
A Computational Fluid Dynamics-Based Model for Assessing Rupture Risk in Cerebral Arteries with Varying Aneurysm Sizes


1
Centre for Biomedical Engineering, Indian Institute of Technology (IIT), Delhi 110016, India
2
Department of Biomedical Engineering, All India Institute of Medical Sciences (AIIMS), Delhi 110029, India
*
Author to whom correspondence should be addressed.
Math. Comput. Appl. 2023, 28(4), 90; https://doi.org/10.3390/mca28040090
Submission received: 18 May 2023
/
Revised: 3 July 2023
/
Accepted: 11 July 2023
/
Published: 2 August 2023
(This article belongs to the Special Issue Computational Methods for Coupled Problems in Science and Engineering)
Abstract
:A cerebral aneurysm is a medical condition where a cerebral artery can burst under adverse pressure conditions. A 20% mortality rate and additional 30 to 40% morbidity rate have been reported for patients suffering from the rupture of aneurysms. In addition to wall shear stress, input jets, induced pressure, and complicated and unstable flow patterns are other important parameters associated with a clinical history of aneurysm ruptures. In this study, the anterior cerebral artery (ACA) was modeled using image segmentation and then rebuilt with aneurysms at locations vulnerable to aneurysm growth. To simulate various aneurysm growth stages, five aneurysm sizes and two wall thicknesses were taken into consideration. In order to simulate realistic pressure loading conditions for the anterior cerebral arteries, inlet velocity and outlet pressure were used. The pressure, wall shear stress, and flow velocity distributions were then evaluated in order to predict the risk of rupture. A low-wall shear stress-based rupture scenario was created using a smaller aneurysm and thinner walls, which enhanced pressure, shear stress, and flow velocity. Additionally, aneurysms with a 4 mm diameter and a thin wall had increased rupture risks, particularly at specific boundary conditions. It is believed that the findings of this study will help physicians predict rupture risk according to aneurysm diameters and make early treatment decisions.
1. Introduction
A cerebral aneurysm is a weak or thin region of an arterial section in the human brain that balloons or bulges out when filled up with blood. The bulging aneurysm may compress the nerves or brain tissue. Additionally, this may lead to rupture or bursting, causing blood to flow into adjacent tissues (called a hemorrhage). A ruptured aneurysm can cause serious health problems such as hemorrhagic stroke, brain damage, unconsciousness, and even death [1,2]. The adult population within the range of 30 to 60 years of age is the most vulnerable to aneurysms, and women are more likely than men to have one. A brain aneurysm rupture affects roughly 6.7 million people in the USA each year, and the most serious aneurysm complication is rupture, which affects 2–4% of the global population [3]. In addition to this, 500,000 deaths related to aneurysm rupture are reported worldwide [4]. These problems are also prevalent in Europe, southern Asia, and Eastern Asia, with death rates of approx. 41%, 46%, and 60%, respectively [5]. In a recent study by Bechstein et al. [6], it was reported that Mongolia reported a crude incidence of 14.53 ruptures per 100,000 persons.
Hence, understanding aneurysm development and its progression is essential, which is the aim and rationale for this study.
Fukazawa et al. [7] performed a computational study to investigate the rupture risk of middle cerebral artery (MCA) aneurysms. They estimated the points with a high risk of rupture on the basis of the dynamic blood flow. Using three-dimensional CT scans and computational fluid dynamics (CFD), the aneurysm shapes were reconstructed, and it was found that the wall shear stress had a substantial impact on aneurysm rupture. Geers et al. [8] performed steady-flow simulations of the hemodynamics of cerebral aneurysms to evaluate wall shear stress (WSS) and examined the time-averaged (TA), peak systole (PS), and end-diastole (ED) WSS fields to compare simulations of steady flow and pulsatile flow. Cebral et al. [9] investigated pulsatile flow CFD models with patient-specific models. They studied 210 consecutive cerebral aneurysms and observed that concentrated inlet jets, narrow impingement zones, and complex and unstable flow patterns were all related to a clinical history of previous aneurysm rupture. This was performed using image-based, patient-specific geometry and qualitative hemodynamic analysis. These qualitative evaluations serve as a springboard for even more complex quantitative analyses intended to calculate the likelihood that an aneurysm will collapse later.
John et al. [10] characterized the various flow types found in anterior communicating artery aneurysms. Individual patient computational models were created, and simulations were performed to evaluate the risk of rupture. The findings demonstrated that aneurysms with smaller impaction regions and more blood entering the aneurysm were more likely to rupture. The results showed that aneurysms with smaller impaction areas and greater amounts of blood entering the aneurysm had a higher probability of rupture. Jeong et al. [11] compiled and discussed the probability of cerebral aneurysm initiation, growth, and rupture. The results demonstrated that the highest stress and displacement values were obtained by aneurysms that ruptured close to artery walls. Similarly, Luckrajh et al. [12] used CT angiograms of individuals with anterior communicating artery (ACoA) aneurysms and these statistics may act as baseline information of the morphological and morphometric features of ACoA aneurysms which should also be understood when organizing and carrying out aneurysm treatments. Using finite element analysis, Foutrakis et al. [9] investigated the hemodynamics of cerebral saccular aneurysm formation. Models of the curved artery section and arterial splitting at various stages were created to assess the development of aneurysms. The results demonstrated that pressure and shear stress generated across an artery’s outer wall and at the leading edge of a capillary bifurcation increased the formation of saccular aneurysms. Torii et al. [13] created two brain aneurysms for the purpose of conducting fluid–structure interaction (FSI) simulations with hypertensive and normal blood pressure parameters. They looked at the distribution of wall shear stress (WSS) to completely comprehend an aneurysm. They noticed that the larger distribution of high WSS reduced wall weakening while increasing wall deformation-related alterations in flow patterns. Therefore, knowledge of pressure, wall shear, and blood flow is required to analyze an aneurysm rupture.
It is well known that one of the key causes of aneurysm rupture is hemodynamics. Aneurysm rupture is indicated by flow impingement, increased pressure, and unusual wall shear stress. Understanding the function of wall shear stress in cerebral aneurysms at comparable anatomic sites may be possible. These results indicate that CFD may be a key factor in the clinical assessment of aneurysm risks. There is an increasing need for accurate prediction of aneurysm growth and rupture in order to select the most appropriate and effective endovascular treatment. Concerning the possibility of aneurysm rupture, there is a huge knowledge gap. This study characterized the rupture risk by evaluating aneurysm growth and wall thickness during initiation in a real anterior cerebral artery (ACA). The formation of the aneurysm throughout its five stages was modeled by adjusting the aneurysm’s diameter. Following an assessment of the rupture risk for each stage under hypertension settings and consideration of two wall thicknesses (0.075 mm and 0.15 mm), an analysis of both flow and pressure distributions on the artery-aneurysm models was conducted. The findings of this study are anticipated to open up novel possibilities for understanding the development of aneurysms and their risk of perforation under situations of variable aneurysm diameters and wall thicknesses.
The novel aspects of our work include the consideration of different aneurysm sizes on actual MRI-scanned artery models to study the behavior of fluids (i.e., blood), compared to the plethora of previous studies that over-simplified the artery geometry as a hollow cylindrical tube. Our study showcases economical modeling methods using realistic scanned geometries.
2. Materials and Methods
2.1. Selection of Artery and Aneurysm
As compared to the posterior lobes, the frontal lobes receive more blood from the anterior cerebral arteries. Due to this, anterior arteries are more vulnerable to induced pressures hence, it is important to understand the disorders that are associated with the anterior region. One of the most frequent locations is the anterior cerebral artery (ACA) of intracranial aneurysms which has been reported as a significant site for ruptures. Over 92% of the total rupture cases have been reported due to an aneurysm at this location [2,12,14]. Data shows that brain arteries with curvature or bifurcation are prone to develop or spread aneurysms [11]. Hence, according to statistical data and literature review, we found that ACA is more prominent and vulnerable to diseases. Hence our study focused on this area as discussed in the following sections.
2.2. Geometrical Modeling
The initial steps in the geometric modeling of the arteries included recreation of the segmented MRI data. To develop geometric models of aneurysm development, the cerebral artery was further divided and altered. The thorough technique is explained in the ensuing subsections.
2.2.1. Preparing Arterial 3-D Geometry and Modeling
To create a three-dimensional model of the human cerebral arteries, MRI scans of the brain were taken from the NIH Visible Human database. The 3-D geometry of the cerebral artery network was obtained by segmenting and reconstructing the MRI data using TurtleSeg software (Figure 1A). It is evident from the literature review that aneurysm genesis or progression is more frequent in cerebral arteries that curve or split. As a result, specific parts of the anterior cerebral artery, which are reported to be at risk of aneurysm development, were dissected from the full arterial network using the MeshLab program (Figure 1B). The surface features of the cut-out cerebral arteries were then smoothened, and all the discrepancies were resolved using the ‘stitch and remove’ command. The ACA sections were then assigned a diameter of 2 mm and a thickness of 0.2 mm (i.e., 10% of the diameter [15]).
2.2.2. Modeling of Aneurysms
In order to simulate the aneurysm on the cut-out portion of the cerebral arteries, the optimal aneurysm positions on the arterial segment were determined. After that, a cavity was built where the aneurysm was to be placed. The geometry was then exported in ‘.STEP’ format using Solidworks (Dassault Systèmes, Vélizy-Villacoublay, France). and then imported to ANSYS Workbench 2020R1 (Canonsburg, PA, USA) for analysis using the computational fluid dynamics (CFD) technique.
In the current work, the shape of the aneurysms was considered spherical due to their commonality. In a previous study, MRI scans from 84 patients reported a spherical shape of the aneurysms [14]. Hence, on the basis of these data, we considered the shape of the aneurysm to be spherical. In this work, we simulated aneurysm growth through the development of five different models with different diameters, where each model with a fixed size represented a particular aneurysm growth stage. Additionally, two different wall thicknesses were simulated for all five models. The five models were then used to understand and evaluate the nature of blood flow and differences in wall shear stresses and pressures among all the stages of aneurysm growth [16]. For the ACA component, aneurysms with sizes of 2 mm, 4 mm, 6 mm, 8 mm, and 10 mm were modeled. In a previous study, the aneurysms were reported to have walls that ranged in thickness from 0.01 to 0.216 mm [17]. As a result, in this work, two aneurysm thicknesses—0.075 mm and 0.15 mm—were taken into account for the arterial sections [18]. The models developed for the ACA segment of the cerebral arteries have different aneurysm dimensions, as shown in Figure 2A–E. As our study also includes the effect of wall thickness, a fluid domain was created in each of the respective artery models using both Fusion 360 and SolidWorks. As the artery was developed using MRI technology, it had a large number of faces and edges. The STL format was used to resolve the small edges and faces, which added complexity to the computational domain. So, to overcome this, an optimal STL was obtained using Fusion 360 by reducing the model’s number of faces and edges in several steps and then exporting the file in STEP format. The STEP file was imported into SolidWorks for the development of the fluid domain and was finally assembled.
2.3. Finite Element Modeling
The mesh convergence analysis of the models was conducted using ANSYS Workbench. The Solid-187 elements were used to combine the aneurysm and artery models. Higher-order, three-dimensional, ten-node elements with quadratic displacement behavior were chosen, similar to prior computational studies [19,20]. Surface-to-surface contact was applied between aneurysm and artery models. The method involving bonding contact pairs at all times was adopted [21,22]. A mesh adaptive technique was used to ensure an optimal mesh with low skewness and high orthogonality. Six meshes were produced for each artery model by altering the element size and spacing; 30,867, 40,560, 45,993, 78,831, 123,634, and 420,125 were the generated number of mesh elements for the artery model. Additionally, the residuals also converged to a convergence value of 10−6. Figure 3 represents the meshed model of a single artery, including the fluid domain.
Fluid Properties, Loads, and Boundary Conditions
From the literature, it was determined that the blood density was 1070 kg/m3 and the viscosity was 0.004 kg/m·s [23]; hence, these values were used in the current work. We presumptively used Newtonian laminar flow, which is an incompressible fluid flow. Furthermore, the lumen’s wall was considered rigid. Inlet boundary conditions were applied to the elements on the face of the inlet. At the inlet, the blood velocity was adopted from the literature [23]. A constant velocity of 0.10 m/s was assigned at the inlet. The operating pressure was set to atmospheric pressure, i.e., 101,325 Pa, and the reference pressure value was set to zero. The rigid wall’s properties were modeled with a Young’s modulus of 10 MPa, a Poisson’s ratio of 0.49, and a density of 10 MPa. These values were based on a recent study by Khe et al. [24]. As per a previous study [25], the zero-pressure boundary condition indicated zero pressure as the bleeding was reported without considering any impacts from the vessels outside the simulation area. Therefore, in our study, the outlet gauge pressure was given the static pressure value of 0.024 MPa, corresponding to 180 mmHg, and was used to simulate the pressure circumstances associated with hypertension. Figure 4 shows the inlet and outlet flows.
3. Results
3.1. Results of Mesh Convergence
For the mesh convergence investigation, the produced meshes were subjected to an input flow velocity of 0.1 m/s. The highest pressure introduced in the mesh-based designs was evaluated across consecutive meshes in order to determine the ideal number of mesh elements. The ACA section’s maximum pressure variation was within a tolerable limit (i.e., 5%) for the pressure after the mesh elements crossed 123,634 elements (Figure 5A). As a result, the mesh with 123,634 elements was found to be optimal for the ACA segment. Figure 5B shows the change in area-weighted average pressure with respect to the number of iterations. A constant line was reported, which showed converged results for the corresponding meshed models. The mesh independence study revealed that considering a more refined mesh does not show any significant differences as compared to coarsely meshed structures. By adopting a number of elements 123,634, the net mass flow was achieved to a convergence value of 10−7. Additionally, the residuals also converged to a convergence value of 10−6. The developed computational framework took 70 iterations to reach convergence.
3.2. Distributions of Stress at Various Aneurysm Progression Levels
Figure 6 shows the pressure distributions for the ACA’s 0.075 mm (Figure 6a) and 0.15 mm (Figure 6b) aneurysm thickness models. In line with previous computational studies on hemodynamics, our study showed similar static pressure values across all the models [7,11,23]. On the arterial and aneurysmal structures, it was found that the pressure concentration was not uniform in all the models. Near the artery-aneurysm’s neck region, there was a concentration of pressure, and the aneurysm’s neck and aneurysm showed homogeneous pressure ranges. According to the literature [26], the pressure range observed in the MCA was 22,000.00 Pa–26,287.00 Pa. Hence, the pressure results of our study are in the same order as the literature results. For various models with 0.075 mm thickness, the highest pressure varied between 24,005.00 Pa and 24,035.00 Pa, while for models with 0.15 mm thickness, it varied from 24,007.00 Pa to 24,032.00 Pa. Evaluation of the pressure data showed that variations in aneurysm sizes and in boundary thicknesses significantly affect the pressure distribution. In summary, the findings showed considerable influence on the aneurysm’s structural characteristics, including its width and thickness. It was noticed that the pressure decreased from 24,031.97 to 24,009.75 as the aneurysm’s size increased from 2 mm to 10 mm in the ACA artery with a wall thickness of 0.15 mm. In the ACA artery with a wall thickness of 0.075 mm, the pressure first increased from 24,029.24 to 24,034.5 for an aneurysm diameter of 2 mm to 4 mm, and then further decreased from 24,024.15 to 24,008.75 with the increase in diameter. Also, a strong correlation R2 was found (i.e.,0.97 and 0.8294) between pressure and a changing diameter of the aneurysm for an artery with walls of thickness 0.15 mm and 0.075 mm, respectively.
3.3. Distributions of Wall Shear Stress at Varying Aneurysm Progression Stages
Figure 7 shows the wall shear stresses for the aneurysm with thicknesses of 0.075 mm (Figure 7a) and 0.15 mm (Figure 7b), respectively. In the figures, the red region signifies a wall shear stress of more than 2 Pa. A non-uniform WSS was observed throughout the artery. Overall, the findings showed considerable influence on the aneurysm’s structural characteristics, including its diameter and thickness. As per previous studies, our study also exhibited similar results, i.e., in all model walls, shear stress was found to be zero at the aneurysm [9,27]. As the aneurysm’s size rose from 2 mm to 10 mm in the ACA artery with a wall thickness of 0.15 mm, it was found that the wall shear stress dropped from 3.57 Pa to 0.5 Pa. With an aneurysm diameter of 2 mm to 4 mm, the wall shear stress in the ACA artery with a wall thickness of 0.075 mm first increased from 2.42 Pa to 5.83 Pa, and as the diameter increases, it continues to decrease from 1.68 Pa to 0.48 Pa.
3.4. Velocity Streamlines at Various Aneurysm Progression Stages
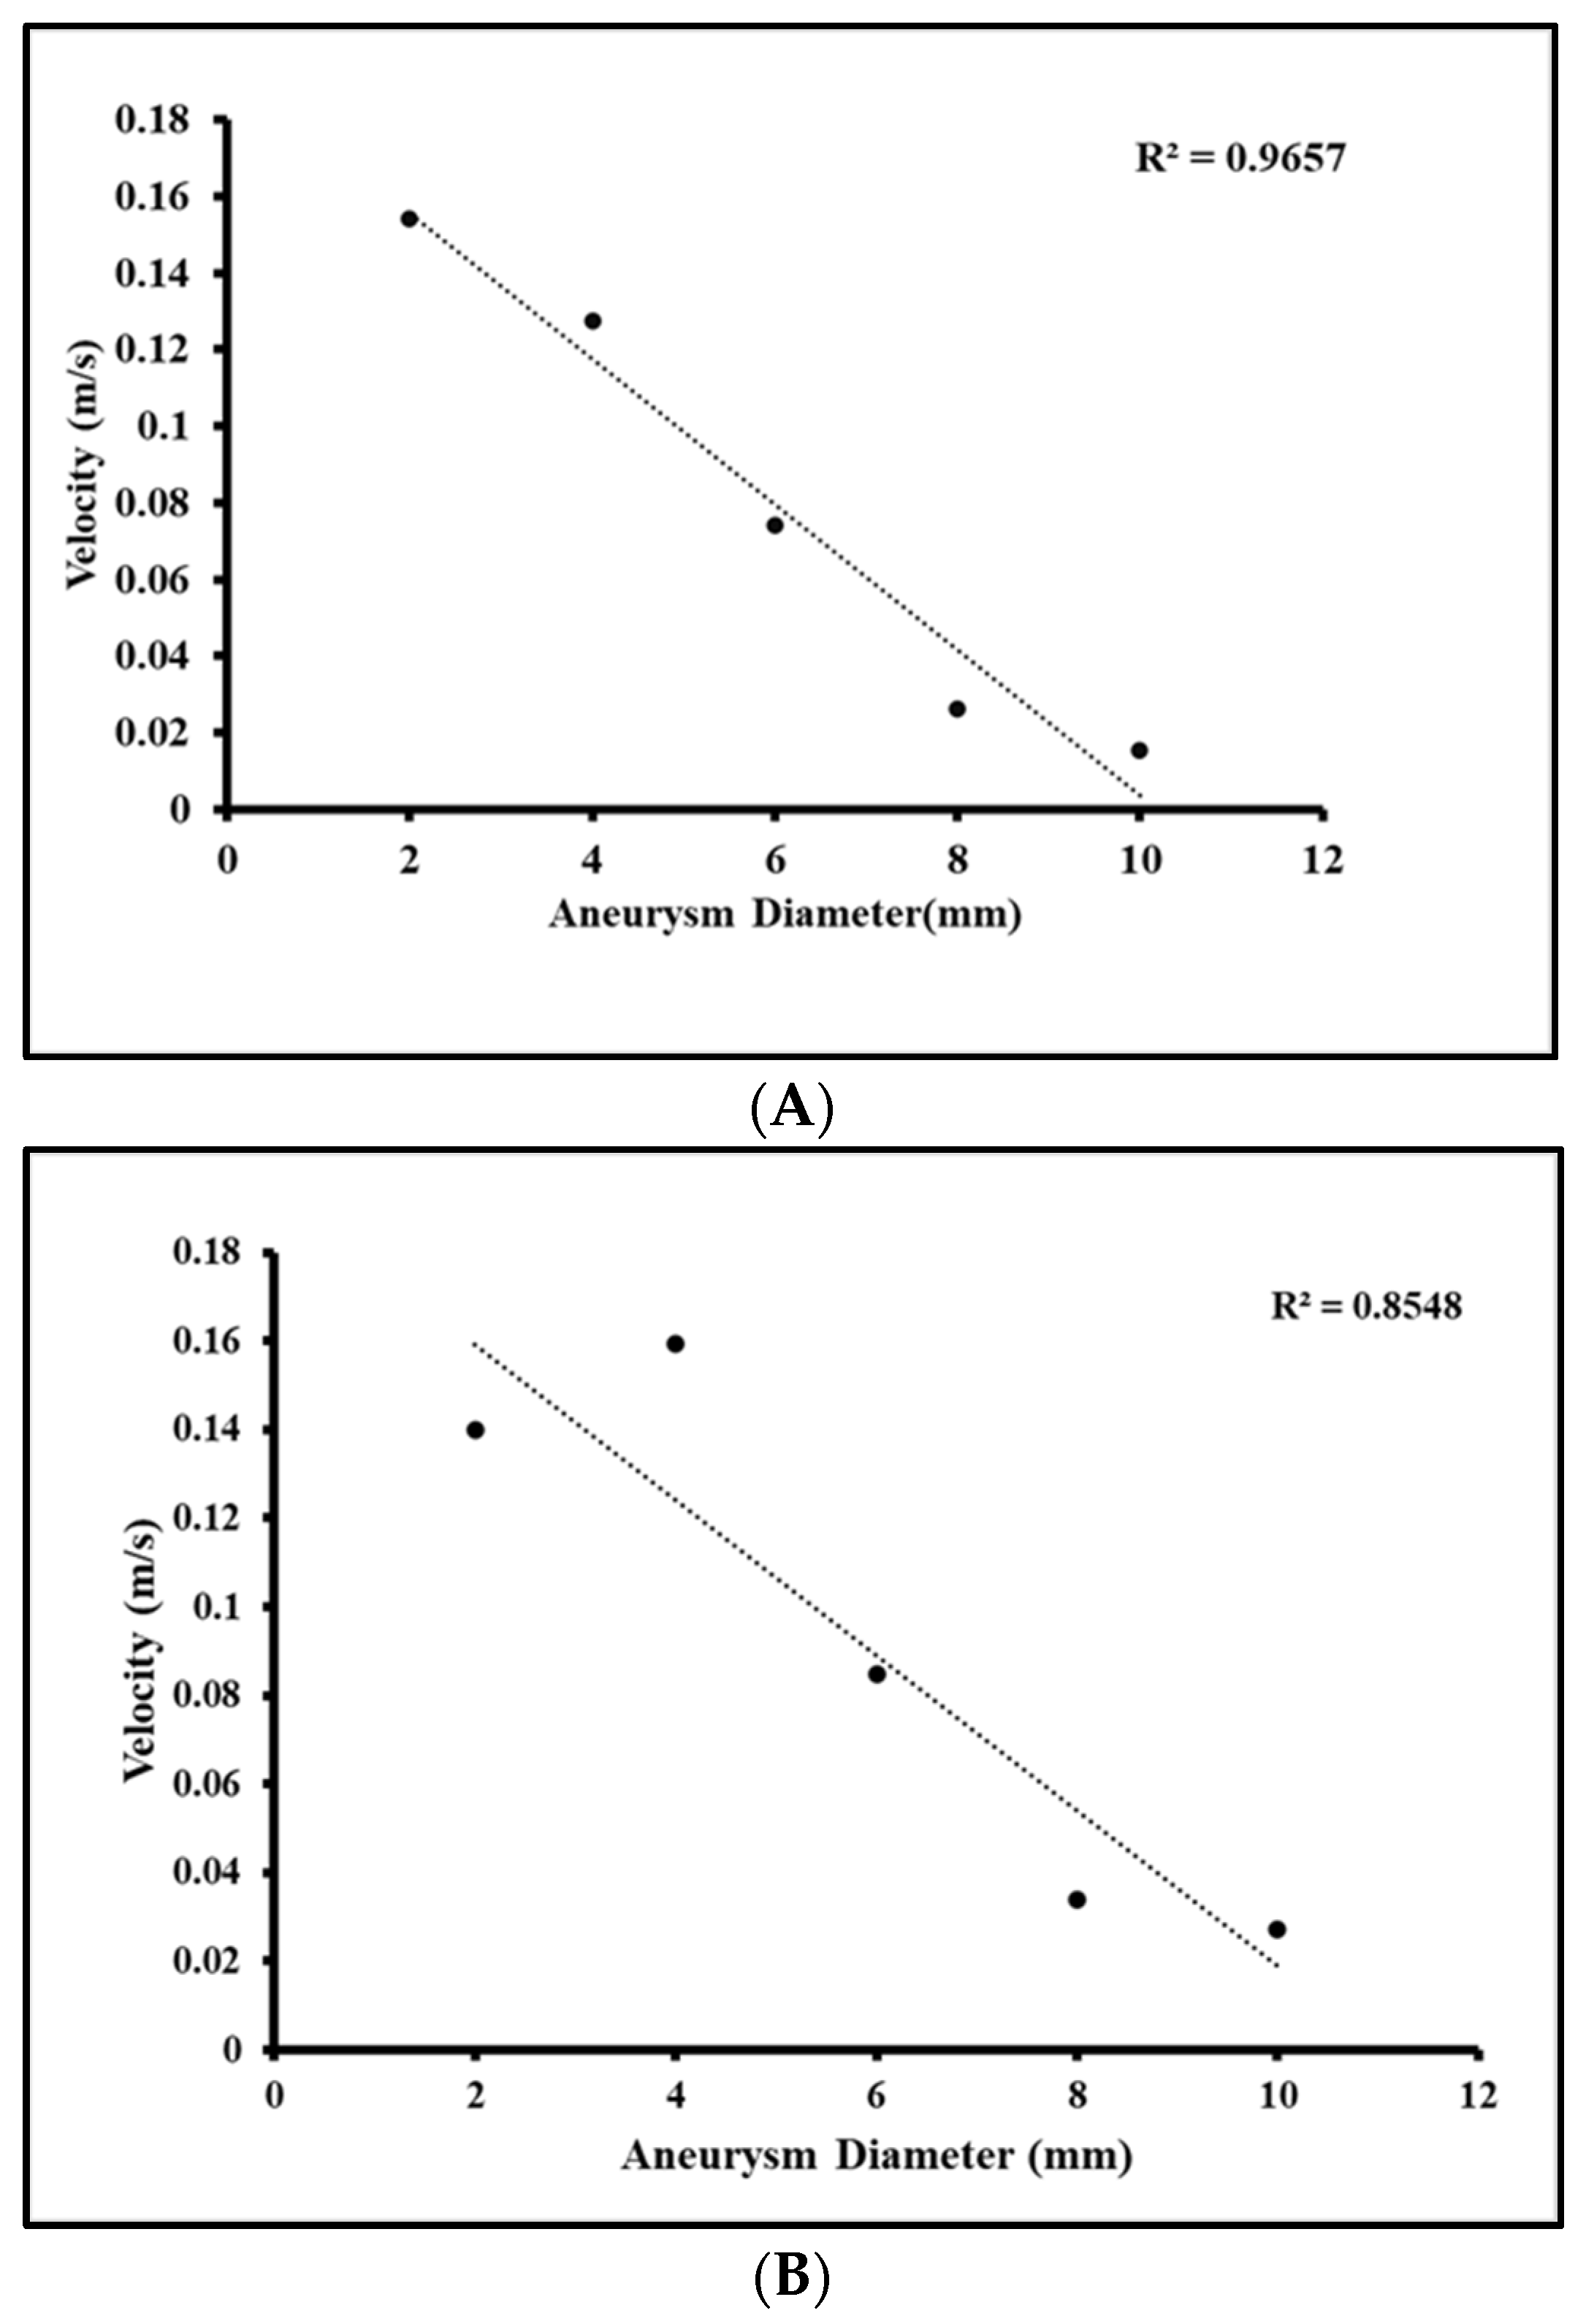
Our findings also showed that all rupture regions have low WSS magnitudes and slower flow rates. As per a previous study by Fukazawa et al. [7], it was reported that lower WSS could be a significant component contributing to the degenerative process ongoing in the aneurysm wall and aneurysm rupture, independent of the aneurysm morphology. Based on this, our study reported lower WSS at the apex of all the aneurysms. After the apex, the geometrical boundary joining the artery showed reduced WSS as compared to other regions of the artery. Hence, the low WSS and slow flow rates at these locations may suggest possible aneurysm ruptures. It has been suggested that the flow pattern may be a crucial element in the pathogenic process of aneurysm rupture [7,9,27]. In our study, the maximum streamline velocity was observed near the bifurcation of the arteries (Figure 8). The flow velocity in the ACA artery, which has a wall thickness of 0.075 mm, initially increased from 0.14 m/s to 0.15 m/s (Figure 8a) as the aneurysm diameter increased from 2 mm to 4 mm. However, as the diameter expanded further, it continued to decrease up to 0.01 m/s. The velocity also decreased from 0.15 m/s to 0.01 m/s when the aneurysm’s diameter was increased from 2 mm to 10 mm in the ACA artery with a 0.15 mm thick wall (Figure 8b). Furthermore, there was a significant association (i.e., R2 of 0.96 and 0.85) between pressure and aneurysm diameter for an arterial wall thickness of 0.150 mm and 0.075 mm, respectively.
4. Discussion
This study has demonstrated that steady-flow simulations can accurately approximate the wall shear stress, pressure, and velocity streamline field of an aneurysm as well as an artery. Figure 9 displays the changes in aneurysm pressure and average neck pressure as well as the correlation between pressure and diameter for aneurysms having thicknesses of 0.15 mm and 0.075 mm. When wall tension is higher than the tissue’s mechanical strength, aneurysms rupture. Pathological wall remodeling is directly related to the localized weakening of the aneurysm wall, which is characterized by the narrowing of the media and a lack of collagen fibers [28]. An artery with a thickness of 0.15 mm and the smallest diameter of 2 mm, as well as an artery with a wall thickness of 0.075 mm and a diameter of 4 mm, both experienced the highest pressure. These results are in line with previous studies. This research showed that an artery with a 4 mm diameter and a 0.075 mm wall thickness was the most vulnerable to aneurysm rupture. Additionally, the fluctuation in pressure with thickness is consistent with the literature [11], which asserts that the wall tension of a spherical aneurysm is inversely proportional to the wall thickness and directly proportional to the internal pressure and radius. As a result, high pressure, and a thin wall increase wall tension.
One of the important hemodynamic factors is WSS. The current analysis showed that the WSS at the rupture locations had a low magnitude. Therefore, these findings imply that reduced WSS would substantially lead to the continuous deterioration of the aneurysm wall and its rupture [7]. A 4 mm aneurysm demonstrated the peak wall shear stress in an artery with a 0.15 mm wall thickness, while a 4 mm aneurysm demonstrated the maximum wall shear stress in an artery with a 0.075 mm wall thickness. The opposite side of the aneurysm in both situations had a critical area with wall thicknesses of 0.075 mm and 0.15 mm in the artery and a 4 mm aneurysm diameter. This region had a high value of WSS and pressure close to the aneurysm bifurcation, raising the risk of aneurysm development at that location. Additionally, our observations and results were in line with those of previous research [11], which demonstrated that low WSS and modified flow patterns might have a long-term influence on aneurysm wall deterioration via wall reconfiguration.
A flow pattern analysis based on 3D streamlines of intra-aneurysmal flow and cross-sectional flow was performed, which revealed a complex flow structure and pattern. We discovered that the artery with a wall thickness of 0.15 and the lowest diameter, or one with a wall thickness of 0.075 and a diameter of 4 mm, produced the highest pressures when observing the streamline velocity in the artery. Based on this study, the most vulnerable aneurysm that can rupture was observed to have a diameter of 4 mm and a wall thickness of 0.075 mm. These results are in line with previous studies [9]. A ruptured aneurysm is more likely to have complicated and unstable flows, concentrated inputs, and tiny impingement zones. Figure 10 represents the correlation of velocity with diameter for wall thicknesses of 0.075 mm and 0.15 mm, respectively. These results are in line with previous studies, according to the statistical analysis, which also shows a substantial correlation between these qualitative hemodynamic features and aneurysm rupture. Even though diffuse inflows characterized the majority of unruptured aneurysms, many of them also featured complicated flows, unstable flows, and/or tiny impingement zones.
In past arterial flow studies, wall shear stresses have been extensively studied and reported as an important metric in determining thrombosis, aneurysms, minor clots, etc. In a previous study by Shojima et al. [29], 20 middle cerebral artery aneurysms were evaluated using CFD, and it was concluded that the WSS of the aneurysm region may be of some help for the prediction of rupture. In another study by Cebral et al. [9], a qualitative hemodynamic analysis of cerebral aneurysms was performed using images from 210 patients. The specific geometry, concentrated inflow jets, small impingement zones, complicated flow patterns, and unstable flow patterns were all found to be associated with a clinical history of past aneurysm rupture. The findings demonstrate the possibility that CFD could have a significant impact on the clinical assessment of aneurysm risks. Our study is in line with previous studies; it follows the same trend and also conforms to the range of values for WSS, pressure, and velocity. A total of 12 intracranial aneurysms (IAs), 8 ruptured and 4 unruptured, at the middle cerebral artery bifurcation were studied using FSI to better identify the characteristics of ruptured IAs [30]. In conclusion, they found that ruptured IAs had a larger low WSS area and more complex, concentrated, and unstable flow [31]. Computational models of six ruptured middle cerebral artery aneurysms with intraoperative confirmation of rupture points were constructed from three-dimensional rotational angiography images, and they were able to find the rupture points in all cases. With those findings, the local hemodynamics of ruptured aneurysms were quantitatively investigated. The rupture point was located in a low WSS region of the aneurysm wall [7]. Twelve ruptured middle cerebral artery bifurcation aneurysms were analyzed by three-dimensional computed tomographic angiography and CFD, and it was found that CFD may determine the rupture point of aneurysms using the feature of markedly low WSS [32]. It was found that ruptured aneurysms tend to have complex and/or unstable flow patterns, concentrated flow jets, and small impingement regions.
These assumptions were carefully taken into consideration by studying the past literature in this area. One of the assumptions, such as the consideration of human blood as Newtonian, was based on a previous study by Berger et al. [33]. The blood flow mechanics, along with their impact on the artery walls, were reviewed. It was mentioned that the consideration of blood as a Newtonian and laminar fluid was appropriate to understand the flow mechanics if the viscosity and density were accurately modeled. In larger arteries, the blood was treated as a Newtonian fluid. This assumption was found to be acceptable for most regions except those with a small strain rate; hence, no significant differences were reported for non-Newtonian flows in these arteries. Based on this study, we considered the viscosity and density of the blood to model the fluid computationally. Our work consisted of understanding the effect of different aneurysm sizes on fluid pressures, wall shear stresses, and blood velocities. Hence, the modeling of water, ions, proteins, nutrients, red and white blood cells, and platelets was not considered as it could have led to a much more complex flow system. The complex flow system could lead to difficulties in model convergence and, hence, reduced accuracy and precision of the CFD model. Moreover, the results from our work were comparable with a recent study by Berger et al. [33], which was based on the actual clinical setting.
Another assumption, such as the consideration of a lumen’s wall as rigid, was based on a recent study by Humphrey et al. [34]. The lumen’s wall was considered rigid, and modeling the multiple layers was reported as computationally expensive. These considerations were found to be significant at peak systolic pressures. Also, based on a previous study by Jou et al. [35], the aneurysm’s mechanical properties were reported to be twice as stiff (due to a lack of elastin) as compared to other vessels; hence, it was considered rigid. In other studies, such as those by Shojima et al. [29] and Gao et al. [21], similar assumptions were considered to investigate the hemodynamics of an aneurysm by calculating the wall shear stress, wall pressures, and velocity streamlines. Other novel aspects of our work include the consideration of different aneurysm sizes on the actual MRI-scanned artery models to study the behavior of fluid (i.e., blood), whereas a plethora of previous studies oversimplified the artery geometry, considering it as a hollow cylindrical tube. Our study showcases economical modeling methods using realistic scanned geometries. To the best of our knowledge, these modeling methods and results have not been reported to date.
5. Conclusions
This study presented the development of a computational framework for modeling cerebral aneurysm growth and estimating rupture risk. By altering the aneurysm width and wall thickness in vulnerable arterial sections, such as the anterior cerebral artery, aneurysm growth was simulated. It was determined how blood pressure, aneurysm wall thickness, and aneurysm diameter affect the wall shear stresses at the aneurysm wall. According to this study, fluid–structure interaction can locate aneurysm rupture spots by utilizing distinctive flow dynamic properties, including complicated flow and noticeably low WSS. To evaluate the risk of rupture, a computational fluid dynamics-based model was incorporated to determine the effect of geometrical characteristics on the pressure gradients of an aneurysm. The results of this study may be used to estimate the risk of aneurysm rupture under varied aneurysm sizes and wall thicknesses. It is believed that this research will offer new perspectives on cerebral aneurysms and assist physicians and surgeons in formulating preventative methods to lessen aneurysm ruptures.
There are a few limitations to this work that must be acknowledged. Only spherical aneurysms with constant wall thicknesses were taken into account to develop artery-aneurysm models. It is known that certain aneurysms in real-world situations have irregular geometries and differing wall thicknesses at various aneurysm sites. The computational modeling of the artery and aneurysm structures in this work also made use of the isotropic material properties. Because of the fibers that are present in the skin layers, arteries exhibit anisotropic material characteristics. The consideration of the mechanical properties of the blood as Newtonian is a simplification based on studies by Berger et al. [33]. It was mentioned that the consideration of blood as a Newtonian and laminar fluid was appropriate to understand the flow mechanics if the viscosity and density were accurately modeled. In larger arteries, the blood was treated as a Newtonian fluid. This assumption was found to be acceptable for most regions, except in those with a small strain rate; hence, no significant differences were reported for non-Newtonian flows in these arteries. The lumen’s wall was considered rigid since modeling the multiple layers was reported as computationally expensive, but this assumption was found to be significant at peak systolic pressures. Also, based on a previous study by Jou et al. [35], the aneurysm’s mechanical properties were reported to have twice the stiffness due to a lack of elastin as compared to other vessels, and, hence, it was considered rigid. The artery wall was assumed to be rigid, and it was assigned as a solid domain with its material properties, such as density, Young’s modulus, and Poisson ratio, in the Ansys Fluent solver. As per the Fluent Theory Guide [36], it has an intrinsic FSI function that takes into account the effect of changing thickness on the wall stiffness to some extent. Future studies considering FSI, actual aneurysm forms, wall thicknesses, and anisotropic material-based models can help enhance the overall accuracy and precision of the developed framework.
Author Contributions
Conceptualization, A.C. and S.G.; Data curation, R.S. and S.G.; Formal analysis, R.S., S.G. and A.C.; Investigation, S.G. and A.C.; Methodology, R.S., S.G. and A.C.; Project administration, S.G. and A.C.; Validation, R.S., S.G. and A.C.; Visualization, R.S., S.G. and A.C.; Writing—original draft, R.S. and S.G.; Writing—review and editing, R.S., S.G. and A.C. All authors have read and agreed to the published version of the manuscript.
Funding
This research received no external funding.
Data Availability Statement
The datasets generated and/or analyzed during the current study are not publicly available due to their large size but are available from the corresponding author on reasonable request.
Acknowledgments
This paper and the research would not have been possible without the exceptional support of A.C. and the facilities provided by the Indian Institute of Technology Delhi (IIT-D), India.
Conflicts of Interest
The authors declare no conflict of interest.
References
- Han Seok, J.; Jang Han Seok, C. Current Science Management of Cerebral Aneurysm. J. Mol. Pathophysiol. 2021, 10, 1–2. [Google Scholar]
- Mura, J.M.; Degaspari, S.; Spetzler, R.F.; Fennell, V.S.; Yashar, M.; Kalani, S.; Atwal, G.; Martirosyan, N.L. Biology of Saccular Cerebral Aneurysms: A Review of Current Understanding and Future Directions. Front. Surg. 2016, 3, 43. [Google Scholar] [CrossRef] [Green Version]
- Vlak, M.H.M.; Algra, A.; Brandenburg, R.; Rinkel, G.J.E. Prevalence of unruptured intracranial aneurysms, with emphasis on sex, age, comorbidity, country, and time period: A systematic review and meta-analysis. Lancet Neurol. 2011, 10, 626–636. [Google Scholar] [CrossRef] [PubMed]
- Statistics and Facts—Brain Aneurysm Foundation. Available online: https://www.bafound.org/statistics-and-facts/ (accessed on 25 June 2023).
- Etminan, N.; Chang, H.S.; Hackenberg, K.; De Rooij, N.K.; Vergouwen, M.D.I.; Rinkel, G.J.E.; Algra, A. Worldwide Incidence of Aneurysmal Subarachnoid Hemorrhage According to Region, Time Period, Blood Pressure, and Smoking Prevalence in the Population: A Systematic Review and Meta-analysis. JAMA Neurol. 2019, 76, 588–597. [Google Scholar] [CrossRef]
- Bechstein, M.; Gansukh, A.; Regzengombo, B.; Byambajav, O.; Meyer, L.; Schönfeld, M.; Kniep, H.; Hanning, U.; Broocks, G.; Gansukh, T.; et al. Risk Factors for Cerebral Aneurysm Rupture in Mongolia. Clin. Neuroradiol. 2022, 32, 499–506. [Google Scholar] [CrossRef] [PubMed]
- Fukazawa, K.; Ishida, F.; Umeda, Y.; Miura, Y.; Shimosaka, S.; Matsushima, S.; Taki, W.; Suzuki, H. Using Computational Fluid Dynamics Analysis to Characterize Local Hemodynamic Features of Middle Cerebral Artery Aneurysm Rupture Points. World Neurosurg. 2015, 83, 80–86. [Google Scholar] [CrossRef] [PubMed]
- Geers, A.J.; Larrabide, I.; Morales, H.G.; Frangi, A.F. Approximating hemodynamics of cerebral aneurysms with steady flow simulations. J. Biomech. 2014, 47, 178–185. [Google Scholar] [CrossRef]
- Cebral, J.R.; Mut, F.; Weir, J.; Putman, C.M. Association of Hemodynamic Characteristics and Cerebral Aneurysm Rupture. AJNR Am. J. Neuroradiol. 2011, 31, 264–270. [Google Scholar] [CrossRef]
- Barile, J.P.; Mitchell, S.A.; Thompson, W.W.; Zack, M.M.; Reeve, B.B.; Cella, D.; Smith, A.W. Patterns of Chronic Conditions and Their Associations with Behaviors and Quality of Life, 2010. Prev. Chronic Dis. 2015, 12, 150179. [Google Scholar]
- Jeong, W.; Rhee, K. Hemodynamics of cerebral aneurysms: Computational analyses of aneurysm progress and treatment. Comput. Math. Methods Med. 2012, 2012, 782801. [Google Scholar] [CrossRef] [Green Version]
- Luckrajh, J.S.; Harrichandparsad, R.; Satyapal, K.S.; Lazarus, L. A clinical investigation of the anatomy of the proximal anterior cerebral artery and its association with anterior communicating artery aneurysm. Transl. Res. Anat. 2022, 27, 100200. [Google Scholar] [CrossRef]
- Torii, R.; Oshima, M.; Kobayashi, T.; Takagi, K.; Tezduyar, T.E. Numerical investigation of the effect of hypertensive blood pressure on cerebral aneurysm-Dependence of the effect on the aneurysm shape. Int. J. Numer. Meth. Fluids 2007, 54, 995–1009. [Google Scholar] [CrossRef]
- Dehdashti, A.R.; Chiluwal, A.K.; Regli, L. The Implication of Anterior Communicating Complex Rotation and 3-Dimensional Computerized Tomography Angiography Findings in Surgical Approach to Anterior Communicating Artery Aneurysms. World Neurosurg. 2016, 91, 34–42. [Google Scholar] [CrossRef] [PubMed]
- Valencia, A.; Burdiles, P.; Ignat, M.; Mura, J.; Bravo, E.; Rivera, R.; Sordo, J. Fluid structural analysis of human cerebral aneurysm using their own wall mechanical properties. Comput. Math. Methods Med. 2013, 2013, 293128. [Google Scholar] [CrossRef]
- Liu, Z.; Ajimu, K.; Yalikun, N.; Zheng, Y.; Xu, F. Potential Therapeutic Strategies for Intracranial Aneurysms Targeting Aneurysm Pathogenesis. Front. Neurosci. 2019, 13, 1238. [Google Scholar] [CrossRef] [Green Version]
- Macdonald, D.J.; Finlay, H.M.; Canham, P.B. Directional Wall Strength in Saccular Brain Aneurysms from Polarized Light Microscopy. Ann. Biomed. Eng. 2000, 28, 533–542. [Google Scholar] [CrossRef]
- Singh, G.; Yadav, P.N.; Gupta, S.; Chanda, A. Biomechanical modeling of aneurysm in posterior cerebral artery and posterior communicating artery: Progression and rupture risk. Brain Multiphysics 2023, 4, 100069. [Google Scholar] [CrossRef]
- Gupta, S.; Singh, G.; Chanda, A. Prediction of diabetic foot ulcer progression: A computational study. Biomed. Phys. Eng. Express 2021, 7, 065020. [Google Scholar] [CrossRef]
- Gupta, V.; Chanda, A. Expansion potential of skin grafts with novel I-shaped auxetic incisions. Biomed. Phys. Eng. Express 2021, 8, 015016. [Google Scholar] [CrossRef]
- Gupta, S.; Gupta, V.; Chanda, A. Biomechanical modeling of novel high expansion auxetic skin grafts. Int. J. Numer. Methods Biomed. Eng. 2022, 38, e3586. [Google Scholar] [CrossRef]
- Singh, G.; Gupta, S.; Chanda, A. Biomechanical modelling of diabetic foot ulcers: A computational study. J. Biomech. 2021, 127, 110699. [Google Scholar] [CrossRef] [PubMed]
- Gao, B.L.; Hao, H.; Hao, W.; Ren, C.F.; Yang, L.; Han, Y. Cerebral aneurysms at major arterial bifurcations are associated with the arterial branch forming a smaller angle with the parent artery. Sci. Rep. 2022, 12, 5106. [Google Scholar] [CrossRef]
- Khe, A.K.; Cherevko, A.A.; Chupakhin, A.P.; Bobkova, M.S.; Krivoshapkin, A.L.; Orlov, K.Y. Haemodynamics of giant cerebral aneurysm: A comparison between the rigid-wall, one-way and two-way FSI models. J. Phys. Conf. Ser. 2016, 722, 012042. [Google Scholar] [CrossRef]
- Chul Suh, D.; Sang Lee, J.; Young Moon, J.; Sang Lee, Y.; Woo Kim, Y. Considerations of Blood Properties, Outlet Boundary Conditions and Energy Loss Approaches in Computational Fluid Dynamics Modeling. Neurointervention 2014, 9, 1–8. [Google Scholar] [CrossRef]
- Hariri, S.; Mirzaei Poueinak, M.; Hassanvand, A.; Barzegar Gerdroodbary, M.; Faraji, M. Effects of blood hematocrit on performance of endovascular coiling for treatment of middle cerebral artery (MCA) aneurysms: Computational study. Interdiscip. Neurosurg. 2023, 32, 101729. [Google Scholar] [CrossRef]
- Russin, J.; Babiker, H.; Ryan, J.; Rangel-Castilla, L.; Frakes, D.; Nakaji, P. Computational Fluid Dynamics to Evaluate the Management of a Giant Internal Carotid Artery Aneurysm. World Neurosurg. 2015, 83, 1057–1065. [Google Scholar] [CrossRef]
- Ma, Z.; Mao, C.; Jia, Y.; Fu, Y.; Kong, W. Extracellular matrix dynamics in vascular remodeling. Am. J. Physiol. Cell Physiol. 2020, 319, C481–C499. [Google Scholar] [CrossRef]
- Shojima, M.; Oshima, M.; Takagi, K.; Torii, R.; Hayakawa, M.; Katada, K.; Morita, A.; Kirino, T. Magnitude and Role of Wall Shear Stress on Cerebral Aneurysm. Stroke 2004, 35, 2500–2505. [Google Scholar] [CrossRef]
- Gao, B.; Ding, H.; Ren, Y.; Bai, D.; Wu, Z. Study of Typical Ruptured and Unruptured Intracranial Aneurysms Based on Fluid–Structure Interaction. World Neurosurg. 2023, 175, e115–e128. [Google Scholar] [CrossRef]
- Omodaka, S.; Sugiyama, S.I.; Inoue, T.; Funamoto, K.; Fujimura, M.; Shimizu, H.; Hayase, T.; Takahashi, A.; Tominaga, T. Local hemodynamics at the rupture point of cerebral aneurysms determined by computational fluid dynamics analysis. Cerebrovasc. Dis. 2012, 34, 121–129. [Google Scholar] [CrossRef]
- Cebral, J.R.; Mut, F.; Sforza, D.; Löhner, R.; Scrivano, E.; Lylyk, P.; Putman, C. Clinical application of image-based CFD for cerebral aneurysms. Int. J. Numer. Methods Biomed. Eng. 2011, 27, 977–992. [Google Scholar] [CrossRef] [Green Version]
- Berger, S.A.; Jou, L.D. Flows in Stenotic Vessels. Annu. Rev. Fluid Mech. 2003, 32, 347–382. [Google Scholar] [CrossRef]
- Humphrey, J.D.; Na, S. Elastodynamics and arterial wall stress. Ann. Biomed. Eng. 2002, 30, 509–523. [Google Scholar] [CrossRef] [PubMed]
- Jou, L.-D.; Quick, C.M.; Young, W.L.; Lawton, M.T.; Higashida, R.; Martin, A.; Saloner, D. Computational Approach to Quantifying Hemodynamic Forces in Giant Cerebral Aneurysms. Am. J. Neuroradiol. 2003, 24, 1804–1810. [Google Scholar] [PubMed]
- ANSYS. ANSYS FLUENT Theory Guide. Available online: https://www.afs.enea.it/project/neptunius/docs/fluent/html/th/main_pre.htm (accessed on 3 July 2023).
Figure 1.
(A) Network of cerebral veins and arteries; (B) ACA section.
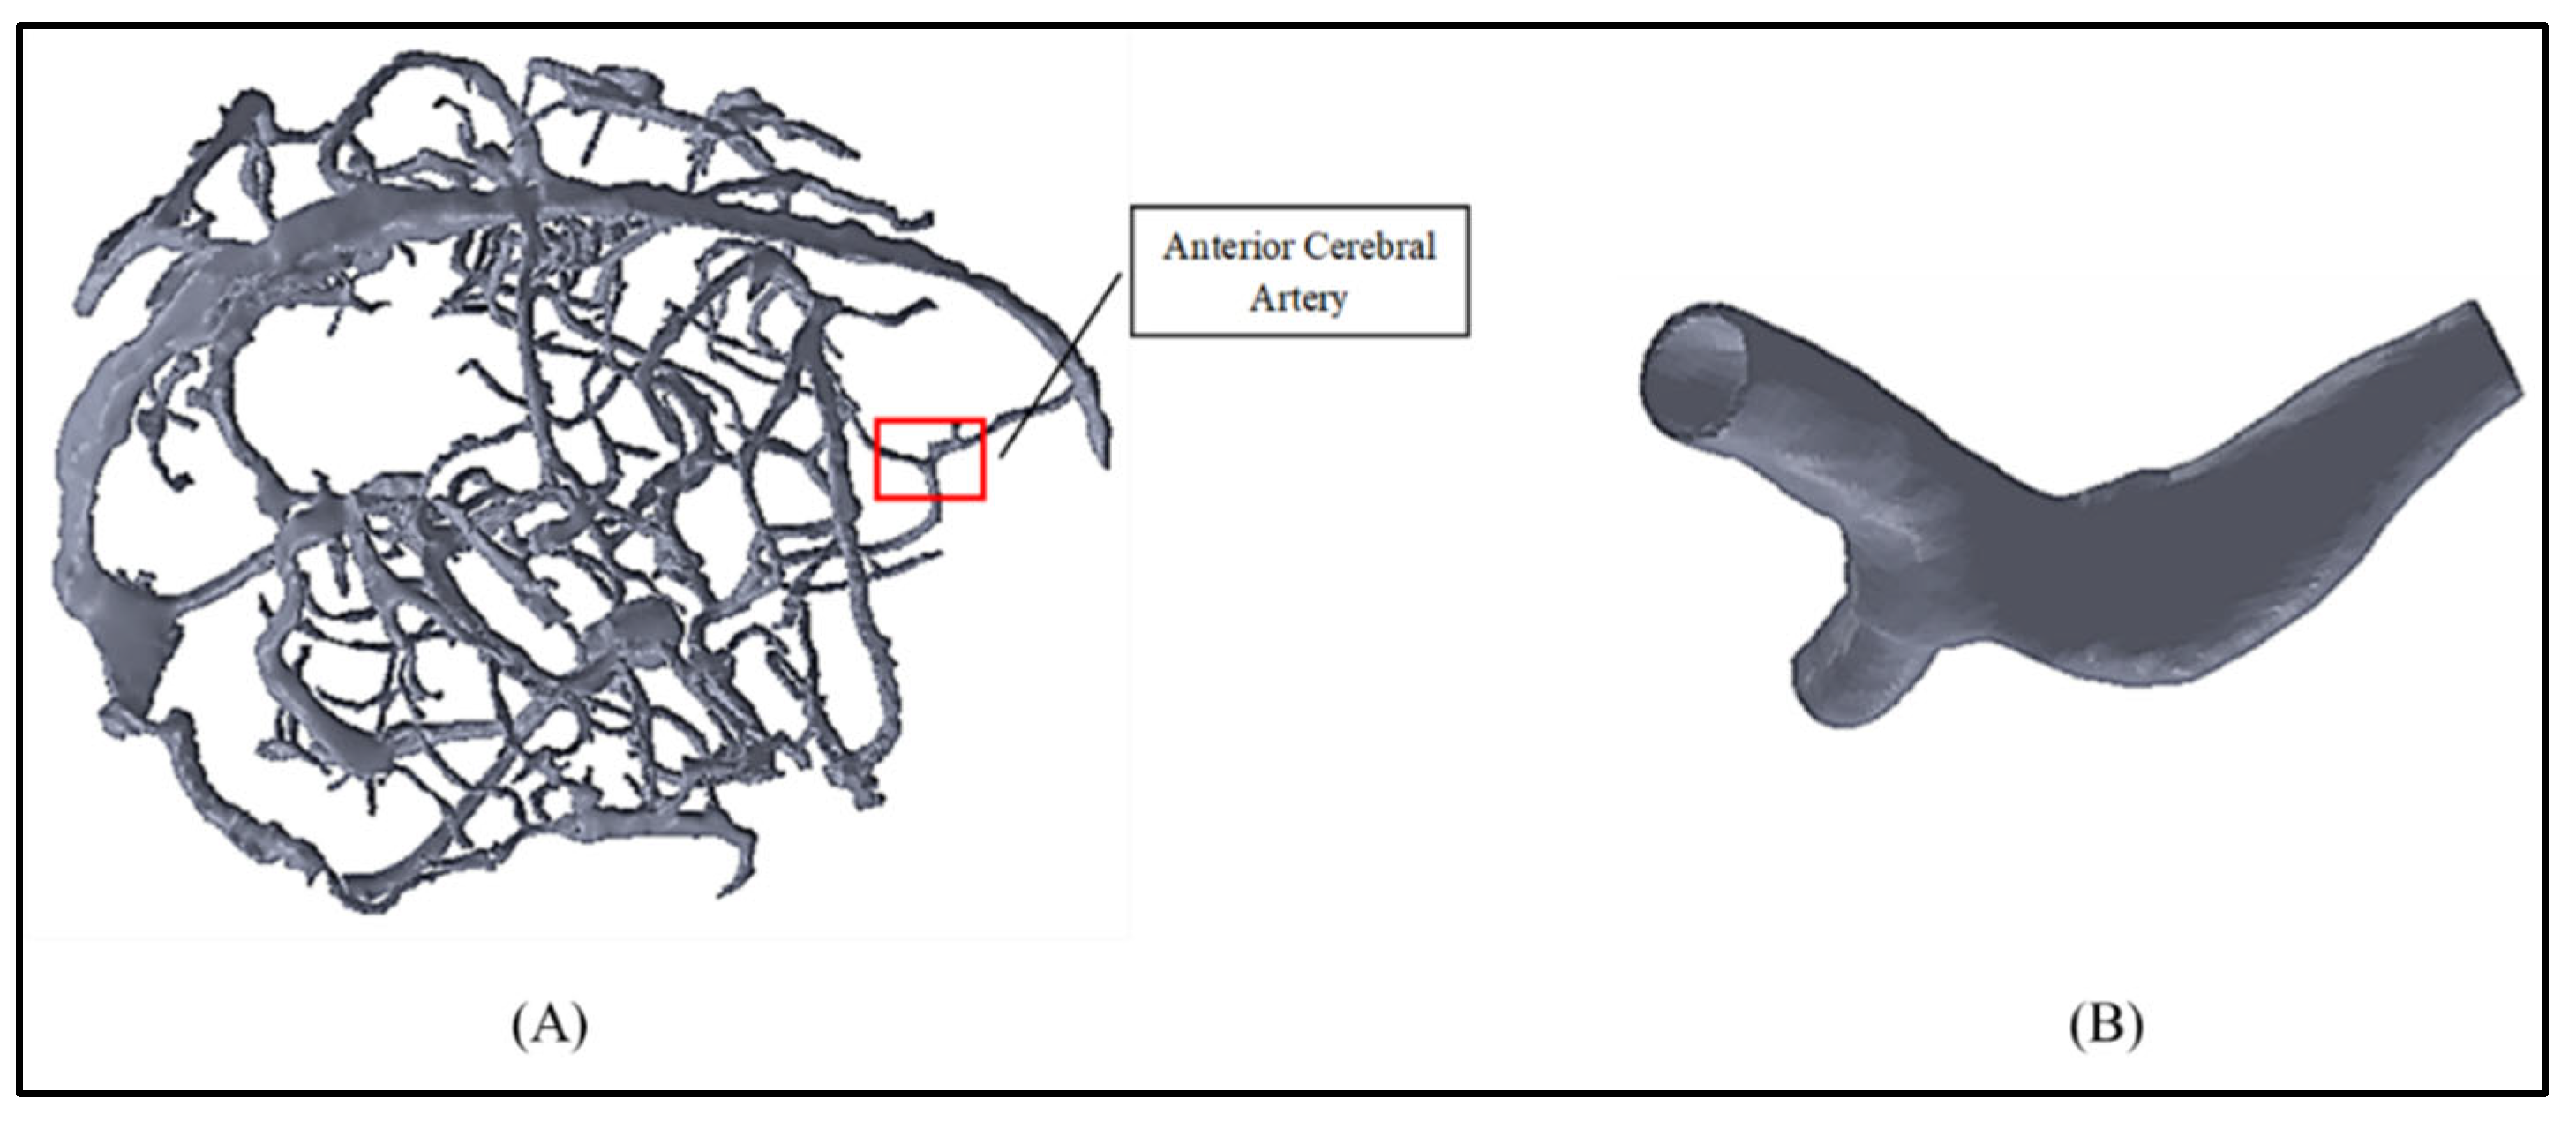
Figure 2.
Aneurysms of different diameters that simulate growth in ACA: (A) 2 mm, (B) 4 mm, (C) 6 mm, (D) 8 mm, and (E) 10 mm.
Figure 2.
Aneurysms of different diameters that simulate growth in ACA: (A) 2 mm, (B) 4 mm, (C) 6 mm, (D) 8 mm, and (E) 10 mm.

Figure 3.
Meshed artery model of the ACA section.
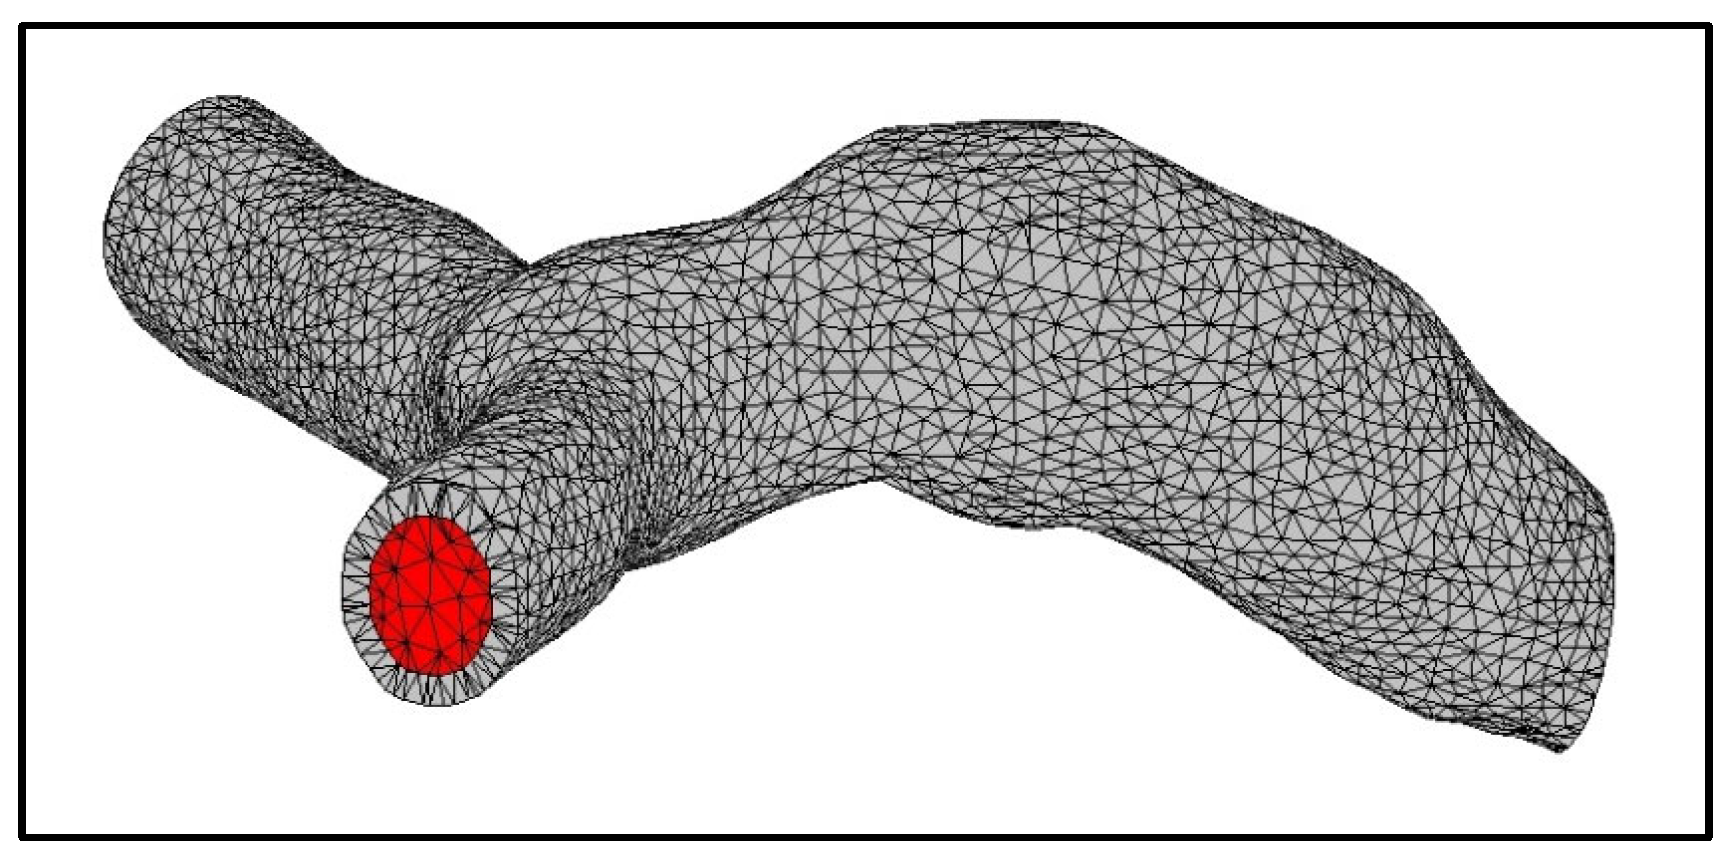
Figure 4.
Annotation of the inlet and outlet section for artery ACA.
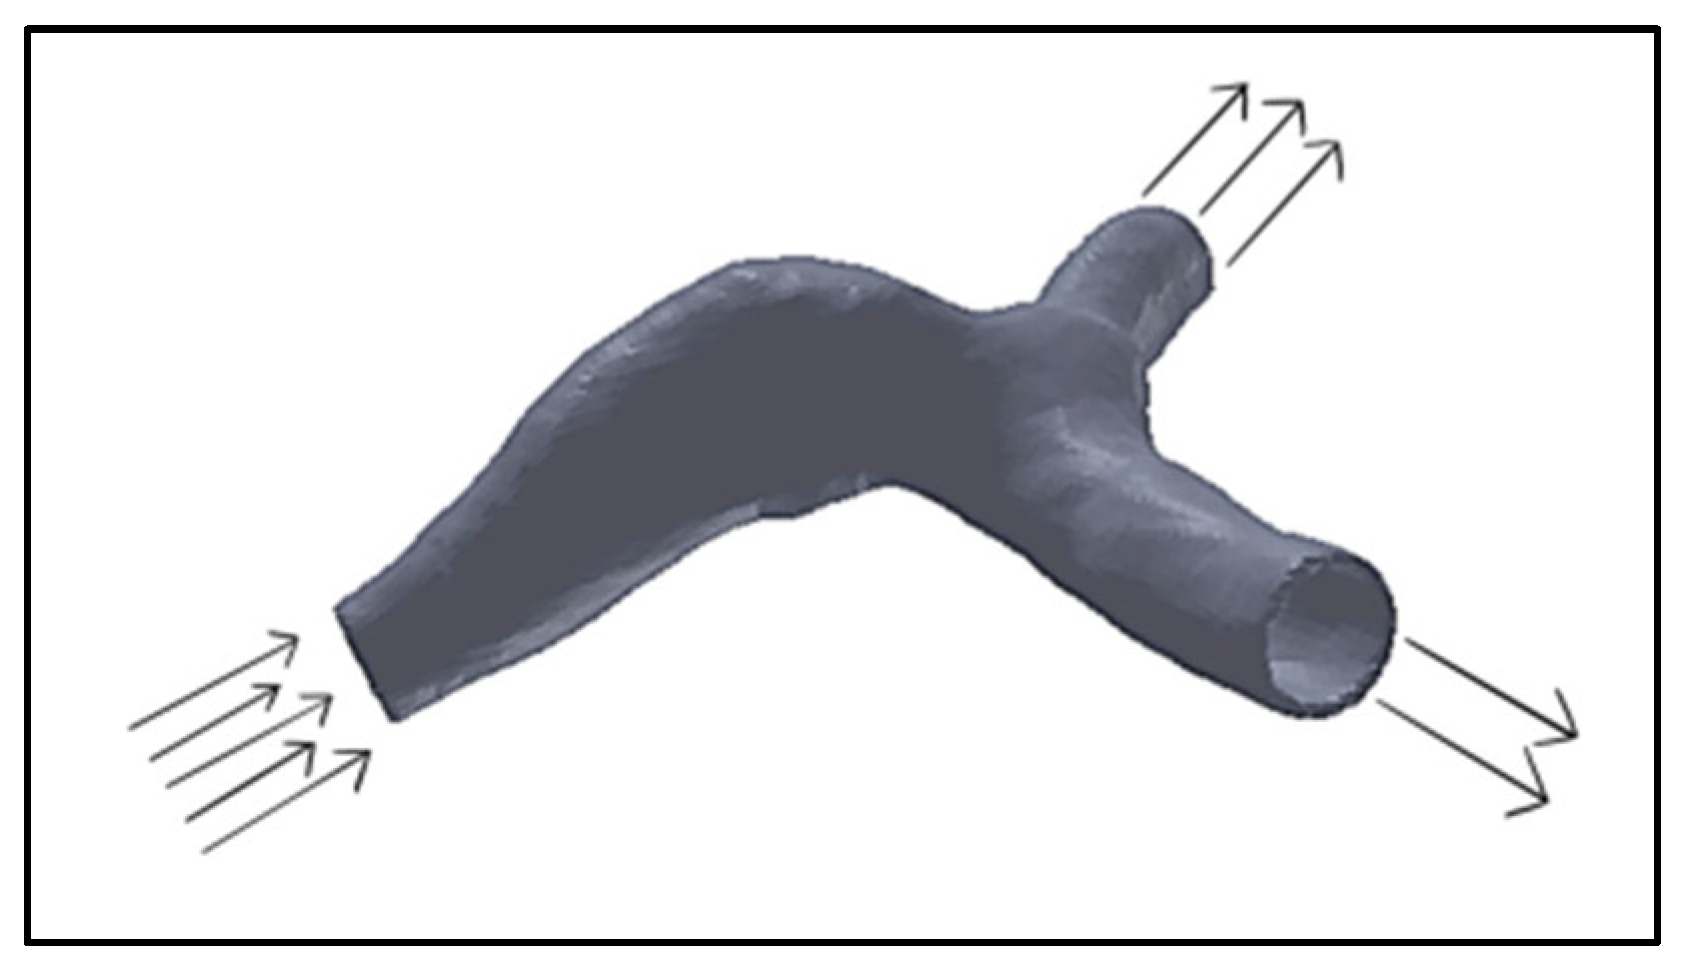
Figure 5.
(A) Mesh convergence results for ACA; (B) CFD result convergence; (C) plot of surface report for wall shear stress result vs. iteration.
Figure 5.
(A) Mesh convergence results for ACA; (B) CFD result convergence; (C) plot of surface report for wall shear stress result vs. iteration.
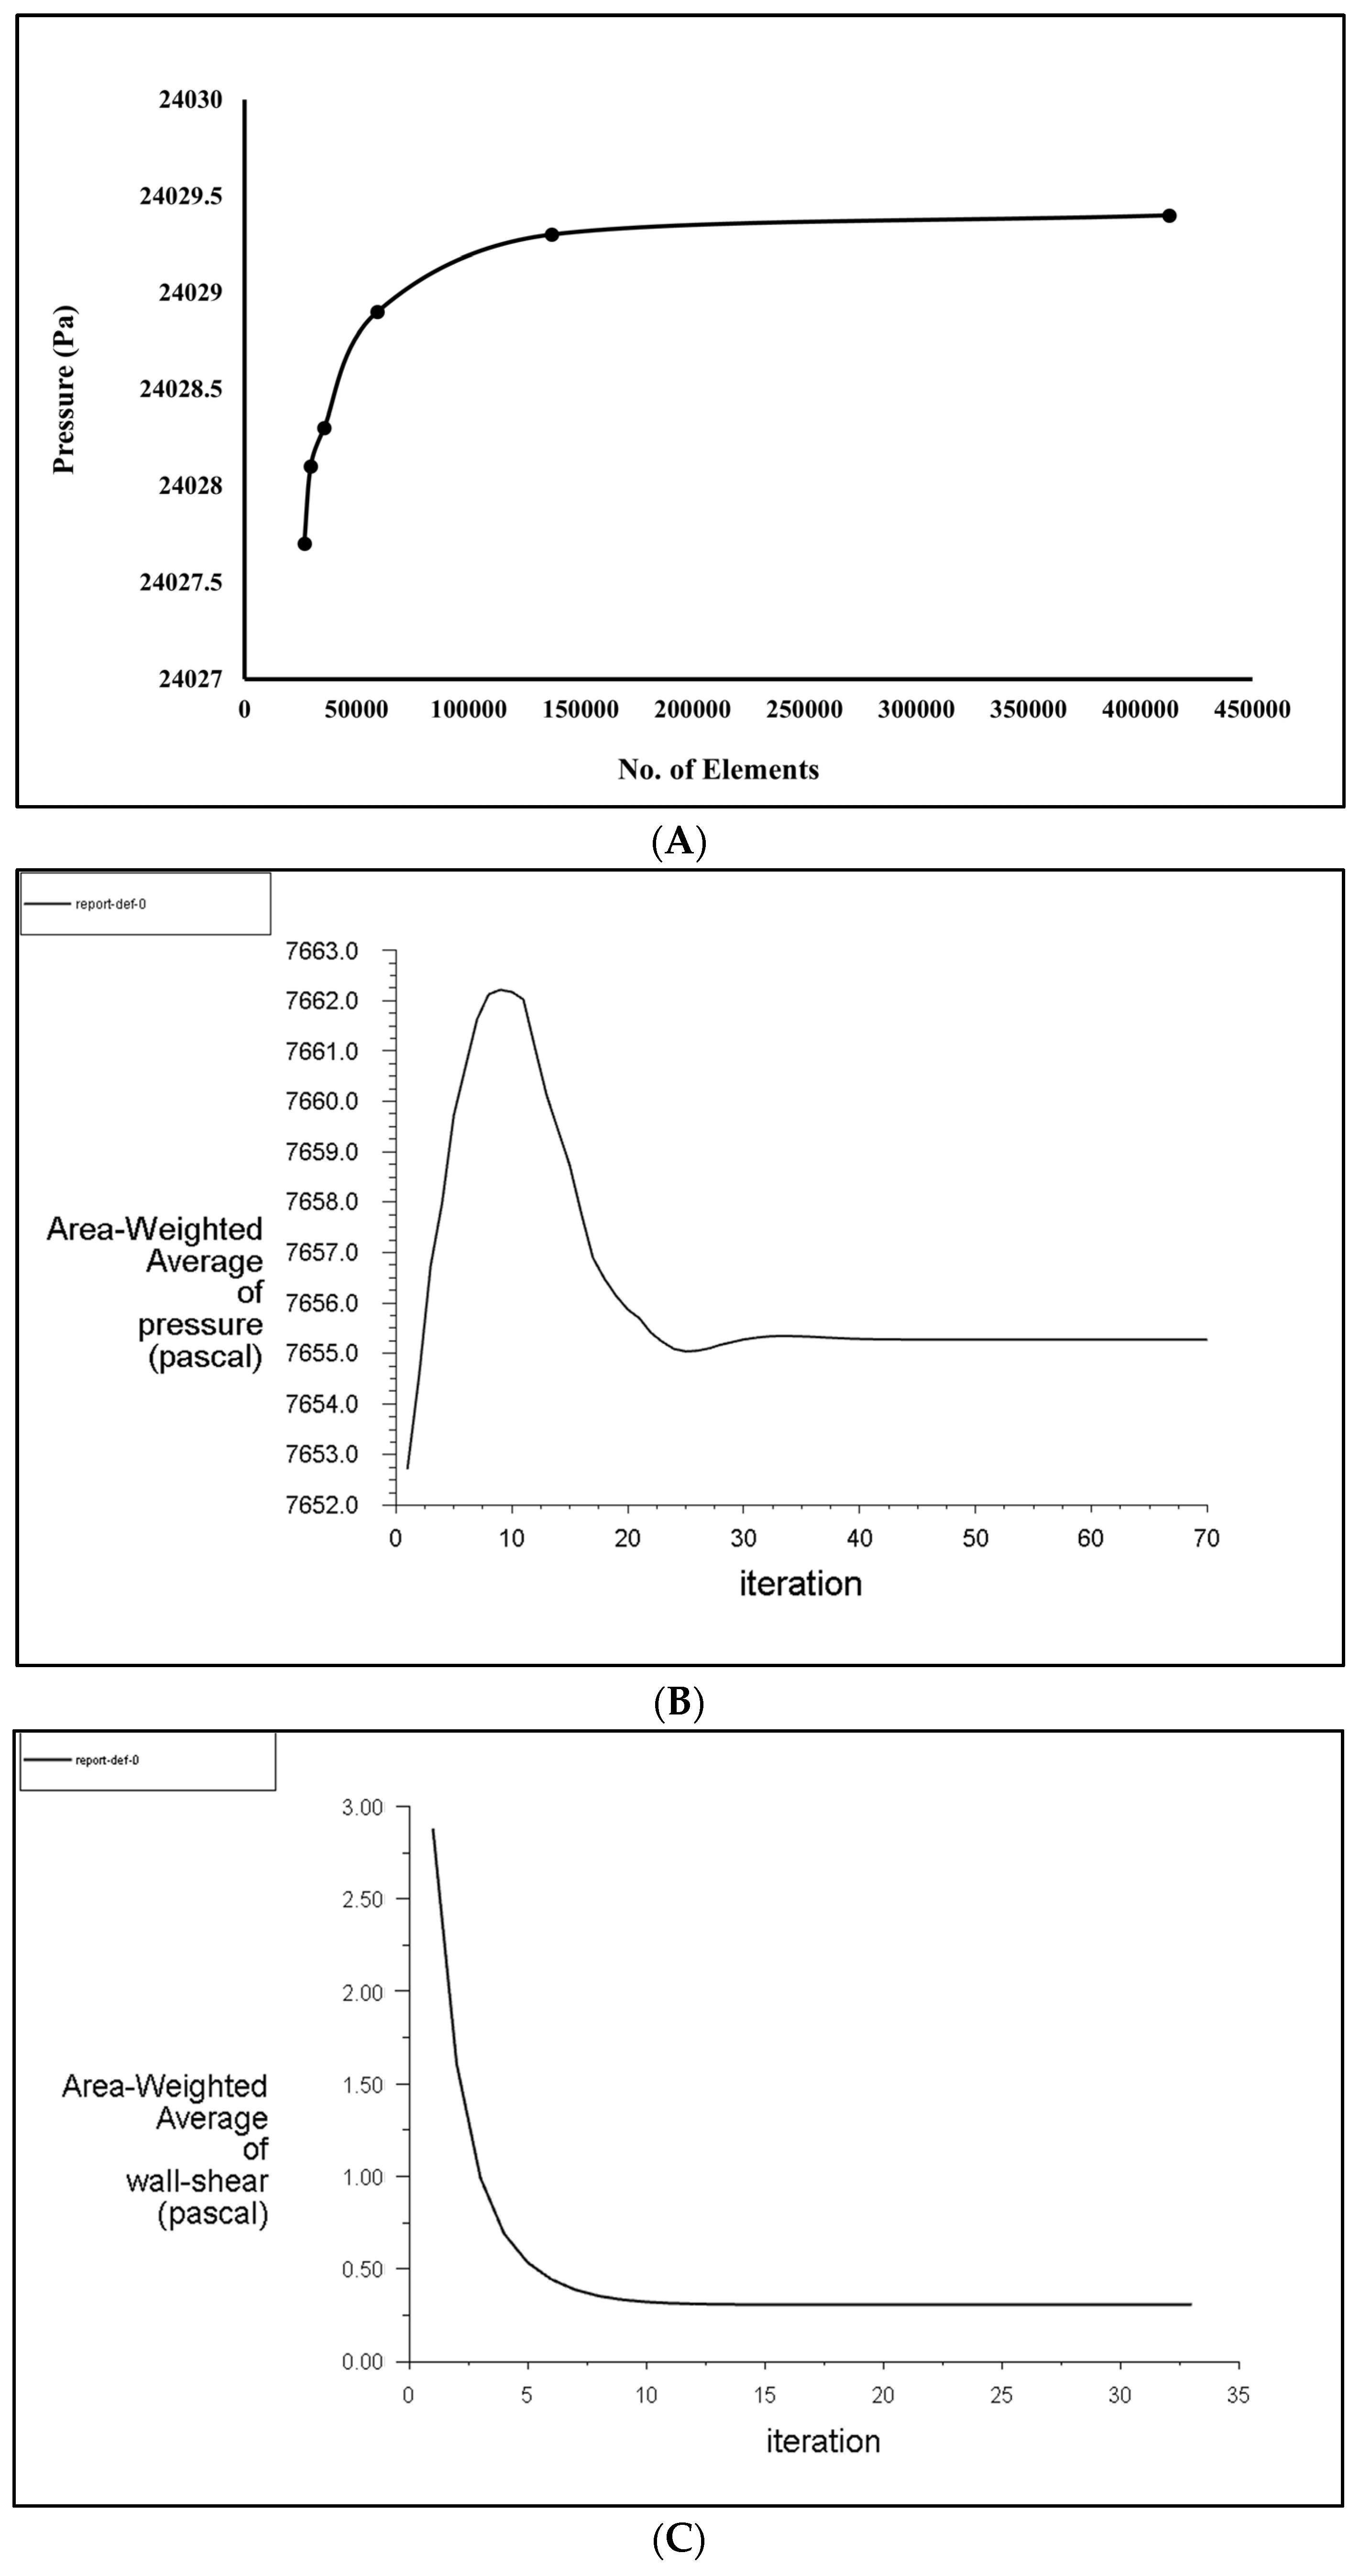
Figure 6.
(a,b) Pressure contours of artery ACA of wall thickness 0.075 mm and 0.15 mm, respectively, at hypertension pressure conditions for different aneurysm diameters: (A) 2 mm, (B) 4 mm, (C) 6 mm, (D) 8 mm, and (E) 10 mm.
Figure 6.
(a,b) Pressure contours of artery ACA of wall thickness 0.075 mm and 0.15 mm, respectively, at hypertension pressure conditions for different aneurysm diameters: (A) 2 mm, (B) 4 mm, (C) 6 mm, (D) 8 mm, and (E) 10 mm.
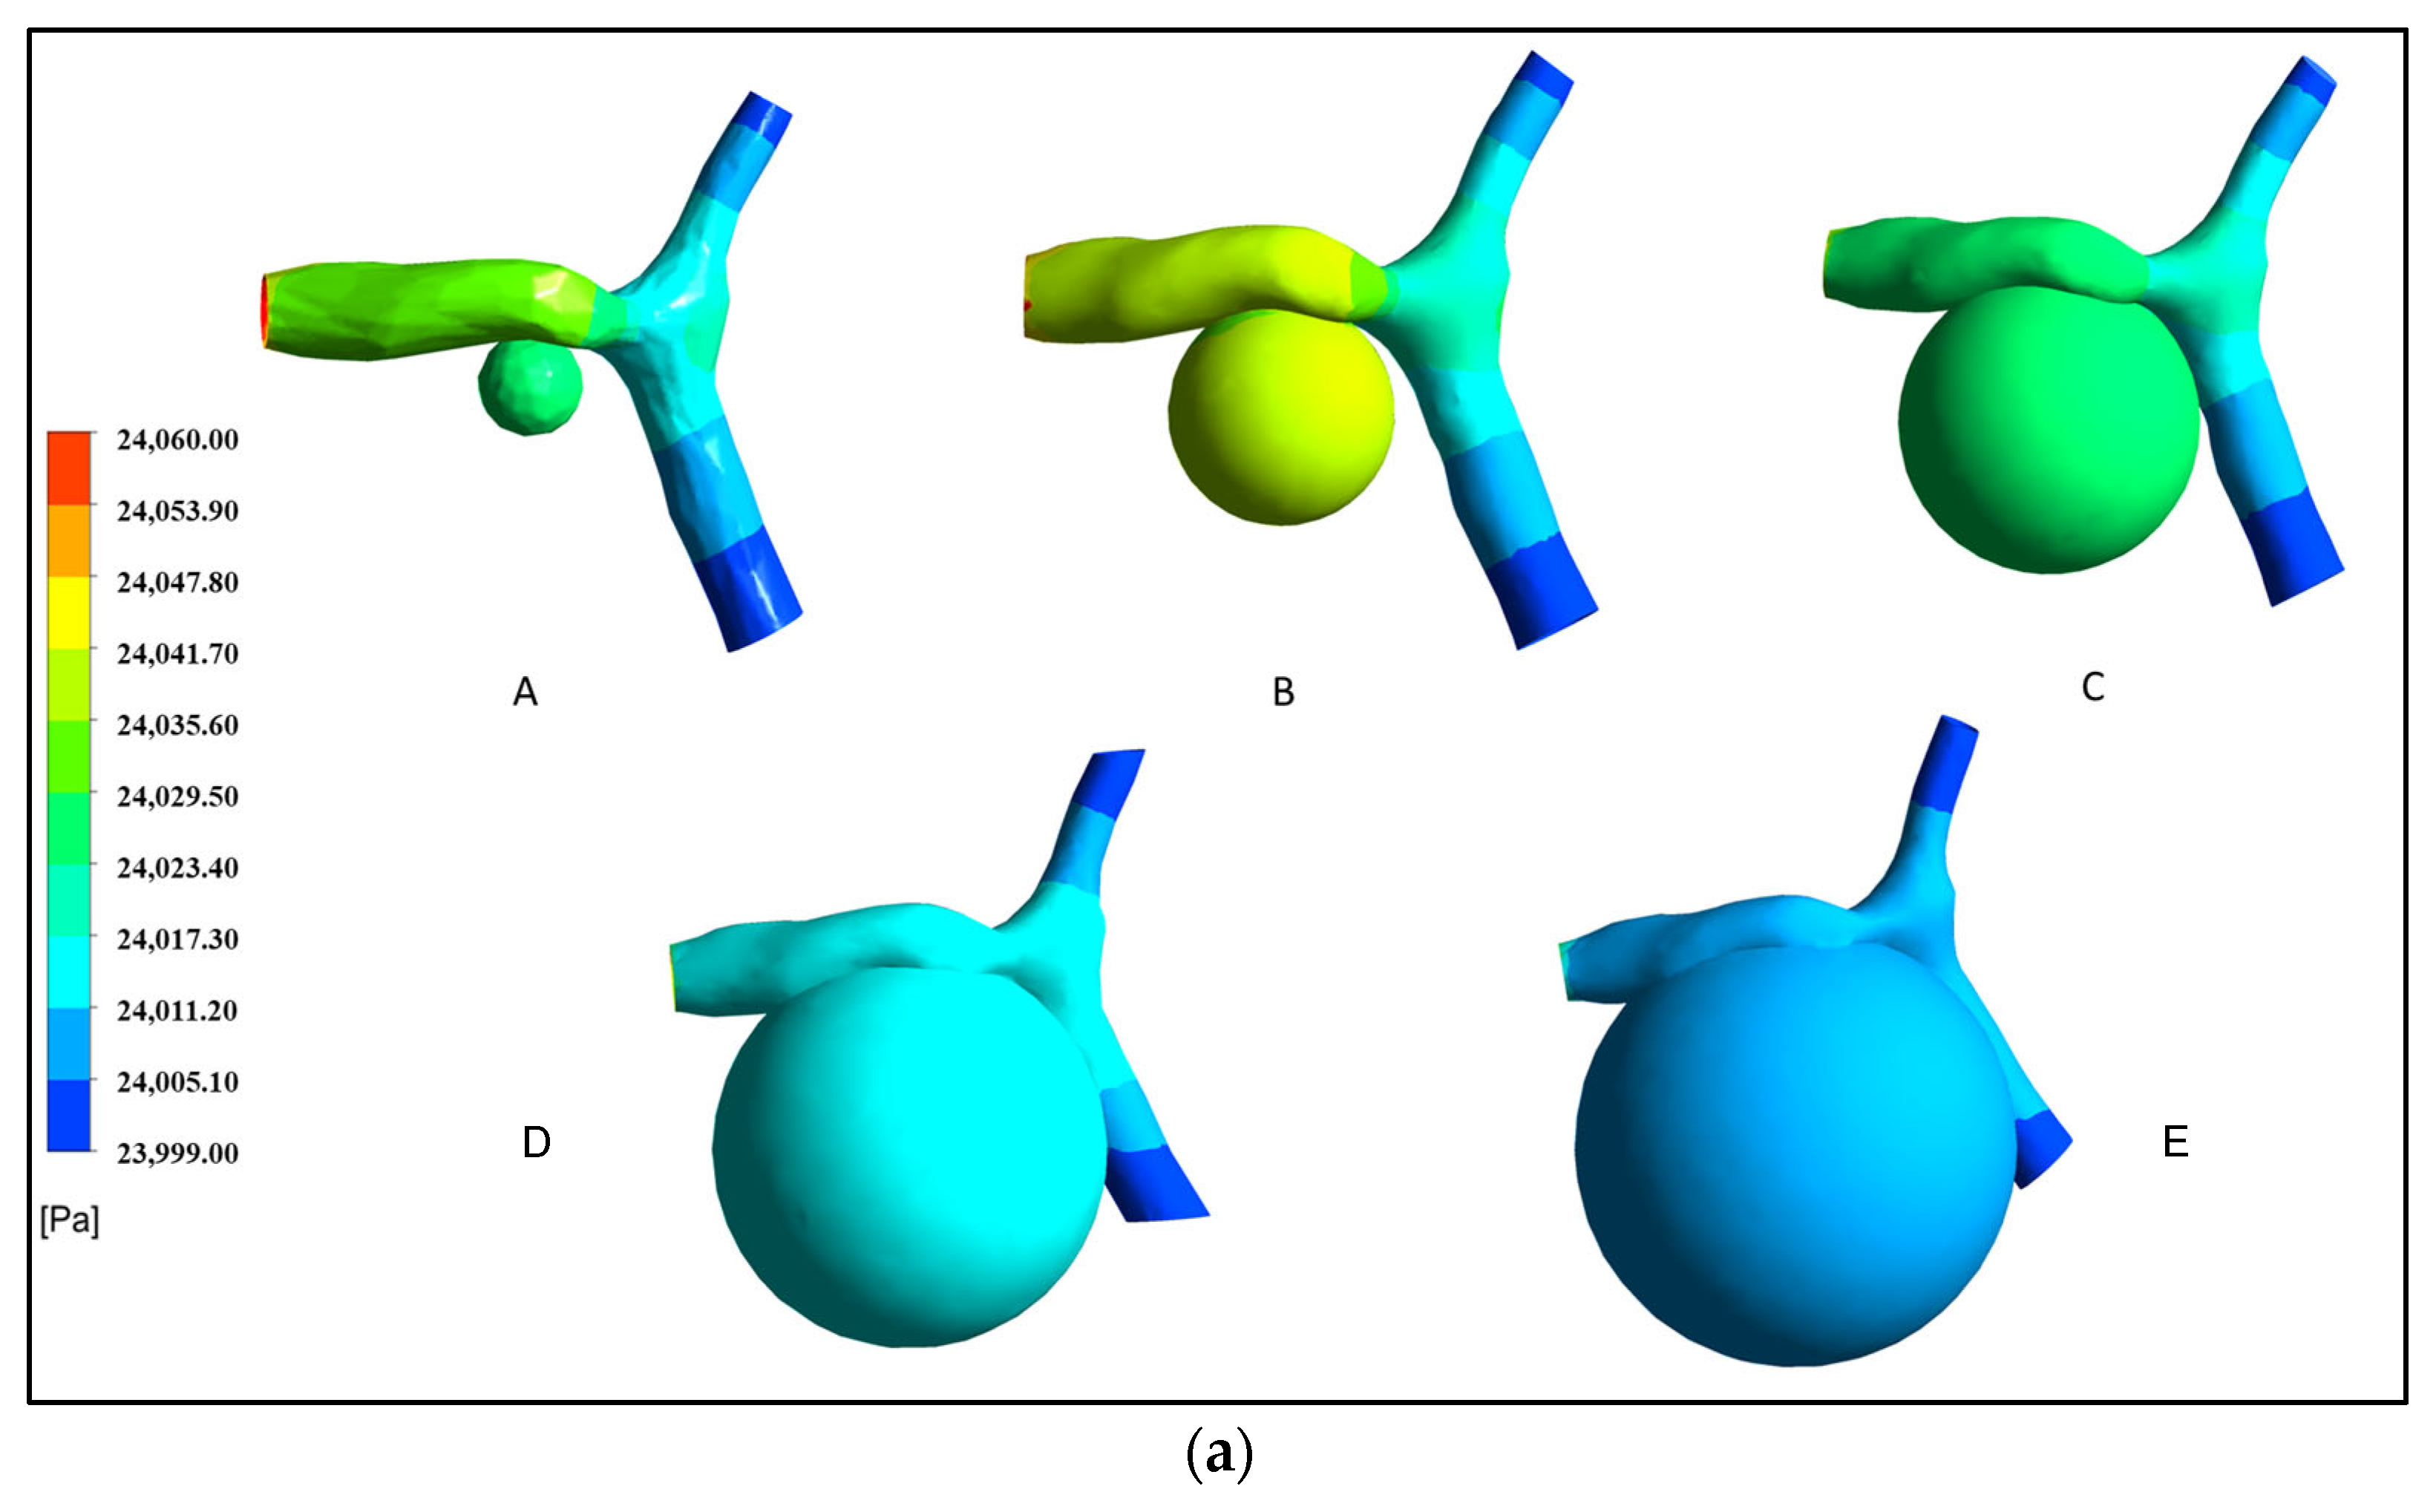
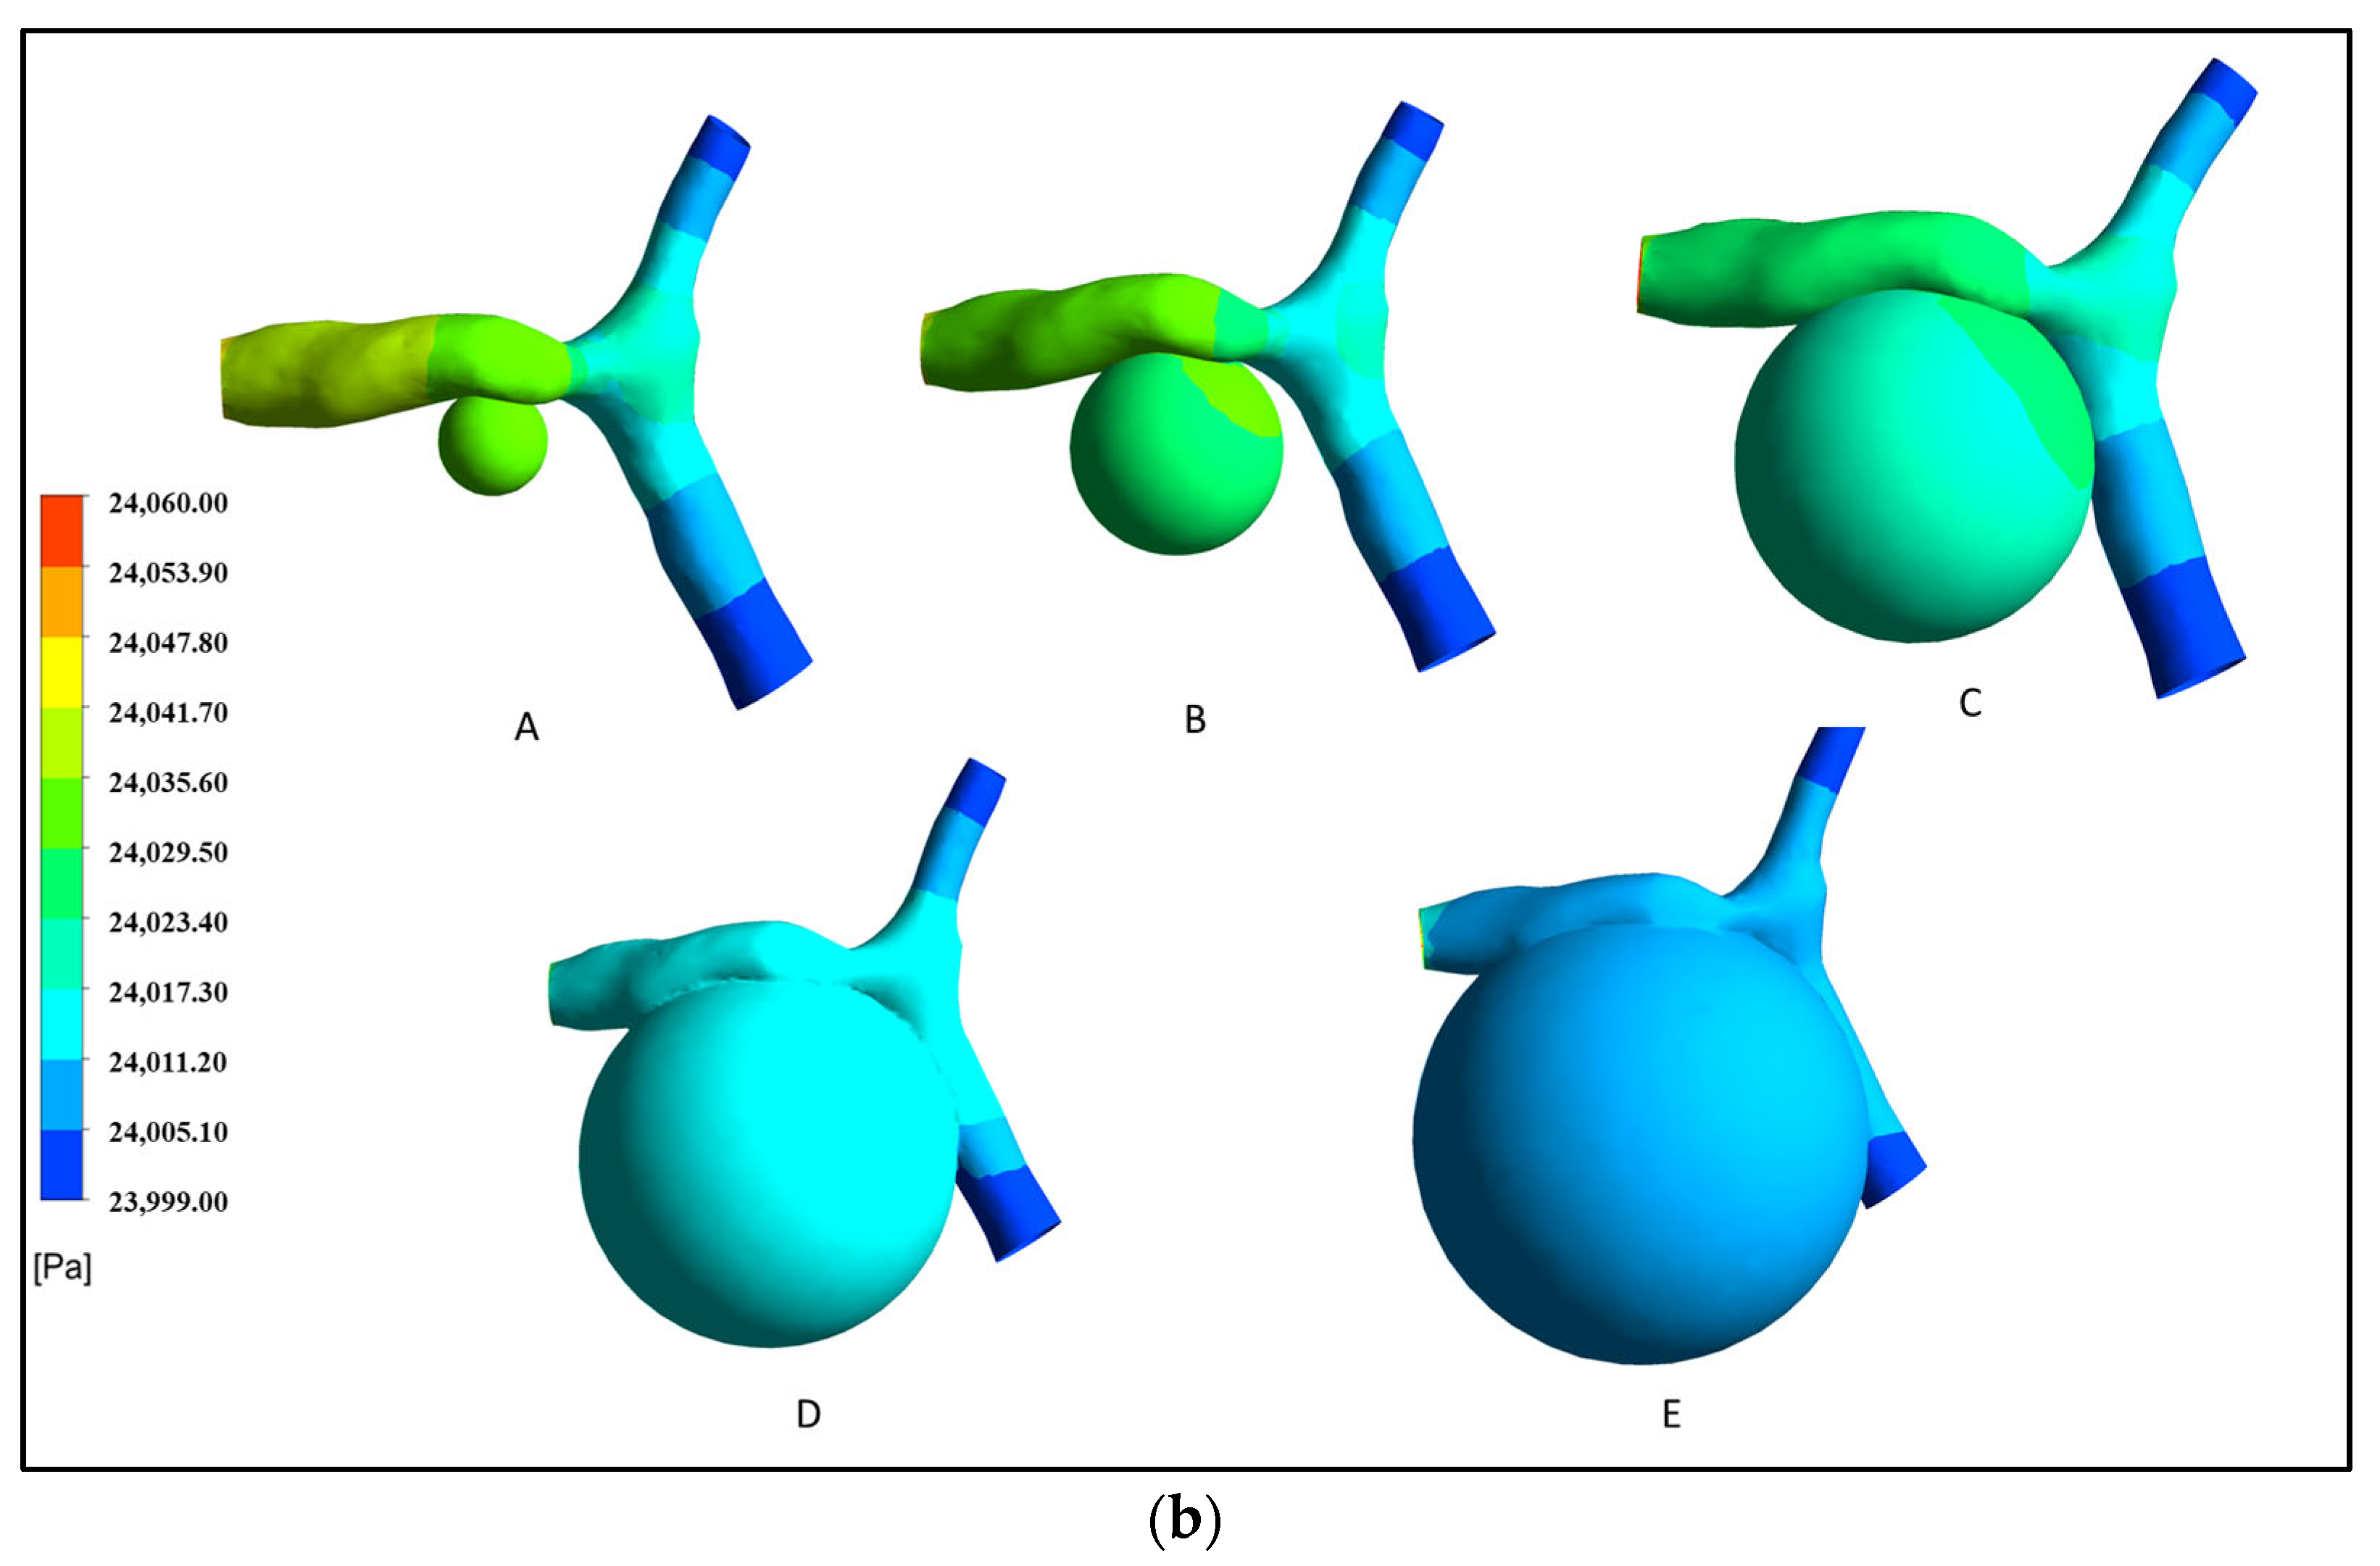
Figure 7.
(a,b) Wall shear stress contours of artery ACA of wall thickness 0.075 mm and 0.15 mm, respectively, at hypertension pressure conditions for different aneurysm diameters: (A) 2 mm, (B) 4 mm, (C) 6 mm, (D) 8 mm, and (E) 10 mm.
Figure 7.
(a,b) Wall shear stress contours of artery ACA of wall thickness 0.075 mm and 0.15 mm, respectively, at hypertension pressure conditions for different aneurysm diameters: (A) 2 mm, (B) 4 mm, (C) 6 mm, (D) 8 mm, and (E) 10 mm.


Figure 8.
(a,b) Velocity streamlines contours of artery ACA of wall thickness 0.075 mm and 0.15 mm, respectively, at hypertension pressure conditions for different aneurysm diameters: (A) 2 mm, (B) 4 mm, (C) 6 mm, (D) 8 mm, and (E) 10 mm.
Figure 8.
(a,b) Velocity streamlines contours of artery ACA of wall thickness 0.075 mm and 0.15 mm, respectively, at hypertension pressure conditions for different aneurysm diameters: (A) 2 mm, (B) 4 mm, (C) 6 mm, (D) 8 mm, and (E) 10 mm.

Figure 9.
(A,C) Pressure at the aneurysm and average pressure at the neck variation with diameter of wall thickness 0.075 mm and 0.15 mm, respectively. (B,D) Correlation of pressure with diameter for wall thicknesses of 0.075 mm and 0.15 mm, respectively.
Figure 9.
(A,C) Pressure at the aneurysm and average pressure at the neck variation with diameter of wall thickness 0.075 mm and 0.15 mm, respectively. (B,D) Correlation of pressure with diameter for wall thicknesses of 0.075 mm and 0.15 mm, respectively.


Figure 10.
Correlation of velocity with diameter for wall thicknesses of (A) 0.075 mm and (B) 0.15 mm.
Figure 10.
Correlation of velocity with diameter for wall thicknesses of (A) 0.075 mm and (B) 0.15 mm.
Disclaimer/Publisher’s Note: The statements, opinions and data contained in all publications are solely those of the individual author(s) and contributor(s) and not of MDPI and/or the editor(s). MDPI and/or the editor(s) disclaim responsibility for any injury to people or property resulting from any ideas, methods, instructions or products referred to in the content. |
© 2023 by the authors. Licensee MDPI, Basel, Switzerland. This article is an open access article distributed under the terms and conditions of the Creative Commons Attribution (CC BY) license (https://creativecommons.org/licenses/by/4.0/).
Share and Cite
MDPI and ACS Style
Singla, R.; Gupta, S.; Chanda, A. A Computational Fluid Dynamics-Based Model for Assessing Rupture Risk in Cerebral Arteries with Varying Aneurysm Sizes. Math. Comput. Appl. 2023, 28, 90. https://doi.org/10.3390/mca28040090
AMA Style
Singla R, Gupta S, Chanda A. A Computational Fluid Dynamics-Based Model for Assessing Rupture Risk in Cerebral Arteries with Varying Aneurysm Sizes. Mathematical and Computational Applications. 2023; 28(4):90. https://doi.org/10.3390/mca28040090
Chicago/Turabian StyleSingla, Rohan, Shubham Gupta, and Arnab Chanda. 2023. "A Computational Fluid Dynamics-Based Model for Assessing Rupture Risk in Cerebral Arteries with Varying Aneurysm Sizes" Mathematical and Computational Applications 28, no. 4: 90. https://doi.org/10.3390/mca28040090