Arbitrarily Accurate Analytical Approximations for the Error Function


School of Electrical Engineering, Computing and Mathematical Sciences, Curtin University, GPO Box U1987, Perth 6845, Australia
Math. Comput. Appl. 2022, 27(1), 14; https://doi.org/10.3390/mca27010014
Submission received: 26 November 2021
/
Revised: 20 January 2022
/
Accepted: 27 January 2022
/
Published: 9 February 2022
(This article belongs to the Collection Feature Papers in Mathematical and Computational Applications)
Abstract
:A spline-based integral approximation is utilized to define a sequence of approximations to the error function that converge at a significantly faster manner than the default Taylor series. The real case is considered and the approximations can be improved by utilizing the approximation for and with optimally chosen. Two generalizations are possible; the first is based on demarcating the integration interval into m equally spaced subintervals. The second, is based on utilizing a larger fixed subinterval, with a known integral, and a smaller subinterval whose integral is to be approximated. Both generalizations lead to significantly improved accuracy. Furthermore, the initial approximations, and those arising from the first generalization, can be utilized as inputs to a custom dynamic system to establish approximations with better convergence properties. Indicative results include those of a fourth-order approximation, based on four subintervals, which leads to a relative error bound of 1.43 × 10⁻⁷ over the interval . The corresponding sixteenth-order approximation achieves a relative error bound of 2.01 × 10⁻¹⁹. Various approximations that achieve the set relative error bounds of 10−4, 10−6, 10−10, and 10−16, over , are specified. Applications include, first, the definition of functions that are upper and lower bounds, of arbitrary accuracy, for the error function. Second, new series for the error function. Third, new sequences of approximations for that have significantly higher convergence properties than a Taylor series approximation. Fourth, the definition of a complementary demarcation function that satisfies the constraint . Fifth, arbitrarily accurate approximations for the power and harmonic distortion for a sinusoidal signal subject to an error function nonlinearity. Sixth, approximate expressions for the linear filtering of a step signal that is modeled by the error function.
MSC (2020):
33B20; 41A10; 41A15; 41A581. Introduction
The error function arises in many areas of mathematics, science, and scientific applications including diffusion associated with Brownian motion (Fick’s second law), the heat kernel for the heat equation, e.g., [1], the modeling of magnetization, e.g., [2], the modelling of transitions between two levels, for example, with the modeling of smooth or soft limiters, e.g., [3] and the psychometric function, e.g., [4,5], the modeling of amplifier non-linearities, e.g., [6,7], and the modeling of rubber-like materials and soft tissue, e.g., [8,9]. It is widely used in the modeling of random phenomena as the error function defines the cumulative distribution of the Gaussian probability density function and examples include, the probability of error in signal detection, option pricing via the Black–Scholes formula, etc. Many other applications exist. In general, the error function is associated with a macro description of physical phenomena and the de Moivre–Laplace theorem is illustrative of the link between fundamental outcomes and a higher-level model.
The error function is defined on the complex plane according to
where the path is between the points zero and and is arbitrary. Associated functions are the complementary error function, the Faddeyeva function, the Voigt function, and Dawson’s integral, e.g., [10]. The Faddeyeva function and the Voigt function, for example, have applications in spectroscopy, e.g., [11]. The error function can also be defined in terms of the spherical Bessel functions, e.g., Equation (7.6.8) of [10], and the incomplete Gamma function, e.g., Equation (7.11.1) of [10]. Marsaglia [12] provides a brief insight into the history of the error function.
For the real case, which is the case considered in this paper, the error function is defined by the integral
The widely used, and associated, cumulative distribution function for the standard normal distribution is defined according to
Being defined by an integral, which does not have an explicit analytical form, there is interest in approximations of the error function and, in recent decades, many approximations have been developed. Table 1 details indicative approximations for the real case and their relative errors are shown in Figure 1. Most of the approximations detailed in this table are custom and have a limited relative error bound with bounds in the range of 3.05 × 10⁻⁵ [13] to 7.07 × 10⁻³ [14]. It is preferable to have an approximation form that can be generalized to create approximations that converge to the error function. Examples include the standard Taylor series, the Bürmann series, and the approximation by Abrarov, which are defined in Table 1.
Many of the approximations detailed in Table 1 can be improved upon by approximating the associated residual function, denoted g, via a Padé approximant or a basis set decomposition. Examples of possible approximation forms, and the resulting residual functions, are given in Table 2. One example is that of a 4/2 Padé approximant for the function , which leads to the approximation:
The relative error bound in this approximation is 4.02 × 10⁻⁷. Higher-order Padé approximants can be used to generate approximations with a lower relative error bound. Matic [15] provides a similar approximation with an absolute error of 5.79 × 10⁻⁶.
An approximation of the error function can also be obtained by combining separate approximations, which are accurate, respectively, for and , via a demarcation function d
where
Naturally, an approximation of d requires an approximation of the error function. Unsurprisingly, the relative error in the approximation for the error function equals the relative error in the approximation utilized to approximate the error function in d.
Finally, efficient numerical implementation of the error function is of interest and Chevillard [16] and De Schrijver [17] provide results and an overview. Highly accurate piecewise approximations have long since been defined, e.g., [18].
The two-point spline-based approximations for functions and integrals, detailed in [19], have recently been applied to find arbitrarily accurate approximations for the hyperbolic tangent function [20]. In this paper, the general two-point spline approximation form is applied to define a sequence of convergent approximations for the error function. The basic form of the approximation of order n, denoted , is
where is a polynomial of order n and is a polynomial of order less than n. Convergence of the sequence of approximations to is shown and the convergence is significantly better than the default Taylor series. For example, the second-order approximation
yields a relative error bound of 0.056 over the interval [0, 2] which is better than a fifteenth-order Taylor series approximation. The approximations can be improved by utilizing the approximation for and thereby establishing approximations with a set relative error bound over the interval .
Two generalizations are detailed. The first is of the form
and is based on utilizing approximations associated with m equally spaced subintervals of the interval [0, x]. The second is based on utilizing a fixed subinterval within [0, x] and then approximating the error function over the remainder of the interval. Both generalizations lead to significantly improved accuracy. For example, a fourth-order approximation based on four variable subintervals, when used with the approximation for , has a relative error bound of 1.43 × 10⁻⁷ over the interval . The corresponding sixteenth-order approximation has a relative error bound of 2.01 × 10⁻¹⁹. Finally, by utilizing the solutions of a custom dynamical system, approximations with better convergence properties can be established.
Applications of the proposed approximations for the error function include, first, the definition of functions that are upper and lower bounds, of arbitrary accuracy, for the error function. Second, new series for the error function. Third, new sequences of approximations for that have significantly higher convergence properties than a Taylor series approximation. Fourth, the definition of a complementary demarcation function that satisfies the constraint . Fifth, arbitrarily accurate approximations for the power and harmonic distortion for a sinusoidal signal subject to an error function nonlinearity. Sixth, approximate expressions for the linear filtering of a step signal modeled by the error function.
Section 2 details the spline-based approximation for the error function and its convergence. Improved approximations, obtained by utilizing the nature of the error function for large arguments, are detailed in Section 3. Two generalizations, with the potential for lower relative error bounds, are detailed in Section 4 and Section 5. Section 6 details how the initial approximations, and the approximations arising from the first generalization, can be utilized as inputs to a custom dynamical system to establish approximations with better convergence properties. Applications are specified in Section 7. Conclusions are stated in Section 8.
1.1. Notes and Notation
As , it is sufficient to consider approximations for the interval .
For a function defined over the interval , an approximating function has a relative error, at a point , defined according to . The relative error bound for the approximating function over the interval is defined according to
The notation is used. The symbol u denotes the unit step function.
Mathematica has been used to facilitate the analysis and to obtain numerical results.
1.2. Background Results
The following result underpins the bounds proposed for the error function:
Lemma 1.
Upper and Lower Functional Bounds. A positive approximation to a positive function over the interval , with a relative error bound
leads to the following upper and lower bounded functions:
The relative error bounds, over the interval , for the upper and lower bounded functions, respectively, are:
Proof.
The definition of the relative error bound, as specified by Equation (12), leads to
which implies
and the relative error bounds:
□
Convergent Integral Approximations
One application of the proposed approximations for the error function requires knowledge of when function convergence implies convergence of associated integrals.
Lemma 2.
Convergent Integral Approximation. If a sequence of functions converges, over the interval , to a bounded and integrable function , then point-wise convergence is sufficient for the associated integrals to be convergent, i.e., for
Proof.
The required result follows if it is possible to interchange the order of limit and integration, i.e.,
Standard conditions for when the interchange is valid are specified by the monotone and dominated convergence theorems, e.g., [29], (p. 26). Sufficient conditions for a valid interchange include point-wise function convergence, and for to be integrable and bounded. □
2. Spline-Based Approximations for Error Function
2.1. Spline Approximation for Error Function
The following nth-order, two-point spline-based approximation for an integral has been detailed in Equation (48) of [19], for a function that is at least (n + 1)th-order differentiable:
where
Direct application of this result to the integral defining the error function leads to the results stated in Theorem 1:
Theorem 1.
Spline-Based Integral Approximation for Error Function. The error function can be defined according to
where is the nth-order spline-based integral approximation defined according to
and is the associated residual function whose derivative is
In these equations,
A more general approximation is
Proof.
The proof is detailed in Appendix A. □
2.1.1. Note
The polynomial function is equivalently defined by the kth-order Hermite polynomial function ([21], p. 775, Equation (23.3.10)) and an explicit form is
A change of variable , and noting that implies , leads to the alternative form
Substitution of this form into Equation (24) leads to the direct polynomial form for the nth-order approximation to the error function:
2.1.2. Approximations
The polynomial functions p, as defined by Equations (26), (28), and (29), have the explicit forms:
Approximations for the error function, as defined by Equation (24) and for orders zero to five, are:
2.2. Results
The relative error in the zero- to tenth-order spline-based series approximations, along with the relative error in Taylor series approximations of orders 1–15, are detailed in Figure 2. The clear superiority, in terms of convergence, of the spline-based series relative to the Taylor series is evident. The relative error in the spline approximations, of orders 16, 20, 24, 28, and 32, are shown in Figure 3.
The Mathematica code underpinning the results shown in Figure 2, is detailed in Supplementary Material. Such code is indicative of the code underpinning the results detailed in the paper.
2.3. Approximation for Large Arguments
Zero- and first-order approximations for the error function, and for the case of , are
The relative errors in such approximations, respectively, are
and their graphs are shown in Figure 3.
2.4. Convergence
To prove the convergence of the sequence of functions , defined by Theorem 1, to the error function, it is sufficient to prove that the corresponding sequence of residual functions converge to zero. This can be shown by considering the derivatives of the residual functions defined by Equation (25). The derivatives of the residual functions of orders zero, one, and two, respectively, are:
Theorem 2.
Convergence of Spline-Based Approximations. For all fixed values of x, the derivatives of the residual functions converge to zero as the order increases, i.e., for all fixed values of x it is the case that
This is sufficient for the convergence of the residual functions, i.e., and, hence, for x fixed:
The convergence is nonuniform.
Proof.
The proof is detailed in Appendix B. □
2.5. Improved Approximation Based on Iteration
Consider the general result
By using the approximations, , as defined in Theorem 1, in the integral, improved approximations for the error function can be defined.
Theorem 3.
Improved Approximation via Iteration. An improved approximation, of order n, for the error function is
where and are defined, respectively, by Equations (21) and (29).
Proof.
From Equation (45), it follows that
As
it follows, from the form for detailed in Equation (30), that
which is the required result. □
2.5.1. Explicit Approximations
Approximations to the error function, of orders zero to five, are:
Note that integration of these expressions leads to functions defined, in part, by the Gamma function that is an integral. This makes further iteration impractical.
2.5.2. Results
3. Improved Approximations
3.1. Improved Approximation for Error Function
An improved approximation for the error function can be achieved by noting, as illustrated in Figure 3, that the approximation is increasingly accurate for the case of and for increasing. By switching at a suitable point , as illustrated in Figure 5, from a spline-based approximation to the approximation , an improved approximation is achieved. Naturally, it is possible to switch to the approximation , or higher-order approximations, in a similar manner.
Theorem 4.
Improved Approximation for Error Function. Improved approximations for the error function, based on the nth-order approximations detailed in Theorems 1 and 3, and consistent with the illustration shown inFigure 5, are
where the transition points, respectively, are defined according to
Proof.
The improved approximation results follow from optimally switching, as illustrated in Figure 5 and at the point specified by Equation (57), to the approximation , which has a lower relative error magnitude. □
Transition Points and Relative Error Bounds
The transition points, for various orders of spline approximation, are specified in Table 3. The relationship between the transition point and order is shown in Figure 6 for the case of the approximations . This relationship can be approximated, with a second-order polynomial, according to
However, as small variations in can lead to significant changes in the maximum relative error in the approximation for the error function, precise values for are preferable.
3.2. Improved Approximation for Taylor Series
The approximation of for can be utilized to improve the relative error bound for a Taylor series approximation according to
where is a nth-order Taylor series, with n odd, as specified in Table 1. The optimum transition points and relative error bounds, for selected orders, are detailed in Table 4. The variation of the relative errors, with order, are shown in Figure 8. The change in the optimum transition point can be approximated according to
but, again, as small variations in can lead to significant changes in the maximum relative error in the approximation for the error function, precise values for are preferable. The clear superiority in the convergence of the spline-based series is evident from a visual comparison of the relative errors shown in Figure 7 and Figure 8.
4. Variable Subinterval Approximations for Error Function
An improved analytic approximation for the error function can be achieved by demarcating the interval into variable subintervals, e.g., the subintervals , , , and for the four-subintervals case, and by utilizing spline-based integral approximations for each subinterval. Chiani [30] utilized subintervals to enhance approximations for the complementary error function.
Theorem 5.
Variable Subinterval Approximations for Error Function. The nth-order spline-based approximation to the error function, based on m equal-width subintervals, is
where
An alternative form is
where
Proof.
The first result follows by applying Equation (27) in Theorem 1 to the subintervals , , , . The alternative form arises by expanding the outer summation in Equation (61) and collecting terms of similar form. □
4.1. Explicit Expressions
A first-order approximation, based on m subintervals, is
For the four-subintervals case, explicit expressions are
Using the alternative form, a fourth-order expression is
A fourth-order spline approximation, which utilizes 16 subintervals, is detailed in Appendix C. This expression, when utilized with the transition point , yields an approximation with a relative error bound of 4.82 × 10⁻¹⁶.
Results
The relative errors in the spline approximations of orders one to six, and for the case of four equal subintervals , , , and , are shown in Figure 9.
4.2. Improved Approximation
The spline approximations utilizing variable subintervals can be improved by using the transition to the approximation at a suitable point, as specified by Equation (56). The relative error in the spline approximations of orders one to seven, and for the case of four equal subintervals , , , and , are updated in Figure 10 to show the improvement associated with utilizing the optimum transition point to the approximation . The relative error bounds, and transition points, are detailed in Table 5 and Table 6 for the cases of four and 16 subintervals.
Examples
A first-order approximation, based on m subintervals, as specified by Equation (65), yields the relative error bound of 7.21 × 10⁻⁵ for four subintervals and the transition point ; 4.51 × 10⁻⁶ for eight subintervals with a transition point ; 2.82 × 10⁻⁷ for 16 subintervals and a transition point of ; and 1.10 × 10⁻⁹ for 64 subintervals and a transition point .
The fourth-order approximation, based on four equal subintervals, as specified by Equation (68), leads to the relative error bound of 1.43 × 10⁻⁷ when used with the transition point . A sixteenth-order approximation, based on four equal subintervals, leads to an error bound of 2.01 × 10⁻¹⁹ when used with the optimum transition point of .
5. Dynamic Constant plus Spline Approximation
Consider the demarcation of the areas, as illustrated in Figure 11 and based on a resolution , that define the error function. It follows that
For the general case of nonuniformly spaced intervals, as defined by the set of monotonically increasing points , and where it is not necessarily the case that , the error function is defined according to
where , and
A spline-based approximation, as defined by Equation (27), can be utilized for the unknown integrals in Equations (69) and (70). This leads to the results stated in Theorem 6:
Theorem 6.
Error Function Approximation: Dynamic Constant Plus a Spline Approximation. The error function, as defined by Equations (69) and (70), can be approximated, respectively, by
Proof.
These results arise from spline approximation of order n, as defined by Equation (27), for the integrals, respectively, over the intervals and . □
5.1. Approximations of Orders Zeros to Four
Approximations of orders zero to four arising from Theorem 6 are:
5.2. Results
For a resolution of , the coefficients are tabulated in Table 7.
A resolution of yields a relative error bound of 1.16 × 10⁻⁵ for a second-order approximation, a relative error bound of 1.35 × 10⁻⁹ for a fourth-order approximation, a relative error bound of 7.15 × 10⁻¹⁴ for a sixth-order approximation and a relative error bound of 9.03 × 10−37 for a sixteenth-order approximation. These bounds are based on 10,000 equally spaced samples in the interval [0, 8].
The variation of the relative error bound with resolution, and order, is detailed in Figure 12. The nature of the variation of the relative error, for orders two, three, and four, is shown in Figure 13 for a resolution of 0.5. It is possible to obtain better results by using nonuniformly spaced intervals but the improvement, in general, does not warrant the increase in complexity.
6. A Dynamic System to Yield Improved Approximations
It is possible to utilize the approximations detailed in Theorems 1 and 5 as the basis for determining new approximations with a lower relative error. The approach is indirect and based on considering the feedback system illustrated in Figure 14, which has varying feedback. The differential equation characterizing the system is
For specific input, x, and modulated feedback, , signals the output has a known form. For example, for the case of , the output signal, assuming zero initial conditions, is
For the case of
the output signal, assuming zero initial conditions, is
This case facilitates approximations for the error function, which can be made arbitrarily accurate and which are valid for the positive real line.
Theorem 7.
Dynamical System Approximations for Error Function. Based on the differential equation specified by Equation (79), a nth-order approximation to, for the case of, can be defined according to
where, for the case of :
and with
Here, the coefficients , are defined by the expansion
arising from the polynomials (Equation (26))
Finally, it is the case that
with the convergence being uniform.
Proof.
The proof is detailed in Appendix D. □
6.1. Explicit Approximations
Explicit approximations for orders zero to four for , are:
6.2. Results
The relative error bounds associated with the approximations to are detailed in Table 8. The graphs of the relative errors in the approximations are shown in Figure 15. The clear advantage of the proposed approximations is evident, with the improvement increasing with the order of the initial approximation (i.e., a function with an initial lower relative error bound leads to an increasingly lower relative error bound). The other clear advantage of the approximations, as is evident in Figure 15, is that the relative error is bounded as .
6.3. Extension
By utilizing the approximations detailed in Theorem 5, similar approximations can be detailed, with lower relative error. For example, the first-order approximation, , which is based on four equal subintervals and is defined by Equation (67), yields the approximation
which has a relative error bound of 2.83 × 10⁻⁶. With an optimum transition point of 3.292, the original approximation has a relative error bound of 7.21 × 10⁻⁵ (see Table 5).
6.4. Notes
First, the constants , , as defined in Equation (84), form a series that in the limit converges to 1. It then follows that the corresponding series converges to π:
Second, the square root functional structure has been utilized for approximations to the error function, as is evident from the approximations detailed in Table 1. It is easy to conclude that the form
is well suited for approximating the error function.
7. Applications
This section details indicative applications for the approximations to the error function that have been detailed above.
The distinct analytical forms specified in Theorems 1, 3, 5 and 7, for approximations to the error function, in general, facilitate analysis for different applications. For example, the form detailed in Theorem 1 underpins approximations to exp(−x2), as detailed in Section 7.2. The form detailed in Theorem 7 underpins analytical approximations for the power associated with the output of a nonlinearity modeled by the error function when subject to a sinusoidal signal. The approximations are detailed in Section 7.6.
For applications, where a set relative error bound over a set interval is required, the suitable approximation will depend, in part, on the domain over which an approximation is required as well as the level of the relative error bound that is acceptable. For example, the approximations detailed in Theorems 1 and 3 lead to simple analytical forms and modest relative error bounds over when used with an appropriate transition point for the approximation of . Without the use of a transition point, such approximations are likely to be best suited for a restricted domain—for example, the domain , which is consistent with the three sigma case arising from a Gaussian distribution. The fourth-order approximations, as specified by Equations (36) and (54), have relative error bounds, respectively, of 1.02 × 10⁻³ and 1.90 × 10⁻⁴ over . Section 7.1 provides examples of approximations that are consistent with set relative error bounds, over the interval , of 10−4, 10−6, 10−10, and 10−16.
7.1. Error Function Approximations: Set Relative Error Bounds
Consider the case where an approximation for the error function, with a relative error bound over the positive real line of 10−4, is required. A 47th-order Taylor series, with a transition point of , yields a relative bound of 1.00 × 10⁴.
An eighth-order spline approximation, with a transition point of , yields a relative error bound of 2.79 × 10⁻⁵. The approximation, according to Equation (56), is
A seventh-order approximation, with a transition point of , yields a relative error bound of 1.79 × 10⁻⁴.
A first-order spline approximation, based on four equal subintervals , , and , is defined according to
and yields a relative error bound of 7.21 × 10⁻⁵ with the transition point .
A dynamic constant plus a spline approximation of order 2, and based on a resolution of , achieves a relative error bound of 8.33 × 10⁻⁵ (10,000 points in the interval [0, 5]). The approximation is
where
Here, the approximation of , for (after three intervals) can be utilized without impacting the relative error bound.
Utilizing a fourth-order spline approximation and iteration consistent with Theorem 7, the approximation
yields a relative error bound of 1.82 × 10⁻⁵.
Details of approximations that are consistent with higher-order relative error bounds are detailed in Table 9.
7.2. Approximation for Exp(−x2)
A nth-order approximation to the Gaussian function is detailed in the following theorem:
Theorem 8.
Approximation for Gaussian Function. A nth-order approximation,to the Gaussian functionis
where is defined by Equation (21) and is defined by Equation (26).
Proof.
The proof is detailed in Appendix E. □
7.2.1. Approximations
Approximations to , of orders zero to five, are:
7.2.2. Results
The relative errors in the above defined approximations to are detailed in Figure 16 for approximations of order 0, 2, 4, 6, 8, 10, and 12, along with the relative error in Taylor series for orders 1, 3, 5, …, 15. The clear superiority of the defined approximations is evident.
7.2.3. Comparison
The following nth-order approximation for exp(−x2) has been proposed in Equation (77) of [19]:
where is defined by Equation (21). The relative error bounds over the interval (the three sigma bound case for Gaussian probability distributions) for this approximation, and the approximation defined by Equation (103), are detailed in Table 10. The tabulated results clearly show that this approximation is more accurate than the approximation detailed in Equation (103). The improvement is consistent with the higher-order Padé approximant being used.
The following approximations (seventh- and fifth-order) yield relative error bounds of less than 0.001 over the interval :
A twenty-seventh-order Taylor series approximation yields a relative bound of 1.03 × 10⁻³.
7.3. Upper and Lower Bounded Approximations to Error Function
Establishing bounds for erf(x) has received modest research interest, e.g., [31], and published bounds for erf(x) for the case of x > 0 include Chu [32]:
Corollary 4.2 of Neuman [33]:
and refinements to the form proposed by Chu [32], e.g., Yang [34,35], Corollary 3.4 of [35]:
where
The relative error in these bounds is detailed in Figure 17.
Utilizing the results of Lemma 1, it follows that any of the approximations detailed in Theorems 4, 5, 6, or 7 can be utilized to create upper and lower bounded functions for erf(x), x > 0, of arbitrary accuracy and with an arbitrary relative error bound. For example, the approximation specified by Equation (99) yields the functional bounds:
with a relative error bound of 8.33 × 10⁻⁵ for the lower bounded function and 1.44 × 10⁻⁴ for the upper bounded function. Such accuracy is better than the bounds underpinning the results shown in Figure 17. The sixteenth-order approximation, , based on four equal subintervals, specified in Appendix C and when used with a transition point , leads to the functional bounds
with a relative error bound of less than 9.64 × 10⁻¹⁶ for the lower bounded function and 9.32 × 10⁻¹⁶ for the upper bounded function.
7.4. New Series for Error Function
Consider the exact results
where is specified by Equation (24) and is specified by Equation (25). By utilizing a Taylor series approximation for in and then integrating, an approximation for can be established. This leads to new series for the error function.
Theorem 9.
New Series for Error Function. Based on zero-, first-, and second-order approximations, the following series for the error function are valid:
Further series, based on higher-order approximations, can also be established.
Proof.
The proof is detailed in Appendix F. □
Results
The relative errors associated with the zero- and second-order series are shown in Figure 18 and Figure 19. Clearly, the relative error improves as the number of terms used in the series expansion increases. The significant improvement in the relative error, for small values of x, is evident. A comparison with the relative errors associated with Taylor series approximations, as shown in Figure 2, shows the improved performance.
The second-order approximation arising from Equation (118), i.e.,
yields a relative error bound of less than 0.001 for the interval [0, 0.87] and less than 0.01 for the interval [0, 1.1].
7.5. Complementary Demarcation Functions
Consider a complementary function which is such that
With the approximation detailed in Theorem 7 (and by noting that —see Equation (96)), it is the case that
and, thus, can be defined independently of the error function. This function is shown in Figure 20 along with . These two functions act as complementary demarcation functions for the interval . The transition point is as
7.6. Power and Harmonic Distortion: Erf Modeled Nonlinearity
The error function is often used to model nonlinearities and the harmonic distortion created by such a nonlinearity is of interest. Examples include the harmonic distortion in magnetic recording, e.g., [2,36], and the harmonic distortion arising, in a communication context, by a power amplifier, e.g., [7]. For these cases, the interest was in obtaining, with a sinusoidal input signal defined by , the harmonic distortion created by an error function nonlinearity over the input amplitude range of [−2, 2].
Consider the output signal of a nonlinearity modelled by the error function:
For such a case, the output power is defined according to
and the output amplitude associated with the kth harmonic is
To determine an analytical approximation to the output power, the approximations stated in Theorem 7 lead to relatively simple expressions. Consider the third-order approximation, as specified by Equation (93), which has a relative error bound of 2.03 × 10⁻⁴ for the positive real line. For such a case, the output signal is approximated according to
and is shown in Figure 21.
The power in can be readily determined (e.g., via Mathematica) and it then follows that an approximation to the true power is
where and , respectively, are the zero- and first-order Bessel functions of the first kind. The variation in output power is shown in Figure 22.
Harmonic Distortion
To establish analytical approximations for the harmonic distortion, the functional forms detailed in Theorem 7 are not suitable. However, the functional forms detailed in Theorem 1 do lead to analytical approximations that are valid over a restricted domain. Consider a fourth-order spline approximation, as specified by Equation (36), which approximates the error function over the range [−2, 2] with a relative error bound that is better than 0.001 and leads to the approximation
The amplitude of the kth harmonic in such a signal is given by
where the change of variable has been used. The first, third, fifth, and seventh harmonic levels are:
The variation, with the input signal amplitude, of the harmonic distortion, as defined by , is shown in Figure 23.
7.7. Linear Filtering of an Error Function Step Signal
Consider the case of a practical step input signal that is modeled by the error function, and the case where such a signal is input to a 2nd-order linear filter with a transfer function defined by
Theorem 10.
Linear Filtering of an Error Function Signal. The output of a second-order linear filter, defined by Equation (135), to an error function input signal, defined by, is
and can be approximated by the nth-order signal
where is defined by one of the approximations detailed in Theorems 4, 5, 6, or 7. It is the case that
Proof.
The proof is detailed in Appendix G. □
Results
For an input signal , , input into a second-order linear filter with , the output signal is shown in Figure 24. The relative errors in the approximations to the output signal are shown in Figure 25 for the case of approximations as specified by Equation (56) and with the use of optimum transition points.
7.8. Extension to Complex Case
By definition, the error function, for the general complex case, is defined according to
where the path is between the points zero and and is arbitrary. For the case of , and a path along the x axis to the point (x, 0) and then to the point , the error function is defined according to Equation (5) of [37]:
7.9. Approximation for the Inverse Error Function
There are many applications where the inverse error function is required and accurate approximations for this function are of interest. From the research underpinning this paper, the author’s view is that finding approximations to the inverse error function is best treated directly and as a separate problem, rather than approaching it via finding the inverse of an approximation to the error function.
8. Conclusions
This paper has detailed analytical approximations for the real case of the error function, underpinned by a spline-based integral approximation, which have significantly better convergence than the default Taylor series. The original approximations can be improved by utilizing the approximation for , with being dependent on the order of approximation. The fourth-order approximations arising from Theorems 1 and 3, with respective transition points of and , achieve relative error bounds over the interval , respectively, of 1.03 × 10⁻³ and 2.28 × 10⁻⁴. The respective sixteenth-order approximations, with and , have relative error bounds of 3.44 × 10⁻⁸ and 6.66 × 10⁻⁹.
Further improvements were detailed via two generalizations. The first was based on utilizing integral approximations for each of the m equally spaced subintervals in the required interval of integration. The second was based on utilizing a fixed subinterval within the interval of integration with a known tabulated area, and then utilizing an integral approximation over the remainder of the interval. Both generalizations lead to significantly improved accuracy. For example, a fourth-order approximation based on four subintervals, with , achieves a relative error bound of 1.43 × 10⁻⁷ over the interval . A sixteenth-order approximation, with , has a relative error bound of 2.01 × 10⁻¹⁹.
Finally, it was shown that a custom feedback system, with inputs defined by either the original error function approximations or approximations based on the use of subintervals, leads to analytical approximations with improved accuracy that are valid over the positive real line without utilizing the approximation for suitably large values of . The original fourth-order error function approximation yields an approximation with a relative error bound of 1.82 × 10⁻⁵ over the interval . The original sixteenth-order approximation yields an approximation with a relative error bound of 1.68 × 10⁻¹⁴.
Applications of the approximations include, first, approximations to achieve the specified error bounds of 10−4, 10−6, 10−10, and 10−16 over the positive real line. Second, the definitions of functions that are upper and lower bounds, of arbitrary accuracy, for the error function. Third, new series for the error function. Fourth, new sequences of approximations for that have significantly higher convergence properties than a Taylor series approximation. Fifth, a complementary demarcation function satisfying the constraint was defined. Sixth, arbitrarily accurate approximations for the power and harmonic distortion for a sinusoidal signal subject to an error function nonlinearity. Seventh, approximate expressions for the linear filtering of a step signal that is modeled by the error function.
Supplementary Materials
The following supporting information can be downloaded at: https://www.mdpi.com/article/10.3390/mca27010014/s1, File S1. Mathematica Code for Figure 2 Results.
Funding
This research received no external funding.
Acknowledgments
The support of Abdelhak M. Zoubir, SPG, Technische Universität Darmstadt, Darmstadt, Germany, who hosted a visit during which the research for, and writing of, this paper was completed, is gratefully acknowledged. An anonymous reviewer provided a comment, which, after consideration, led to the improved approximations detailed in Theorem 3.
Conflicts of Interest
The authors declare no conflict of interest.
Appendix A. Proof of Theorem 1
Consider . Successive differentiation of this function leads to the iterative formula
where
It then follows from Equation (20) that
The result for the case of then yields the nth-order approximation for the error function:
To determine consider the equality . Differentiation yields
and the required result:
Appendix B. Proof of Theorem 2
The use of a Taylor series expansion for in the definitions of and , as defined by Equations (40) and (41), yields:
From a consideration of and , as well as higher-order residual functions, it can be readily seen that the polynomial terms of order zero to 2n + 1 in have coefficients of zero. It then follows that can be written as
where
and where it can readily be shown that
Graphs of the magnitude of the residual functions, , for orders zero, two, four, six, and eight, are shown in Figure A1. The magnitude of the functions defined by , for the same orders, are shown in Figure A2 and it is evident that
for a fixed constant , which is of the order of unity. Hence:
Figure A1.
Graphs of for orders zero, two, four, six and eight.
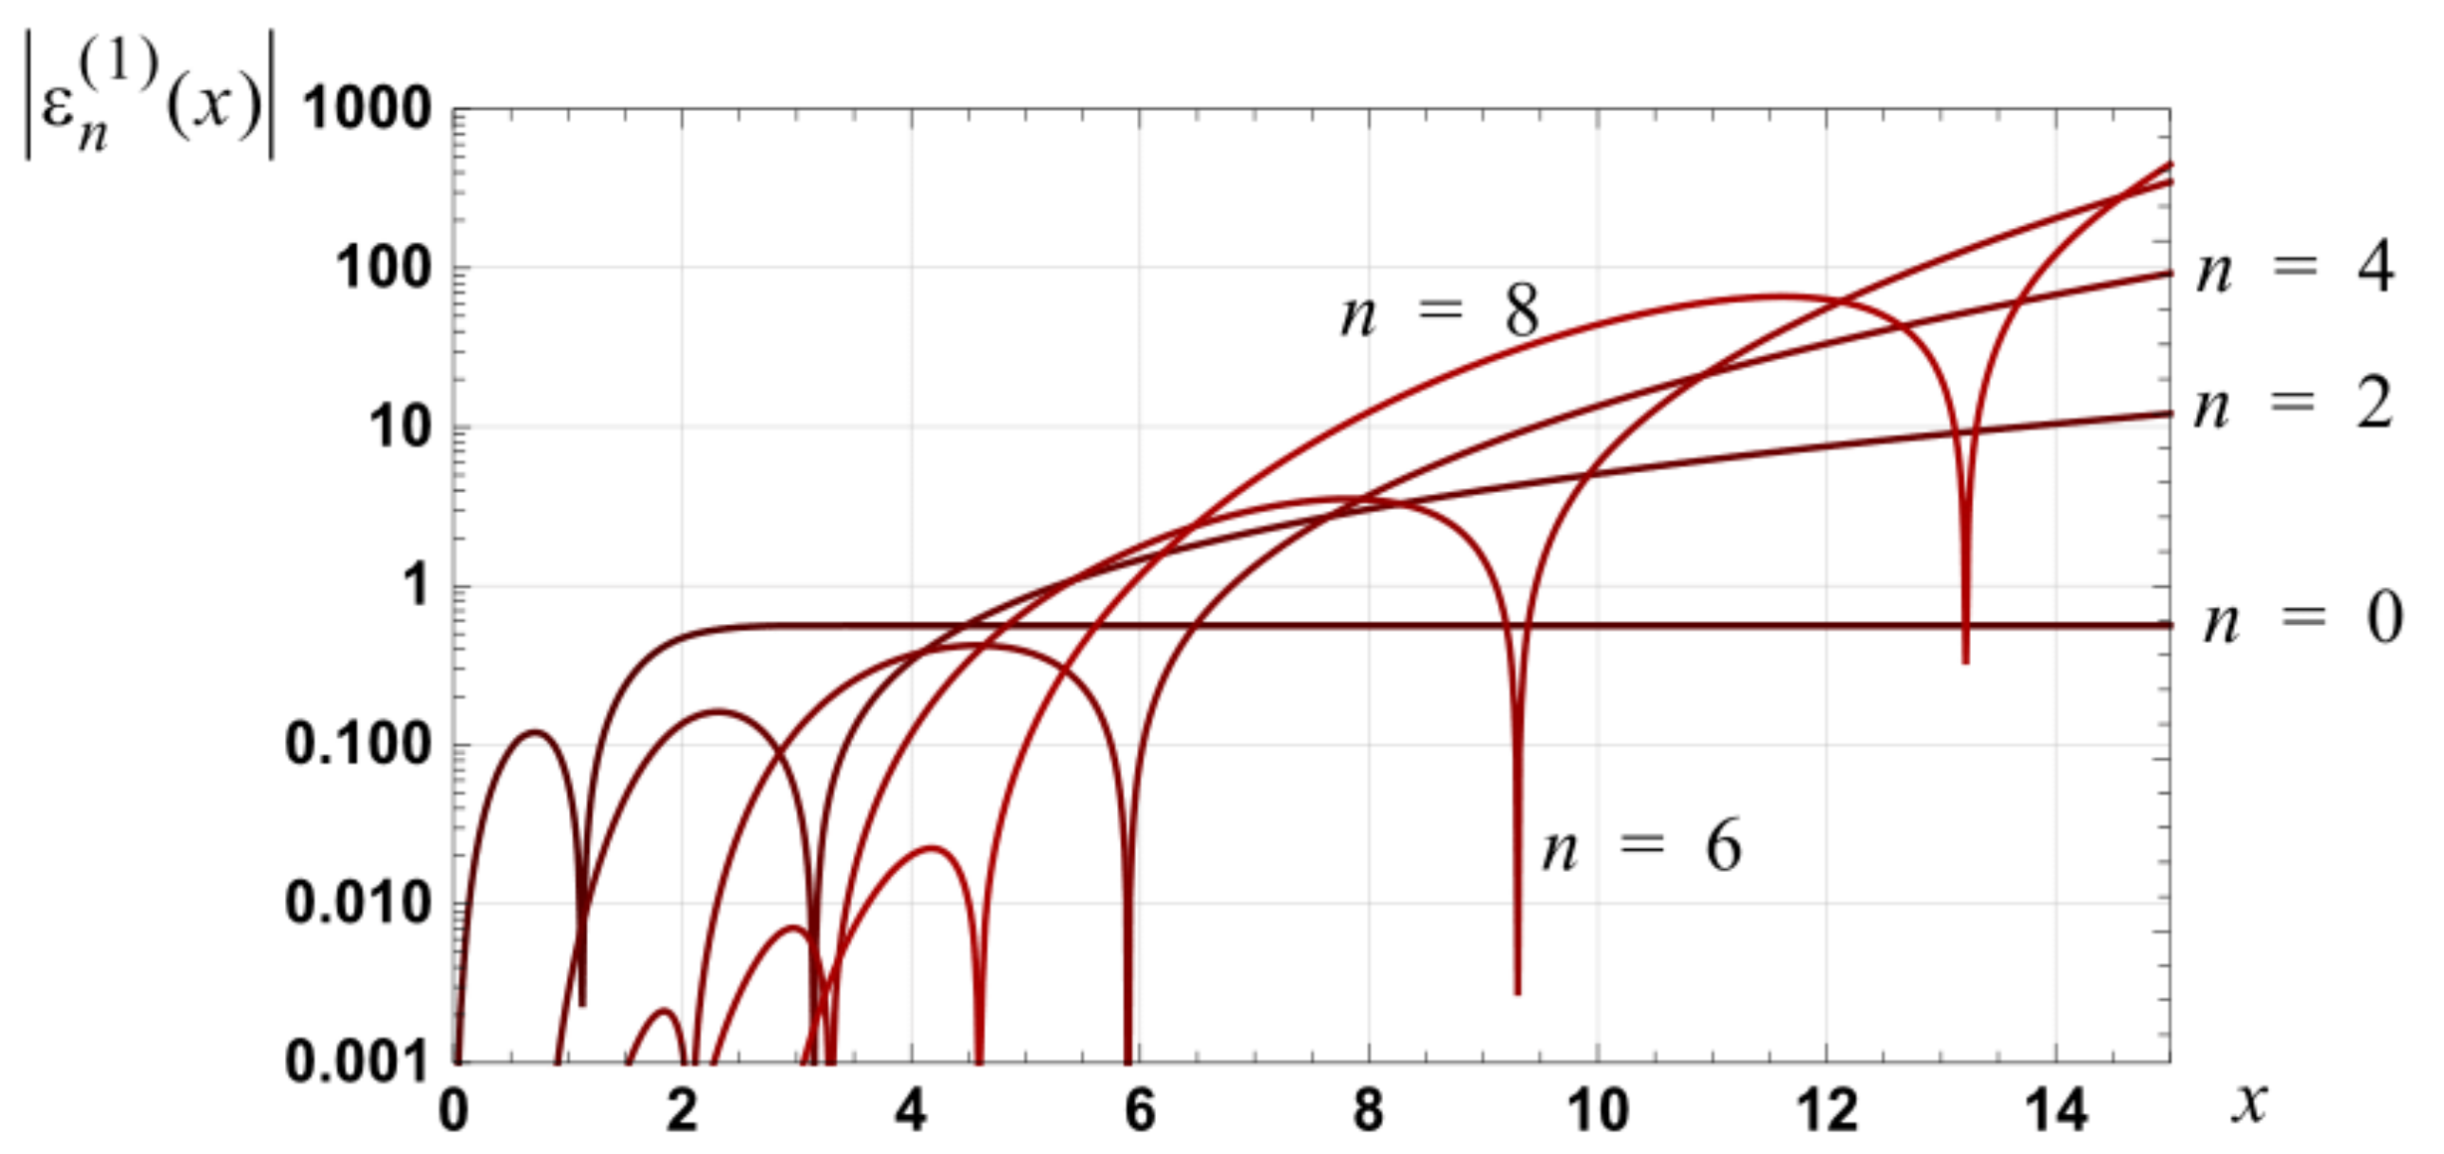
Figure A2.
Graphs of for orders zero, two, four, six and eight.

Further, as , it follows, for all fixed values of x, that
The convergence is not uniform.
It then follows, for all fixed values of x, that there exists an order of approximation, n, such that the error in the approximation can be made arbitrarily small, i.e., there exists a number such that
In general, increases with x. Thus, there exists a number such that
Finally, as , for all n, it then follows, for x fixed, that
which proves convergence.
Appendix C. Fourth-Order Spline Approximation—The Sixteen-Subintervals Case
Consistent with Theorem 5, a fourth-order spline approximation, which utilizes 16 subintervals, is
When this approximation is utilized with the transition point , the relative error bound in the approximation to the error function, over the interval , is 4.82 × 10⁻¹⁶.
Appendix D. Proof of Theorem 7
Consider the differential Equation
for the case where is based on the nth-order approximation to the error function, defined in Theorem 1, and is defined according to
To find a solution to the differential equation for such a driving signal, first note that the solution to the differential equation for the case of is
Second, with defined by Equation (A20), the following signal form
has potential as a basis for finding solutions for the unknown polynomial functions and and the unknown constant . With such a form, the initial condition of implies
It is the case that
Substitution of and into the differential equation yields
which implies
and
Thus:
To solve for the polynomials and , first note (see Equation (26)) that
for appropriately defined coefficients , .
Appendix D.1. Solving for Coefficients of First Polynomial
Substitution of from Equation (A29) into the differential equation defining yields
With for n odd, the maximum power for t on the right side of the differential equation is , n even, and for n odd. Thus, the form required for is
Substitution then yields
For the case of even, equating coefficients associated with set powers of , yields:
With the odd coefficients , , ..., being zero, it follows that the corresponding odd coefficients are also zero. For the even coefficients, the algorithm is:
where m = n. For the case of n being odd, the odd coefficients are again zero and the algorithm is the same as that specified in Equation (A34) with m = n − 1.
Appendix D.2. Solving for Coefficients of Second Polynomial
Substitution of from Equation (A29) into the differential equation defining yields:
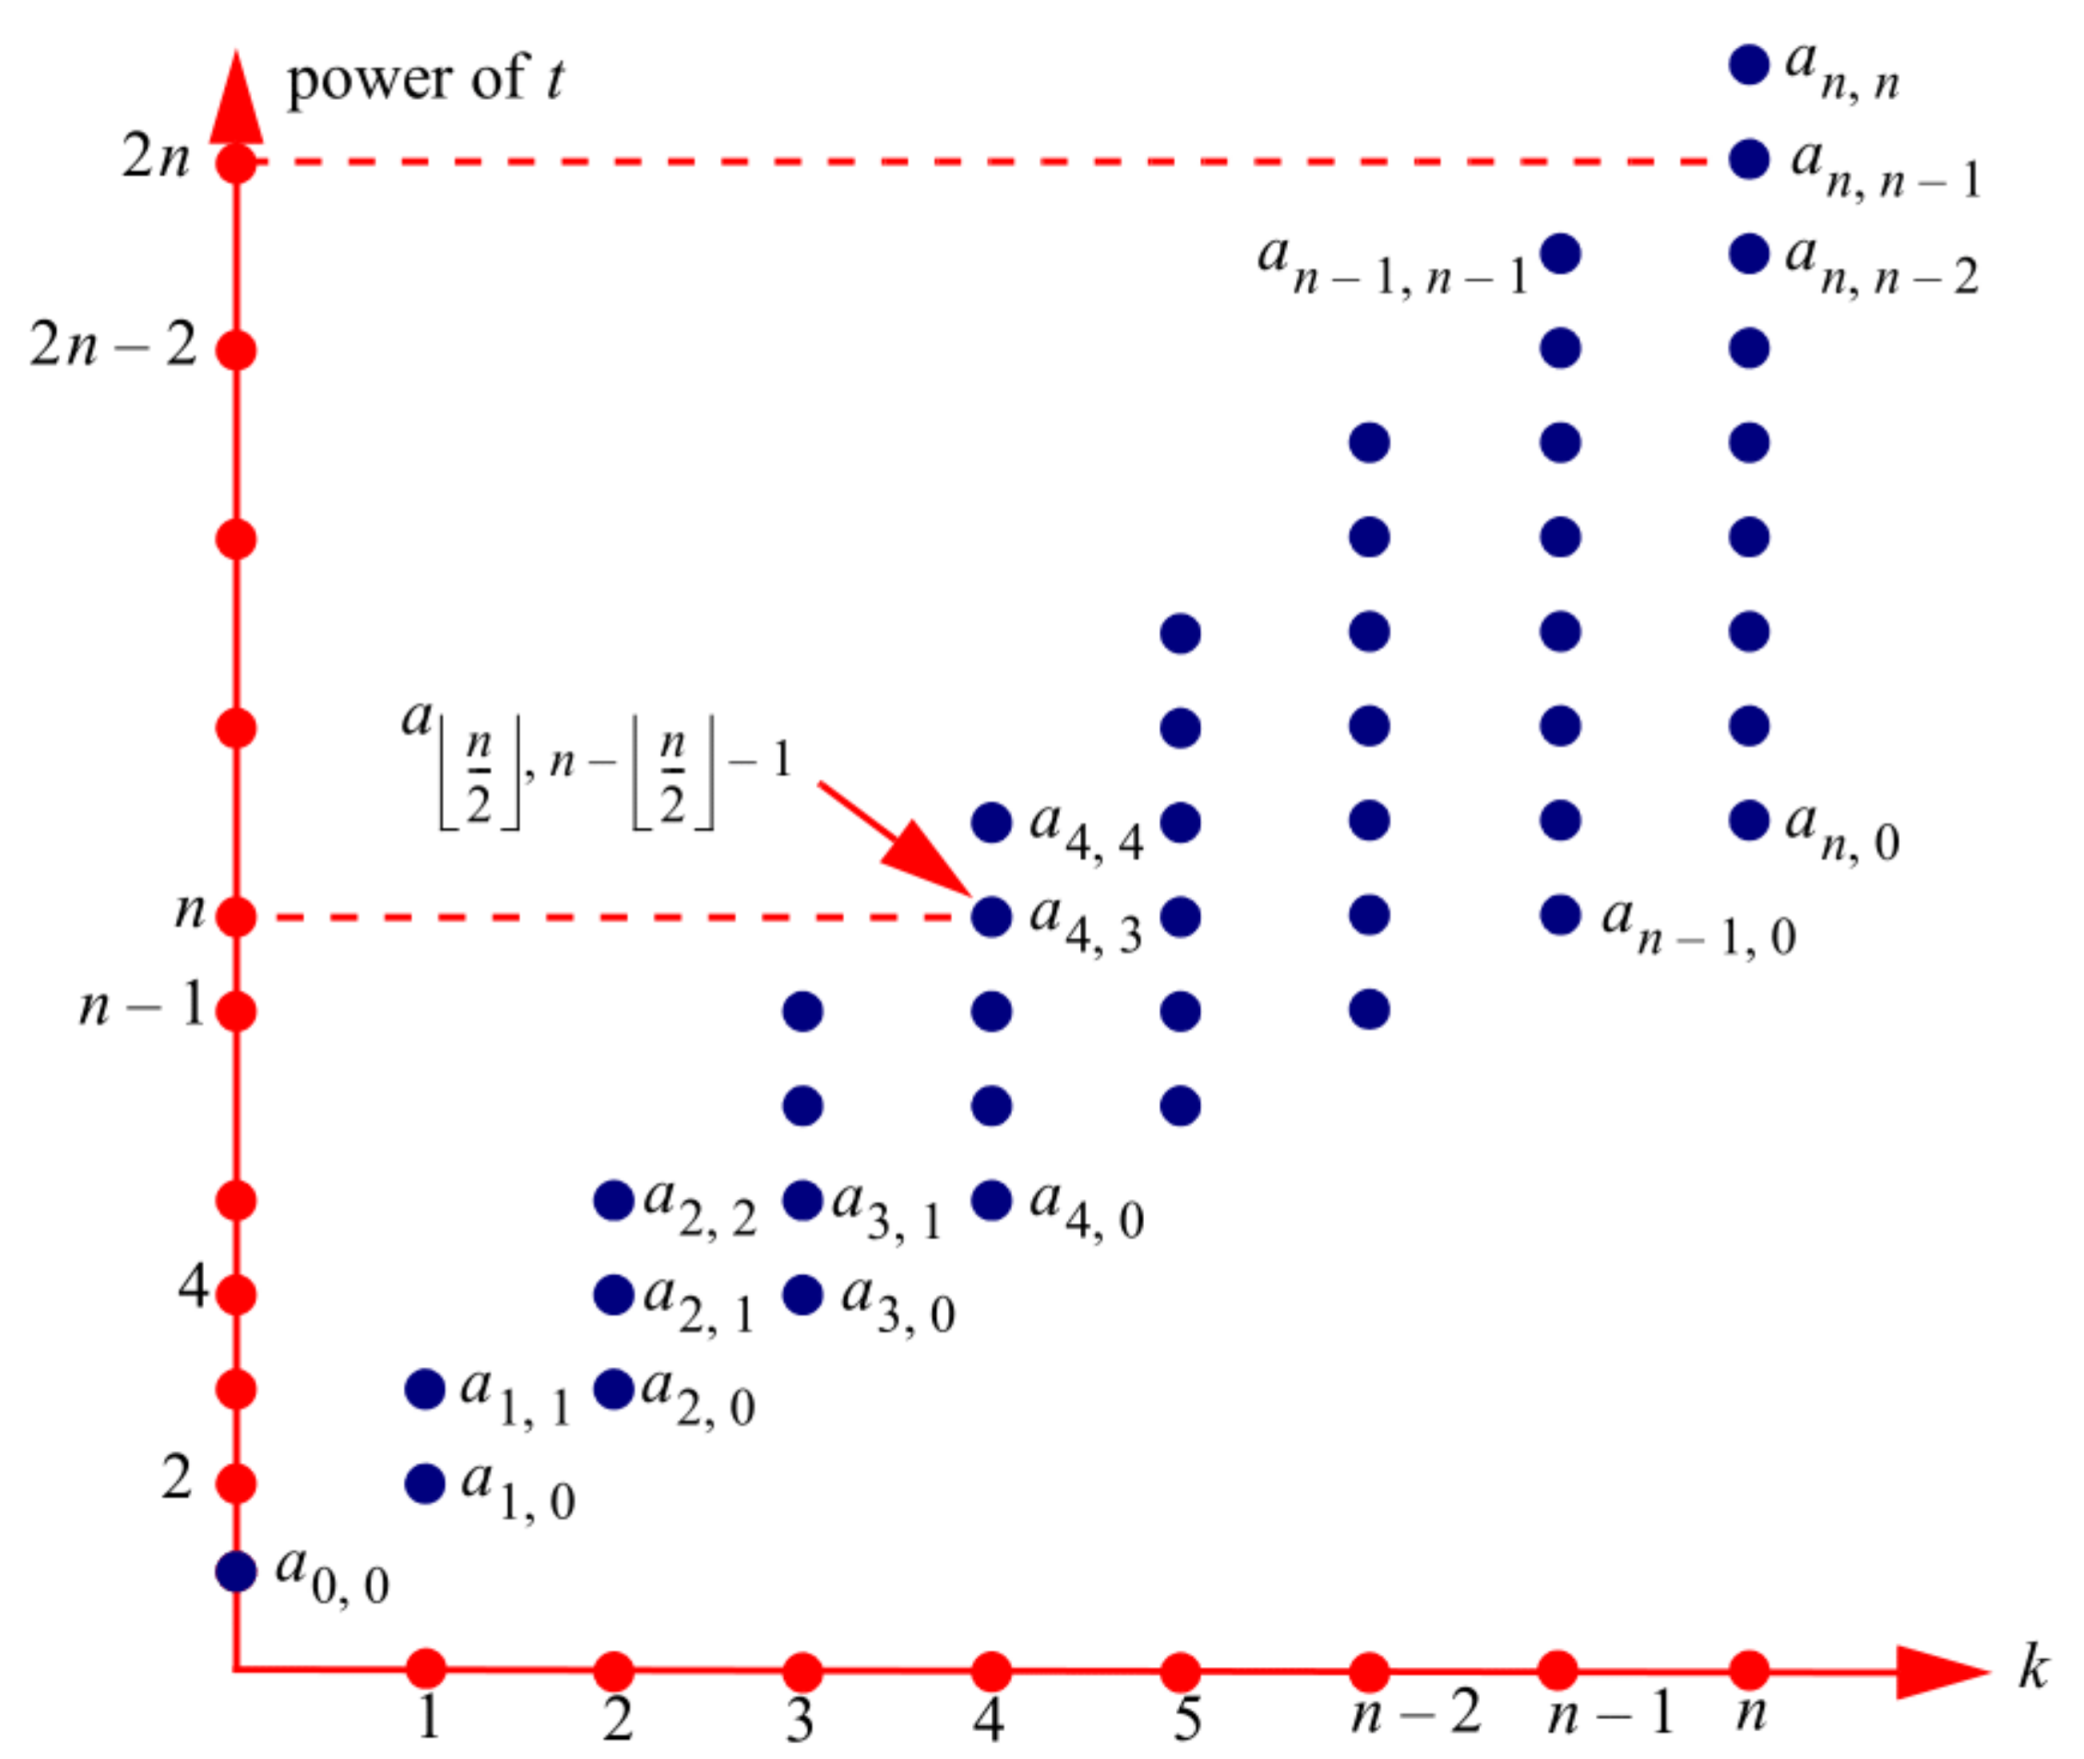
The coefficients that are associated with a given power of t are illustrated in Figure A3. It then follows, for a fixed power of t, say , that the associated coefficients, , are
Thus:
Figure A3.
Illustration of the coefficients that potentially are non-zero for a set power of t. The illustration is for the case of n = 8.
Figure A3.
Illustration of the coefficients that potentially are non-zero for a set power of t. The illustration is for the case of n = 8.
With
the differential equation implies
The requirement, thus, is for . Equating coefficients (see Figure A3) yields:
As the coefficients are zero, the algorithm is:
Appendix E. Proof of Theorem 8
Consider the results stated in Theorem 1:
Differentiation then yields
which leads to the required result:
Appendix F. Proof of Theorem 9
Consider the exact result
where is specified by Equation (32) and the derivative of the error term, , is specified by Equation (40). By utilizing a Taylor series approximation for , can be written as
Integration yields
and the following series for the error function then follows:
The series associated with first- and second-order approximations follow in an analogous manner.
Appendix G. Proof of Theorem 10
The filter output is given by the convolution integral:
Using the integral results, e.g., Equations (4.2.1) and (4.2.5) of [38]:
with , , , it then follows that
Simplifying, and using the fact that the error function is an odd function, yields the required result:
To prove convergence, consider
where and h is the impulse response of the second-order filter. The interchange of limit and integration is valid, consistent with Lemma 2, as the integrand comprises differentiable bounded functions.
References
- Lebedev, N.N. Special Functions and Their Applications; Dover Publications: Dover, DE, USA, 1971. [Google Scholar]
- Fujiwara, T. Wavelength response of harmonic distortion in AC-bias recording. IEEE Trans. Magn. 1980, 16, 501–506. [Google Scholar] [CrossRef]
- Lee, J.; Woodring, D. Considerations of Nonlinear Effects in Phase-Modulation Systems. IEEE Trans. Commun. 1972, 20, 1063–1073. [Google Scholar] [CrossRef]
- Klein, S.A. Measuring, estimating, and understanding the psychometric function: A commentary. Percept. Psychophys. 2001, 63, 1421–1455. [Google Scholar] [CrossRef] [PubMed]
- Rinderknecht, M.D.; Lambercy, O.; Gassert, R. Performance metrics for an application-driven selection and optimization of psychophysical sampling procedures. PLoS ONE 2018, 13, e0207217. [Google Scholar] [CrossRef]
- Shi, Q. OFDM in bandpass nonlinearity. IEEE Trans. Consum. Electron. 1996, 42, 253–258. [Google Scholar] [CrossRef]
- Taggart, D.; Kumar, R.; Raghavan, S.; Goo, G.; Chen, J.; Krikorian, Y. Communication system performance—Detailed modeling of a power amplifier with two modulated input signals. In Proceedings of the 2005 IEEE Aerospace Conference, Bozeman, MT, USA, 4 December 2005; pp. 1398–1409. [Google Scholar] [CrossRef]
- Li, W. Damage Models for Soft Tissues: A Survey. J. Med. Biol. Eng. 2016, 36, 285–307. [Google Scholar] [CrossRef]
- Ogden, R.W.; Roxburgh, D.G. A pseudo-elastic model for the Mullins effect in filled rubber. Proc. R. Soc. Lond. Ser. A Math. Phys. Eng. Sci. 1999, 455, 2861–2877. [Google Scholar] [CrossRef]
- Temme, N.M. Error Functions, Dawson’s and Fresnel Integrals. In NIST Handbook of Mathematical Functions; Olver, F.W., Lozier, D.W., Boisvert, R.F., Clark, C.W., Eds.; National Institute of Standards and Technology and Cambridge University Press: Cambridge, MA, USA, 2010. [Google Scholar]
- Schrerier, F. The Voigt and complex error function: A comparison of computational methods. J. Quant. Spectrosc. Radiat. Transf. 1992, 48, 743–762. [Google Scholar] [CrossRef]
- Marsaglia, G. Evaluating the Normal Distribution. J. Stat. Softw. 2004, 11, 1–11. [Google Scholar] [CrossRef]
- Sandoval-Hernandez, M.A.; Vazquez-Leal, H.; Filobello-Nino, U.; Hernandez-Martinez, L. New handy and accurate approximation for the Gaussian integrals with applications to science and engineering. Open Math. 2019, 17, 1774–1793. [Google Scholar] [CrossRef]
- Menzel, R. Approximate closed form solution to the error function. Am. J. Phys. 1975, 43, 366–367, Erratum in Am. J. Phys. 1975, 43, 923–923 . [Google Scholar] [CrossRef]
- Matíc, I.; Radoičić, R.; Stefanica, D. A sharp Pólya-based approximation to the normal CDF. Appl. Math. Comput. 2018, 322, 111–122. [Google Scholar] [CrossRef]
- Chevillard, S. The functions erf and erfc computed with arbitrary precision and explicit error bounds. Inf. Comput. 2012, 216, 72–95. [Google Scholar] [CrossRef]
- De Schrijver, S.K.; Aghezzaf, E.-H.; Vanmaele, H. Double precision rational approximation algorithms for the standard normal first and second order loss functions. Appl. Math. Comput. 2012, 219, 2320–2330. [Google Scholar] [CrossRef]
- Cody, W.J. Rational Chebyshev approximations for the error function. Math. Comput. 1969, 23, 631–637. [Google Scholar] [CrossRef]
- Howard, R.M. Dual Taylor Series, Spline Based Function and Integral Approximation and Applications. Math. Comput. Appl. 2019, 24, 35. [Google Scholar] [CrossRef]
- Howard, R.M. Arbitrarily Accurate Spline Based Approximations for the Hyperbolic Tangent Function and Applications. Int. J. Appl. Comput. Math. 2021, 7, 1–59. [Google Scholar] [CrossRef]
- Abramowitz, M.; Stegun, I.A. Handbook of Mathematical Functions with Formulas, Graphs and Mathematical Tables; US Department of Commerce: Dover, DE, USA, 1964.
- Nandagopal, M.; Sen, S.; Rawat, A. A Note on the Error Function. Comput. Sci. Eng. 2010, 12, 84–88. [Google Scholar] [CrossRef]
- Schöpf, H.M.; Supancic, P.H. On Bürmann’s theorem and its application to problems of linear and nonlinear heat transfer and diffusion: Expanding a function in powers of its derivative. Math. J. 2014, 16, 1–44. [Google Scholar]
- Winitzki, S. A Handy Approximation for the Error Function and Its Inverse. 2008. Available online: https://scholar.google.com/citations?user=Q9U40gUAAAAJ&hl=en&oi=sra (accessed on 10 November 2020).
- Soranzo, A.; Epure, E. Simply explicitly invertible approximations to 4 decimals of error function and normal cumulative distribution function. arXiv 2012, arXiv:1201.1320v1. [Google Scholar]
- Vedder, J.D. Simple approximations for the error function and its inverse. Am. J. Phys. 1987, 55, 762–763. [Google Scholar] [CrossRef]
- Vazquez-Leal, H.; Castaneda-Sheissa, R.; Filobello-Nino, U.; Sarmiento-Reyes, A.; Orea, J.S. High Accurate Simple Approximation of Normal Distribution Integral. Math. Probl. Eng. 2012, 2012, 1–22. [Google Scholar] [CrossRef]
- Abrarov, S.M.; Quine, B.M. A rapid and highly accurate approximation for the error function of complex argument. arXiv 2013, arXiv:1308.3399. [Google Scholar]
- Champeney, D.C. A Handbook of Fourier Theorems; Cambridge University Press: Cambridge, UK, 1987. [Google Scholar]
- Chiani, M.; Dardari, D. Improved exponential bounds and approximation for the Q-function with application to average error probability computation. In Proceedings of the Global Telecommunications Conference, GLOBECOM’02, IEEE, Taipei, Taiwan, 17–21 November 2002; Volume 2, pp. 1399–1402. [Google Scholar] [CrossRef]
- Alzer, H. Error function inequalities. Adv. Comput. Math. 2010, 33, 349–379. [Google Scholar] [CrossRef]
- Chu, J.T. On Bounds for the Normal Integral. Biometrika 1955, 42, 263. [Google Scholar] [CrossRef]
- Neuman, E. Inequalities and Bounds for the Incomplete Gamma Function. Results Math. 2013, 63, 1209–1214. [Google Scholar] [CrossRef]
- Yang, Z.-H.; Chu, Y.-M. On approximating the error function. J. Inequalities Appl. 2016, 2016, 311. [Google Scholar] [CrossRef]
- Yang, Z.-H.; Qian, W.-M.; Chu, Y.; Zhang, E. On approximating the error function. Math. Inequalities Appl. 2018, 21, 469–479. [Google Scholar] [CrossRef]
- Abuelma’atti, M.T. A note on the harmonic distortion in AC-bias recording. IEEE Trans. Magn. 1988, 24, 3259–3260. [Google Scholar] [CrossRef]
- Salzer, H.E. Formulas for calculating the Error function of a complex variable. Math. Tables Other Aids Comput. 1951, 5, 67–70. [Google Scholar] [CrossRef]
- Ng, E.W.; Geller, M. A table of integrals of the error functions. J. Res. Nat. Bur. Stand. B Math. Sci. 1969, 73B, 1–20. [Google Scholar] [CrossRef]
Figure 1.
Graph of the magnitude of the relative error in the approximations, detailed in Table 1, for erf(x).
Figure 1.
Graph of the magnitude of the relative error in the approximations, detailed in Table 1, for erf(x).
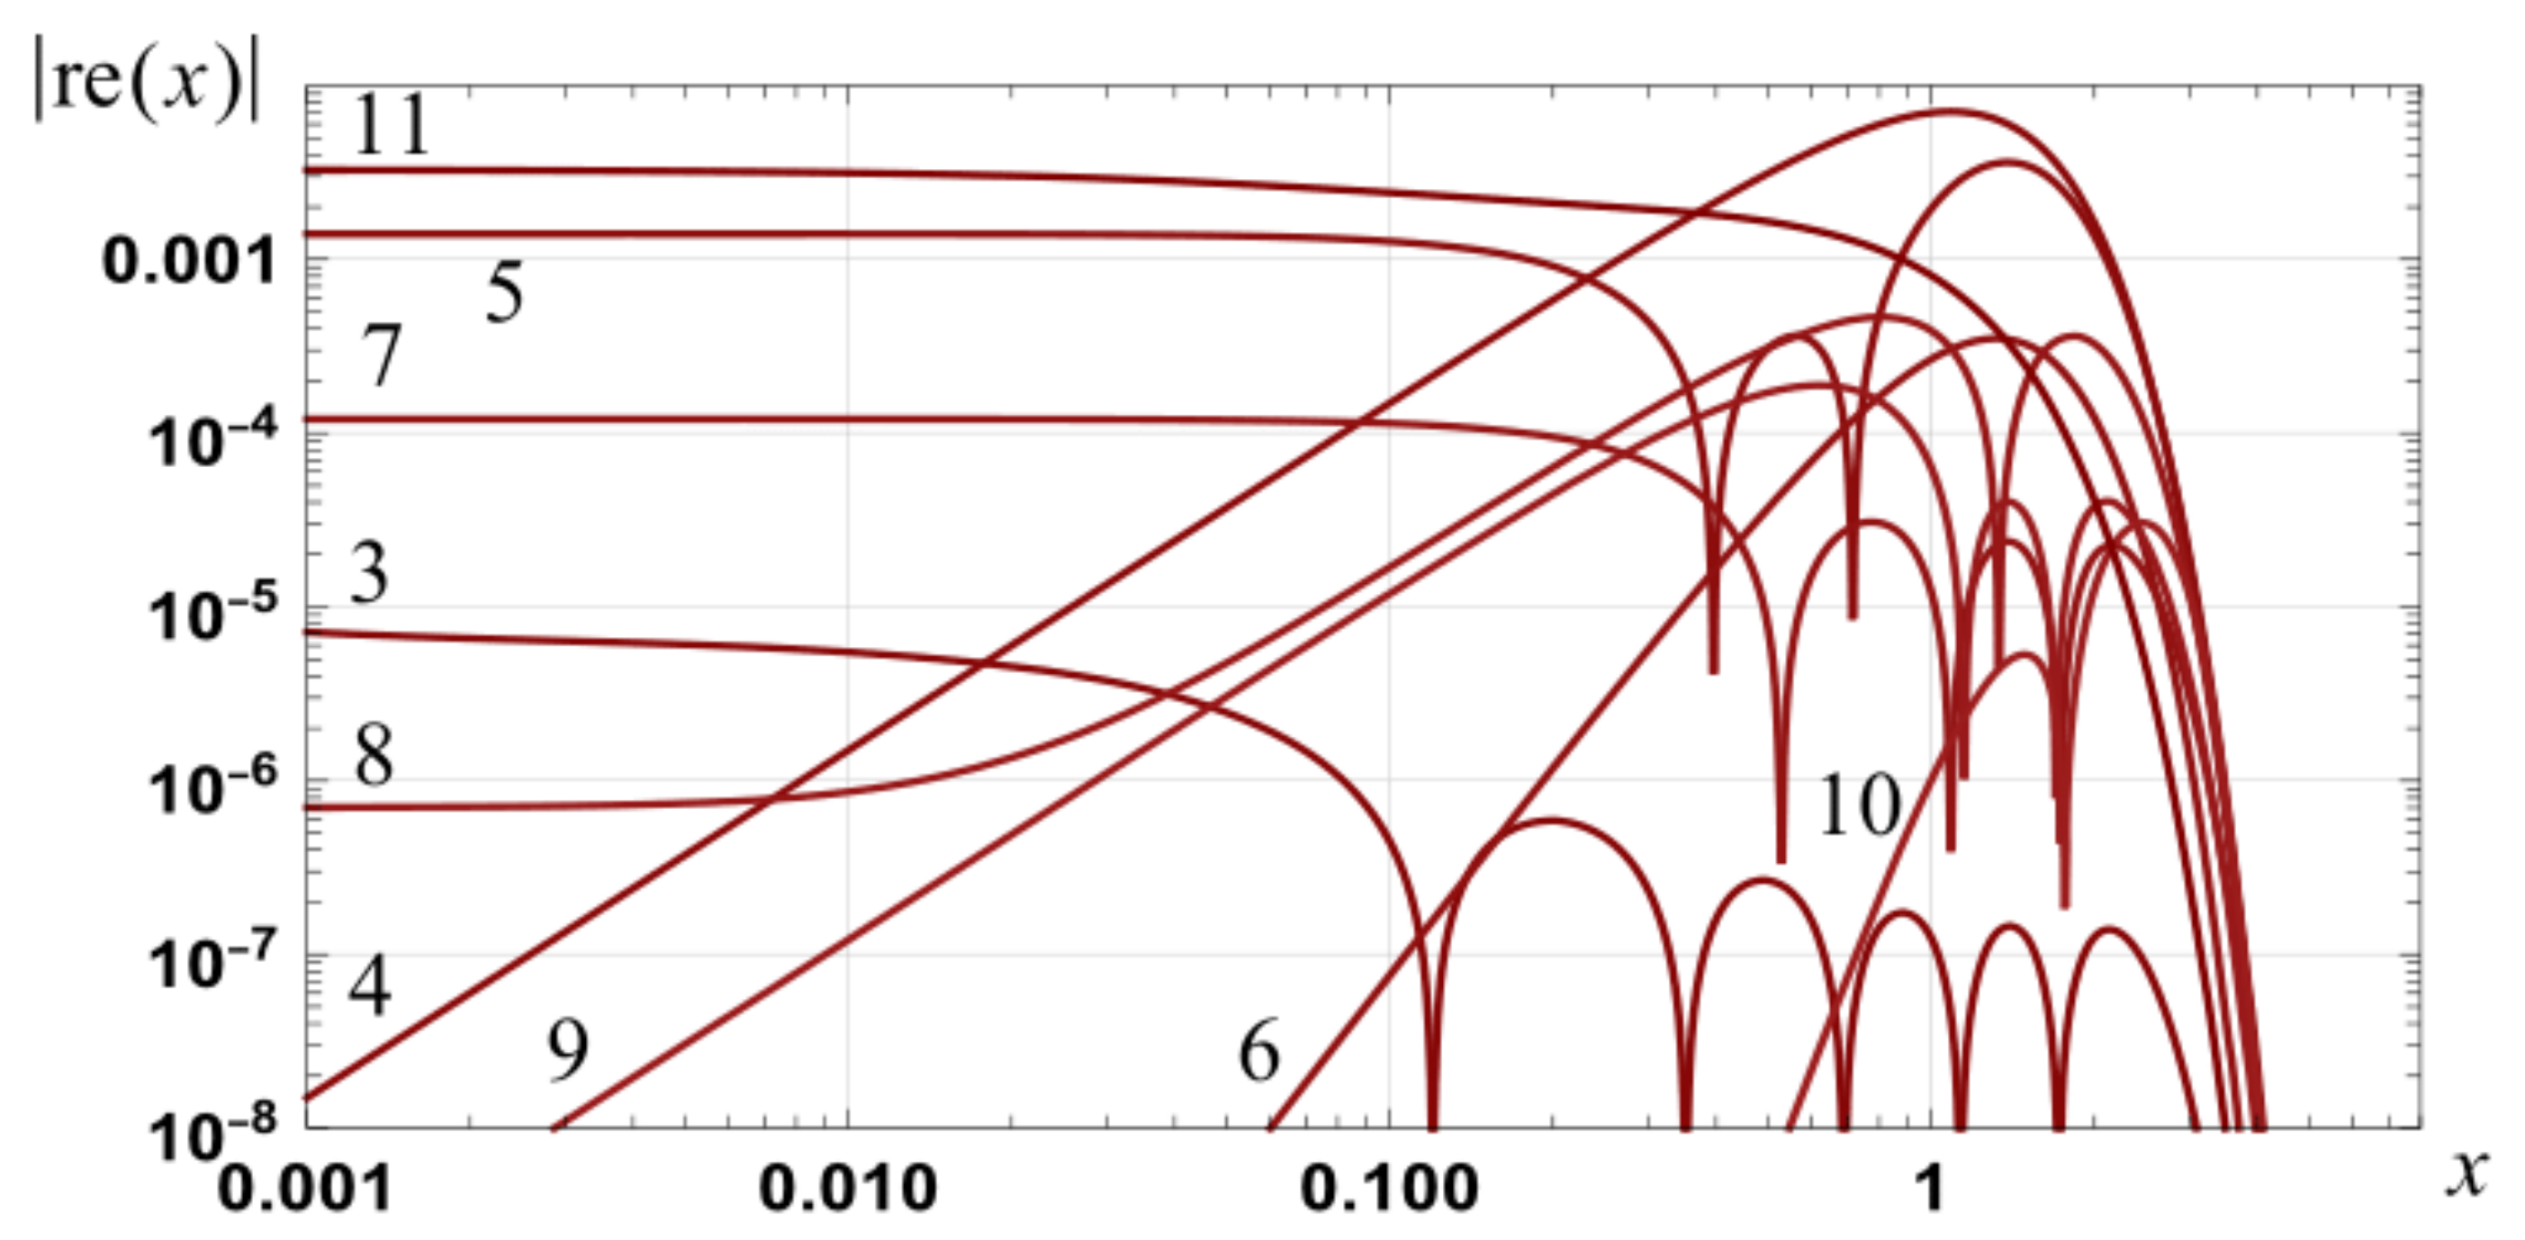
Figure 2.
Graph of the magnitude of the relative errors in approximations to erf(x): zero to tenth order integral spline based series and first, third, ..., fifteenth order Taylor series (dotted).
Figure 2.
Graph of the magnitude of the relative errors in approximations to erf(x): zero to tenth order integral spline based series and first, third, ..., fifteenth order Taylor series (dotted).
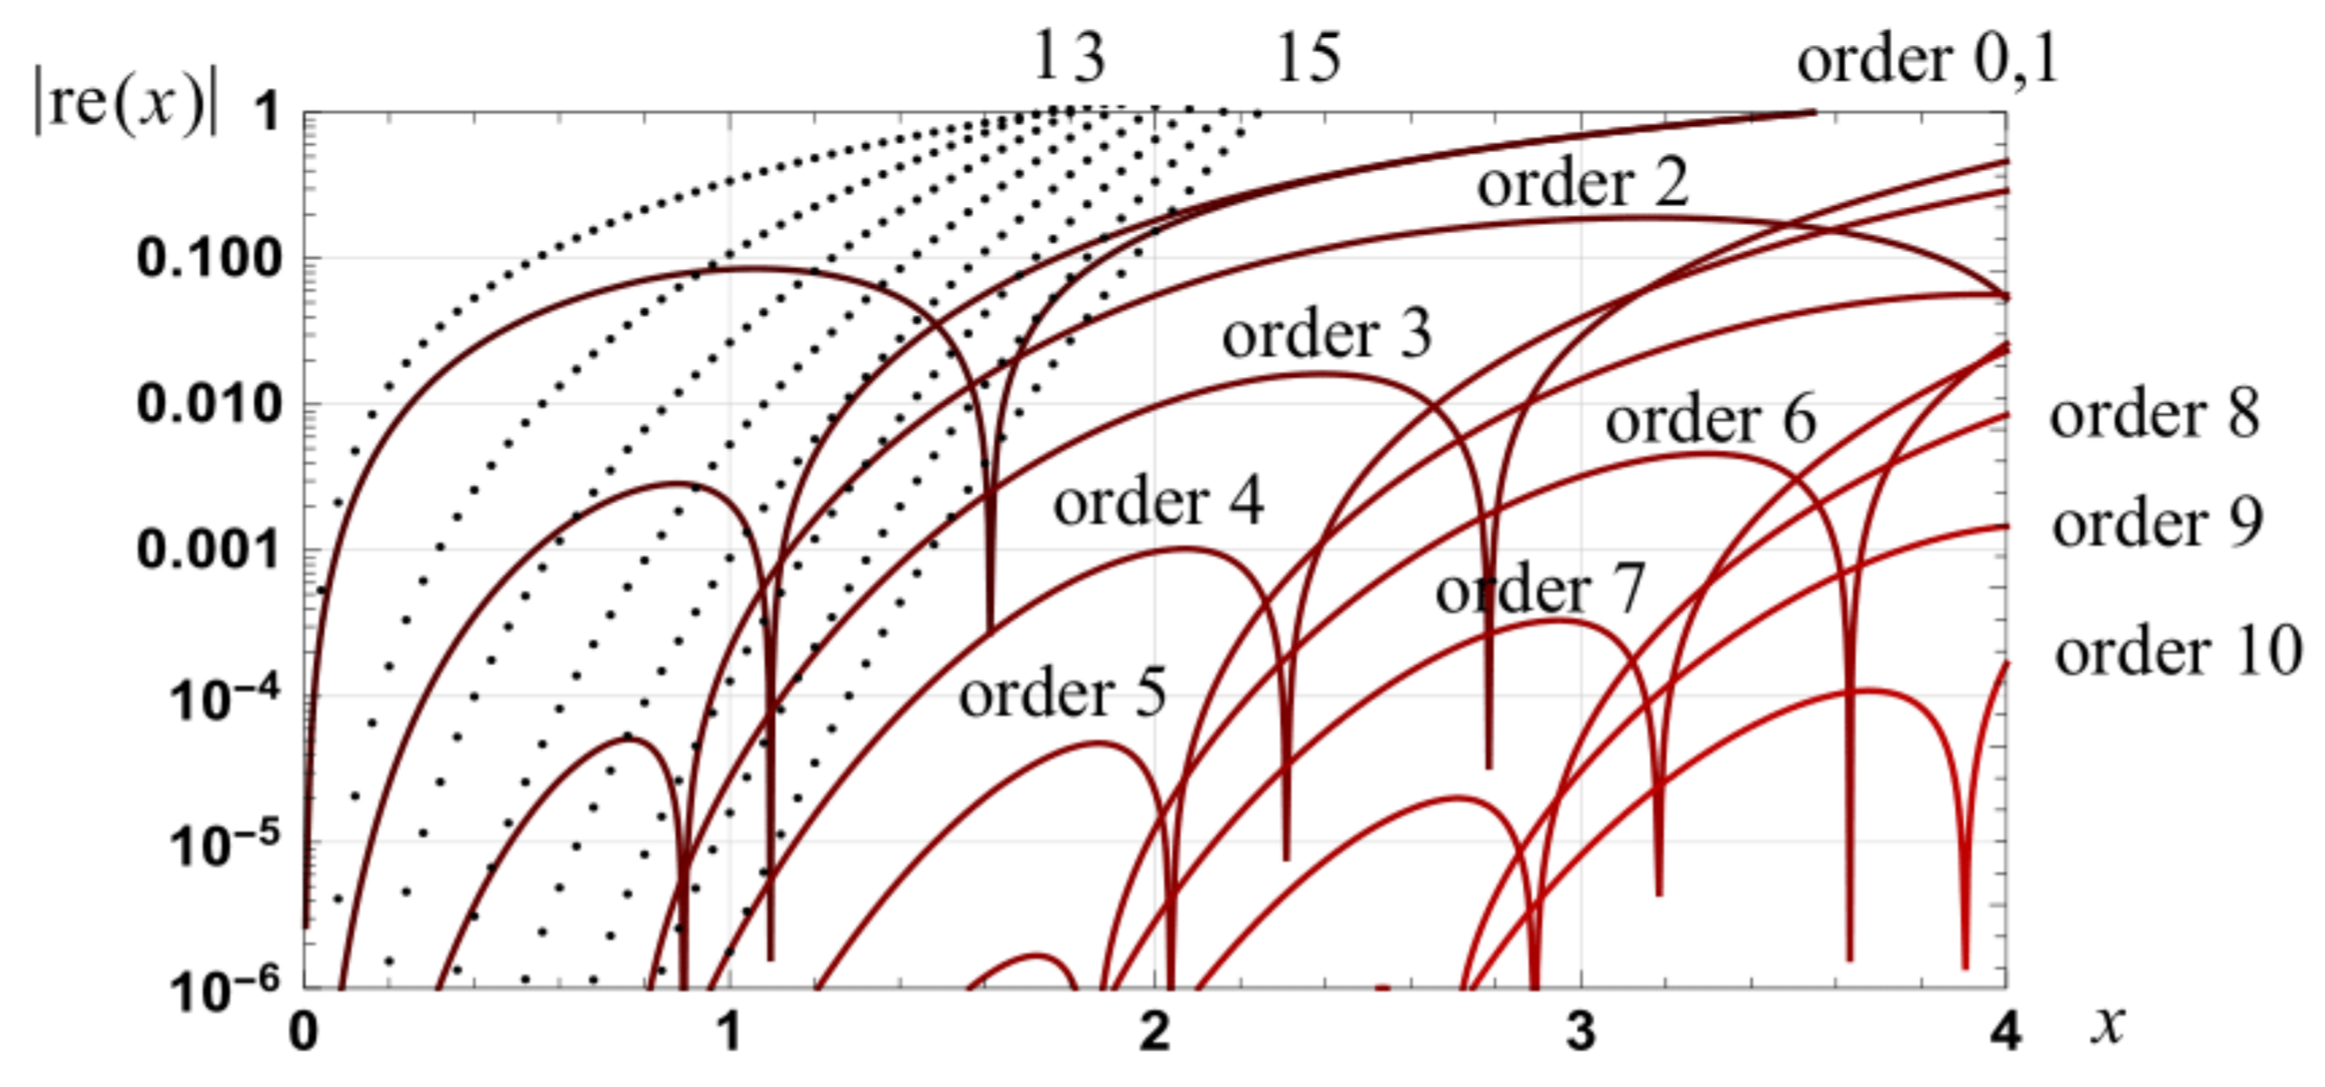
Figure 3.
Graph of the magnitude of the relative errors associated with the approximation and along with the relative error in spline approximations of orders 16, 20, 24, 28 and 32.
Figure 3.
Graph of the magnitude of the relative errors associated with the approximation and along with the relative error in spline approximations of orders 16, 20, 24, 28 and 32.
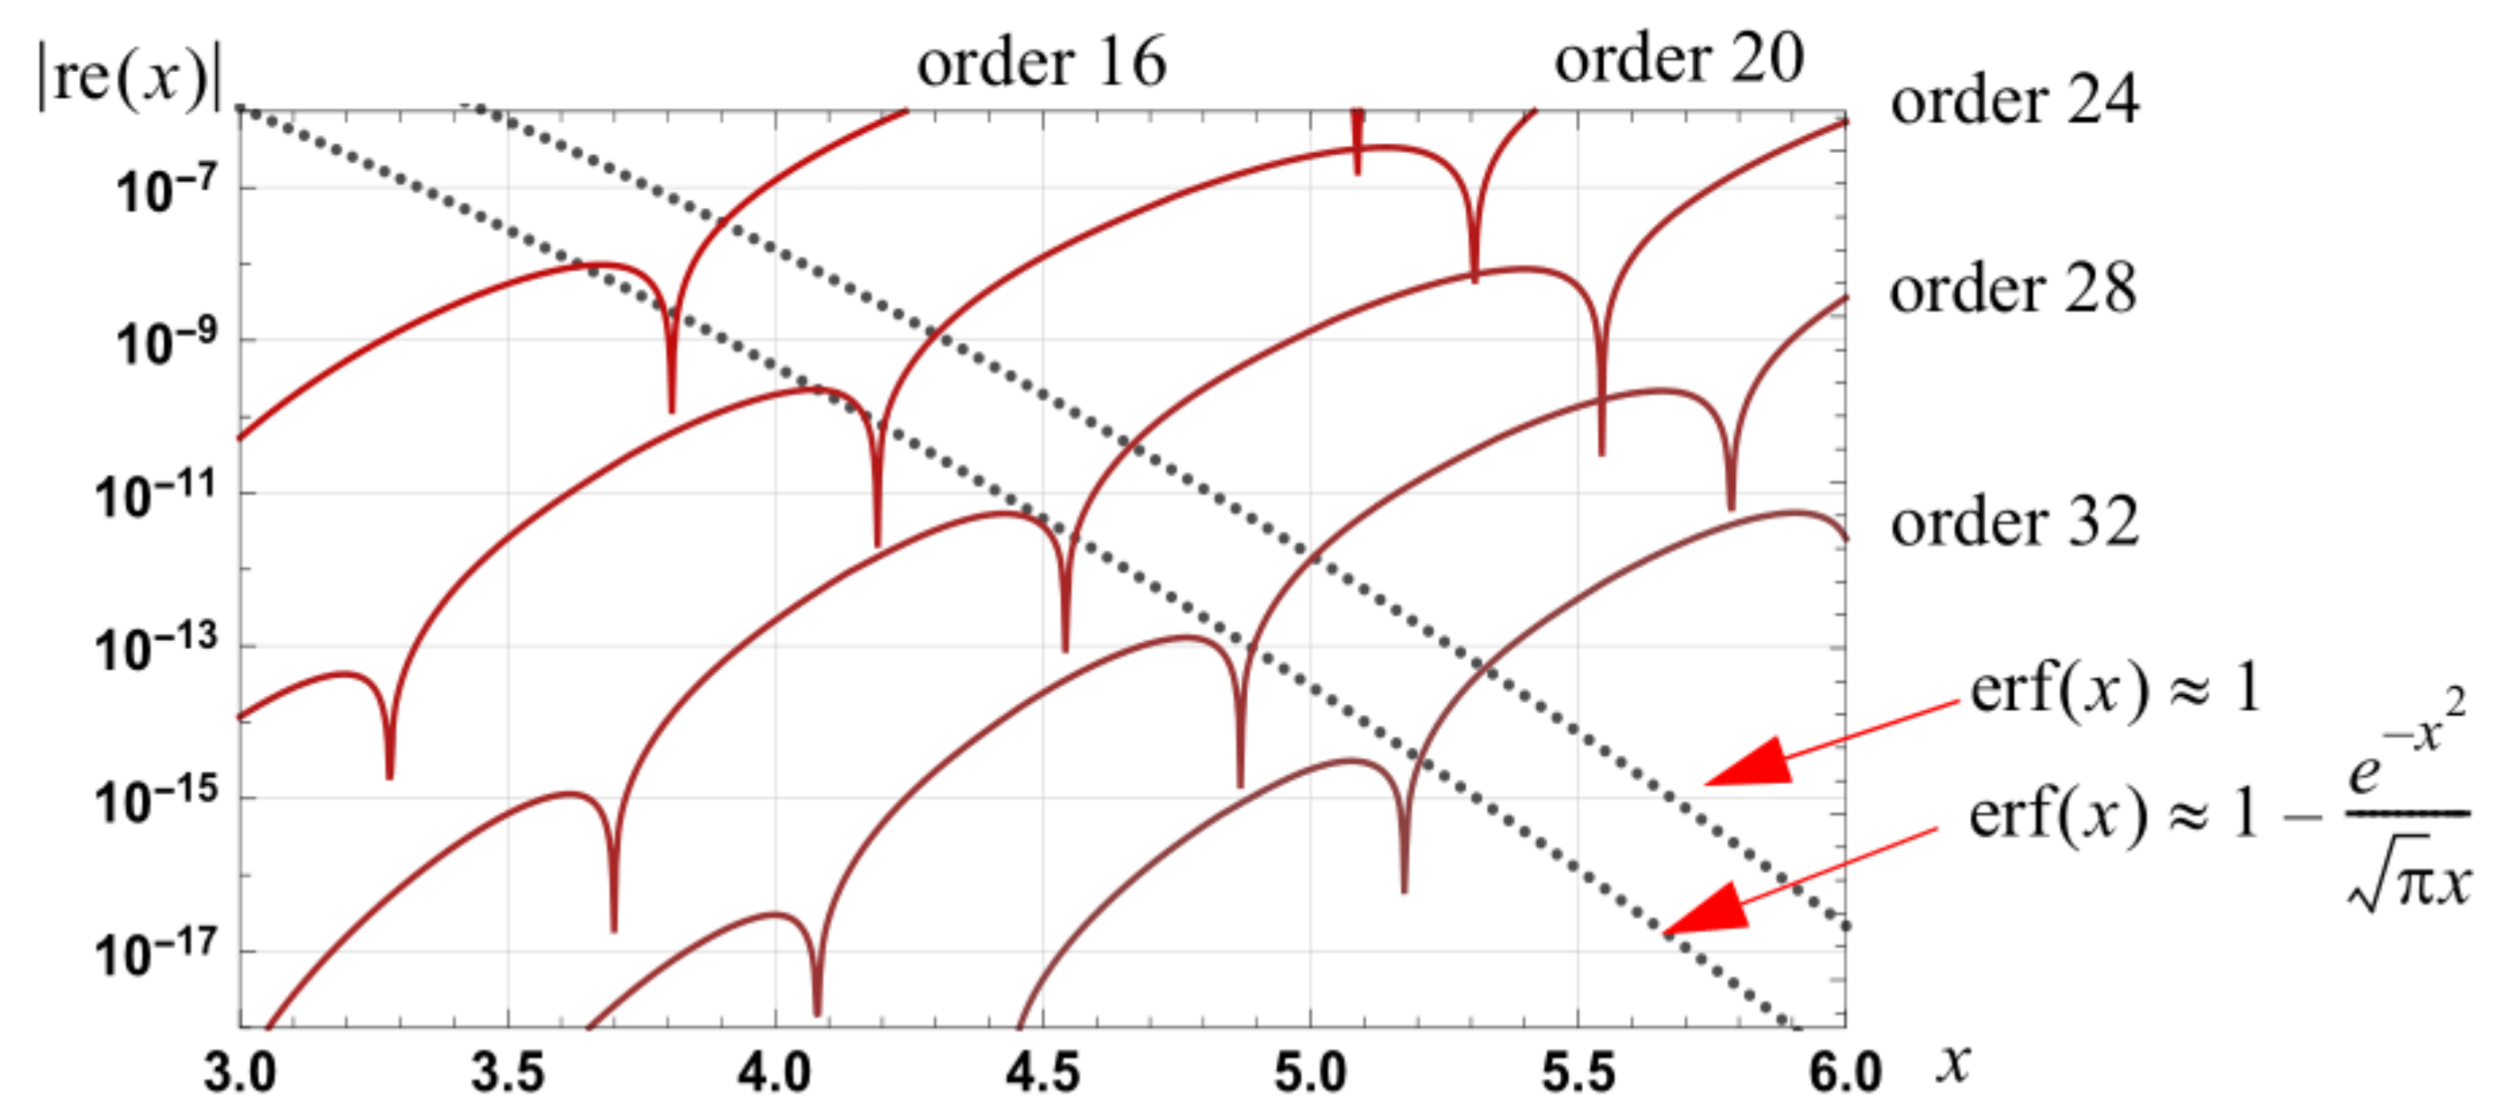
Figure 4.
Graph of the magnitude of the relative errors in the approximations to erf(x), of even orders, as specified by Equation (46). The dotted results are for the fourth order approximation specified by Theorem 1 (Equation (36)).
Figure 4.
Graph of the magnitude of the relative errors in the approximations to erf(x), of even orders, as specified by Equation (46). The dotted results are for the fourth order approximation specified by Theorem 1 (Equation (36)).

Figure 5.
Illustration of the crossover point where the magnitude of the relative error in the approximation equals the magnitude of the relative error in a set order spline approximation.
Figure 5.
Illustration of the crossover point where the magnitude of the relative error in the approximation equals the magnitude of the relative error in a set order spline approximation.

Figure 6.
Graph of the relationship between the optimum transition point , as defined by Equation (57) for the case of and the order of the spline approximation.
Figure 6.
Graph of the relationship between the optimum transition point , as defined by Equation (57) for the case of and the order of the spline approximation.
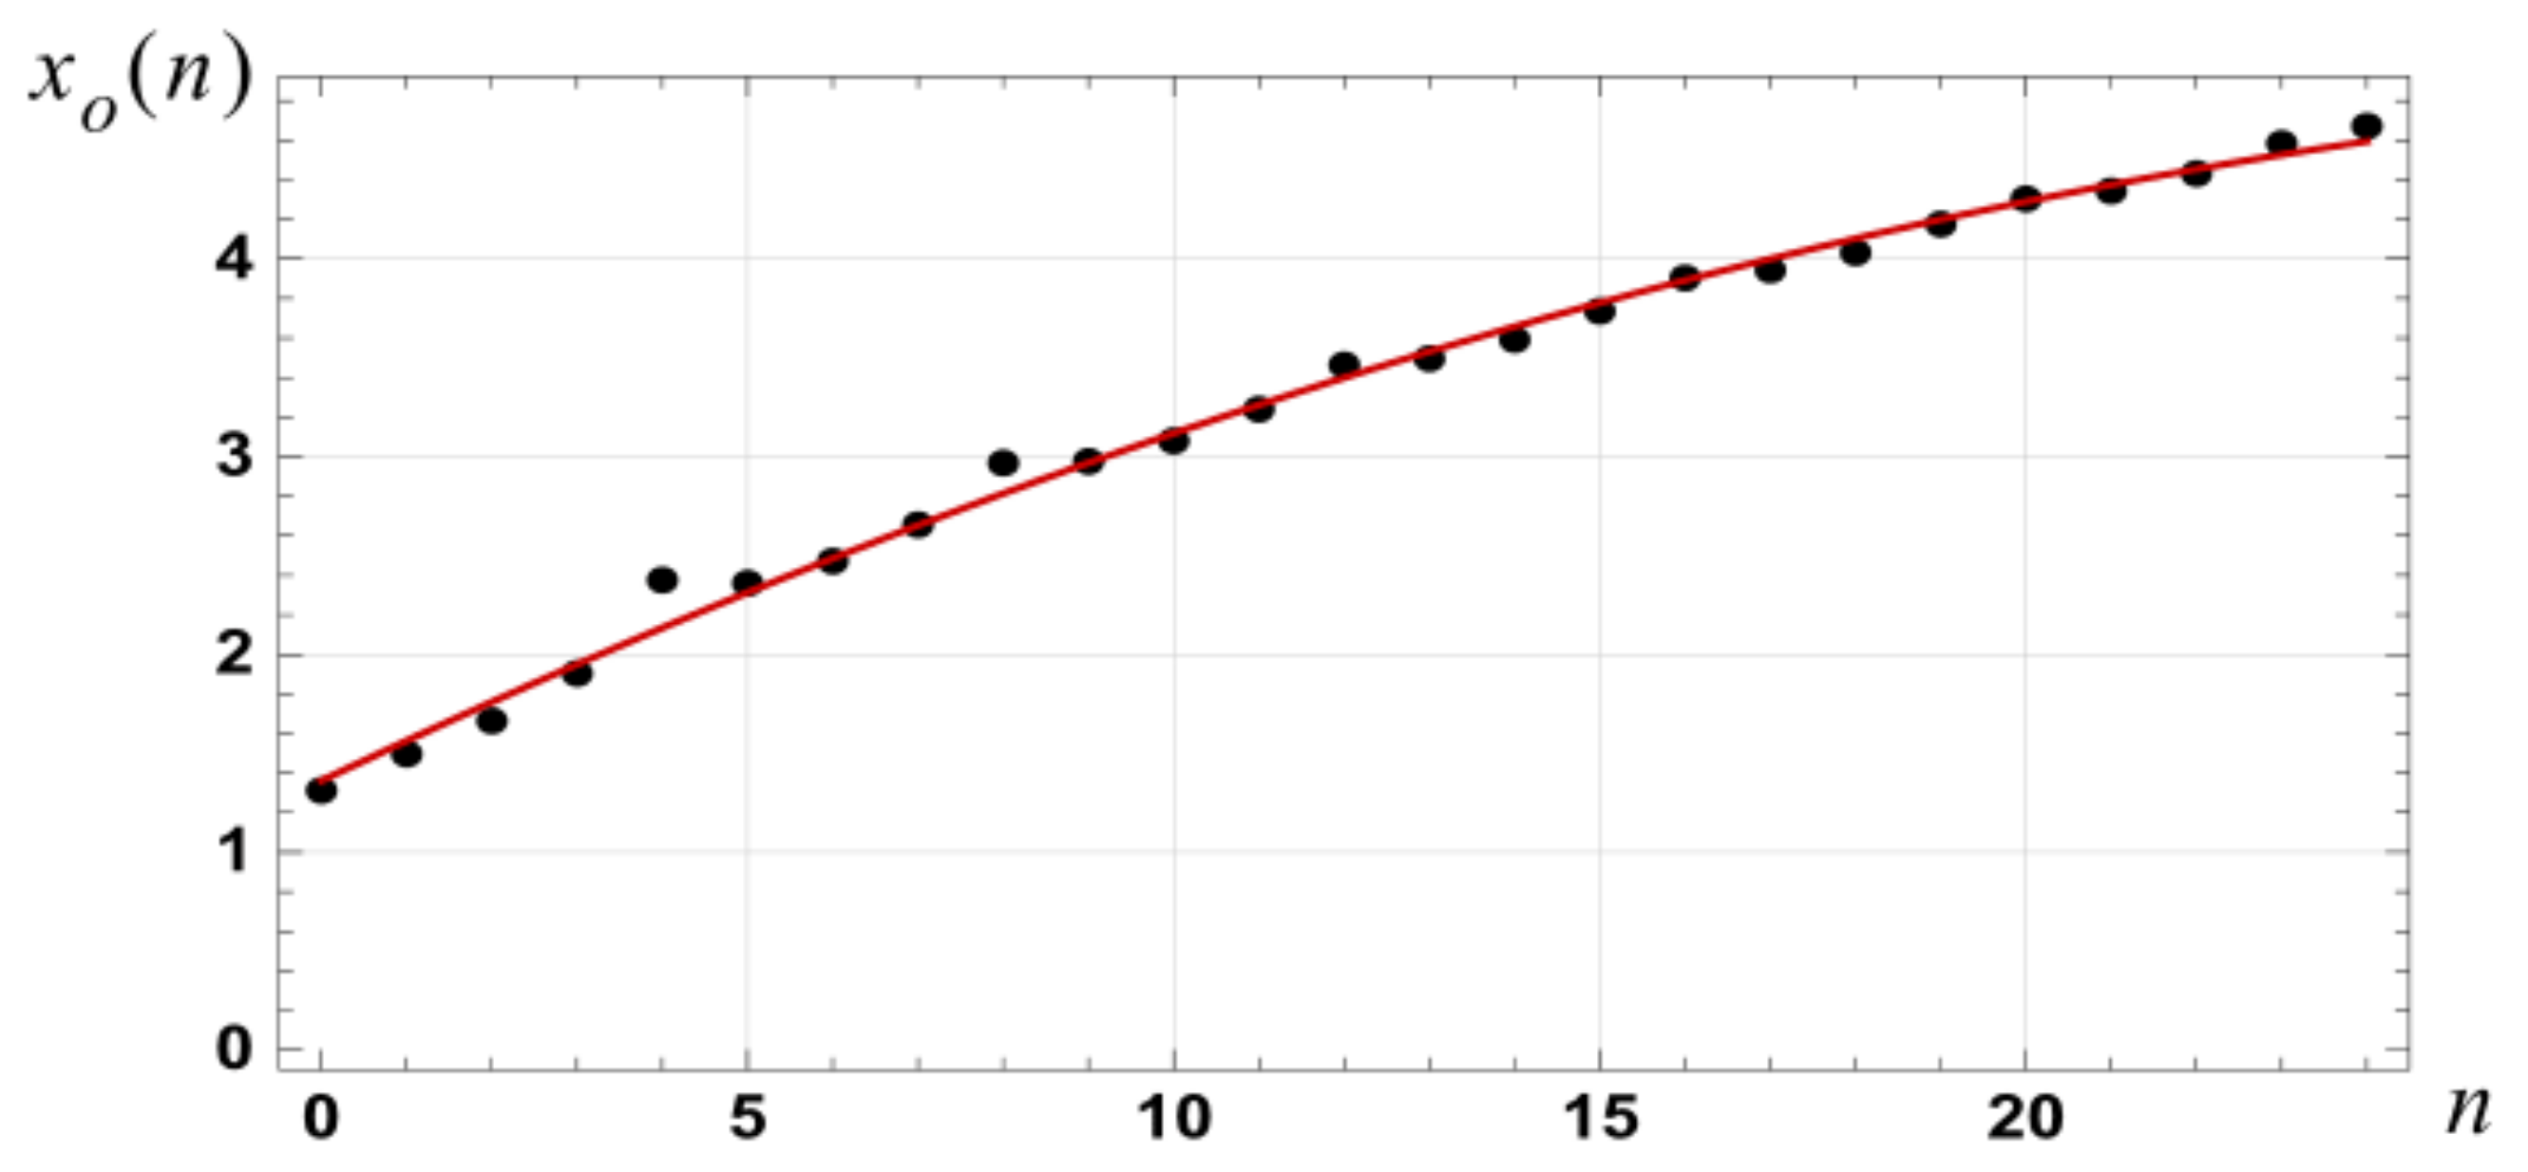
Figure 7.
Graph of the relative errors in the approximations, , to erf(x), of orders 2, 4, 6, …, 20, based on utilizing the approximation in an optimum manner.
Figure 7.
Graph of the relative errors in the approximations, , to erf(x), of orders 2, 4, 6, …, 20, based on utilizing the approximation in an optimum manner.
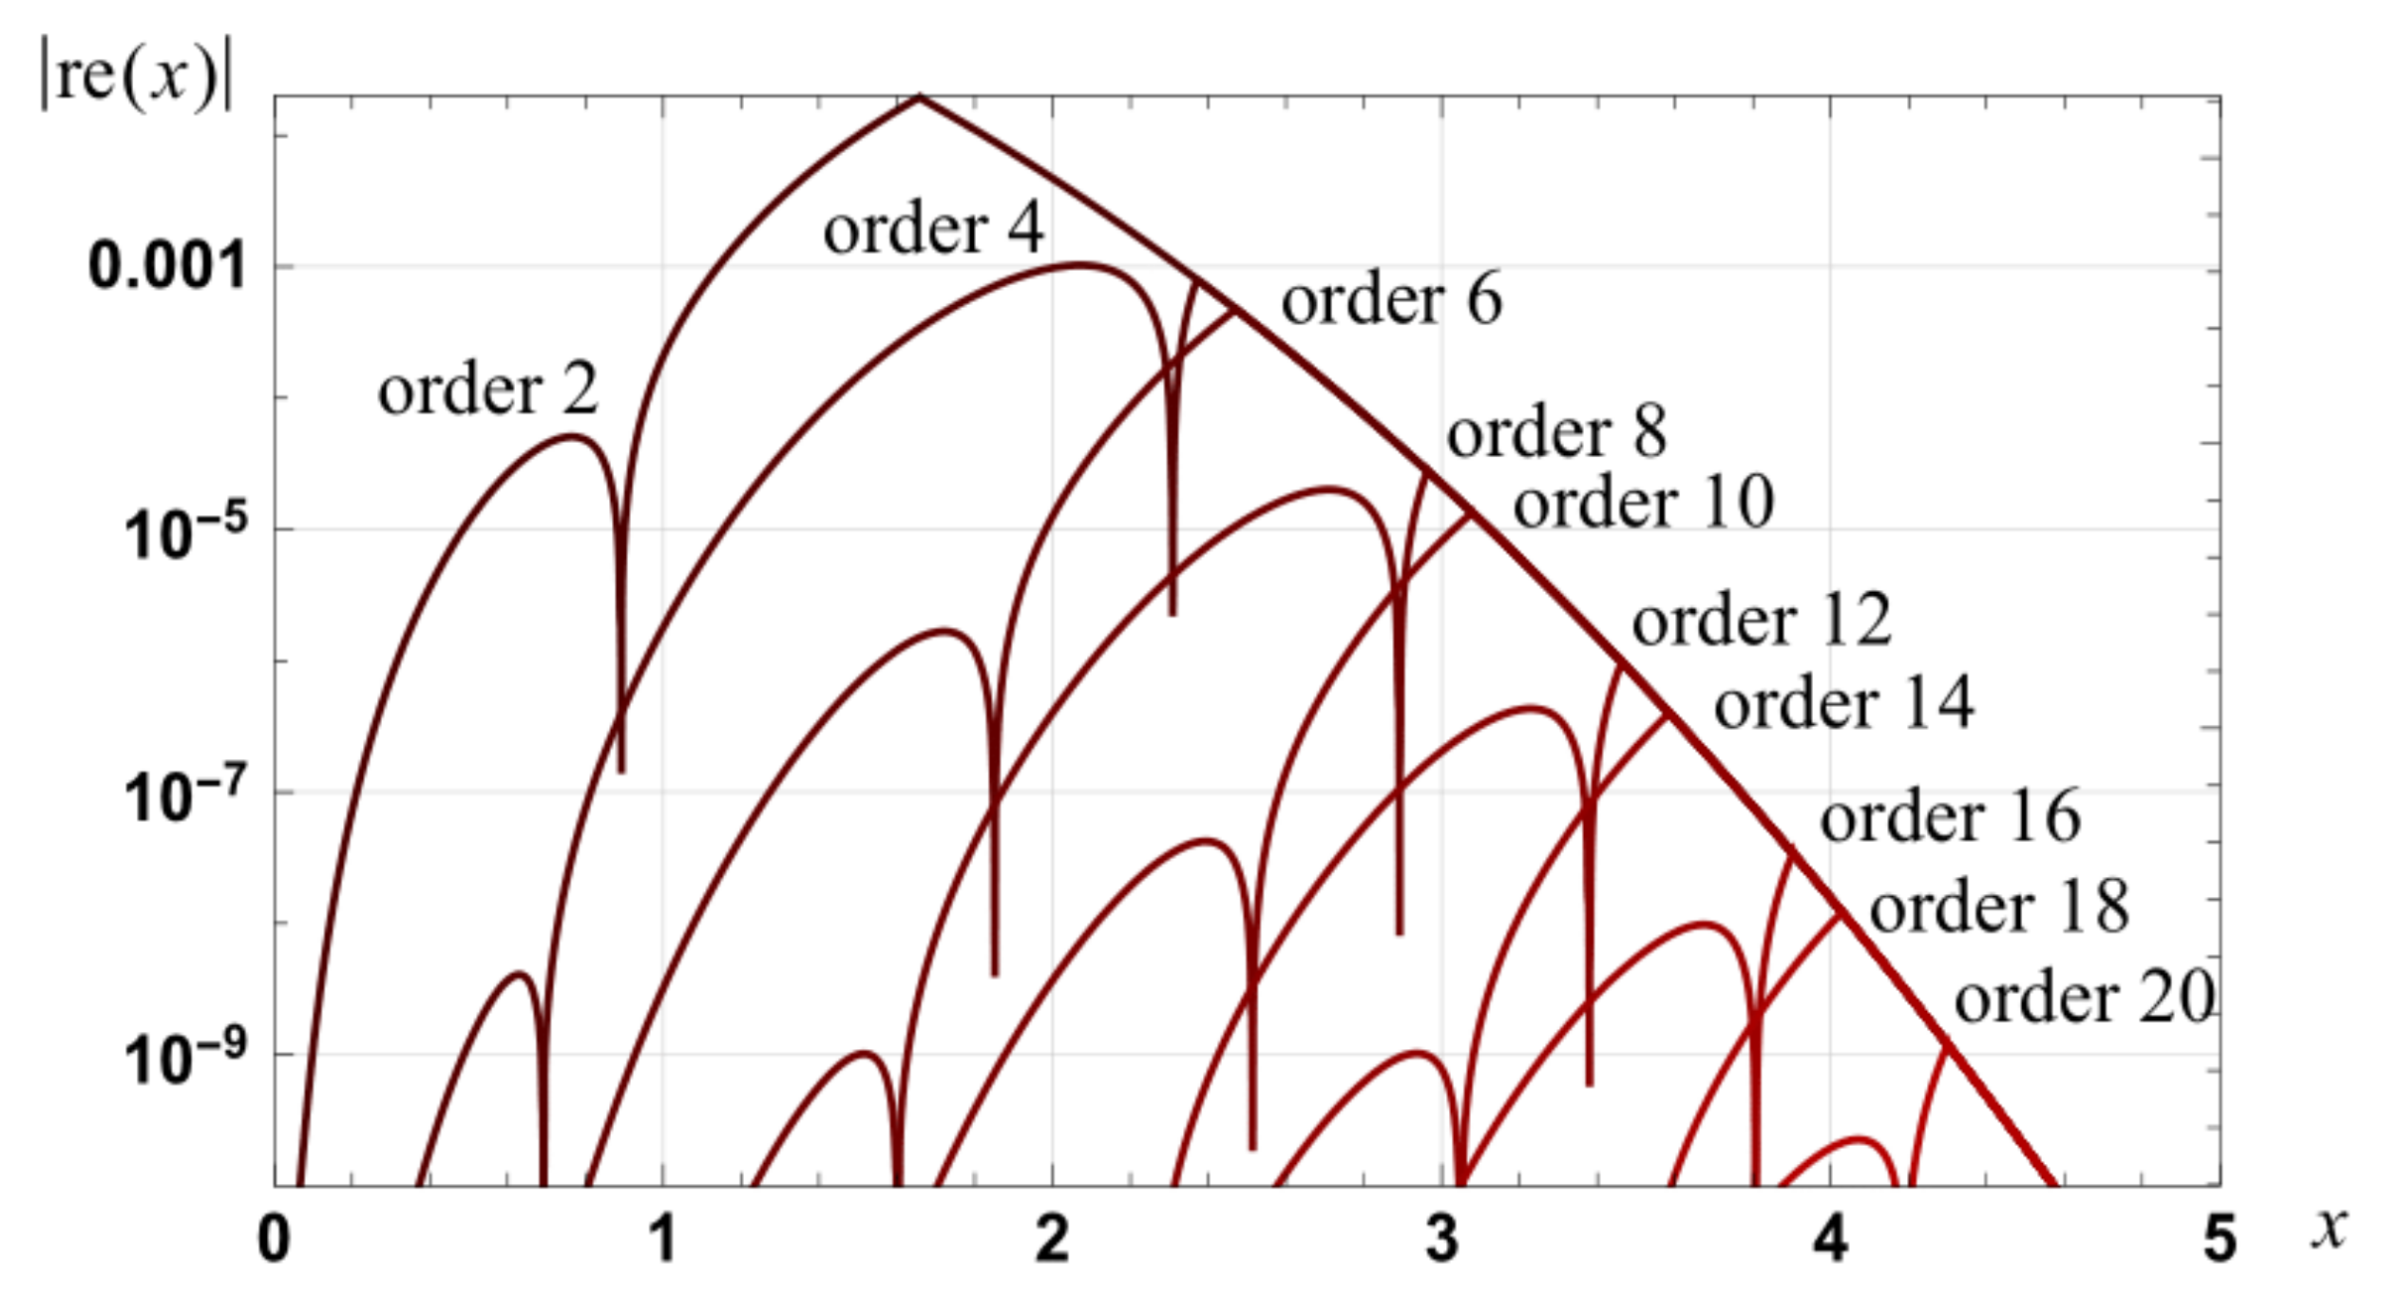
Figure 8.
Graph of the magnitude of the relative error in Taylor series approximations to that utilize an optimized change to the approximation .
Figure 8.
Graph of the magnitude of the relative error in Taylor series approximations to that utilize an optimized change to the approximation .

Figure 9.
Graph of the relative errors in spline approximations to , of orders one to six and based on four variable sub-intervals of equal width.
Figure 9.
Graph of the relative errors in spline approximations to , of orders one to six and based on four variable sub-intervals of equal width.

Figure 10.
Graph of the relative errors in approximations to : first to seventh order spline based series based on four sub-intervals of equal width and with utilization of the approximation at the optimum transition point.
Figure 10.
Graph of the relative errors in approximations to : first to seventh order spline based series based on four sub-intervals of equal width and with utilization of the approximation at the optimum transition point.
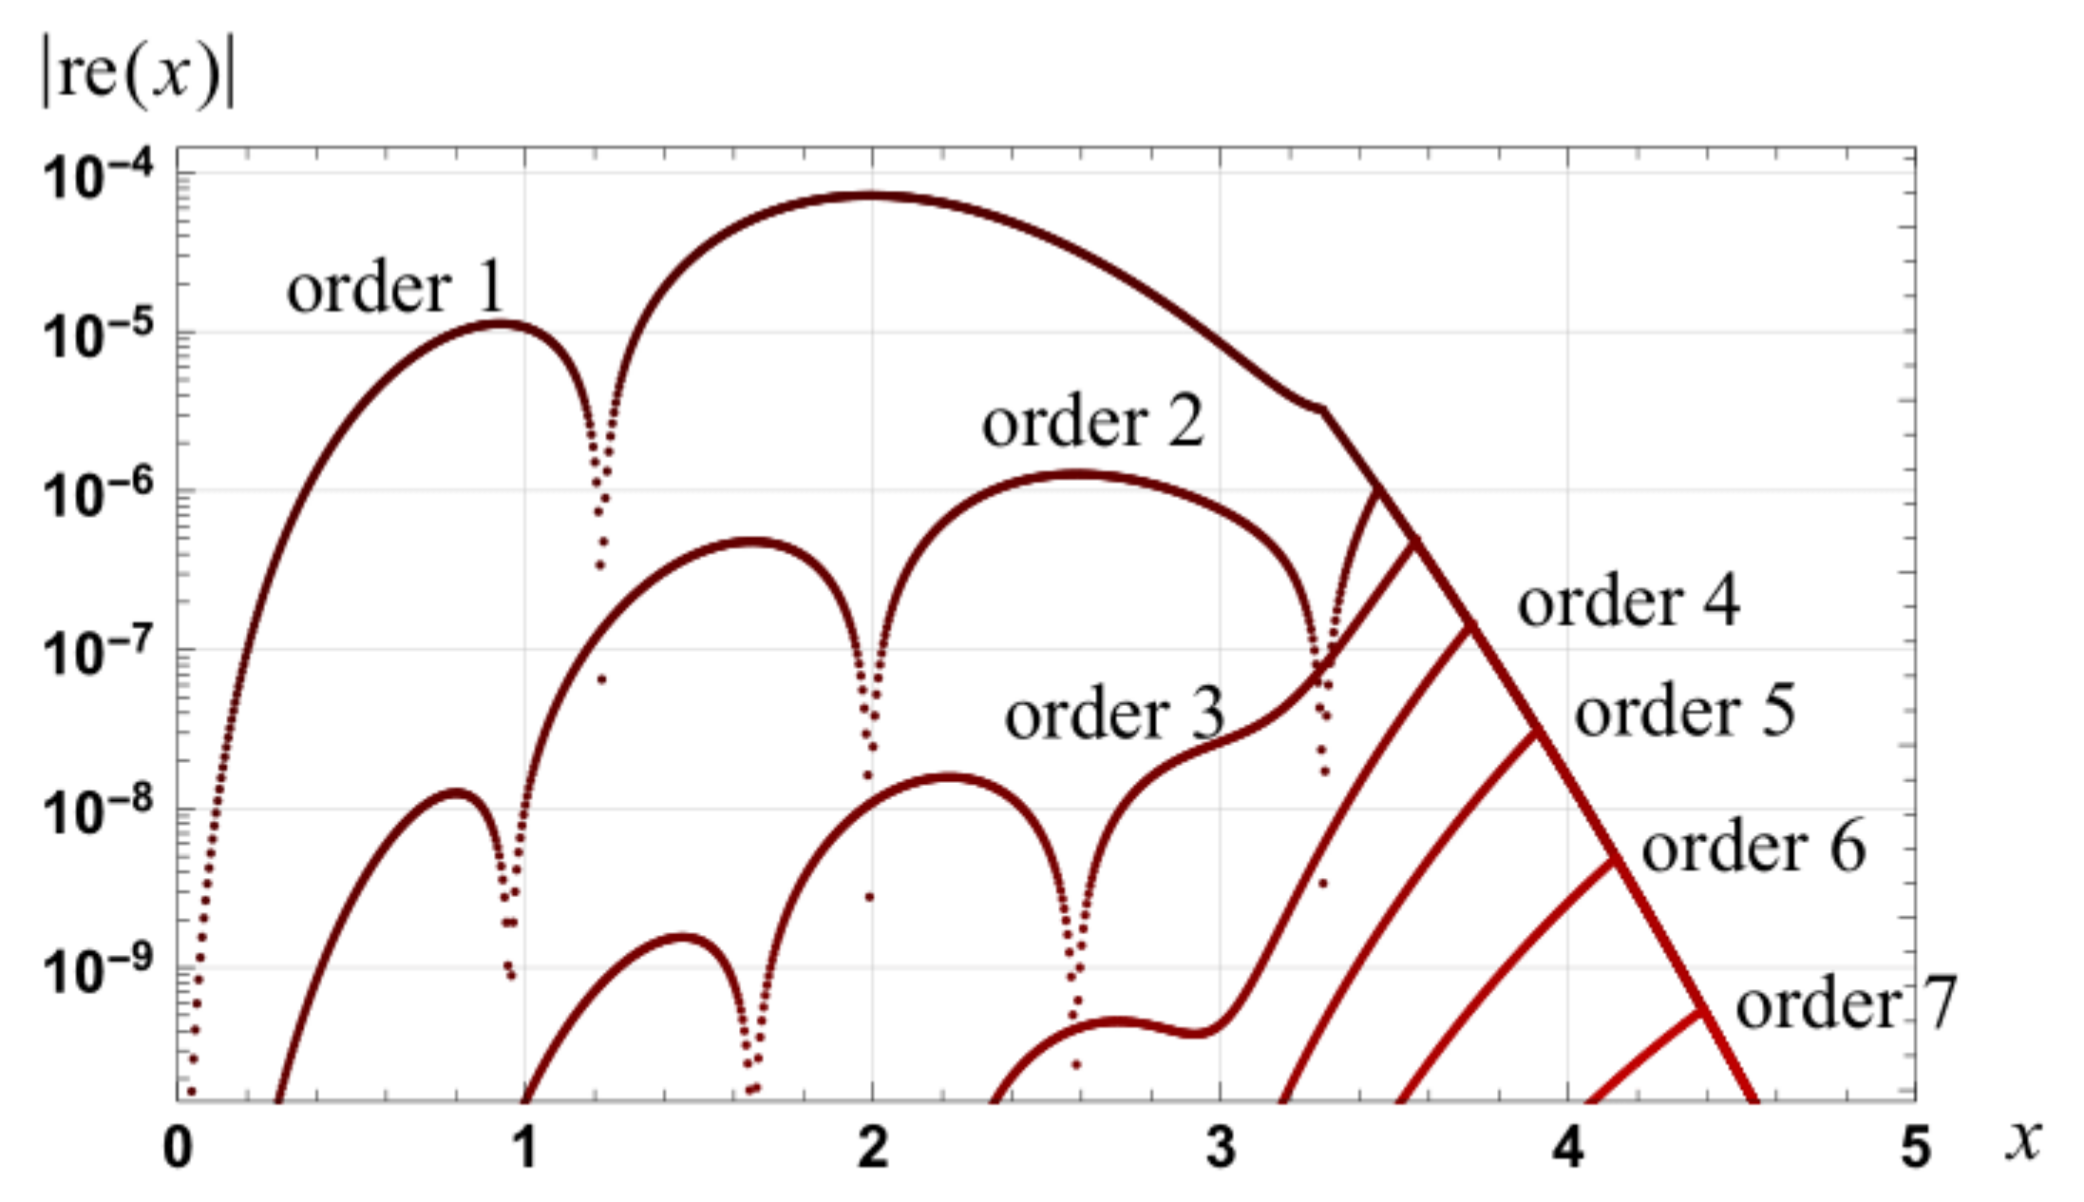
Figure 11.
Illustration of areas comprising erf(x).
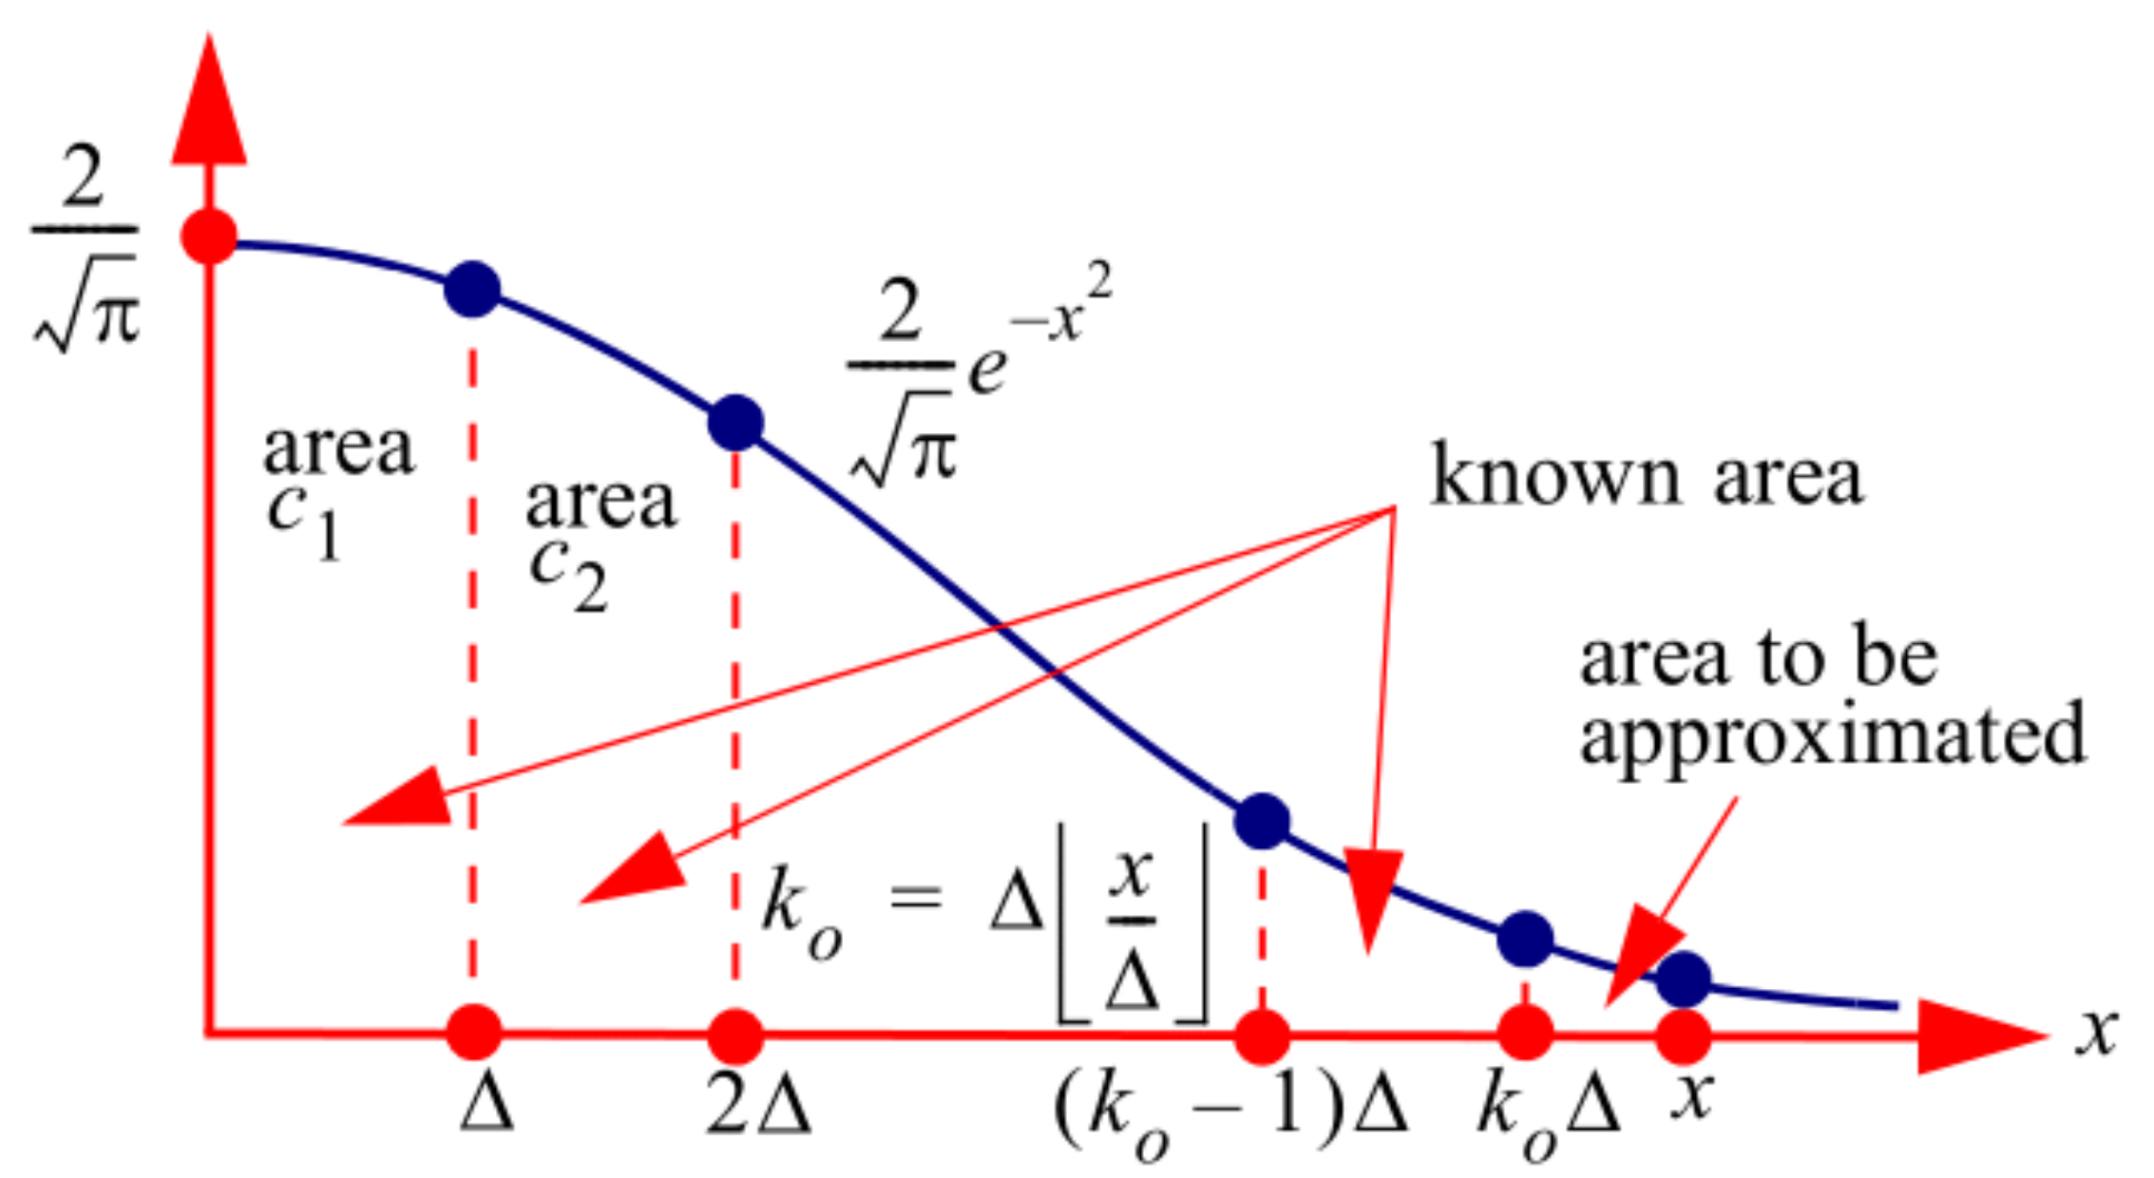
Figure 12.
Graph of the relative error bound, versus the order of approximation, for various set resolutions.
Figure 12.
Graph of the relative error bound, versus the order of approximation, for various set resolutions.

Figure 13.
Graph of the relative errors, based on a resolution of , in second to fourth order approximations to erf(x).
Figure 13.
Graph of the relative errors, based on a resolution of , in second to fourth order approximations to erf(x).

Figure 14.
Feedback system with dynamically varying (modulated) feedback.
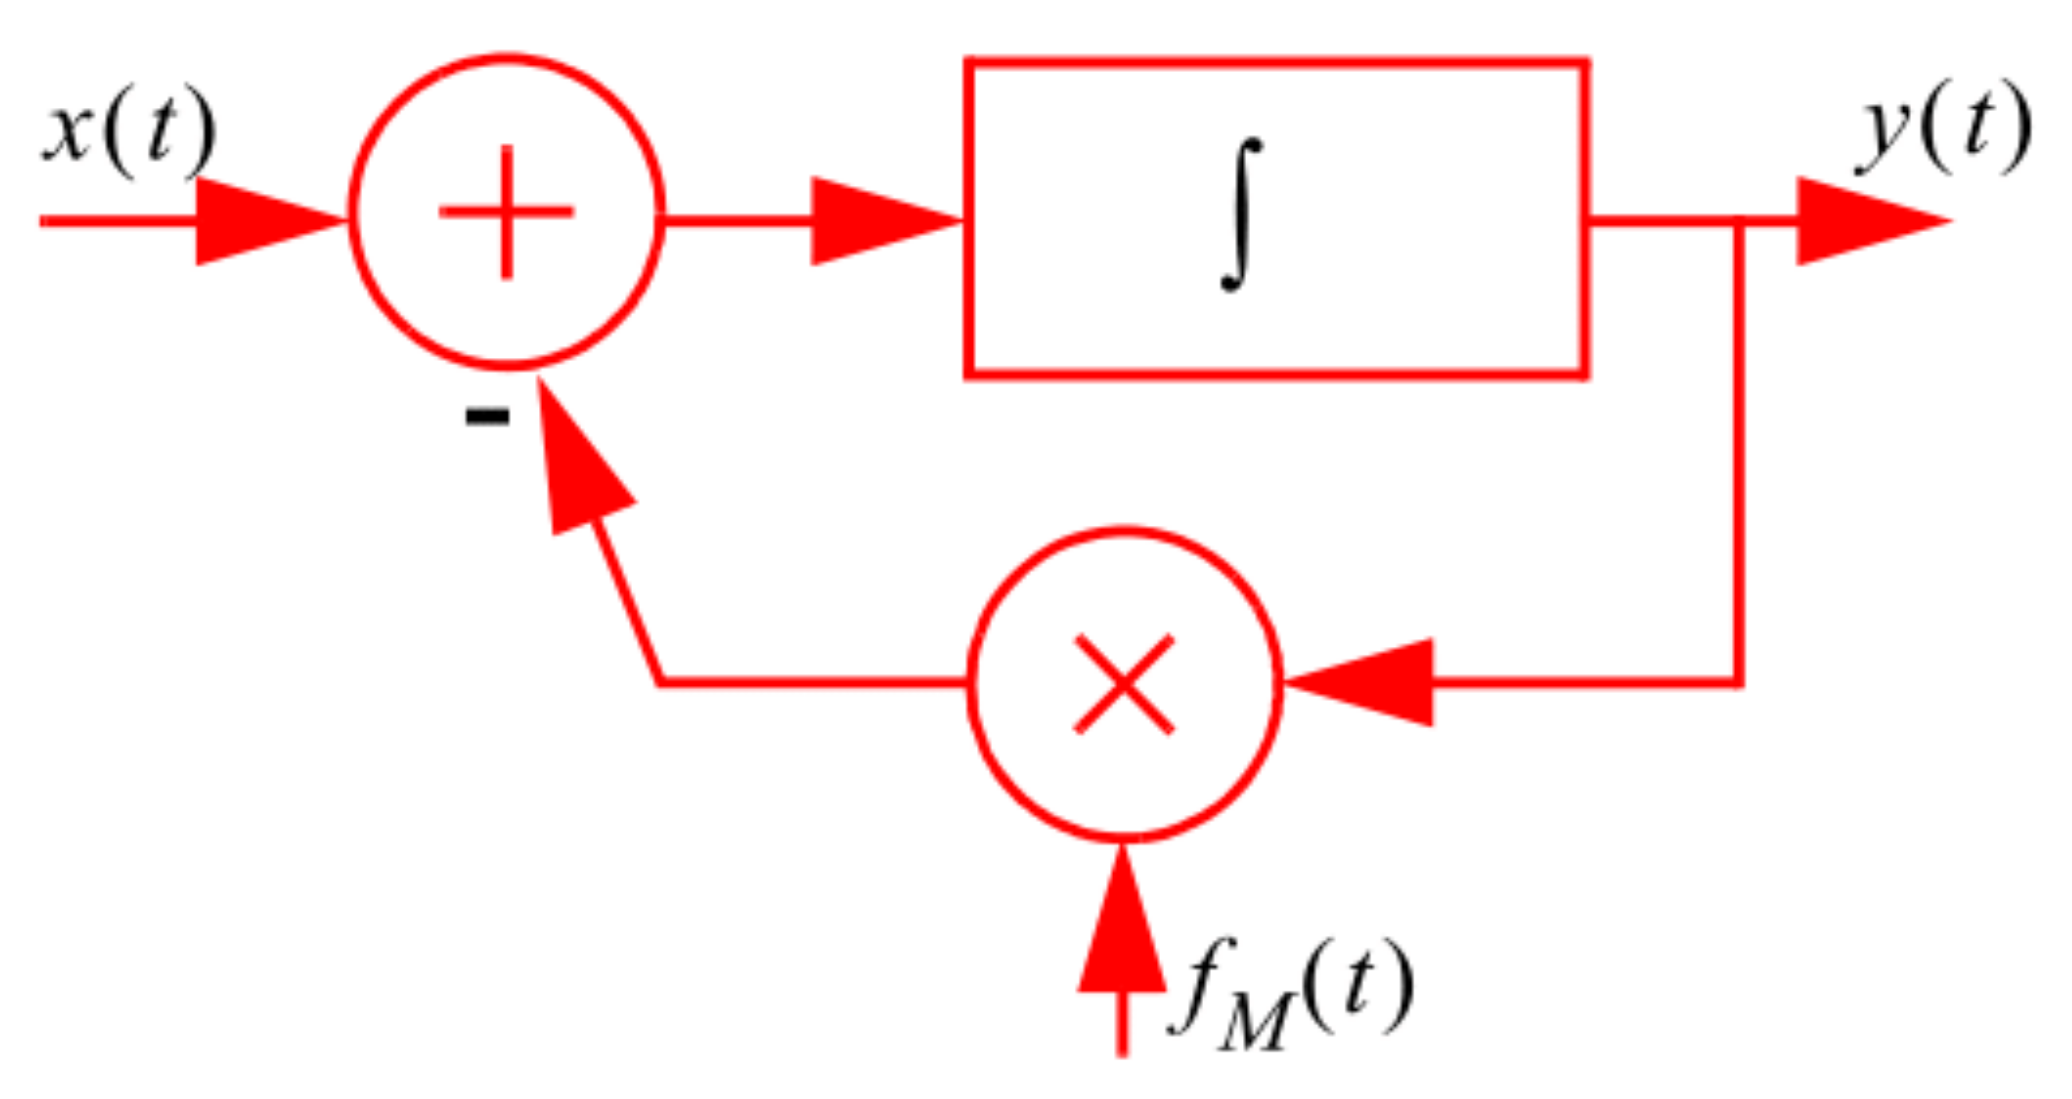
Figure 15.
Graph of the relative errors in approximations, of orders one to eight, to erf(x) as defined in Theorem 7.
Figure 15.
Graph of the relative errors in approximations, of orders one to eight, to erf(x) as defined in Theorem 7.
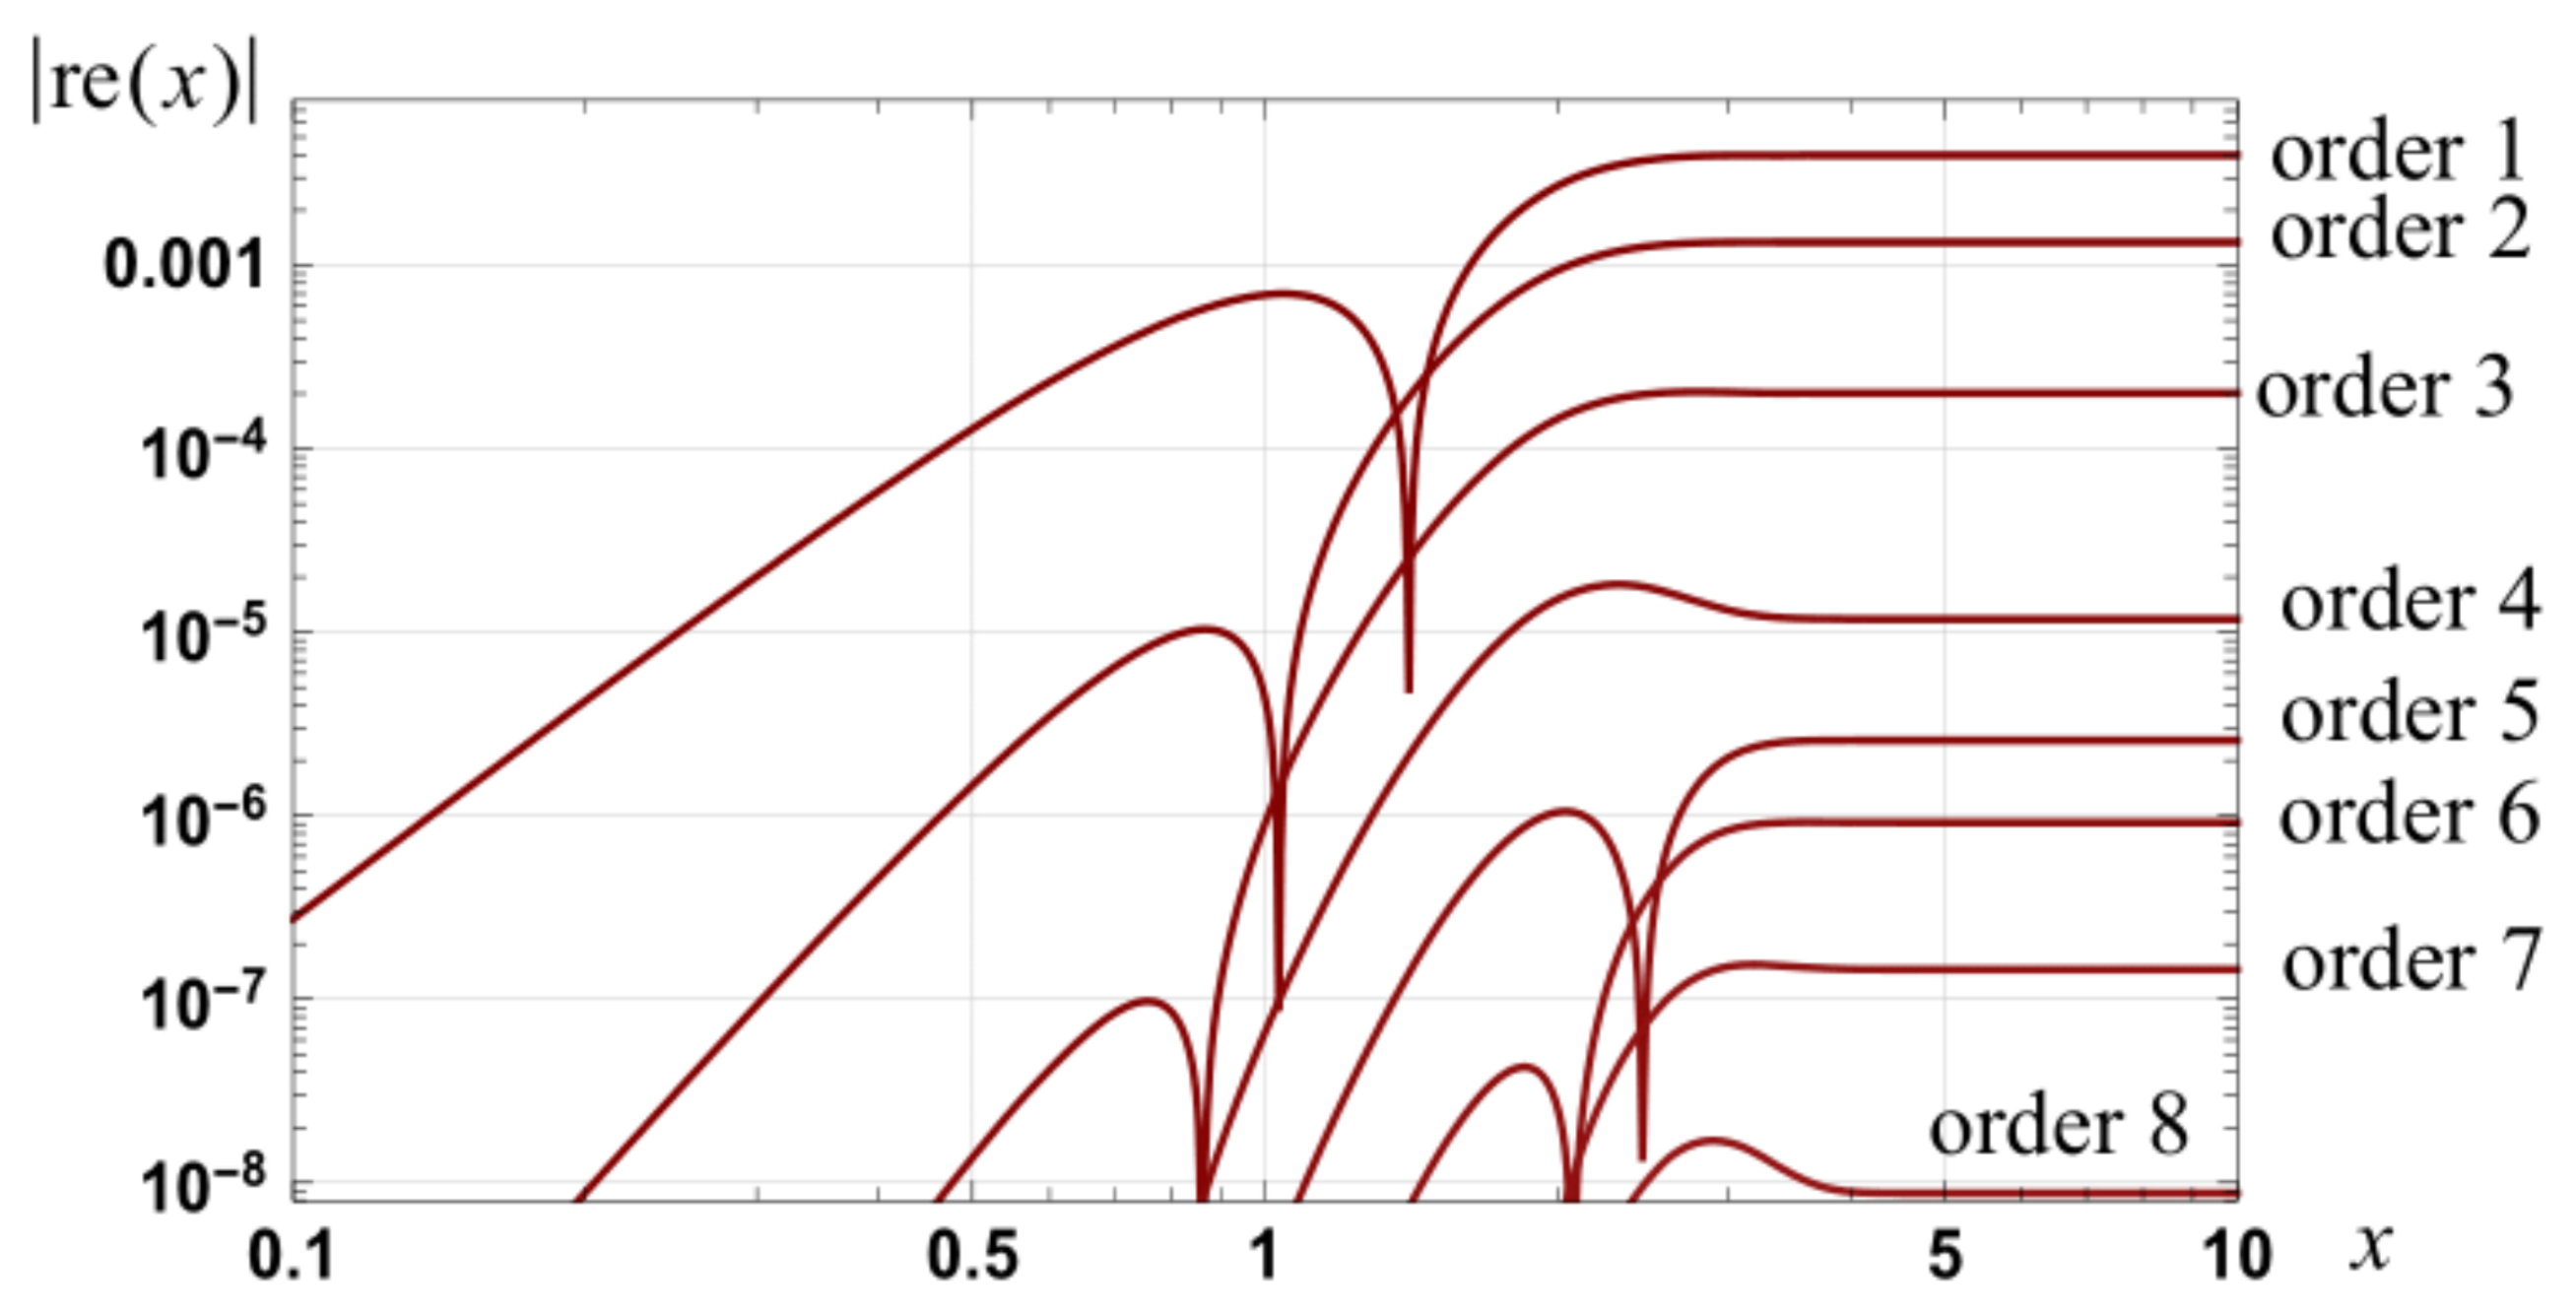
Figure 16.
Graph of the magnitude of the relative errors in approximations to exp(−x2), as defined by Equation (103), of orders 0, 2, 4, 6, 8, 10 and 12. The dotted curves are the relative errors associated with Taylor series of orders 1, 3, 5, 7, 9, 11, 13 and 15.
Figure 16.
Graph of the magnitude of the relative errors in approximations to exp(−x2), as defined by Equation (103), of orders 0, 2, 4, 6, 8, 10 and 12. The dotted curves are the relative errors associated with Taylor series of orders 1, 3, 5, 7, 9, 11, 13 and 15.
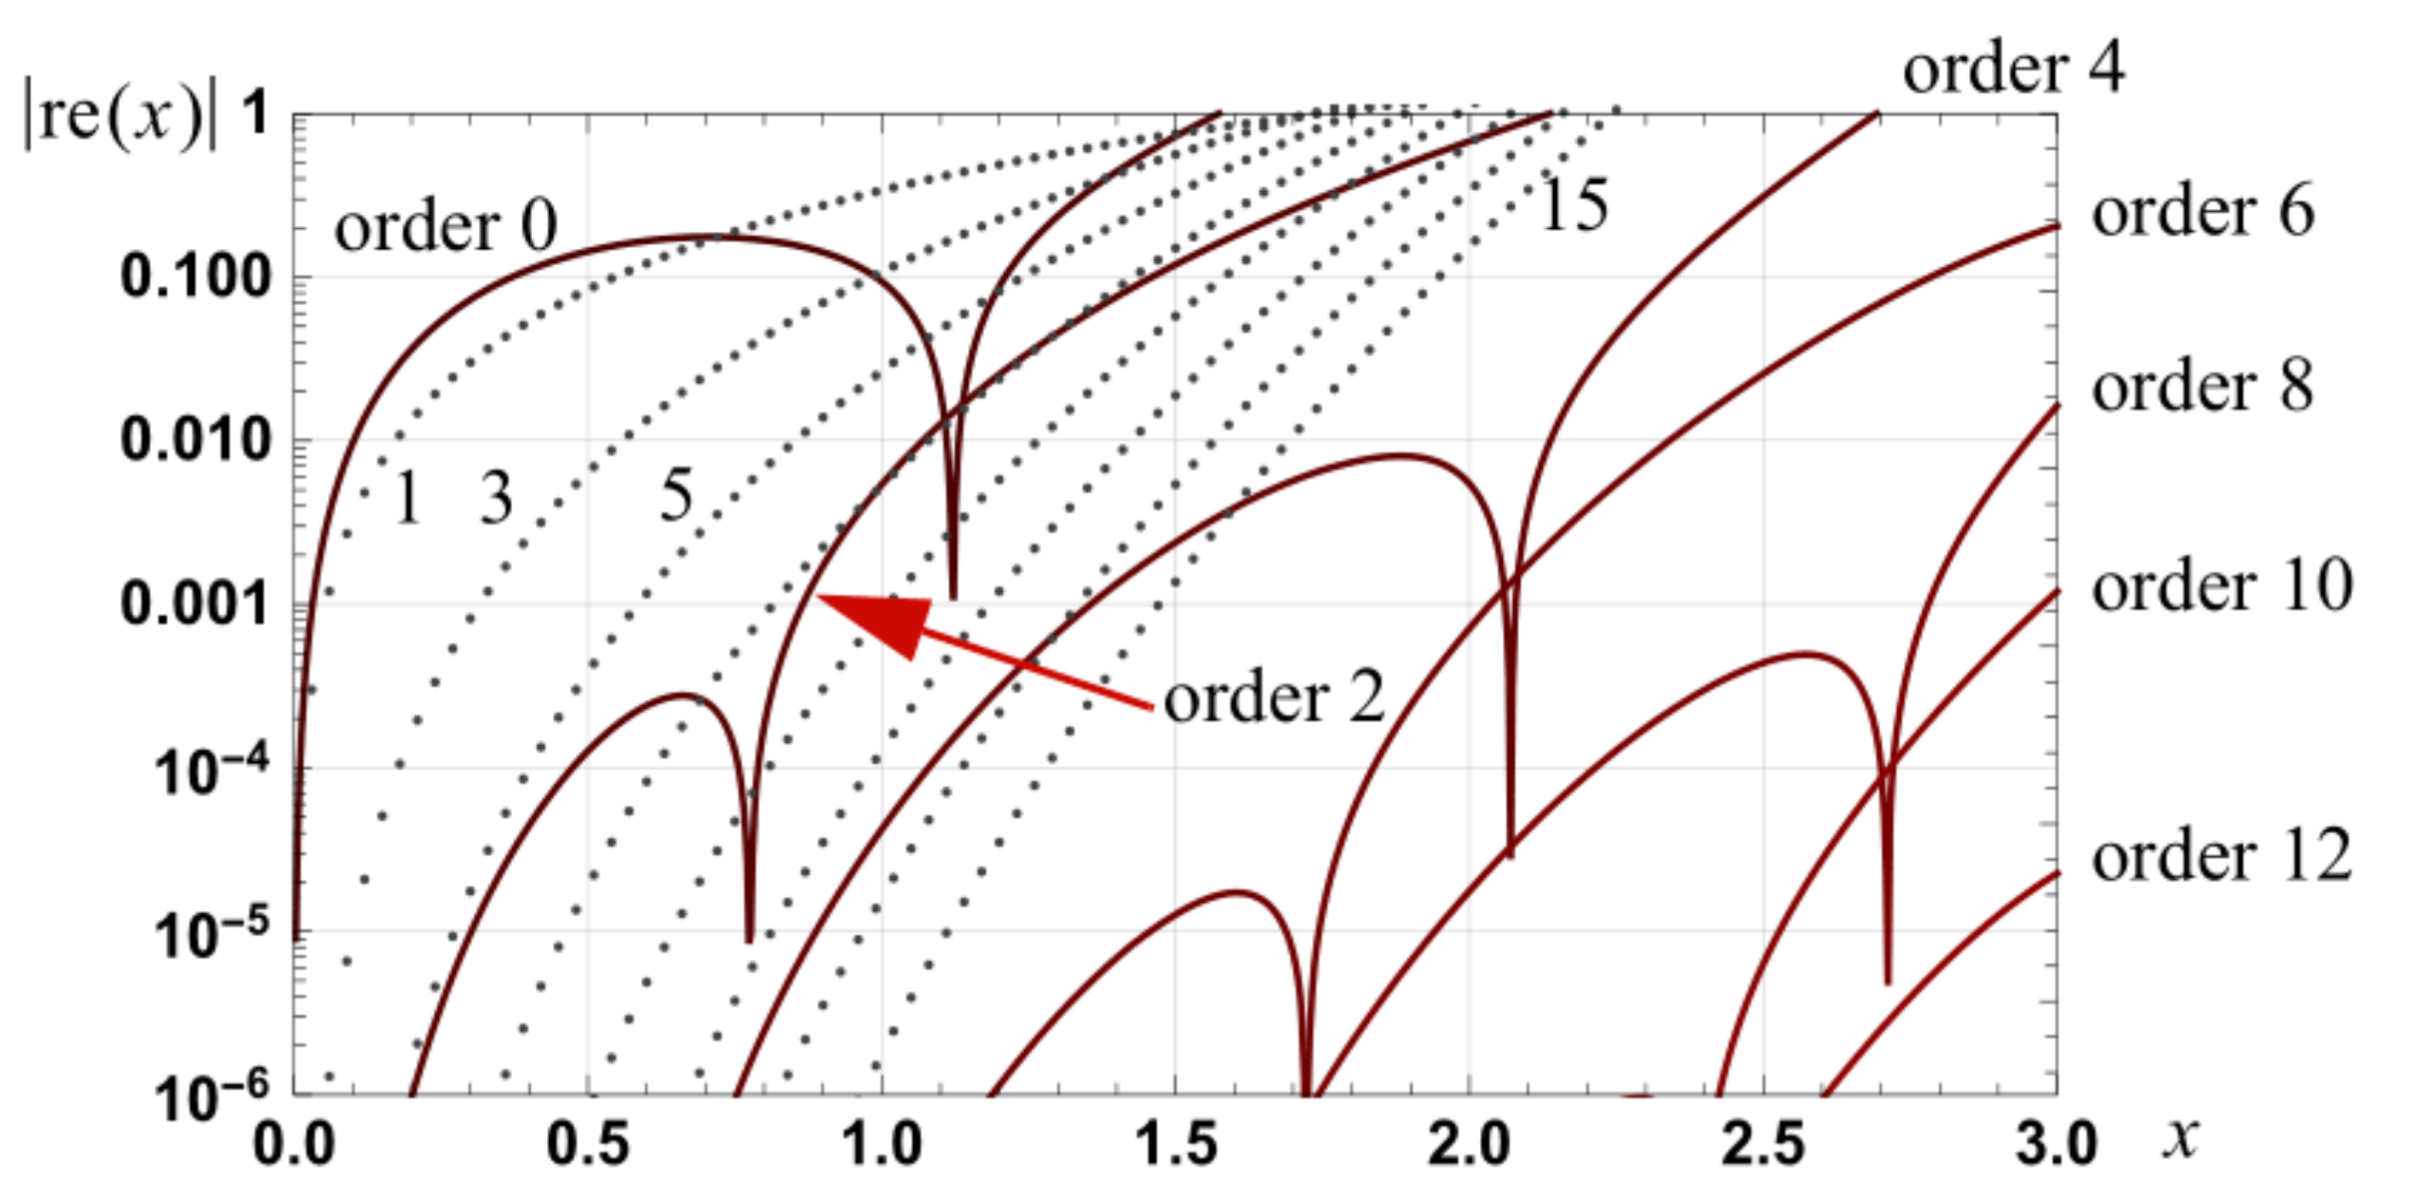
Figure 17.
Relative error in upper and lower bounds to erf(x) as, respectively, defined by Equation (110)–(112). The parameters p = 1 and q = π/4 have been used for the bounds defined by Equation (110).
Figure 17.
Relative error in upper and lower bounds to erf(x) as, respectively, defined by Equation (110)–(112). The parameters p = 1 and q = π/4 have been used for the bounds defined by Equation (110).

Figure 18.
Relative error in the approximations and to erf(x) where the residual function is approximated by the stated order.
Figure 18.
Relative error in the approximations and to erf(x) where the residual function is approximated by the stated order.
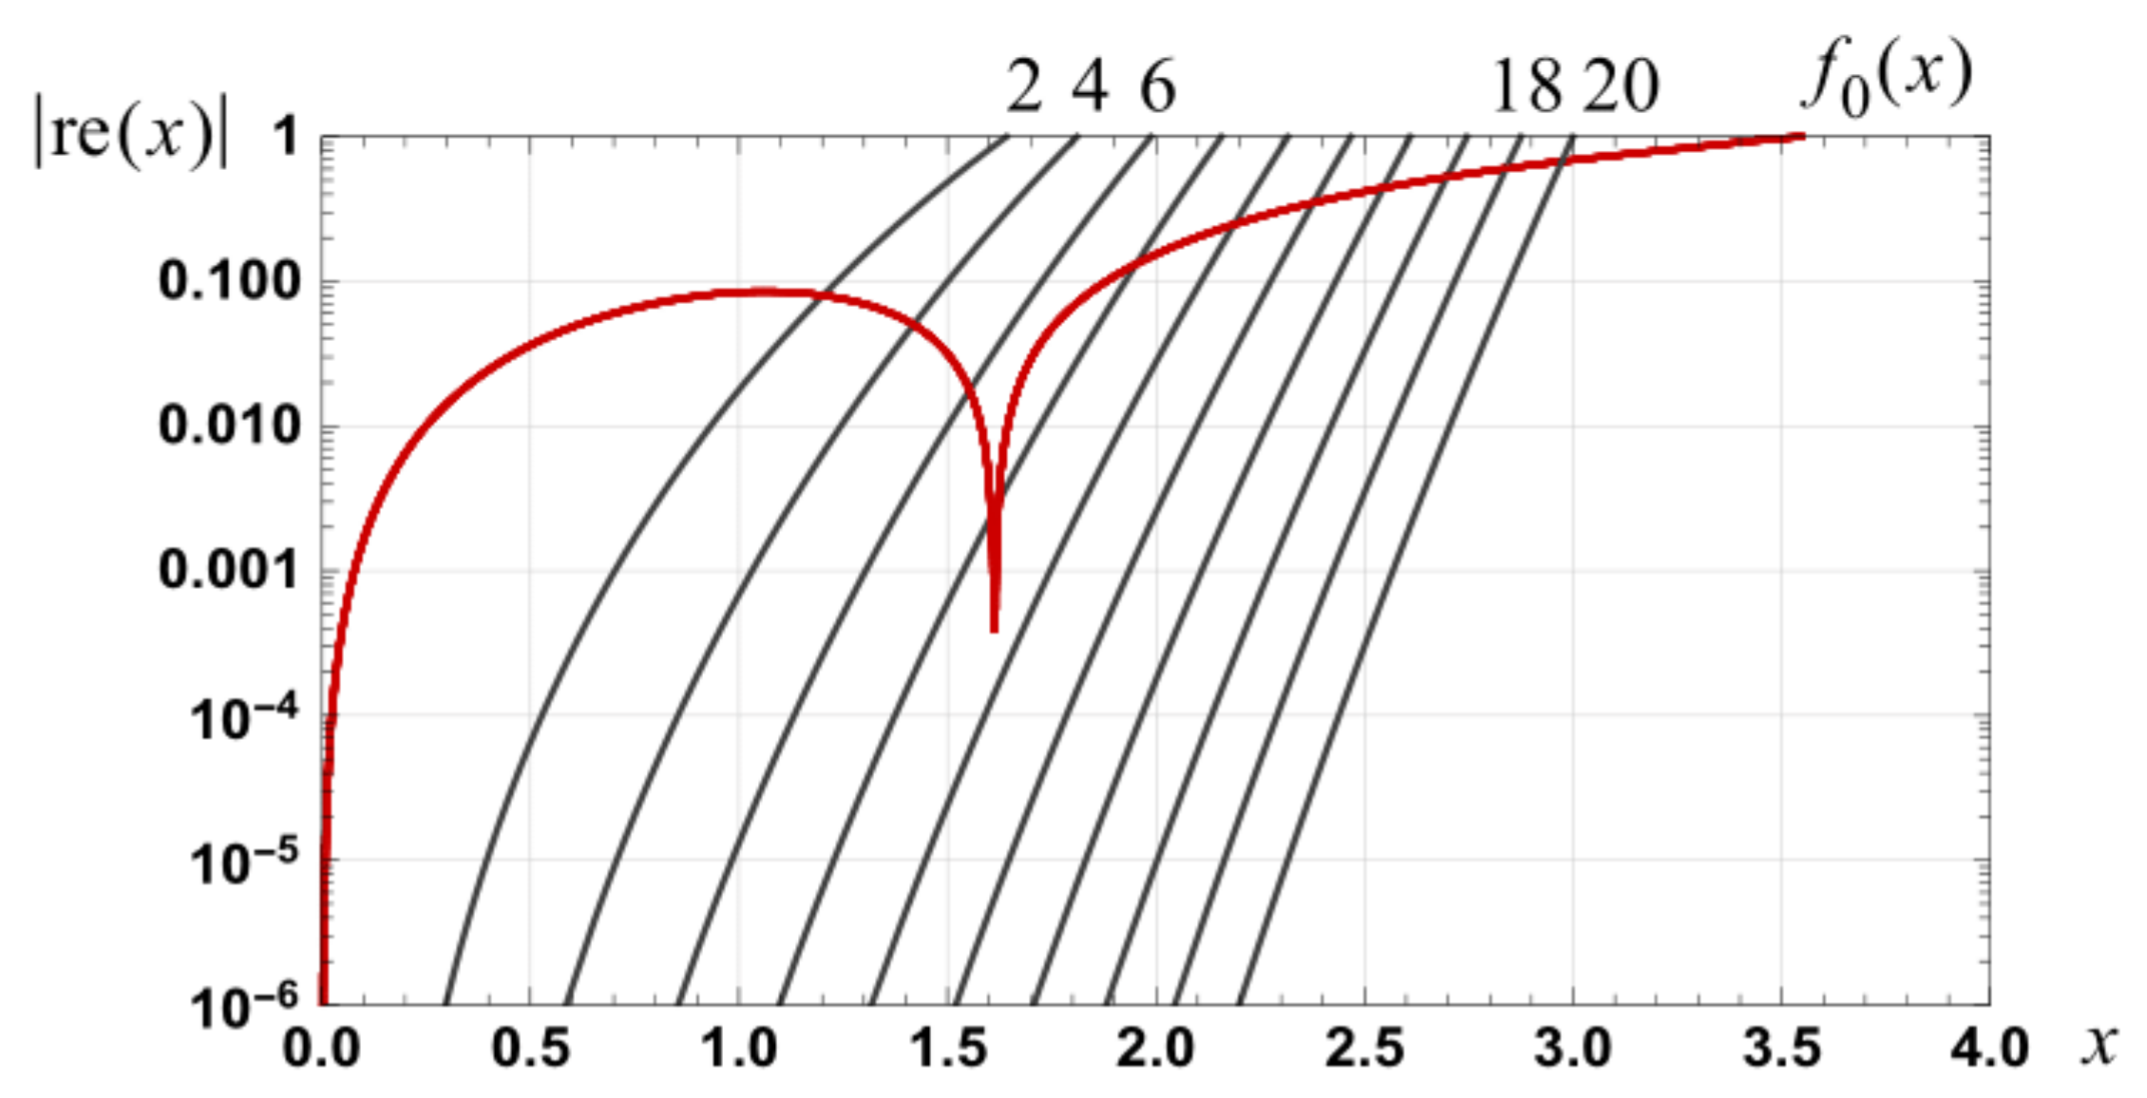
Figure 19.
Relative error in the approximations and to erf(x) where the residual function is approximated by the stated order.
Figure 19.
Relative error in the approximations and to erf(x) where the residual function is approximated by the stated order.
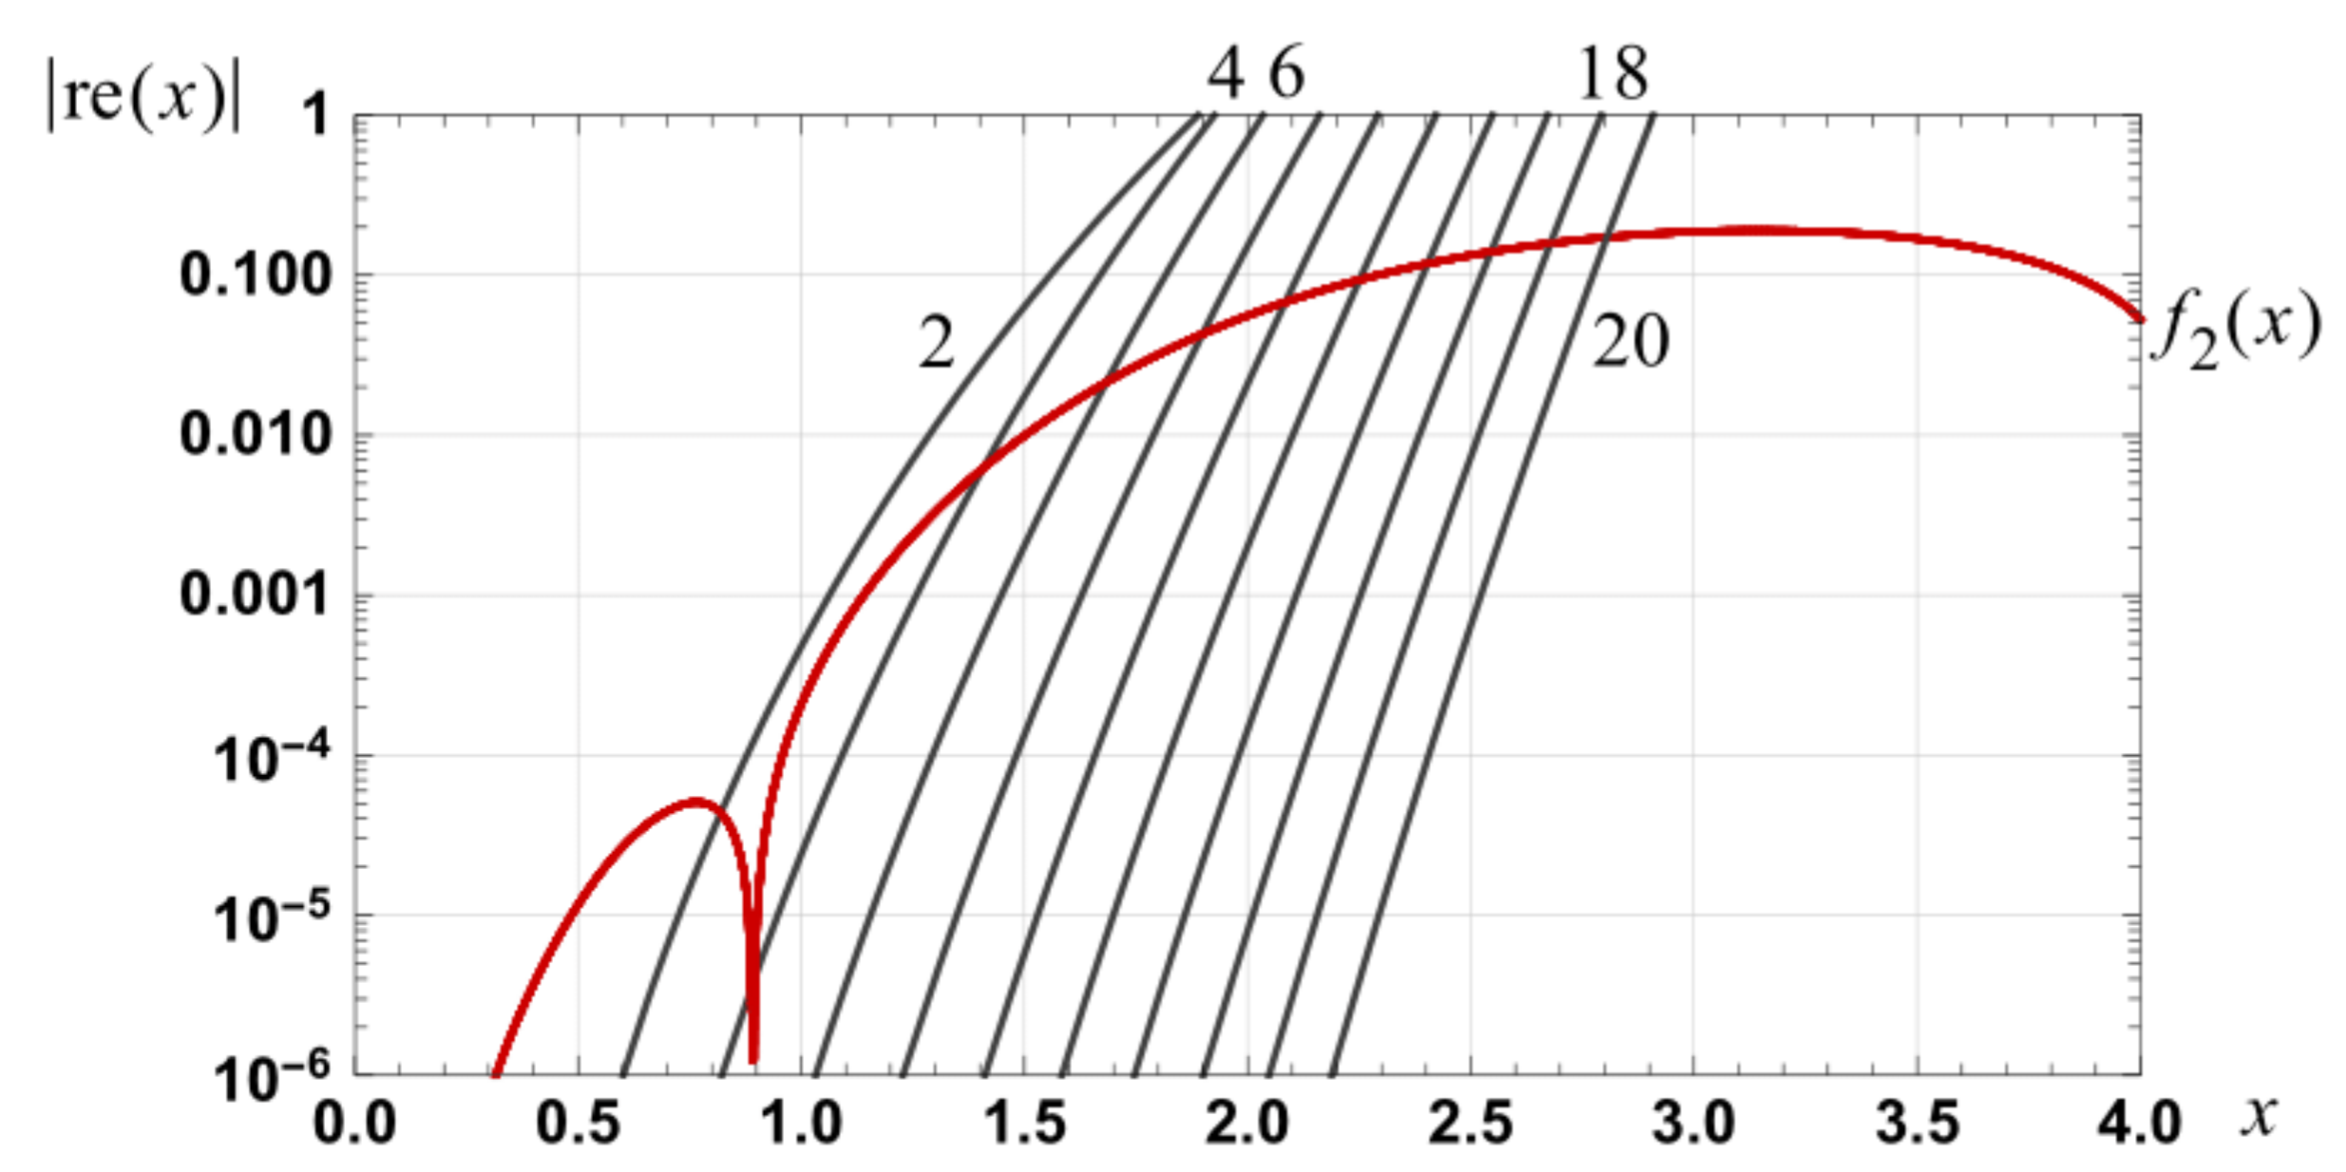
Figure 20.
Graph of the signals and erf(x)2.

Figure 21.
Graph of for the case of and for amplitudes of a = 0.5, a = 1, a = 1.5 and a = 2.
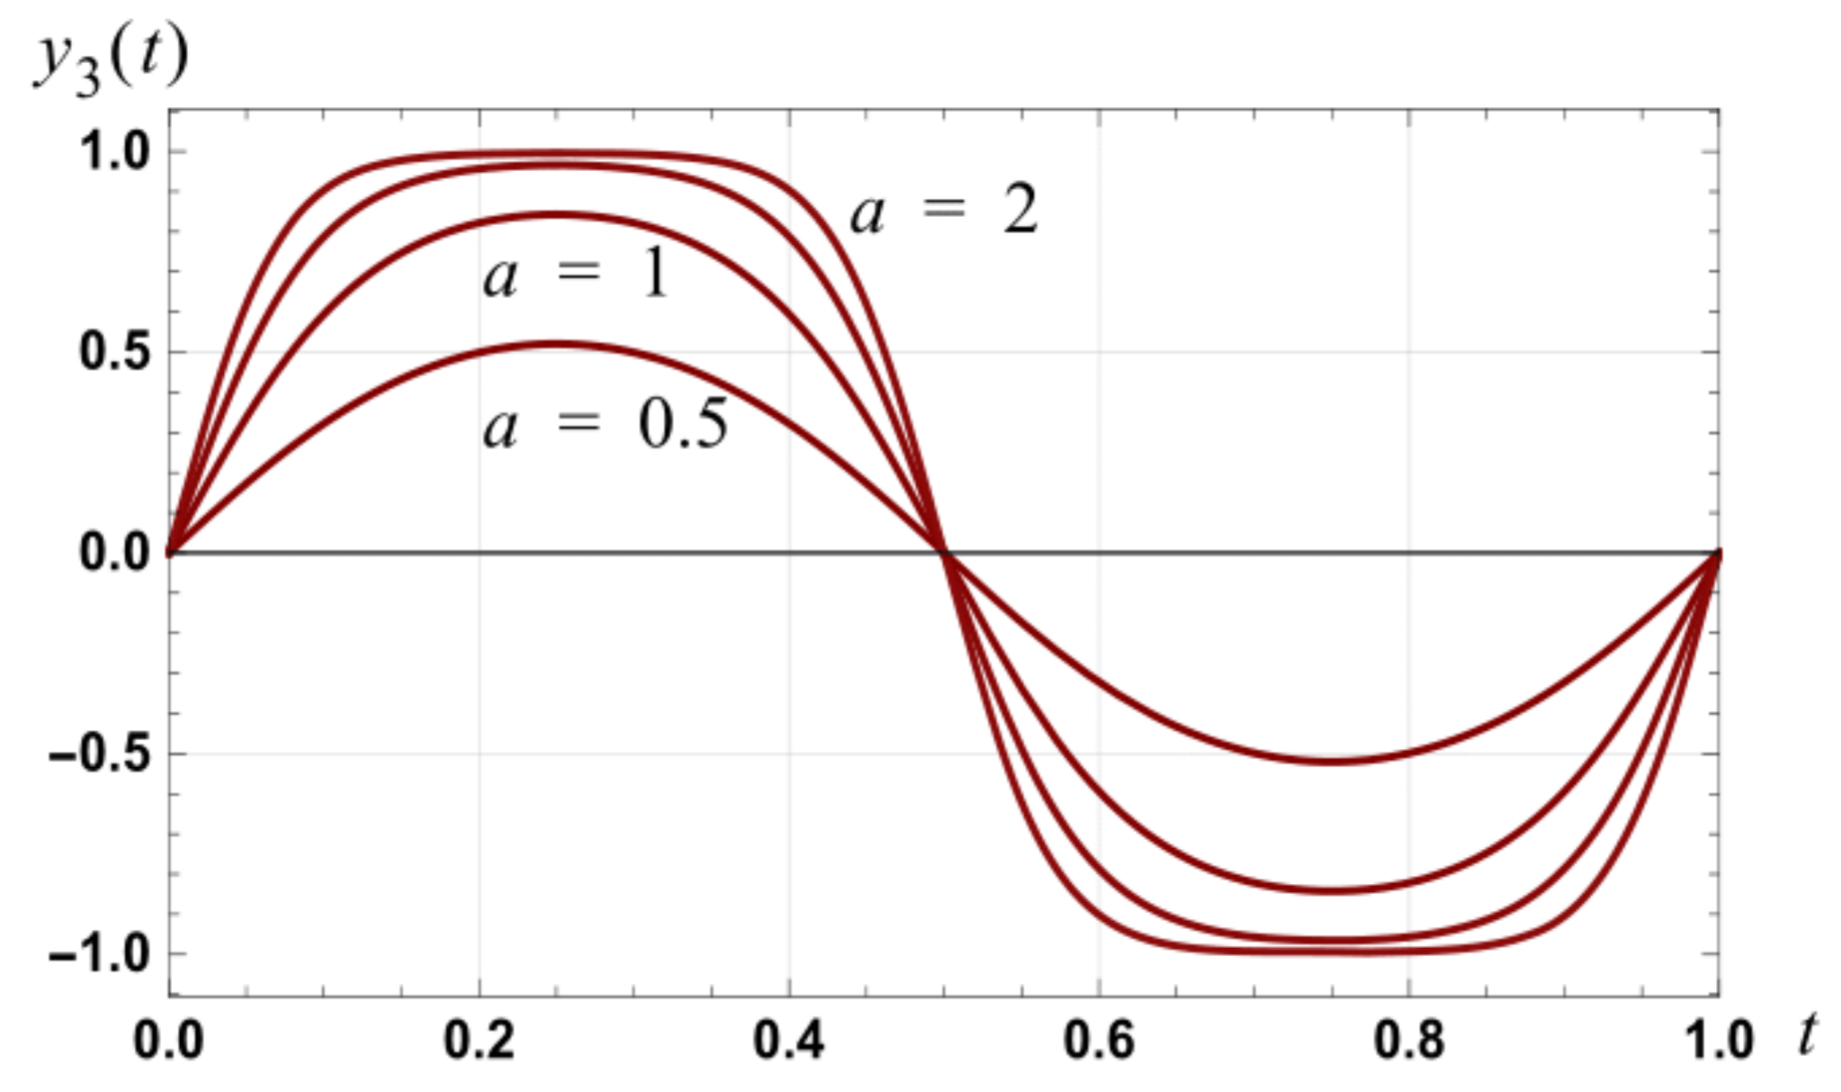
Figure 22.
Graph of the input power, output power and ratio of output power to input power as the amplitude of the input signal varies.
Figure 22.
Graph of the input power, output power and ratio of output power to input power as the amplitude of the input signal varies.

Figure 23.
Graph of the variation of harmonic distortion with amplitude.

Figure 24.
Graph of the input signal , and the corresponding approximation to the output of a second order linear filter with , .
Figure 24.
Graph of the input signal , and the corresponding approximation to the output of a second order linear filter with , .
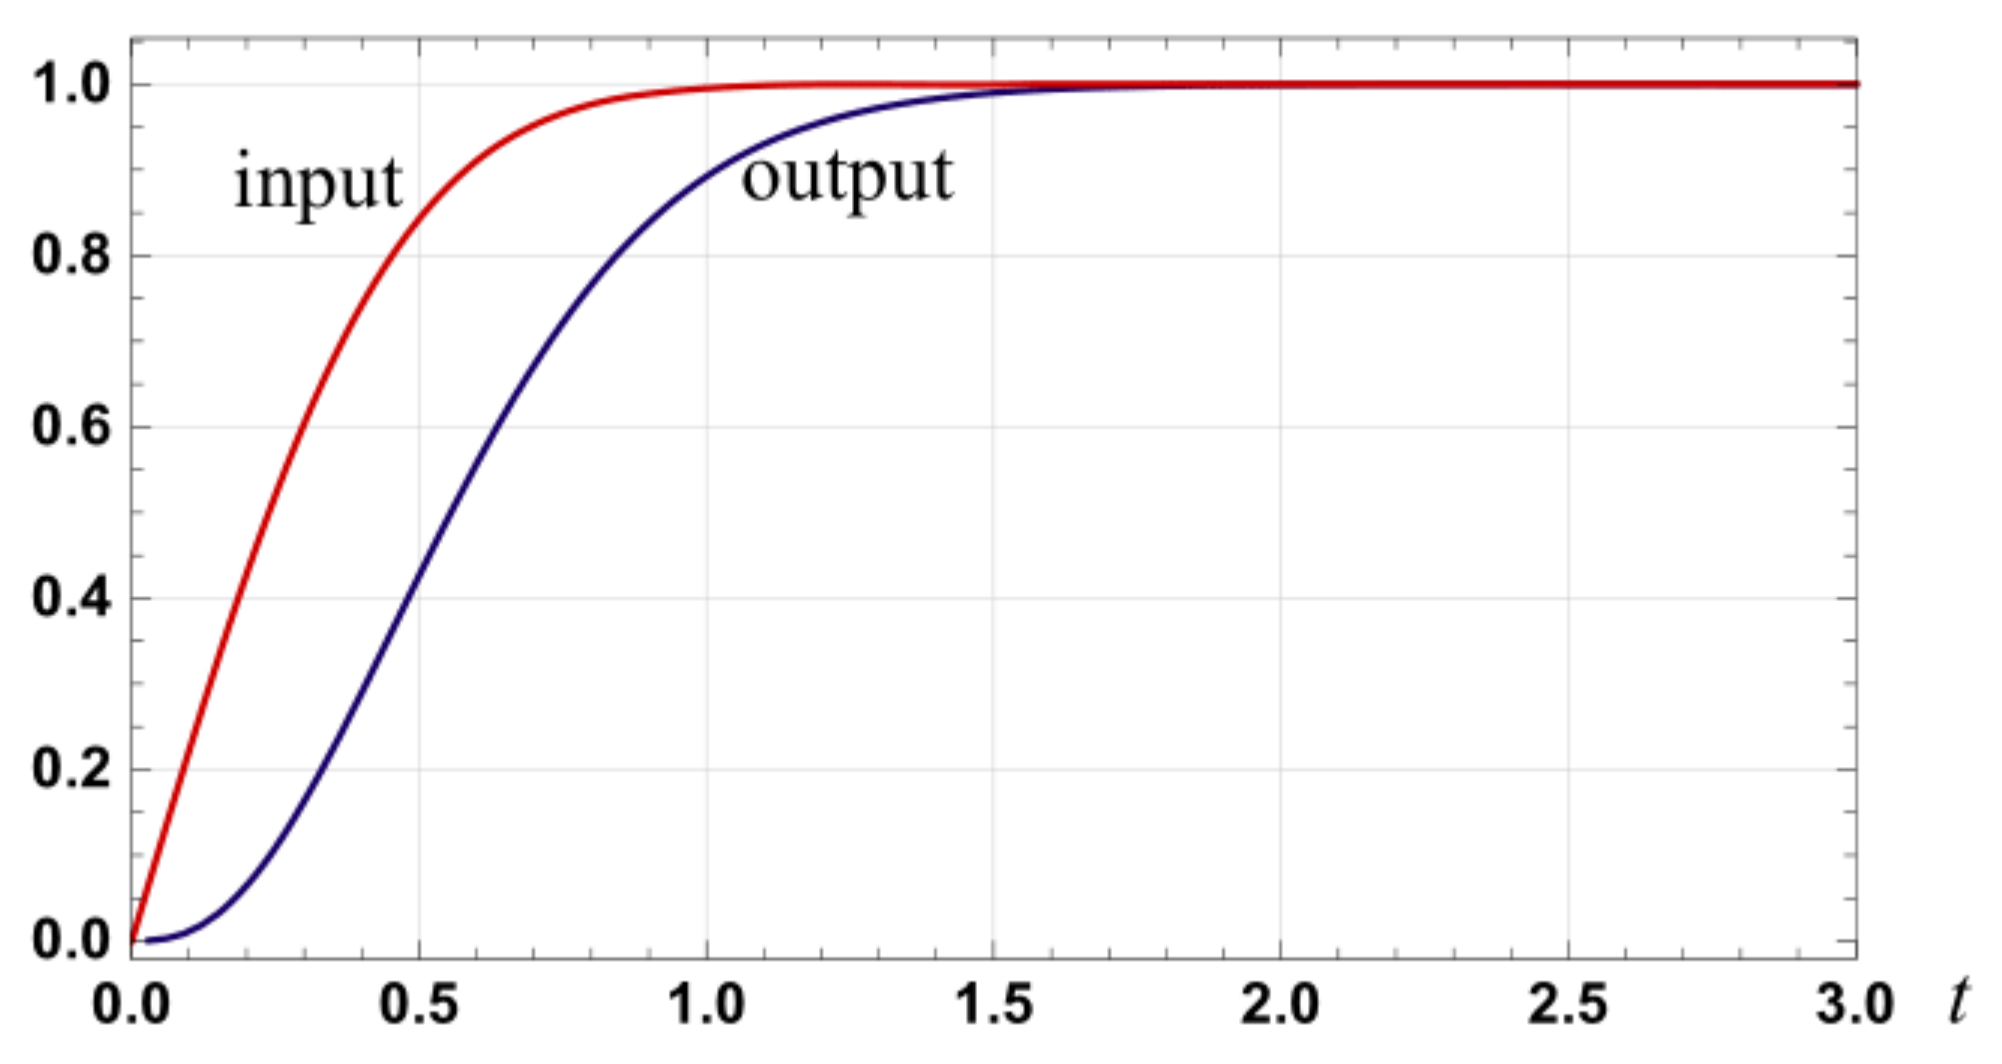
Figure 25.
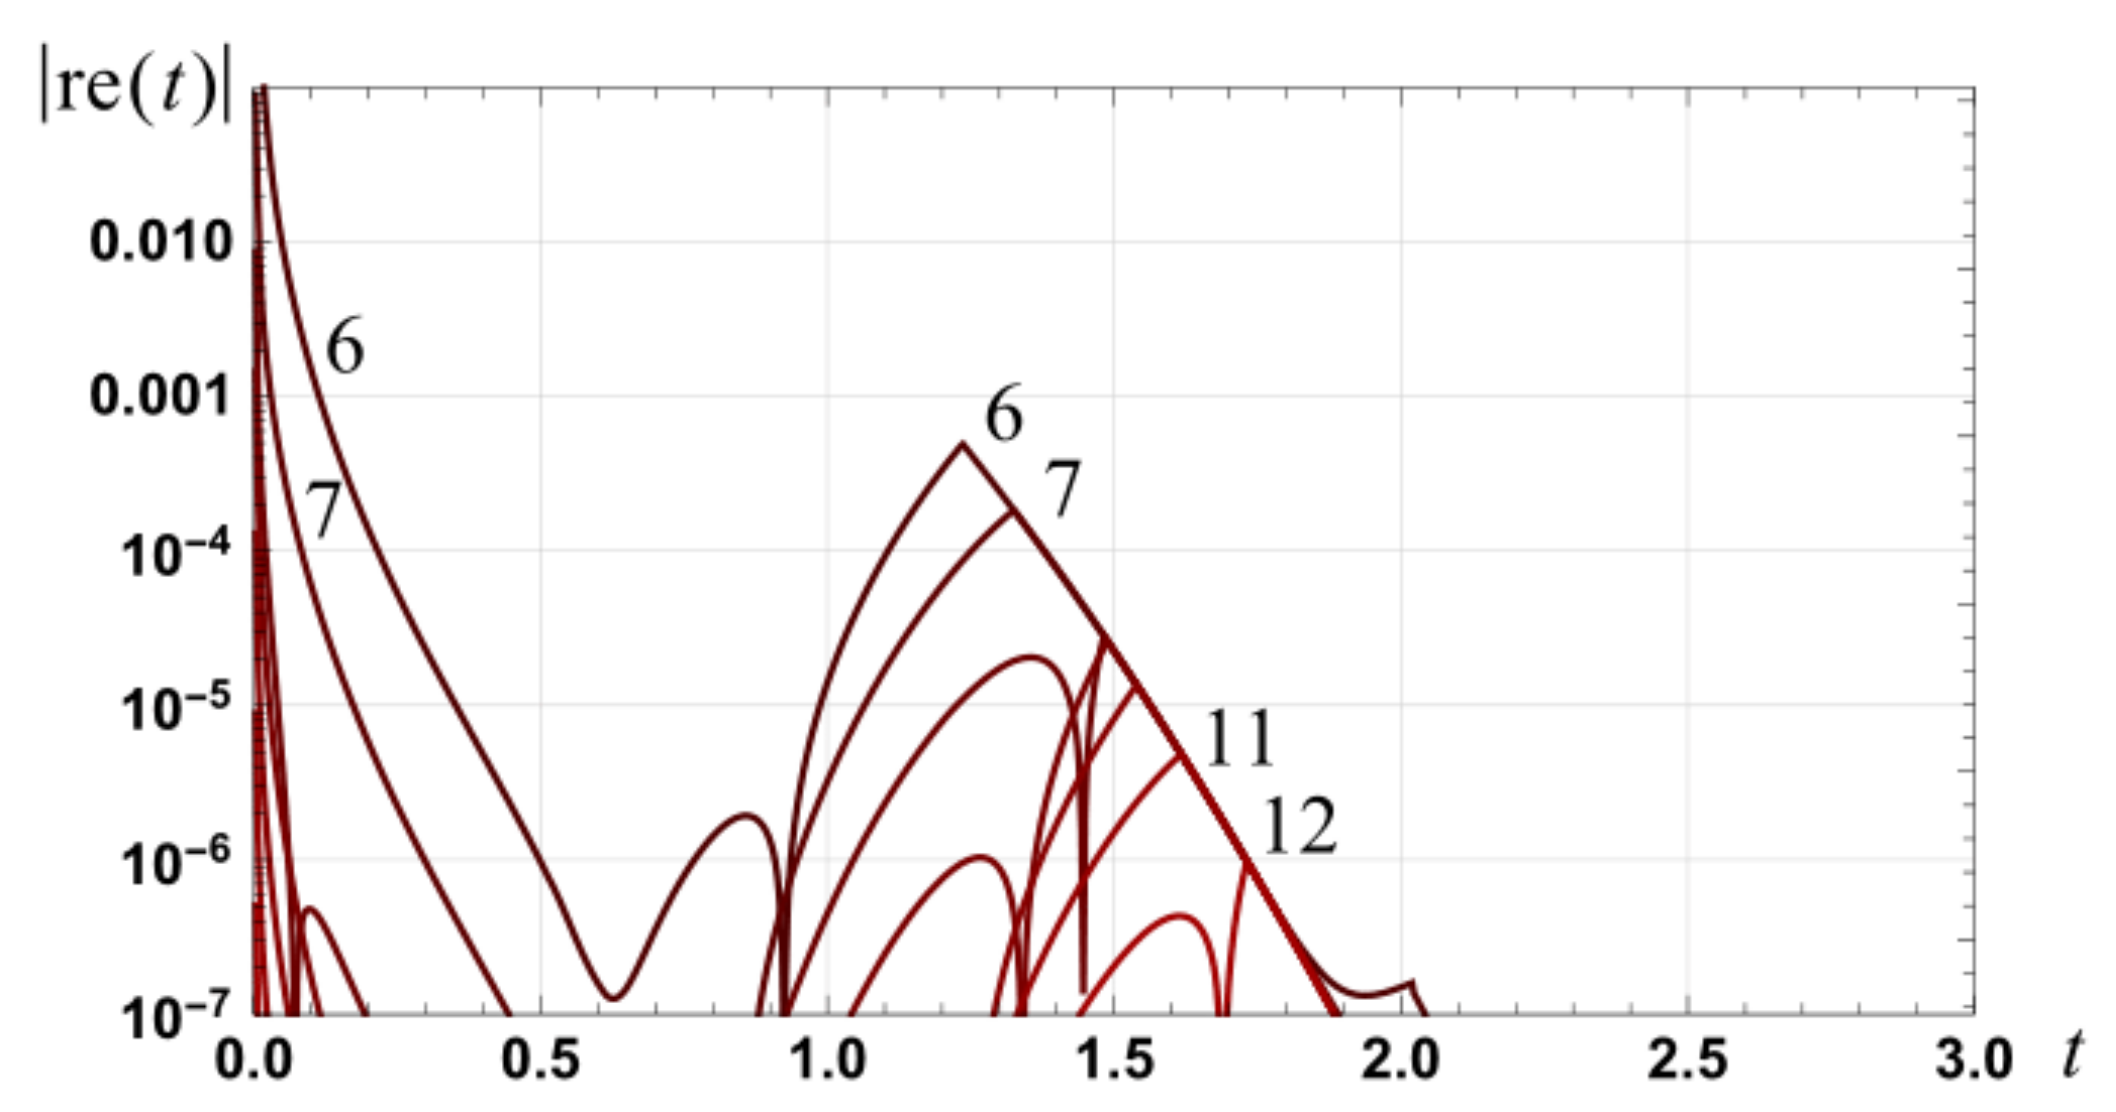
Graph of the relative errors associated with the output signal, shown in Figure 24, for approximations to the error function (Equation (56)) of orders six to twelve which utilize optimum transition points.
Figure 25.
Graph of the relative errors associated with the output signal, shown in Figure 24, for approximations to the error function (Equation (56)) of orders six to twelve which utilize optimum transition points.

Table 1.
Examples of published approximations for , . For the third and second last approximations, the coefficient definitions are detailed in the associated reference. The stated relative error bounds arise from sampling the interval [0, 5] with 10,000 uniformly spaced points.
Table 1.
Examples of published approximations for , . For the third and second last approximations, the coefficient definitions are detailed in the associated reference. The stated relative error bounds arise from sampling the interval [0, 5] with 10,000 uniformly spaced points.
| # | Reference | Approximation | Relative Error Bound |
| 1 | Taylor series | ||
| 2 | Abramowitz [21], p. 297, Equation (7.1.6) | ||
| 3 | Abramowitz [21], p. 299, Equation (7.1.26) | 8.09 × 10⁻⁶ | |
| 4 | Menzel [14] and Nadagopal [22] | 7.07 × 10⁻³ | |
| 5 | Bürmann series [23], Equation (33) | 3.61 × 10⁻³ | |
| 6 | Winitzki [24], Equation (3) | 3.50 × 10⁻⁴ | |
| 7 | Soranzo [25], Equation (1) | 1.20 × 10⁻⁴ | |
| 8 | Vedder [26], Equation (5) | 4.65 × 10⁻³ | |
| 9 | Vazquez-Leal [27], Equation (3.1) | 1.88 × 10⁻⁴ | |
| 10 | Sandoval-Hernandez [13], Equation (23) | 3.05 × 10⁻⁵ | |
| 11 | Abrarov [28], Equation (16) | 3.27 × 10⁻³ (N = 6) |
Table 2.
Residual functions associated with approximations for , .
| # | Error Function | Residual Function |
| 1 | ||
| 2 | ||
| 3 |
Table 3.
The transition points, , and the resulting relative error bounds for the spline-based approximations specified by Equation (56). The transition points are based on sampling the interval [0, 5] with 10,000 points.
Table 3.
The transition points, , and the resulting relative error bounds for the spline-based approximations specified by Equation (56). The transition points are based on sampling the interval [0, 5] with 10,000 points.
| Approx. Order: n | Transition Point for | Relative Error Bound for | Transition Point for | Relative Error Bound for |
| 0 | 1.3085 | 0.0851 | 1.465 | 0.0400 |
| 1 | 1.492 | 0.0362 | 1.769 | 0.0126 |
| 2 | 1.658 | 1.95 × 10⁻² | 1.929 | 6.42 × 10⁻³ |
| 3 | 1.8975 | 7.36 × 10⁻³ | 2.1725 | 2.13 × 10⁻³ |
| 4 | 2.3715 | 1.03 × 10⁻³ | 2.6305 | 2.28 × 10⁻⁴ |
| 6 | 2.4715 | 4.75 × 10⁻⁴ | 2.73 | 1.13 × 10⁻⁴ |
| 8 | 2.963 | 2.79 × 10⁻⁵ | 3.1855 | 6.69 × 10⁻⁶ |
| 10 | 3.0785 | 1.35 × 10⁻⁵ | 3.324 | 2.59 × 10⁻⁶ |
| 12 | 3.4625 | 9.78 × 10⁻⁷ | 3.67 | 2.12 × 10⁻⁷ |
| 14 | 3.5845 | 4.00 × 10⁻⁷ | 3.8205 | 6.57 × 10⁻⁸ |
| 16 | 3.9025 | 3.44 × 10⁻⁸ | 4.101 | 6.66 × 10⁻⁹ |
| 18 | 4.0285 | 1.22 × 10⁻⁸ | 4.257 | 1.75 × 10⁻⁹ |
| 20 | 4.300 | 1.20 × 10⁻⁹ | 4.493 | 2.11 × 10⁻¹⁰ |
| 22 | 4.429 | 3.76 × 10⁻¹⁰ | 4.652 | 4.75 × 10⁻¹¹ |
| 24 | 4.6655 | 4.18 × 10⁻¹¹ | 4.854 | 6.70 × 10⁻¹² |
Table 4.
The transition points, and resulting relative error bounds, for Taylor series approximations specified by Equation (59). The transition points are based on sampling the interval [0, 4] with 10,000 points.
Table 4.
The transition points, and resulting relative error bounds, for Taylor series approximations specified by Equation (59). The transition points are based on sampling the interval [0, 4] with 10,000 points.
| Order: | ||
| 1 | 0.8864 | 0.266 |
| 3 | 1.078 | 0.146 |
| 5 | 1.222 | 0.0917 |
| 7 | 1.344 | 0.0609 |
| 9 | 1.4532 | 0.0416 |
| 13 | 1.6452 | 0.0204 |
| 17 | 1.8144 | 0.0105 |
| 21 | 1.9672 | 5.44 × 10⁻³ |
| 25 | 2.1084 | 2.89 × 10⁻³ |
| 29 | 2.24 | 1.55 × 10⁻³ |
| 37 | 2.4812 | 4.53 × 10⁻⁴ |
| 45 | 2.70 | 1.35 × 10⁻⁴ |
| 53 | 2.902 | 4.09 × 10⁻⁵ |
| 61 | 3.09 | 1.24 × 10⁻⁵ |
Table 5.
Transition point and relative error bound for the four equal subintervals case. The transition points are based on sampling the interval [0, 8] with 10,000 points.
Table 5.
Transition point and relative error bound for the four equal subintervals case. The transition points are based on sampling the interval [0, 8] with 10,000 points.
| Spline Order | Transition Point | Relative Error Bound |
|---|---|---|
| 0 | 2.7016 | 5.32 × 10⁻³ |
| 1 | 3.292 | 7.21 × 10⁻⁵ |
| 2 | 3.4544 | 1.27 × 10⁻⁶ |
| 4 | 3.7208 | 1.43 × 10⁻⁷ |
| 8 | 4.6616 | 4.34 × 10⁻¹¹ |
| 12 | 5.6784 | 9.75 × 10⁻¹⁶ |
| 16 | 6.3736 | 2.01 × 10⁻¹⁹ |
| 20 | 7.1544 | 4.62 × 10⁻²⁴ |
| 24 | 7.7136 | 1.06 × 10⁻²⁷ |
Table 6.
Transition point and relative error bound for the 16 equal subintervals case. The transition points are based on sampling the interval [0, 12] with 10,000 points.
Table 6.
Transition point and relative error bound for the 16 equal subintervals case. The transition points are based on sampling the interval [0, 12] with 10,000 points.
| Spline Order | Transition Point | Relative Error Bound |
|---|---|---|
| 0 | 5.5008 | 3.32 × 10⁻⁴ |
| 1 | 6.8796 | 2.82 × 10⁻⁷ |
| 2 | 7.0224 | 3.14 × 10⁻¹⁰ |
| 4 | 7.1544 | 4.82 × 10⁻¹⁶ |
| 8 | 7.5996 | 6.22 × 10⁻²⁷ |
| 12 | 8.2032 | 4.16 × 10⁻³¹ |
| 16 | 8.9244 | 1.66 × 10−36 |
| 20 | 9.7284 | 4.68 × 10−43 |
| 24 | 10.584 | 1.21 × 10−50 |
Table 7.
Coefficient values for the case of .
| k | Definition for | |
| 1 | 5.204998778 × 10⁻¹ | |
| 2 | 3.222009151 × 10⁻¹ | |
| 3 | 1.234043535 × 10⁻¹ | |
| 4 | 2.921711854 × 10⁻² | |
| 5 | 4.270782964 × 10⁻³ | |
| 6 | 3.848615204 × 10⁻⁴ | |
| 7 | 2.134739863 × 10⁻⁵ | |
| 8 | 7.276811144 × 10⁻⁷ | |
| 9 | 1.522064186 × 10⁻⁸ | |
| 10 | 1.950785844 × 10⁻¹⁰ | |
| 11 | 1.530101947 × 10⁻¹² | |
| 12 | 7.336328181 × 10⁻¹⁵ |
Table 8.
Relative error bounds, over the interval , for approximations to as defined in Theorem 7.
| Order of Approx. | Relative Error Bound: Original Series—Optimum Transition Point (Table 3) | Relative Error Bound: Approx. Defined by Equation (83) |
| 0 | 0.0851 | 2.68 × 10⁻² |
| 1 | 0.0362 | 3.98 × 10⁻³ |
| 2 | 1.95 × 10⁻² | 1.34 × 10⁻³ |
| 3 | 7.36 × 10⁻³ | 2.03 × 10⁻⁴ |
| 4 | 1.03 × 10⁻³ | 1.82 × 10⁻⁵ |
| 6 | 4.75 × 10⁻⁴ | 9.20 × 10⁻⁷ |
| 8 | 2.79 × 10⁻⁵ | 1.69 × 10⁻⁸ |
| 10 | 1.35 × 10⁻⁵ | 7.43 × 10⁻¹⁰ |
| 12 | 9.78 × 10⁻⁷ | 1.67 × 10⁻¹¹ |
| 14 | 4.00 × 10⁻⁷ | 6.47 × 10⁻¹³ |
| 16 | 3.44 × 10⁻⁸ | 1.68 × 10⁻¹⁴ |
| 18 | 1.22 × 10⁻⁸ | 5.90 × 10⁻¹⁶ |
| 20 | 1.20 × 10⁻⁹ | 1.73 × 10⁻¹⁷ |
| 22 | 3.76 × 10⁻¹⁰ | 5.56 × 10⁻¹⁹ |
| 24 | 4.18 × 10⁻¹¹ | 1.79 × 10⁻²⁰ |
Table 9.
Approximations that are consistent with a set relative error bound. The actual relative error bound is specified by .
Table 9.
Approximations that are consistent with a set relative error bound. The actual relative error bound is specified by .
| Relative Error Bound | Spline Approx: Theorem 4 | Variable Interval Approx: Theorem 5 | Dynamic Constant Plus Spline Approx: Theorem 6 | Iterative Approx: Theorem 7 |
| 10−6 | ||||
| 10−10 | ||||
| 10−16 |
Table 10.
Relative error bounds for approximations over the interval .
| Order of Approx. | Relative Error Bound: Equation (103) | Relative Error Bound: Equation (77) of [19] |
| 0 | 8.00 | 35.6 |
| 1 | 3.74 | 6.98 |
| 2 | 0.957 | 0.767 |
| 3 | 1.25 × 10⁻¹ | 5.25 × 10⁻² |
| 4 | 8.04 × 10⁻³ | 2.42 × 10⁻³ |
| 5 | 7.71 × 10⁻³ | 7.98 × 10⁻⁵ |
| 6 | 2.09 × 10⁻³ | 1.97 × 10⁻⁶ |
| 7 | 3.72 × 10⁻⁴ | 3.75 × 10⁻⁸ |
| 8 | 5.02 × 10⁻⁵ | 5.69 × 10⁻¹⁰ |
| 10 | 4.54 × 10⁻⁷ | 7.22 × 10⁻¹⁴ |
| 12 | 1.09 × 10⁻⁹ | 4.62 × 10⁻¹⁸ |
Publisher’s Note: MDPI stays neutral with regard to jurisdictional claims in published maps and institutional affiliations. |
© 2022 by the author. Licensee MDPI, Basel, Switzerland. This article is an open access article distributed under the terms and conditions of the Creative Commons Attribution (CC BY) license (https://creativecommons.org/licenses/by/4.0/).
Share and Cite
MDPI and ACS Style
Howard, R.M. Arbitrarily Accurate Analytical Approximations for the Error Function. Math. Comput. Appl. 2022, 27, 14. https://doi.org/10.3390/mca27010014
AMA Style
Howard RM. Arbitrarily Accurate Analytical Approximations for the Error Function. Mathematical and Computational Applications. 2022; 27(1):14. https://doi.org/10.3390/mca27010014
Chicago/Turabian StyleHoward, Roy M. 2022. "Arbitrarily Accurate Analytical Approximations for the Error Function" Mathematical and Computational Applications 27, no. 1: 14. https://doi.org/10.3390/mca27010014