Article

A Model Proposal for a Multi-Objective and Multi-Criteria Vehicle Assignment Problem: An Application for a Security Organization

1
Turkish Military Academy, Defense Sciences Institute, Çankaya, Ankara 06400, Turkey
2
Industrial Engineering Department, Turkish Military Academy, Çankaya, Ankara 06400, Turkey
*
Author to whom correspondence should be addressed.
Math. Comput. Appl. 2016, 21(4), 39; https://doi.org/10.3390/mca21040039
Submission received: 15 March 2016 / Revised: 19 August 2016 / Accepted: 1 September 2016 / Published: 26 September 2016

Abstract

:
Law enforcement agencies have great importance to provide peace and prosperity for the community. If the quality level of policing services is high, stability within the country will also increase. The law enforcement authorities transfer their policing services to people by means of using tools and equipment. In this study, this subject has been studied in order to improve the service quality of motor vehicles to increase efficiency in the assignments area. For the assignment of the vehicle, four main criteria and fifteen sub-criteria are defined. The criteria’s weights achieving the desired goal are calculated using the Analytic Network Process (ANP). The obtained weights have been subjected to the evaluation of performance in terms of each vehicle and each region where it can be assigned. The decision model with four basic objectives, containing service, cost, time and usage of technical capacity to ensure the use of vehicles at optimum efficiency, is designed. After weighting of the criteria, a mathematical model aiming at maximizing the service and the effectiveness of using the technical capacity of vehicle and minimizing the time and cost has been developed. The results are compared with the current situation. The study has been tested with three different scenarios having different objective priorities.

1. Introduction

Living in peace and prosperity is very important for individuals as members of the community. Police are one of the most ubiquitous representatives of the government, and citizens’ confidence in the government likely affects their confidence in the police. Citizens expect their police to respond effectively to crime. While most causes of crime are beyond police purview, the public requires police to respond promptly to their concerns and secure their neighborhoods [1]. Security and safety services are provided by various public and private law enforcement agencies or organizations across the country; the general directorate of security within the boundaries of the municipality and gendarmerie in rural areas. The quality and effectiveness of services depend on the level of training of law enforcement and the effective use of equipment.
The multi-criteria and multi-objective model, which will make the distribution of vehicles used in the district, is proposed as a part of a study on the effective use of equipment. It was needed for the vehicle assignment model to improve efficiency. Assignment problems are considered as a special case for transportation problems. When we consider transportation and assignment problems as real-life problems, a variety of purposes emerge in the creation of models. While in the classic assignment problem, we assign a task to an agent or an agent to a task, in real-life problems, we can assign more than one agent to a task or more than one task to an agent. In real-life problems, many criteria that affect the assignment are available. All of the assignment criteria have different weights. Weighting of the criteria is accomplished by the Analytic Network Process (ANP), which is the most comprehensive framework for the analysis of societal, governmental and corporate decisions that is available today to the decision-maker [2] because of the criteria’s interaction with each other. With the proposed model, motor vehicles have been assigned to the appropriate district that has different characteristics.
In this study, the optimal solution of the multi-objective and multi-criteria vehicle assignment problem has been examined. An application tested in a province, which depends on the organization that is responsible for providing policing and the solution of the application, has been acquired for the province. Previous studies on this subject have been examined with a literature survey in Section 2, and the ANP approach and the general assignment model are briefly summarized in Section 3. A model has been proposed in Section 4. The proposed model has been applied on a sample province, and the results of the assignment obtained from the mathematical model have been evaluated in Section 5. In the last section, there are also recommendations for future studies, and a general assessment has been made.

2. Literature Survey

In this study, the literature survey has been examined under five main titles. These are studies about the assignment model, studies using multi-objective assignment models, studies using mathematical modeling with the Multiple Criteria Decision-Making (MCDM) techniques, studies about vehicle selection and studies about the quality of security service.

2.1. Studies about the Assignment Model

Assignment models are used in many areas, such as classic assignment, resource allocation, course scheduling, fleet assignment, assignment placement, making the distribution of tasks and the assignment of personnel to the task. The previous studies about using the assignment models were examined under three main headings [3].

2.1.1. Model with at Most One Task per Agent

Caron et al. [4] use a kind of classical assignment model, for which there are m agents and n tasks, and not every agent is assigned to do every task. The bottleneck Assignment Problem (AP) is presented by Ravindran [5], which minimizes the transportation cost of perishable food from warehouses to markets. A variation of the classic AP is studied by Dell’Amico and Martello [6] about which there are m agents and n tasks, but only k of the agents and tasks are to be assigned, where k is less than both m and n. The presented balanced assignment problem [7] is about planning a program of trips from the U.S. to Europe, minimizing the dates of difference between leaving and returning flights. There are some improved forms of the listed models, such as the lexicographic bottleneck model, the k assignment model, the semi-assignment problem, the categorized assignment problem, the fractional assignment problem, the assignment problem with side constraints, the multi-criteria assignment problem, the quadratic assignment problem, the robust assignment problem and the generalized assignment problem [3].

2.1.2. Models with Multiple Tasks per Agent

The generalized assignment model, which is based on branch and bound, is proposed by Cattrysse and Van Wassenhove [8]. The bottleneck generalized assignment problem (GAP) that includes many applications in scheduling and allocation problems was studied by Martello and Toth [9]. The multiple resource generalized assignment problem about resource planning with the Lagrangian relaxation methodology is presented by Le Blanc et al. [10]. There are some improved models of GAP, such as the multiple resource GAP, the bottleneck GAP and the quadratic generalized assignment problem. Aora and Puri [11] study the variation of the bottleneck assignment problem, which is called the imbalanced time minimizing assignment problem.

2.1.3. Multi-Dimensional Assignment Problem

All of the models listed above are two-dimensional, meaning that the problem is one of optimally matching the members of two sets. However, in some cases, the problem is one of matching the members of three or more sets, and the most common problems are clusters of three elements. These models are as follows: the planar three-dimensional assignment problem is studied by Gilbert et al. [12]; the axial there-dimensional assignment problem is discussed by Gilbert and Hofstra [13]; the three-dimensional bottleneck assignment problem is discussed by Malhotra et al. [14]; and Franz and Miller have studied multi-period assignment problems [15].

2.2. Studies Using Multi-Objective Assignment Models

After examining the area of current assignment models used in the literature, solution-based and hybrid structure studies related to multi-objective assignment problems have been examined. Yang and Chou [16] studied multi-objective optimization for manpower assignment in consulting engineering firms and the solution of the model compared with using the Strength Pareto Evolutionary Algorithm (SPEA) and optimization modelling software, which is called LINGO. The goal programming approach for a multi-objective multi-choice assignment problem is studied by Mehlawat [17]. A study of military personnel appointment and the analysis of the action style under six different strategies [18], a multi-objective assignment model about the assignment of an agent to tasks [19], an assignment model used for a stochastic flow network for the maximization of system reliability and the minimization of cost [20], a fleet assignment using the Taguchi-based DNA algorithm [21], a multi-objective resource assignment problem within the supply chain of the products [22], fuzzy multi-criteria decision-making methods for dual-objective personnel assignments [23] and an application for three objective assignment problems [24] are some examples of multi-objectivity.

2.3. Studies Using Mathematical Modeling with the MCDM Techniques

On the other hand, some real-life problem studies that have many criteria are analyzed in assignment problems. Therefore, using mathematical modelling with MCDM techniques are examined. A study involving the selection of one of three different drivers with Zero-One Goal Programming (ZOGP) is studied by Schniederjans and Garvin [25]. A combination of the Analytic Hierarchy Process (AHP) and Goal Programming (GP) for a global facility location-allocation model is proposed by Badri [26]. Lee and Kim studied using the ANP-GP integrated model for interdependent information system project selection, and with this model, the most appropriate project is selected from six different projects [27]. Karsak [28] studied product planning in quality function deployment using a combined ANP-GP approach. Chang et al. [29] proposed an integrated model using ANP-GP for revitalization strategies in historic transport, and with this model, they chose the most appropriate project through seven different projects for the Alishan Forest Railway. Yan et al. studied the prioritized weighted aggregation in MDCD [30]. An ANP-GP-based integrated study of the problem of resource allocation in transportation [31], a study about exams weighted with ANP [32], the applications of the multi-objective and criteria decision-making process [33], a goal programming approach for the multi-purpose and multi-choice assignment problem [34] and a study of the scheduling of classes in a school [35] can be mentioned as examples for this area.

2.4. Studies about Vehicle Selection

Byun [36] proposed the AHP approach for selecting an automobile purchase model, which may affect the vehicle selection criteria to select the best car among three different cars. A multi-criteria optimization method for the vehicle assignment problem in a bus transportation company is studied by Zak et al. [37]; the routes of the buses are found to minimize the cost of transportation. Apak et al. [38] studied an AHP approach with a novel framework for luxury car selection. Seven criteria and criteria weights are determined for the personal vehicle selection by this proposed model. Nine criteria have been identified, and eight alternatives were ranked according to their weights by Gungor and Isler [39], who studied automobile selection with the AHP approach. Selecting the best panelvan car by using the Promethee method is studied by Soba [40]; one of the six vehicles has been selected with this proposed model, and six criteria were used in the decision model.

2.5. Studies about the Quality of Security Service

There were studies about the quality of security service, but there was no mathematical model to improve the quality of security service in the literature. Singh [41] studied the influence of internal service quality on the job performance of the Royal Police Department. His survey design was used to reach the research objectives. The specific design was a cross-sectional design, and about 250 questionnaires were distributed to employees in the Royal Police Department. Chen et al. studied the police service quality in rural Taiwan, with comparative analysis of perceptions and satisfaction between police staff and citizens. They used five dimensions, such as tangibility, reliability, responsiveness, assurance and empathy, and the authors tried some practical data analysis techniques, such as descriptive statistics analysis, analysis of means, t-test, factor analysis, Pearson correlation analysis, etc., for the assessment of attributes within respondents’ perceptions and satisfaction [42]. Gherghina’s paper has presented several strategies to increase the performance and quality of local police public service. Gherghina has used the operational elements, such as the marketing process, the design process, the service providing process and the service evaluation process, to determine the services’ quality [43]. Improving service quality for a Spanish police service was studied by Tari, and he used the European Foundation for Quality Management (EFQM) model for self-assessment and process management and to create a valid, reliable instrument aimed at knowing employees’ opinions on the strengths and areas for improvement in the service [44].
In this study, four different objectives have been implemented with the proposed model. As a result of the examination of previous studies, there was no vehicle assignment procedure or proposed model and there was no mathematical model to improve the quality of security service in the literature. The vehicle assignment problem is used especially for vehicle routing or selecting the best car from alternatives in the literature. The model makes the vehicle assignment for the regions that will be the most effective. Each vehicle type has its own characteristics, and the performance of the vehicle will be different in each region; so, the problem is a classical assignment problem, and alternatives are ranked according to their weights. Vehicle assignment was developed using the ANP-Linear Programming (LP) integrated model, which was not found in earlier studies.

3. Methods

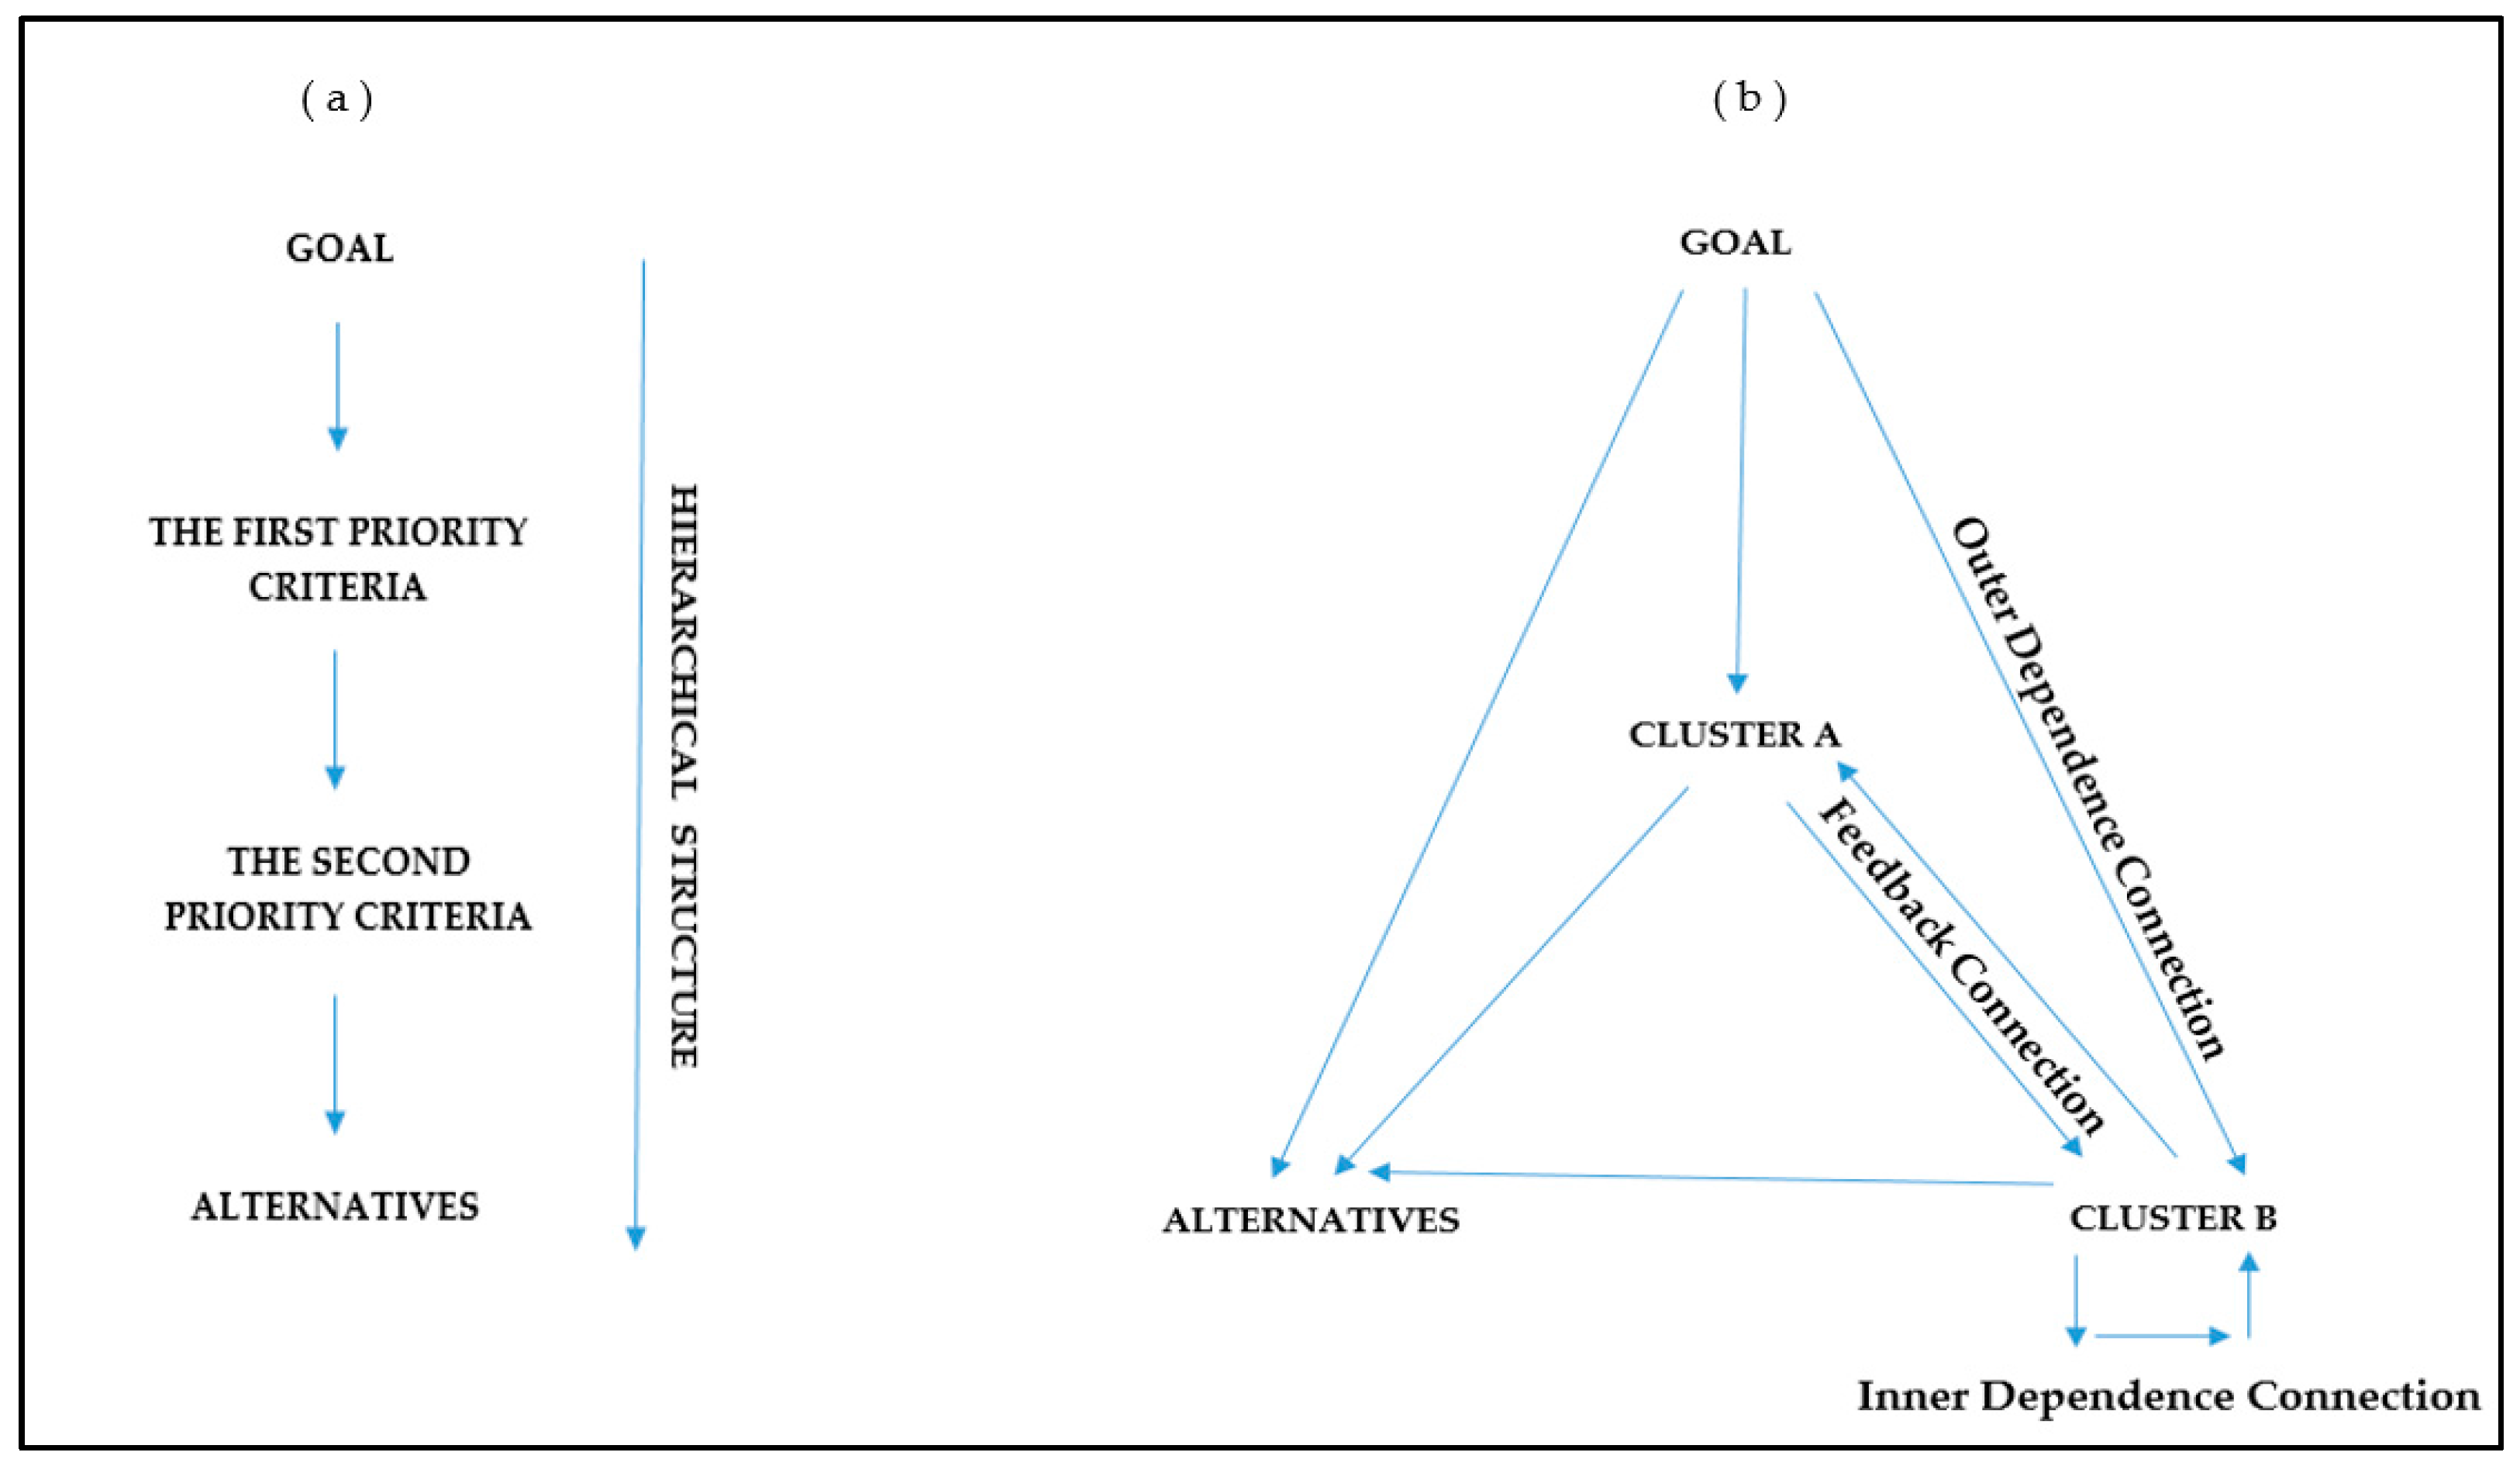
3.1. Analytic Network Process

Problems that are encountered in real-life decision-making consist of some criteria. Decision-makers and researchers have developed various methods to overcome these problems. Among them, the ANP method is one of the most widely-used methods that has been developed by Thomas L. Saaty. ANP can be applied in all areas, and it is easy to use among the MCDM methods [45]. At present, in their effort to simplify and deal with complexity, people who study decision-making use mostly very simple hierarchic structures consisting of a goal, criteria and alternatives [46]. ANP is a generalization of AHP that deals with dependencies. While we assume that criteria are not dependent in the AHP method, we assume that there is a correlation between the main criteria in the ANP method. While hierarchy is a necessity in AHP, it is not a requirement with ANP. The clusters that contain elements are connected by a line in ANP. ANP’s structure is very similar to that of AHP, and they are simple, with three levels of clusters: goal, criteria and alternatives [47].
Most of the decision problems cannot be built on a hierarchical structure, because there is an effect or a dependency from low-level elements to higher level elements. Not only the weight of the criteria determines the importance of the alternatives in the hierarchy, but also the significance of the alternatives determines the weight of the criteria. The results that we want to achieve in the future are shaped through feedback in the ANP method. The AHP method has a linear top to bottom hierarchical structure. There is a relationship between clusters in the same or different levels or ANP having a loop in itself, which is a structure that can interact in any direction [46]. The structural differences are shown between AHP and ANP in Figure 1.
As can be seen in Figure 1, the AHP has a linear structure, but ANP has a network structure. The outgoing arrows from Cluster A to cluster B represents that the cluster B is affected by the A cluster [48]. In general, a network structure consists of components, and a component consists of elements. However, for the network structure in problems that have a complex decision-making progress, we have a system that is composed of subsystems, each subsystem composed of components and each component containing elements. The desired result is obtained by the sum of all components [46]. In a network structure, if a component affects another component, it shows that there is an outer dependency between the two components, but if elements in a component affect each other, there is an inner dependency, which is shown by an arrow that goes out from a component and then enters the same component again. If there is a two-way arrow, this means that there is a feedback between two components. This situation is shown in Figure 1b.
The analysis and evaluation of decisions include the process of recognizing, quantifying and comparing the benefits and costs of decision criteria. Each decision requires an evaluation for determining whether or not it represents an efficient use of resources (e.g., time, money, energy, etc.). For decision problems containing tangible and intangible evaluation criteria, MCDM methods are employed when the intangible decision criteria are difficult to quantify and monetize. From among the MCDM techniques, the analytic hierarchy process and its extended version, the analytic network process has been used by many scientists, researchers and practitioners [49]. The ANP is a holistic approach useful to analyze causal influences and their effects in which all of the factors and criteria involved are laid out in advance in a hierarchy or in a network system that allows for dependencies [50]. The ANP methodology is beneficial in considering both qualitative, as well as quantitative characteristics that need to be considered, as well as taking the non-linear interdependent relationship among the attributes into consideration [51]. AHP models a decision-making framework that assumes a uni-directional hierarchical relationship among decision levels, whereas ANP allows for a more complex relationship among the decision levels and attributes, as it does not require a strict hierarchical structure. In decision-making problems, it is very important to consider the interdependent relationship among criteria because of the characteristics of interdependence that exist in real-life problems. The ANP methodology allows for the consideration of interdependencies among and between levels of criteria and, thus, is an attractive multi-criteria decision-making tool. This feature makes it superior from AHP, which fails to capture interdependencies among different enablers, criteria and sub-criteria. ANP is unique in the sense that it provides synthetic scores, which is an indicator of the relative ranking of different alternatives available to the decision-maker [52]. The ANP is better than AHP because it contains a variety of interactions, dependences and feedback among the elements at the different levels [53]. The ANP method can be considered as an upper level and more common than AHP, and it offers more effective and realistic solutions for the complex multi-criteria decision problems [2].

3.2. The General Assignment Model in Linear Programming

Linear Programming (LP) is one of the techniques to solve mathematical problems. It uses in some areas, such as urban planning, investment, production planning and inventory control, man power planning. The Transportation Problem (TP) deals with the transportation of goods from a set of supply points (factories) to a set of demand points (customers), so as to minimize linear transportation costs; transportation models can be used in some areas, such as inventory control, labor planning, site selection, etc. [54]. Hitchcock first developed the basic TP, which can be modelled as a standard linear programming problem [55]. The assignment problem is one of the special cases of transportation problems. The goal of the assignment problem is to minimize the cost or time of completing a number of jobs by a number of persons. An important characteristic of the assignment problem is that the number of sources is equal to the number of destinations. The agents represent the source, and the tasks represent the destinations. In terms of cost, while transporting costs are minimized in the transportation model, the costs of workers are minimized in the assignment models [56]. Assignment models can be used in areas such as the distribution of jobs to a machine, assigning people, etc. The general assignment model is shown below [57]:
min i = 1 n j = 1 n c i j · x i j   ( c i j 0 ) s . t .        j = 1 n x i j = 1 for   i   I i   = 1 n x i j = 1   for   j   J x i j   { 0 , 1 }   for   ( i , j )   K .
Let X denote a feasible solution of (1). In a simplex-type algorithm, X is highly degenerate and consists of exactly n variables with the value 1; the remaining n2 − n variables have the value 0. Defining w = {(i,j) | xij = 1, xij ∈ X}, w constitutes the assignment corresponding to X. Often, (1) is practically interpreted as n jobs that must be performed by n workers at minimal total cost, and cij is the job cost associated with worker i performing job j. Here, w implies that each job must be assigned to one and only one worker, and vice versa. In the model, all cij values are deterministic [58].

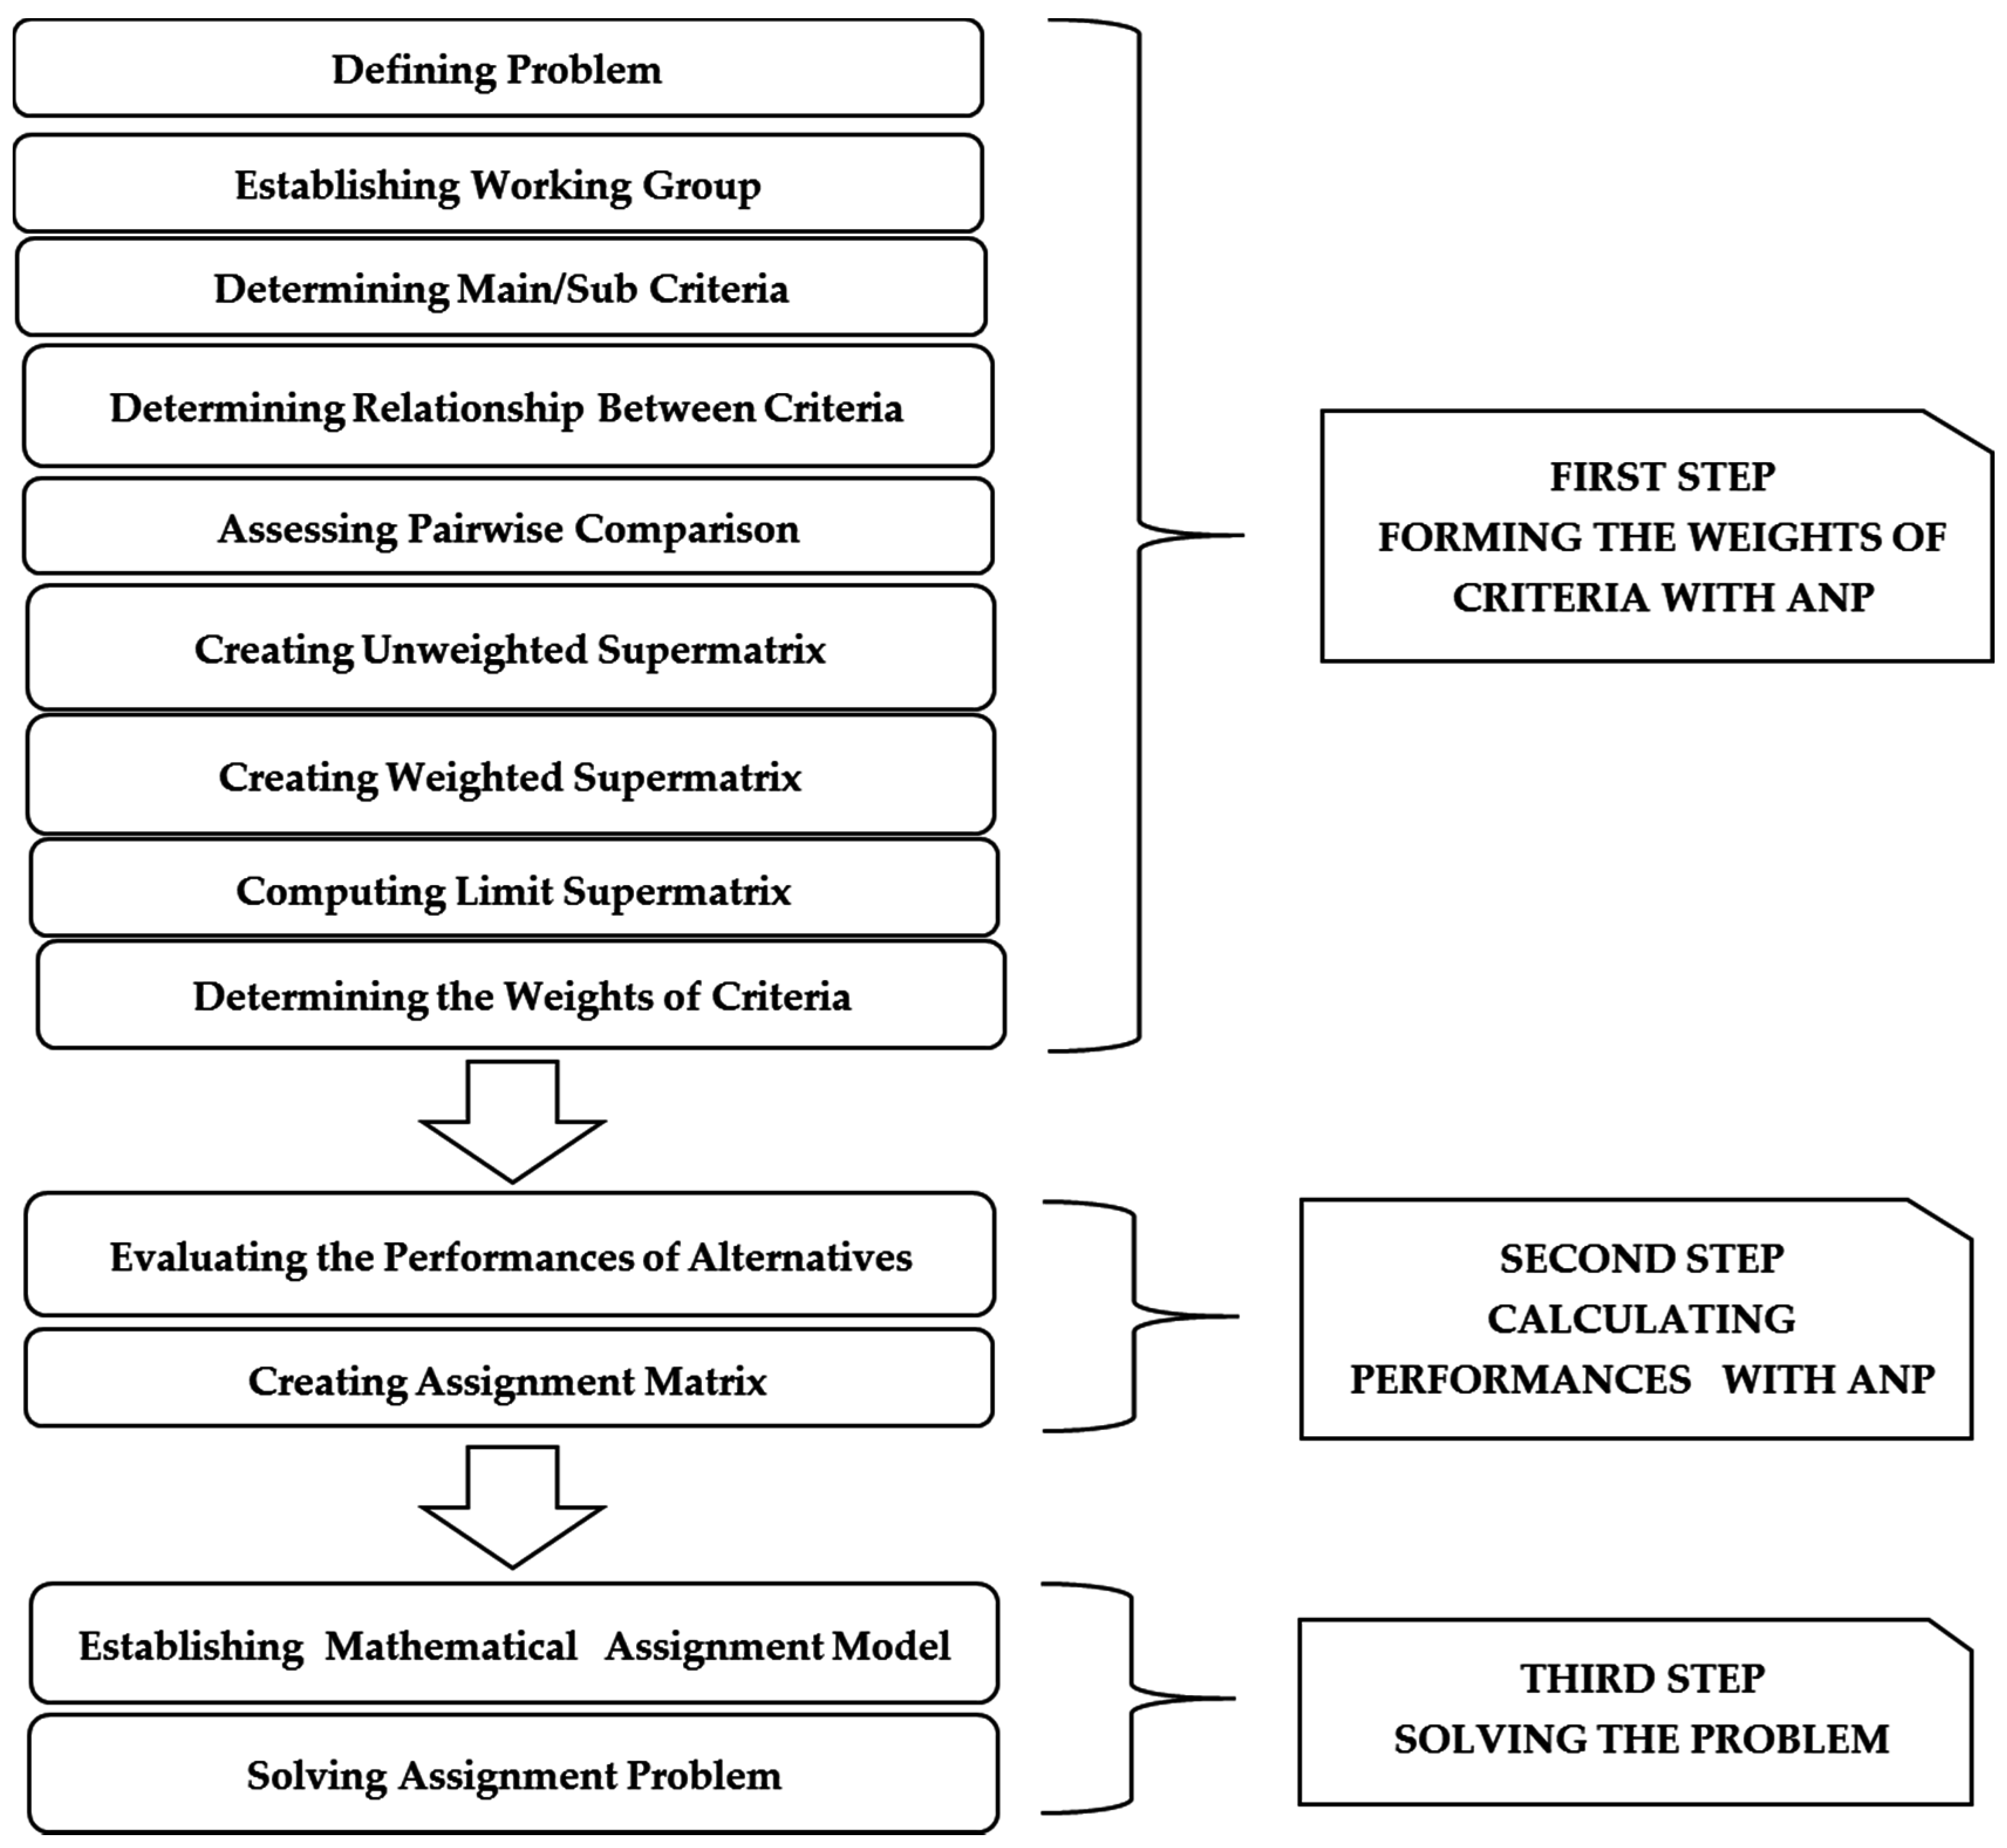
4. Proposed Multi-Criteria and Multi Objective Assignment Hybrid Methodology

The steps of the proposed methodology based on the Deming cycle, and Bank [59] has developed the common procedure of the structured problem solving, which will give us a snapshot of the structured problem solving. Bank said that there are six steps in the problem-solving process. These steps are: identifying and selecting problem, analyzing the problem cause, generating potential solutions, selecting and planning the best solution, implementing the solution and evaluating the solution [60]. These steps of problem solving are combined with ANP’s step, and the vehicle assignment process, which is shown in Figure 2, is formed.
  • First step: using the ANP method for the calculation of the main/sub-criteria weight,
  • Second step: evaluating the performance values of assigned vehicles for each district,
  • Third step: modeling the assignment and realizing the vehicle assignment.
The ANP-LP hybrid approach is used in this process. The weights of criteria and the performance of alternatives will be determined with the ANP approach, and then, the linear programming approach is used to provide the maximum value of performance in the model that presents the solution. ANP is the method that is used in the first step. In the second step, the performances of all alternatives are evaluated under the criteria, shown in Figure 3 which are determined by a working group to assign a vehicle to any district also by using the “ratings” section in ANP’s software, which is called SuperDecision. In the third step, the mathematical model is encoded and solved by the GAMS Solver.

5. Illustrative Example

5.1. Forming the Weights of the Criteria with ANP (First Step)

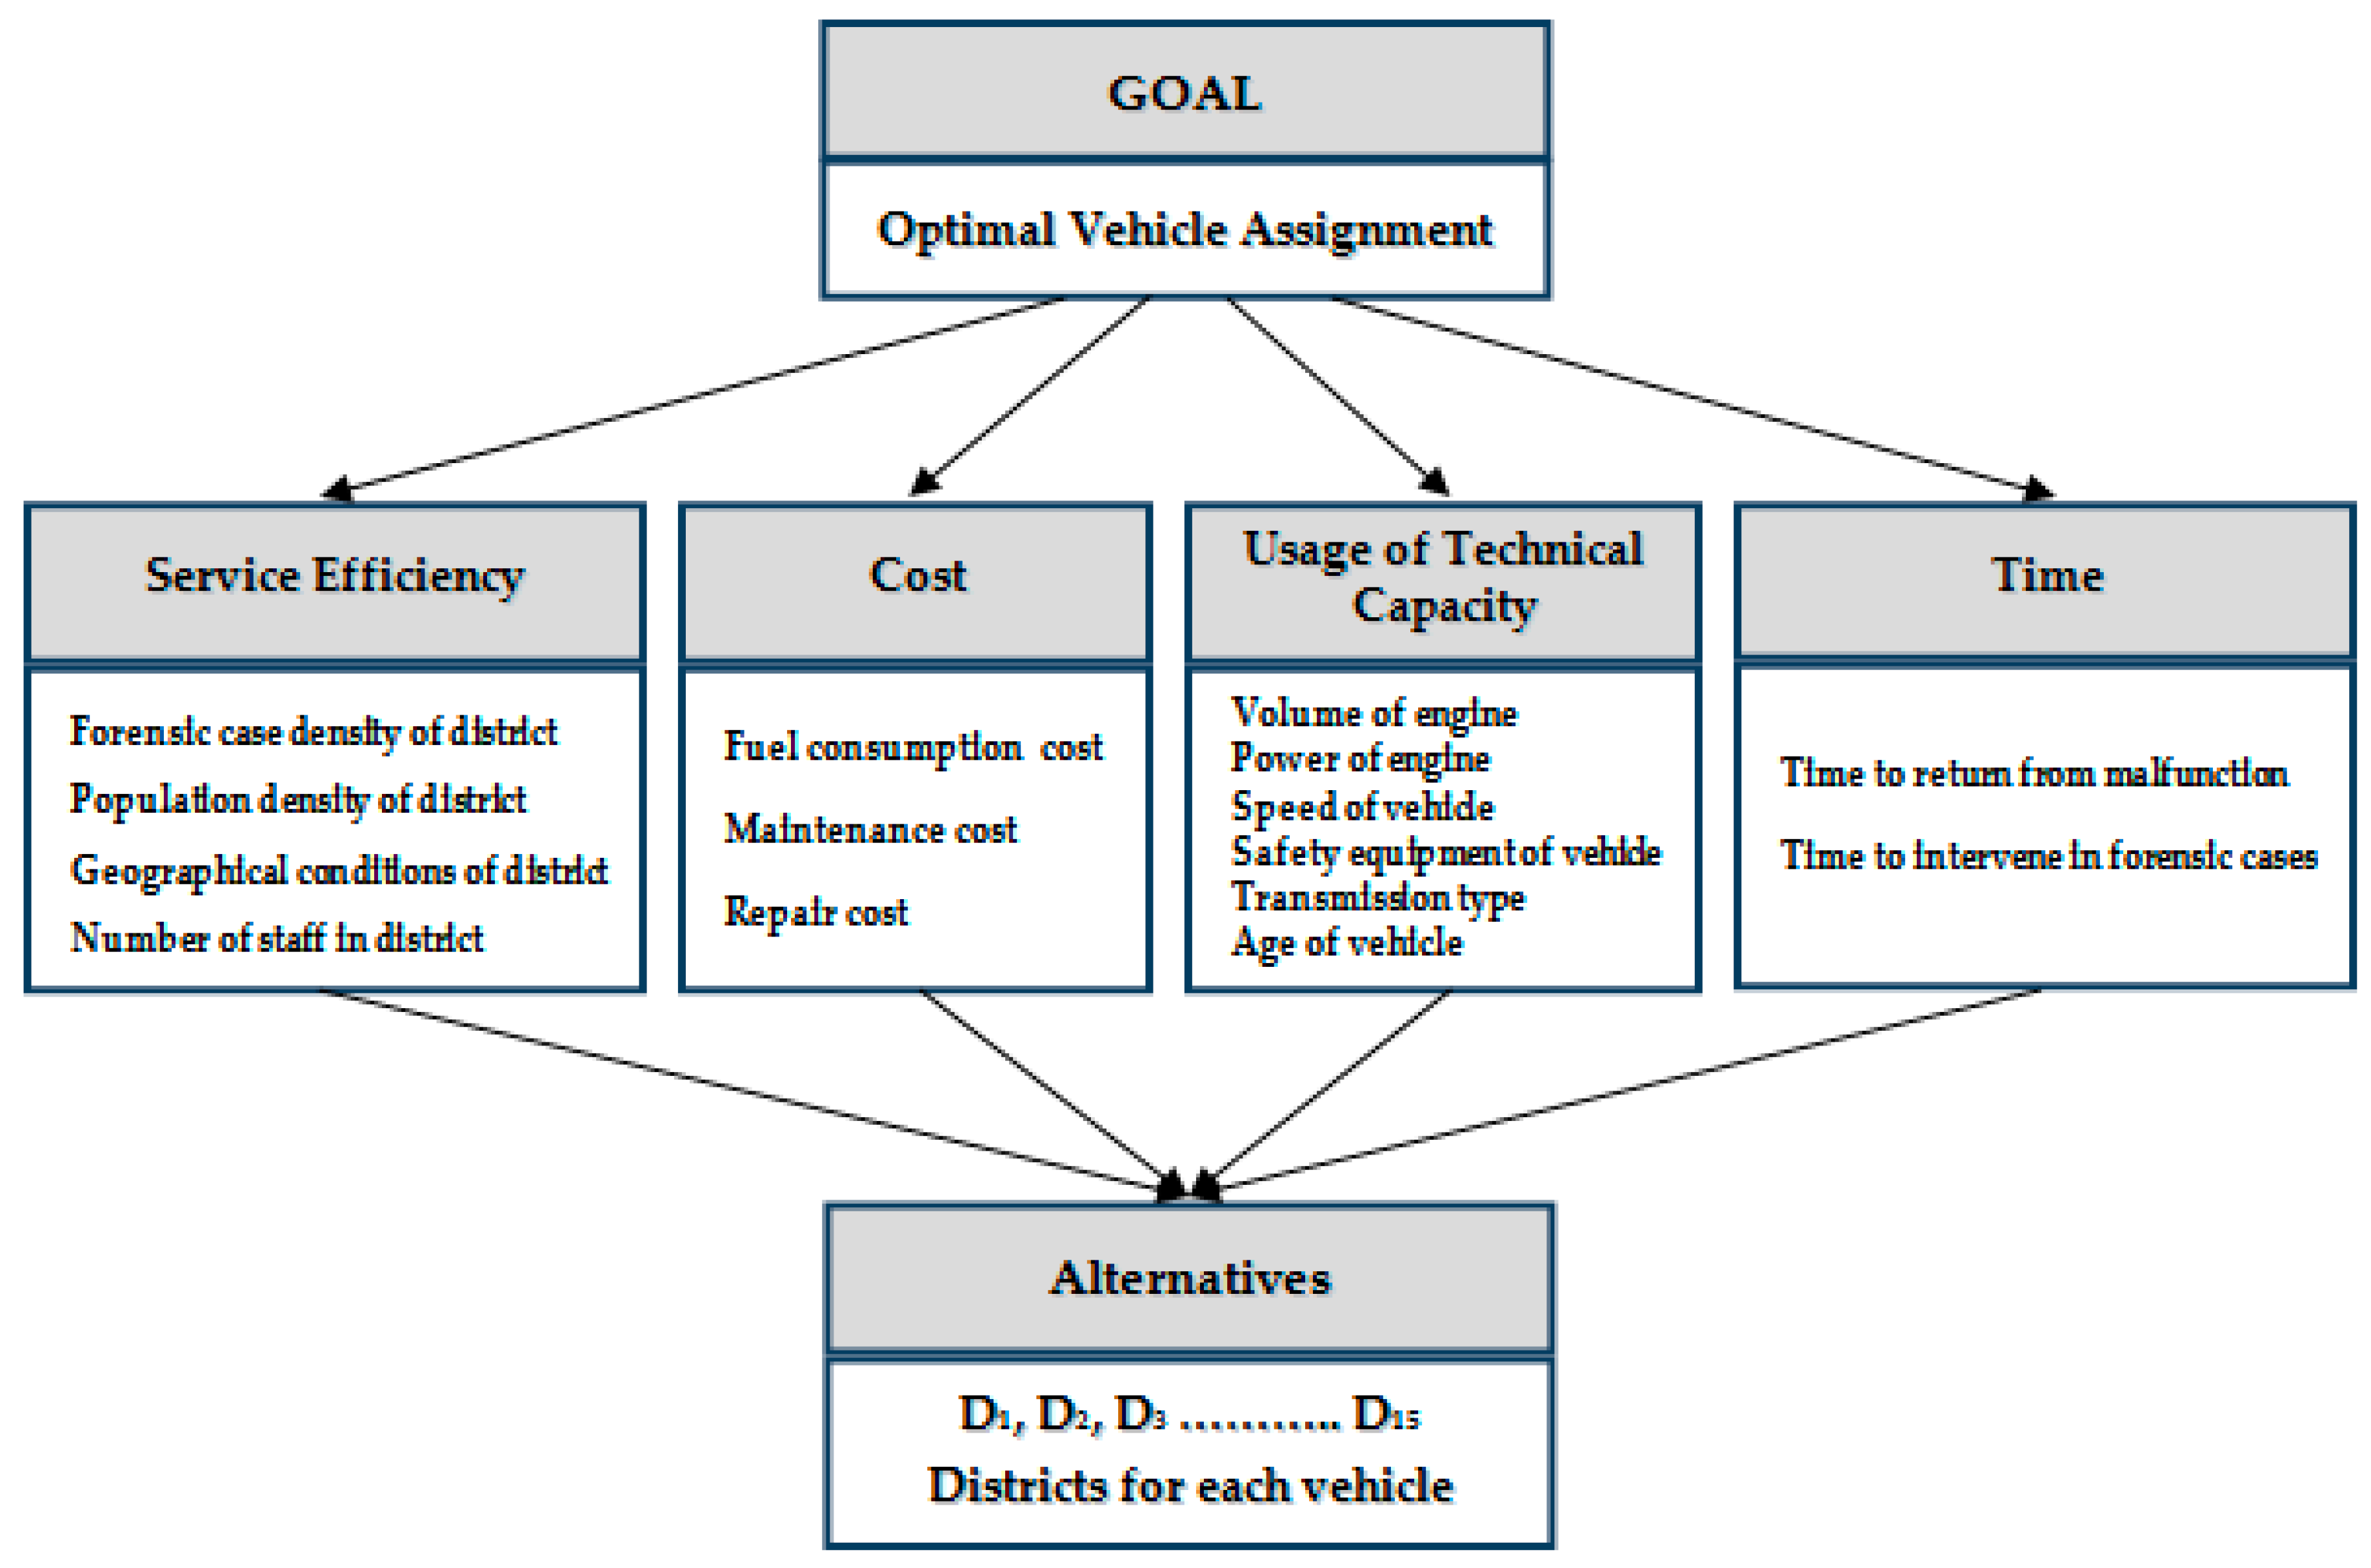
5.1.1. Problem Formulation

Security forces being visible is considered as one of the most important factors to lessen the sense of insecurity that citizens have. Citizens would like to see the security forces more often and their reacting on time to feel confidence. Therefore, public institutions perform security services by means of pedestrian and motorized patrol. Besides giving an efficient service, motorized patrols are important because of creating a strong and positive image in the public. We need a vehicle that runs without a hitch and that has a low failure rate for the realization of the motorized patrol services. Patrol vehicles work all day, and older vehicles are inadequate to provide service. Planning and optimization of the objectives of security services become a necessity regarding the burden of maintenance and repair costs and the fuel consumption of the old cars on a budget.
Today, radical changes in global security, asymmetric threats, uncertainties and technological advances give direction to the design of vehicles that have new features. The diversity of vehicle types for law enforcement agencies that perform different tasks all over the country has increased. Cars have too much diversity due to the variety of tasks, and classification is required. Four basic classifications are administrative vehicles, tactical vehicles, patrol vehicles and traffic vehicles. There are two types of patrol vehicles: Type-I is used on a road, and Type-II, which has a 4 × 4 transmission, is used on highlands. In a system that has much vehicle diversity, vehicle assignment should be made by scientific methods in order to perform security services effectively. The necessity of creating a mathematical model has emerged in order to assign the vehicles to the districts. There are four main objectives including service efficiency, usage of technical capacity, cost and time. The objectives to be achieved with the model are presented below.
With the maximization of service efficiency:
  • Assigning large-capacity vehicles to populous district
  • Assigning large-capacity vehicles to districts with a high density of forensic cases
  • Assigning large-capacity vehicles to districts that have many policing personnel
  • Assigning 4 × 4 type vehicles to high altitude districts.
With the maximization of the usage of technical capacity:
  • Assigning high-speed vehicles to districts that have plain terrain
  • Assigning vehicles that have an adequate level of safety equipment, to the district where the accidents occur more frequently
  • Using vehicles with high motor power in high altitudes
  • Using vehicle with high motor volume in high altitudes
  • Assigning relatively new vehicles to districts with a high density of desired purposes
With the minimization of cost:
  • Assigning vehicles to district which will have minimum fuel consumption cost
  • Minimizing maintenance cost and repair, which can change from district to district
In addition to these are minimizing time and diminishing the time to return from malfunction to use and time to intervene in forensic cases.

5.1.2. Creating Working Group

The selected working group has participated in the decision-making process to determine the main/sub-criteria, the relationship between criteria, the priorities of the vehicle performance in a district and to make pair-wise comparisons.

5.1.3. Determining Main and Sub-Criteria

The decision-making group has studied which criteria can be effective to assign a vehicle to any district. Four main and fifteen sub-criteria, which form the main framework of the model, have been identified. The criteria are shown in Figure 3.

5.1.4. Determining the Relationship between Criteria

Four different clusters of main criteria are formed, and the sub-criteria are integrated in these clusters with the SuperDecision software program (The Creative Decision foundation, Pittsburgh, PA, USA). The face to face interview form, which has comparisons about the goal and criteria, is applied to the decision-making group, which includes four experts who study security and transportation. As a result of using this survey, the main criteria are affected by each other, and all of the main criteria clusters have inner dependency, except the time cluster.

5.1.5. Making Pair-Wise Comparisons

After relations between criteria are revealed, the face to face interview form is created with one-hundred-sixty-five questions in the software program in order to measure the pair-wise comparisons between criteria. The form has been answered by the study group. The geometric means of the answers that are given by the experts are taken. The geometric means are entered in the software program’s interface. The question of how many times a criterion is more important than the others has been answered with pair-wise comparisons of criteria. Pair-wise comparisons are formed in SuperDecision, and each pair-wise comparison is performed.
Pair-wise comparisons are evaluated for each criterion and cluster that affects each other, and one-hundred-sixty-five pair-wise comparisons, which are answered by experts, have been entered into the SuperDecision software program. After completion of pair-wise comparisons, the inconsistency value of each pair-wise comparison is calculated. For instance, one of the values of inconsistency is calculated as 0.00168 and this inconsistency value is less than 0.1, so the reliability of the pair-wise comparison is acceptable. The inconsistency values of all pair-wise comparisons that are used in this study have been checked, and all of them are under 0.1. Thus, the reliability of the model is increased by testing all inconsistency rates of the pair-wise comparisons.

5.1.6. Creating Unweighted Supermatrix

Following pair-wise comparisons, the matrix structure that combines weight of criteria in the model is formed. This matrix structure is called an unweighted supermatrix. The supermatrix structure consists of sub-matrices, and the columns of each sub-matrix are normalized in order to obtain the stochastic matrix at the next phase. The unweighted supermatrix transforms the relation between criteria to the matrix structure. If there is no relation between two criteria, the relevant cell will be zero in the unweighted supermatrix. The weighting of the matrix will be in the next step.

5.1.7. Creating the Weighted Supermatrix

The weighted supermatrix is obtained by multiplying the cluster matrix and unweighted supermatrix. In other words, the weighted supermatrix is obtained by multiplying the eigenvector and the unweighted supermatrix. While the columns of each sub-matrix are normalized in the unweighted supermatrix, the columns of the main matrix structure are normalized in the weighted supermatrix. The columns of the main matrix are normalized in order to obtain the stochastic matrix in the weighted supermatrix. Therefore, the limit of the stochastic weighted supermatrix has been calculated.

5.1.8. Computing the Limit Supermatrix

After obtaining the weighted supermatrix, the power of it must be computed because an element can influence a second element indirectly, and all influences or dependencies are obtained from the power of the matrix. When the rows of the matrix have the same value in each column, the limit supermatrix has obtained. The limit supermatrix of the model that is obtained from the software is presented in the Appendix. Row values that are obtained from the limit supermatrix give the priority coefficient to select the best alternatives. There is column normalization in the limit supermatrix, like the weighted supermatrix. The sum of the weight of each criterion in each column is equal to one. There is no zero in the cells of the matrix because of indirect influences.

5.1.9. Determining the Weight of Criteria

Row values that are obtained from the limit supermatrix and that have the same values in each column create the weights of criteria. There are two types of criteria weights. These are global and local weights. According to Satty and Kearns, the global weights are synthesized from the second level down by multiplying the local weights by the corresponding criterion in the level above and adding them for each element in a level according to the criteria it affects [61]. Using interdependent weights of the criteria and local weights’ attributes, global weights for the attributes are calculated. Global attributes’ weights are computed by multiplying the local weight of the attributes with the interdependent weight of the criteria to which they belong [62]. Global and local weights of criteria are presented in Table 1.
As seen in Table 1, forensic case density of the district with 0.23 provides the maximum impact on the selection of the vehicle that will be assigned. Then, the geographical conditions of the district, time to intervene in forensic cases and population density of the district are affected, respectively. Time to return from malfunction to use has shown the minimum effect. As a result of the evaluation in terms of the main criteria weight, service efficiency in the district shows the maximum effect among the main criteria to assign a vehicle. The weights of the cost and usage of technical capacity are less than service efficiency in the district with respect to affecting the assignment of a vehicle.

5.2. Finding the Performance Value of Each Vehicle for Each District (Second Step)

The performances of all alternatives are evaluated under criteria by using the “ratings” section in ANP’s software. The weights of service efficiency in the district and usage of technical capacity are calculated by the ANP method. However, the weights of criteria are obtained from random data, which are generated as experiential for cost and time. Then, the performance evaluation is made with the criteria weights.

5.2.1. Evaluating the Performances of Alternatives

After all districts are considered as an alternative for each vehicle type, each vehicle’s assignment weights are obtained for each district. As presented in Table 2, Vehicle 1’s performance is evaluated from the point of criteria including Forensic Case Density of District (FCDD), Geographical Conditions of District (GCD), Population Density of District (PDD) and Number of Law Enforcement Staff in the District (LESD) to realize the service efficiency objective. For instance, Vehicle 1 (V1), assigned to District 1 (D1), is evaluated in the first priority in terms of FCDD criterion. As a result of the performance ratings, if the vehicle is assigned to D1, the service efficiency score will be 0.087359. If the same vehicle is assigned to D5, the service efficiency score will be 0.111102.
The performance of Vehicle 1 is evaluated to attain the goal of usage of technical capacity by criteria including the Volume of Engine (VE), the Power of Engine (PE), the Speed of Vehicle (SV), the Safety Equipment of Vehicle (SEV) and the Age of Vehicle (AV). In the evaluation, District 14 has achieved the highest performance value, which affects the assignment with the most points. As a result of the performance evaluation, District 8 has the fewest points in all of the districts. Generic data are created as experiential. The performance evaluation and normalized value of “time” and “cost” are formed as presented in Table 3.
Vehicle 1 is evaluated in terms of annual maintenance costs, and if the vehicle is assigned to District 15, it will have a maximum maintenance cost. District 5 and District 7 have minimum cost. Generating data are used for some other criteria, such as the Repair Cost (RC), Fuel Consumption Cost (FCC), Time to Return from Malfunction to Use (TRMU) and Time to Intervene in Forensic Cases (TIFC). Therefore, the same method is implemented for them. Thus, two of the main criteria are evaluated subjectively, and the other two are evaluated objectively by means of generic data.

5.2.2. Creating Assignment Matrix

After the calculation of the performance of all alternatives, priority values that are obtained from each of the thirteen districts have been converted into an assignment table that is integrated with the model. Seven assignment matrices are formed in the model. Vehicles and districts are symbolized with V, D, respectively. There are 13 types of vehicles from V1 to V13 and 15 types of districts from D1 to D15. The generated assignment matrices affect the assignment regarding the weight of objectives. Weights of the objectives are calculated with the help of ANP. The assignment model is a maximization model in this problem. However, “cost” and “time” have a minimization structure. Therefore, each element of the matrices of “cost” and “time” is multiplied by (−) minus in order to transform the structure of model from minimization to maximization when the assignment table is created. Uniformity is provided in the objective function by changing the structure of the objectives. Seven assignment matrices that each have 15 rows and 13 columns (15 × 13) are formed in order to solve the problem.

5.3. Establishing the Assignment Model and Performing the Assignment of Vehicles (Third Step)

5.3.1. Establishing the Mathematical Assignment Model

Notations for the proposed mathematical model are presented below, and the encountered problem is adapted to the proposed model’s structure. The developed mathematical model has been encoded with GAMS.
Sets   and   Parameters : _ P ij : the   performance   value   of   the   service   efficiency   for   the   assignment   of   jth   vehicle   to   the   ith   district C ij n : the   performance   value   of   the   nth   cost   for   the   assignment   of   jth   vehicle   to   the   ith   district T ij n : the   performance   value   of   the   nth   time   for   the   assignment   of   jth   vehicle   to   the   ith   district U ij : the   performance   value   of   the   usage   of   technical   capacity   for   the   assignment   of   jth   vehicle   to   the   ith   district capi : the   capacity   of   vehicles   of   ith   district capj : the   capacity   of   jth   vehicle i : the   set   of   districts                                 ( i = 1 , 2 , 3 , .... I ) j : the   set   of   vehicles                                 ( j = 1 , 2 , 3 , ... J ) m : the   set   of   policing   vehicles                              ( j = 9 , 10 , 11 , 12 , 13 ) s : the   set   of   administrative   vehicles                          ( j = 1 , 2 ) d : the   set   of   patrol   vehicles                             ( j = 12 , 13 ) t : the   set   of   traffic   vehicles                              ( j = 3 , 4 , 5 , 6 ) k : the   set   of   tactical   vehicles                              ( j = 7 , 8 ) w g : the   weight   of   the   gth   objective                          ( g = p , c , t , u ) Decision   Variables : _ X ij : the   number   for   assignment   of   jth   vehicle   to   ith   district
M a k s   z = w p i j P i j X i j + w c k i j C i j n X i j + w t k i j T i j n X i j + w u i j U i j X i j s u b j e c t   t o i I X i j 1                                     j J ( 1 ) j X i j = c a p i                                      i ( 2 ) i X i j = c a p j                                      j ( 3 ) i X i s 1                                      s J ( 4 ) i X i m 1                                      m J ( 5 ) i X i d 1                                      d J ( 6 ) i X i t 1                                      t J ( 7 ) i X i k 1                                      k J ( 8 ) X i j 0 ( 9 )
Weights of criteria will be calculated according to the objectives, and the performance score will be created for each vehicle for assignment to a district. Finally, vehicle assignments will be made in order to give security services at the highest level. Four main objectives will contribute to the model with their weights, and assignment will be performed. Constraints in the model are different from the constraints of classical assignment models. Because in the classical assignment models, while an element of i assigns to j, an element of j assigns to i. However, here, while an element of i assigns to j, more than one element of j assigns to i. The constraint set (1) ensures assigning at least one j vehicle to every i district. The constraint set (2) provides using all of the vehicle capacity of districts. The constraint set (3) provides using all of the j-type vehicle capacity. The balanced assignment matrix is formed with the constraint set (2) and the constraint set (3). The constraint set (4) ensures assigning at most one s type vehicle to every district. The constraint set (5) provides assigning at least one m type vehicle to every i district. The constraint set (6) ensures assigning at least one d type vehicle to every i district. The constraint set (7) ensures assigning at least one t type vehicle to every i district. The constraint set (8) provides assigning at least one k type vehicle to every i district.

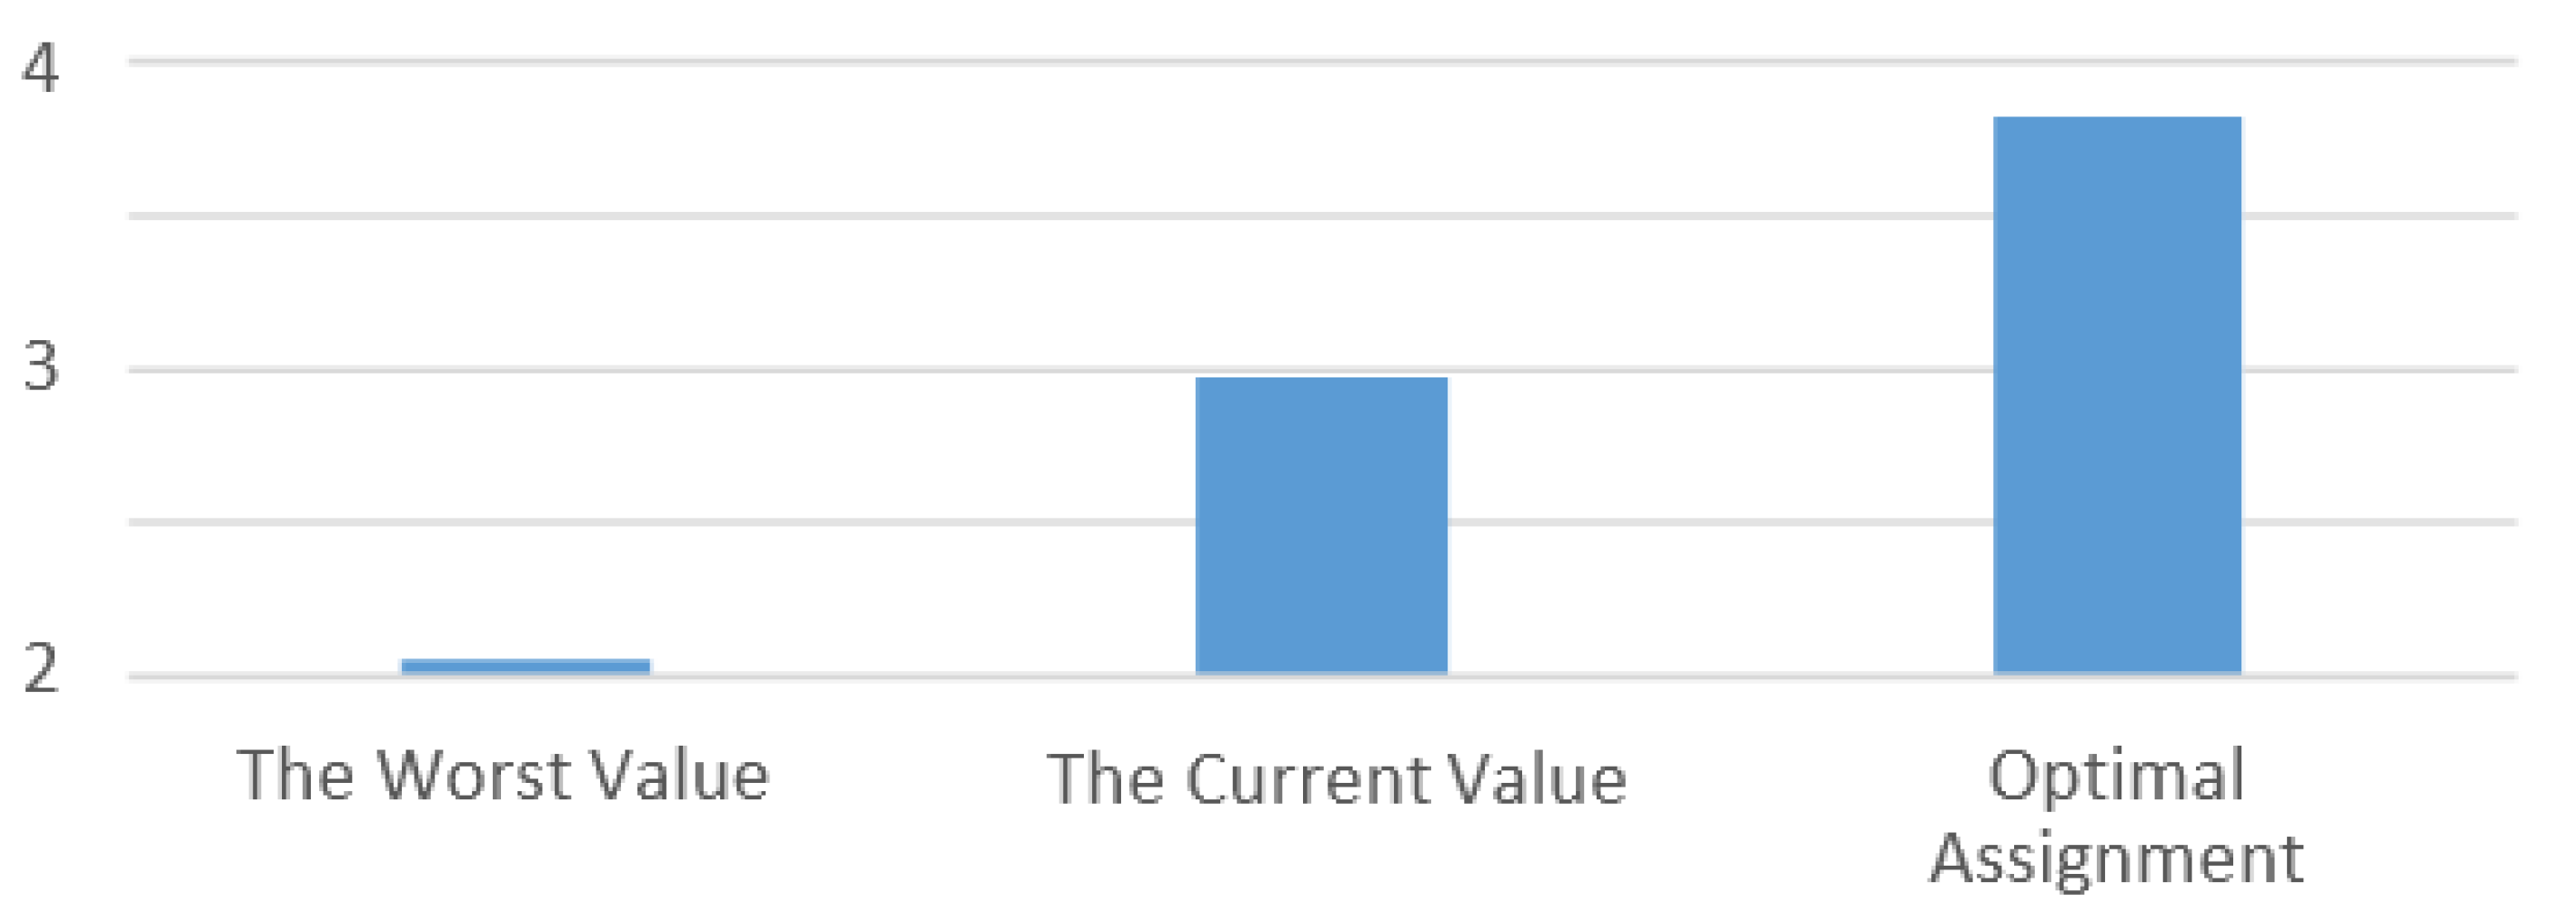
5.3.2. Solving the Assignment Problem and Evaluating the Results

After the mathematical expression of the proposed model, the solution of the encoding is applied by means of the CPLEX/GAMS solver. The solution process has been completed in 0.016 s with a computer that has the Intel Core i5 and a 1.8-GHz processor. The value of the objective function is 3.6373. All of the vehicles are assigned within the identified capacity. The optimal solution has been reached. The current assignment according to experience is presented in Table 4, and the solution of the assignment model is shown in Table 5. In the next section, the results will be evaluated, and the optimality of the assignment which that been made by experience in the current situation will be tested.
As a result of the evaluation of the solution, all of the constraints are carried out in the proposed model, and there is no constraint relaxation. The value of the objective function has been obtained as 3.6373. One-hundred-ninety-six vehicles that are planned for the assignment are realized. The capacities of districts are not exceeded or a lack of capacity is not created.
At least one vehicle that is categorized into the administrative service is assigned to each district, and the type of vehicle that is assigned to the districts is determined by the effect of criteria weights. Traffic service vehicles have shown homogeneous dispersion in general. While Vehicle 4 is predominantly assigned to Districts 7 and 14, Vehicle 5 is assigned to only District 7. Vehicles that are categorized in tactical service are assigned to District 8 and District 9. There is no uniformity across the province in terms of the assignment of patrol vehicles. Vehicle 9 is predominantly assigned to District 11 and District 14. Vehicle 11 is assigned especially to District 2, which is the most highly populated one, and then District 8, District 12 and District 15. Vehicles 12 and 13, which have 4 × 4 transmissions, are especially assigned to District 13, which has the worst terrain.
The results of the solution have been compared with the current vehicles assignment, and the values of the objective functions are evaluated in three phases. Furthermore, the same set of weights and the model structure are used for the validity and consistency of the values in three phases. In the first phase, the worst assignment value has been obtained from the model. Therefore, the maximization problem is considered as the minimization, and the assignment is performed. Thus, the worst value of the objective function with the proposed model is 0.107. In the second phase, an assignment that is still implemented and made by experience is calculated with the proposed model. Therefore, the proposed model is forced to assign the vehicles to the current districts, and the objective function value of the current assignment, which is made by experience, is calculated as 1.9426. In the third phase, the objective function value that provides the optimal solution is obtained as 3.6373 with the proposed model.
In other words, while the objective function value of the current assignment that is made by experience is 1.9426, the value of the objective function that is obtained from the proposed model is raised to the level of 3.6373. The value of the assignment has increased 87% with the proposed model. Furthermore, in this study, the performance of the vehicle assignment system was evaluated indirectly. The graphical display of the assessment is presented in Figure 4. At shown in Figure 4, if the performance of the assignment of the optimal solution that is proposed by the model is one hundred percent, the performance of the current assignment that is proposed by the experiential methods will be fifty-three percent.
This study is made for public institutions that provide security services. Therefore, the weights of the objective are 0.584455 for service efficiency, 0.130425 for cost, 0.145881 for time and 0.13924 for usage of technical capacity, respectively. Actually, the cost that has the highest weight is the most crucial parameter in most studies. However, if we talk about security, the importance of the cost can change. In the study, the service efficiency criterion takes first place because the basis of the study is about security. The proposed assignment model was used in the security services of public institutions and organizations. However, it can be used in the private sector or in other sectors, which can assign their vehicles or other special materials. The values of the main objective weights are changed to evaluate the model in three different scenarios. The results of the scenarios are in Table 6, Table 7 and Table 8, respectively.
(a) Scenario I: All businesses want to minimize the costs. The main purposes of the companies in competition with each other are reducing costs and increasing profits in the globalized business world. Businesses can be divided into two main groups in terms of cost; the first is for-profit businesses, and the second is non-profit businesses, which are often responsible for national security or health services. If this model is used in for-profit businesses, the cost will be the most important criterion. Therefore, the objective of minimizing costs, which is dominant, is examined, and the other main objectives are assumed to have equal weights at the minimum level (wp = 0.1; wc = 0.7; wt = 0.1; wu = 0.1).
(b) Scenario II: The circulation of information has accelerated with the impact of information technology; because of this development, time management has emerged as an important concept. All businesses want to optimize the time and quality of the services that they offer. Providing the service to customers in a short period is important for customer satisfaction. Furthermore, time is important in some public services, such as first aid, public security and firefighting. For these reasons, the objective of minimizing time, which is dominant, is evaluated, and the other main objectives are assumed to have equal weights at the minimum level (wp = 0.1; wc = 0.1; wt = 0.7; wu = 0.1).
(c) Scenario III: Maximizing usage of technical capacity, which is the dominant objective, is evaluated, and the other main objectives are assumed to have equal weights at the minimum level; then, the solution is obtained (wp = 0.1; wc = 0.1; wt = 0.1; wu = 0.7).

6. Conclusions

Vehicles that are used by organizations that produce security services are evaluated to optimize their usage and to increase the quality of service. Firstly, the criteria of the assignment process have been determined in order to achieve the goals. The ANP methodology that can convert qualitative data into quantitative results has been used in the application. Then, the performances of each district for each vehicle are evaluated. The mathematical model is supported by expert opinion in the direction of the desired objectives. As a result of the evaluation by expert opinion, the vehicles that will be assigned to districts are determined. The model has been developed for vehicle fleets that are providing security services and are relatively large scale.
The objective function of the proposed model has been calculated. While the objective function value of the current assignment made by experience is 1.9426, the value of the objective function that is obtained from the proposed model is raised to the level of 3.6373, and the value of the objective function has increased 87% with the proposed model; thus, the current assignment has been improved. The same kinds of vehicles are assigned to a district because of this improvement; so, drivers are specialized in terms of both land and vehicles with the usage of the model’s solution. The applicability of the proposed model is described with three different scenarios.
Organizations that are producing security services can use the ANP-LP hybrid model to assign vehicles to any district. For the future studies, the proposed model can be integrated with other MCDM methodologies. Other MCDM methods can be used for determining the weights of objectives. Goal programming can be used for creating the vehicle assignment model. The proposed model also can be used in the distribution of resources instead of for only security services.

Author Contributions

This research paper was derived from master thesis of Engin Acar which was supervised by Hakan Soner Aplak. Engin Acar performed the experiments and analyzed the data. The article was conceived, designed and written by Engin Acar and Hakan Soner Aplak.

Conflicts of Interest

The authors declare no conflict of interest.

References

  1. Hyunseok, J.; Joongyeup, L.; Jennifer, C.G. The influence of the national government on confidence in the police: A focus on corruption. Int. J. Law Crime Justice 2015, 43, 553–568. [Google Scholar]
  2. Saaty, T.L. Fundamentals of the Analytic Network Process. In Proceedings of the ISAHP, Kobe, Japan, 12–14 August 1999.
  3. Pentico, D.W. Assignment Problems: A golden anniversary survey. Eur. J. Oper. Res. 2007, 176, 774–793. [Google Scholar] [CrossRef]
  4. Caron, G.; Hansen, P.; Jaumard, B. The Assignment Problem with Seniority and Job Priority Constraints. Oper. Res. 1999, 47, 449–454. [Google Scholar] [CrossRef]
  5. Ravindran, A.; Ramaswami, V. On the Bottleneck Assignment Problem. J. Optim. Theory Appl. 1977, 21, 451–458. [Google Scholar] [CrossRef]
  6. Del’Amico, M.; Martello, S. The k-cardinality assignment problem. Discret. Appl. Math. 1997, 76, 103–121. [Google Scholar] [CrossRef]
  7. Martello, S.; Pulleyblank, W.R.; Toth, P.; de Werra, D. Balanced Optimization Problems. Oper. Res. Lett. 1984, 3, 275–278. [Google Scholar] [CrossRef]
  8. Cattrysse, D.G.; Wassenhove, L.N.V. A Survey of Algorithms for the Generalized Assignment Problem. Eur. J. Oper. Res. 1992, 60, 260–272. [Google Scholar] [CrossRef]
  9. Martello, S.; Toth, P. The Bottleneck Generalized Assignment Problem. Eur. J. Oper. Res. 1995, 83, 621–638. [Google Scholar] [CrossRef]
  10. Leblanc, L.J.; Shtub, A.; Anandalingam, G. Formulating and Solving Production Planning Problems. Eur. J. Oper. Res. 1999, 112, 54–80. [Google Scholar] [CrossRef]
  11. Aora, S.; Puri, M.C. A variant of time minimizing assignment problem. Eur. J. Oper. Res. 1998, 110, 314–325. [Google Scholar] [CrossRef]
  12. Gilbert, K.C.; Hofstra, R.B.; Bisgrove, R. An algorithm for a class of three-dimensional assignment problems arising in scheduling operations. Inst. Ind. Eng. Trans. 1987, 19, 29–33. [Google Scholar]
  13. Gilbert, K.C.; Hofstra, R.B. Multidimensional assignment problems. Decis. Sci. 1989, 19, 306–321. [Google Scholar] [CrossRef]
  14. Malhotra, R.; Bhatia, H.L.; Puri, M.C. The three dimensional bottleneck assignment problem and its variants. Optimization 1985, 16, 245–256. [Google Scholar] [CrossRef]
  15. Franz, L.S.; Miller, J.L. Scheduling medical resident to rotations: Solving the large-scale multi period staff assignment. Oper. Res. 1993, 41, 269–279. [Google Scholar] [CrossRef]
  16. Yang, I.T.; Chou, J.S. Multi-objective optimization for manpower assignment in consulting engineering firms. Appl. Soft Comput. 2011, 11, 1183–1190. [Google Scholar] [CrossRef]
  17. Mehlawat, M.K. A multi-choice goal programming approach for cots products selection of modular software systems. Int. J. Reliab. Qual. Saf. Eng. 2013, 20, 1–18. [Google Scholar] [CrossRef]
  18. Klingman, D.; Phillips, N.V. Topological and Computational Aspects of Preemptive Multicriteria Millitary Personnel Assignment Problems. Manag. Sci. 1984, 30, 1362–1375. [Google Scholar] [CrossRef]
  19. Adiche, C.; Aider, M. A Hybrid Method for Solving the Multi-objective Assignment Problem. J. Math. Model. Algorithm 2010, 9, 149–164. [Google Scholar] [CrossRef]
  20. Lin, Y.K.; Yeh, C.T. A Two-stage Approach for a Multi-objective Component Assignment Problem for a Stochastic-flow Network. Eng. Optim. 2013, 45, 265–285. [Google Scholar] [CrossRef]
  21. Yang, X.; Jiang, B. Multi-objective Fleet Assignment Problem Based on Self-adaptive Genetic Algorithm. Adv. Mater. Res. 2013, 694–697, 2895–2900. [Google Scholar] [CrossRef]
  22. Bachlaus, M.; Tiwari, M.K.; Chan, F.T.S. Multi-objective Resource Assignment Problem in a Product-driven Supply Chain Using a Taguchi-based DNA Algorithm. Int. J. Prod. Res. 2009, 47, 2345–2371. [Google Scholar] [CrossRef]
  23. Huang, D.K.; Chiu, H.N.; Yeh, R.H.; Chang, J.H. A Fuzzy Multi-criteria Decision Making Approach for Solving a Bi-objective Personnel Assignment Problem. Comput. Ind. Eng. 2009, 56, 1–10. [Google Scholar] [CrossRef]
  24. Przybylski, A.; Gandibleux, X.; Ehrgott, M. A Two Phase Method for Multi-objective Integer Programming and Its Application to the Assignment Problem with Three Objective. Discret. Optim. 2010, 7, 149–165. [Google Scholar] [CrossRef]
  25. Schniederjans, M.J.; Garvin, T. Using The Analytic Hierarchy Process and Multi-Objective Programming for the Selection of Cost Drivers in Activity-Based Costing. Eur. J. Oper. Res. 1997, 100, 72–80. [Google Scholar] [CrossRef]
  26. Badri, M.A. Combining the Analytic Hierarchy Process and Goal Programming for Global Facility Location-Allocation Problem. Int. J. Prod. Econ. 1999, 62, 237–248. [Google Scholar] [CrossRef]
  27. Lee, J.W.; Kim, S.H. Using Analytic Network Process and Goal Programming For Interdependent Information System Project Selection. Comput. Oper. Res. 2000, 27, 367–382. [Google Scholar] [CrossRef]
  28. Karsak, E.E.; Sözer, S.; Alptekin, S.E. Product Planning in Quality Function Deployment Using a Combined Analytic Network Process and Goal Programming Approach. Comput. Ind. Eng. 2002, 44, 171–190. [Google Scholar] [CrossRef]
  29. Chang, Y.H.; Wey, W.M.; Tseng, H.Y. Using ANP Priorities with Goal Programming for Revitalization Strategies in Historic Transport: A Case Study of the Alishan Forest Railway. Expert Syst. Appl. 2009, 36, 8682–8690. [Google Scholar] [CrossRef]
  30. Yan, H.B.; Huynh, V.N.; Nakamori, Y.; Murai, T. On Prioritized Weighted Aggregation in Multi-criteria Decision Making. Expert Syst. Appl. 2011, 38, 812–823. [Google Scholar] [CrossRef]
  31. Wey, W.M.; Wu, K.Y. Using ANP Priorities with Goal Programming in Resource Allocation in Transportation. Math. Comput. Model. 2007, 46, 985–1000. [Google Scholar] [CrossRef]
  32. Sagır, M.; Ozturk, Z.K. Exam Scheduling: Mathematical Modeling and Parameter Estimation with the Analytic Network Process Approach. Math. Comput. Model. 2010, 52, 930–941. [Google Scholar] [CrossRef]
  33. Aplak, H.S.; Turkbey, O. Fuzzy Logic Based Game Theory Applications in Multi-criteria Decision Making Process. J. Intell. Fuzzy Syst. 2013, 25, 359–371. [Google Scholar]
  34. Mehlawat, M.K.; Kumar, S. A Goal Programming Approach for a Multi-Objective Multi-Choice Assignment Problem. Optimization 2014, 63, 1549–1563. [Google Scholar] [CrossRef]
  35. Ismayilova, N.A.; Sagır, M.; Gasimov, R.N. A Multiobjective Faculty–Course–Time Slot Assignment Problem with Preferences. Math. Comput. Model. 2007, 46, 1017–1029. [Google Scholar] [CrossRef]
  36. Byun, D. The AHP Approach for Selecting an Automobile Purchase Model. Inf. Manag. 2001, 38, 289–297. [Google Scholar] [CrossRef]
  37. Zak, J.; Jazkiewickz, A.; Redmer, A. Multiple Criteria Optimization Method for the Vehicle Assignment Problem in a Bus Transportation Company. J. Adv. Transp. 2009, 43, 203–243. [Google Scholar] [CrossRef]
  38. Apak, S.; Gogus, G.G.; Karakadılar, İ.S. An Analytic Hierarchy Process Approach with a Novel Framework for Luxury Car Selection. Procedia Soc. Behav. Sci. 2012, 58, 1301–1308. [Google Scholar] [CrossRef]
  39. Gungor, I.; Isler, D.B. Automobile Selection with Analytic Hierarchy Process Approach. ZKÜ Sosyal Bilimler Dergisi 2005, 1, 21–33. [Google Scholar]
  40. Soba, M. Selecting the best panelvan autocar by using promethee method and an application. J. Yasar Univ. 2012, 7, 4708–4721. [Google Scholar]
  41. Singh, K. Influence of Internal Service Quality on Job Performance: A Case Study of Royal Police Department. Procedia Soc. Behav. Sci. 2016, 224, 28–34. [Google Scholar] [CrossRef]
  42. Chen, C.M.; Lee, H.T.; Chen, S.H.; Tsai, T.H. The police service quality in rural Taiwan a comparative analysis of perceptions and satisfaction between police staff and citizens. Polic. Int. J. Police Strateg. Manag. 2014, 37, 521–542. [Google Scholar] [CrossRef]
  43. Gherghina, L. Strategies of the Quality of Local Police Public Service in the Municipalities from Romania’s Western Region Based on Marketing Research, Law of Local Police; Official Gazette: Resita, Romania, 2010; Part I; p. 1. [Google Scholar]
  44. Tari, J.J. Improving Service Quality in a Spanish Police Service. Total Qual. Manag. 2006, 17, 409–424. [Google Scholar] [CrossRef]
  45. Singh, K.N.; Kushwaha, S.; Hamid, F. Analytic Network Process—A Review of Application Areas. In Proceedings of the 1st IEEE International Conference on Logistics Operations Management, Le Havre, France, 17–19 October 2012; p. 14.
  46. Saaty, T.L.; Vargas, L.G. Decision Making with the Analytic Network Process: Economic, Political, Social and Technological Applications with Benefits, Opportunities, Costs and Risks; Springer Science + Business Media LLC: Pittsburgh, PA, USA, 2006. [Google Scholar]
  47. Ishizaka, A.; Nemery, P. Multi Criteria Decision Analysis: Methods and Software; John Wiley & Son: West Sussex, UK, 2013. [Google Scholar]
  48. Gencer, C.; Gurpınar, D. Analytic Network Process in Supplier Selection: A Case Study in An Electronic Farm. Appl. Math. Model. 2007, 31, 2475–2486. [Google Scholar] [CrossRef]
  49. Khademi, N.; Behnia, K.; Saedi, R. Using Analytic Hierarchy/Network Process, (AHP/ANP) in Developing Countries: Shortcomings and Suggestions. Eng. Econ. 2014, 59, 2–29. [Google Scholar] [CrossRef]
  50. Ambroggi, M.D.; Trucco, P. Modelling and assessment of dependent performance shaping factors through Analytic Network Process. Reliab. Eng. Syst. Saf. 2011, 96, 849–860. [Google Scholar] [CrossRef]
  51. Meade, L.M.; Sarkis, J. Analyzing organizational project alternatives for agile manufacturing processes: An analytic network approach. Int. J. Prod. Res. 1999, 37, 241–261. [Google Scholar] [CrossRef]
  52. Ravi, V.; Shankar, R.; Tiwari, M.K. Analyzing alternatives in reverse logistics for end-of-life computers: ANP and balanced scorecard approach. Comput. Ind. Eng. 2005, 48, 327–356. [Google Scholar] [CrossRef]
  53. Nguyen, H.T.; Dawal, S.Z.; Nukman, Y.; Aoyama, H. A hybrid approach for fuzzy multi-attribute decision making in machine tool selection with consideration of the interactions of attributes. Expert Syst. Appl. 2014, 41, 3078–3090. [Google Scholar] [CrossRef]
  54. Yu, V.F.; Hu, K.J.; Chang, A.Y. An interactive approach for the multi-objective transportation problem with interval parameters. Int. J. Prod. Res. 2015, 53, 1051–1064. [Google Scholar] [CrossRef]
  55. Hitchcock, F.L. The Distribution of a Product from Several Sources to Numerous Localities. J. Math. Phys. 1941, 20, 224–230. [Google Scholar] [CrossRef]
  56. Taha, A.H. Operations Research: An Introduction, 8th ed.; PEARSON Prentice Hall: Upper Saddle River, NJ, USA, 2003. [Google Scholar]
  57. Ignizio, P.J.; Cavalier, M.T. Linear Programming; Prentice Hall: Englewood Cliffs, NJ, USA, 1994. [Google Scholar]
  58. Lin, C.J. Assignment Problem for Team Performance Promotion under Fuzzy Environment. Math. Probl. Eng. 2013, 2013. [Google Scholar] [CrossRef]
  59. Bank, J. The Essence of Total Quality Management; Prentice Hall International: Hemel Hempstead, UK, 1992. [Google Scholar]
  60. Liang, K.; Zhang, Q. Study on the Organizational Structured Problem Solving on Total Quality Management. Int. J. Bus. Manag. 2010, 5. [Google Scholar] [CrossRef]
  61. Satty, T.L.; Kearns, K.P. Analytical Planning: The Organization of Systems; Pergamon: Oxford, UK, 1985. [Google Scholar]
  62. Yucenur, G.N.; Vayvay, O.; Demirel, N.C. Supplier selection problem in global supply chains by AHP and ANP approaches under fuzzy environment. Int. J. Adv. Manuf. Technol. 2011, 56, 823–833. [Google Scholar] [CrossRef]
Figure 1. (a) Structure of the Analytic Hierarchy Process (AHP); (b) structure of the Analytic Network Process (ANP) (adapted from [46,48]).
Mca 21 00039 g001
Figure 2. Vehicle assignment process.
Mca 21 00039 g002
Figure 3. Criteria framework.
Mca 21 00039 g003
Figure 4. Comparison of assignment performance.
Mca 21 00039 g004
Table 1. Weights of criteria.
CriteriaLocal WeightsTotalGlobal WeightsTotal
Forensic Case Density of the District (FCDD)0.3935310.230001
Geographical Conditions of the District (GCD)0.309400.18083
Population Density of the District (PDD)0.184270.10770
Number of Law Enforcement Staff in the District (LESD)0.112800.06593
Maintenance Cost (MC)0.2521810.03289
Repair Cost (RC)0.155650.02030
Fuel Consumption Cost (FCC)0.592160.07723
Safety Equipment of Vehicle (SEV)0.0333010.00464
Speed of Vehicle (SV)0.093060.01296
Age of Vehicle (AV)0.236710.03296
Power of Engine (PE)0.253870.03535
Volume of Engine (VE)0.204040.02841
Transmission Type (TT)0.179020.02493
Time to Return from Malfunction to Use (TRMU)0.0736710.01075
Time to Intervene in Forensic Cases (TIFC)0.926330.13513
Table 2. Performance values of Vehicle 1 in terms of service efficiency objective for each district. D1, District 1.
DistrictsPrioritiesFCDDGCDPDDLESD
D10.0873591st Priority2nd Priority2nd Priority1st Priority
D20.0434393rd Priority1st Priority4th Priority4th Priority
D30.0661013rd Priority1st Priority1st Priority3rd Priority
D40.0873591st Priority2nd Priority2nd Priority1st Priority
D50.1111021st Priority1st Priority1st Priority2nd Priority
D60.0519212nd Priority2nd Priority2nd Priority3rd Priority
D70.0720102nd Priority1st Priority2nd Priority3rd Priority
D80.0233513rd Priority2nd Priority4th Priority4th Priority
D90.0468182nd Priority3rd Priority1st Priority4th Priority
D100.0753061st Priority3rd Priority2nd Priority1st Priority
D110.0540693rd Priority1st Priority3rd Priority2nd Priority
D120.0661013rd Priority1st Priority1st Priority3rd Priority
D130.0753061st Priority3rd Priority2nd Priority1st Priority
D140.0761292nd Priority1st Priority2nd Priority2nd Priority
D150.0636293rd Priority1st Priority1st Priority4th Priority
Table 3. Annual maintenance cost and normalized form of Vehicle 1 (V1) according to district generic data.
Annual Maintenance Costs ($)
DistrictReal CostsNormalized Costs
D19000.072
D21,1000.088
D38500.068
D49800.078
D57000.056
D67500.060
D77400.059
D88800.070
D97900.063
D107000.056
D117200.057
D127800.062
D137100.057
D148400.067
D151,1200.089
Total12,5601
Table 4. The current assignment has been made by experience.
Current Assignment
Vehicle TypesVehicleD1D2D3D4D5D6D7D8D9D10D11D12D13D14D15Capacity of Vehicles
Administrative Veh.V1 111 111 11 111015
V21 1 11 1 5
Traffic VehiclesV3 2 21 1 2830
V411 11 11 121 313
V5 1 1 1 14
V6 1 2 2 5
Tactical VehiclesV7 2 2 2 639
V83411 2334 3 42333
Patrol Vehicles (T-I)V91321211222221142790
V10 11 2
V111113 11553 87241061
Patrol Vehicles (T-II)V1213 111111 21222
V13 22 1211 12 10
Capacity of Districts83074871220146161911826196
Table 5. The solution of the proposed assignment model.
Assignment Results
Vehicle TypesVehicleD1D2D3D4D5D6D7D8D9D10D11D12D13D14D15Capacity of Vehicles
Administrative Veh.V1 11 1 111 11 111015
V21 1 1 1 1 5
Traffic VehiclesV3 11 3 11 1830
V4 1 511 5 13
V5 4 4
V62 1 1 1 5
Tactical VehiclesV7 4 11 639
V811111 11010 1131133
Patrol Vehicles (T-I)V93 3 12 92790
V10 2 2
V11 26 7 15 1361
Patrol Vehicles (T-II)V12 111 111 1131 1222
V131 11 3 3 110
Capacity of Districts83074871220146161911826196
wp: 0.584455
wc: 0.130425
wt: 0.145881
wu: 0.13924
wp: weight of service efficiency objective
wc: weight of cost objective
wt: weight of time objective
wu: weight of the usage of technical capacity objective
Table 6. Assignment results for Scenario I.
Assignment Results
Vehicle TypesVehicleD1D2D3D4D5D6D7D8D9D10D11D12D13D14D15Capacity of Vehicles
Administrative Veh.V1 1 111 1111111015
V211 11 1 5
Traffic VehiclesV3 1 2 3 1 1830
V4 41 1 41 11 13
V5 3 1 4
V61 4 5
Tactical VehiclesV7 4 11 639
V841111 117 1185133
Patrol Vehicles (T-I)V9126 2790
V10 2 2
V11 3 63 1215 2261
Patrol Vehicles (T-II)V12 111 1 111 11 1222
V131 11 5 1 110
Capacity of Districts83074871220146161911826196
wp: 0.1
wc: 0.7
wt: 0.1
wu: 0.1
wp: weight of service efficiency objective
wc: weight of cost objective
wt: weight of time objective
wu: weight of the usage of technical capacity objective
Table 7. Assignment results for Scenario II.
Assignment Results
Vehicle TypesVehicleD1D2D3D4D5D6D7D8D9D10D11D12D13D14D15Capacity of Vehicles
Administrative Veh.V1 11 1 11 111111015
V21 1 1 11 5
Traffic VehiclesV3 4 21 1830
V4 9 1 11 1 13
V5 1 2 1 4
V61 21 1 5
Tactical VehiclesV7 4 2 639
V811111 81911115133
Patrol Vehicles (T-I)V94 11 122790
V10 2 2
V11 18 16 2 15 1061
Patrol Vehicles (T-II)V12 1 111 8 1222
V13111 11 111 1110
Capacity of Districts83074871220146161911826196
wp: 0.1
wc: 0.1
wt: 0.7
wu: 0.1
wp: weight of service efficiency objective
wc: weight of cost objective
wt: weight of time objective
wu: weight of the usage of technical capacity objective
Table 8. Assignment results for Scenario III.
Assignment Results
Vehicle TypesVehicleD1D2D3D4D5D6D7D8D9D10D11D12D13D14D15Capacity of Vehicles
Administrative Veh.V1 11 1 111 11 111015
V21 1 1 1 1 5
Traffic VehiclesV3 4 11 1 1830
V4 9 1 3 13
V5 1 3 4
V61 1 1 1 1 5
Tactical VehiclesV7 2 3 1 639
V851111 1111 1171133
Patrol Vehicles (T-I)V9 11 12 42790
V10 2 2
V11 26 15 21861
Patrol Vehicles (T-II)V12 11 161 1 1 1222
V131 113 1 11 110
Capacity of Districts83074871220146161911826196
wp: 0.1
wc: 0.1
wt: 0.1
wu: 0.7
wp: weight of service efficiency objective
wc: weight of cost objective
wt: weight of time objective
wu: weight of the usage of technical capacity objective

