Article

Model Distribution Effects on Likelihood Ratios in Fire Debris Analysis

1
Department of Chemistry, University of Central Florida, P.O. Box 162367, Orlando, FL 32816-2366, USA
2
National Center for Forensic Science, University of Central Florida, P.O. Box 162367, Orlando, FL 32816-2367, USA
*
Author to whom correspondence should be addressed.
Separations 2018, 5(3), 44; https://doi.org/10.3390/separations5030044
Submission received: 3 July 2018 / Revised: 10 August 2018 / Accepted: 21 August 2018 / Published: 3 September 2018
(This article belongs to the Special Issue Advances in Fire Debris Analysis)

Abstract

:
Computational models for determining the strength of fire debris evidence based on likelihood ratios (LR) were developed and validated against data sets derived from different distributions of ASTM E1618-14 designated ignitable liquid class and substrate pyrolysis contributions using in-silico generated data. The models all perform well in cross validation against the distributions used to generate the model. However, a model generated based on data that does not contain representatives from all of the ASTM E1618-14 classes does not perform well in validation with data sets that contain representatives from the missing classes. A quadratic discriminant model based on a balanced data set (ignitable liquid versus substrate pyrolysis), with a uniform distribution of the ASTM E1618-14 classes, performed well (receiver operating characteristic area under the curve of 0.836) when tested against laboratory-developed casework-relevant samples of known ground truth.

Graphical Abstract

1. Introduction

Current practice in fire debris analysis within the United States results in reporting a categorical statement with the possibility of additional qualifying statements, as prescribed by the standard method ASTM E1618-14 [1]. These categorical statements result from subjective thresholds for rendering a judgement on the presence or absence of ignitable liquid residue in a sample. Previous research has led to the development of machine learning approaches and the direct calculation of likelihood ratios (LR) for observing the evidence (i.e., the total ion spectrum from a fire debris sample) under the competing hypothesis that a sample contains or does not contain ignitable liquid residue [2,3,4,5,6,7]. These calculations provide an easy and objective method for evaluating the evidentiary value of a fire debris sample, thereby obviating the need for making subjective categorical statements. Application of the approaches and results presented in this paper to other forensic problems is possible where training data is available for the relevant population under consideration.
When developing a method for calculating likelihood ratios, it is important to address the question of what constitutes a relevant population. This is important in both classification and identification problems [8,9]. In both problem types, the choice of a relevant population influences the calculation of the multivariate means as well as the variance and covariance used to calculate the likelihood ratios. Equation (1) presents a one-level model (single measurement for each sample) for the calculation of likelihood ratios with the assumption of multivariate normal between-object distributions.
  L R = | C 1   | 1 / 2 e x p { 1 2 ( y x ¯ 1 ) T ( C 1 ) 1 ( y x ¯ 1 ) } | C 2 | 1 / 2 e x p { 1 2 ( y x ¯ 2 ) T ( C 2 ) 1 ( y x ¯ 2 ) }
In Equation (1), | C g | and ( C g ) 1 ( g = 1, 2) are the determinant and inverse of the covariance matrix estimated for class g using an available database. In this work, the two classes are samples containing ignitable liquid residue and samples that do not contain ignitable liquid residue, designated IL and SUB respectively. The term y in Equation (1) is the feature vector for the single measurement of the sample for which the LR is being calculated and x ¯ g ( g = 1, 2) is the mean feature vector for the database samples from class g [8,9].
Alternatively, the likelihood ratio can be calculated from Equation (2), which is a one-level model based on the assumption of multivariate between-object Gaussian kernel density distributions [8,9].
  L R = | h 1 2 C 1   | 1 / 2 1 m 1 i = 1 m 1 e x p { 1 2 ( y x ¯ 1 i ) T ( h 1 2 C 1 ) 1 ( y x ¯ 1 i ) } | h 2 2 C 2 | 1 / 2 1 m 2 i = 1 m 2 e x p { 1 2 ( y x ¯ 2 i ) T ( h 2 2 C 2 ) 1 ( y x ¯ 2 i ) }
The determinant and inverse of the covariance matrix, | C g | and ( C g ) 1 ( g = 1, 2) are estimated for each class g , given an estimate of the relevant population. The term y is the feature vector for the single measurement of the sample for which the LR is being calculated and x ¯ g i ( g = 1, 2) is the mean feature vectors for the database samples from class g . Equation (2) includes the optimal bandwidth parameter h g ( g = 1, 2) for the kernel functions used for each class. Calculation of the bandwidth is by Equation (3), where m g is the number of samples of class g in the respective database and p is the number of variables in each p-variate feature vector. The kernel density estimate is more appropriate when the population distribution of the data is not normal [8,9].
  h g = ( 4 m g ( 2 p + 1   ) ) 1 p + 4
In a previous report [3], several chemometric methods were evaluated for calculating the evidentiary value of a fire debris sample. Support vector machine (SVM), linear and quadratic discriminant analysis (LDA and QDA, respectively) and k-nearest neighbors (kNN) were evaluated by cross validation on computationally generated training data and by assessing an independent set of data taken from large-scale test burns. The results showed that SVM and QDA performed better in cross validation than LDA and kNN, based on the area under the receiver operating characteristic (ROC) curves (abbreviated as AUC). The AUCs for SVM, QDA, LDA and kNN were 0.99, 0.98, 0.87 and 0.91 respectively. The equal error rates (EER) for the four methods had the reverse ordering relative to the AUC values (i.e., EERSVM < EERQDA < EERLDA < EERkNN). The LR produced from the SVM and LDA cross-validation results were better calibrated than the LR produced by QDA and kNN. In that work [3], calibration was not performed on the LR values following cross validation of each chemometric method. Testing the chemometric methods against the large-scale burn validation data gave AUC values of 0.83, 0.92 and 0.84 for SVM, QDA and kNN methods, respectively. The AUC for SVM, QDA and kNN showed the largest decreases while the LDA AUC (0.87) showed no change. The interpretation of these results was that the computational method was producing training data that possibly was not representative of the large-scale burn data, resulting in poor validation performance of the chemometric models. An alternative explanation may reside in the different approaches used to assign the ground truth for the computationally generated data and the large-scale burn data.
In previous work [3], the computationally generated data was specified to have a ground truth IL class membership if the sample was generated by including ignitable liquid in the range of 0.01–1.0 fractional contribution to the total ion spectrum. Computationally generated samples assigned membership in the ground truth SUB class did not contain any ignitable liquid contribution. Class assignment (IL or SUB) was made for the large-scale burn samples by an “informed analyst” [3], who knew the identity and chromatographic characteristics of the ignitable liquid used in the burn. The analyst assigned the class based on the presence or absence of a recognizable pattern from the ignitable liquid used in the burn. While this approach may seem reliable, it is nonetheless different from the method used to assign the ground truth to the computationally generated samples. In the work presented here, class assignments for the large-scale burn samples are not considered as “ground truths” for the purpose of evaluating model performance. Instead, the known ground truth of the computationally generated data and an independent data set from 16 known ground truth samples are used to evaluate model performance. The LLR, or log 10   ( LR ) , of the large-scale burn data are calculated based on an optimal model derived from computationally generated data. This approach is more representative of casework, wherein the evidentiary value of a sample is sought without knowing the ground truth. This approach also affords the opportunity to assess the calculated evidentiary value for samples where the identity of the ignitable liquids and the sampling locations were known relative to the ignitable liquid pour.

2. Materials and Methods

The calculations in this work are based on a set of data that is computationally generated by mixing data from a database of ignitable liquids and data from a substrates database. The computationally generated data is intended to model fire debris data; however, unlike real fire debris data, the ground truth (presence or absence of ignitable liquid residue) is known for the computationally generated data. The relative amounts of ignitable liquids from each of the different ASTM E1618-14 defined classes, and the relative amount of substrate-only containing samples, are controlled in the computational mixing to generate data sets that represent different population distributions of ignitable liquid classes and substrates. The computational mixing process has been described in detail in previous publications and is summarized here for the benefit of the reader [2,3].
This work utilized 122 substrate pyrolysis samples from the Substrate Database [10], and 111 substrate pyrolysis samples that were not included in the previously computed fire debris models [3], bringing the total number of substrate samples to 233. The ignitable liquid samples used in the models included 445 unweathered and 243 weathered records from the Ignitable Liquids Reference Collection and Database (ILRC) [11], as previously reported [3]. The LR calculation is limited to Equation (1), where the covariance matrix for samples containing ignitable liquid are treated as different (QDA) or the same (LDA) as the covariance matrix for samples that do not contain ignitable liquid. In previous work [3], the LR calculated by Equation (1) were not calibrated following cross validation. In the results reported here, the LR values are calibrated by isotonic regression, also known as the pooled adjacent violators method [12].
Samples designated “IL” were prepared by mixing the total ion spectrum (TIS) from a single ignitable liquid with the TIS of a random number (1 to 5) of substrates [13]. The TIS corresponds to the base-peak normalized electron ionization mass spectrum averaged across the chromatographic profile. The computational mixing has previously been described in detail [2,3,4,5]. A brief review of the computational mixing is given here.

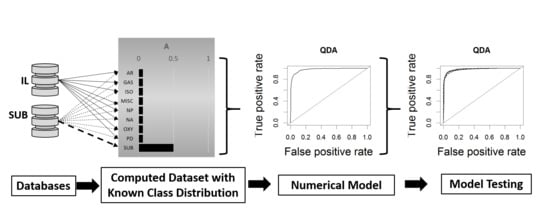
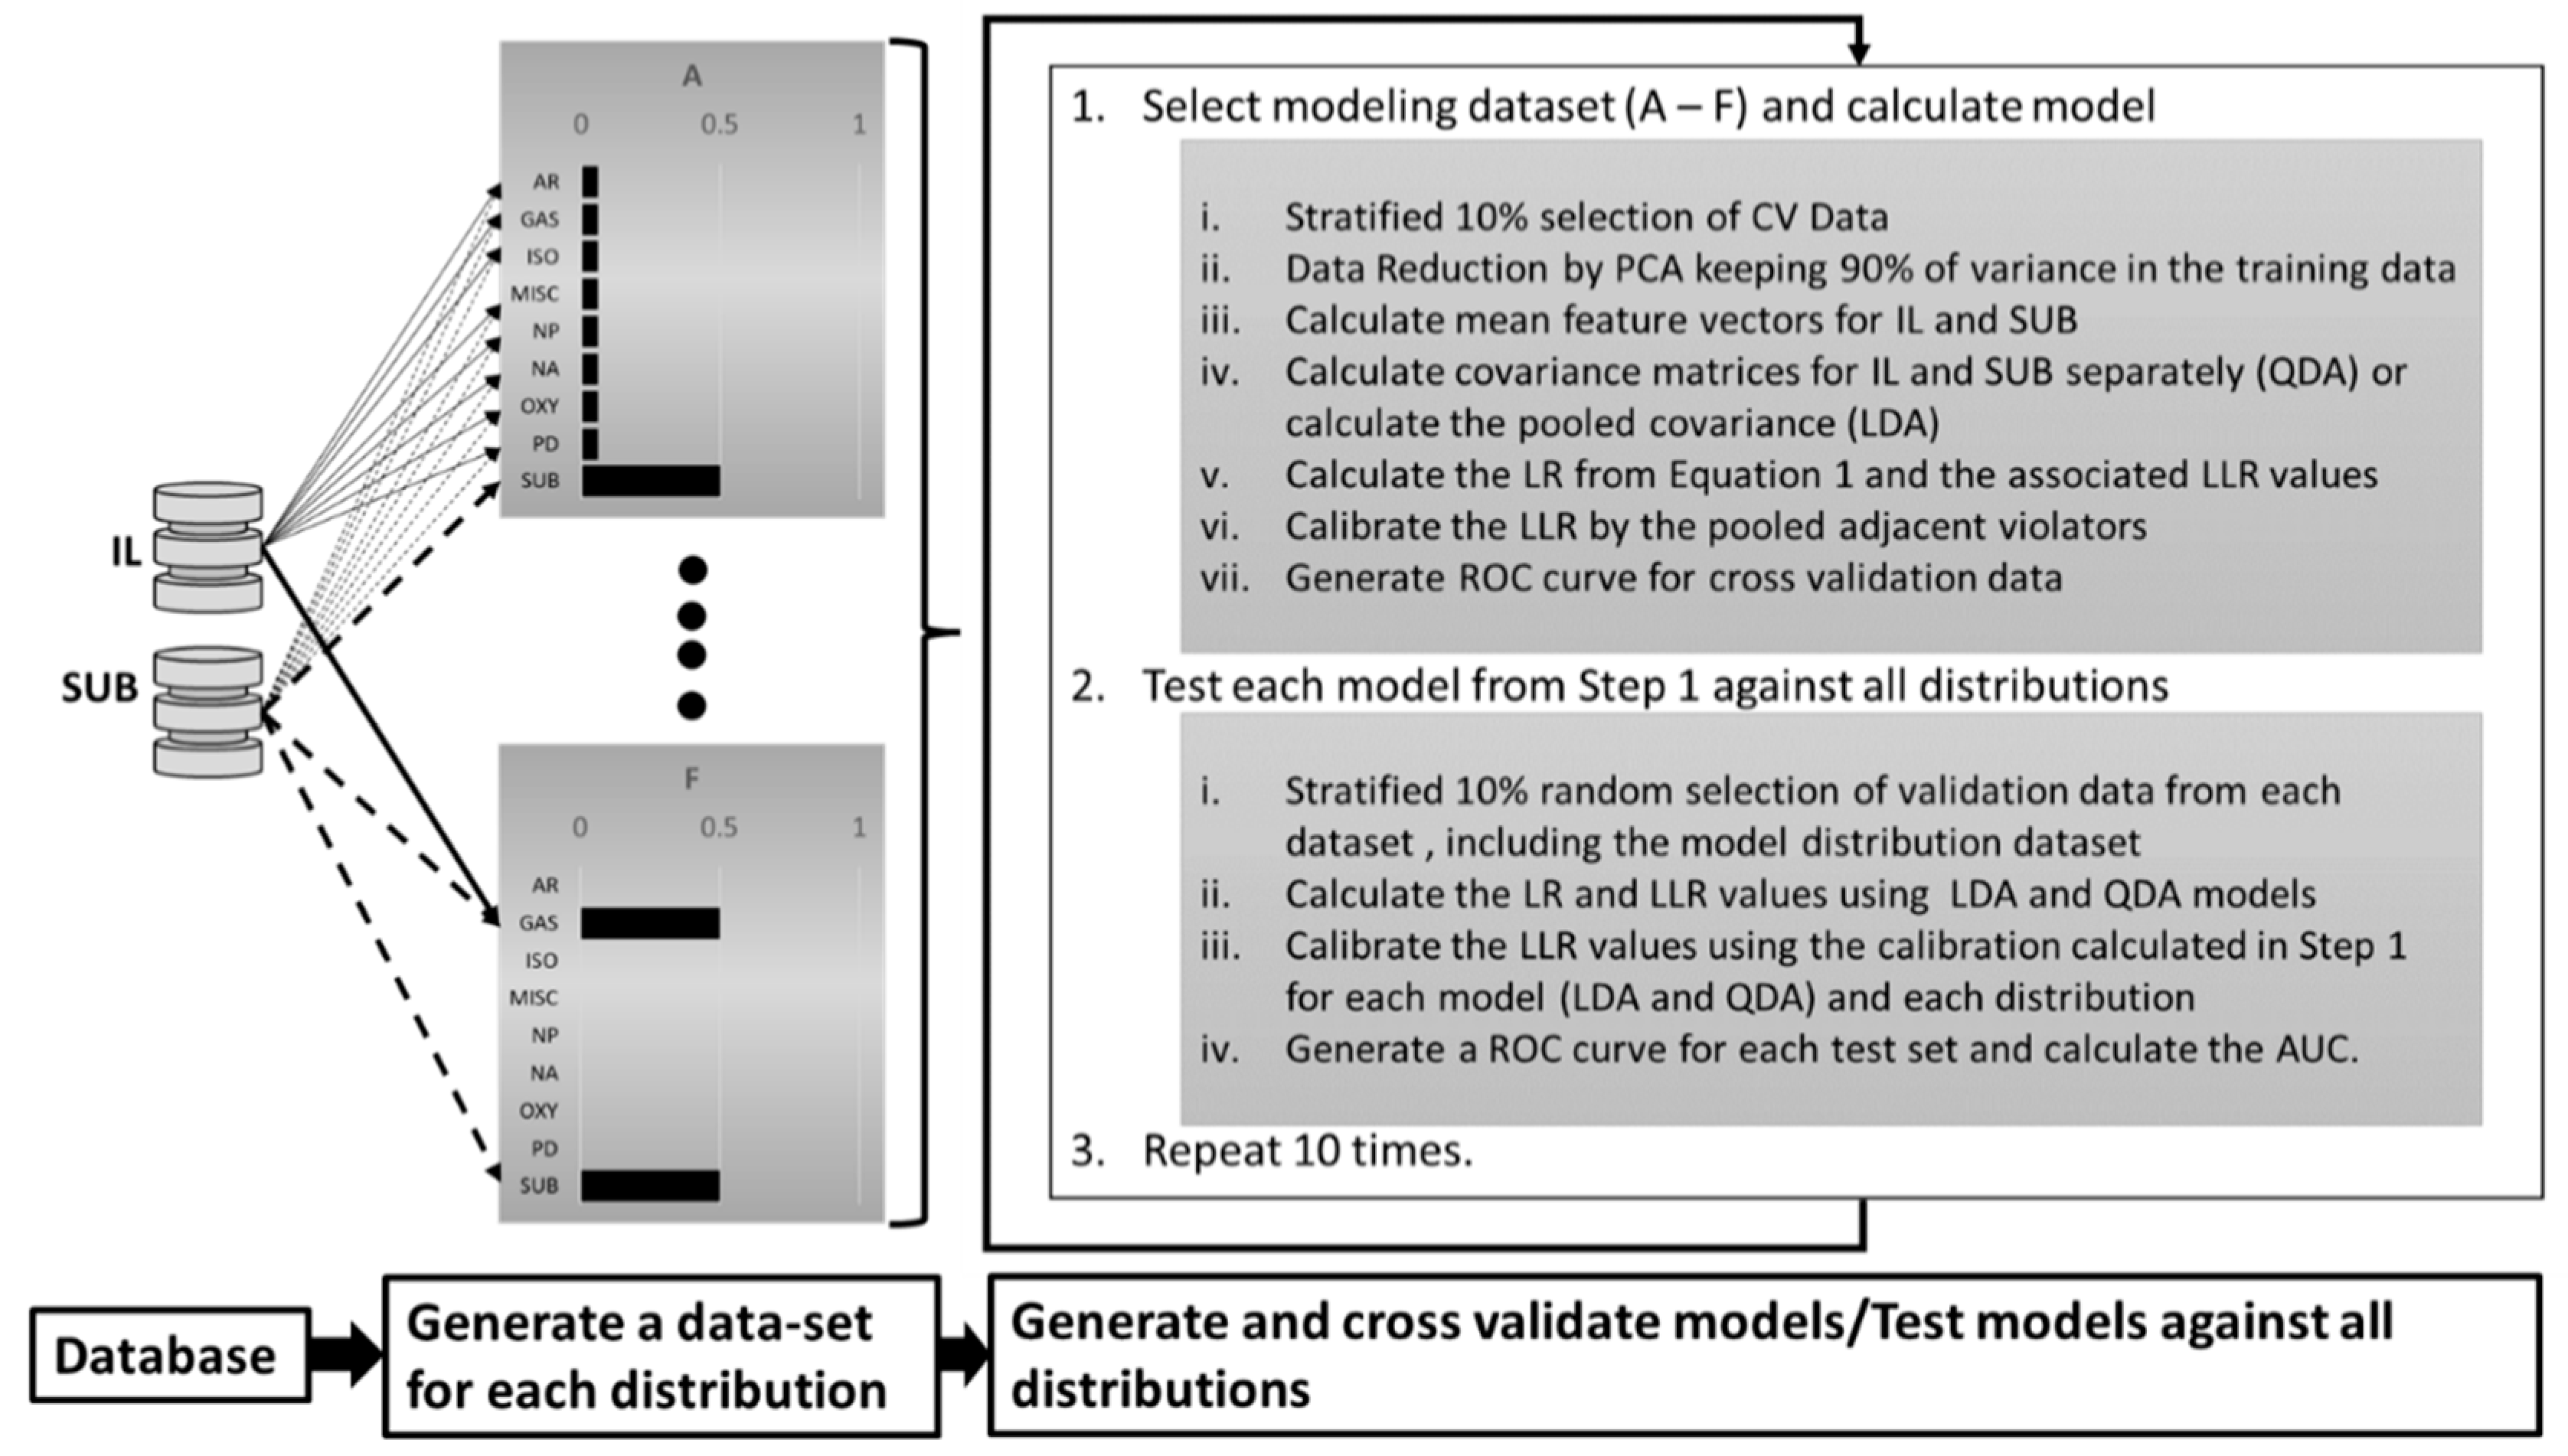
2.1. Computational Fire Debris Data Preparation

Each of the j (j = 1–10,000) simulated fire debris TIS were prepared by mixing a random number i (i = 1–5) of TIS SUB , i from substrate pyrolysis samples with a single TIS IL , j ignitable liquid. Each TIS SUB , i is multiplied by a fractional contribution ψ i , where i ψ i = 1 . The proportion ϕ j of the summed TIS SUB , i substrate contributions and the ( 1 ϕ j ) TIS IL , j contribution from the IL contribution were multiplied by a vector n j to add a maximum of 10% normally distributed noise to each component of TIS j . Each computationally generated TIS j was normalized by dividing each nominal mass-to-charge ratio (m/z) intensity by the maximum value, as shown in Equation (5). This is the same process that was followed in previous work [2,3].
  TIS j = [ ( 1 ϕ j ) TIS I L , j + ϕ j i = 1 5 ψ i TIS SUB , i ] n j
  TIS j , N = TIS j max ( TIS j )
Model data sets were prepared by controlling the proportion of each ignitable liquid class incorporated into each model (i.e., the fraction of the total number of TIS corresponding to each class). The standard method ASTM E1618-14 defines eight different classes of ignitable liquid [1]. These classes include the aromatic solvents (AR), gasoline (GAS), isoparaffinic solvents (ISO), naphthenic paraffinic solvents (NP), normal alkanes (NA), petroleum distillates (PD), oxygenates (OXY) and miscellaneous (MISC). Pyrolyzed substrates (SUB) are included as an additional class in this study. The model distribution data sets used for training and cross validation were prepared as described in the previous paragraph by a stratified random draw with replacement from each class of IL and SUB in accordance with the population distributions shown in Table 1. For example, a data set of 10,000 TIS corresponding to population A would contain 5000 samples comprised of a mixture of substrates (containing no IL) and 5000 samples, each containing a single IL from one of the IL classes mixed with up to five pyrolyzed substrate samples. Each IL class was represented in 630 TIS.
The pairwise similarities ( S i , j ) between distributions i and j are shown in Table 2 and calculated based on Equation (6), where d i , j is the Euclidean distance between distributions i and j, with the squared difference in fractional contributions f i , k and f j , k summed over the k = 1–9 classes shown in Table 1.
  S i , j   = 1 ( 1 + d i , j )
  d i , j   = k = 1 9 ( f i , k f j , k ) 2

2.2. Model Development and Cross Validation

The models used in this work are based on Equation (1), which requires calculation of the covariance matrices ( C 1 and C 2 ) and the mean feature vectors ( x ¯ 1 and x ¯ 2 ) for the IL (class 1) and SUB (class 2) samples from each data set based on the population distributions in Table 1. The feature vectors were comprised of the principal components scores calculated from the total ion spectra for each sample in a computational data set (sets A–F corresponding to the distributions in Table 1). Principal components analysis with mean centering of the data was used to remove collinearity among the ion intensities of different mass-to-charge (m/z) ratio in the total ion spectra. Dimension reduction was achieved by retaining a number of principal component scores required to account for 90% of the variance in the data. The values ( C 1 , C 2 , x ¯ 1 and x ¯ 2 ) allow direct calculation of the likelihood ratio, using Equation (1), for a new sample with feature vector y , without optimization of any adjustable parameters. The feature vector y for a new sample is comprised of the scores obtained by projecting the total ion spectrum for the sample into the principal component space defined by the population.
Models developed for each distribution in Table 1 were cross validated by a 10-fold stratified approach. For each fold in the cross validation, the validation data was removed (10% of ground truth IL and 10% of ground truth SUB) and dimension reduction was performed on the remaining data (90% of the data set) by principal components analysis with mean centering. Retained principal components and associated scores accounted for 90% of the variance in the data, typically corresponding to roughly 30 factors. Two approaches were taken to calculate the covariance matrices required for Equation (1), resulting in two quantitatively different models. In one case, the covariance matrices ( C 1 and C 2 ) were calculated separately for the ground truth IL and SUB samples from the training data. In the other case, the covariance matrices for the IL and SUB samples were assumed equal and the pooled covariance matrix was calculated. The former approach is equivalent to QDA and the latter is equivalent to LDA [3]. Equation (1) was used to calculate the likelihood ratios for the model data (90% of the data set) under both assumptions. The LR values were transformed to LLR, which were calibrated by isotonic regression using the pooled adjacent violators method as implemented in the R isotone package [12,14]. The calibrated LLR values were used to correct the LLR values predicted for the cross-validation data (10% of ground truth IL and 10% of ground truth SUB), as described in Section 2.3.

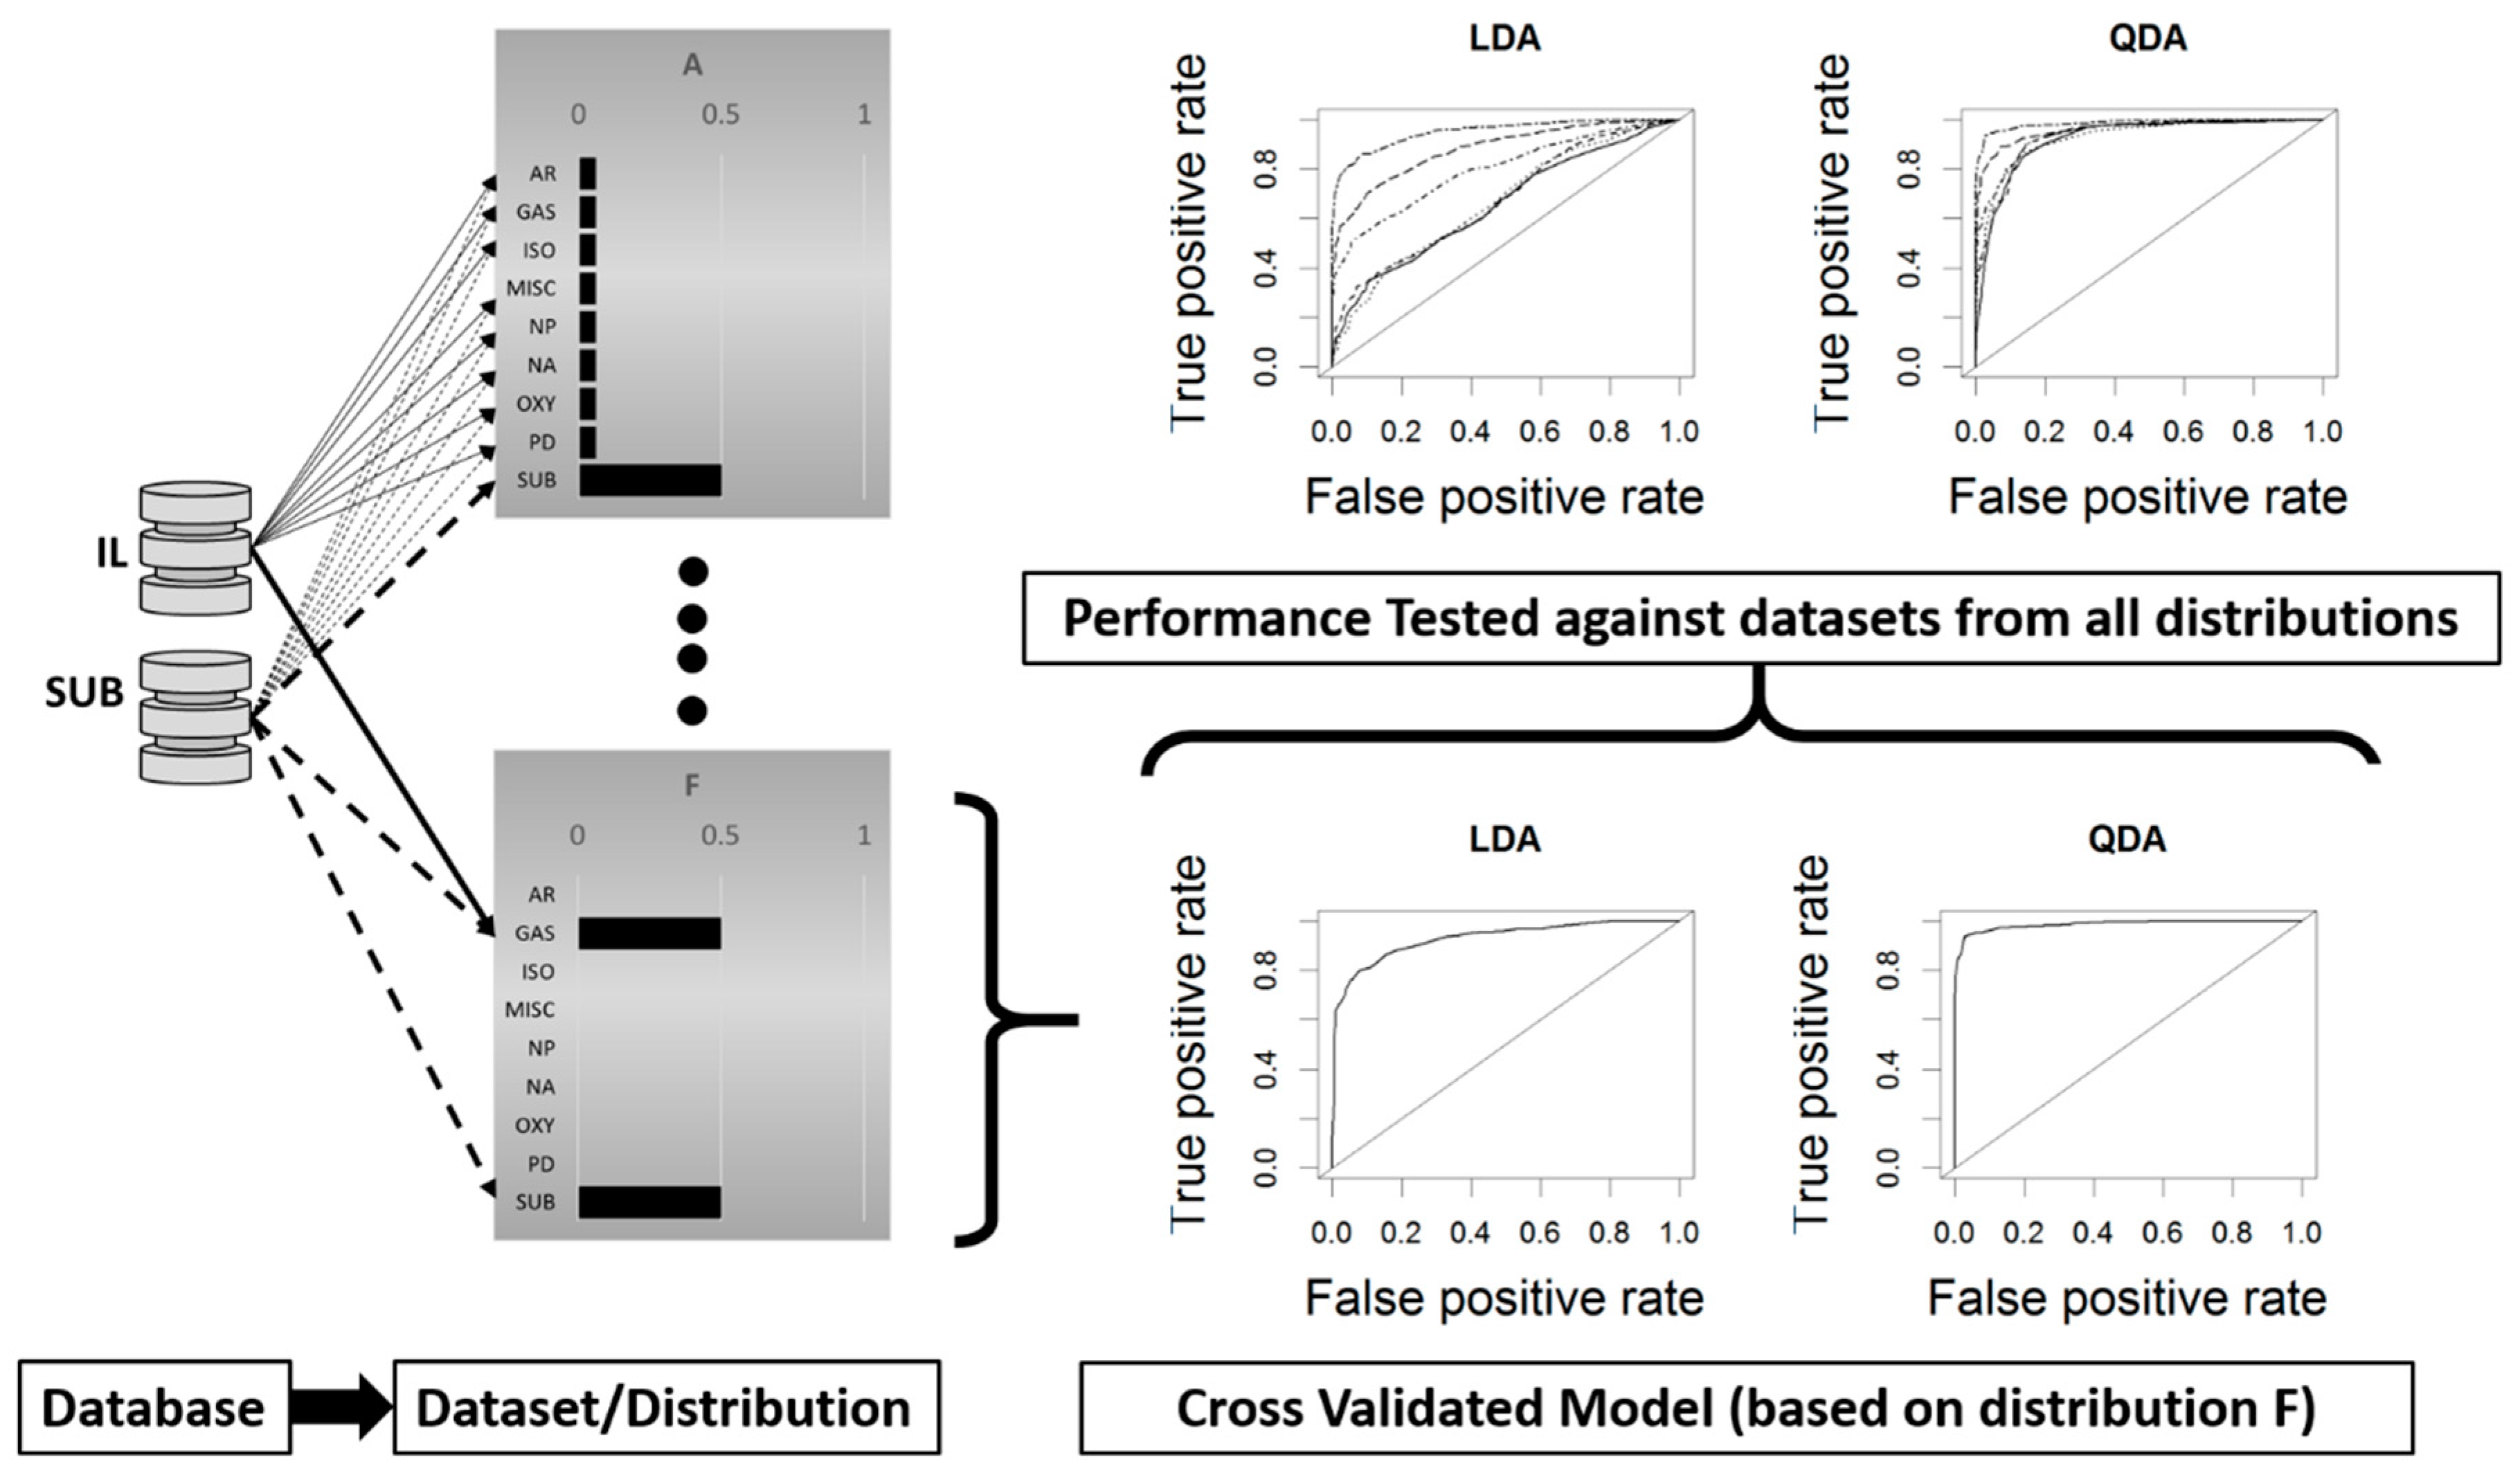
2.3. Model Testing Across Data Distributions

Following model development and calibration, 10% stratified (IL and SUB) test data samples were drawn from each data set A–F. Each test data set was projected into the principal component space described in the previous paragraph and likelihood ratios were calculated from the resulting scores. The likelihood ratios calculated by Equation (1) made use of the mean vectors and covariance matrices generated during model development. Likelihood ratios were transformed to LLRs and calibrated based on the isotonic regression from cross-validation likelihood ratios, as discussed in the previous paragraph. The calibrated LLR values from each test data set and their associated ground truth class membership (IL or SUB) allowed for the generation of ROC curves and recording the AUC for each curve. The sequence of model development, cross validation, calibration and testing was repeated 10 times for each distribution in Table 1. The modeling and testing process is diagramed in Figure 1.

2.4. Model Testing Against Known Ground Truth-Simulated Casework Samples

The QDA model based on Distribution A, Table 1, was used to evaluate 16 samples with known ground-truth class membership (IL or SUB), which were developed in the laboratory to simulate casework-relevant samples. Solutions of ignitable liquids and substrate materials were prepared separately in CS2 and then combined. Four ignitable liquids were evaporated 75% by volume. Ten microliters of the evaporated ignitable liquid was diluted with 500 µL of CS2. Volatile pyrolysis products from eight substrate materials, burned individually for 2 min utilizing the modified destructive distillation method, were extracted onto carbon by heating each sample at 66 °C for 16 h. The carbon strips were each extracted into 500 µL of CS2. Samples classified as containing no ignitable liquid (SUB) consisted of the eight burned substrate materials by themselves. The other eight fire debris samples, designated IL, contained an ignitable liquid with the pyrolysis products from one of the eight substrate materials. These samples were prepared by mixing a portion of the diluted ignitable liquids with the extract of the substrate material. Table 3 provides a description of the samples. Each sample was evaluated using the optimal distribution of the QDA model.

3. Results

Cross Validation Testing Across Distributions

Each cross validated and calibrated model based on distributions in Table 1 was tested with 10 stratified random draws of 1000 test samples from each data set, as described above. Table 4 lists the means and standard deviations for the ROC AUC from each model using each test data set. The results in the upper portion of Table 4 are based on the assumption of different covariance structures for the IL and SUB samples (i.e., the QDA equivalent). The results in the lower half of Table 4 are based on the assumption of equal covariance for IL and SUB and reflect the calculation from Equation (1) using the pooled covariance matrix for IL and SUB (i.e., the LDA equivalent).
The procedure and results for model development with distribution A and testing with distributions A–F are depicted in Figure 2. Similarly, the procedure and results for model development with F and testing with distributions A–F are depicted in Figure 3. The left side of the figures depicts the modeling of fire debris TIS based on the distributions from Table 1. The width of the arrows and the bar charts depict the relative contributions to the model by each ASTM ignitable liquid class and substrate pyrolysis. The single ROC curves demonstrate the cross validation performance of the LDA and QDA models. The plots showing multiple ROC curves demonstrate the range of performance observed when testing the cross validated models with simulated fire debris based on all of the distributions in Table 1.
Figure 4 and Figure 5 show plots that reveal more information regarding the performance of the QDA and LDA models, respectively, based on distribution A from Table 1. Both figures show (a) the ROC plot with LLR cutoff points labeled, (b) the Tippett plot, (c) the detection error trade-off (DET) plot and (d) the empirical cross-entropy (ECE) plot [9].

4. Discussion

4.1. Cross-Validation Testing Across Distributions

Based on the data in Table 4, it is observed that the AUC values for the QDA model are generally higher than the results for the LDA model equivalent. All QDA ROC AUC values exceed 0.9, whereas the LDA ROC AUC values are as low as 0.66, but generally larger than 0.85. The AUC is equal to the probability that a randomly chosen IL sample will have a higher LLR score than a randomly chosen sample from the SUB ground truth class. The AUC results in Table 4 demonstrate a better discrimination between IL and SUB samples by the QDA model. The QDA model produces a hyperquadric decision boundary and the cross-validated performance of the QDA model exceeds that of the LDA model, which produces a generalized hyperplane decision boundary.
Models based on distributions A–E demonstrate consistent performance across all testing distributions. Distribution F contains only SUB and IL samples comprised of GAS + SUB mixtures, and models based on distribution F show poorer performance when tested against the other distributions. The performance (AUC) appears to suffer when the testing distributions contain ignitable liquid classes not represented in the model. Models based on distributions A–C and E are comprised of representatives from all ignitable liquid classes, although the contributions varied across the IL classes. Distribution D contains contributions at fractions greater than 0.0005 for all classes except MISC. The overall AUC is highest and most consistent for the model based on distribution A, which contained equal amounts of IL and SUB ground truth samples and an equal number of samples from each IL class. These observations hold true for both the QDA and LDA models. Interestingly, model A performance appears stable within the variation represented by the distributions A–F. The same is not true with regard to the performance of the model based on distribution F and the AUC does not track with the similarities of distribution F with distributions A–E, see Table 2.
The effect of training distribution on model performance is also seen in Figure 2 and Figure 3. Figure 2 demonstrates that when a model is based on a distribution that contains all IL classes (i.e., distribution A), the model will perform well across all other distributions, even those that do not contain representatives from each IL class. The high AUC for the cross validated LDA and QDA models based on distribution A are an indication of good discrimination by the models. When the LDA and QDA models are tested on distributions A–F, the AUC for each of the test ROC curves is high and very similar to the cross validation curve. The same cannot be said for the performance of the model based on distribution F, which does not contain representatives from all IL classes, see Figure 3. In this case, the LDA and QDA models also work well in cross validation; however, there is a significant change in the discriminating power (lower AUC) when the testing distribution contains IL from classes that were not in the model based on distribution F. When calculating the likelihood ratio based on Equation (1) or Equation (2), the covariance matrix calculated from the TIS in the training dataset must account for variance and covariance observed in the test data.

4.2. Model Comparisons

In previous work [3], the authors compared (without calibration) the two models examined in this work and found that discrimination of cross validation samples was superior for the QDA model; however, the QDA model was poorly calibrated. In this work, calibration of the LLR values was introduced into the model. In addition, more SUB samples were included in the calculated mixtures and the overall number of mixed samples was increased from 6400 to 10,000. Evidence for better discrimination by the QDA model can be seen in the higher ROC AUC (Figure 4a and Figure 5a) and the smaller equal error rate (EER) (Figure 4c and Figure 5c). The EER and AUC are related, such that as the ROC AUC decreases, the EER will increase. A smaller EER, and higher AUC, indicates a better discriminating model.
Good discrimination by a model is necessary but not sufficient for forensic applications [9]. The amount of misleading evidence relative to a LLR = 0, (i.e., percent of ground truth IL samples with LLR < 0 and ground truth SUB samples with LLR > 0) can be visualized by the Tippett plot [9]. Comparison of Figure 4b and Figure 5b demonstrates the smaller amount of misleading cross-validation evidence for the QDA model, based on a boundary corresponding to a LLR = 0. If a model was biased toward either HIL or HSUB, this would be reflected in an asymmetry of the misleading evidence about the LLR = 0 line, which is not the case here. There is also a relationship between the ROC AUC and the amount of misleading evidence. As the ROC AUC decreases, the extent of misleading evidence increases. This follows directly from the fact that the AUC is the probability that a randomly selected ground truth IL sample will have a higher LLR (score) than a ground truth SUB sample. Bias in the model can only be observed in the ROC plots in Figure 4 and Figure 5 by labeling the LLR values on the ROC curve. In ROC space, the point at which the diagonal line from (0, 1) to (1, 0) intersects the ROC curve can be used to determine the EER (see above), and if the point of intersect is not at a LLR = 0, the model shows bias. In Figure 3a, the LDA model shows some bias.
Calibration cannot be visualized directly from the Tippet, DET or ROC plots. The combined model performance properties of discrimination and calibration constitute the accuracy of the method and can be visualized by examining the empirical cross-entropy (ECE) plots. The ECE plots, Figure 4d and Figure 5d, each contain three curves. The solid curve reflects the ECE (y axis) of the cross validation LR values calculated for a range of prior odds. The empirical cross entropy is given by Equation (8) [9], where P ( H X | I ) , N X and O ( H X | I ) (X = IL or SUB) are the prior probabilities, number of ground truth samples and the prior odds in favor of H X . In Equation (8), the prior probabilities and the prior odds have been written with the inclusion of I in the conditional. This term, I, accounts for additional information in the case under consideration. Equation (8) is a “strictly proper scoring rule”, as described by Zadora and coauthors [9].
  E C E = P ( H IL   | I ) N IL i :   H IL   is   true l o g 2 ( 1 + 1 L R i × O ( H IL | I ) ) + P ( H SUB | I ) N SUB j :   H SUB   is   true l o g 2 ( 1 + L R j × O ( H S UB | I ) )
The dashed curve is the ECE of the cross validation LR values following calibration by isotonic regression using the pooled adjacent violators (PAV) algorithm [12]. The ECE of the PAV-calibrated LR values represent maximum discrimination by the model. Lower ECE values of the dashed curve in the ECE plot reflect a more highly discriminating model. The dotted curve represents the ECE of the LR values of a neutral reference, which always produces a LR value equal to one. When the solid and dashed curves in the ECE plot lie close to each other, the model is well calibrated.
The ECE plots in Figure 4d and Figure 5d show that both the QDA and LDA models are well calibrated. The LDA model was well calibrated in the previous work [3], and adding an independent calibration step has not visibly improved or detracted from the model’s performance. On the other hand, the QDA model was not well calibrated in the previous report [3]; however, the addition of an independent calibration step in this work has greatly improved the calibration, as reflected in Figure 4d. The ECE plot in Figure 4d also demonstrates higher discriminating power for the QDA model.
The data presented in Table 2 and Figure 2 and Figure 3 demonstrate consistently superior performance of the QDA model acting on the cross-validation data. The cross validation makes use of computationally-generated known ground truth data; however, due to the method by which the model data was prepared, there is no guarantee that it is truly representative of fire debris data. In the following section, the performance of the QDA model is examined for known ground truth data that is representative of casework samples.

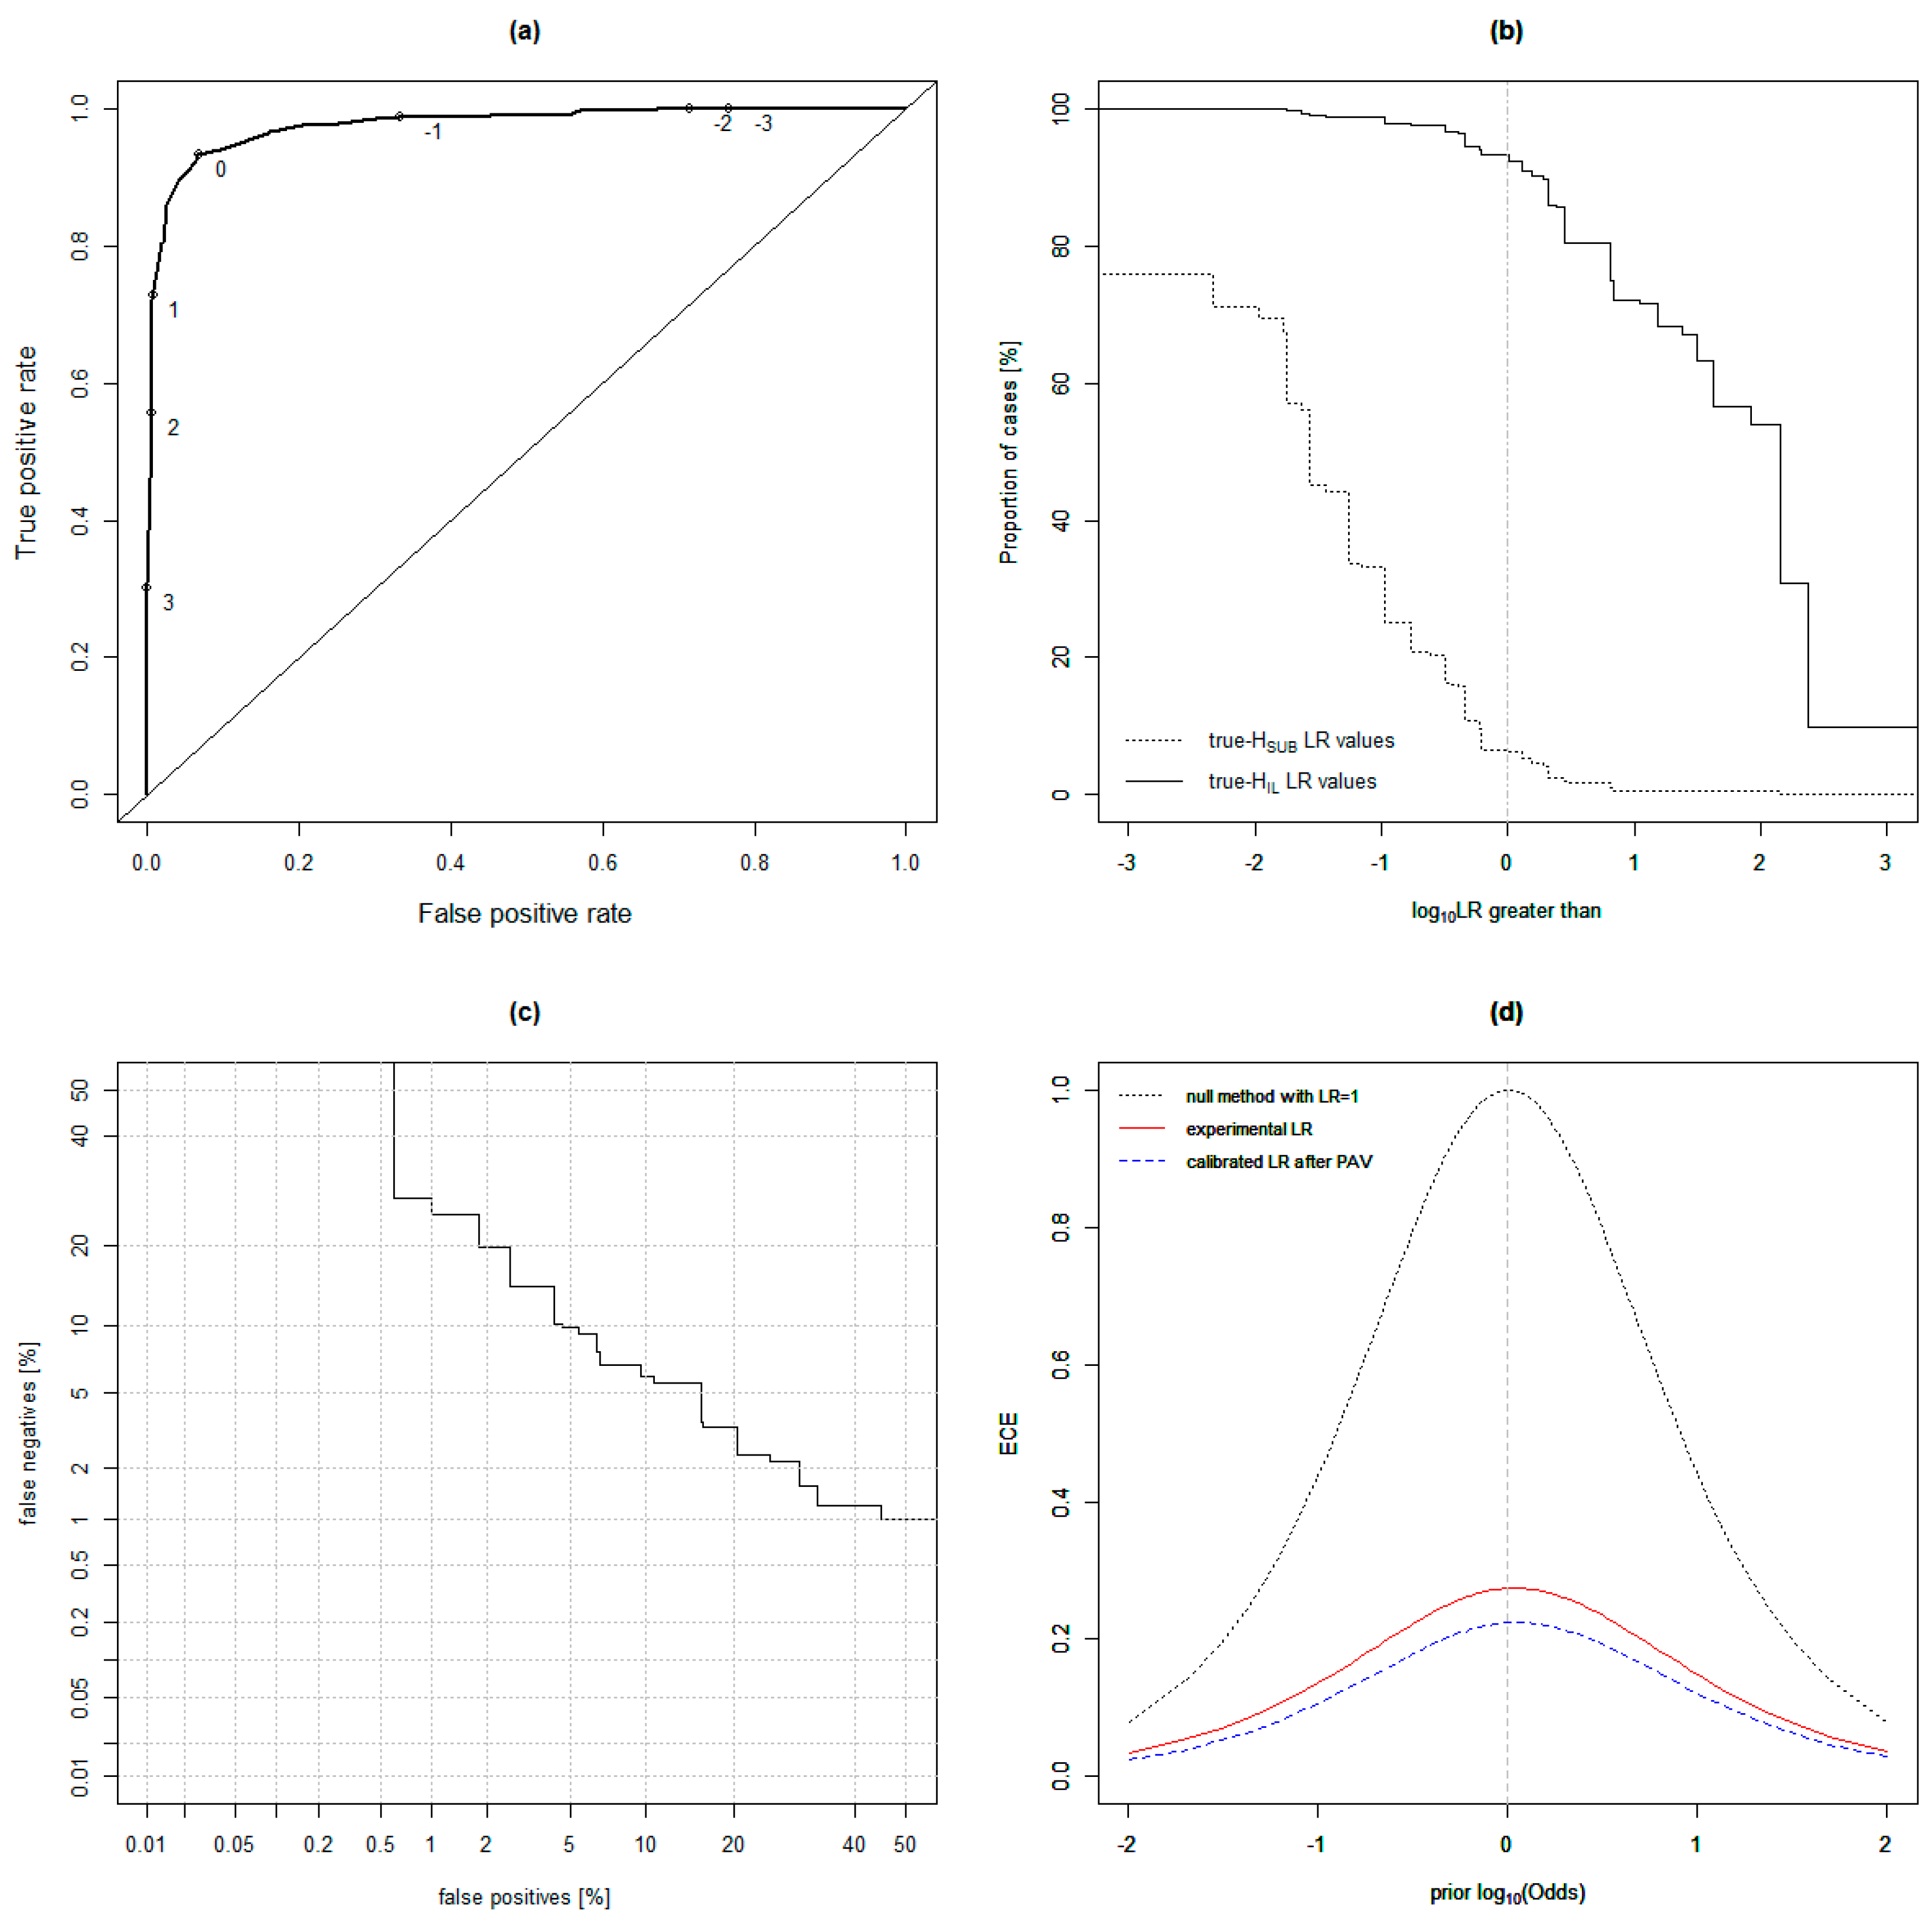
4.3. Testing the Quadratic Discriminant Analysis (QDA) Model on Known Ground Truth-Simulated Casework Samples

Casework-relevant samples with known ground truth were prepared as described in Section 2.4 and analyzed by the same gas chromatography-mass spectrometry (GC-MS) methods used for the analysis of database IL and SUB samples. The TIS resulting from GC-MS analysis of the known ground truth samples were evaluated by the QDA model based on distribution A, Table 1. The resulting LLR values for each sample are given in Table 5, along with the supported hypothesis, and the level of support, as reflected by the verbal scale reported by Evett et al. [15]. The column labeled “Misleading Evidence” in Table 5 indicates whether the sample would constitute misleading evidence based on a threshold LLR of 0. The model indicated only limited support for the incorrect class (IL) for two of the misleading samples, A and P. On the other hand, the model provided moderate support for the absence of IL residue in sample B. Sample B was comprised of an isoparaffinic liquid mixed with pyrolysis products from a leather jacket. The IL (Exxon Isopar C, ILRC SRN 120) is a light isoparaffinic comprised mainly of 2,2,4-trimethylpentane and lesser amounts of other isomers of trimethylpentane and dimethylhexanes. This light isoparaffinic solvent does not produce a chromatographic pattern typically associated with a higher average molecular weight isoparaffinic solvent.
From the data in Table 5, we can assess the performance of the model based on the Wilcoxon-Mann-Whitney U-statistic. The ROC AUC is equal to the Mann-Whitney U value divided by the product of the number of ground truth IL and SUB samples, i.e., AUC = U / ( N IL × N SUB ) . An AUC of 0.836 is calculated from the data in Table 5.

5. Conclusions

This work demonstrates the importance of selecting a relevant population that is representative of all ASTM E1618-14 IL classes typically observed in casework when building an LDA or QDA model for sample classification. It is also shown that an additional step, in which the LLR values are calibrated, can improve model performance [3]. Independent validation with known ground truth samples that are casework-relevant is important for models that are based on fire debris samples that are generated in-silico. Building models based on a large sampling of known ground truth samples that are casework-relevant is, perhaps, a better approach; however, in fire debris analysis it is challenging to collect a substantial number of known ground truth samples. Certainly the experimental generation of 10,000 known ground truth samples that were casework-relevant would be a challenge. Current research in the author’s laboratory is directed towards the experimental generation of a much larger number of known ground truth samples that can be used to validate models based on in-silico-generated data.

Author Contributions

Conceptualization, M.E.S. and M.R.W.; Methodology, A.A., M.R.W., N.T. and M.E.S.; Software, M.E.S. and A.A.; Validation, A.A., M.R.W., N.T. and M.E.S.; Formal Analysis, M.E.S.; Investigation, A.A.; Resources, M.R.W.; Data Curation, A.A., M.R.W. and M.E.S.; Writing-Original Draft Preparation, A.A.; Writing-Review and Editing, M.E.S., M.R.W., N.T. and A.A.; Visualization, M.E.S. and A.A.; Supervision, M.E.S.; Project Administration, M.R.W. and M.E.S.; Funding Acquisition, M.E.S.

Funding

This project was supported by Award Number 2015-DN-BXK051 awarded by the National Institute of Justice, Office of Justice Programs, U.S. Department of Justice. The opinions, findings, and conclusions or recommendations expressed in this publication are those of the authors and do not necessarily reflect those of the Department of Justice.

Conflicts of Interest

The authors declare no conflict of interest.

References

  1. ASTM International. Standard Test Method for Ignitable Liquid Residues in Extracts from Fire Debris Samples by Gas Chromatography-Mass Spectrometry; ASTM International: West Conshohocken, PA, USA, 2014. [Google Scholar]
  2. Lopatka, M.; Sigman, M.E.; Sjerps, M.J.; Williams, M.R.; Vivo-Truyols, G. Class-conditional feature modeling for ignitable liquid classification with substantial substrate contribution in fire debris analysis. Forensic Sci. Int. 2015, 252, 177–186. [Google Scholar] [CrossRef] [PubMed]
  3. Sigman, M.E.; Williams, M.R. Assessing evidentiary value in fire debris analysis by chemometric and likelihood ratio approaches. Forensic Sci. Int. 2016, 264, 113–121. [Google Scholar] [CrossRef] [PubMed]
  4. Waddell, E.E.; Song, E.T.; Rinke, C.N.; Williams, M.R.; Sigman, M.E. Progress toward the determination of correct classification rates in fire debris analysis. J. Forensic Sci. 2013, 58, 887–896. [Google Scholar] [CrossRef] [PubMed]
  5. Waddell, E.E.; Williams, M.R.; Sigman, M.E. Progress toward the determination of correct classification rates in fire debris analysis ii: Utilizing soft independent modeling of class analogy (SIMCA). J. Forensic Sci. 2014, 59, 927–935. [Google Scholar] [CrossRef] [PubMed]
  6. Williams, M.R.; Sigman, M.E.; Lewis, J.; Pitan, K.M. Combined target factor analysis and bayesian soft-classification of interference-contaminated samples: Forensic fire debris analysis. Forensic Sci. Int. 2012, 222, 373–386. [Google Scholar] [CrossRef] [PubMed]
  7. Coulson, R.; Williams, M.R.; Allen, A.; Akmeemana, A.; Ni, L.; Sigman, M.E. Model-effects on likelihood ratios for fire debris analysis. Forensic Chem. 2018, 7, 38–46. [Google Scholar] [CrossRef]
  8. Zadora, G.; Neocleous, T. Likelihood ratio model for classification of forensic evidence. Analytica Chim. Acta 2009, 642, 266–278. [Google Scholar] [CrossRef] [PubMed]
  9. Zadora, G.; Martyna, A.; Ramos, D.; Aitken, C. Statistical Analysis in Forensic Science: Evidential Value of Multivariate Physicochemical Data; John Wiley & Sons Ltd.: West Sussex, UK, 2014. [Google Scholar]
  10. National Center for Forensic Science. Substrate Database, 2017 ed.; National Center for Forensic Science: Orlando, FL, USA, 2017. [Google Scholar]
  11. National Center for Forensic Science. Ignitable Liquids Reference Collection and Database (ILRC); National Center for Forensic Science: Orlando, FL, USA, 2017. [Google Scholar]
  12. Zadrozny, B.; Elkan, C. Transforming classifier scores into accurate multiclass probability estimates. In Proceedings of the Eighth ACM SIGKDD International Conference on Knowledge Discovery and Data Mining, Edmonton, AB, Canada, 23–25 July 2002; pp. 694–699. [Google Scholar]
  13. Sigman, M.E.; Williams, M.R.; Castelbuono, J.A.; Colca, J.G.; Clark, C.D. Ignitable liquid classification and identification using the summed-ion mass spectrum. Instrum. Sci. Technol. 2008, 36, 375–393. [Google Scholar] [CrossRef]
  14. De Leeuw, J.; Hornik, K.; Mair, P. Isotone optimization in R: Pool-adjacent-violators algorithm (PAVA) and active set methods. J. Stat. Softw. 2009, 32, 24. [Google Scholar] [CrossRef]
  15. Evett, I.W.; Jackson, G.; Lambert, J.A.; McCrossan, S. The impact of the principles of evidence interpretation on the structure and content of statements. Sci. Justice 2000, 40, 233–239. [Google Scholar] [CrossRef]
Figure 1. Diagram showing the model construction and testing steps.
Separations 05 00044 g001
Figure 2. Procedure and results for developing LDA and QDA models based on a dataset having distribution A (Table 1) and testing the model with datasets having distributions A–F (Table 1).
Separations 05 00044 g002
Figure 3. Procedure and results for developing LDA and QDA models based on a dataset having distribution F (Table 1) and testing the model with datasets having distributions A–F (Table 1).
Separations 05 00044 g003
Figure 4. Plots showing the performance of a model based on distribution A from Table 1 and the assumption of different covariance matrices for the IL and SUB classes (i.e., QDA model) using Equation (1). Plots include: (a) the ROC plot with LLR cutoff points labeled, (b) the Tippett plot, (c) the detection error trade-off (DET) plot and (d) the empirical cross-entropy (ECE) plot.
Separations 05 00044 g004
Figure 5. Plots showing the performance of a model based on distribution A from Table 1 and the pooled covariance for the IL and SUB classes (i.e., LDA model) using Equation (1). Plots include: (a) the ROC plot with LLR cutoff points labeled, (b) the Tippett plot, (c) the DET plot and (d) the ECE plot.
Separations 05 00044 g005
Table 1. Population distributions used to create model distribution data sets in this study: (A) Uniform across samples containing ignitable liquid residue (IL) classes and balanced total IL and samples that do not contain ignitable liquid residue (SUB) contributions. (B) Uniform across IL classes and unbalanced total IL and SUB contributions. (C) Distribution of IL classes in the Ignitable Liquids Reference Collection, and Substrates databases. (D) Distribution of IL classes and SUB from large scale burns previously reported in [7]. (E) Distribution of IL classes and SUB determinations from 70,000 cases over 10 years, as previously reported in [7]. (F) Balanced IL and SUB with only gasoline contributing to the distribution of IL classes.
ClassesABCDEF
Aromatic solvents (AR)0.0630.0940.0420.0440.0050.000
Gasoline (GAS)0.0630.0940.0410.2810.3300.500
Isoparaffinic solvents (ISO)0.0630.0940.0620.0540.0030.000
Miscellaneous (MISC)0.0630.0940.1640.0000.0580.000
Naphthenic paraffinic solvents (NP)0.0630.0940.0300.0340.0020.000
Normal alkanes (NA)0.0630.0940.0280.0390.0030.000
Oxygenates (OXY)0.0630.0940.1230.0340.0120.000
Petroleum distillates (PD)0.0630.0940.2950.1180.0620.000
Pyrolyzed substrates (SUB)0.5000.2500.2150.3940.5250.500
Table 2. Similarity between distributions calculated from Equations (6) and (7), and the fractional contributions in Table 1.
ABCDE
B0.790
C0.7190.800
D0.7930.7800.717
E0.7710.7060.6610.846
F0.6810.6500.6040.7770.838
Table 3. Composition on known ground truth simulated casework samples. The IL SRN corresponds to the sample record number in the Ignitable Liquids Reference Collection and Database (ILRC) [11].
Sample (Ground Truth)Ignitable Liquid SRN/ClassSubstrate Material DescriptionIL:SUB Ratio
A (SUB)noneolefin carpet and padding0
B (IL)120/isoparaffinicleather jacket3.5
C (IL)259/gasolinevinyl flooring1
D (SUB)nonemilk jug and duct tape0
E (IL)46/MPDroofing shingle1.76
F (SUB)nonevinyl flooring0
G (SUB)nonepolyester carpet0
H (IL)120/isoparaffinicpolyester carpet0.25
I (IL)73/aromaticolefin carpet and padding0.25
J (SUB)nonelaminate flooring and newspaper0
K (IL)73/aromaticpolyester carpet and padding1
L (SUB)nonepolyester carpet and padding0
M (SUB)noneleather jacket0
N (IL)259/gasolinemilk jug and duct tape0.25
O (IL)46/MPDlaminate flooring and newspaper1
P (SUB)noneroofing shingle0
Table 4. Area under the receiver operating characteristic curve (ROC AUC) means and standard deviations from each model distribution (rows, labeled A–F) using each test data set (columns, labeled A–F). The upper portion of the Table gives results based on the assumption of different covariance structures for the IL and SUB samples (i.e., the quadratic discriminant analysis (QDA) equivalent). Results in the lower half of the Table are based on the assumption of equal covariance for IL and SUB and reflect the calculation from Equation (1) using the pooled covariance matrix for IL and SUB (i.e., the linear discriminant analysis (LDA) equivalent).
Testing Distributions in Columns
ModelABCDEF
IL and SUB Independent Covariance Matrices (QDA)
A0.975 ± 0.0050.975 ± 0.0040.972 ± 0.0040.976 ± 0.0030.975 ± 0.0040.978 ± 0.004
B0.927 ± 0.0080.941 ± 0.0050.923 ± 0.0080.937 ± 0.0060.935 ± 0.0060.942 ± 0.008
C0.921 ± 0.0070.929 ± 0.0070.928 ± 0.0070.929 ± 0.0060.928 ± 0.0070.930 ± 0.009
D0.954 ± 0.0060.956 ± 0.0050.949 ± 0.0040.974 ± 0.0030.965 ± 0.0060.976 ± 0.003
E0.969 ± 0.0080.969 ± 0.0040.966 ± 0.0030.977 ± 0.0040.982 ± 0.0030.984 ± 0.003
F0.923 ± 0.0120.921 ± 0.0090.924 ± 0.0070.951 ± 0.0080.962 ± 0.0060.985 ± 0.003
Pooled Covariance Matrix for IL and SUB (LDA)
A0.878 ± 0.0080.876 ± 0.0110.875 ± 0.0110.884 ± 0.0080.879 ± 0.0120.882 ± 0.010
B0.873 ± 0.0080.877 ± 0.0120.870 ± 0.0140.879 ± 0.0070.878 ± 0.0100.881 ± 0.010
C0.865 ± 0.0080.866 ± 0.0130.875 ± 0.0140.868 ± 0.0080.865 ± 0.0110.863 ± 0.012
D0.864 ± 0.0100.859 ± 0.0090.853 ± 0.0130.898 ± 0.0080.889 ± 0.0130.913 ± 0.011
E0.855 ± 0.0100.852 ± 0.0110.858 ± 0.0140.892 ± 0.0100.910 ± 0.0120.928 ± 0.009
F0.665 ± 0.0210.664 ± 0.0150.691 ± 0.0160.777 ± 0.0170.864 ± 0.0130.943 ± 0.011
Table 5. Results from testing the QDA model from Distribution A, Table 1, on 16 known ground truth simulated casework samples.
SampleGround TruthLLRHypothesis SupportedLevel of SupportMisleading EvidenceIL:SUB Ratio
ASUB0.292HILLimitedYes0
BIL−1.037HSUBModerateYes3.5
CIL2.577HILModerately StrongNo1
DSUB−0.508HSUBLimitedNo0
EIL2.095HILModerately StrongNo1.76
FSUB−0.508HSUBLimitedNo0
GSUB0.000HSUBLimitedNo0
HIL0.249HILLimitedNo0.25
IIL20.000HILVery StrongNo0.25
JSUB−0.508HSUBLimitedNo0
KIL20.000HILVery StrongNo1
LSUB−0.348HSUBLimitedNo0
MSUB−1.037HSUBModerateNo0
NIL2.577HILModerately StrongNo0.25
OIL0.292HILLimitedNo1
PSUB0.292HILLimitedYes0

