Article

Titania and Zinc Oxide Nanoparticles: Coating with Polydopamine and Encapsulation within Lecithin Liposomes—Water Treatment Analysis by Gel Filtration Chromatography with Fluorescence Detection

Ottawa-Carleton Chemistry Institute, Department of Chemistry, Carleton University, Ottawa, ON K1S 5B6, Canada
*
Author to whom correspondence should be addressed.
Separations 2018, 5(1), 13; https://doi.org/10.3390/separations5010013
Submission received: 14 November 2017 / Revised: 29 January 2018 / Accepted: 2 February 2018 / Published: 8 February 2018

Abstract

:
The interplay of metal oxide nanoparticles, environmental pollution, and health risks is key to all industrial and drinking water treatment processes. In this work we present a study using gel filtration chromatography for the analytical investigation of metal oxide nanoparticles in water, their coating with polydopamine, and their encapsulation within lecithin liposomes. Polydopamine prevents TiO2 and ZnO nanoparticles from aggregation during chromatographic separation. Lecithin forms liposomes that encapsulate the nanoparticles and carry them through the gel filtration column, producing an increase of peak area for quantitative analysis without any change in retention time to affect qualitative identification. To the best of our knowledge, this is the first report that demonstrates the potential application of lecithin liposomes for cleaning up metal oxide nanoparticles in water treatment. Encapsulation of graphene quantum dots by liposomes would allow for monitoring of nanoparticle-loaded liposomes to ensure their complete removal by membrane ultrafiltration from treated water.

1. Introduction

Nanomaterials exhibit novel physicochemical properties that continue to promote their use in various industrial manufacturing processes. The top applications of nanomaterials in North America includes catalysts, coatings, electronics, food products, paints, rubber tires, and textiles [1]. Three metal oxide nanoparticles having sizes between 1 and 100 nanometers, namely titania (TiO2), zinc oxide (ZnO), and ceria (CeO2), are produced in high tonnage for use as additives in nanomaterials worldwide. TiO2 nanoparticles are used as a fine whitener in cosmetics and sunscreen products because of their brightness, high refractive index, and resistance to discoloration. However, concerns are increasing recently about environmental pollution and the health risks of widespread exposure to TiO2 nanoparticles. Long et al. reported that TiO2 nanoparticles can produce reactive oxygen species that cause many diseases including immortalized brain microglia in mice [2,3]. Trouiller et al. found that TiO2 nanoparticles are inducers of DNA damage and genetic instability in mice [4]. Chang et al. found a high percentage of biological toxicity when the liver and kidneys were exposed to TiO2 nanoparticles [5]. Grande and Tucci lately discussed the potential human health risks induced by exposure to TiO2 nanoparticles [6]. Disdier demonstrated that, despite a lack of brain translocation, exposure to TiO2 nanoparticles induces blood-brain carrier physiology alteration and neuro-inflammation that may lead to central nervous system disorders [7]. Shah et al. have emphasized the biological and chemical concerns about TiO2 nanoparticles as well as their toxicological profile at the molecular level [8]. Water pollution has become a major concern for many countries in recent years due to the rapid industrialization of nanotechnologies. Hence, the development of industrial wastewater and drinking water treatment systems to remove TiO2 among other metal oxide nanoparticles is vital to providing long-term environmental and public health security [9,10,11].
Polydopamine (PDA) is a multifunctional biopolymer structurally similar to naturally occurring melanin [12]. PDA nanocapsules have been successfully used for drug delivery [13]. Their good biocompatibility and biodegradability have facilitated biomedical development for use as both a photoacoustic imaging contrast agent and a chemothermotherapy agent for tumors [14]. The high wrapping tendency of PDA has favored the fabrication of Au-PDA nanoparticles with an ultrathin (1.3 nm) shell for high sensitivity, uniformity, and stability in shell-isolated nanoparticle-enhanced Raman spectroscopy [15]. A new magnetic molecularly imprinted polymer has been prepared by polymerizing dopamine on the surface of Fe3O4 nanoparticles in the presence of thionine template [16]. Novel ultrafiltration-adsorption membranes have been designed via decorating the walls of membrane internal pores with PDA nanoparticles for removal of Pb2+, Cd2+ and Cu2+ [17]. A highly efficient nanofiltration membrane can be fabricated via surface decoration of metal-organic framework/graphene oxide composite onto PDA-coated polysulfone substrate [18]. The PDA coating can be dissolved in an alkaline solution to regenerate the membrane [19]. Dopamine can be added to coat metal oxide nanoparticles under ultrasonication with PDA, which breaks up all coagulated nanoparticles and prevents any re-aggregation to merit accurate analysis [20].
Lecithin, being a mixture of phospholipids, is the main component of lipid matrix in biological membranes [21]. Crude lecithin is commercially available at a low cost in large quantities. This natural zwitterionic surfactant can self-organize into lamellar Lα mesophase when small amounts of water are admixed [22]. Liposomes of soy lecithin are readily prepared by strong sonication [23], dehydration-rehydration-heating [24], and thin film ultrasonic dispersion [25,26] to form an inner aqueous compartment surrounded by a concentric bilayer of phospholipids. They are environmentally friendly and simple to manufacture at a high lipid concentration [27]. Microfluidization is more efficient than ultrasonication in particle size reduction [28]. As the lipid bilayer membrane has an average particle size from 110 nm to 990 nm [29], they are a cost-effective option for many applications to deliver drugs, imaging agents, peptides, proteins, and nucleic acids [29,30,31,32,33,34]. Nano-liposomes of crude soy lecithin are also effective for cleaning fuel oil-contaminated sands and soils [35]. The development of polymer-liposome complexes for biomedical applications is growing rapidly [36,37]. A liposome—Ag-Au core/shell nanocomposite is good for drug delivery by near infrared laser irradiation [38]. All these previous works contributed to our idea that lecithin liposomes can readily encapsulate metal oxide nanoparticles.
Gel filtration chromatography (GFC) is a versatile analytical technique that permits the effective separation of proteins and other biological molecules in an aqueous buffer solution [39]. Separation is achieved using a porous gel matrix to which analyte molecules, for steric reasons, have different degrees of access solely on the basis of molecular size [40]. Water is commonly used to pre-equilibrate the gel-filtration matrix. The mechanism of size exclusion is also applicable for the separation of nanoparticles after surface functionalization to improve their stability [41,42,43,44]. Unfortunately, TiO2 nanoparticles form aggregates in aqueous suspension as a function of the electrolyte ionic strength and nature of the divalent cations typically found in surface water and soil [45]. TiO2 nanoparticles selectively adsorb water-soluble organic phosphates [46]. Lecithin at 5 μg/mL can stabilize these nanoparticles [47]. Mesoporous carbon can be nano-emulsified in a lecithin O/W system to be trapped in the pores of TiO2 for cosmetic applications [48].
In this work, GFC was used to investigate TiO2 and ZnO nanoparticles in water by fluorescence detection, after coating them with PDA and encapsulating them within lecithin liposomes. It was crucial to prevent aggregation of these nanoparticles in every water sample, to carry them through the gel filtration column without excessive retention, and to obtain reproducible detection peaks during chromatographic separation. Potential applications for cleaning up metal oxide nanoparticles during industrial wastewater and drinking water treatment are proposed. The idea of using lecithin liposomes for nanoparticle pre-concentration and removal in water treatment analysis is innovative. Its development into an industrial procedure is feasible as the reported critical micellar concentration of lecithin is around 0.4 mg/mL and the assembled lecithin liposomes have a typical size of 100–1000 nm, which is sufficient to accommodate all sizes of nanoparticles.

2. Materials and Methods

2.1. Materials

Methanol was purchased from VWR (Mississauga, ON, Canada). Soy lecithin in oil form was obtained from Vita Health Products (Winnipeg, MB, Canada). Titanium dioxide nanopowder (21 nm primary particle size), zinc oxide powder (maximum particle size: 45 nm), and Tris base (pKa = 8.2) were obtained from Sigma-Aldrich (Oakville, ON, Canada).

2.2. Coating of TiO2 or ZnO Nanoparticles with Polydopamine

TiO2 or ZnO nanoparticles (100 mg), dopamine (100 mg), Tris (63 mg), and distilled deionized water (60 mL) were mixed by magnetic stirring for 1 h. The mixture was centrifuged at 4500 rpm for 30 min, the supernatant was discarded, and the TiO2-PDA or ZnO-PDA nanoparticles were re-suspended in deionized water (40 mL) for all subsequent experiments.

2.3. Lecithin Liposomes Blank

A thick syringe needle was inserted to a capsule of lecithin oil for half an hour to suck lecithin slowly into the syringe. A mixture of lecithin (0.05 mL) and methanol (4.95 mL) was sonicated by an unbranded ultrasonic homogenizer (20 kHz, 108 W, sequentially powered on for 2 s, and powered off for 5 s) for 5 min at room temperature to form a uniform dispersion. This dispersion was mixed with distilled deionized water, obtained from a Millipore Milli-Q water system (Bedford, MA, USA), at a ratio of 1:2 by volume to serve as a lecithin liposomes blank, for comparison with TiO2 or ZnO nanoparticles encapsulated within lecithin liposomes, in GFC-FD analysis. In a mixture of methanol and water (1:2 ratio), the dispersion of lecithin liposomes is stable for at least an hour, which was enough time the GFC-FD analysis.

2.4. Lecithin Liposome-Encapsulated TiO2 or ZnO Nanoparticles

To prepare lecithin liposome-encapsulated TiO2 or ZnO nanoparticles, different concentrations of nanoparticles (from 0.01 to 1.0 mg/mL prepared daily in our laboratory using distilled deionized water as the dispersion medium) were mixed with the lecithin liposomes blank at a ratio of 2:1 by volume. The mixtures were homogenized by the ultrasonic homogenizer (20 kHz, 108 W, sequentially powered on for 2 s and powered off for 5 s) for 5 min at room temperature to form uniform suspensions before GFC-FD analysis. Furthermore, different amounts (50–250 μL) of lecithin liposomes were added to either distilled deionized water (500 μL) or 1.0 mg/mL TiO2 nanoparticles (500 μL), followed by addition of distilled deionized water until the total volume was 750 μL.

2.5. UV-Visible Absorption and Fluorescence Emission Spectroscopy

Fluorescence excitation and emission spectra of samples were measured on a Horiba Jobin Yvon (Edison, NJ, USA) FluoroMax-4 spectrofluorometer using a slit width of 4 nm for both emission and excitation. First under excitation by UV light at a wavelength of 300 nm, the emission wavelength was scanned from 350 to 550 nm to obtain a fluorescence emission spectrum. Next by monitoring the emission intensity at a wavelength of 450 nm, the excitation wavelength was scanned from 200 to 400 nm to obtain a fluorescence excitation spectrum.

2.6. Gel Filtration Chromatography

Gel filtration chromatography was performed on a Shimadzu LC-6A system (Columbia, MD, USA), initially using a short column (Shodex SHSB-807G, 50 × 8 mm, 35 μm, MWCO 10,000) for rapid analysis and eventually on a long column (Shodex SB-807HQ, 300 × 8 mm, MWCO 10,000) for extended analysis. Both columns were purchased from Canadian Life Science (Peterborough, ON, Canada). Distilled deionized water was used as the mobile phase at a flow rate ranging from 0.3 mL/min to 1.0 mL/min. The GFC system was coupled to a Jasco FP-2020 Plus intelligent fluorescence detector (Easton, MA, USA). Fluorescence detection (FD) employed λex = 365 nm and λem = 460 nm for TiO2-PDA determination, or λex,max = 350 nm and λem,max = 395 nm for TiO2 determination.

3. Results and Discussion

Before GFC could be used to investigate the coating of TiO2 nanoparticles in water with PDA and their encapsulation within lecithin liposomes, their fluorescence properties were studied in order to determine the excitation and emission wavelengths for selective and sensitive detection. Ultrasonic homogenization was evaluated for facilitating the encapsulation of TiO2-PDA nanoparticles by lecithin liposomes, by observing if reproducible peaks could be obtained from GFC-FD analysis for the chromatographic characterization of lecithin liposome-encapsulated TiO2-PDA nanoparticles. A short GFC column was initially used for rapid analysis and a long column was used for extended analysis to characterize their retention time, retention volume, and peak area at different flow rates of the mobile phase. After the feasibility of determining TiO2 nanoparticles in the presence of lecithin liposomes was confirmed, the potential application of lecithin liposomes for encapsulating other metal oxide nanoparticles would be demonstrated with ZnO nanoparticles. Optimization of the new method was carried out by adding different amounts of lecithin liposomes to a fixed concentration of TiO2 nanoparticles. In order to develop a cost effective technology for the removal of metal oxide nanoparticles in water treatment, graphene quantum dots were tested as a fluorescent sensor for monitoring the complete removal of nanoparticle-loaded liposomes from the treated water.

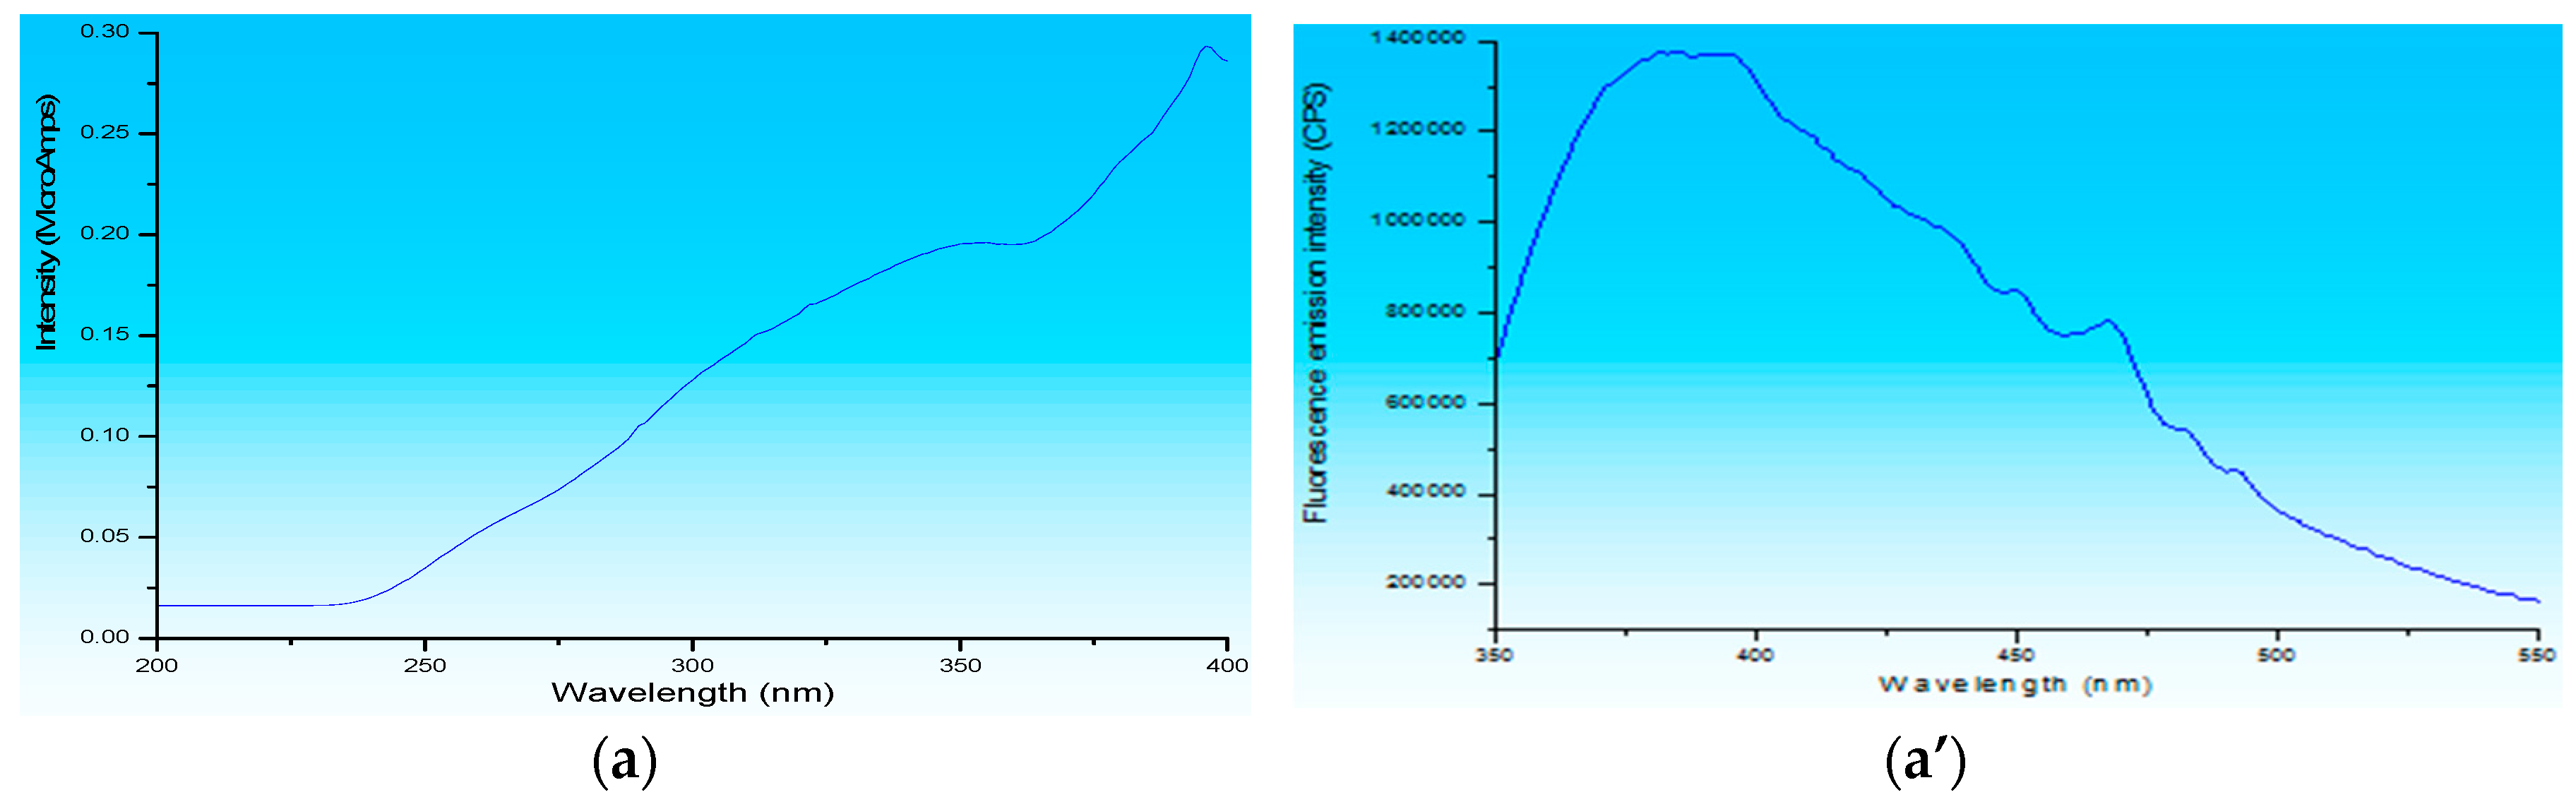
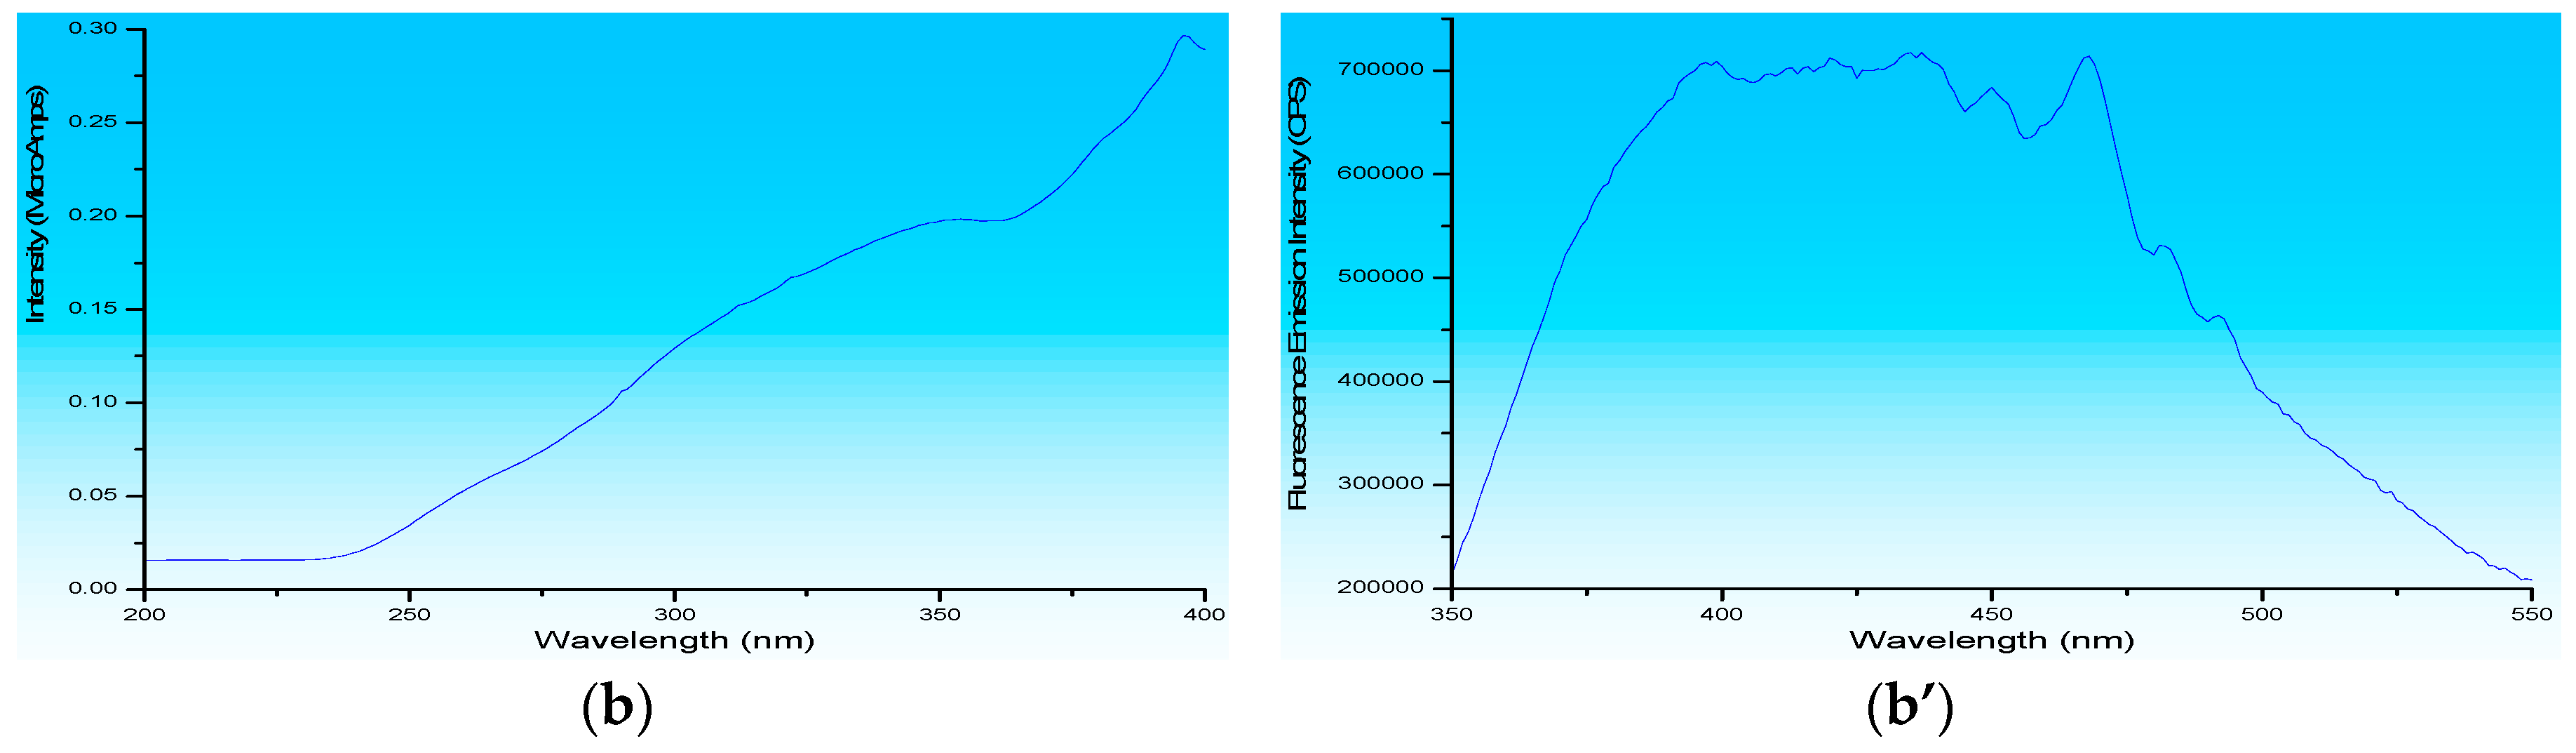
3.1. Fluorescence Spectroscopy

The fluorescence property of lecithin liposome-encapsulated TiO2 nanoparticles was determined first. The maximum excitation and emission wavelengths were measured to be λex,max = 350 nm and λem,max = 395 nm in Figure 1a,a’. Next, λex = 365 nm and λem = 460 nm were determined for lecithin-bound TiO2-PDA nanoparticles in Figure 1b,b’. Both excitation spectra look very similar because lecithin liposomes are nearly transparent, the PDA coating is only a couple nanometers thick, and TiO2 nanoparticles were mainly responsible for absorption of the UV light from 230 nm to 400 nm. The two emission spectra are obviously different due to energy transfer from TiO2 nanoparticles emission at 395 nm to PDA emission at 460 nm in Figure 1b only. Efficient and facile coating of TiO2 nanoparticles with PDA had previously been reported in the scientific literature [49,50]. The transmission electron microscopy images of TiO2 and TiO2-PDA nanoparticles in Figure 2 below show how difficult it is to see their difference due to a thin organic PDA coating.

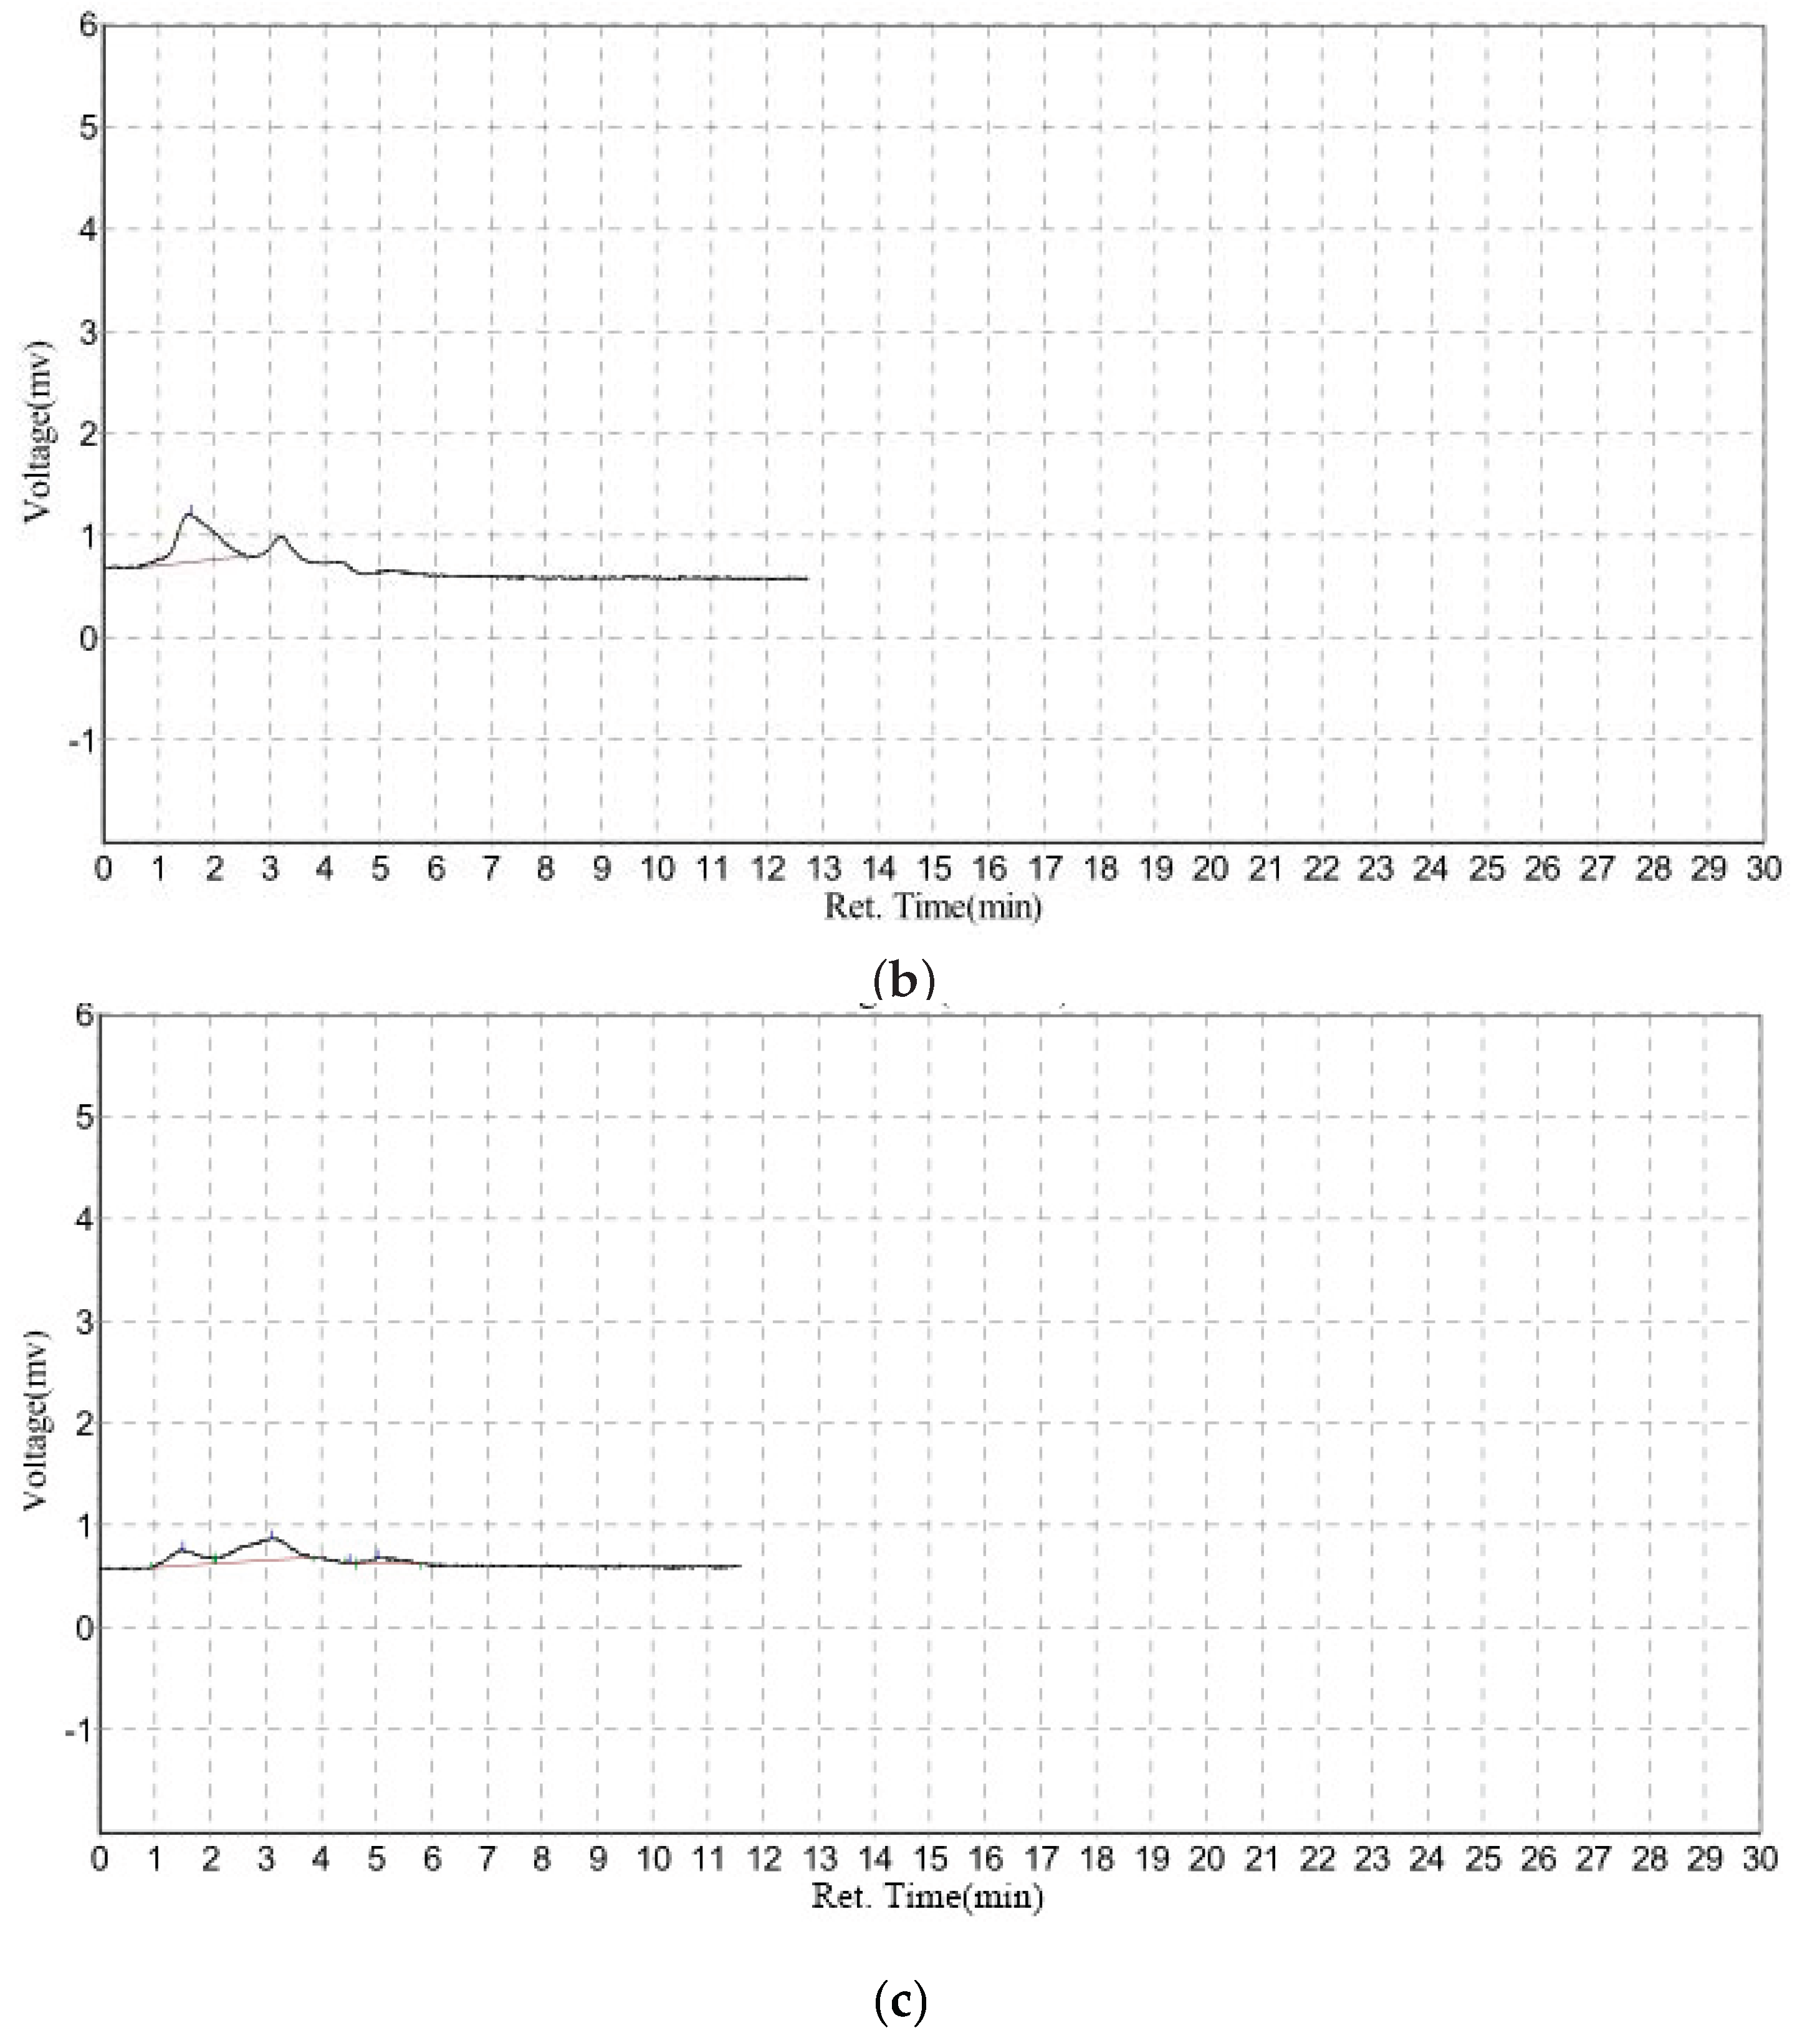
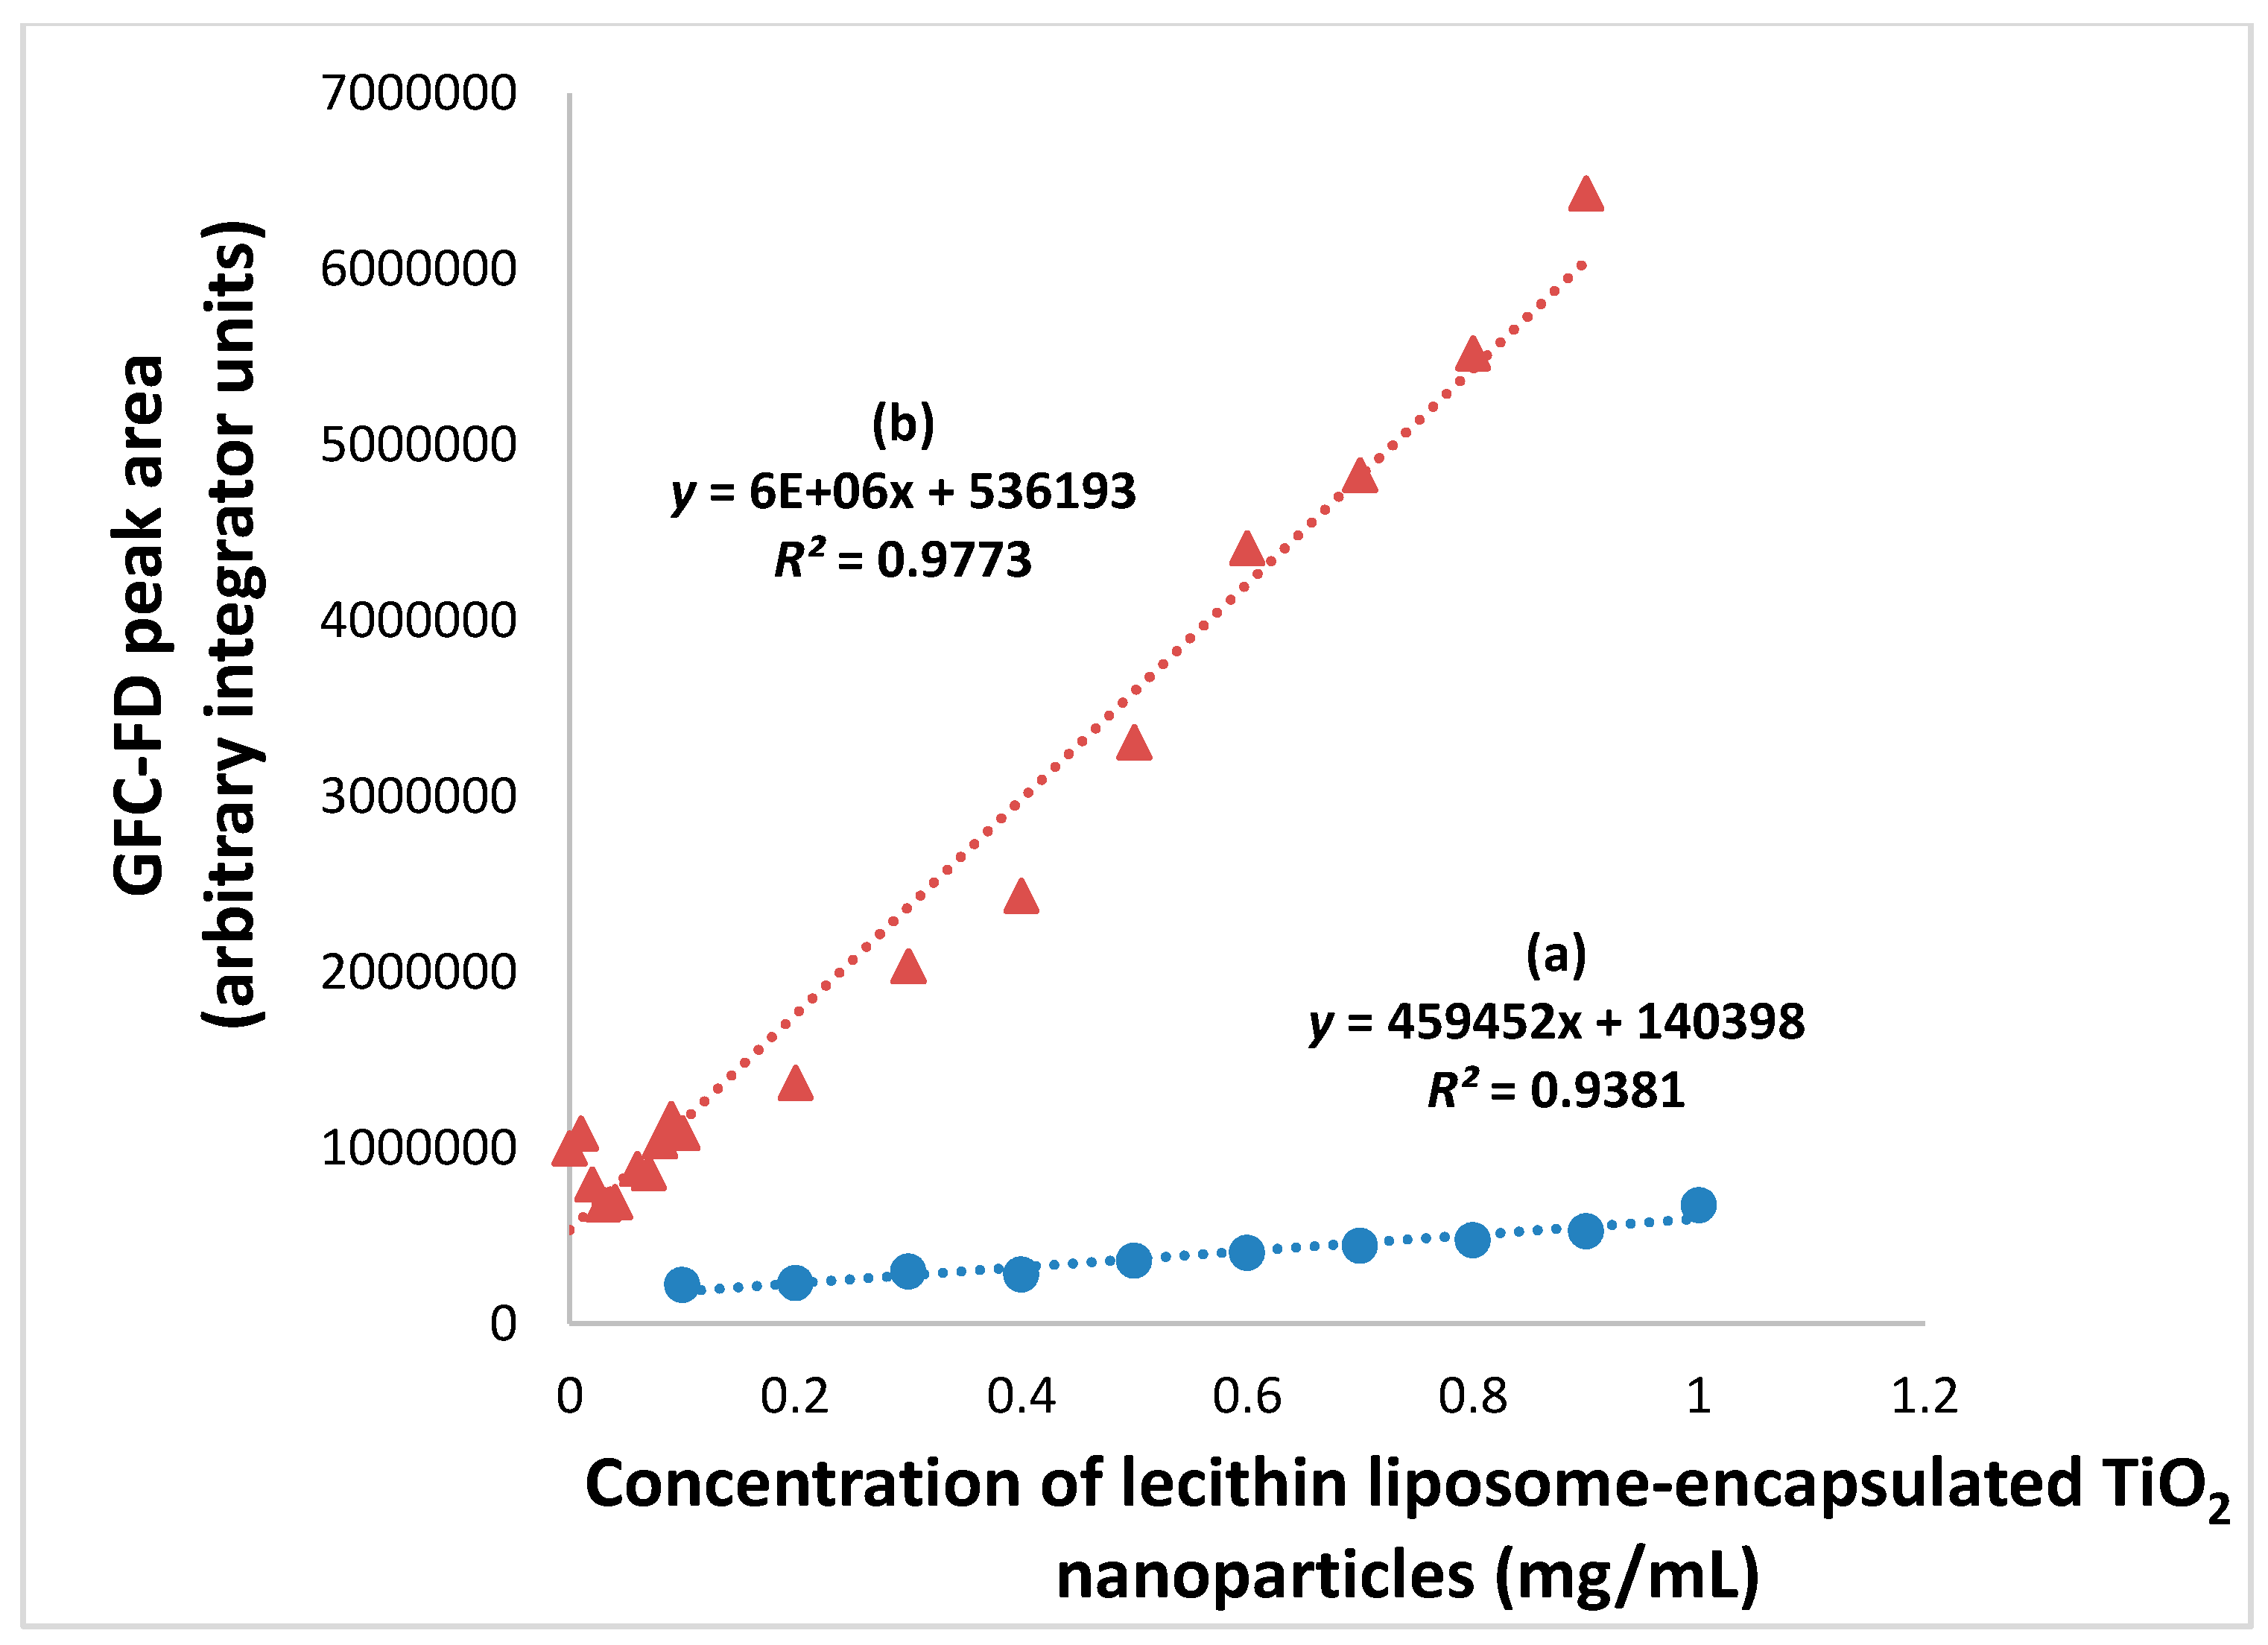
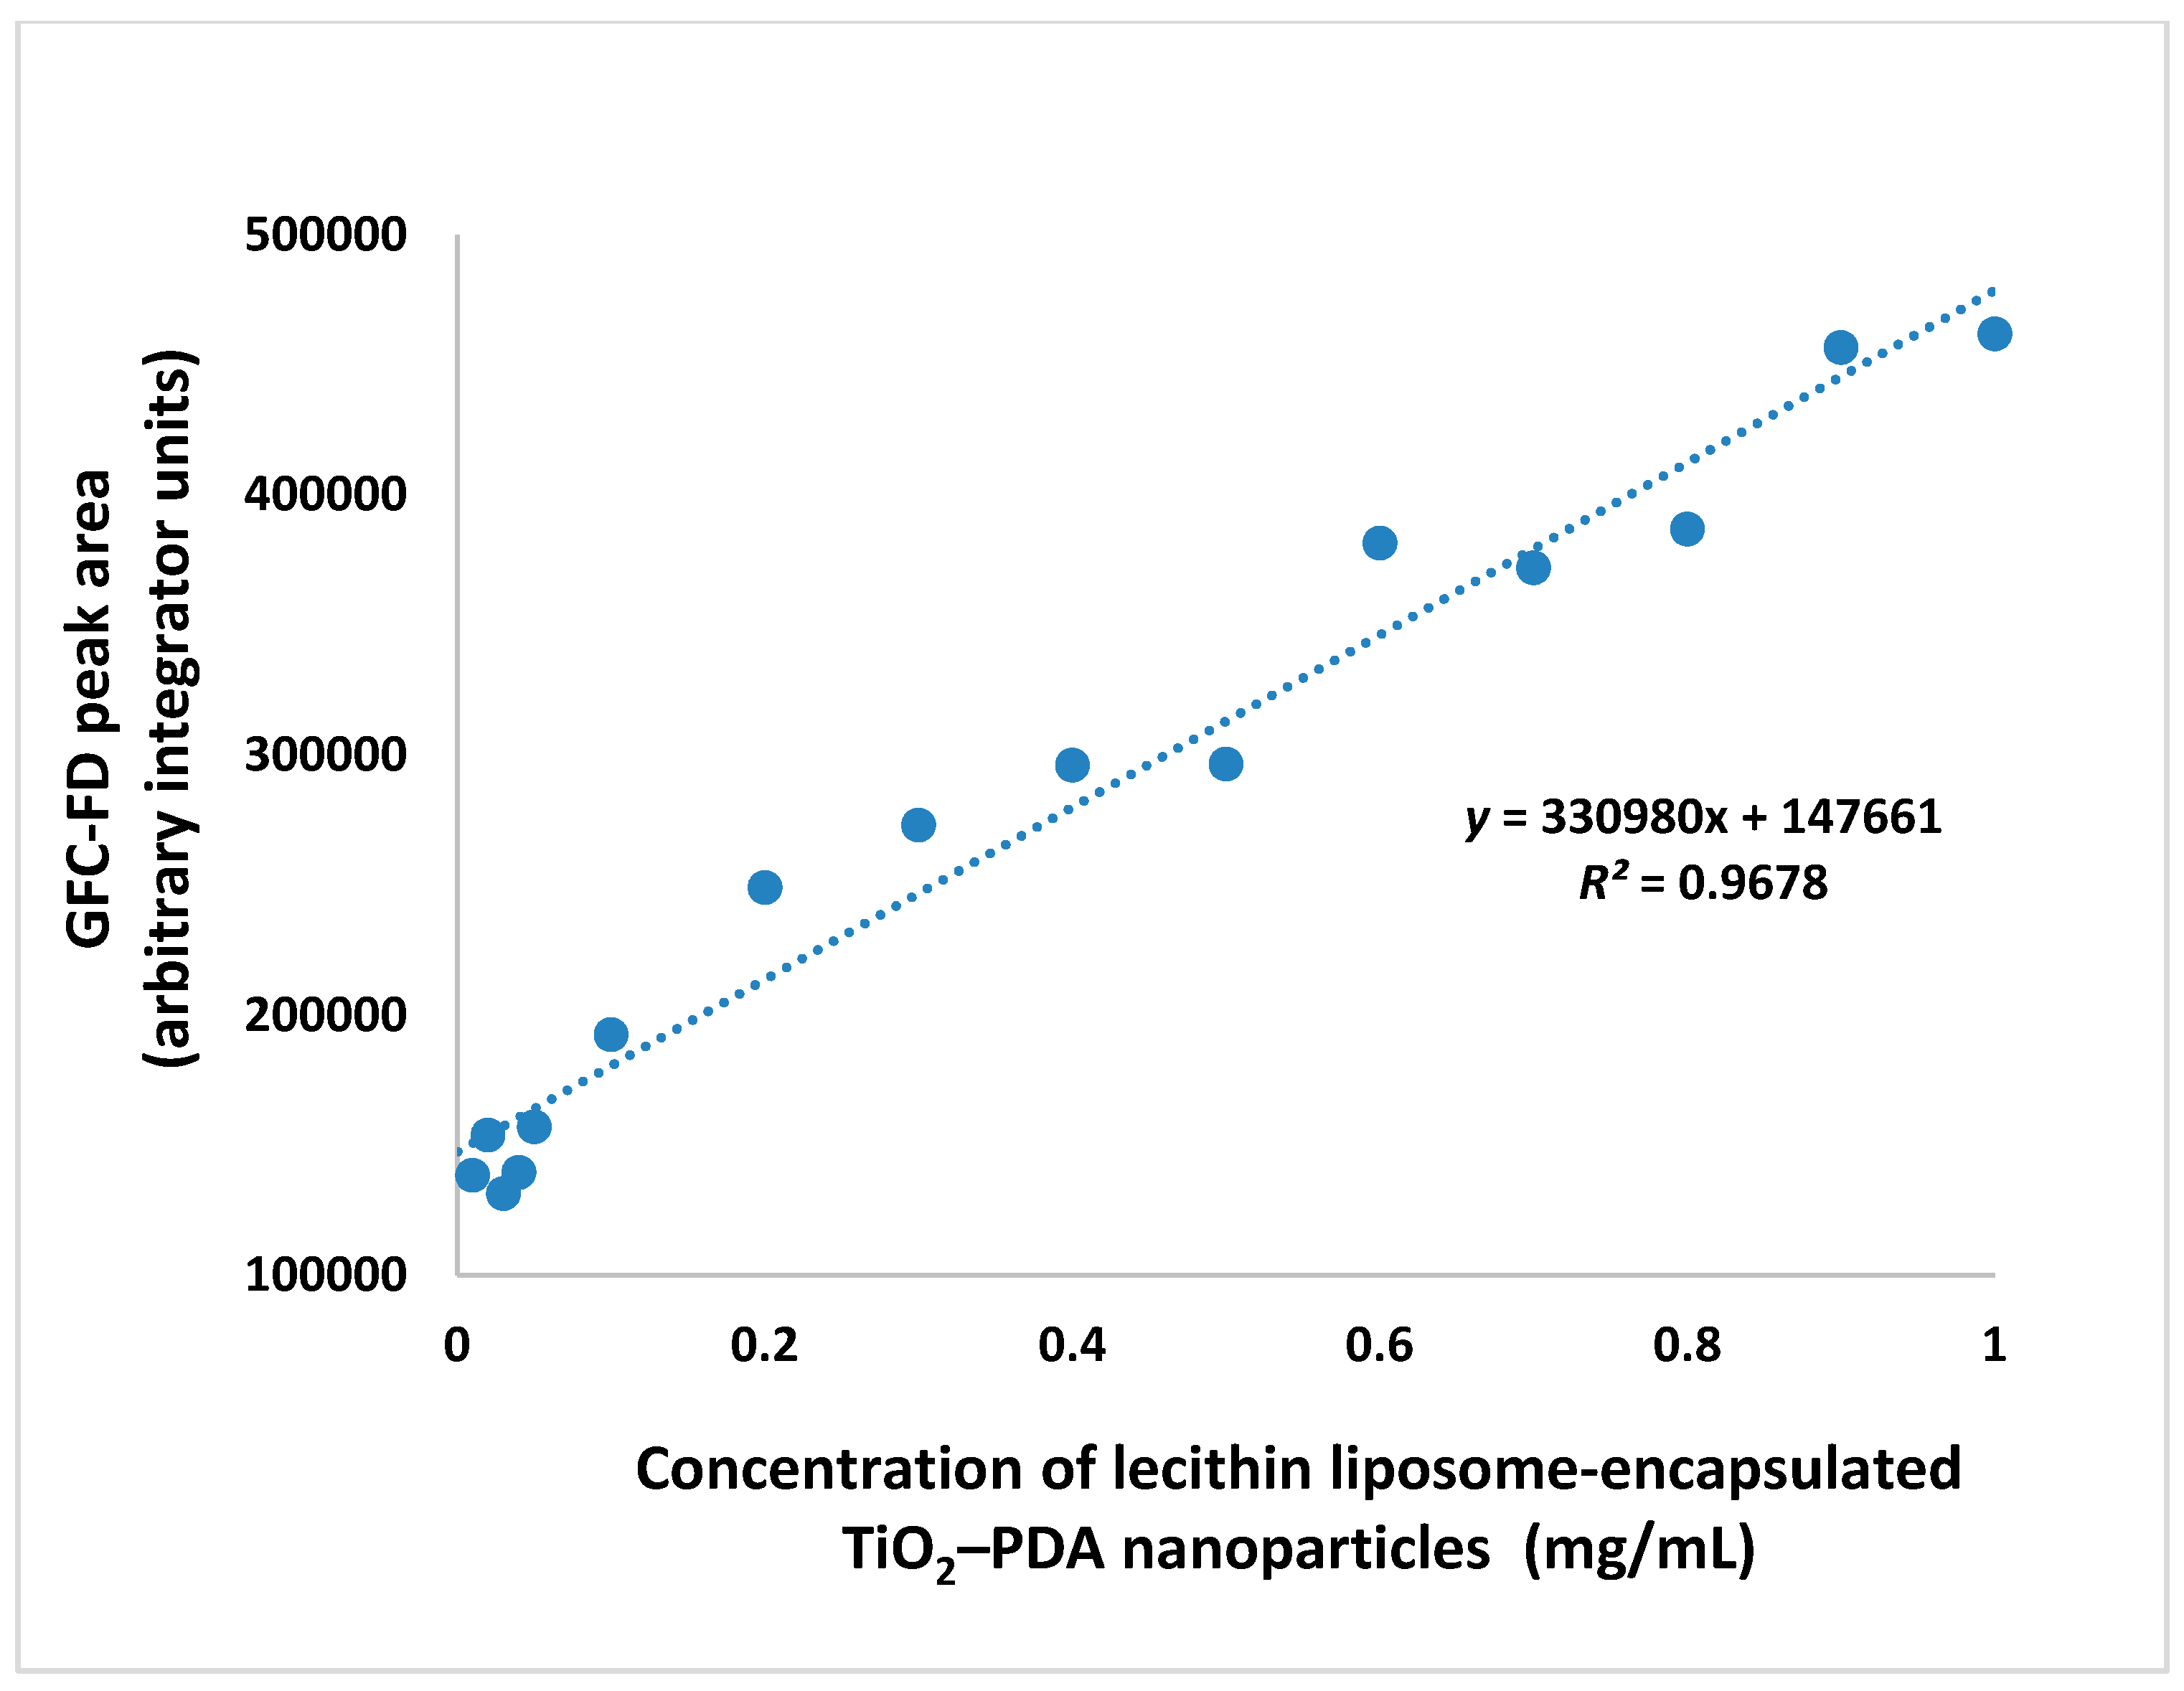
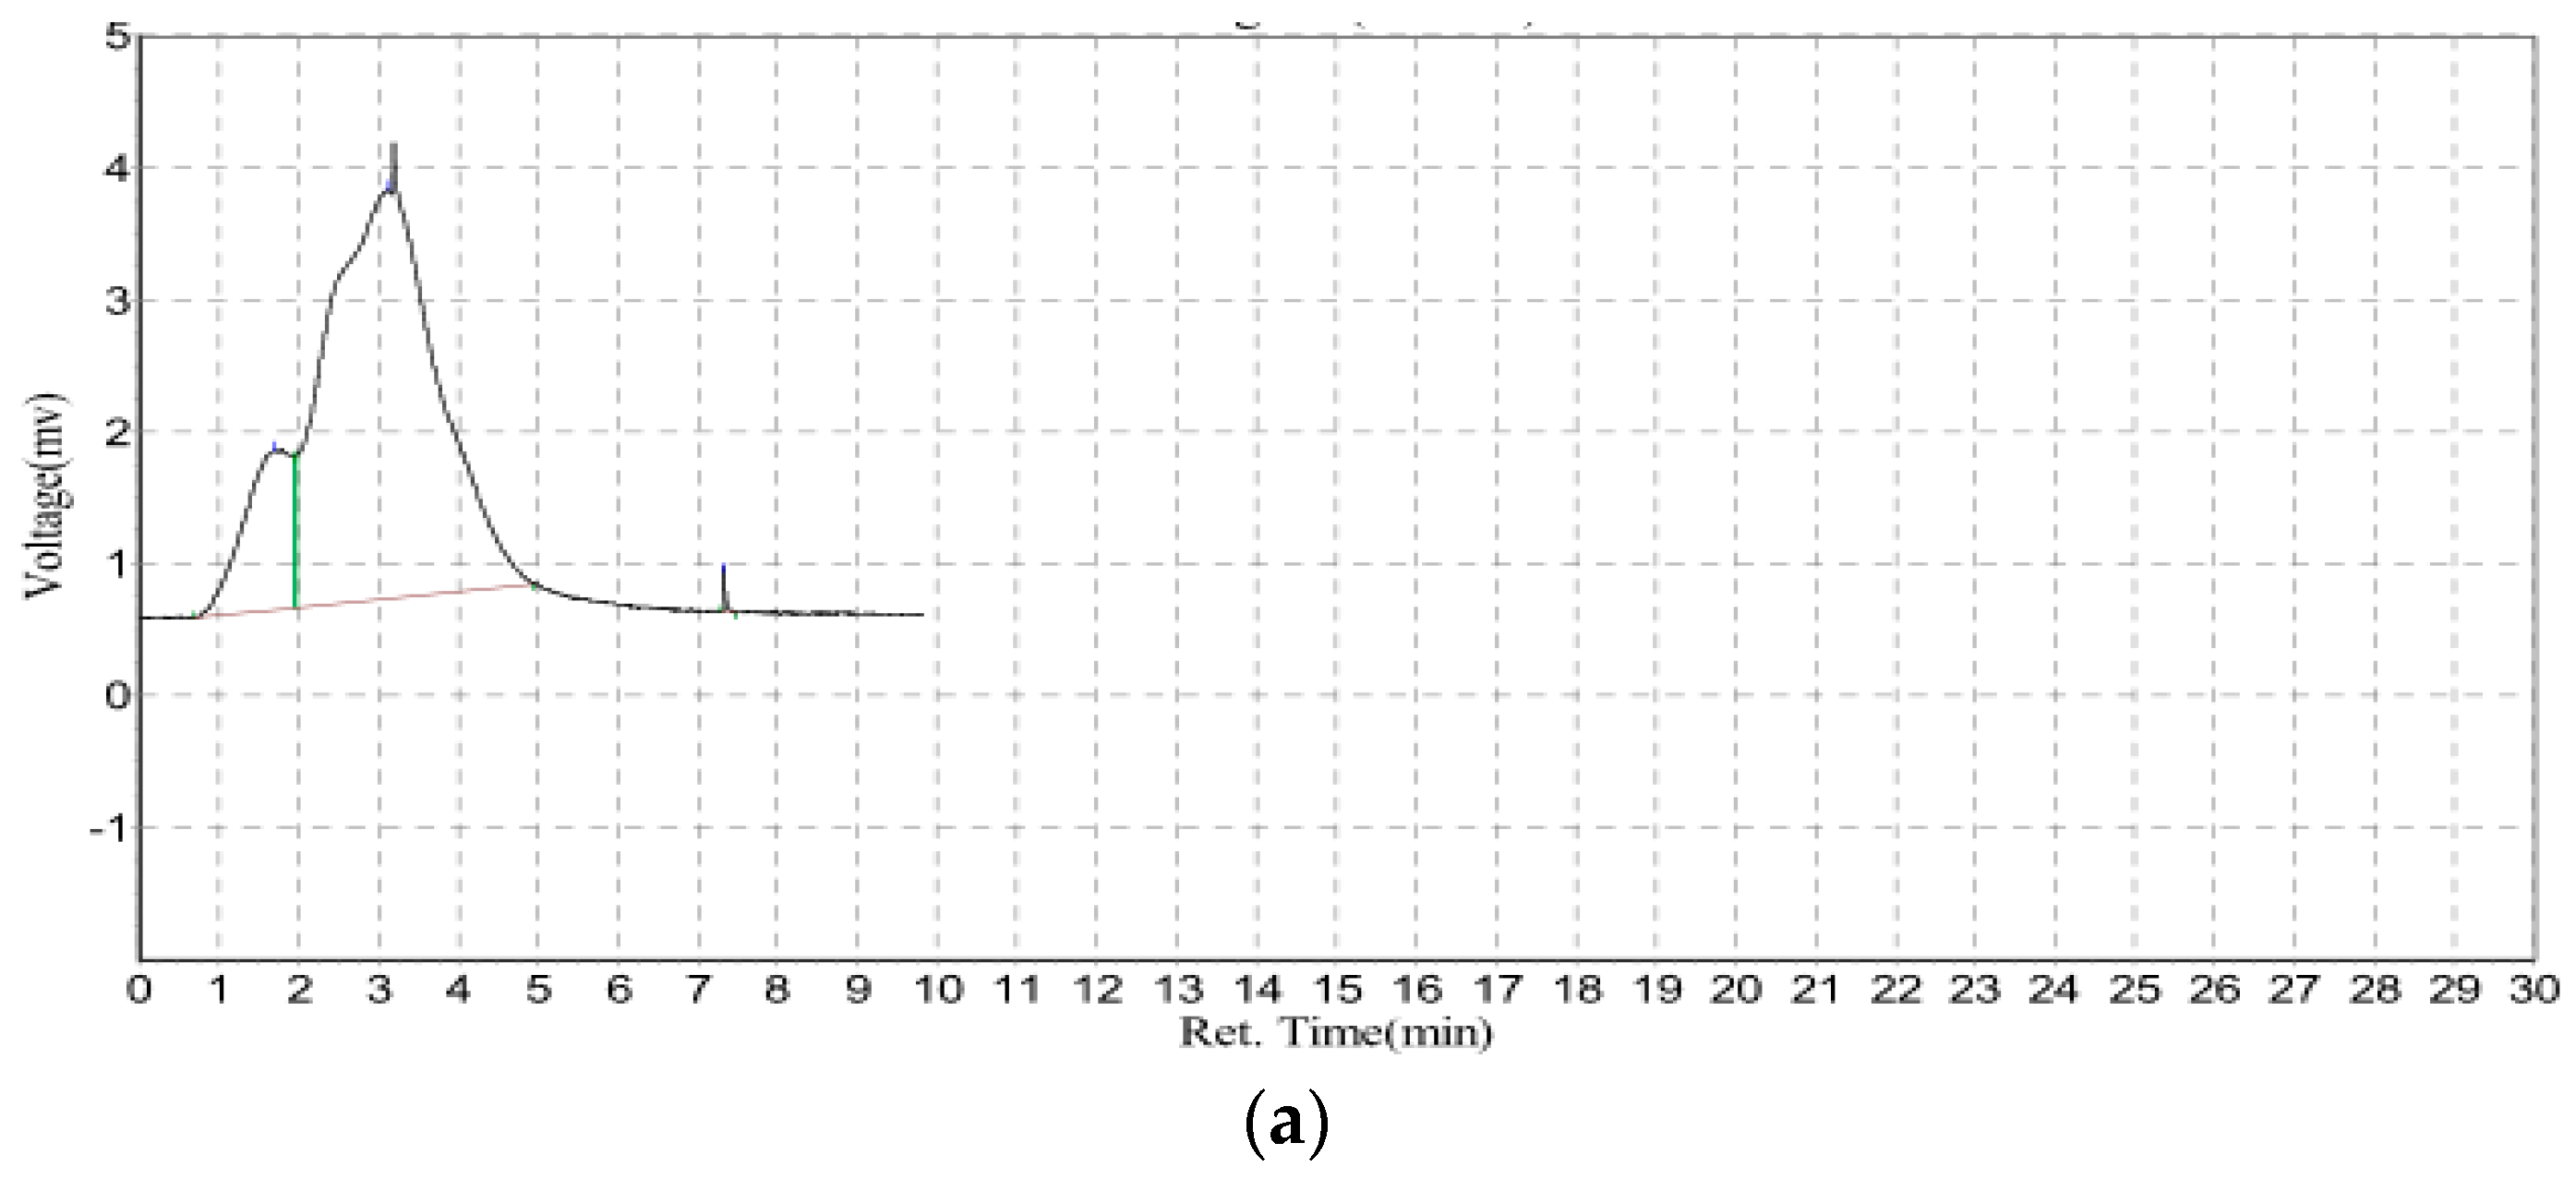
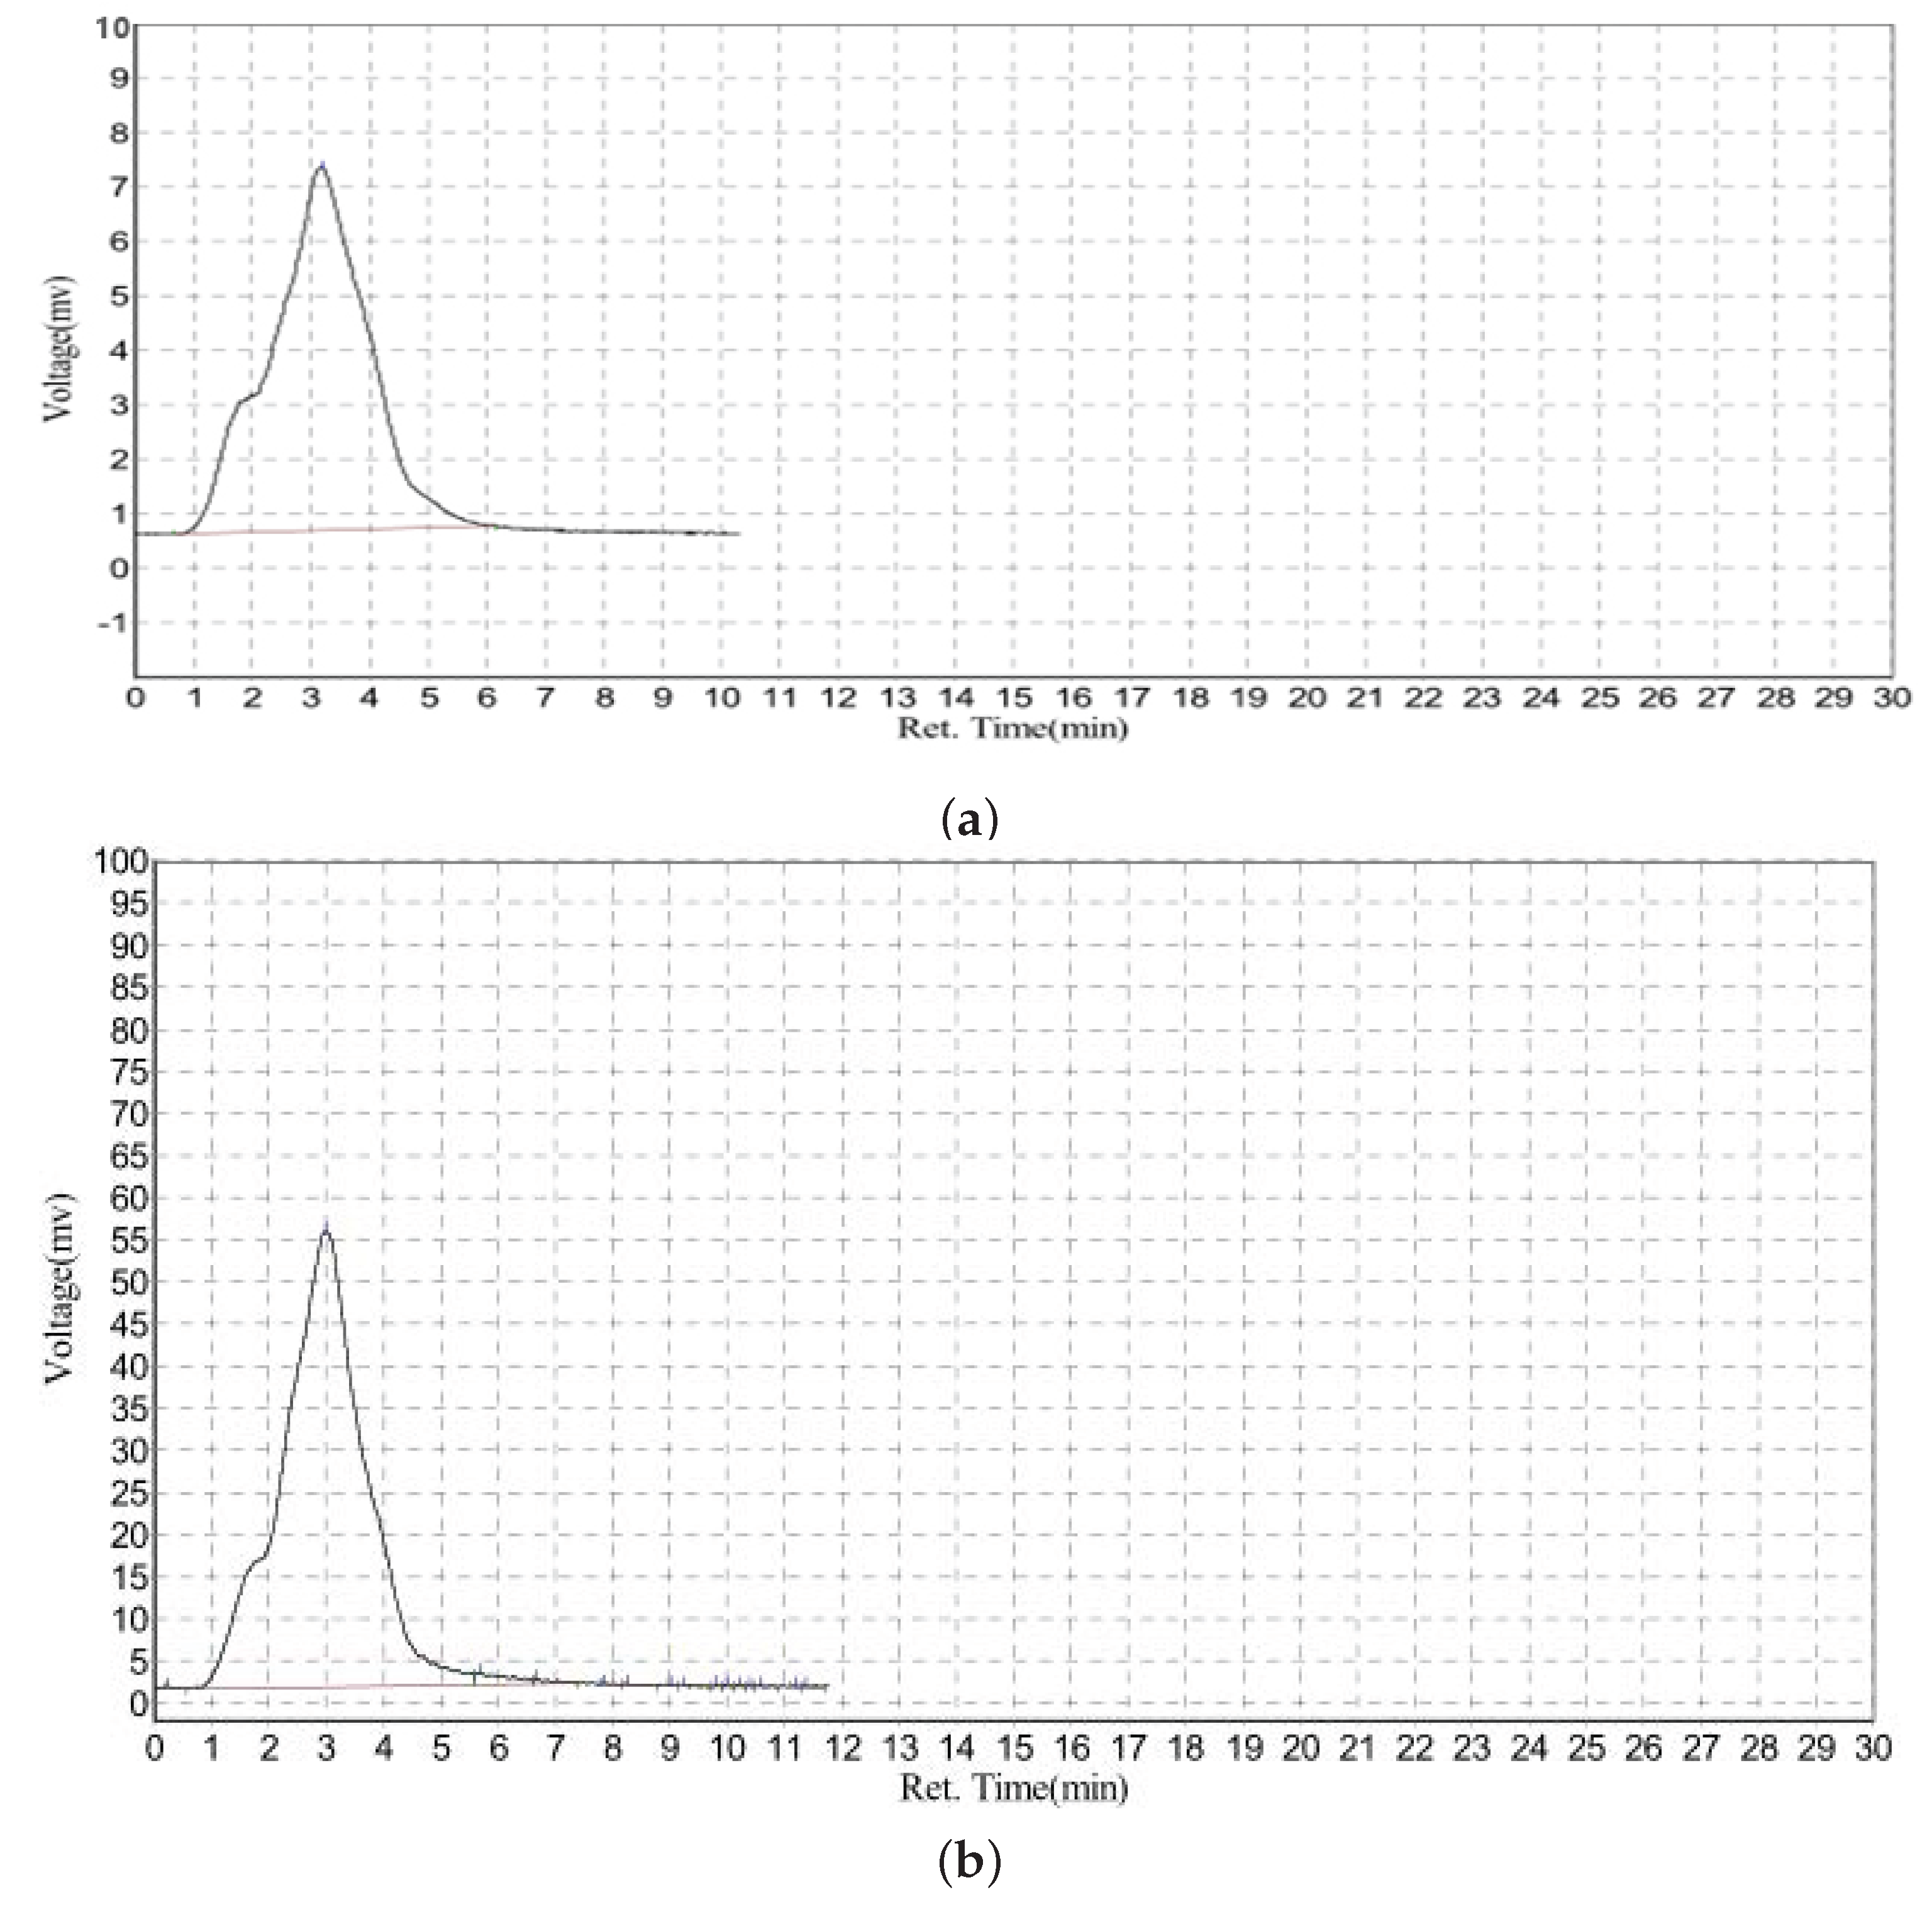
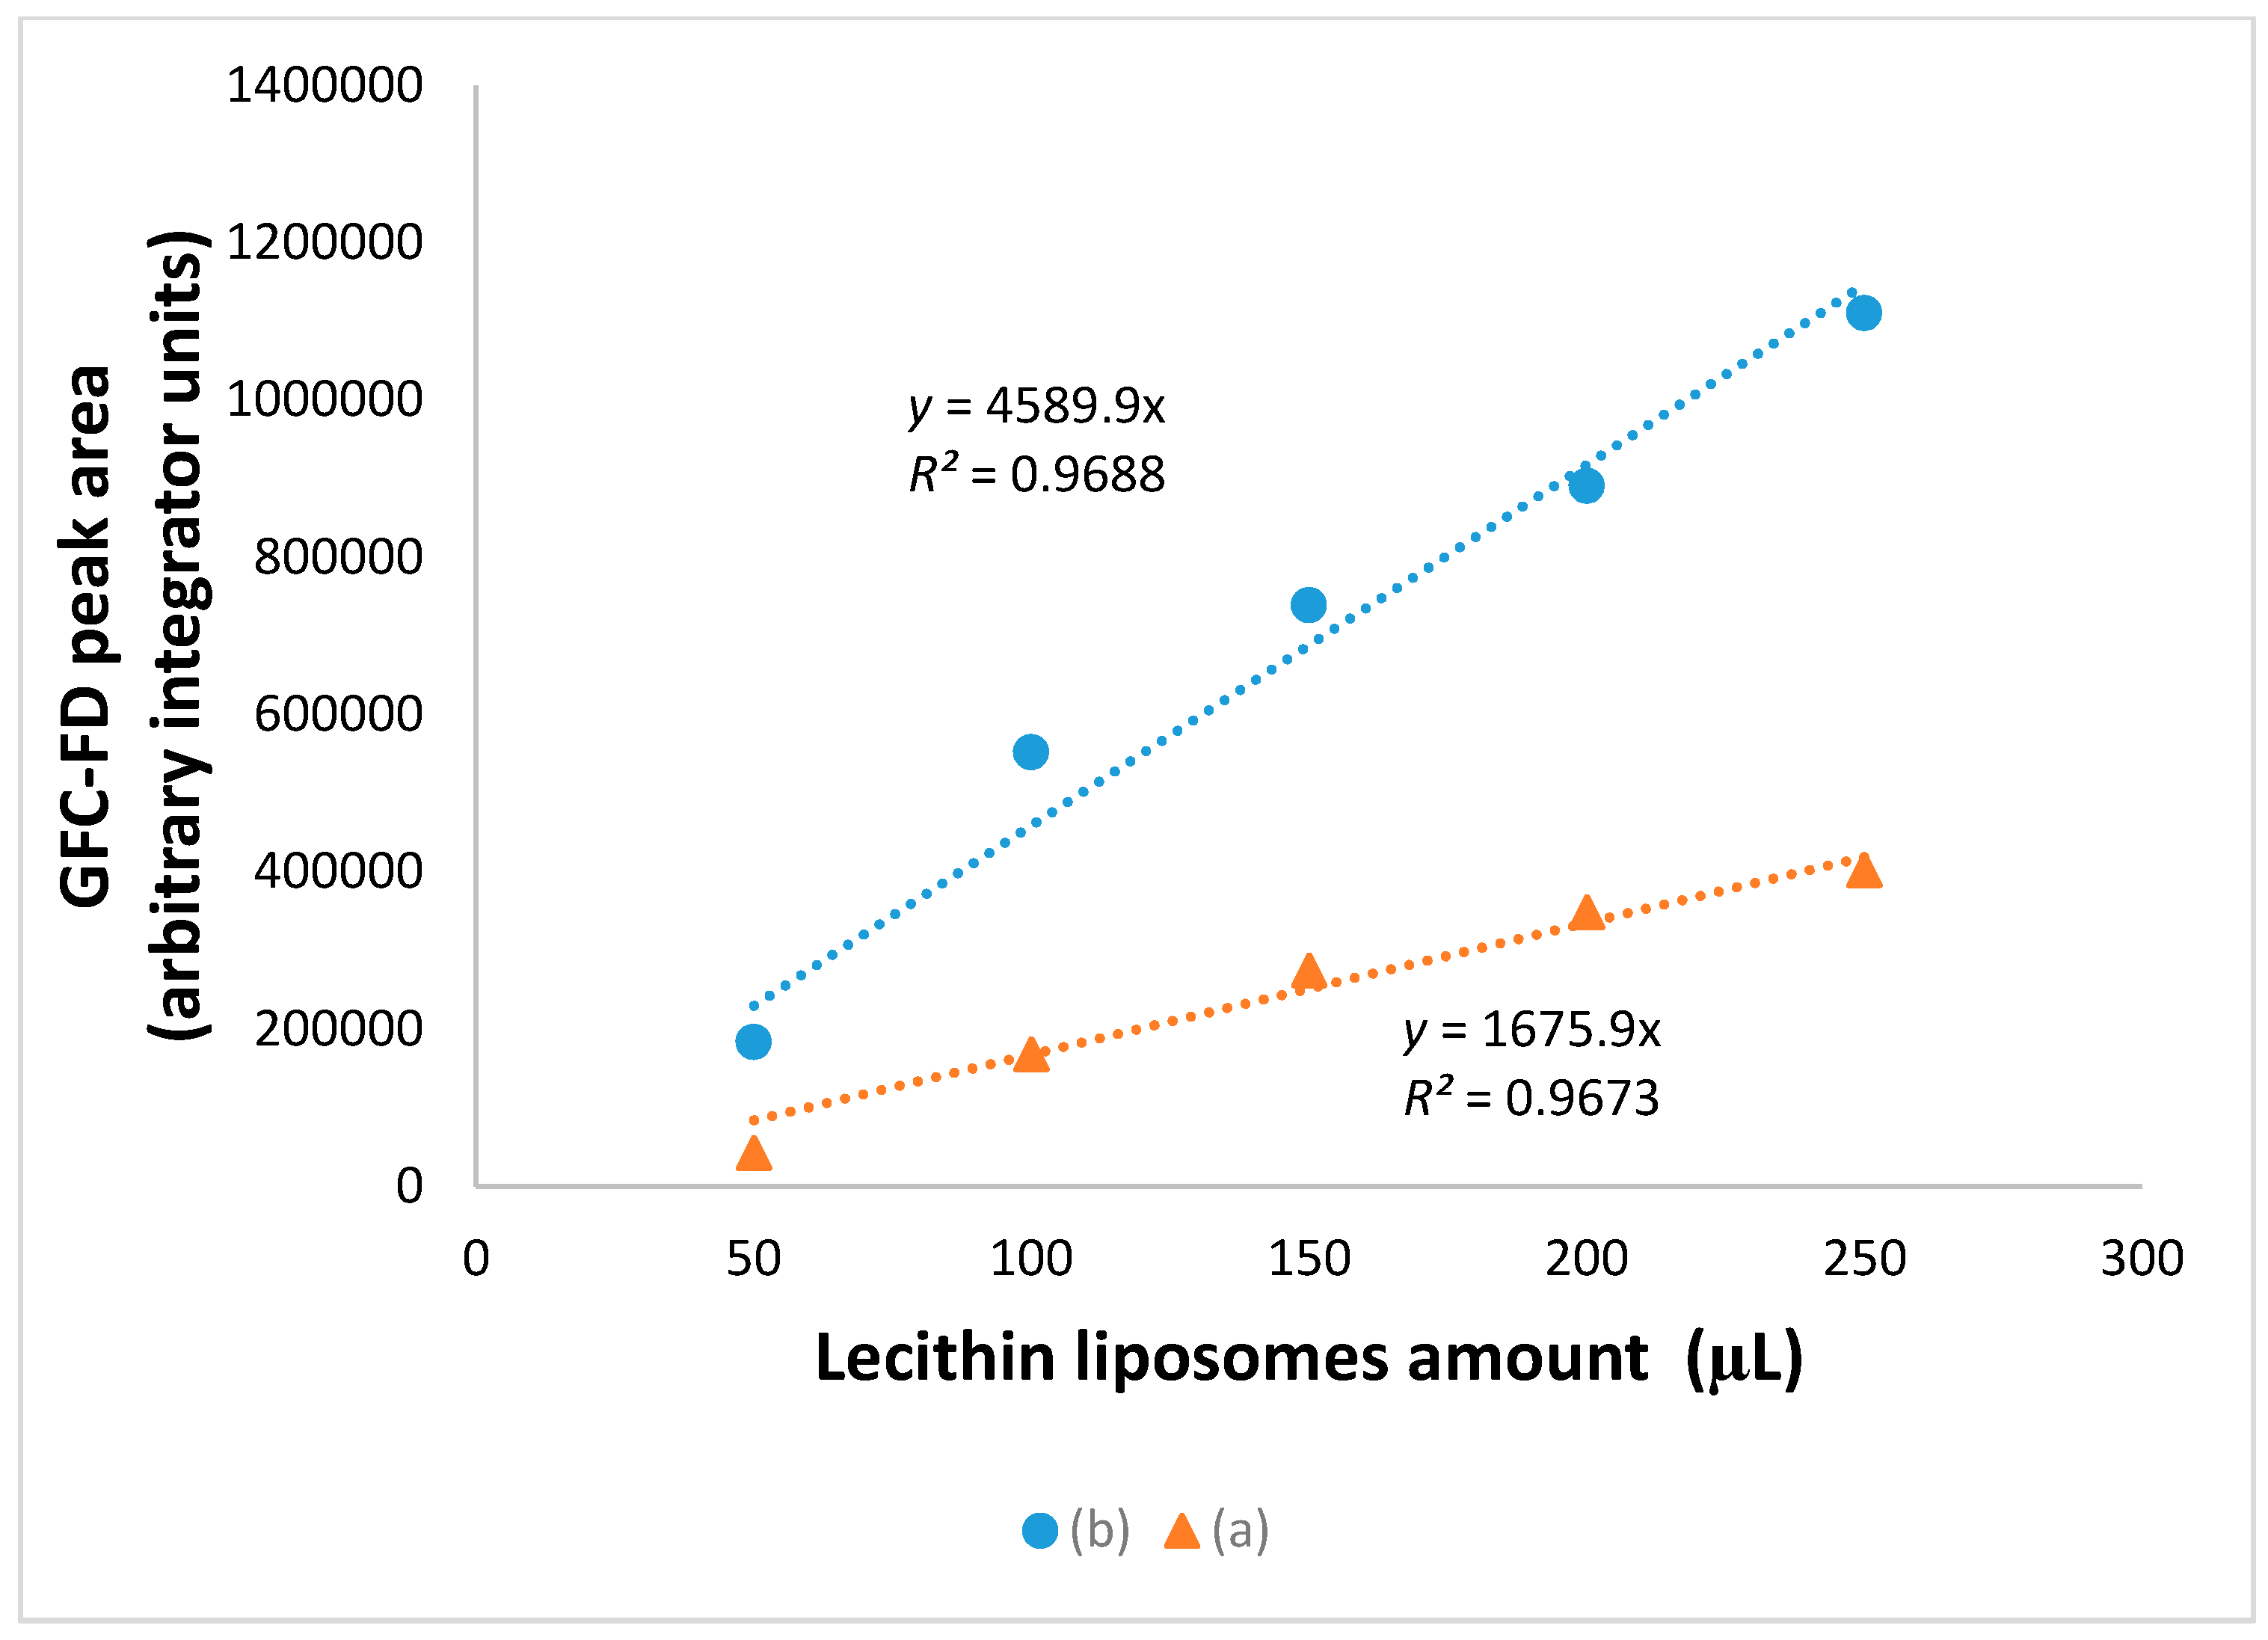
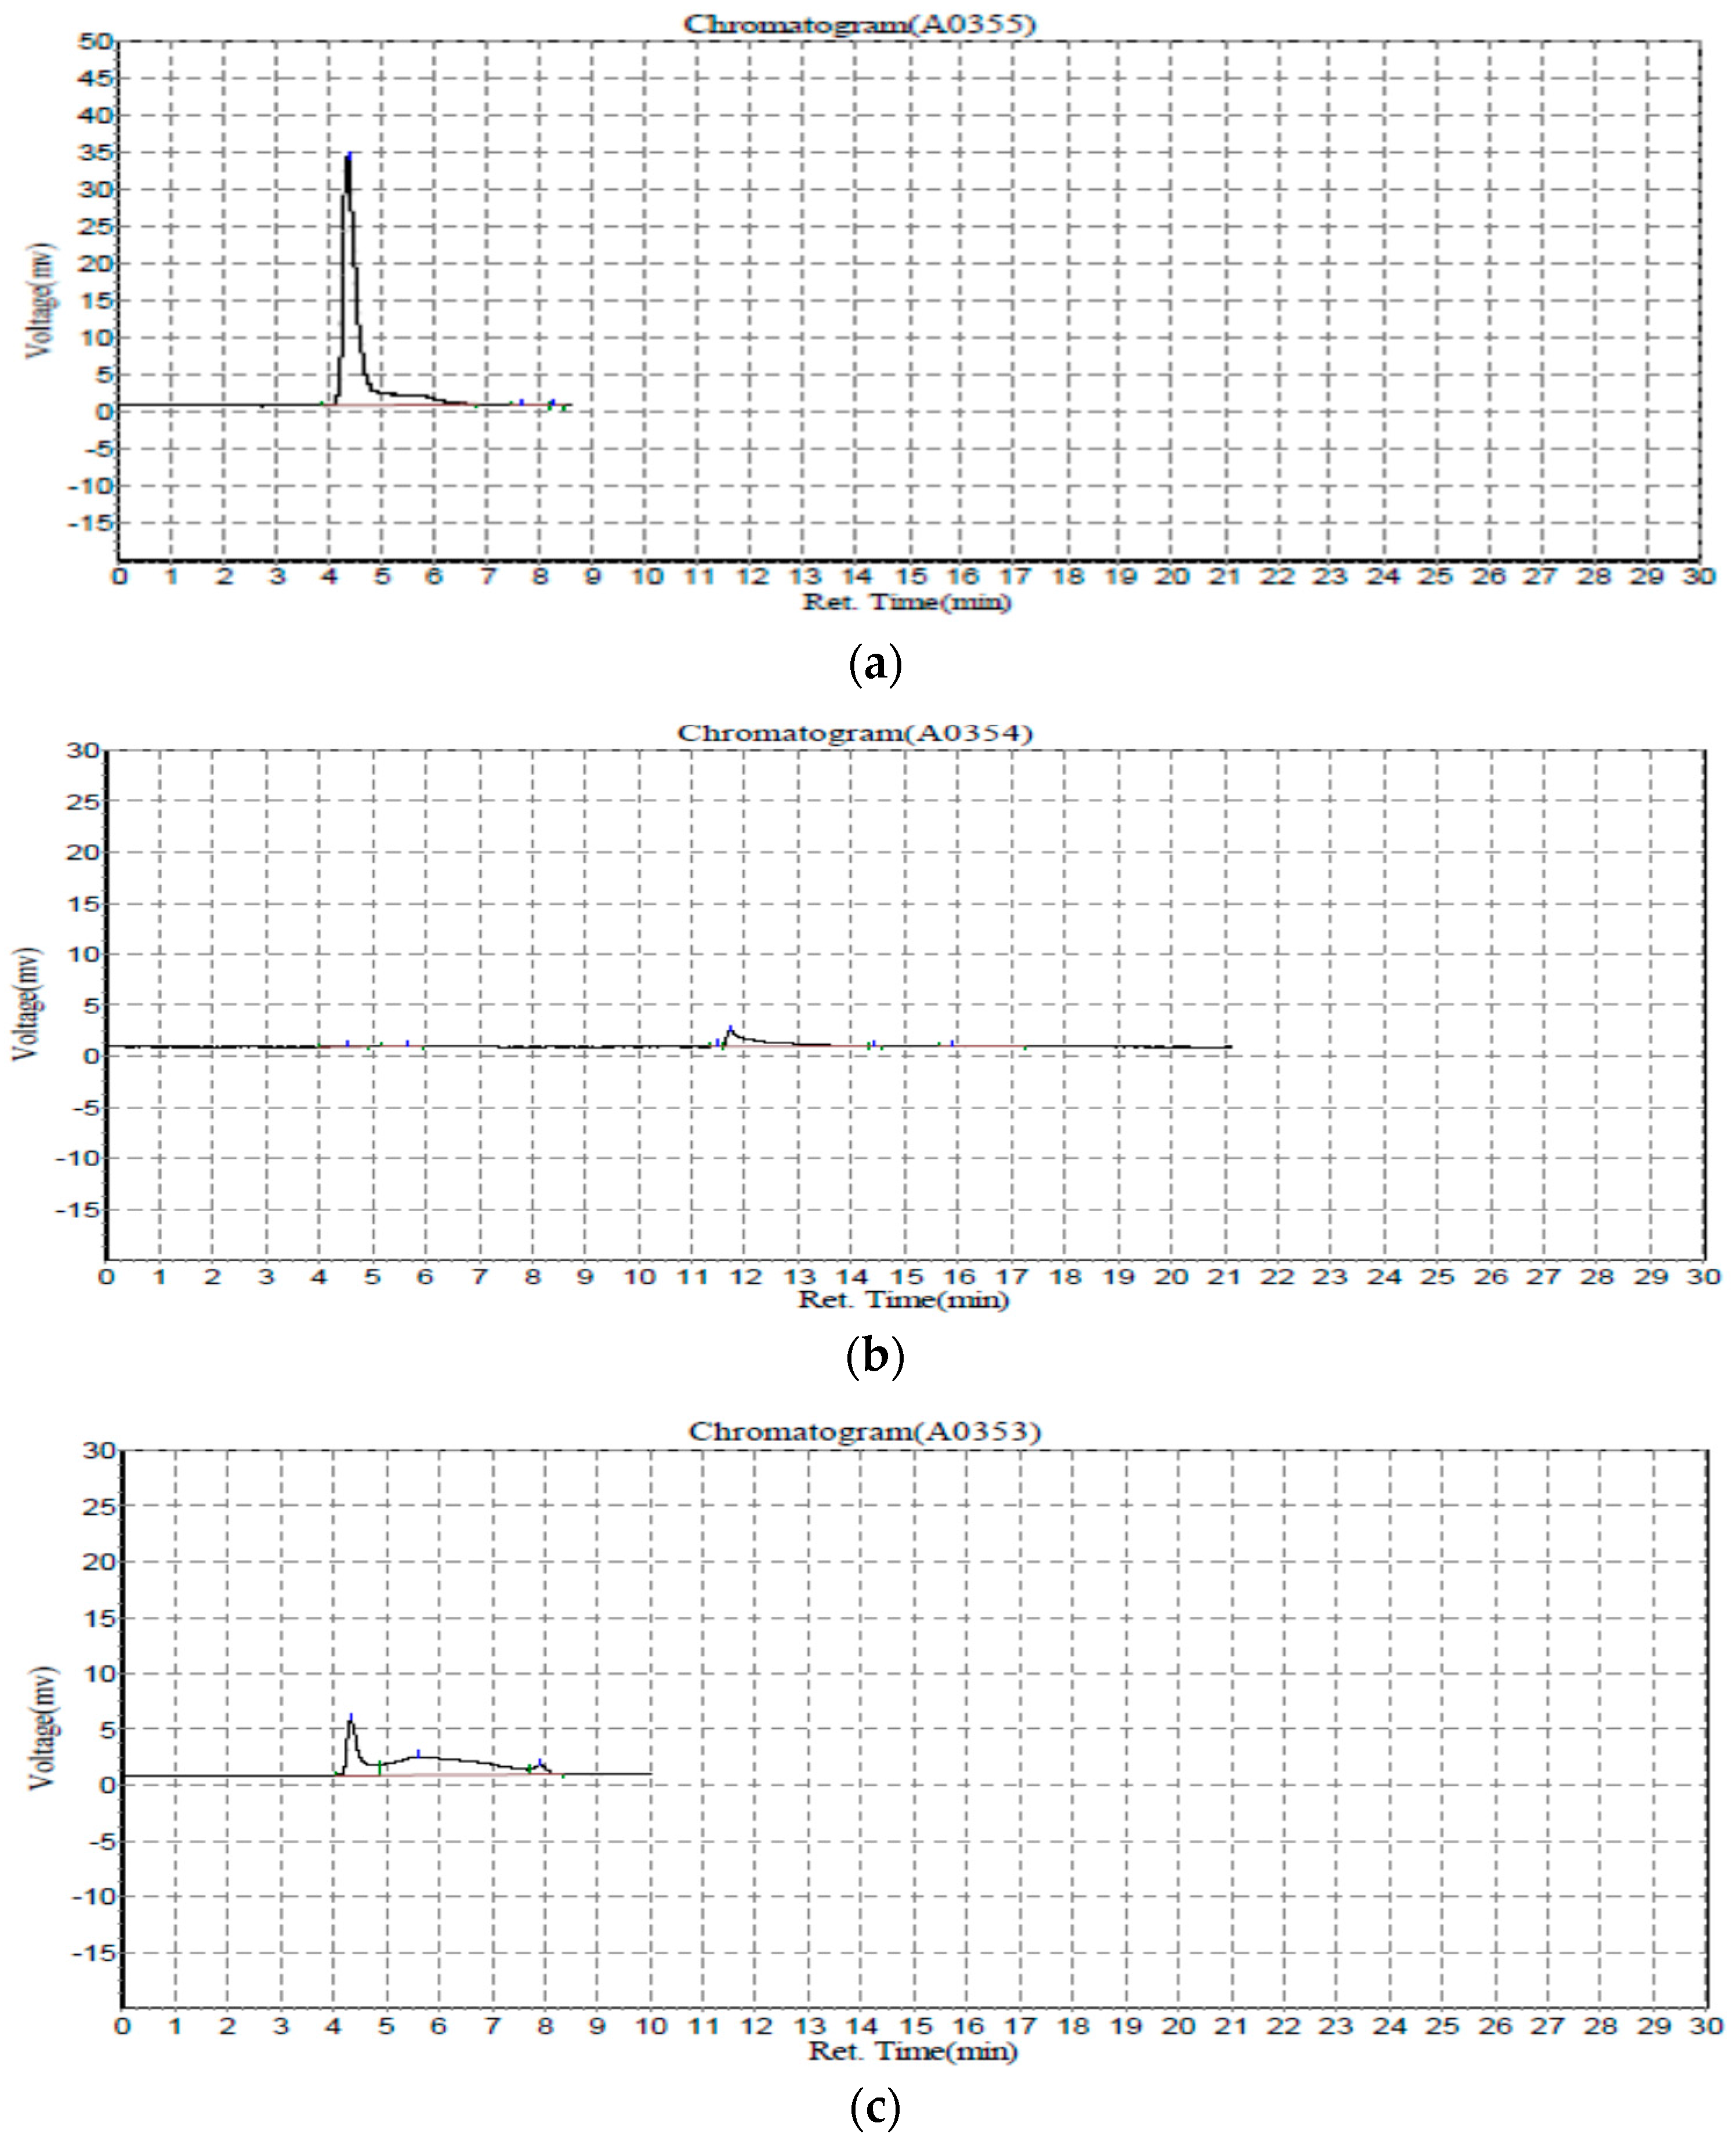
3.2. Rapid GFC-FD Analysis of Lecithin Liposome-Encapsulated TiO2–PDA Nanoparticles

A short GFC column (50 × 8 mm) was initially used for rapid analysis of lecithin liposome-encapsulated TiO2-PDA nanoparticles. As expected, a PDA coating prevented the TiO2 nanoparticles from aggregation during chromatographic separation. Ultrasonic homogenization apparently facilitated the encapsulation of TiO2 nanoparticles by lecithin liposomes, thus yielding reproducible peaks for the chromatographic characterization of lecithin liposome-encapsulated TiO2-PDA nanoparticles. The standard calibration curve in Figure 3 shows that the GFC-FD peak area increased as the concentration of lecithin liposome-encapsulated TiO2-PDA nanoparticles increased. At the lowest concentrations of lecithin liposome-encapsulated TiO2-PDA nanoparticles studied, peak areas were very close to each other around the quantification limit of the GFC-FD analysis method. Next, lecithin liposome-encapsulated PDA nanoparticles and PDA nanoparticles were also analyzed by rapid GFC-FD for a comparison. Their peak areas in Figure 4b,c are significantly smaller than that in Figure 4a despite equivalent concentrations. This difference in peak area can certainly be attributed to the presence versus absence of TiO2 nanoparticles. A rapid method for the quantitative analysis of TiO2-PDA nanoparticles by GFC-FD in 6 min is thus verified for the linear dynamic range from 0.05 mg/mL to 1.00 mg/mL.

3.3. Rapid GFC-FD Analysis of Lecithin Liposome-Encapsulated TiO2 Nanoparticles

Lecithin liposome-encapsulated TiO2 nanoparticles (without PDA coating) were analyzed by rapid GFC for elucidating the analytical merits of PDA. The peak area in Figure 5a was larger than that for lecithin liposome-encapsulated TiO2-PDA nanoparticles in Figure 4a where the fluorescence from TiO2 nanoparticles was quenched by the PDA coating. Using next the maximum excitation and emission wavelengths λex,max = 350 nm and λem,max = 395 nm for FD, a stronger peak was obtained for lecithin liposome-encapsulated TiO2 nanoparticles in Figure 5b. A new standard calibration curve was constructed in Figure 6 to validate the linear dynamic range from 0.05 mg/mL to 1.00 mg/mL. The maximum wavelengths (λex,max = 350 nm and λem,max = 395 nm) generated a better calibration curve than the initial wavelengths (λex = 365 nm and λem = 460 nm) in terms of sensitivity and linearity. These results indicate the real possibility of determining lecithin liposome-encapsulated TiO2 nanoparticles down to 0.10 mg/mL. Unfortunately, the blank (a mixture of lecithin liposomes and distilled deionized water in a ratio of 1:2 by volume) produced a peak area as large as those obtained from all standard concentrations below 0.10 mg/mL. This could probably be attributed to stronger fluorescence from the phosphatidylcholine and phosphatidyl-ethanolamine contents of lecithin at these maximum wavelengths [51]. It became important that the blank peak from lecithin liposomes be separated from the lecithin liposome-encapsulated TiO2 peaks by using a longer GFC column for extended analysis.

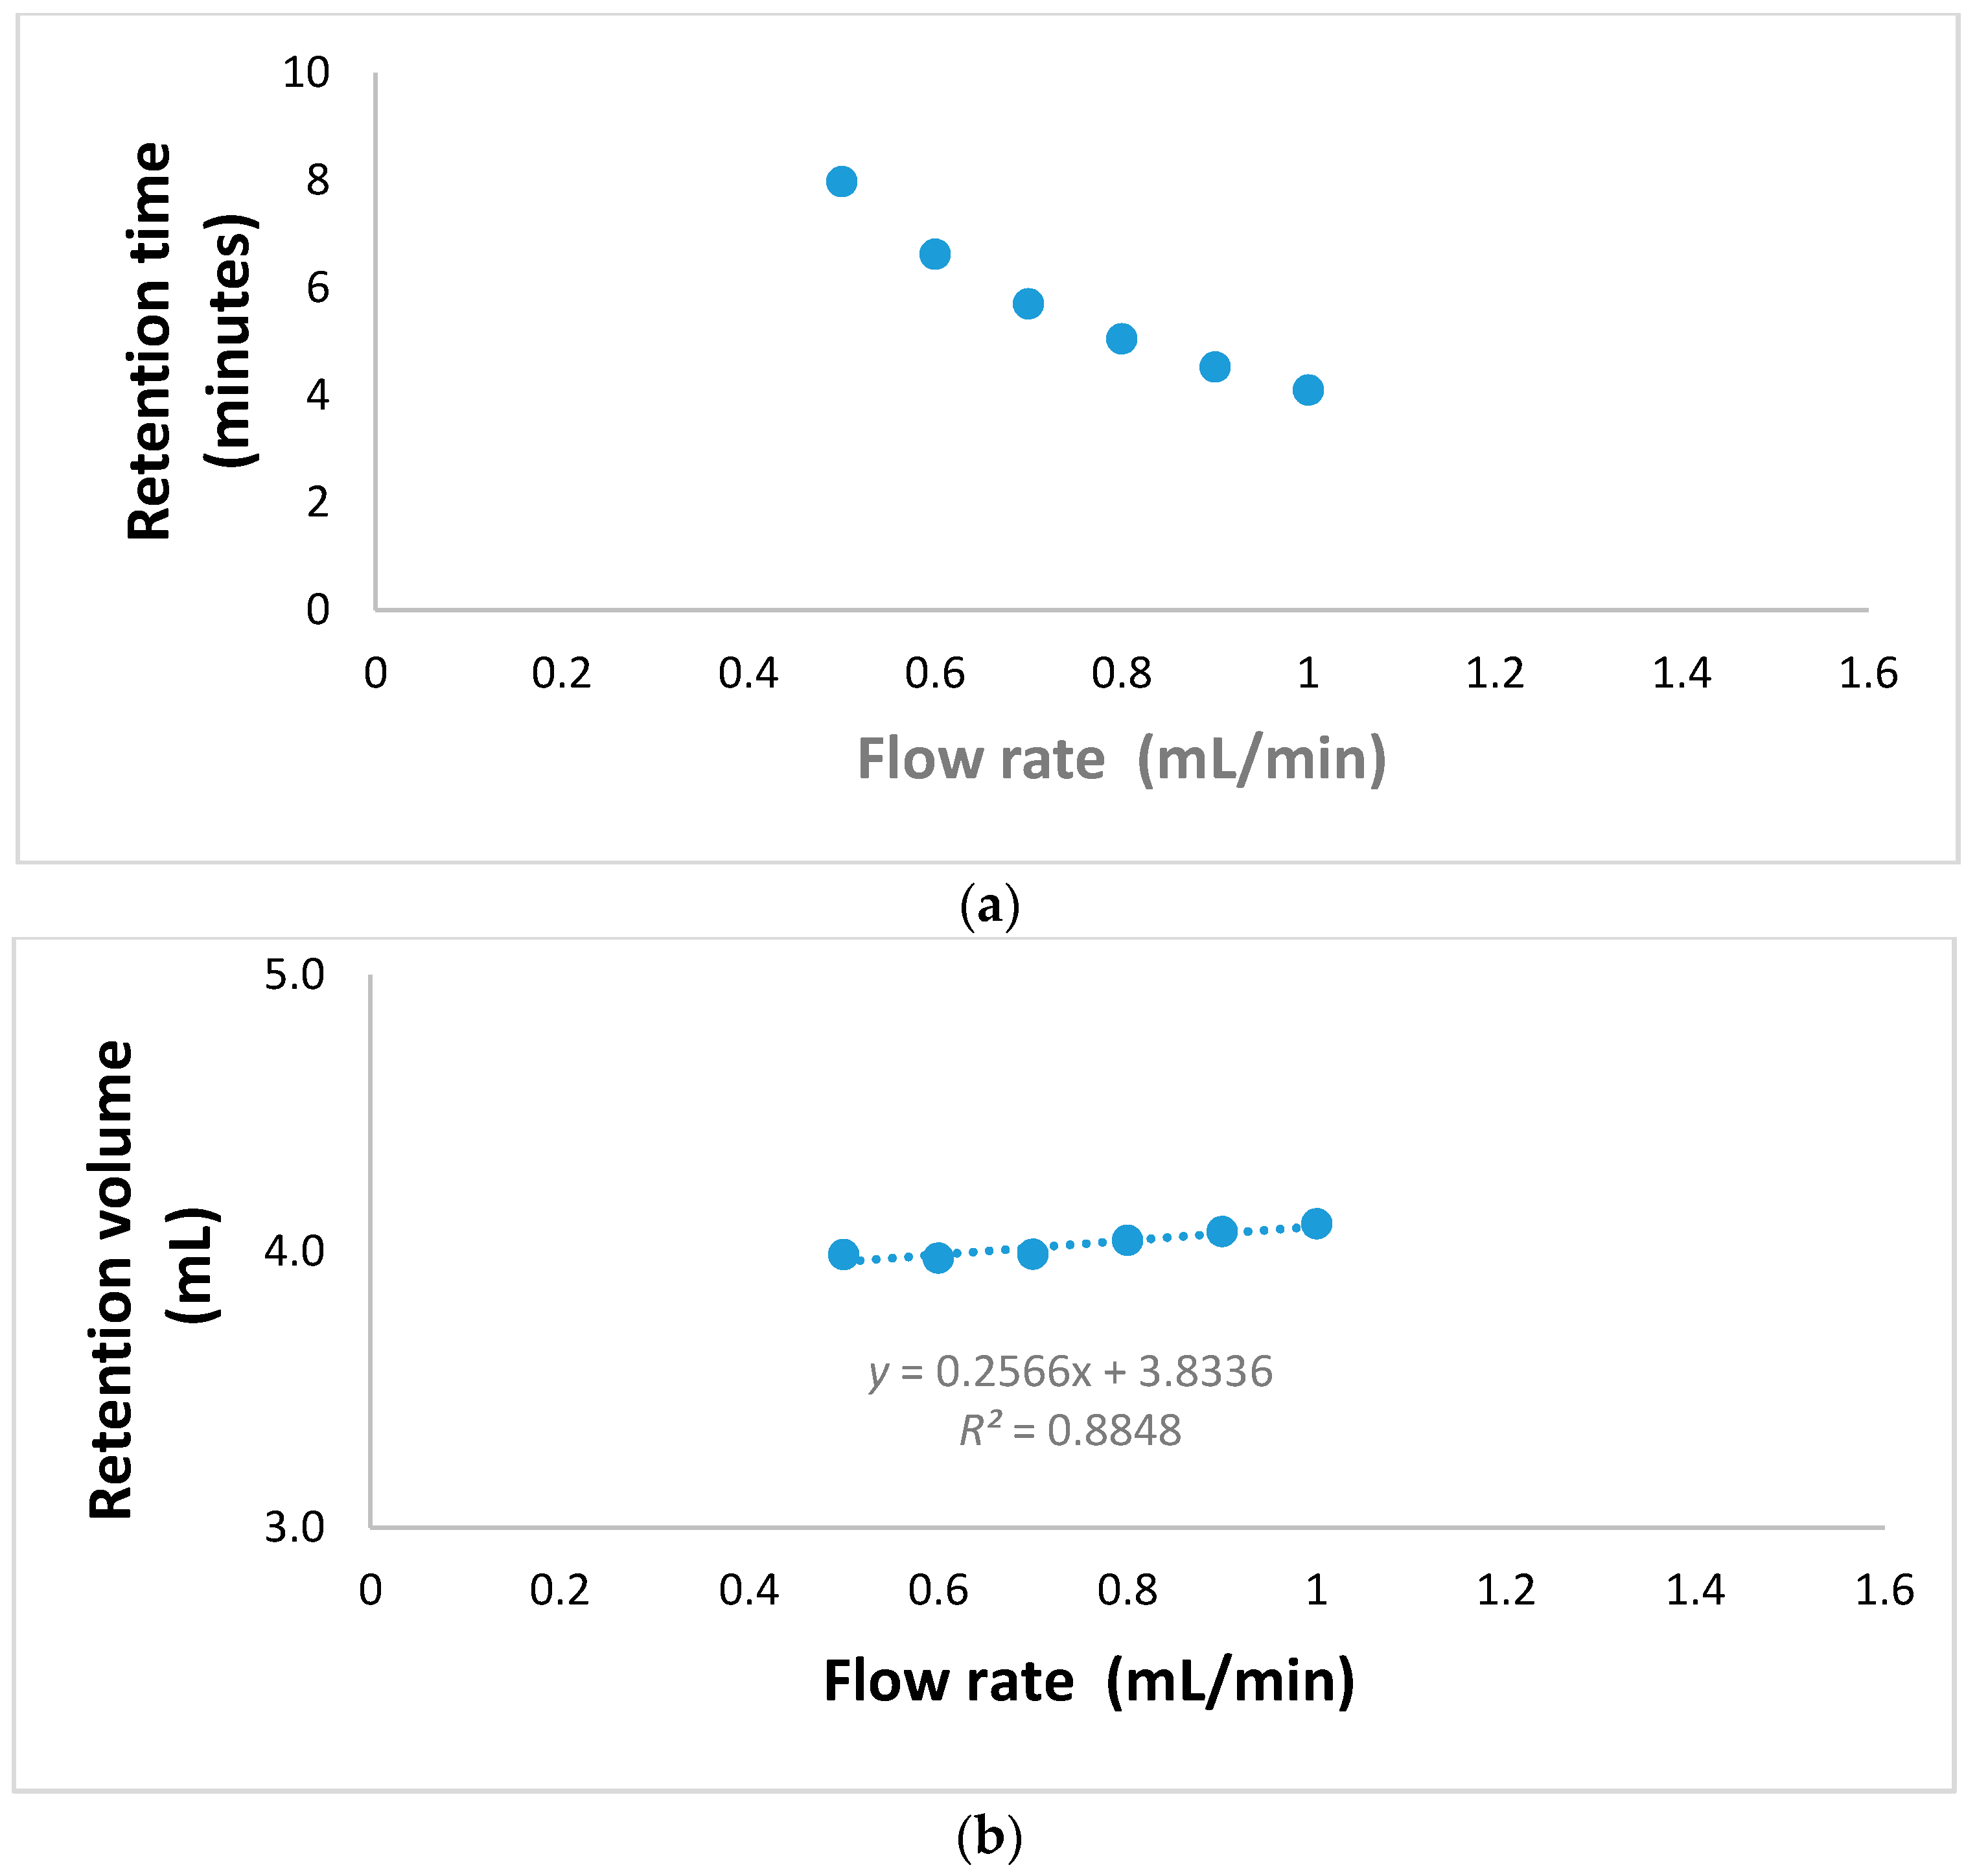
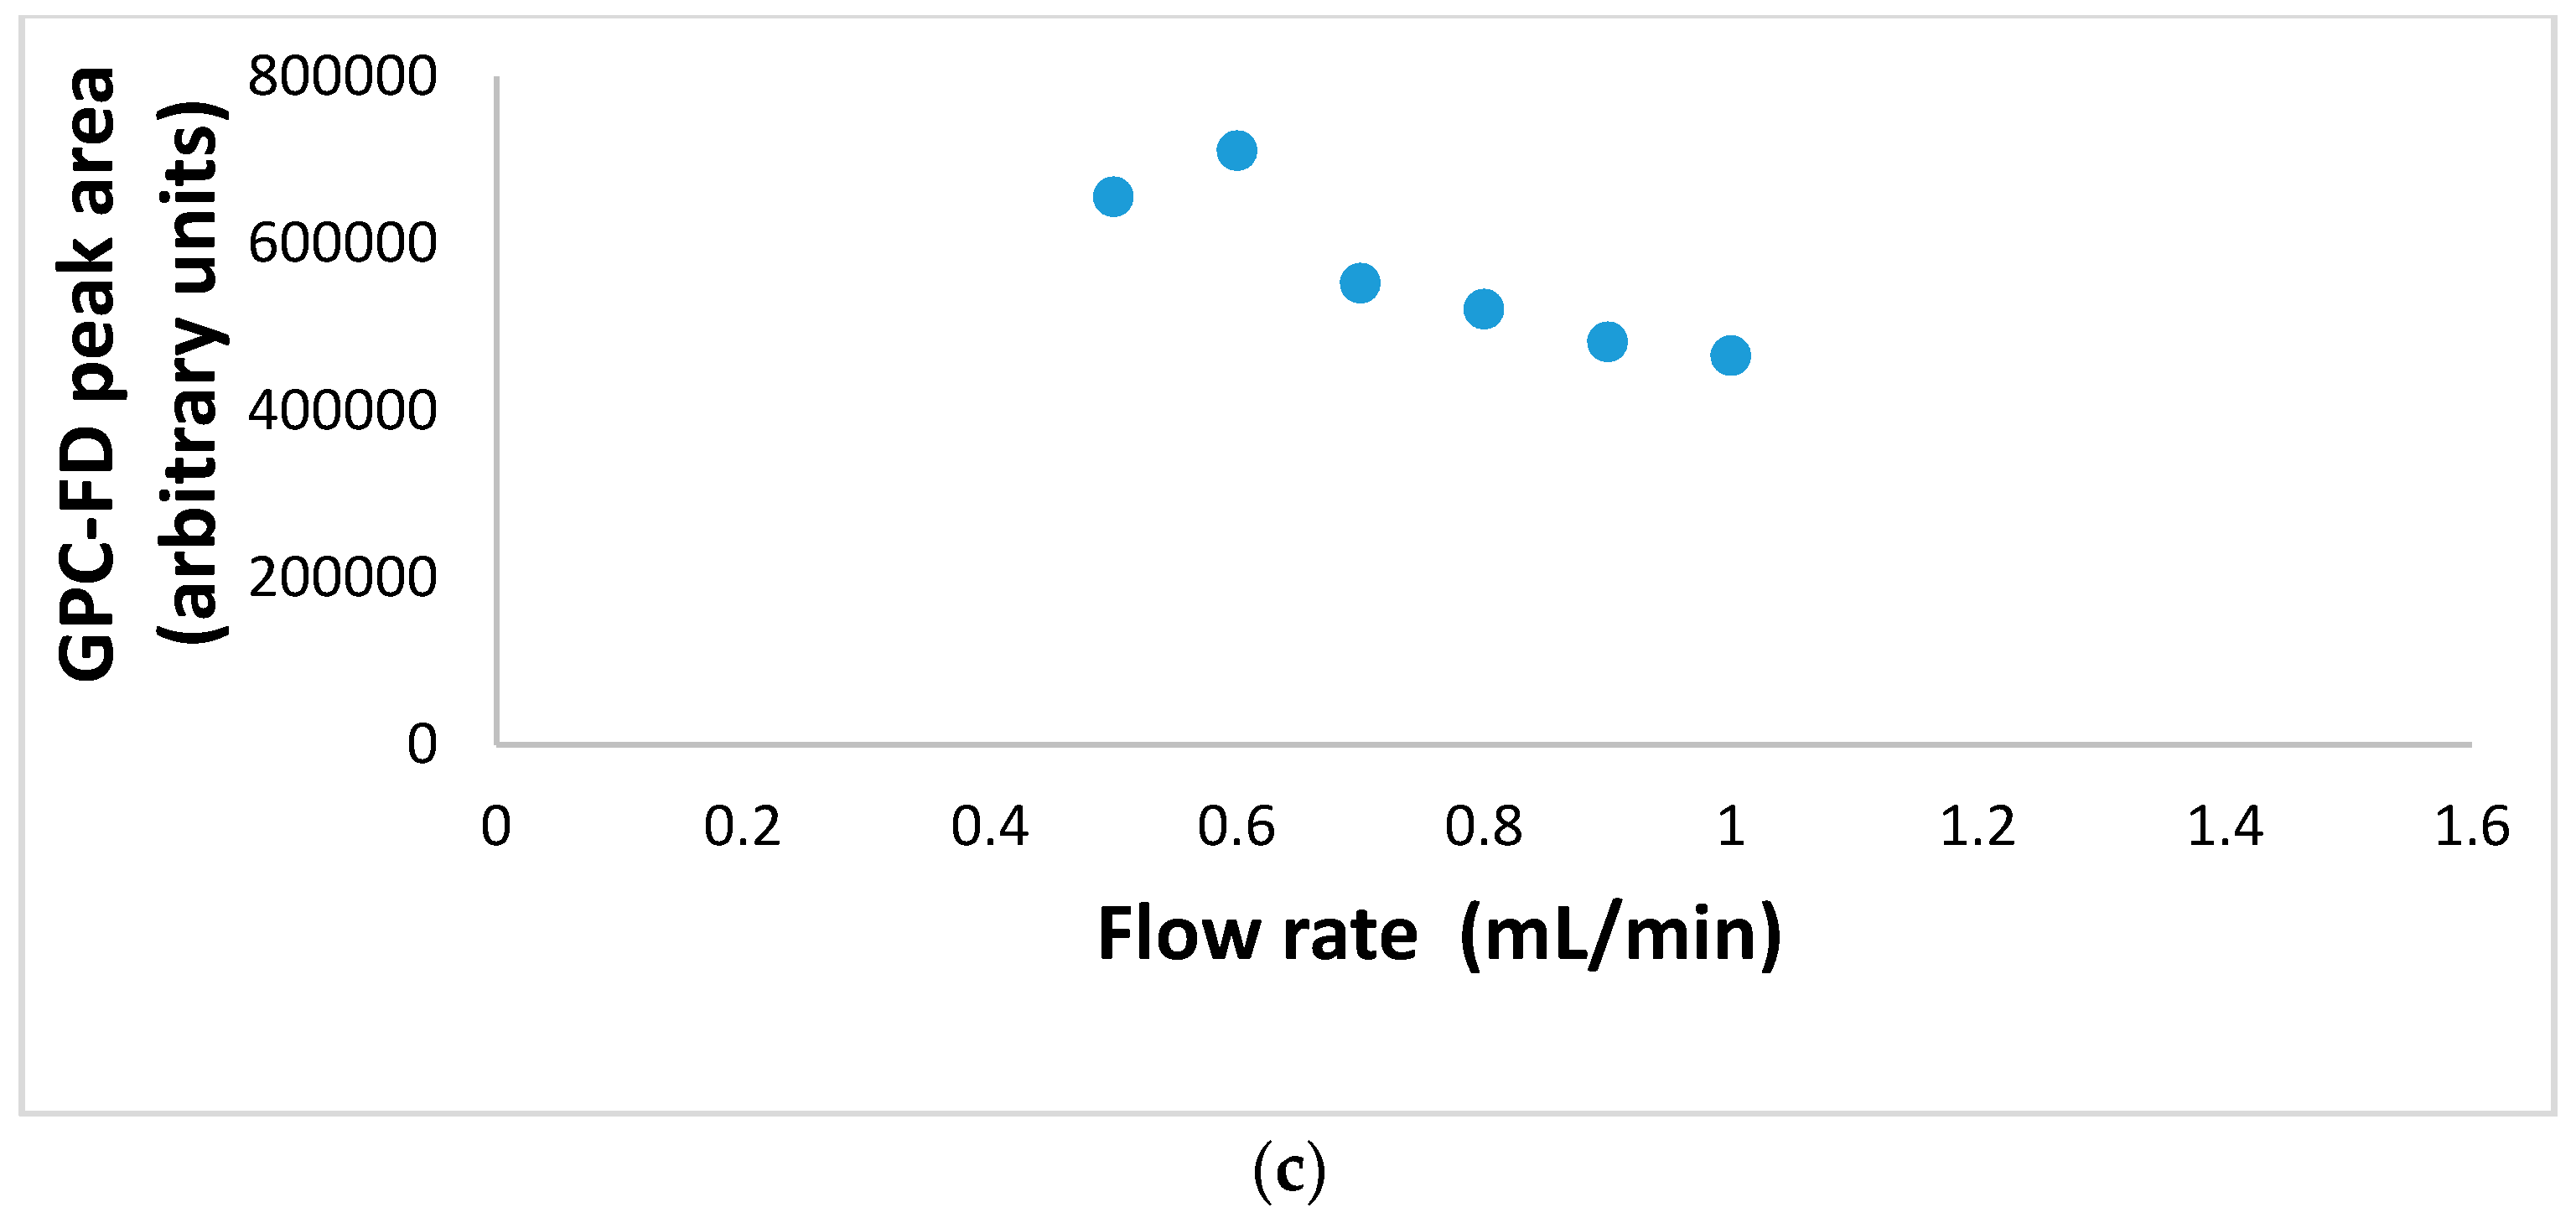
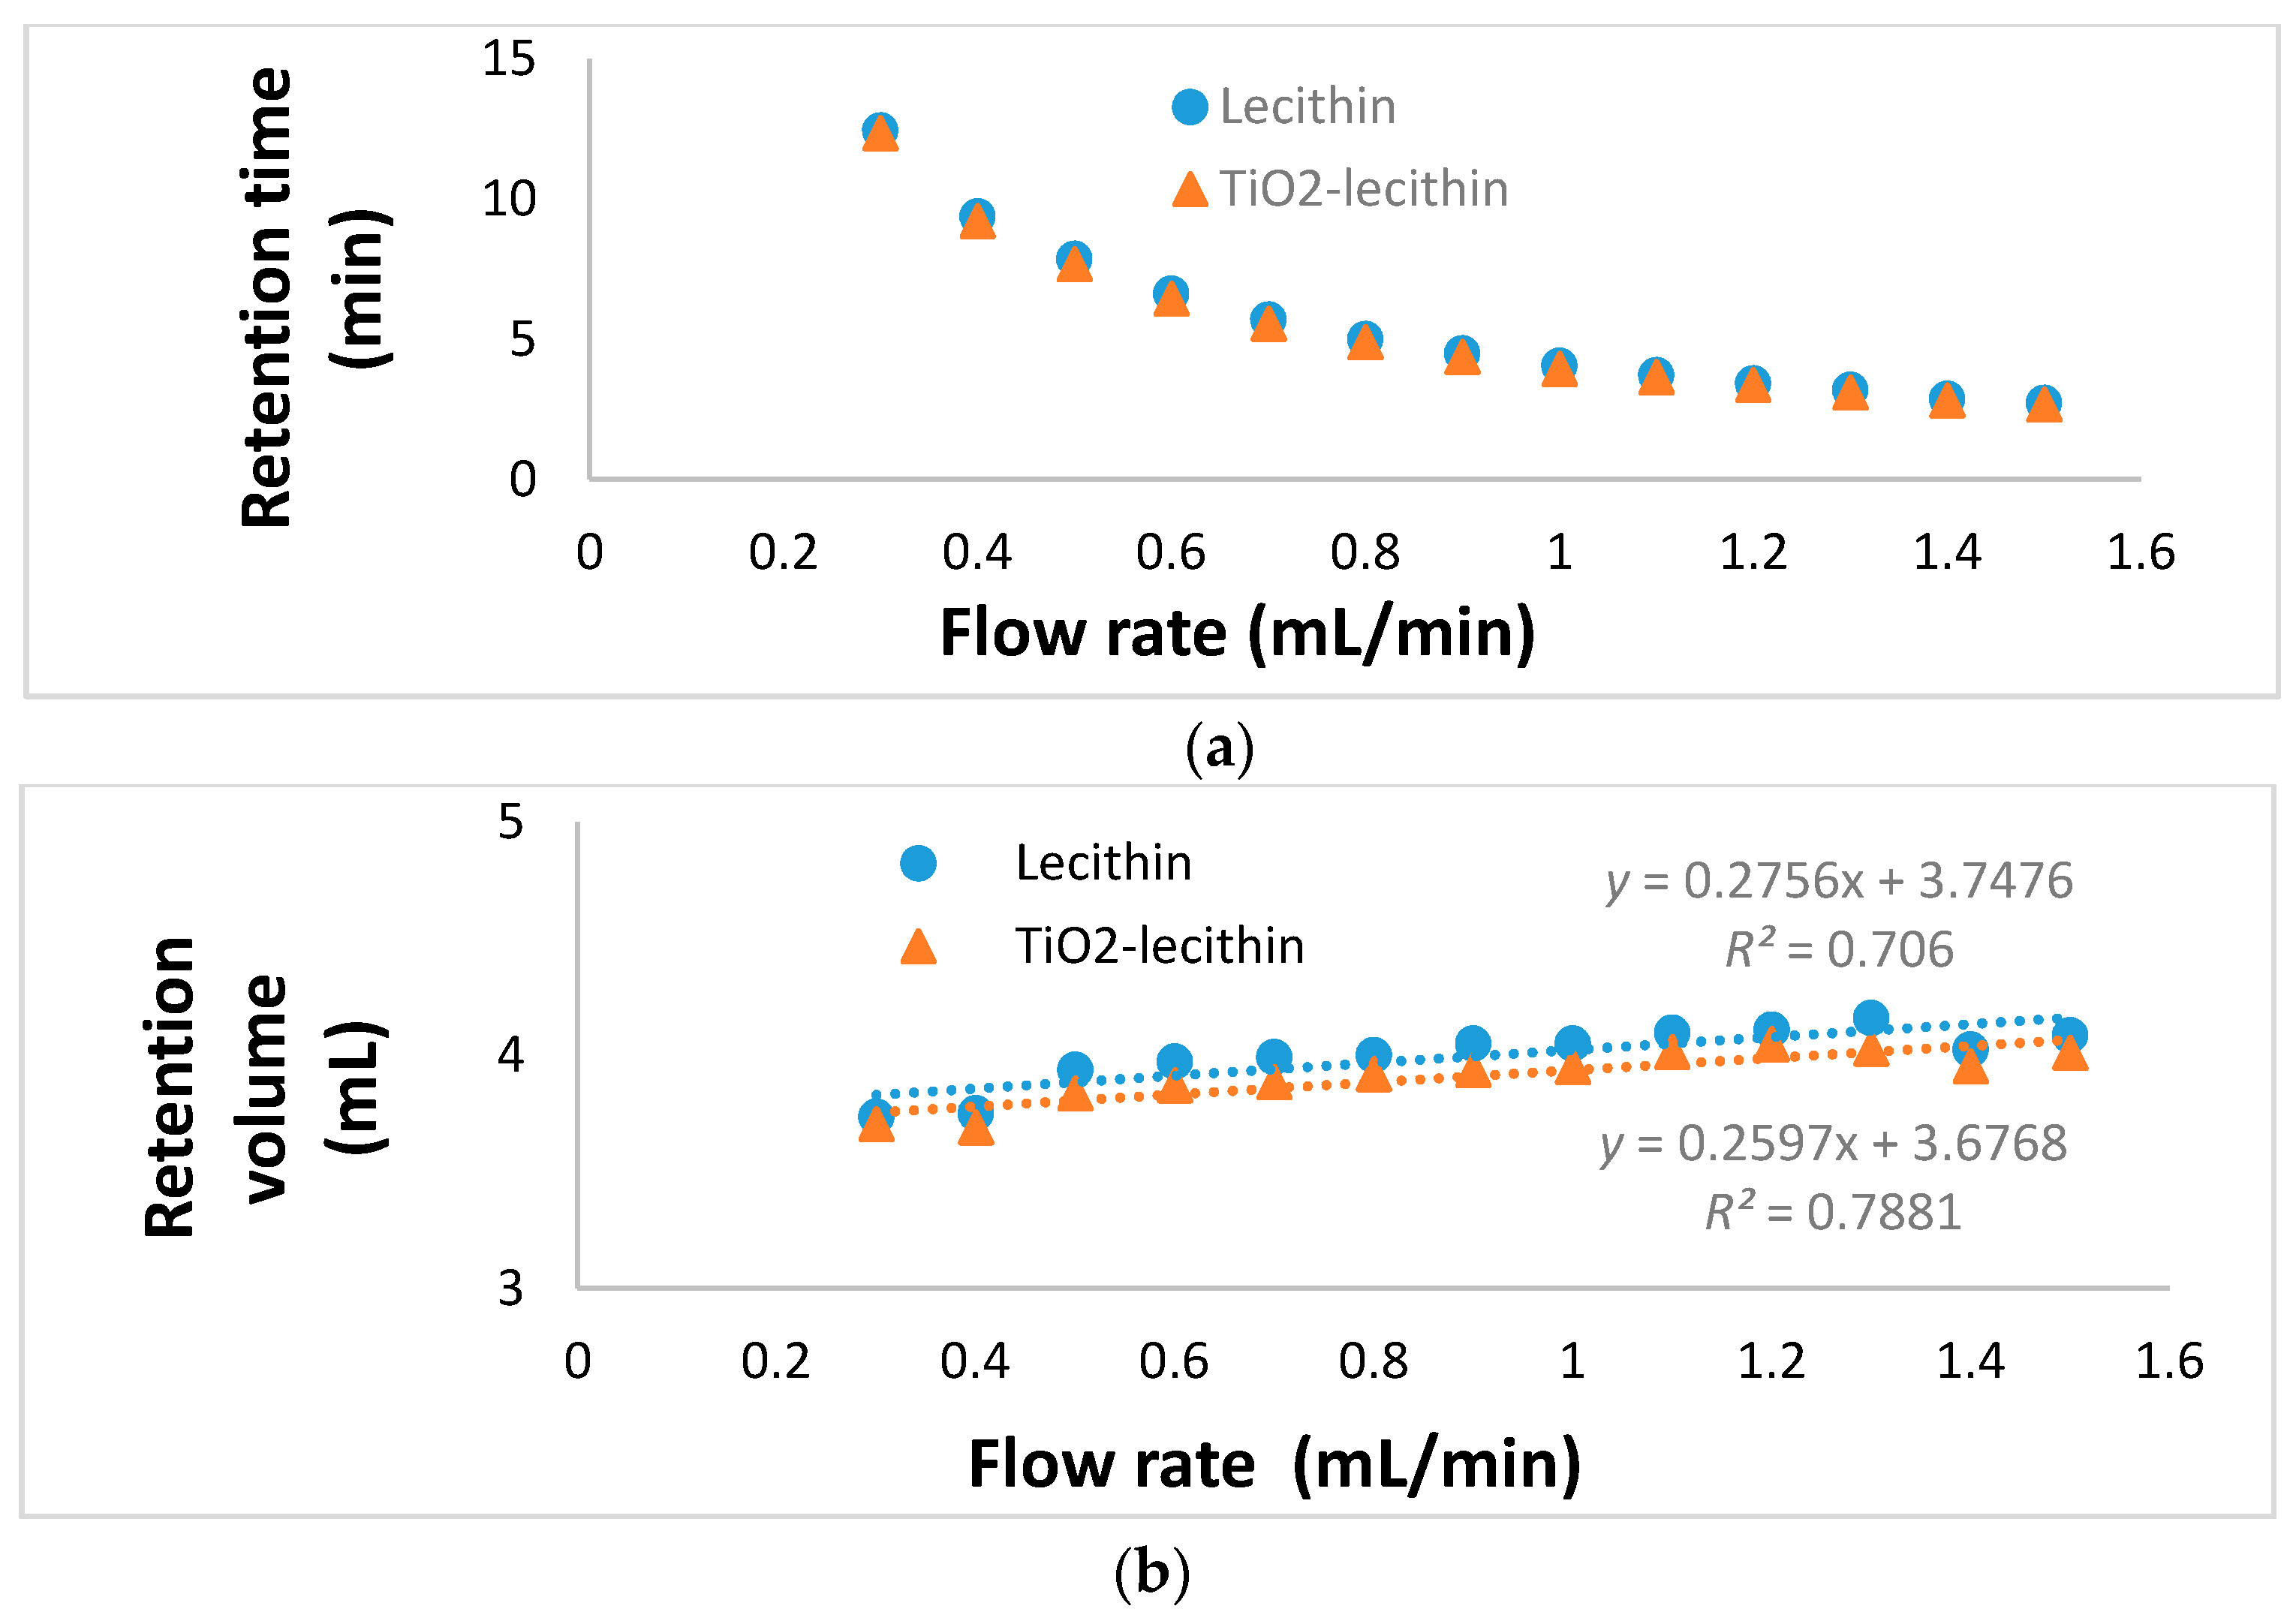
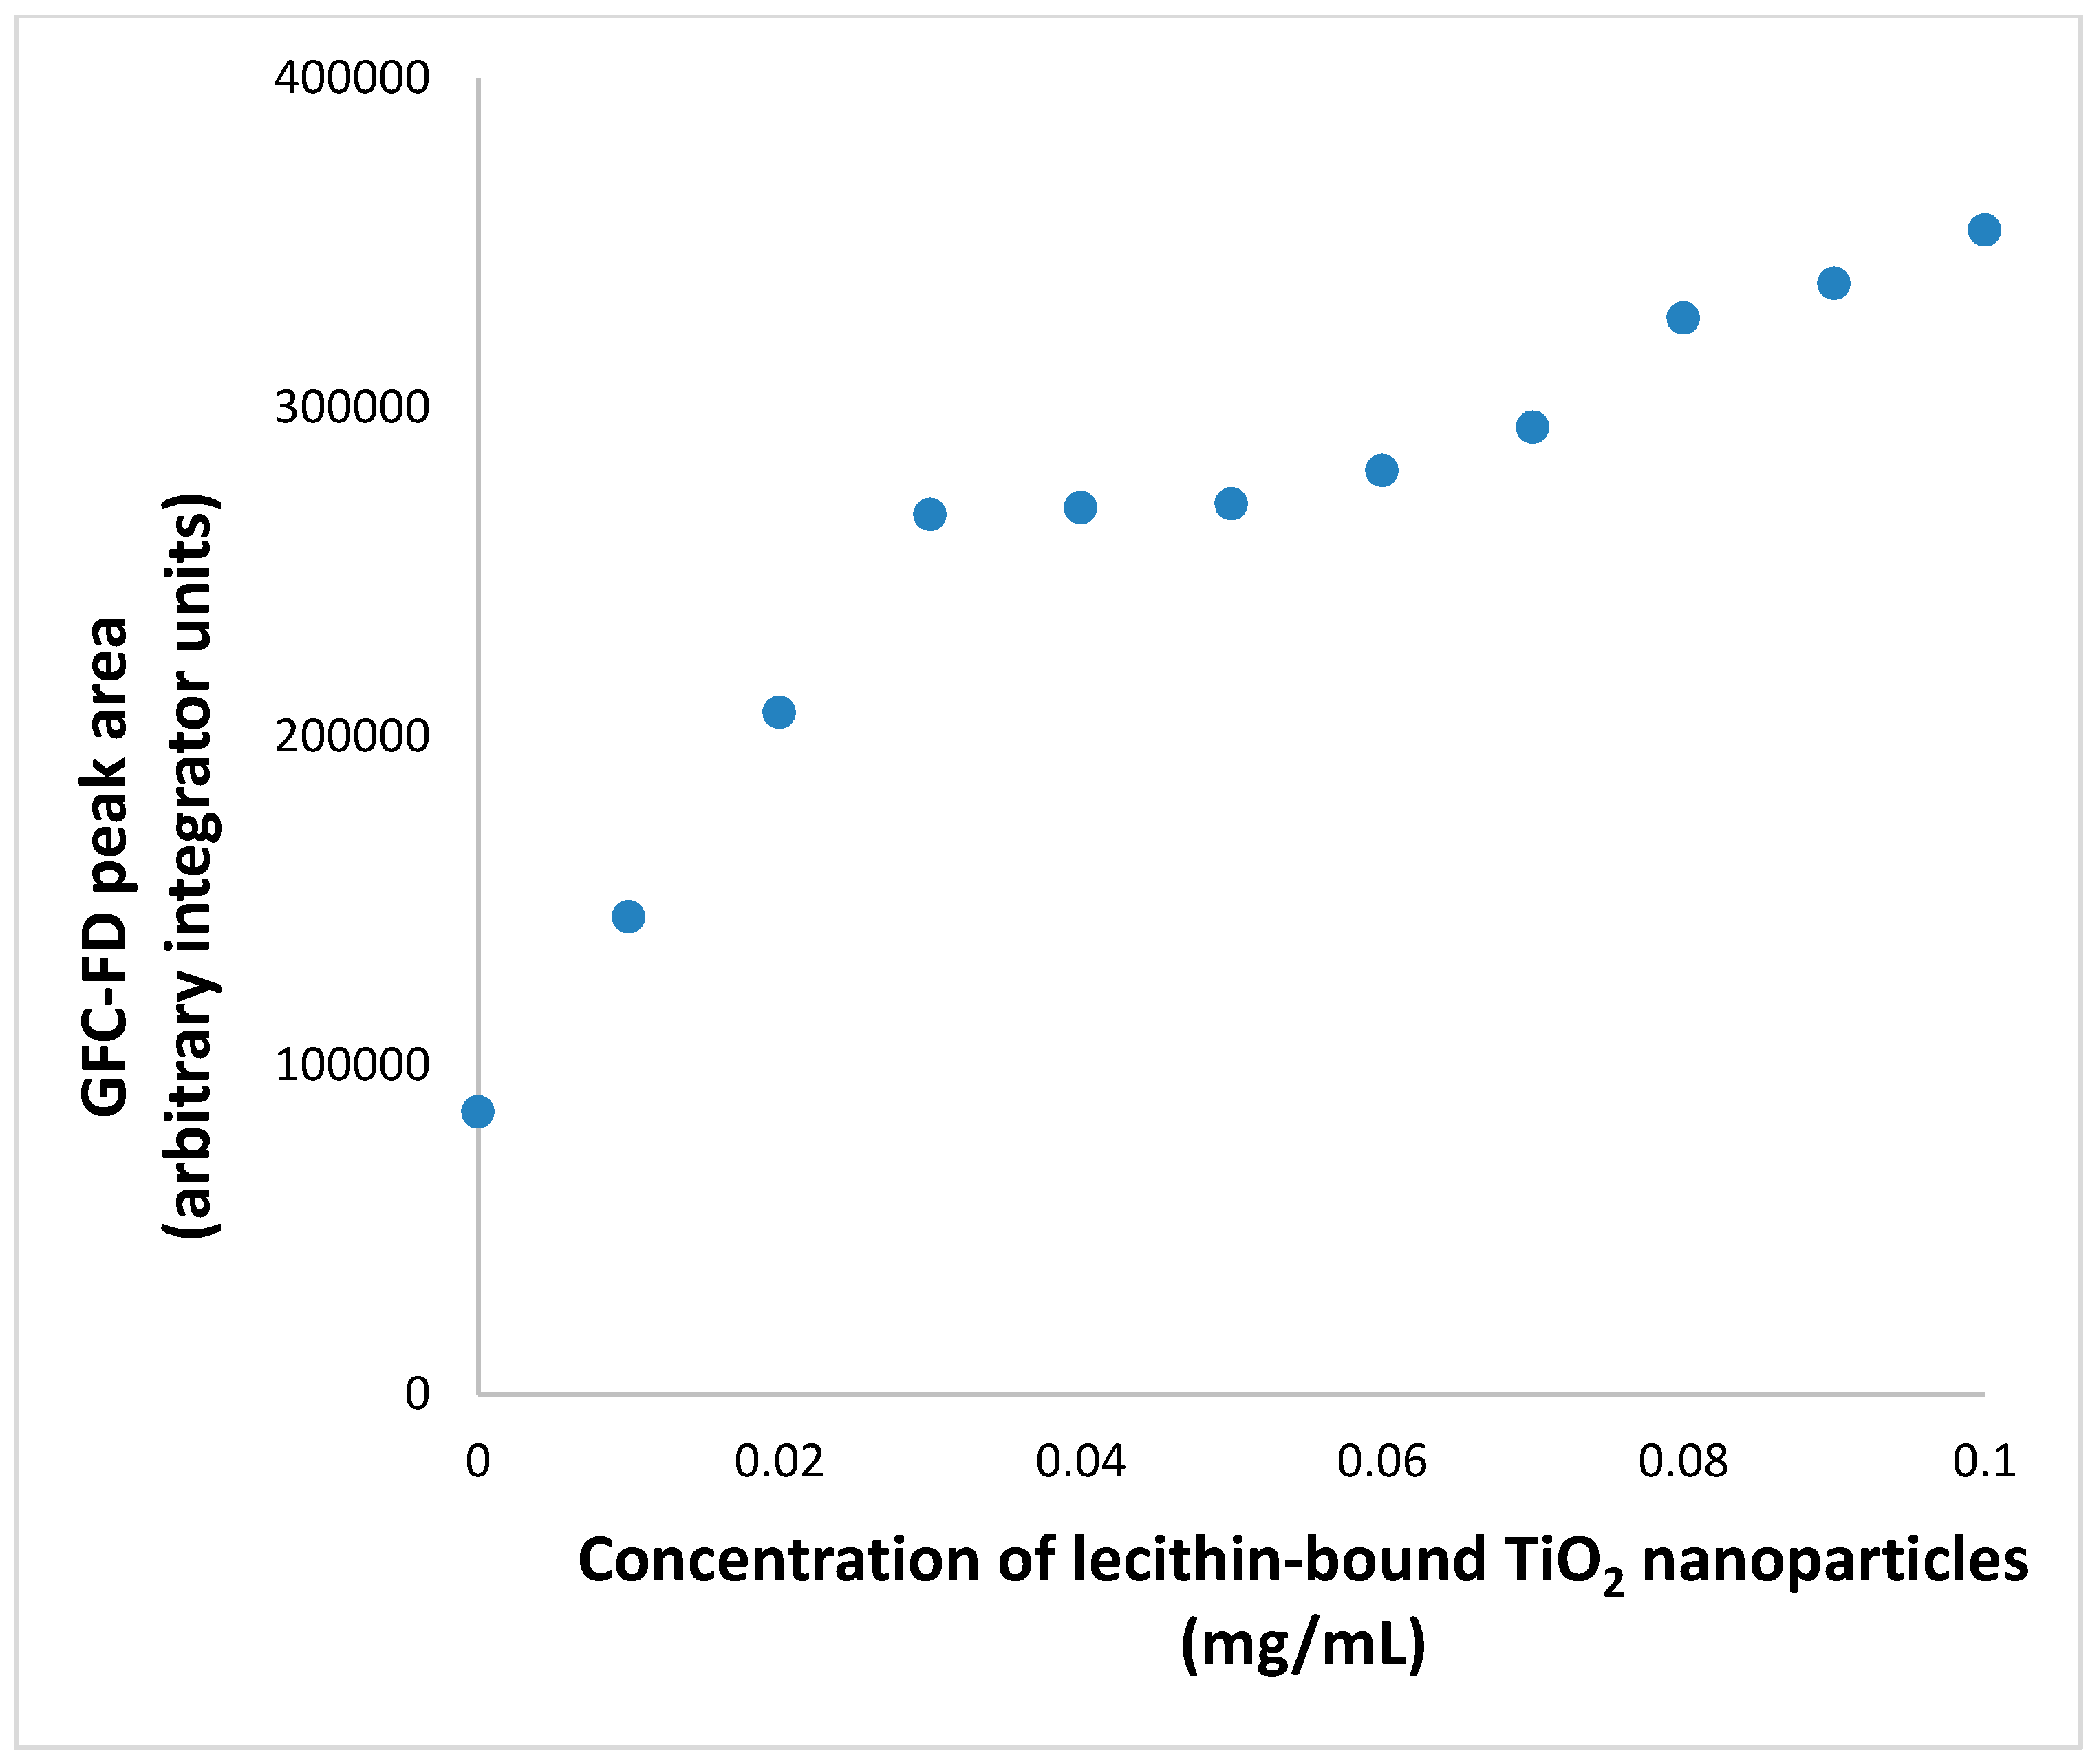
3.4. Extended GFC-FD Analysis of Lecithin Liposome-Encapsulated TiO2 Nanoparticles

A long GFC column (300 × 8 mm) was next used for extended analysis of lecithin liposome-encapsulated TiO2 nanoparticles, TiO2 nanoparticles, and lecithin liposomes separately. It was evidenced from the extended GFC-FD chromatograms (not shown here) that TiO2 nanoparticles (injected at a low concentration of 0.01 mg/mL) were retained excessively on the long column as no peak appeared using a mobile phase flow rate increasing from 0.5 mL/min up to 1.5 mL/min. These results can be explained based on the time needed for water to wash the TiO2 nanoparticles through the entire length of gel filtration matrix in the column. Fortunately, encapsulation of TiO2 nanoparticles within lecithin allowed them to go through the column together quickly to appear as one combo peak at a retention time of 4.15 min. It was confirmed that the peak area of lecithin liposome-encapsulated TiO2 nanoparticles was larger than that for lecithin liposomes alone, to our great delight.
The influence of flow rate (from 0.5 to 1.0 mL/min) on the retention time, retention volume, and peak area of lecithin liposome-encapsulated TiO2 nanoparticles (injected at a low concentration of 0.01 mg/mL) was systematically investigated. An increase of flow rate obviously decreased their retention time in Figure 7a, while the retention volume stayed constant at 4.03 ± 0.05 mL with a nearly horizontal trend line in Figure 7b, and the peak area decreased in Figure 7c because the peak became narrower as expected. The unidirectional trends of these results, within experimental errors, confirmed consistently the feasibility of determining TiO2 nanoparticles in the presence of lecithin liposomes.
The influence of flow rate (from 0.3 to 1.5 mL/min) on the retention time, retention volume, and peak area of lecithin liposome-encapsulated TiO2 nanoparticles (injected at a high concentration of 1.0 mg/mL) was also systematically investigated. An increase of flow rate again decreased their retention time in Figure 8a while their retention volume remained constant at 3.95 ± 0.07 mL with a nearly horizontal trend line in Figure 8b. Interestingly, the retention volume for lecithin liposomes was actually higher, indicating a smaller size than lecithin liposome-encapsulated TiO2 nanoparticles. This makes sense because the high concentration of encapsulated TiO2 nanoparticles could enlarge the size of each and every lecithin liposome. As smaller molecules have greater access and larger molecules are excluded from the gel filtration matrix, they would be eluted from the GFC column in decreasing order of size. The difference in peak area between lecithin liposomes and lecithin liposome-encapsulated TiO2 nanoparticles allowed easily for quantitative determination of TiO2 nanoparticles at this high concentration. Again, the peak area decreased in Figure 8c because the peak became narrower as the flow rate was increased.
The flow rate of 1.0 mL/min was deemed optimal for all subsequent extended GFC-FD analyses of TiO2 (and other metal oxide) nanoparticles. Encapsulation within lecithin liposomes improved their stability when travelling through the entire length of the gel filtration matrix in the column. Lecithin liposomes apparently carried the TiO2 nanoparticles through the gel column, as evidenced by a larger peak area, without increasing its original retention time—which indicated a relatively large size corresponding to liposomes. Vemuri and Rhodes had previously explored the use of size exclusion chromatography, as a large-scale process, to separate liposomes from free drug in a liposome preparation [52]. Interestingly, lecithin presented no distinct critical micelle concentration in either alcohol solution or water suspension, as Hara et al. had measured using electric conductivity and fluorescence [53]. Hypothetically, in the present work, TiO2 nanoparticles were first stripped of all adsorbed anions by the methanol inside lecithin liposomes. Methanol had previously been used for desorption of picrate anions from magnetic nanoparticles that were coated with cetyltrimethyl-ammonium bromide [54]. Presumably, lecithin molecules dispersed around the bare non-ionic TiO2 nanoparticles that interacted favorably with the hydrophobic lipid moiety of each lecithin molecule. Under strong ultrasonication, they merged to form nanoliposomes, each containing several TiO2 nanoparticles. Being metastable aggregates of lipids [55], coalescence between lecithin nanoliposomes occurred when they were compressed by ultrasonic homogenization [56]. A calibration curve was constructed for the extended GFC analysis of lecithin-bound TiO2 nanoparticles at a flow rate of 1.0 mL/min, using λex,max = 350 nm and λem,max = 395 nm for FD. As shown in Figure 9, initially the GFC-FD peak area increased with increasing uptake of TiO2 nanoparticles by the lecithin liposomes, up to 0.03 mg/mL. However, no significant increase in peak area could be observed from 0.03 to 0.06 mg/mL, apparently indicating no further uptake of TiO2 nanoparticles by the lecithin liposomes. Above 0.06 mg/mL, the peak area continued to increase only moderately to suggest a possible restructuring of the TiO2 nanoparticle-loaded lecithin liposomes. Further research needs to elucidate the mechanism of action behind this irregular shape of the calibration curve.
Optimization of the GFC-FD method was carried out by adding different amounts of lecithin liposomes into either distilled deionized water or TiO2 nanoparticles (1.0 mg/mL). The peak area at 4.15 min for lecithin liposomes exhibited a linear correlation with the amount of lecithin liposomes as shown in Figure 10. However, a significantly steeper slope was obtained for TiO2 nanoparticles (than that for water). Apparently, the more lecithin liposomes were added, the lower the concentration of TiO2 nanoparticles that would be encapsulated within each and every liposome. Thus, the excitation of TiO2 fluorescence became more efficient and the emission of TiO2 fluorescence became less self-quenched. This strongly suggested that more lecithin liposomes can be used to obtain a larger peak area for any given concentration of TiO2 nanoparticles after subtraction of the lecithin liposomes blank, thereby improving the analytical sensitivity of this extended GFC method.

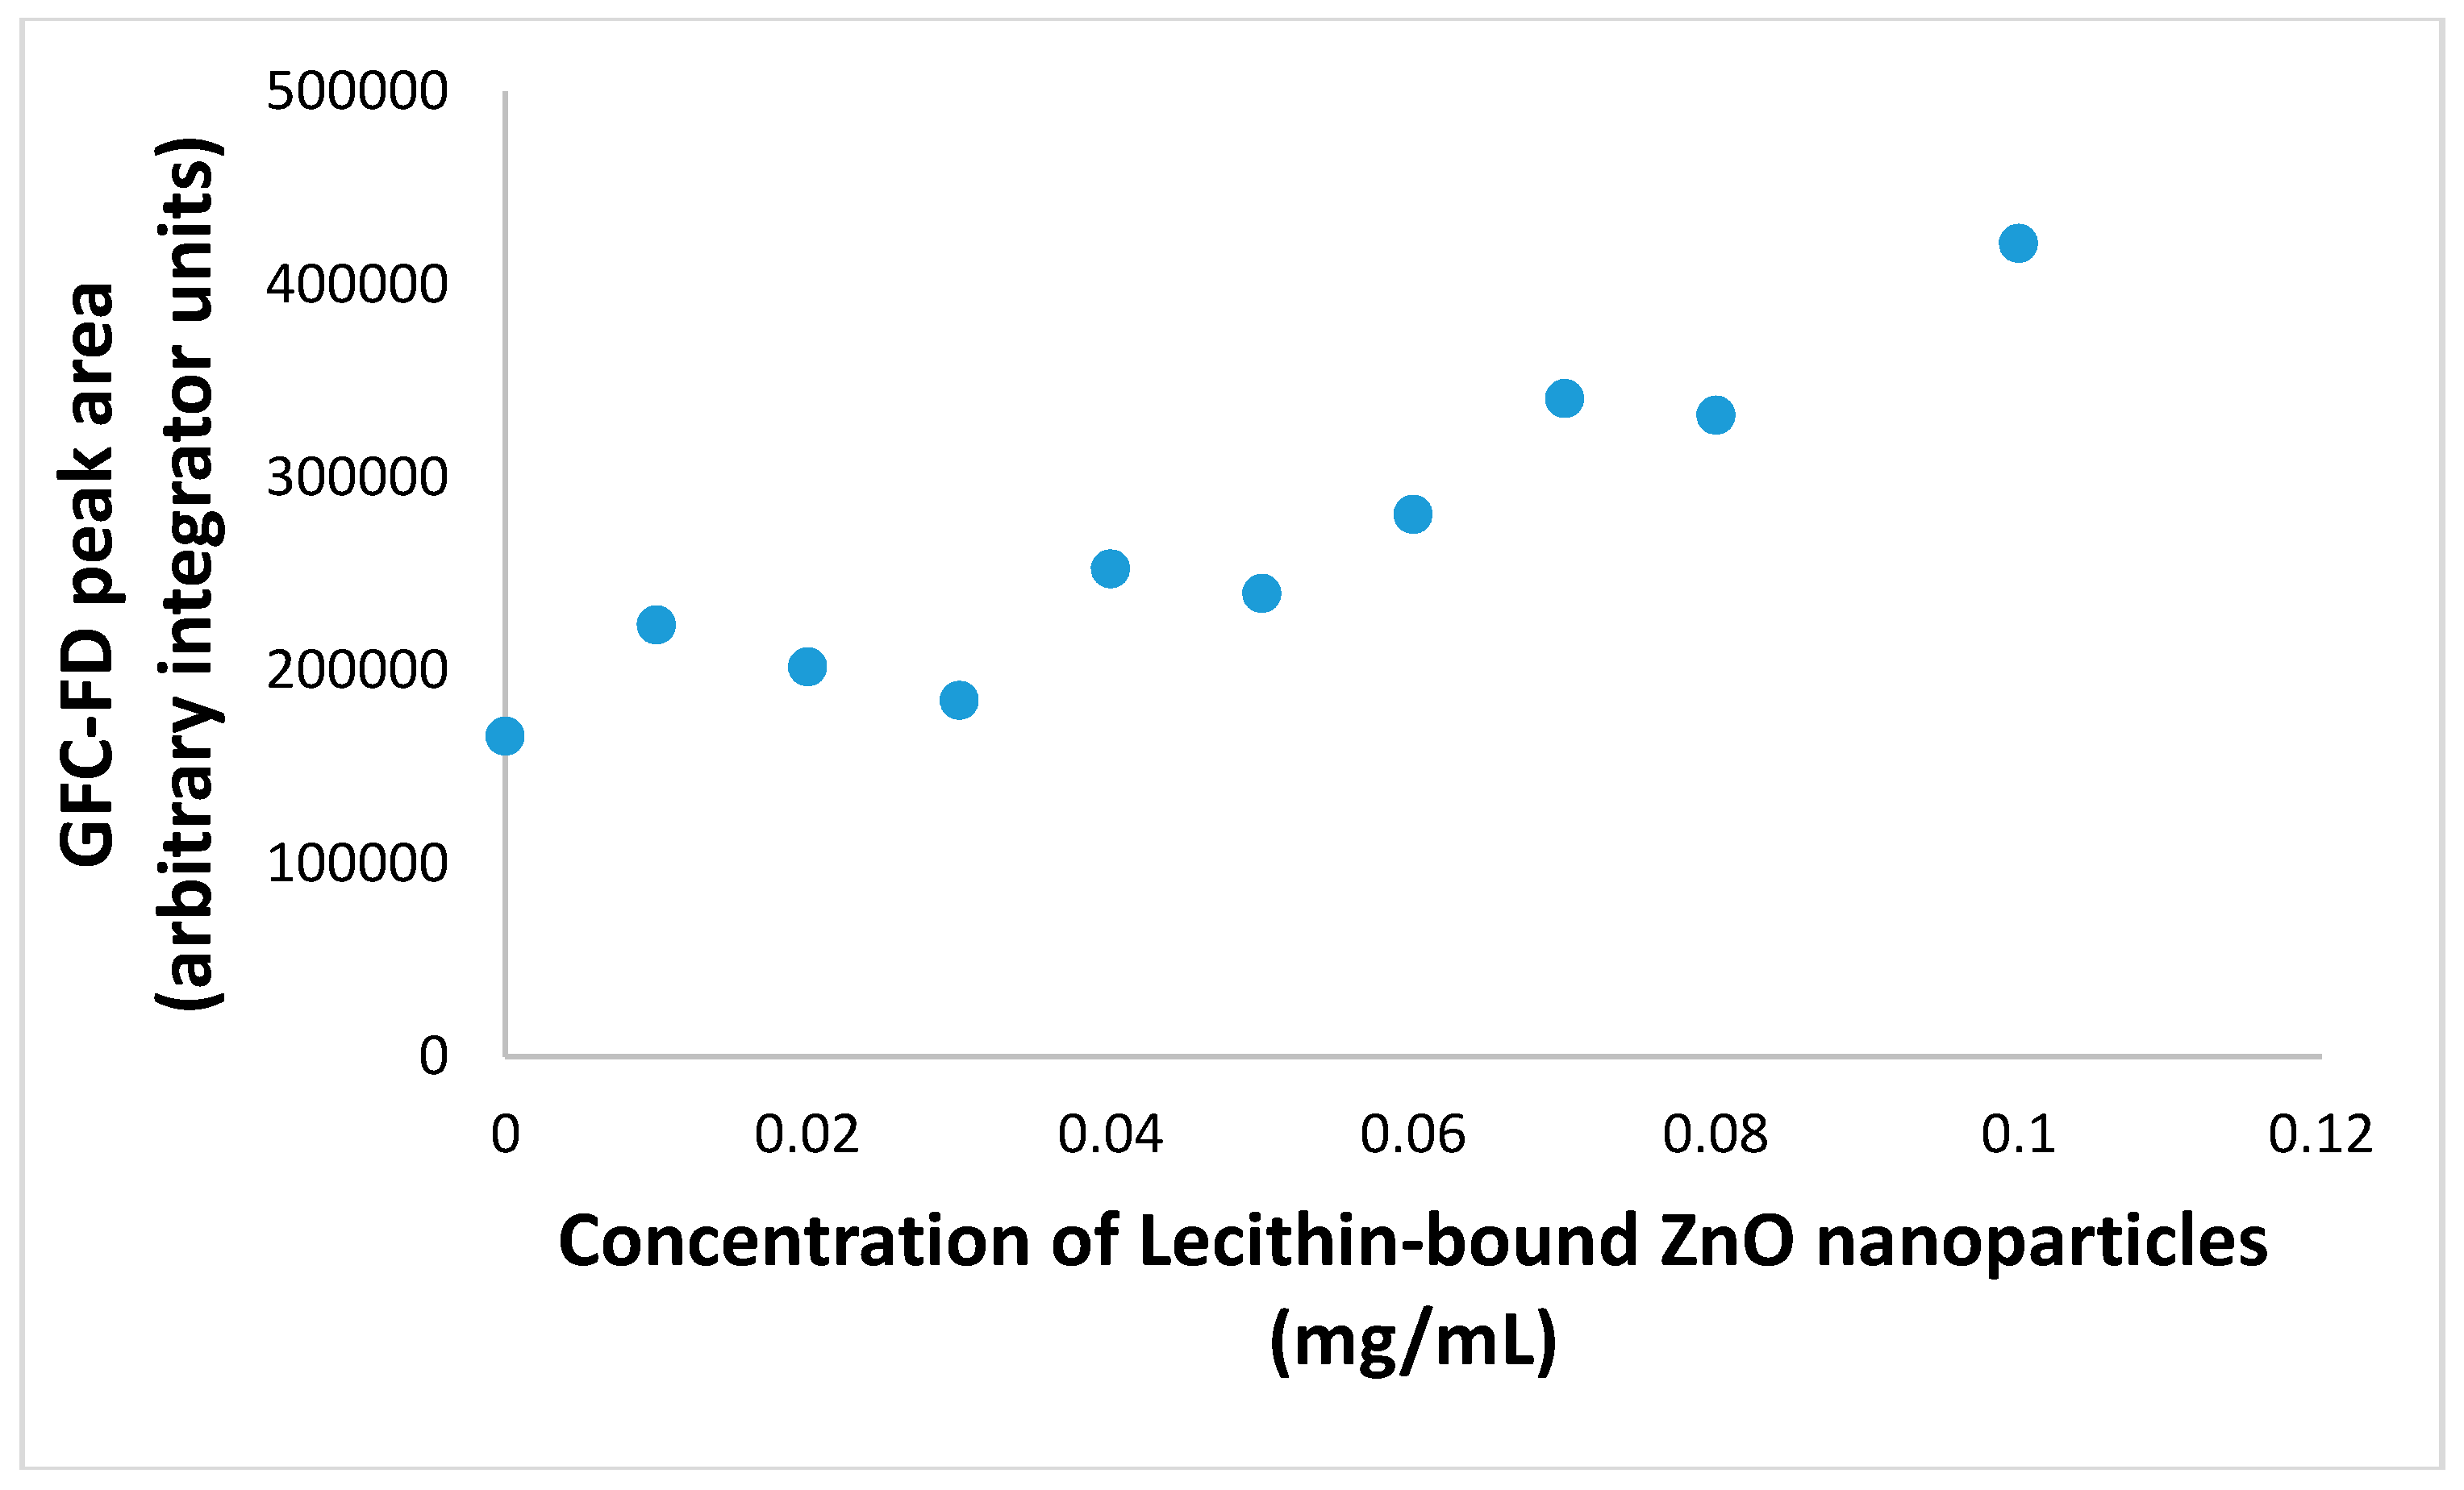
3.5. Extended GFC-FD Analysis of Lecithin Liposome-Encapsulated ZnO Nanoparticles

In order to demonstrate the potential application of lecithin liposomes for encapsulating metal oxide nanoparticles other than just TiO2 in water treatment, extended GFC-FD analysis was next performed on lecithin liposome-encapsulated ZnO nanoparticles, ZnO nanoparticles, and lecithin liposomes. Just like TiO2, encapsulation of ZnO nanoparticles within lecithin liposomes allowed them to go through the column together to appear as a combination peak at a retention time of 4.34 min in Figure 11a. It was next evidenced that ZnO nanoparticles were strongly retained on the long column until its peak appeared at 11.47 min in Figure 11b. The chromatogram in Figure 11c shows a peak at 4.15 min with an area linearly proportional to the concentration of lecithin liposomes (R2 = 0.98, data not shown). In hindsight, for the sake of contrasting, TiO2 nanoparticles had not shown any peak and lecithin liposome-encapsulated TiO2 nanoparticles had exhibited a retention time of 4.42 min.
The peak area of 1.0 mg/mL lecithin liposome-encapsulated ZnO nanoparticles was significantly stronger than that of lecithin liposomes alone. A standard calibration curve has been constructed in Figure 12 for the extended GFC analysis at a flow rate of 1.0 mL/min, using λex = 350 nm and λem = 395 nm for FD. Binding of lecithin liposomes with ZnO nanoparticles is confirmed by the larger peak areas for increasing concentrations from 0.01 mg/mL to 0.10 mg/mL. For lecithin liposome-encapsulated ZnO nanoparticles, a detection limit of 0.05 mg/mL is attained by this GFC-FD method.

3.6. Extended GFC-FD Analysis of Lecithin Liposome-Encapsulated Graphene Quantum Dots

It is important to develop a cost effective technology for the removal of TiO2 nanoparticles ranging from industrial wastewater to contaminated drinking water treatment. A limiting factor in drinking water treatment is the ability to collect all the waterborne nanoparticles for removal. Industrial filtration technologies are currently used on a very large scale but they are often plagued by structural variation and surface fouling of membrane filters [57,58,59]. The results discussed so far show the possibility of using lecithin liposomes for simple water treatment. One monitoring requirement is that the nanoparticle-loaded lecithin liposomes must subsequently be removed from the treated water before it is released to local waterways. Fluorescent GQDs have attracted tremendous attention for a wide range of sensing applications because of their good water dispersibility, high photostability, excellent biocompatibility, and low toxicity [60,61,62]. They can potentially serve as a sensor probe for monitoring the complete removal of nanoparticle-loaded liposomes from the treated water. Extended GFC analysis of a small aliquot of GQDs that had previously been synthesized and characterized in our lab [19] produced a sharp FD peak at 21.2 min in Figure 13a, as expected for their small size of 5–6 nm. Extended GFC analysis of GQDs in mixture with lecithin liposome-encapsulated TiO2 nanoparticles showed a significant reduction in the GQDs peak area at 20.8 min and the appearance of a small peak at 9.4 min in Figure 13b. This new peak could be attributed to the encapsulation of GQDs by lecithin liposomes (loaded with TiO2 nanoparticles). This result is consistent with a previous work by Chen et al. on the encapsulation of quantum dots in liposomes and the separation of nanoparticle-loaded liposomes from unencapsulated nanoparticles by size exclusion chromatography using a Sepharose gel [63]. They used fluorescence correlation spectroscopy to determine that each liposome encapsulated an average of three quantum dots. Hence, both studies have indicated GQDs can potentially serve the purpose of monitoring the nanoparticle-loaded liposomes to track their complete removal from treated water by ultrafiltration using the membrane separation technology [19,64,65].

4. Conclusions

Coating with polydopamine and encapsulation within lecithin liposomes prevent TiO2 and ZnO nanoparticles from aggregation during extended chromatographic separation through the gel filtration matrix, even in a long column. To the best of our knowledge, this is the first report on the gel filtration chromatographic analysis of lecithin liposomes that demonstrates their potential application for cleaning up two different types of metal oxide nanoparticles in water treatment, at a high efficiency but with a low cost. The colloidal stability of TiO2-PDA nanoparticles is important but not crucial for this new method because every sample is homogenized ultrasonically both during encapsulation by lecithin liposomes and before each GFC-FD analysis. In water treatment, unstable nanoparticles form aggregates, undergo sedimentation, and thus do not need liposome encapsulation to clean them up. Considering the importance of industrial wastewater and drinking water treatment technologies, liposomes can be completely removed by membrane ultrafiltration but metal oxide nanoparticles cannot. Further research will need to test whether this method is applicable to environmental matrices with a complex composition. Encapsulation of graphene quantum dots by liposomes will potentially allow monitoring of the nanoparticle-loaded liposomes during their subsequent removal from the treated water before it is released to local waterways or delivered to homes for drinking.

Acknowledgments

Financial support from NSERC Canada (grant number 315574) is gratefully acknowledged.

Author Contributions

Edward P. C. Lai conceived and designed the experiments; Xuhao Zhao performed the experiments; Xuhao Zhao and Edward P. C. Lai analyzed the data; Edward P. C. Lai and Xuhao Zhao wrote the paper.

Conflicts of Interest

The authors declare no conflict of interest. The funding sponsor had no role in the design of the study; in the collection, analysis, or interpretation of data; in the writing of the manuscript, and in the decision to publish the results.

List of Symbols and Abbreviations

CeO2ceria
FDfluorescence detection
GFCgel filtration chromatography
λem,maxmaximum emission wavelength
λex,maxmaximum excitation wavelength
PDApolydopamine
TiO2titania
ZnOzinc oxide

References

  1. Regulatory Cooperation Council. Nanotechnology Initiative. Final Report. Work Element 2, Priority Setting: Development of a Joint Nanomaterials Classification Scheme. Regulatory Cooperation Council. Available online: http://nanoportal.gc.ca/666215CB-929F-4F75-B78C-4D9DD0F1093B/FINAL%20DRAFT%20RCC%20Nanotechnology%20Initiative%20Work%20Element%202.pdf (accessed on 4 February 2018).
  2. Long, T.C.; Saleh, N.; Tilton, R.D.; Lowry, G.V.; Veronesi, B. Titanium dioxide (P25) produces reactive oxygen species in immortalized brain microglia (BV2): Implications for nanoparticle neurotoxicity. Environ. Sci. Technol. 2006, 40, 4346–4352. [Google Scholar] [CrossRef] [PubMed]
  3. Trouiller, B.; Reliene, R.; Westbrook, A.; Solaimani, P.; Schiestl, R.H. Titanium dioxide nanoparticles induce DNA damage and genetic instability in vivo in mice. Cancer Res. 2009, 69, 8784–8789. [Google Scholar] [CrossRef] [PubMed]
  4. Chang, X.; Zhang, Y.; Tang, M.; Wang, B. Health effects of exposure to nano-TiO2: A meta-analysis of experimental studies. Nanoscale Res. Lett. 2013. [Google Scholar] [CrossRef] [PubMed]
  5. Grande, F.; Tucci, P. Titanium dioxide nanoparticles: A risk for human health? Mini Rev. Med. Chem. 2016, 16, 762–769. [Google Scholar] [CrossRef] [PubMed]
  6. Disdier, C. Evaluation of the Effects of TiO2 Nanoparticles Exposure on the Adult and Vulnerable Brains—Toxicology and Food Chain. Ph.D. Thesis, University of Paris-Saclay, Paris, France, 2016. Available online: https://tel.archives-ouvertes.fr/tel-01312182/document (accessed on 4 February 2018).
  7. Shah, S.N.A.; Shah, Z.; Hussain, M.; Khan, M. Hazardous effects of titanium dioxide nanoparticles in ecosystem. Bioinorg. Chem. Appl. 2017. [Google Scholar] [CrossRef] [PubMed]
  8. Barndõk, H.; Hermosilla, D.; Han, C.; Dionysiou, D.D.; Negro, C.; Blanco, Á. Degradation of 1,4-dioxane from industrial wastewater by solar photocatalysis using immobilized NF-TiO2 composite with monodisperse TiO2 nanoparticles. Appl. Catal. B Environ. 2016, 180, 44–52. [Google Scholar] [CrossRef]
  9. Wadhwa, U. Removal of Toxic Metal Ions from Industrial Waste Water by Photo Deposition on P-25 TiO2 Nanoparticles. Master’s Thesis, Thapar Univeristy, Patiala, India, 2016. Available online: http://dspace.thapar.edu:8080/jspui/handle/10266/4302 (accessed on 4 February 2018).
  10. Malakootian, M.; Ranandeh Kalankesh, L.; Loloi, M. Investigation of performance of hybrid nanoparticles TiO2/SiO2 in removing of mercury from industrial waste water. J. Toloo-E-Behdasht 2014, 13, 147–159. [Google Scholar]
  11. Kohri, M.; Yanagimoto, K.; Kawamura, A.; Hamada, K.; Imai, Y.; Watanabe, T.; Ono, T.; Taniguchi, T.; Kishikawa, K. Polydopamine-based 3D colloidal photonic materials: Structural color balls and fibers from melanin-like particles with polydopamine shell layers. ACS Appl. Mater. Interfaces 2017. [Google Scholar] [CrossRef] [PubMed]
  12. Nador, F.; Guisasola, E.; Baeza, A.; Villaecija, M.A.M.; Vallet-Regí, M.; Ruiz-Molina, D. Synthesis of polydopamine-like nanocapsules via removal of a sacrificial mesoporous silica template with water. Chem. Eur. J. 2017, 23, 2753–2758. [Google Scholar] [CrossRef] [PubMed]
  13. Li, Y.; Jiang, C.; Zhang, D.; Wang, Y.; Ren, X.; Ai, K.; Chen, X.; Lu, L. Targeted polydopamine nanoparticles enable photoacoustic imaging guided chemo-photothermal synergistic therapy of tumor. Acta Biomater. 2017, 47, 124–134. [Google Scholar] [CrossRef] [PubMed]
  14. Ye, W.; Huang, H.; Yang, W.; Wang, X.; Ren, C.; Hu, Q.; Li, Y.; Ren, B. Ultrathin polydopamine film coated gold nanoparticles: A sensitive, uniform, and stable SHINERS substrate for detection of benzotriazole. Analyst 2017, 142, 3459–3467. [Google Scholar] [CrossRef] [PubMed]
  15. Wang, L.; Miao, L.; Yang, H.; Yu, J.; Xie, Y.; Xu, L.; Song, Y. A novel nanoenzyme based on Fe3O4 nanoparticles@thionine-imprinted polydopamine for electrochemical biosensing. Sens. Actuators B Chem. 2017, 253, 108–114. [Google Scholar] [CrossRef]
  16. Fang, X.; Li, J.; Li, X.; Pan, S.; Zhang, X.; Sun, X.; Shen, J.; Han, W.; Wang, L. Internal pore decoration with polydopamine nanoparticle on polymeric ultrafiltration membrane for enhanced heavy metal removal. Chem. Eng. J. 2017, 314, 38–49. [Google Scholar] [CrossRef]
  17. Rao, Z.; Feng, K.; Tang, B.; Wu, P. Surface Decoration of Amino-Functionalized Metal-Organic Framework/Graphene Oxide Composite onto Polydopamine-Coated Membrane Substrate for Highly Efficient Heavy Metal Removal. ACS Appl. Mater. Interfaces 2017, 9, 2594–2605. [Google Scholar] [CrossRef] [PubMed]
  18. Yan, J.; Yang, L.; Lu, X.; Lee, P.S. Method of Preparing Hollow Metal or Metal Oxide Nano- or Micro-Spheres. U.S. Patents 9,555,557 B2, 31 January 2017. [Google Scholar]
  19. Wang, K.; Lai, E.P.C. Fluorescence quenching of graphene quantum dots by titania nanoparticles in water analysis after coating with polydopamine. J. Mol. Nanotechnol. Nanomed. 2017, 1, 106–114. [Google Scholar]
  20. Li, X.; John, V.T.; He, G.; Zhan, J.; Tan, G.; McPherson, G.; Bose, A.; Sarkar, J. Shear induced formation of patterned porous titania with applications to photocatalysis. Langmuir 2009, 25, 7586–7593. [Google Scholar] [CrossRef] [PubMed]
  21. Shchipunov, Y.; Krekoten, A. Crystalline titania nanoparticles synthesized in nonpolar Lα lecithin liquid-crystalline media in one stage at ambient conditions. Colloids Surf. B Biointerfaces 2011, 87, 203–208. [Google Scholar] [CrossRef] [PubMed]
  22. Taladrid, D.; Marín, D.; Alemán, A.; Álvarez-Acero, I.; Montero, P.; Gómez-Guillén, M.C. Effect of Chemical Composition and Sonication Procedure on Properties of Food-Grade Soy Lecithin Liposomes with Added Glycerol. Food Res. Int. 2017, 100, 541–550. [Google Scholar] [CrossRef] [PubMed]
  23. Zabodalova, L.A.; Chernjavskij, V.A.; Ishchenko, T.N.; Skvortcova, N.N. Production of liposomes from soybean lecithin. Sci. J. NRU ITMO 2011, 2, UDC 665.372+544.77. [Google Scholar]
  24. Mohan, A.; Rajendran, S.R.C.K.; Thibodeau, J.; Bazinet, L.; Udenigwe, C.C. Liposome Encapsulation of Anionic and Cationic Whey Peptides: Influence of Peptide Net Charge on Nanoliposome Formation and Properties. LWT Food Sci. Technol. 2018, 87, 40–46. [Google Scholar] [CrossRef]
  25. Jin, H.H.; Lu, Q.; Jiang, J.G. Curcumin liposomes prepared with milk fat globule membrane phospholipids and soybean lecithin. J. Dairy Sci. 2016, 99, 1780–1790. [Google Scholar] [CrossRef] [PubMed]
  26. Panahi, Y.; Farshbaf, M.; Mohammadhosseini, M.; Mirahadi, M.; Khalilov, R.; Saghfi, S.; Akbarzadeh, A. Recent advances on liposomal nanoparticles: Synthesis, characterization and biomedical applications. Artif. Cells Nanomed. Biotechnol. 2017, 45, 788–799. [Google Scholar] [CrossRef] [PubMed]
  27. Guner, S.; Oztop, M.H. Food grade liposome systems: Effect of solvent, homogenization types and storage conditions on oxidative and physical stability. Colloids Surf. A Physicochem. Eng. Asp. 2017, 513, 468–478. [Google Scholar] [CrossRef]
  28. Sahu, A.K.; Jain, V. Screening of process variables using Plackett–Burman design in the fabrication of gedunin-loaded liposomes. Artif. Cells Nanomed. Biotechnol. 2017, 45, 1011–1022. [Google Scholar] [CrossRef] [PubMed]
  29. Nguyen, T.L.; Nguyen, T.H.; Nguyen, D.H. Development and in vitro evaluation of liposomes using soy lecithin to encapsulate paclitaxel. Int. J. Biomater. 2017, 2017. [Google Scholar] [CrossRef] [PubMed]
  30. Nkanga, C.I.; Krause, R.W.; Noundou, X.S.; Walker, R.B. Preparation and characterization of isoniazid-loaded crude soybean lecithin liposomes. Int. J. Pharm. 2017, 526, 466–473. [Google Scholar] [CrossRef] [PubMed]
  31. Naeem, S.; Kiew, L.V.; Chung, L.Y.; Fui, K.S.; Misran, M.B. A comparative approach for the preparation and physicochemical characterization of lecithin liposomes using chloroform and non-halogenated solvents. J. Surfactants Deterg. 2015, 18, 579–587. [Google Scholar] [CrossRef]
  32. Roberts, S.A.; Parikh, N.; Blower, R.J.; Agrawal, N. SPIN: Rapid synthesis, purification, and concentration of small drug-loaded liposomes. J. Liposome Res. 2017. [Google Scholar] [CrossRef] [PubMed]
  33. Nayak, D.; Boxi, A.; Ashe, S.; Thathapudi, N.C.; Nayak, B. Stavudine loaded gelatin liposomes for HIV therapy: Preparation, characterization and in vitro cytotoxic evaluation. Mater. Sci. Eng. C 2017, 73, 406–416. [Google Scholar] [CrossRef] [PubMed]
  34. Cheraghi, M.; Negahdari, C.B.; Daraee, H.; Eatemadi, A. Heart targeted nanoliposomal/nanoparticles drug delivery: An updated review. Biomed. Pharmacother. 2017, 86, 316–323. [Google Scholar] [CrossRef] [PubMed]
  35. Barenholz, A.L.; Barenholz, Y.; Bercovier, H. Nano-liposomes of crude soy lecithin are effective for cleaning fuel-contaminated sands and soils. Expert Opin. Environ. Biol. 2016, 5. [Google Scholar] [CrossRef]
  36. Simões, M.G.; Alves, P.; Carvalheiro, M.; Simões, P.N. Stability effect of cholesterol-poly(acrylic acid) in a stimuli-responsive polymer-liposome complex obtained from soybean lecithin for controlled drug delivery. Colloids Surf. B Biointerfaces 2017, 152, 103–113. [Google Scholar] [CrossRef] [PubMed]
  37. Hao, J.; Guo, B.; Yu, S.; Zhang, W.; Zhang, D.; Wang, J.; Wang, Y. Encapsulation of the flavonoid quercetin with chitosan-coated nano-liposomes. LWT Food Sci. Technol. 2017, 85A, 37–44. [Google Scholar] [CrossRef]
  38. Zhao, Y.; Zhao, J.; Shan, G.; Yan, D.; Chen, Y.; Liu, Y. SERS-active liposome@Ag/Au nanocomposite for NIR light-driven drug release. Colloids Surf. B Biointerfaces 2017, 154, 150–159. [Google Scholar] [CrossRef] [PubMed]
  39. O’Fagain, C.; Cummins, P.M.; O’Connor, B.F. Protein Chromatography; Methods in Molecular Biology Book Series; Humana Press: New York, NY, USA, 2017; Volume 681, pp. 25–33. [Google Scholar]
  40. Hagel, L. Gel-Filtration Chromatography. Curr. Protoc. Mol. Biol. 2001. [Google Scholar] [CrossRef]
  41. Fedotov, P.S.; Vanifatova, N.G.; Shkinev, V.M.; Spivakov, B.Y. Fractionation and characterization of nano- and micro-particles in liquid media. Anal. Bioanal. Chem. 2011, 400, 1787–1804. [Google Scholar] [CrossRef] [PubMed]
  42. Malvern Instruments Limited. Size Exclusion Chromatography/Gel Permeation Chromatography: An Introduction in 30 Minutes; Malvern Instruments Limited: Malvern, UK, 2015; Available online: https://cdn.technologynetworks.com/TN/Resources/PDF/WP150625IntroToSECGPC.pdf (accessed on 4 February 2018).
  43. Preecha, P.; Jettanasen, J. Investigation of functionalized silicon nanoparticles by size exclusion chromatography. Mater. Res. Express 2017, 4, 045007. [Google Scholar] [CrossRef]
  44. Pitkänen, L.; Bustos, A.R.M.; Murphy, K.E.; Winchester, M.R.; Striegel, A.M. Quantitative characterization of gold nanoparticles by size-exclusion and hydrodynamic chromatography, coupled to inductively coupled plasma mass spectrometry and quasi-elastic light scattering. J. Chromatogr. A 2017, 59–67. [Google Scholar] [CrossRef] [PubMed]
  45. French, R.A.; Jacobson, A.R.; Kim, B.; Isley, S.L.; Penn, R.L.; Baveye, P.C. Influence of ionic strength, pH, and cation valence on aggregation kinetics of titanium dioxide nanoparticles. Environ. Sci. Technol. 2009, 43, 1354–1359. [Google Scholar] [CrossRef] [PubMed]
  46. Ikeguchi, Y.; Nakamura, H. Selective enrichment of phospholipids by Titania. Anal. Sci. 2000, 16, 541–543. [Google Scholar] [CrossRef]
  47. Chibowski, E.; Holysz, L.; Terpilowski, K. Influence of ionic surfactants and lecithin on stability of titanium dioxide in aqueous electrolyte solution. Croat. Chem. Acta 2007, 80, 395–403. [Google Scholar]
  48. Byung, G.; Jong, H.; Jin, H.; Kyoung, C. Inorganic-organic nano-hybrid: Preparation of nano-sized TiO2 paste trapped OMC nano-emulsion and its application for cosmetics. J. Soc. Cosmet. Sci. Korea 2004, 30, 181–187. [Google Scholar]
  49. Logeta, G.; Yoo, J.E.; Mazare, A.; Wang, L.; Schmuki, P. Highly controlled coating of biomimetic polydopamine in TiO2 nanotubes. Electrochem. Commun. 2015, 52, 41–44. [Google Scholar] [CrossRef]
  50. Mao, W.X.; Lin, X.J.; Zhang, W.; Chi, Z.X.; Lyu, R.W.; Cao, A.M.; Wan, L.J. Core–shell structured TiO2@polydopamine for highly active visible-light photocatalysis. Chem. Commun. 2016, 52, 7122–7125. [Google Scholar] [CrossRef] [PubMed]
  51. Krüger, S.; Bürmann, L.; Morlock, G.E. Comparison and characterization of soybean and sunflower lecithins used for chocolate production by high-performance thin-layer chromatography with fluorescence detection and electrospray mass spectrometry. J. Agric. Food Chem. 2015. [Google Scholar] [CrossRef] [PubMed]
  52. Vemuri, S.; Rhodes, C.T. Separation of liposomes by a gel filtration chromatographic technique: A preliminary evaluation. Pharm. Acta Helv. 1994, 69, 107–113. [Google Scholar] [CrossRef]
  53. Hara, I.; Kaneko, H.; Kato, A. The critical micelle concentration of phospholipids—Lecithin and lysolecithin. J. Jpn. Oil Chem. Soc. 1960, 9, 407–409. [Google Scholar] [CrossRef]
  54. Parham, H.; Zargar, B.; Rezazadeh, M. Removal, preconcentration and spectrophotometric determination of picric acid in water samples using modified magnetic iron oxide nanoparticles as an efficient adsorbent. Mater. Sci. Eng. C 2012, 32, 2109–2114. [Google Scholar] [CrossRef]
  55. Li, L.; Braiteh, F.S.; Kurzrock, R. Liposome-encapsulated curcumin: In vitro and in vivo effects on proliferation, apoptosis, signaling, and angiogenesis. Cancer 2005, 104, 1322–1331. [Google Scholar] [CrossRef] [PubMed]
  56. Taylor, P.; Xu, C.; Fletcher, P.D.I.; Paunov, V.N. A novel technique for preparation of monodisperse giant liposomes. Chem. Commun. 2003, 14, 1732–1733. [Google Scholar] [CrossRef]
  57. Duke, M.; Zhao, D.; Semiat, R. (Eds.) Functional Nanostructured Materials and Membranes for Water Treatment; Wiley & Sons: Hoboken, NJ, USA, 2013. [Google Scholar]
  58. Saleh, T.A.; Gupta, V.K. (Eds.) Nanomaterial and Polymer Membranes: Synthesis, Characterization, and Applications; Elsevier: Amsterdam, The Netherlands, 2016. [Google Scholar]
  59. Grumezescu, A.M. (Ed.) Water Purification; Academic Press: London, UK, 2017. [Google Scholar]
  60. Zhou, S.; Xu, H.; Gan, W.; Yuan, Q. Graphene quantum dots: Recent progress in preparation and fluorescence sensing applications. RSC Adv. 2016, 6, 110775–110788. [Google Scholar] [CrossRef]
  61. Lai, E.P.C. Carbon, graphene and graphene oxide quantum dots for analytical biochemistry research. Biochem. Anal. Biochem. 2016, 5. [Google Scholar] [CrossRef]
  62. Lai, E.P.C. Graphene quantum dots for bioanalytical sensors and biochemical imaging applications. J. Res. Anal. 2017, 3, 84–90. [Google Scholar]
  63. Chen, C.S.; Yao, J.; Durst, R.A. Liposome encapsulation of fluorescent nanoparticles: Quantum dots and silica nanoparticles. J. Nanopart. Res. 2006, 8, 1033–1038. [Google Scholar] [CrossRef]
  64. Bennett, A. Membrane Technology: Developments in Ultrafiltration Technologies. Filtr. Sep. 2012, 49, 28–33. [Google Scholar] [CrossRef]
  65. Lohwacharin, J.; Takizawa, S. Effects of nanoparticles on the ultrafiltration of surface water. J. Membr. Sci. 2009, 326, 354–362. [Google Scholar] [CrossRef]
Figure 1. Fluorescence excitation spectra using λem = 450 nm: (a) lecithin liposome-encapsulated TiO2 nanoparticles; and (b) lecithin liposome-encapsulated TiO2-PDA nanoparticles. Fluorescence emission spectra using λex = 300 nm: (a’) lecithin liposome-encapsulated TiO2 nanoparticles; and (b’) lecithin liposome-encapsulated TiO2-PDA nanoparticles.
Separations 05 00013 g001aSeparations 05 00013 g001b
Figure 2. Transmission electron microscopy images: (a) TiO2 nanoparticles; and (b) TiO2-PDA nanoparticles.
Separations 05 00013 g002
Figure 3. Standard calibration curve for rapid GFC analysis of lecithin liposome-encapsulated TiO2-PDA nanoparticles, using λex = 365 nm and λem = 460 nm for FD.
Separations 05 00013 g003
Figure 4. Rapid GFC analysis: (a) lecithin liposome-encapsulated TiO2-PDA nanoparticles (1 mg/mL); (b) lecithin liposome-encapsulated PDA nanoparticles; and (c) PDA nanoparticles, using λex = 365 nm and λem = 460 nm for FD.
Separations 05 00013 g004aSeparations 05 00013 g004b
Figure 5. Rapid GFC analysis of (a) lecithin liposome-encapsulated TiO2 nanoparticles (1 mg/mL), using (a) λex = 365 nm and λem = 460 nm; and (b) λex,max = 350 nm and λem,max = 395 nm, for FD.
Separations 05 00013 g005
Figure 6. Standard calibration curves for rapid GFC analysis of lecithin liposome-encapsulated TiO2 nanoparticles using (a) λex = 365 nm and λem = 460 nm; and (b) λex,max = 350 nm and λem,max = 395 nm, for FD.
Separations 05 00013 g006
Figure 7. Effects of flow rate on (a) retention time; (b) retention volume; and (c) peak area of lecithin liposome-encapsulated TiO2 nanoparticles (0.01 mg/mL) in extend GFC analysis, using λex,max = 350 nm and λem,max = 395 nm for FD.
Separations 05 00013 g007aSeparations 05 00013 g007b
Figure 8. Effects of flow rate on (a) retention times; (b) retention volumes; and (c) peak areas of lecithin liposomes and lecithin liposome-encapsulated TiO2 nanoparticles (1.0 mg/mL) in extended GFC-FD analysis, using λex,max = 350 nm and λem,max = 395 nm for FD.
Separations 05 00013 g008aSeparations 05 00013 g008b
Figure 9. Standard calibration curve for extended GFC analysis of lecithin liposome-encapsulated TiO2 nanoparticles at a flow rate of 1 mL/min, using λex,max = 350 nm and λem,max = 395 nm for FD.
Separations 05 00013 g009
Figure 10. Optimization of lecithin liposomes amount added to (a) distilled deionized water; and (b) TiO2 nanoparticles (1.0 mg/mL), in extended GFC analysis using λex,max = 350 nm and λem,max = 395 nm for FD.
Separations 05 00013 g010
Figure 11. Extended GFC analysis: (a) lecithin liposome-encapsulated ZnO nanoparticles (1.0 mg/mL); (b) ZnO nanoparticles (1.0 mg/mL); and (c) lecithin liposomes, using λex = 350 nm and λem = 395 nm for FD.
Separations 05 00013 g011
Figure 12. Standard calibration curve for extended GFC analysis of lecithin liposome-bound ZnO nanoparticles at a flow rate of 1 mL/min, using λex = 350 nm and λem = 395 nm for FD.
Separations 05 00013 g012
Figure 13. Extended GFC analysis: (a) GQDs; and (b) GQDs with lecithin liposome-encapsulated TiO2 nanoparticles (1.0 mg/mL), using λex,max = 350 nm and λem,max = 395 nm for FD.
Separations 05 00013 g013

