Review

Size Separation Techniques for the Characterisation of Cross-Linked Casein: A Review of Methods and Their Applications

1
Chair of Food Engineering, Institute of Natural Materials Technology, Technische Universität Dresden, 01062 Dresden, Germany
2
Polymer Separation Group, Department of Analytics, Leibniz-Institut für Polymerforschung Dresden e.V., Hohe Straße 6, 01069 Dresden, Germany
3
Faculty of Mathematics and Science, Technische Universität Dresden, 01062 Dresden, Germany
*
Author to whom correspondence should be addressed.
Separations 2018, 5(1), 14; https://doi.org/10.3390/separations5010014
Submission received: 8 November 2017 / Revised: 2 February 2018 / Accepted: 8 February 2018 / Published: 12 February 2018
(This article belongs to the Special Issue Size Separation Techniques)

Abstract

:
Casein is the major protein fraction in milk, and its cross-linking has been a topic of scientific interest for many years. Enzymatic cross-linking has huge potential to modify relevant techno-functional properties of casein, whereas non-enzymatic cross-linking occurs naturally during the storage and processing of milk and dairy products. Two size separation techniques were applied for characterisation of these reactions: gel electrophoresis and size exclusion chromatography. This review summarises their separation principles and discusses the outcome of studies on cross-linked casein from the last ~20 years. Both methods, however, show limitations concerning separation range and are applied mainly under denaturing and reducing conditions. In contrast, field flow fractionation has a broad separation range and can be easily applied under native conditions. Although this method has become a powerful tool in polymer and nanoparticle analysis and was used in few studies on casein micelles, it has not yet been applied to investigate cross-linked casein. Finally, the principles and requirements for absolute molar mass determination are reviewed, which will be of increased interest in the future since suitable calibration substances for casein polymers are scarce.

1. Introduction

Casein is a group of non-globular phosphoproteins originating from mammalian milk with four main types (αS1, αS2, β, κ) that differ in amino acid composition and thus in molar mass, hydrophobicity and charge (Table 1). Additionally, αS1-, αS2- and β-casein are highly sensitive to calcium because of their numerous phosphorylated serine residues [1,2]. In milk, up to ~5000 casein molecules are associated to supramolecular aggregates, traditionally called casein micelles, which show an average diameter of ~200 nm. They are stabilised by strong electrostatic interactions, with colloidal calcium phosphate nanoclusters (~2 nm in radius) and weaker non-covalent interactions between the caseins [3,4,5]. The colloidal stability of casein micelles in aqueous systems is ensured by steric repulsion of the so-called “hairy layer”, which corresponds to the glycosylated, hydrophilic C-termini of κ-casein located on the micelle surface [6,7,8]. A schematic illustration of the casein micelle structure, as suggested by Dalgleish [3], is shown in Figure 1. In spite of decades of research, structure of casein micelles and type of interactions between caseins are still a topic of controversial discussion (e.g., [9,10,11] vs. [12,13]. Furthermore, the term casein “micelle” is a rather historical one and gives rise to debates about its appropriateness to describe the structure of these aggregates (e.g., [5,14,15] vs. [16]).
Through intake of milk, casein micelles provide newborns with, among others, protein, calcium and phosphorus. The unique structural features of casein micelles are also of significant importance for the manufacture of fermented dairy products. For instance, addition of rennet, a proteolytic enzyme naturally occurring in the fourth stomach of calves, leads to the removal of the “hairy layer” and thus in the loss of colloidal stability of casein micelles. The resulting aggregation and subsequent gel formation is an essential step in the production of most cheese varieties [6,18]. Similarly, acidification of milk through partial fermentation of lactose to lactic acid by lactic acid bacteria causes a release of colloidal calcium phosphate and thus partial dissociation of casein molecules, which reassociate with the residual micelles to form acid gels at the isoelectric point (pH ~ 4.6) [14,19]. Furthermore, isoelectric precipitation of caseins and subsequent neutralisation with alkali yields caseinates [20], which can be used as techno-functional food additives and serve as model substrate for gelation experiments.
During the recent years, enzymatic and non-enzymatic cross-linking of casein and caseinates has been extensively studied as a possibility to modify their techno-functional properties such as emulsification, foaming or gel formation. In many cases, the results were linked to the size of the generated casein oligomers and polymers, but size determination by separation techniques is still challenging, mainly because of insufficient resolution and the unavailability of suitable standard substances for molar mass determination. In this review we provide an overview on prominent cross-linking reactions (Section 2), followed by a discussion of two size separation techniques that are commonly applied for the characterisation of cross-linked casein: gel electrophoresis (Section 3) and size exclusion chromatography (Section 4). This includes descriptions of the separation principles as well as the advantages and limitations in the context of casein studies. Finally, we elaborate the potential of field flow fractionation, which has not yet been applied to investigate cross-linked casein (Section 5), and summarise the principles of and requirements for absolute molar mass determination (Section 6). The paper offers a profound state-of-the-art review of the analysis of casein polymers and may encourage rethinking and improvement of some common practices.

2. Enzymatic and Non-Enzymatic Cross-Linking Reactions

2.1. Cross-Linking Enzymes

Transglutaminase (TGase; EC 2.3.2.13) is the most common enzyme used for protein cross-linking. It catalyses acyl transfer reactions between the γ-carboxamide group of glutamine and primary amines such as ε-amino groups of lysine, and intermolecular reactions between protein-bound glutamine and lysine residues therefore result in protein polymerisation (Figure 2). The economically feasible production of a calcium-independent TGase from microbial origin together with its mild reaction optima (pH ~ 6–7, ~ 40–50 °C) led to increased utilisation in the food industry [21,22]. The reaction mechanisms and possible applications in dairy products and other protein-based foods were extensively reviewed in the past, e.g., [22,23,24,25,26,27,28]. Besides the characterisation of the polymers, the number of cross-links formed by TGase can also be determined. Peptide bonds between terminal functional groups, referred to as isopeptide bonds, are not susceptible to most proteolytic enzymes and remain therefore intact after total enzymatic protein hydrolysis; subsequent amino acid analysis by chromatographic techniques enables the determination of the N-ε-(γ-glutamyl)-lysine isopeptide [29]. Although the isopeptide content was shown to be an important driver for the stiffness of acid-induced casein gels, polymer size still has to be taken into account [30,31,32].
Besides TGase, oxidoreductases were applied, which have a completely different cross-linking mechanism: firstly, the enzymes oxidise specific functional groups that react further in non-enzymatic reactions. This leads to a variety of covalent bonds so that the total number of cross-links can hardly be determined by amino acid analysis [23]. Monogioudi et al. [33] applied 31P nuclear magnetic resonance spectroscopy after phosphorylation of hydroxyl groups to quantify cross-links formed in β-casein after oxidation of tyrosine residues by tyrosinase (EC 1.14.18.1). Recently, cross-linking with laccase (EC 1.10.3.2) was tested for its potential to improve the structure of stirred yoghurt gels in a post-fermentation step because of the acidic pH optimum of the enzyme. The catalysed oxidation of phenolic amino acid residues, however, resulted in very reactive radicals, which also caused protein degradation [34,35,36].

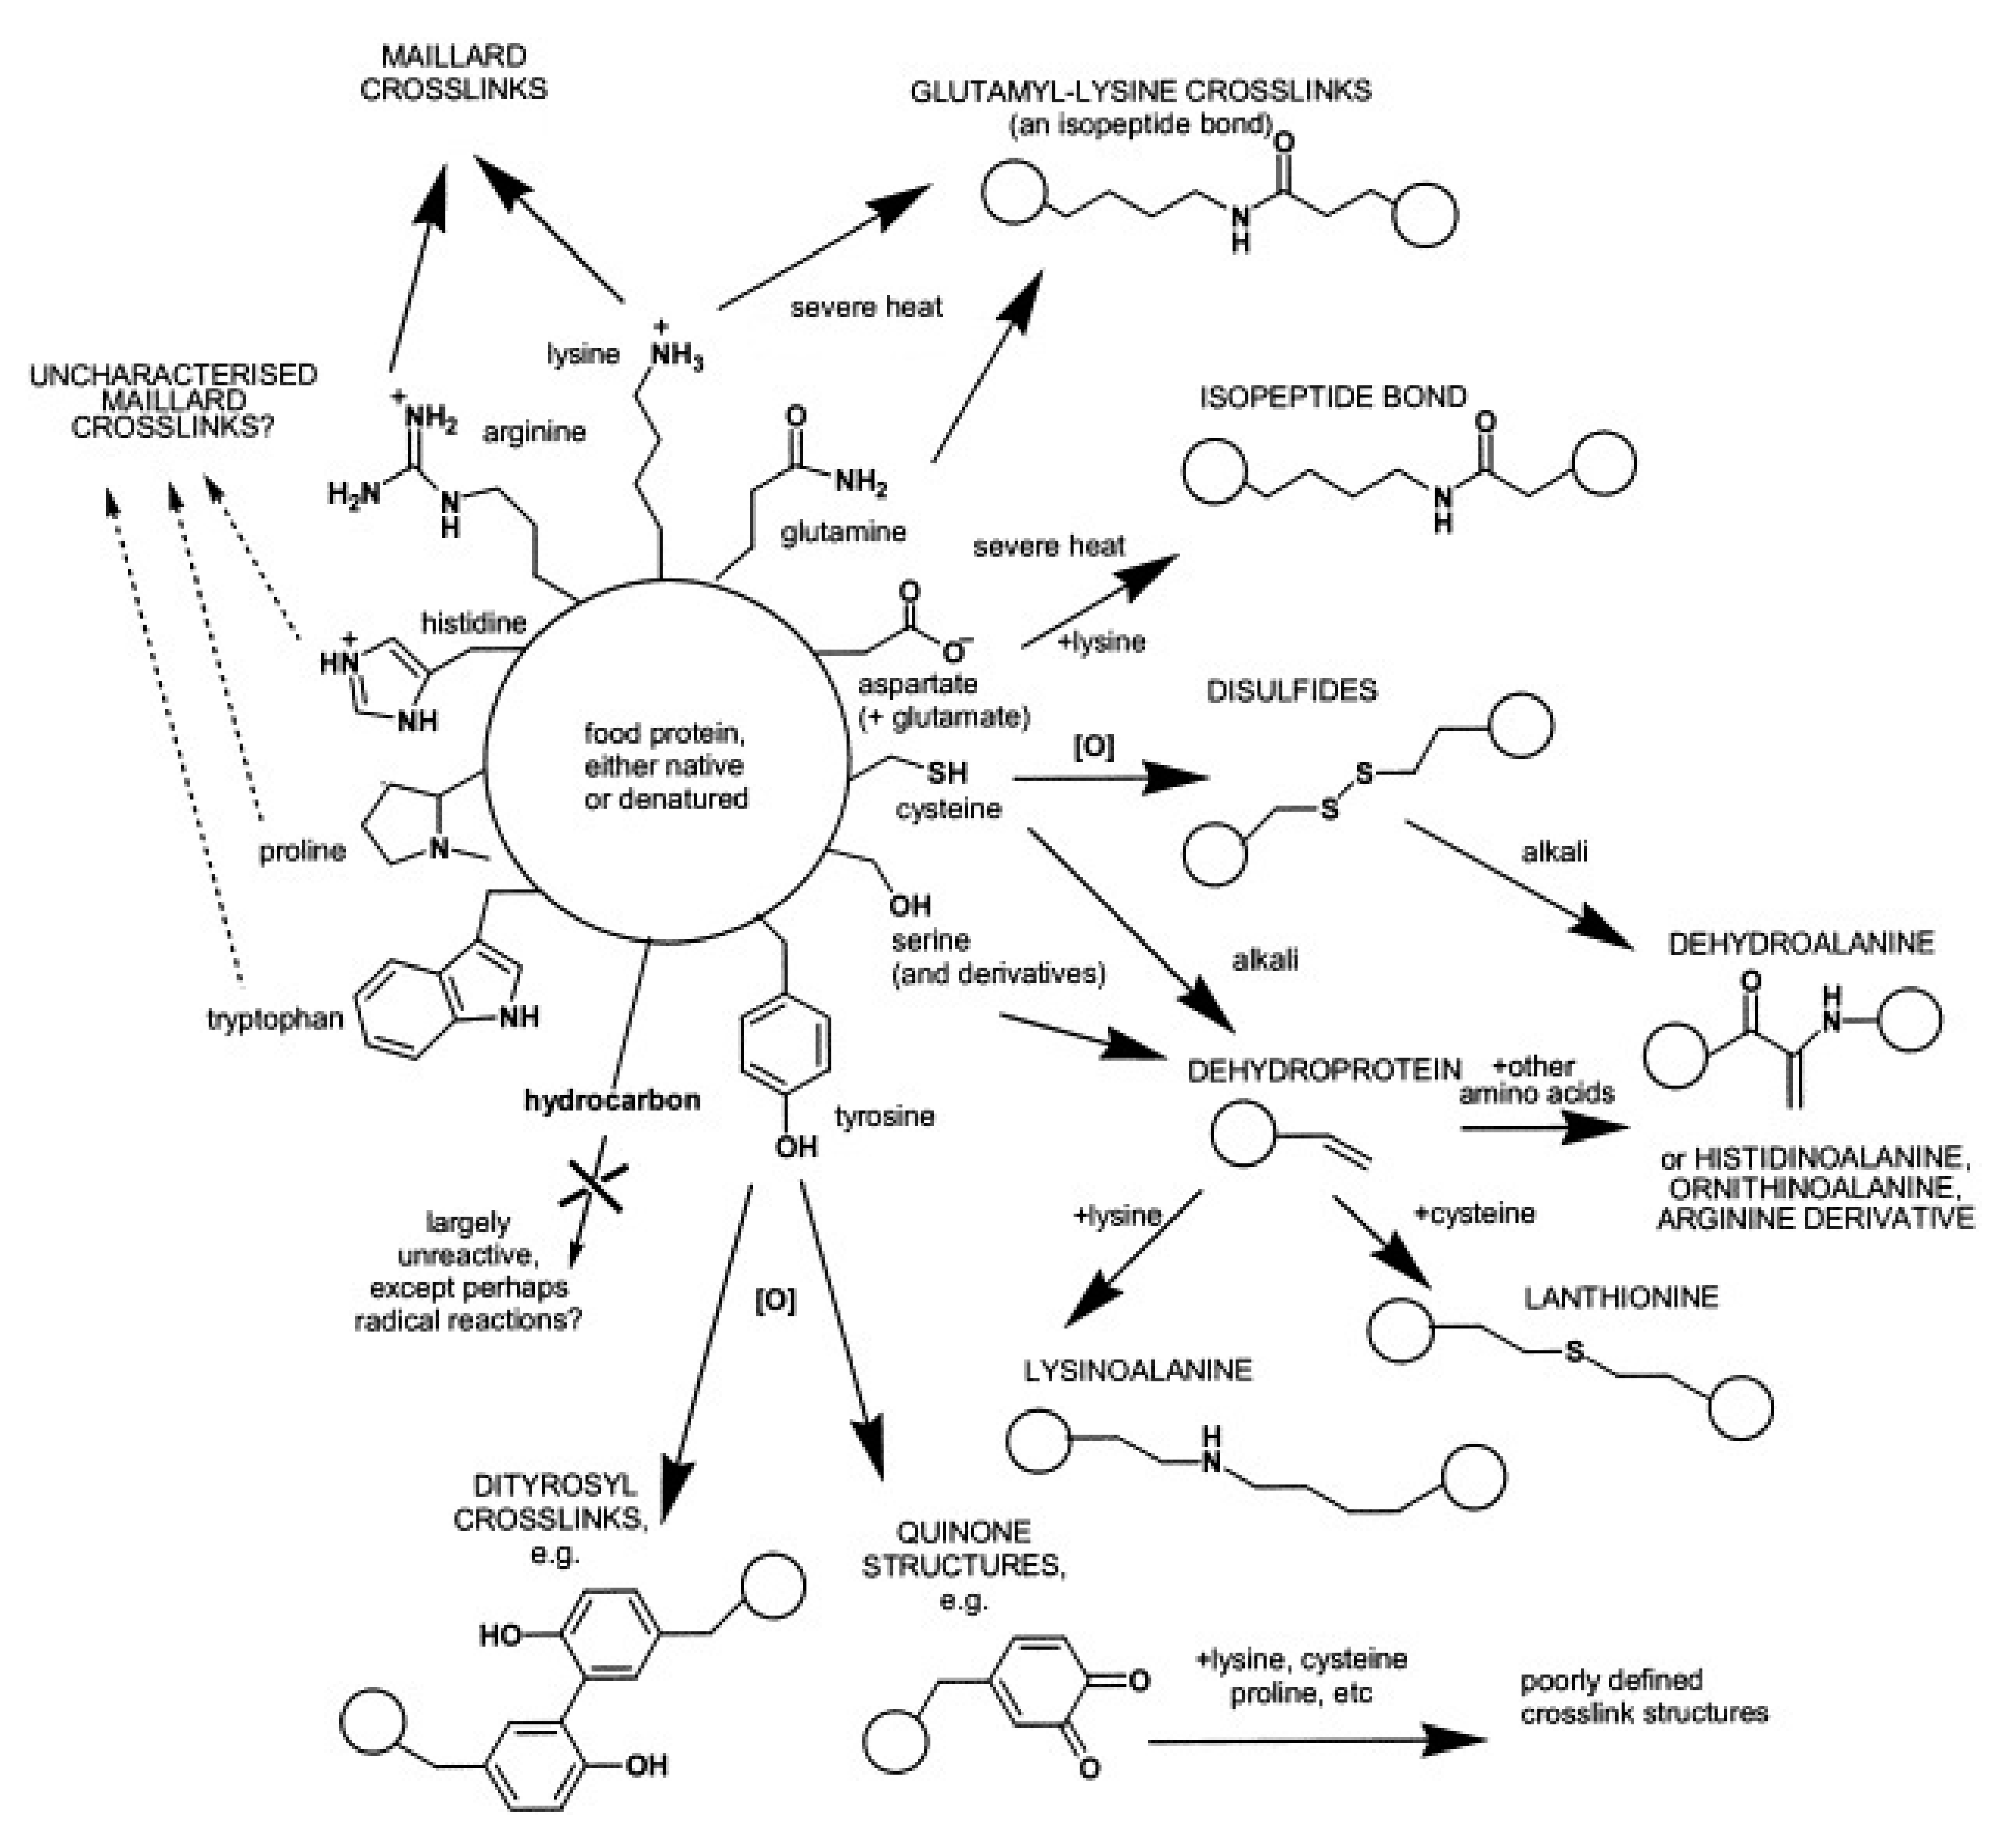
2.2. Non-Enzymatic Cross-Linking

Causes for non-enzymatic protein cross-linking are numerous (Figure 3). One of the most prominent examples is the Maillard reaction [37], which occurs naturally during storage and/or heat treatment of foods. Starting with a condensation of carbonyl groups of reducing carbohydrates such as glucose or lactose with protein-bound amino groups, especially ε-amino groups of lysine, a complex reaction sequence takes place and results in a broad variety of reaction products and eventually in protein cross-linking. The chemistry of the reaction products and the mechanisms of their formation are still not fully explored. Nevertheless, the Maillard reaction, also referred to as glycation, and its possible application in food manufacturing were extensively reviewed in recent years, e.g., [23,38,39,40,41].
Certain conditions during food processing can facilitate the formation of protein cross-links even in the absence of carbohydrates. Alkaline treatment, especially in combination with heating, transforms particular amino acid residues into reactive intermediates, which form cross-links by reactions with other functional groups. Typical products are lysinoalanine, histidinoalanine and lanthionine, which can be determined by chromatographic techniques, e.g., [43,44,45,46,47,48]. Severe heat treatment may even induce the formation of isopeptide bonds between lysine and glutamine (N-ε-(γ-glutamyl)-lysine) or asparagine (N-ε-(β-aspartyl)-lysine), however, these reactions are competed by the Maillard reaction and therefore restricted in the presence of reducing carbohydrates [23,42,49,50].
Another important type of (mainly) non-enzymatically induced protein cross-links are disulphide bonds, which result from oxidative coupling of cysteine residues. They contribute essentially to the three-dimensional structure of protein molecules but are also formed from free thiol groups as well as in disulphide exchange reactions as a consequence of heat treatment or mechanical stress [23,42,50]. In contrast to other cross-links, disulphide bonds can be easily cleaved in redox reactions with reducing agents such as dithiothreitol or β-mercaptoethanol. The extent of intermolecular cross-linking can therefore be estimated by comparing reduced and unreduced samples using size separation techniques [51,52,53,54].
Instead of using carbohydrates to induce Maillard-type cross-linking reactions, chemical cross-linkers with more than one reactive group can be applied [23]. Recently, genipin, methylglyoxal, glyoxal, glutaraldehyde and glyceraldehyde were shown to cross-link casein by reactions with amino groups from lysine or arginine residues [45,55,56,57,58,59,60], but application in food production is often restricted because of the toxicity of some of the reagents.

3. Gel Electrophoresis and Capillary Electrophoresis

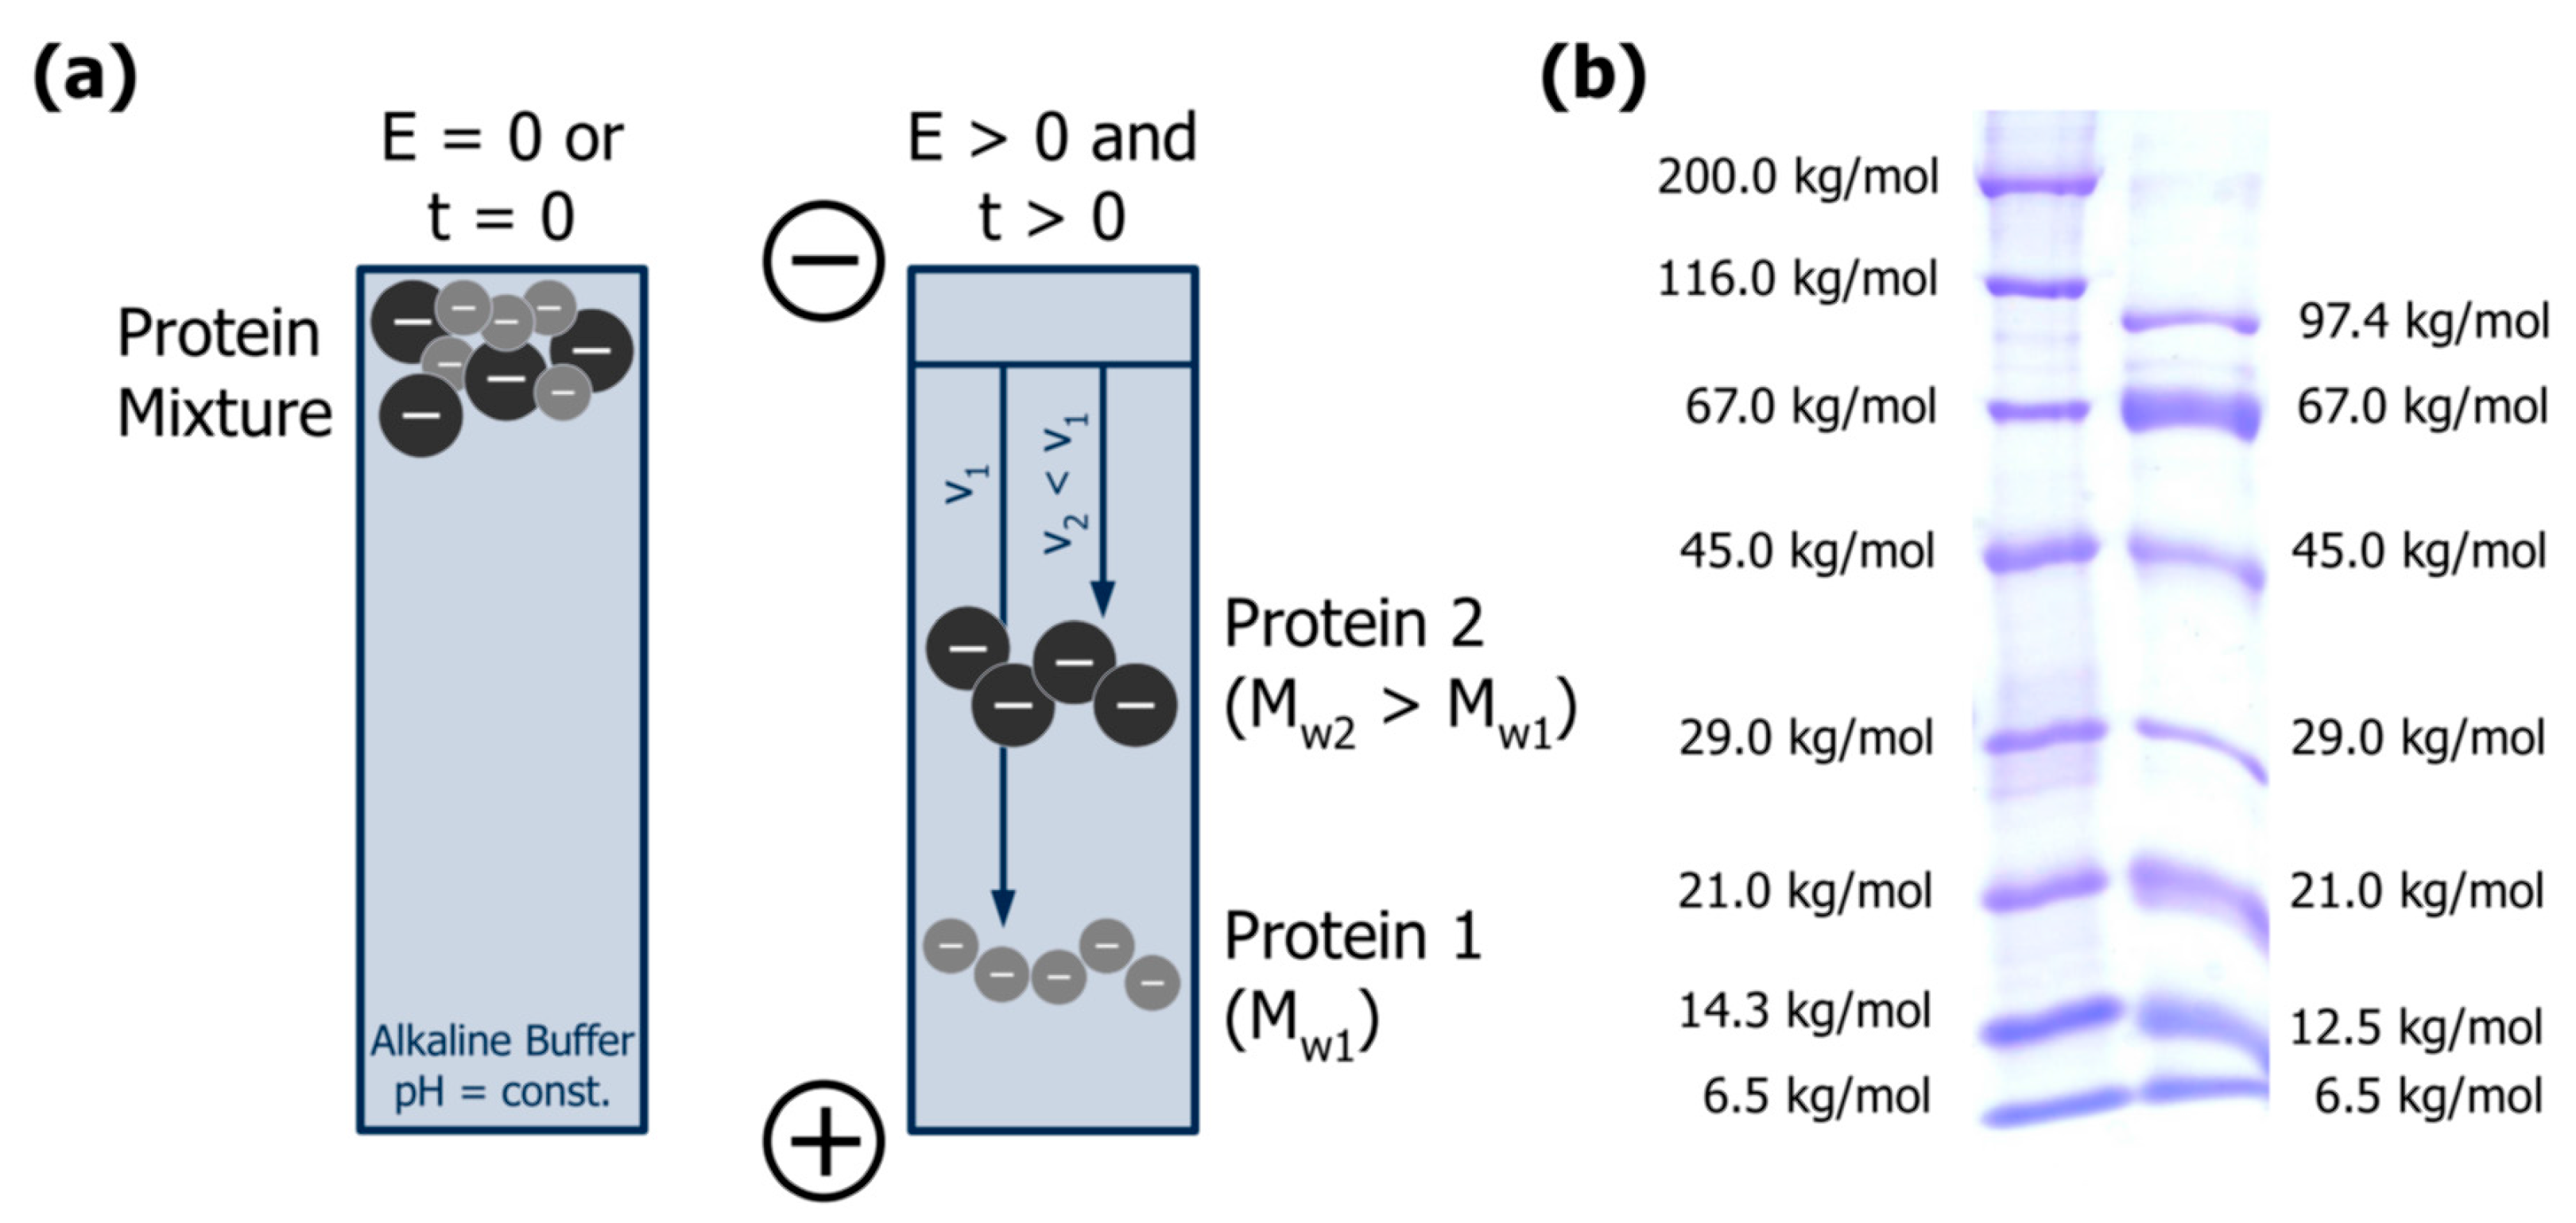
3.1. Separation Principle

Electrophoresis is the terminus for the directed movement of charged analytes in an electric field. The driving force of the migration results from the product of net charge and field strength and is counteracted by friction forces, which depend on the resistance of the surrounding medium against the movement, but also on the size of the analytes. Thus the separation in a particular matrix is related to charge and size, usually expressed as “electrophoretic mobility” of an analyte. The application of polymeric gel networks, referred to as gel electrophoresis (Figure 4a), facilitates the fixation of the analytes subsequent to the separation and is therefore the most common electrophoretic technique in protein analysis. Visualisation of the protein fractions is most frequently achieved by staining with Coomassie brilliant blue, silver, or fluorescent dyes. Presuming that all proteins in the sample bind the dye equally, software-aided densitometric evaluation enables semi-quantitative analysis [61,62]. A profound overview on principles and practical realisations of gel electrophoresis is provided by Westermeier [61] so that only the most important aspects are summarised here.
Gel electrophoresis is usually carried out using polyacrylamide gels, whereas agarose gels are only applied for proteins with high molar mass (>800 kg/mol). Polyacrylamide gels result from a chemical copolymerisation of acrylamide monomers with N,N′-methylenebisacrylamide as a cross-linker, initiated by free radicals formed from ammonium persulphate in the presence of tertiary amines (e.g., N,N,N′,N′-tetramethylethylenediamine). The pore size of the gel decreases with increasing acrylamide concentration and influences the retardation of the analytes during separation. Polyacrylamide gels are mainly applied as vertical slab gels with a thickness of ~1 mm, and are usually discontinuous: a stacking gel with large pore size is placed on top of the actual separating gel, facilitating the transition of analytes from solution into the gel matrix and the subsequent introduction into the separating gel. The gel buffer is usually alkaline so that the proteins exhibit a constant negative net charge and migrate towards the anode. Additionally, it may contain dissociating agents such as urea or sodium dodecyl sulphate (SDS) to suppress non-covalent interactions as they are present in casein micelles, and disulphide bonds may be cleaved by adding reducing agents such as dithiothreitol or β-mercaptoethanol. The upper and lower edges of the gel have to be in direct contact to the electrode buffer whose ionic compounds migrate in the electric field to transport electric current [61,62].
In capillary electrophoresis, analytes are separated during transportation along a buffer-filled or gel-containing capillary column from anode to cathode. Such capillaries usually consist of coated or uncoated silica and have inner diameters of 25–75 µm, and detection via UV/Vis or fluorescence spectroscopy at the outlet is possible for quantitative analysis. Capillary electrophoresis is more resistant to higher voltages and thus requires a shorter analysis time than conventional slab gel electrophoresis; however, the equipment is more cost-intensive [62].
Sodium dodecyl sulphate polyacrylamide gel electrophoresis (SDS-PAGE) is the most common electrophoretic practice in protein analysis, and most protocols applied today are based on the method initially presented by Laemmli [63]. SDS is a strong anionic detergent that denatures proteins by cleaving hydrogen bonds and disintegrating their secondary and tertiary structure [61]. In addition, the hydrophobic tail interacts with hydrophobic protein regions to form local micelle-like structures, resulting in a necklace-like protein-SDS complex [64] (Figure 5). SDS is added in surplus, masking the net charge of the proteins and resulting in a constant charge per mass unit since up to 1.4 mg can bind per mg of protein. Therefore, the electrophoretic mobility of protein-SDS complexes and thus their migration velocities in the electric field depend only on their size [61,62]. Figure 4b exemplarily depicts the separation of two globular protein mixtures by SDS-PAGE.
In urea polyacrylamide gel electrophoresis (urea-PAGE), urea is used as dissociating agent in the gel buffer instead of SDS. Therefore, proteins keep their original net charge, which additionally contributes to their electrophoretic mobility and thus to the separation process. This technique may be applied to separate proteins with similar molar mass but different charge, as it is the case for casein monomers and their proteolysis products [62].
In isoelectric focusing, proteins are separated in an electric field according to their isoelectric points. For that, pH gradients are introduced into the polyacrylamide network, which cause a decrease of protein charge during their migration through the gel. When an analyte reaches the region with a pH corresponding to its isoelectric point, the electrophoretic mobility will be zero and the analyte will stop migrating towards the electrode. In general, very low acrylamide concentrations are used to obtain a high pore size and an unhindered migration. pH gradients can be adjusted by adding carrier ampholytes with different isoelectric points that migrate towards the respective electrodes in a pre-electrophoresis step, or by binding charged groups to the polyacrylamide matrix (referred to as immobilised pH gradient [65]) [66].
Isoelectric focusing is most powerful when coupled with SDS-PAGE. This is the most common variety of two-dimensional gel electrophoresis and an important element of protein mapping or “proteomics”, which aims at separating and identifying 100–1000 proteins in complex mixtures [67]. Figure 6 depicts the principle procedure: first, isoelectric focusing of the sample is performed on a gel strip or rod, which is subsequently equilibrated in SDS buffer and placed on the top of a polyacrylamide slab gel. Secondly, SDS-PAGE according to Laemmli [63] is run to achieve size separation. The original method as developed by the group of O’Farrell [68,69] was based on isoelectric focusing in a mobile pH gradient adjusted by carrier ampholytes. Today, immobilised pH gradients are more common since they facilitate a higher reproducibility of this multi-step procedure, especially between different laboratories [70,71]. After staining, selected spots may be digested by trypsin, and extracted peptides can be analysed by mass spectrometry for determination of their amino acid sequence. Finally, identification of the protein fraction can be achieved by matching with databases [67].
Although the number of “main” milk proteins is limited, the milk proteome is highly complex. This is due to genetic variants, post-translational modifications (e.g., phosphorylation, glycosylation, proteolysis, cross-linking), and the presence of less abundant proteins [72], of which the globular whey proteins α-lactalbumin (~14 kg/mol), β-lactoglobulin (~18 kg/mol), and serum albumin (~66 kg/mol) represent the largest fractions [1]. Recent review papers on proteomics of milk proteins underline the potential of two-dimensional gel electrophoresis for detection of post-translational modifications of milk proteins during storage or processing, as well as to differences between species and effects of animal sicknesses and lactation period on milk protein composition [72,73,74].

3.2. Advantages and Limitations in the Context of Casein Investigation

The major advantage of gel electrophoresis over other separation techniques is that monomers of individual casein types can be discriminated despite similar molar mass (19–25 kg/mol). This is especially true for urea-PAGE, which also exploits charge differences for separation (see also [62,75,76]), but also in the case of SDS-PAGE, where whey proteins are also clearly separated from caseins [36,62,77,78]. Therefore, susceptibility of different casein types to particular cross-linking reactions can be easily estimated. Purified casein standards should be used for correct band identification rather than molar mass markers because the electrophoretic mobility of caseins in SDS-PAGE is lower than expected from their molar mass [79]. The migration velocities follow the order αS2-casein < αS1-casein < β-casein < κ-casein; however, αS2-casein is not always clearly separated so that αS-caseins are often evaluated as one band (Figure 7; see also [80,81] for casein standards). The fact that αS1-casein migrates slower than β-casein despite its lower molar mass (see Table 1) was ascribed to a larger hydrodynamic volume of αS1-casein-SDS-complexes at alkaline pH [79]. When compared to molar mass markers, ~29 kg/mol would be obtained for monomeric β-casein (Figure 7a), which is ~20% higher than the actual value (~24 kg/mol). Similar results were reported by Liu & Damodoran [82], who also showed that dimers, trimers, and tetramers of β-casein migrate like globular proteins with molar mass of ~72, ~110, and ~150 kg/mol, respectively, manifesting that molar mass markers are not suitable for correct assessment of casein polymers. In contrast to that, molar mass evaluation by SDS-PAGE worked well for cross-linked whey proteins [83,84,85,86,87]. Different polymeric fractions of casein homopolymers may be visually distinguishable to some extent (Figure 7b; see also [82,88]). Cross-linking of mixed systems such as casein micelles or caseinates, however, results in a number of heteropolymers with a broad range of molar mass. For instance, casein trimers can vary from ~57 to ~75 kg/mol, and tetramers from ~76 to ~100 kg/mol, depending on the types of casein cross-linked (see Table 1). As can be seen from Figure 7b, κ-casein homopolymers show higher electrophoretic mobility than respective β-casein homopolymers. Corresponding bands may also be identified in mixed system, but overall resolution is rather poor because the variety of heteropolymers causes a pronounced smear. Furthermore, very large polymers cannot penetrate the separating or stacking gel and remain as condensed stains at the top (Figure 7a,b; see also [89,90,91], which may even result in a loss of sample material [92,93]. The separation limit can be slightly expanded by decreasing the pore size of the gel matrix (reduction of acrylamide concentration) or by using a gradient gel (compare Figure 7a,b), but a thorough analysis of high molar mass casein polymers by SDS-PAGE is not possible since even low acrylamide concentrations of typical stacking gels (40 mg/mL) can hardly be reduced without limiting practicability. Therefore, gel electrophoresis is an easy but rather qualitative method to evaluate casein cross-linking.

3.3. Literature Review of Studies on Cross-Linked Casein

Owing to the limited possibility for quantitative analysis and molar mass evaluation, gel electrophoresis is rather applied as a rapid assay to verify that polymerisation did occur. In fact, Ikura et al. [95] were one of the first using SDS-PAGE to monitor enzymatic casein polymerisation, followed by numerous further studies. For raw milk it was shown that cross-linking with TGase was prevented presumably by an indigenous inhibitor [77,96,97]; however, other authors achieved casein cross-linking in raw milk [78]. Using SDS-PAGE, the cross-linking potential of laccase preparations from different microbial origins [98] as well as the suitability of different reaction-mediating additives [99] were evaluated for application in milk gels. The necessity of mediators such as ferulic acid to facilitate casein cross-linking by laccase was also reported in other studies [85,100]. Dinnella et al. [101] showed that casein polymerisation by TGase is limited in the presence of N-carbobenzoxy-glutaminyl-glycine (Z-Gln-Gly) because of the enzyme’s higher affinity for the low molecular weight γ-glutamyl donor. Additionally, possible side reactions such as protein degradation were identified by fractions smaller than the monomers, e.g., [35,98,100].
As concerns non-enzymatic cross-linking, SDS-PAGE was applied to discriminate Maillard-type cross-linking from other reactions taking place during heat treatment of milk proteins. For instance, Al-Saadi et al. [46] compared the formation of non-enzymatic cross-links in milk protein samples during heat treatment at 95 °C in the presence or absence of lactose. They observed considerable polymerisation in both cases, but cross-linking was more pronounced in the presence of lactose, indicating a strong impact of the Maillaird reaction in addition to dehydroalanine-derived cross-links such as lysinoalanine. This is supported by Le et al. [58] who used purified αS1-casein as simplified substrate for similar experiments and further investigations. These authors concluded from defined cross-linking with methylglyoxal that rather advanced Maillard reaction products than dehydroalanine formation are responsible for cross-linking in the presence of lactose.
Since different casein types are usually well resolved, susceptibility of αS-, β- and κ-casein to distinct cross-linking reactions can be evaluated by SDS-PAGE. It should, however, be recommended to use purified casein standards rather than molar mass markers to ensure correct band identification. For instance, Tang et al. [89] studied the susceptibility of non-micellar sodium caseinate to TGase, but the determined order of κ-casein > αS-casein > β-casein might rather be a result of false band assignments. In spite of studies that have shown an order of β-casein > αS-casein > κ-casein, e.g., [77,78,80], this information is still cited in the literature, e.g., [27,102]. On the other hand, it is generally acknowledged that κ-casein is most susceptible to TGase in case of micellar casein because of high accessibility on the micelle surface, e.g., [78,92,103,104,105,106,107,108]. This was also shown for cross-linking with laccase [35,98,99]. In this context, Moon et al. [93] found that micelle associated β-casein becomes increasingly susceptible to TGase when its mobility is increased by raising the pH of milk from ~6.7 to ~7.5–9.0.
Likewise, capillary electrophoresis was applied for separation of the different casein types and their genetic variants, and to study casein cross-linking via the decrease of the respective peak intensities [103,109,110,111]. In these studies SDS was not used, resulting in overlapping peaks and poor resolution of the electrophoretic patterns with ongoing cross-linking because separation was not according to size. Application of SDS-containing buffers for other proteins showed satisfactory size separation [112], making capillary electrophoresis suitable also for cross-linked casein.
To verify the occurrence of heteropolymers consisting of different casein types, Lilla et al. [113] applied a combination of SDS-PAGE and immunoblotting, and a similar approach was carried out by Lauber et al. [88] to show that TGase is able to cross-link β-casein with β-lactoglobulin during high pressure treatment. Furthermore, glycoprotein staining according to Zacharius et al. [114] was applied to visualise the binding of carbohydrates to casein polymers [115,116,117,118].
Few studies focused on casein cross-linking by TGase at interfaces. Partanen et al. [119] demonstrated by SDS-PAGE of foamed sodium caseinate that casein polymers are formed at the air/water interface during incubation. Macierzanka et al. [80] assessed cross-linking kinetics of sodium caseinate before and after emulsification and found that cross-linking, especially of αS1-casein, is delayed at the oil/water interface. Furthermore, Partanen et al. [120] concluded from the appearance of a fraction with increased electrophoretic mobility that, in addition to polymerisation of β-casein molecules, intramolecular isopeptide bonds were formed within molecules which were adsorbed as monolayers at oil/water or air/water interfaces. Similar to these studies, casein gels were analysed by SDS-PAGE when enzymatic cross-linking was conducted simultaneously to [121,122] or after acid-induced gelation [35,36,99,100]. The probably most remarkable finding from such approaches is the increased susceptibility of κ-casein in sodium caseinate to TGase at acidic pH [122].
Two-dimensional gel electrophoresis combining isoelectric focusing and SDS-PAGE was applied to investigate non-enzymatic cross-linking in dairy products. For instance, Chevalier et al. [123] studied the occurrence of disulphide bonds in raw and heated milk. Under reducing conditions (i.e., addition of dithiothreitol), raw milk was separated into monomeric fractions of caseins and whey proteins with only small amounts of degradation products. In contrast, more than 20 additional spots appeared under non-reducing conditions, indicating a number of different polymers formed through disulphide cross-linking of mainly αS2-casein, κ-casein, and β-lactoglobulin. Additionally, a high molar mass fraction appeared even under reducing conditions after heat treatment at 90 °C for 30 min, which was assigned to a trimer composed of αS1-, αS2-, and κ-casein formed as a result of non-disulphide cross-linking. This roughly corresponds to the findings of Holland et al. [124] who, however, observed the formation of non-disulphide cross-links between αS1-, αS2-, and β-casein during storage of heat treated milk and attributed this to lysinoalanine formation. In the study of Le et al. [125], polymer formation during storage of milk protein powders was correlated with the formation of particular Maillard reaction products. They also found that high molecular weight polymers mainly consist of αS1-casein and only smaller amounts of αS2-, β-, and κ-casein [58].
Cross-linking of milk proteins by TGase was analysed via two-dimensional gel electrophoresis by Hsieh & Pan [126] and Chen & Hsieh [127]. In contrast to the aforementioned studies on non-enzymatic cross-linking, almost no polymeric components were visible on the gels. Since casein polymers formed by TGase are often reported to be too large to enter SDS-PAGE stacking gels, it might be possible that the polymers were lost during isoelectric focusing. Nevertheless, susceptibility of different isomers of individual casein types to TGase can be assessed from the disappearance of monomeric fractions with ongoing incubation. Hsieh & Pan [126] therefore observed that the monoglycosylated form of κ-casein is a better substrate for TGase than the triglycosylated form.

4. Size Exclusion Chromatography

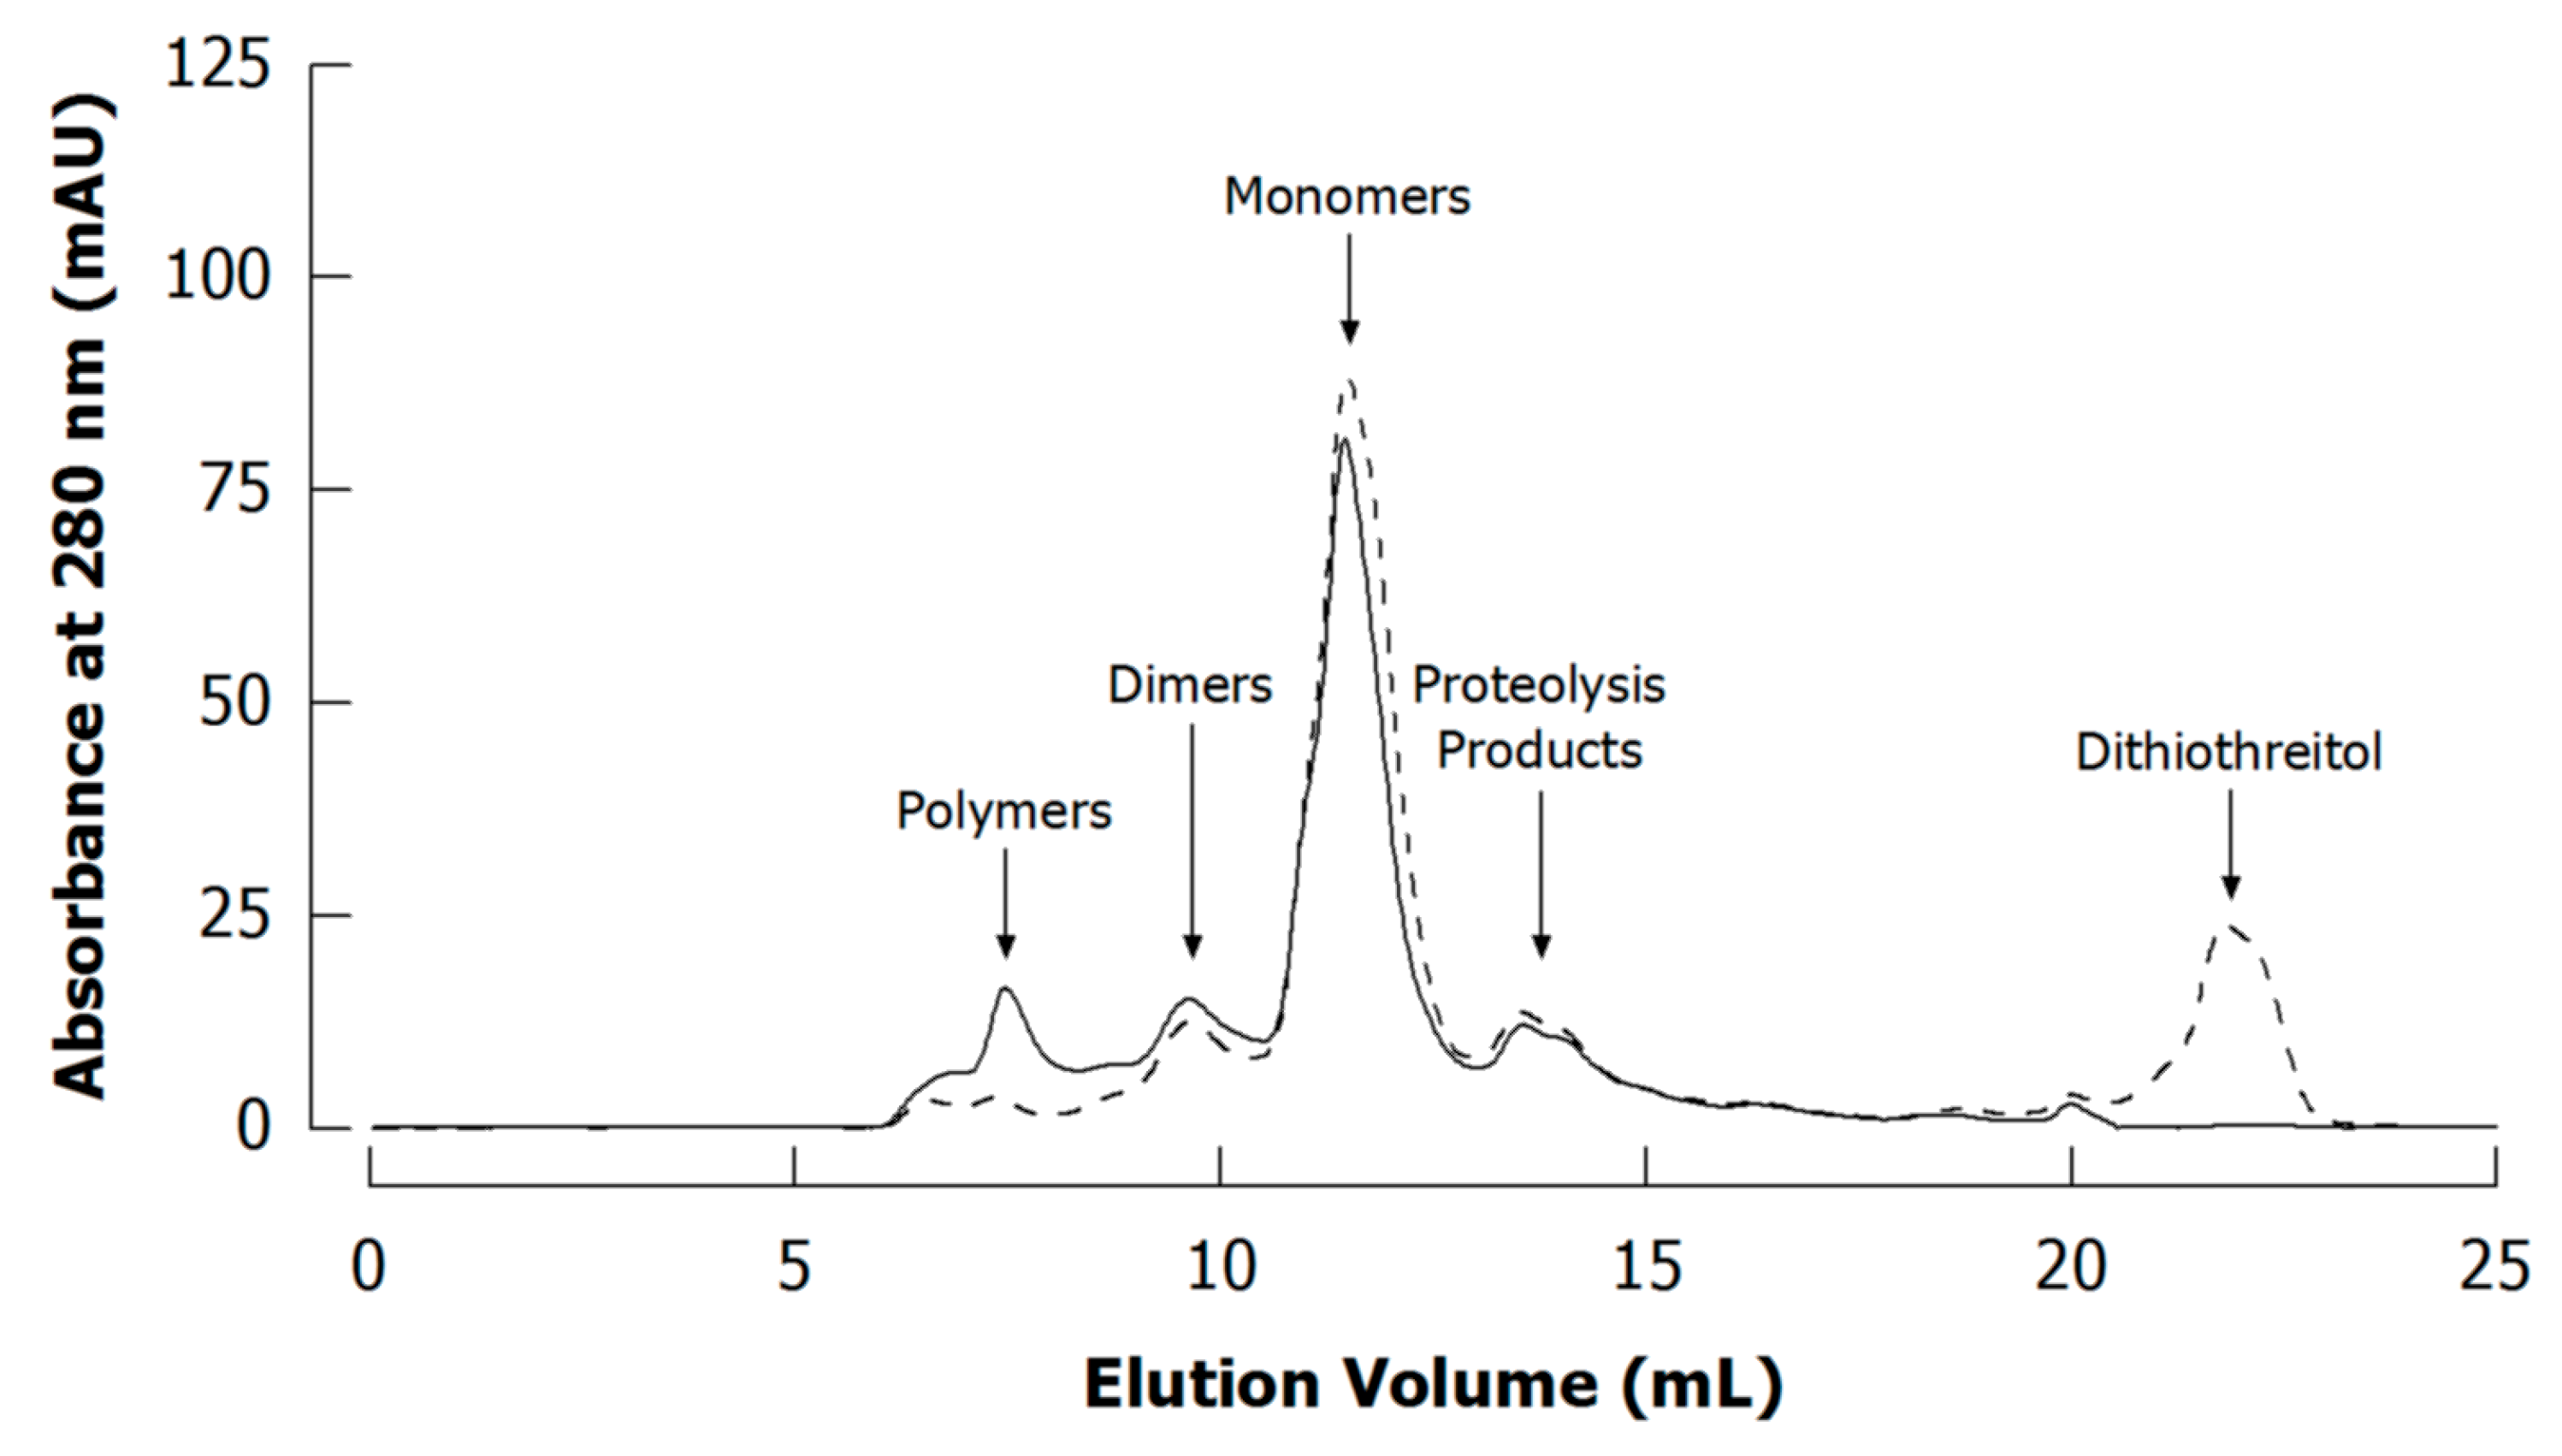
4.1. Separation Principle

Size exclusion chromatography (SEC; sometimes referred to as gel permeation chromatography or gel filtration) is a column-based liquid chromatography technique that allows the separation of macromolecules according to their hydrodynamic size. SEC columns are packed with porous polymer beads, and concentration gradients between inside and outside of the beads force molecules to diffuse into the pores and out again during their transportation through the column in liquid buffers. Smaller molecules can access a higher number of pores and are therefore retained longer in the column whereas larger molecules can only penetrate larger pores and elute earlier (Figure 8). Molecules larger than the pores cannot be separated and will elute in the so called void volume. Eluted fractions are detected mainly by concentration sensitive detectors (e.g., UV/Vis or refractive index) and a linear relationship persists between elution volume and logarithm of the hydrodynamic size [128,129]. Therefore, calibration of SEC with molar mass standards is possible for analytes with similar structure (e.g., globular proteins), whereas molar mass of macromolecules with other structure (e.g., linear, branched) may be over- or underestimated because of a deviating elution behaviour. If suitable calibration substances are not available, absolute molar mass determination using online light scattering detectors may be helpful [130].
In case of proteins, denaturing elution buffers are applied to unfold protein structure, suppress non-covalent aggregation, and avoid interactions with column material. Such buffers frequently contain urea [30,53,89,91,131], SDS [115,132], or guanidine hydrochloride [116]. Using non-denaturing buffers for studying sodium caseinate has been reported to result in an additional high molecular weight fraction composed of mainly non-covalently associated aggregates [89,133]. To cleave disulphide bonds reducing agents such as dithiothreitol or β-mercaptoethanol are added to ensure separation only according to the cross-linking reaction that is studied. Otherwise, higher polymerisation will be determined because of additional cross-linking via disulphide bonds (Figure 9; see also [53,54]).
SEC column materials differ in composition and pore volume. The column most frequently used for studying cross-linked casein is Superdex 200, e.g., [30,44,47,48,54,100,115,131,134,135,136,137,138,139,140,141,142,143,144,145,146,147,148], which is provided by GE Healthcare (Uppsala, Sweden). The column material is based on agarose/dextran with a ratio of pore volume to void volume of Vi/Vo = 1.7 and exhibits a fractionation range from 10 to 600 kg/mol for globular proteins [128]. Superose 6 columns (GE Healthcare, Uppsala, Sweden) that are packed with agarose beads with Vi/Vo = 1.87 and exhibit a greater separation range of 5 to 5000 kg/mol for globular proteins [128] were also applied, e.g., [43,118,149]. In other studies, silica- or polymer-based columns from the TSK-Gel series (Tosoh, Tokyo, Japan) were used, e.g., [91,116,132].

4.2. Advantages and Limitations in the Context of Casein Investigation

The advantage of SEC over gel electrophoresis is the enhanced possibility for quantitative analysis with concentration sensitive detectors (e.g., UV/Vis, refractive index) that provide a direct electronic signal from the sample components. UV detection is frequently used, but suffers from the fact that different casein types exhibit different absorbance coefficients [135], which may additionally change after cross-linking. The use of globular proteins for molar mass calibration results in overestimation because caseins exhibit higher hydrodynamic radii and thus elute earlier than globular proteins with similar molar mass [150]. Moeckel et al. [48] used instead polymers of polystyrene sulphonate in the range from 6.4 to 152 kg/mol to assign the position of casein monomers, dimers, trimers, and oligomers in the chromatograms.
The separation efficiency depends strongly on column material. Taking non-micellar casein cross-linked by TGase as example, Figure 10a compares chromatograms obtained from Superdex 200 and Superose 6, exhibiting fractionation ranges from 10 to 600 and 5 to 5000 kg/mol for globular proteins, respectively. Superdex 200 consequently results in a narrower elution of fractions and better separation in the low molar mass region, i.e., monomers and dimers, whereas Superose 6 reveals an additional fraction at ~9–12 mL, which coelutes with the largest polymers at ~7.5 mL when using Superdex 200. The detection of two different high molar mass fractions is in good agreement with typical SDS-PAGE patterns, showing fractions incapable of entering both stacking and separating gel (see Section 3; Figure 7).
In contrast to gel electrophoresis, different casein types elute together in a single peak and cannot be clearly discriminated. However, when injecting standards of different casein types slightly different elution following the order β-casein < αS1-casein < κ-casein can be seen (Figure 10b), which is in accordance to their respective molar mass (Table 1) and allows at least rough hints on their different polymerisation velocity [148]. Using Superdex 200, the monomer peak is clearly shifted to higher elution volumes with higher cross-linking of non-micellar casein by TGase (Figure 10a), which suggests the presence of remaining κ-casein, as also observed by SDS-PAGE (see Section 3.3). This shift, however, is less pronounced when using Superose 6 because the broader fractionation range results in a narrower elution of monomers. The combination of both columns unites their advantages: the broad fractionation range of Superose 6 reveals the second fraction of polymers, and the separation of monomers and small oligomers is enhanced by Superdex 200. Other combinations of different SEC columns were also applied to increase separation quality [91,116,118].
Because of the heterogeneity of caseins and heteropolymers resulting from cross-linking, peaks of polymeric fractions in size exclusion chromatograms are broader than respective homopolymers and may also vary in their position depending on cross-linking intensity. Figure 11a depicts non-micellar acid casein cross-linked by TGase: the maximum of the dimer peak is shifted from ~9.85 mL to ~10.12 mL with ongoing cross-linking. The position of this peak, however, is not changing when dimers are comprised either of only β-casein (Figure 11b) or of only κ-casein (Figure 11c), and they can be distinguished by their elution volumes of ~10.6 mL and ~11.4 mL, respectively. It is thus safe to presume that the dimer peak of acid casein is shifting because dimers containing β-casein are further cross-linked whereas dimers with κ-casein remain and/or are formed in later stages of cross-linking.
Another limitation is that whey proteins may be less effectively separated from caseins. In case of both Superdex 200 and Superose 6, β-lactoglobulin coelutes with the monomers while α-lactalbumin can be separated to some extent (Figure 10c). For quantitative analysis of casein polymerisation in milk, whey proteins should be removed from the sample prior to SEC. This may be achieved through acid precipitation of casein at pH 4.6 [53], which does not affect native whey proteins. After heat treatment, however, β-lactoglobulin is covalently attached to κ-casein via disulphide bonds and will therefore precipitate together with casein [102].

4.3. Literature Review of Studies on Cross-Linked Casein

Similar to gel electrophoresis, the most simple application of SEC under denaturing and reducing conditions is for verification that polymerisation occurred, e.g., [54,116,133,134,147]. In several studies, Bönisch et al. used SEC to investigate the action and inactivation of an inhibitor of TGase indigenous to milk [135,136,137], and to show that casein polymerisation by transglutaminase declines during yoghurt fermentation as the enzyme loses its activity below pH 5 [138]. Furthermore, using ferulic acid as mediator for laccase-induced casein polymerisation resulted in an additional peak in SEC, which decreased with ongoing cross-linking because of participation of this substance in the reaction [100]. Hiller & Lorenzen applied SEC to compare the efficiency of various enzymes to cross-link different milk protein substrates [131,142], and to assess the susceptibility of sodium caseinate to TGase after dephosphorylation [141].
The possibility of calculating peak areas from chromatograms allows the determination of the concentration of distinct polymeric fractions. For instance, the highest number of casein dimers in TGase-catalysed polymerisation was observed in moderately cross-linked samples, i.e., at high levels of residual monomers (>50%), indicating that dimers as well as smaller oligomers are good substrates for further cross-linking by TGase [32,78,146]. Moreover, the polymerisation degree (sometimes also referred to as oligomerisation degree) was calculated in several studies from size exclusion chromatograms by relating peak areas of cross-linked caseins to the entire sample area [30,32,44,47,48,53,78,134,135,136,146,147,148]. Because reference casein samples often reveal a low level of polymerised casein (see Figure 9 and Figure 10), the polymerisation degree after cross-linking was also expressed as the difference between cross-linked samples and reference [137,138,139,144,145]. A different definition of polymerisation degree was given by Monogioudi et al. [91] for β-casein cross-linked by tyrosinase: they used SEC in combination with multi-angle laser light scattering (MALS) for molar mass determination (see also Section 6) and calculated the ratio of average molar mass to molar mass of monomeric β-casein. However, the authors used a literature value for the molar mass of β-casein instead of determining it with the applied method, so the validity of this approach was not proven.
A further parameter that may be calculated from size exclusion chromatograms is the minimum concentration of intermolecular cross-linking amino acids [CLAA]min. Based on Lauber et al. [53] dimers, trimers, tetramers, etc. must contain at least one, two, or three intermolecular cross-links, respectively, results in [CLAA]min of 0.5, 0.67, or 0.75 mol per mol casein monomer, respectively. Using concentrations of different polymeric fractions [x] as determined from the chromatograms, [CLAA]min of the sample can be estimated as follows [53]:
[ CLAA ] min 0.5 · [ dimer ] + 0.67 · [ trimer ] + 0.9 · [ polymer ]
Considering that fractions larger than trimers are often poorly separated by SEC, [CLAA]min of the polymeric fraction (sometimes assigned to oligomers) is assumed to be 0.9 mol per mol casein monomer for simplification.
The calculation of [CLAA]min is especially interesting in combination with experimentally determined values for the respective cross-linking amino acids. From studies on non-enzymatic cross-linking it was concluded that [CLAA]min higher than experimental data (e.g., for lysinoalanine or histidinoalanine) implies the occurrence of unknown cross-links, and that lower [CLAA]min is an indicator for intramolecular cross-linking [44,45,48]. Higher [CLAA]min may also indicate underestimation by insufficient protein hydrolysis prior to amino acid analysis. This may be especially the case when enzymatic hydrolysis has to be applied instead of acid hydrolysis to keep cross-links such as N-ε-(γ-glutamyl)-lysine intact [53,103]. Without calculating [CLAA]min, Pellegrino et al. [43] suggested that intramolecularly formed lysinoalaine caused conformational changes of β-casein monomers as the monomer peak in SEC had a different shape compared to the reference. Similarly, little changes in the polymer peak while the content of N-ε-(γ-glutamyl)-lysine still increased during extended treatment of non-micellar casein with TGase was taken as an indicator for extensive internal cross-linking in polymers that had reached a maximum size [30,31,148].
Selinheimo et al. [115] coupled SEC with fluorescence spectroscopy additionally to UV detection to determine changes in tyrosine residues, the formation of di-tyrosine cross-links, and the incorporation of mediators ferulic acid and p-coumaric acid due to cross-linking of αS-casein with tyrosinase or laccase. Furthermore, SEC was coupled with refractive index and MALS detectors for determination of absolute molar mass of cross-linked casein [91,118] (see also Section 6).
Data for modelling the kinetics of cross-linking reactions were gathered by considering the reduction of casein monomers. Despite the numerous reaction sides of casein, Menéndez et al. [140] assumed TGase-catalysed cross-linking to be a single substrate reaction of monomers into polymers at short incubation times (<15 min) and fitted their data to Michaelis–Menten enzyme kinetic (see [151]). The kinetic data revealed that maximum reaction velocity is highest for cross-linking of β-casein, followed by non-micellar acid casein and αS1-casein; however, the enzyme had the highest affinity to acid casein, which was explained by the presence of κ-casein. Jaros et al. [78] reported that for longer incubation periods (up to 10 h) the reduction of casein monomers by TGase follows a second-order reaction. In a similar approach, Bulca et al. [47] fitted heat-induced casein polymerisation to zero-order reaction kinetic and compiled lines of equal effects for heating time and temperature.
In all of the aforementioned studies, SEC was carried out under denaturing and reducing conditions to cleave non-covalent interactions and disulphide bonds and therefore to achieve separation of casein monomers and polymers. This approach is, however, not suitable for studying the structure of casein micelles. On the other hand, pore sizes of common SEC columns are too small for proper investigation of such large aggregates. Holt [152] developed a method using Sephacryl columns and simulated milk ultrafiltrate as eluent to separate casein micelles, non-micellar casein, and whey proteins. Partschefeld et al. [143] applied this procedure for TGase-treated skim milk and observed decreasing concentration of non-micelle-bound casein with increasing intensity of cross-linking, which was in line with the amount of non-sedimentable material as determined by centrifugation.
SEC can be easily applied for preparative fractionation of casein polymers, especially when larger columns are used to allow increased injection volumes. Boeriu et al. [132] collected fractions from β-casein/arabinoxylan heteropolymers generated by peroxidase for further characterisation by fourier-transform infrared spectroscopy (FT-IR). Similarly, Siegl [150] applied preparative SEC on non-enzymatically cross-linked casein to obtain different polymeric fractions for determination of their lysinoalanine and histidinoalanine contents.
SEC columns for the separation of peptides were used to study digests of cross-linked casein. Monogioudi et al. [153] observed for β-casein cross-linked by TGase that very large fragments (>20 kg/mol) remain after hydrolysis with pepsin, and that low molecular weight fractions (<4 kg/mol) exhibit a different amino acid composition as determined by mass spectrometry. Hellwig et al. [154,155] performed simulated gastrointestinal digestion and used SEC to isolate fractions below and above 0.2–0.5 kg/mol for further analysis. The authors detected N-ε-(γ-glutamyl)-lysine formed by TGase as well as lysinoalanine mainly in high molar mass fractions and therefore concluded that these cross-linking amino acids are probably unavailable for absorption in the intestine.

5. Field Flow Fractionation

5.1. Separation Principle

Among the family of liquid chromatographic techniques, field flow fractionation (FFF) is the most capable and versatile separation technique for polymer analysis in terms of separation range, resolution, and selectivity [156]. In contrast to column-based separation methods, the separation in FFF is carried out in an empty ribbon-like channel where sample solution and eluent are confined. The separation force is achieved by applying an external field force perpendicularly to the direction of the sample within the channel. The applied fields can include cross-flow stream, temperature gradient, centrifugal force, electrical potential, or gravitational force, resulting in different FFF sub-techniques that allow the fractionation of molecules according to molecular size, charge, density, and/or chemical structure. In the recent years, the theoretical background of FFF and its main applications in analysis of synthetic and natural polymers [157,158,159,160], colloids and nanoparticles [161,162,163], cells and biomolecules [159,164], and food macromolecules [165] have been reviewed in great detail.
Asymmetrical flow field flow fractionation (AF4) is the most prominent FFF sub-class where the separation takes place in a trapezoidal channel with an ultra-filtration membrane as the bottom wall of the channel, which is permeable for the eluent but impermeable for the sample [166]. An external cross-flow is applied orthogonally to the channel flow, and separates the analysed molecules with respect to their diffusivity [165]. The procedure of a typical AF4 separation approach is shown in Figure 12. During the first two steps (i.e., injection and focusing) the eluent enters the channel from the inlet and outlet port, and permeates the ultra-filtration membrane. After injection, the sample becomes concentrated in the focusing step in a narrow band on the membrane. The injection flow is stopped and the sample is relaxed at the starting point. Thereafter, the flow is switched to the elution mode and the molecules are transported from the inlet to the outlet port. Due to the geometry of the channel, the eluent streams in a laminar flow with a parabolic profile, i.e., the flow velocity increases with the distance from the ultra-filtration membrane to the centre of the channel in vertical direction. The analytes are driven continuously by the cross-flow towards the membrane and the Brownian diffusion generates a counteracting motion back to the channel centre. Smaller objects with higher diffusion constant have their equilibrium position in the higher laminar layers, where the longitudinal flow is faster. Hence, they will be transported more rapidly to the channel outlet than larger objects. This separation mechanism, is referred to as “normal” or Brownian separation mode, and is the most common in AF4 for particles smaller than 1 µm in diameter. Larger particles exhibit low diffusion coefficients so that the cross-flow driven movement is not balanced by Brownian motion of the particles. In contrast to the normal mode, smaller particles are located away from the higher laminar layers and elute later than larger particles. This separation mechanism is known as steric-hyperlayer mode and is characterised by a steric inversion point that depends on the flow rate, channel dimensions and particle size. Analysis of polydisperse samples spanning the steric inversion point may be hampered by co-elution of small and large particles in normal and steric-hyperlayer mode, respectively [167].
In normal separation mode, AF4 can separate different molecules according to their diffusion coefficient (D), which is related to the hydrodynamic radius (Rh) by the Stokes-Einstein equation [168], assuming spherical shape of the molecules:
R h = T · k B 6 · η · π · D
where kB is the Boltzmann constant, T is the temperature and η is the viscosity of the eluent. By combining the Stokes-Einstein equation with the retention theory [169] Rh can be obtained from the elution time:
R h = t E · T · k B η · π · w 2 · F x F c
where tE is the elution time, w is the channel thickness, Fx is the cross-flow velocity, and Fc is the channel flow velocity. The calculation of the diffusion coefficient from the elution time becomes more complex if the cross-flow changes during elution. A numerical solution was therefore developed for trapezoidal channel and was improved for cross-flow decaying with the time [170,171,172].
The cross-flow is the key parameter that defines the elution behaviour of the sample, and should be optimised to obtain the best separation in a relatively short analysis time. As a general rule, the velocity of the cross-flow is selected according to the size of the analysed samples. A high cross-flow is useful to fractionate smaller components, whereas a low cross-flow is applied for larger components. In case of narrowly distributed samples (e.g., protein monomers), a constant cross-flow can be used. On the other hand, for broadly distributed samples (monomers and aggregates), a cross-flow decaying with time is useful to achieve a high resolution separation and reduced analysis time over the entire size distribution [173].
The choice of the ultra-filtration membrane is dependent on the size and charge of the analysed molecules. The most frequently used ultra-filtration membranes are made of regenerated cellulose (RC) or polyether sulphone (PES) with typical cut-off of 10 kDa. PES membranes are relatively hydrophobic and have a higher negative surface charge in comparison to RC membranes [174,175]. The eluent is commonly a buffer solution with varying pH and ionic strength depending on the sample solution. For protein analysis, high concentration of salt is helpful to minimise undesirable membrane-sample interactions, which can result in sample loss [176].
The amount of injected sample has to be adjusted to ensure high separation power. As the sample becomes focused at the ultra-filtration membrane, its concentration is ten times higher at this point. Injecting large amounts of sample might result in channel overloading, which hampers the fractionation.
Different detectors can be coupled to the AF4 channel for an appropriate determination of various molecular properties of the eluted fractions such as molar mass, molecular size, conformation, and shape. For that, MALS, differential refractive index (dRI), UV/Vis, and dynamic light scattering (DLS) are commonly applied [177]. Additional information on similar parameters could be delivered by differential viscometer [178], and structure and molecular composition can be further investigated by coupling AF4 to nuclear magnetic resonance (NMR) [179] and FT-IR [180].
The high pressure during the focusing step can cause formation of conglomerates, which could falsify the separation results, especially when highly interactive moieties in the molecules are available as it is often the case for natural polymers. Therefore, an alternative to the conventional AF4 represents the frit-inlet channel (FI-AF4), which reduces the concentration of the sample near the ultra-filtration membrane. The channel design allows by-passing the focusing step, and the samples are hydrodynamically relaxed by a compressing action of an additional flow that enters the channel from a small permeable frit placed close to the injection port (Figure 13). After the sample components have passed the frit inlet flow area and reached a ready state equilibrium, the separation process takes place in the same way as the elution step for the conventional AF4. In this regard, the continuous migration along the channel reduces the chance of sample adhesion to the membrane as well as system contaminations [181,182].

5.2. Potential Advantages and Limitations in the Context of Casein Investigation

The main advantage of FFF over other separation techniques is the lack of a stationary phase. The open channel provides a gentle sample fractionation with high resolution and minimal shear forces, and allows the separation of a wide range of molar masses, from approx. 10 up to 107 kg/mol [183]. Furthermore, the absence of a stationary phase allows the application of a broad variety of eluents, including non-denaturing buffers that enable the investigation of casein structures in their native environment. This is crucial for studying casein micelles, but also promising for non-micellar casein, which is known to form small aggregates via non-covalent interactions [184,185]. In this regard, caseinate solutions can contain a molar mass range from approx. 20 kg/mol (monomer) up to 1000 kg/mol (aggregates and polymers) [149,186]. Therefore, separation range and selectivity have to be large enough for a comprehensive characterisation of all fractions as it can be readily achieved in one separation step when using AF4.
A potential drawback of AF4 might be the material and/or cut-off of the ultra-filtration membrane. The cut-off, which is an index of the pore size of the membrane, defines the lowest molar mass that will be separated in the channel. In case of casein samples, this corresponds to the monomer (~20 kg/mol). When using a 10 kDa cut-off, a certain amount of monomers might pass the pores, resulting in a loss of sample On the other hand, using a cut-off of 2 kDa or 5 kDa limits the possibility to use a high cross-flow because of the excessive pressure on the membrane during the elution step, which can hamper the fractionation.

5.3. Literature Review of Studies on Casein

Despite its huge potential, FFF has not yet been applied for the investigation of cross-linked casein. The following section is therefore focused on its general applications for casein investigation.
McKinnon et al. [187] used sedimentation FFF as well as flow FFF to study casein micelles in skim milk and observed a good agreement between particle size distributions as calculated from the elution times and determined by dynamic light scattering; however, only smaller casein micelles (<40 nm in diameter) were investigated with flow FFF.
Glantz et al. [188] applied AF4 for the investigation of casein micelles over the entire size range. Figure 14 depicts the molar mass and size distributions, with peak 3 representing the casein micelles.
Molar mass and radius of gyration were determined by MALS detector, whereas Rh was calculated from the elution time (see Section 5.1, Equation (3)). Additionally, the apparent densities were determined over the entire size distribution in order to get deeper insight into the conformation and shape of casein micelles (see also Section 6.2). By combining the experimental data obtained from AF4-MALS and theoretical models for the description of the shape of colloidal particles, the authors found that the majority of casein micelles exhibit a spherical shape with an average radius of gyration and Rh of 177 nm and 116 nm, respectively. A low amount of anisotropic and elongated aggregates was found; however, the reason for the occurrence of such aggregation was not fully understood, and therefore further investigations are needed to fill the gap concerning the structure and morphology of casein micelle aggregates.
Nogueira Silva et al. [189] and Lazzaro et al. [190] applied AF4 for the determination of the particle size distribution of casein aggregates as prepared by partial disintegration of casein micelles, and achieved a separation of intact casein micelles and smaller compounds, which became more abundant with decreasing pH or increasing concentration of trisodium citrate as a consequence of casein micelle dissociation. Guyomarc’h et al. [191] used AF4 in comparison with SEC for the characterisation of unheated and heated skim milk. The conversion of native whey proteins to complexes of whey proteins and κ-casein in the serum phase as well as on the surface of casein micelles was demonstrated by AF4, whereas the removal of casein micelles was necessary for investigation by SEC.
AF4 has been recently applied by Cragnell et al. [192] for studying the size distribution of bovine β-casein assemblies, resulting in two main populations. The authors firstly performed SAXS and osmometry measurements, with the latter contradicting results published in literature. Therefore, AF4 was performed, resulting in the plot shown in Figure 15. Over the whole fractogram, Rg ranged from approx. 20 to 100 nm, and the molar mass from approx. 20 to 104 kg/mol (1 to ~200 monomers), demonstrating that β-casein forms a polydisperse distribution of equilibrium assemblies.

6. Absolute Molar Mass and Size Determination

6.1. Determination Principle and Requirements

The molar mass is one of the key parameters that permit the evaluation of structural properties of macromolecules, and is traditionally performed by SEC, which requires a calibration procedure usually performed by using standards with similar structure and behaviour as the macromolecules in solution. This approach leads to the determination of a molar mass relative to the elution volume of the used standard. In case of casein, as no calibration standards are available, MALS is suitable for the determination of the absolute molar mass M, or, in case that no separation is performed prior to static light scattering measurements, the weight average molar mass (MW) is determined [193]. This is possible because the light scattering intensity is in direct relation with the molar mass. In this regard, the combination of AF4 or SEC with scattering techniques (see Figure 16) is a powerful tool for comprehensive characterisation of a wide range of polymers [194,195,196,197].
In MALS experiments, the intensity of light scattered by an analyte is measured at different angles (θ). For a dilute sample solution, and assuming a vertically polarised incident light, the intensity (I) of scattered light is proportional to the properties of the sample solution according to the Zimm equation [198]:
I ( θ ) scattered M · c · ( d n d c ) 2 · P ( θ )
where c is the concentration of the sample solution, M is the molar mass, dn/dc is the specific refractive index increment of the scattering solution, and P(θ) is the particle scattering function. In case of polydisperse samples with a distribution of molar masses, the symbol M becomes MW.
The value of dn/dc and its accuracy are essential for an appropriate calculation of M. Therefore, MALS is commonly combined with a differential refractive index detector (dRI) as a concentration detector in an online experiment. For many molecules, dn/dc is constant over a broad range of molar masses. In the case of casein, however, dn/dc may differ with respect to the conditions applied for sample preparation, and after cross-linking. In this regard, it is necessary to determine dn/dc individually.
The particle scattering function P(θ) defines the angle-dependent intensity of the scattered light with increasing angle of observation. It is only dependent on the structure of the scattering molecules and, for small angles, it can be approximated as:
lim θ 0 P ( θ ) = 1 16 · π 2 3 · λ 2 · R g 2 · sin 2 ( θ 2 ) = 1 u 2 3 · R g 2
where λ is the wavelength of the incident light in a given solvent, Rg is the radius of gyration, also referred to as root-mean-square radius (Rrms), and u is the scattering vector. Therefore, the size of the scattering particle can be obtained by the measurement of the angular variation of the scattered light intensity. In particular, for a polydisperse sample, smaller particles scatter light more intensely at higher scattering angles, whereas the light scattering intensity of larger molecules is dominant at low scattering angles. However, MALS experiments are usually limited to rather large polymers. Determining the absolute molar mass by MALS detection depends on dn/dc and concentration and generally works well for polymers of at least 10 kg/mol in molar mass (Equation (4)). However, Rg can be determined for particles of at least 10 nm in size (depending on the laser wavelength) (Equation (5)). This is due to the determination limit of the diameter of a particle, which is 1/20 of the wavelength used in the scattering process.
The light scattering data obtained from MALS can be fitted by different approaches, the most prominent one represented by the Zimm equation, allowing the evaluation of both MW and Rg. With respect to the type of the macromolecules, different models have been developed for fitting the light scattering data [199].
Assumptions about the structural conformation of the molecules can be obtained by the conformational plot, which is the dependence of Rg on MW with respect to the following equation:
R g = K · M W ν
The slope of the double logarithmic plot defines the scaling factor ν, which gives information on the structure of the analysed molecule, e.g., ν = 0.33 for spheres, ν ~ 1 for rods, and ν = 0.5 … 0.6 for random coils.
Another important parameter is Rh, which is related to the diffusion coefficient of the molecules according to the Stokes-Einstein equation. A significant advantage of the Rh over Rg is that it can be also determined for molecules smaller than 10 nm. This value can be evaluated by batch-mode DLS, which is an absolute size measurement technique. However, in the case of polydisperse samples, the batch-mode DLS offers only limited possibilities to characterise the entire size distribution because of the high scattering intensity of larger particles. In contrast, when connected to AF4 or SEC, DLS permits the determination of the hydrodynamic radius of the eluted fractions. Furthermore, the mutual relation of the two radii (Rg/Rh) allows the estimation of the molecular shape. For homogeneous hard sphere the ratio is equal to 0.775, for linear random coil is between 1 and 2, and for elongated conformations the ratio is up to 2 [200]. The determination of the diffusion coefficient and thus the hydrodynamic radius is also possible from the AF4 elution time (see Section 5.1, Equation (3)); however, both approaches possess advantages and limitations that were treated in depth in the bioconjugation of synthetic macromolecules and proteins [177,201,202,203,204,205].
Additionally, the calculation of the apparent density ρ(app)i is helpful for molecular characterisation:
ρ ( app ) i = ( M W ) i V ( R ) i
where V is the volume occupied by the fraction i, and R can be Rg or Rh. This value allows distinguishing different conformations within a macromolecular network and shape [206].

6.2. Literature Review of Studies on Casein

Up to now, little has been published on the molar mass of cross-linked casein, although its determination is important to understand the functional behaviour of these proteins. The most common characterisation methods are various types of electron microscopy giving interesting insights into the morphology of the casein structure, e.g., [43,48,207,208], and batch light scattering providing average values of molar mass and size distribution.
HadjSadok et al. [184] performed batch static and dynamic light scattering to determine molar mass and hydrodynamic radius of sodium caseinate, revealing a dependence of the self-aggregation on temperature, pH, and NaCl concentration. In addition to the caseinate particles, however, small amounts of a large component were detected. To allow optimal analysis by light scattering techniques, the quantity of this fraction should be reduced either during sample preparation (e.g., centrifugation) or via size separation techniques prior to MALS detection.
In batch-MALS, Lucey et al. [149] observed lower average molar masses and Rg after ultra-centrifugation of sodium caseinate solutions because of the removal of residual lipid particles, and thus applied SEC-MALS only for analysis of centrifuged samples. A dn/dc of 0.190 mL/g was considered for molar mass determination. The distribution revealed two main fractions ranging between ~30 and 800 kg/mol, indicating the presence of casein monomers as well as polymeric κ-casein and complexes of αS1- and β-casein. In the conformational plot, the authors observed strong changes in conformation over the size distribution, suggesting that in caseinates several types of casein aggregates might exist depending on the molar mass, and that the shape of such aggregates might not be spherical but rather elongated.
Monogioudi et al. [91] applied SEC-MALS for the determination of molar mass, Rg, and polymerisation degree of β-casein cross-linked by tyrosinase and TGase. The authors concluded from the results that the cross-linking of β-casein with tyrosinase and TGase is comparable in terms of molar mass, size and polymerisation degree, despite different reaction mechanisms. With respect to molar mass determination, however, the use of dn/dc of 0.186 mL/g as adapted from the literature may not be correct since the authors used different eluents, and cross-linking could have had an additional influence.
Glantz et al. [188] calculated the apparent densities ρ and the Rg/Rh ratio from the molar mass and radii distributions in order to describe the shape of casein micelles (Figure 17). From the data, the authors found a different tendency of ρh and ρg as a function of the Rg, suggesting large differences in conformation over the entire size distribution. Additionally, the majority of the casein micelles had a ratio of Rg/Rh of 0.77, which is in the range of sphere-like clusters, but a low amount of them appeared to be more anisotropic with a ratio Rg/Rh above 1.7. In this regard, the authors suggested that a small fraction of casein micelles in milk can form larger and elongated aggregates.

7. Conclusions and Outlook

Casein is the main milk protein fraction and exhibits high nutritional value as well as relevant techno-functional properties. Especially during the last two decades, both enzymatic and non-enzymatic cross-linking of casein were studied in great detail because of the relevance to milk processing. Since cross-linking typically results in the polymerisation of casein, size separation techniques were frequently applied to study these reactions. The principles and applications of the two most common methods as well as a possible alternative are summarised in this review.
Polyacrylamide gel electrophoresis permits the separation of individual casein types to study their susceptibility to particular cross-linking reactions, but very high molar mass casein polymers can hardly enter the gel matrix and are poorly resolved. Two-dimensional gel electrophoresis is an important tool in proteomics for the separation of up to 1000 proteins and is applied in particular for investigating non-enzymatic cross-linking during storage of milk and dairy products. Subsequent mass spectrometric analysis allows the identification of different milk proteins even in covalently cross-linked fractions.
Size exclusion chromatography facilitates quantitative analysis of polymeric fractions by using concentration sensitive detectors like UV/Vis or refractive index. Therefore, parameters such as polymerisation degree and minimum concentration of intermolecular cross-linking amino acids were estimated in the past, and the data were also used for modelling the kinetics of cross-linking reactions. The separation efficiency, however, depends on the column material, and the analysis of very high molar mass casein polymers is hampered when the separation range is too narrow.
In this regard, field flow fractionation is a promising method for a more comprehensive investigation of casein polymers over the entire size range, but no studies on cross-linked casein have been published so far. Few investigations of casein micelles, however, underline especially its potential application under non-denaturing conditions.
Up to now little has been reported about appropriate standard substances for molar mass calibration of casein polymers. Therefore, absolute molar mass determination will be of increased interest in the future. For that, multi-angle light scattering in combination with size separation techniques is most suitable.

Acknowledgments

Financial support was received from Deutsche Forschungsgemeinschaft (Bonn, Germany) under grant numbers RO3454/5-1 and LE1424/9-1. Microbial transglutaminase was kindly provided by Ajinomoto Foods SAS (Hamburg, Germany), and Harald Bothe (GE Healthcare Europe GmbH, Freiburg, Germany) is gratefully acknowledged for providing a Superose 6 Increase 10/300 GL column.

Author Contributions

Norbert Raak and Raffaele Andrea Abbate conducted the main literature search and wrote the manuscript with valuable contributions from Albena Lederer, Harald Rohm, and Doris Jaros. Experiments were planned and performed by Norbert Raak. All authors contributed references and suggestions and agreed to the submission of the paper.

Conflicts of Interest

The authors declare no conflict of interest. The founding sponsors had no role in the design of the study; in the collection, analyses, or interpretation of data; in the writing of the manuscript, and in the decision to publish the results.

Appendix A. Experimental Details

Appendix A.1. Casein Sample Preparation

Acid casein powder from Sigma-Aldrich GmbH (Steinheim, Germany; crude protein content 868 g/kg, Kjeldahl method, N × 6.38 [209]) was dissolved in 0.1 mol/L phosphate buffer at pH 6.8 (referred to as casein in phosphate buffer). αS-, β-, and κ-casein standards (Sigma-Aldrich GmbH, Steinheim, Germany) were dissolved in demineralised water. Target protein concentration was always 27 g/kg, and 0.3 g/kg sodium azide was added for preservation.
Incubation of temperature equilibrated casein solutions with 3 U/gprotein microbial transglutaminase (Activa MP from Streptomyces mobarensis, Ajinomoto Foods Europe SAS, Hamburg, Germany) was carried out at 40 °C for different periods of time and stopped by heat treatment (85 °C, 15 min) to inactivate the enzyme. Samples were subsequently cooled in ice water. Reference samples, referred to as 0 h, were pre-tempered and heat-treated without enzyme addition.

Appendix A.2. Linear Sodium Dodecyl Sulphate Polyacrylamide Gel Electrophoresis

Linear SDS-PAGE was performed using a vertical device with 10 × 8 cm² plates (C.B.S. Scientific Company Inc., Del Mar, CA, USA), and the procedure was slightly modified from Laemmli [63]. Acrylamide solution (97:3 (w/w) acrylamide: N,N′-methylenebisacrylamide) was blended 70:30 (v/v) with a mixture of 2 mol/L Tris-HCl buffer (pH 8.8), 100 mg/mL SDS, 10 mol/L N,N,N′,N′-tetramethylethylenediamine (TEMED), and 100 mg/mL ammonium persulphate (94.8:3.4:0.1:1.7 (v/v)) to obtain a separating gel mixture with 125 mg/mL acrylamide. A stacking gel mixture with 40 mg/mL acrylamide was prepared accordingly but with 0.33 mol/L Tris-HCL buffer (pH 6.8). The separating gel mixture was poured first between the plates (gap ~0.5 mm), and the stacking gel mixture was placed on top after ~60 min. The gels were left over night for complete polymerisation. The electrode buffer contained 0.05 mol/L Tris, 0.38 mol/L glycine, and 2 g/L SDS. Casein solutions were blended 0.3:4.7:4.7:0.3 (v/v) with 8 mol/L urea, sample buffer (pH 8.0; 0.8 mol/L Tris, 2 mmol/L ethylenediaminetetraacetic acid (EDTA), 4 mol/L glycerine, 20 g/L SDS, 0.2 g/L Orange G), and 150 mg/mL dithiothreitol prior to boiling for 5 min. 10 µL of the samples were injected to the sample wells, and the separation was achieved by applying 100 V for ~2.5 h. Protein bands were stained with Coomassie Brilliant Blue R250 (0.6 g/L in 4:1:5 (v/v) ethanol, acetic acid, demineralised water), and gels were subsequently destained with 5:1:14 (v/v) methanol, acetic acid, demineralised water.
Two molar mass markers from Serva Electrophoresis GmbH (Heidelberg, Germany) that contain mainly globular proteins were analysed for comparison with casein: Protein Test Mixture 6 (trypsin inhibitor from bovine lung, Mr 6500; cytochrome C, Mr 12,500; trypsin inhibitor from soybean, Mr 21,000; carbonic anhydrase, Mr 29,000; ovalbumin, Mr 45,000; bovine serum albumin, Mr 67,000; phosphorylase B, Mr 97,400), and Liquid Mix Protein Marker 6.5–200 kDa (aprotinin, Mr 6500; lysozyme, Mr 14,300; trypsin inhibitor from soybean, Mr 21,000; carbonic anhydrase, Mr 29,000; ovalbumin, Mr 45,000; bovine serum albumin, Mr 67,000; β-galactosidase, Mr 116,000; myosin, Mr 200,000).

Appendix A.3. Gradient Sodium Dodecyl Sulphate Polyacrylamide Gel Electrophoresis

A vertical device with 20 × 20 cm2 plates (PEQLAB Biotechnologie GmbH, Erlangen, Germany) was used for gradient SDS-PAGE. All buffers and stock solutions were equal to linear SDS-PAGE (Appendix A.2); however, two separation gel mixtures with 40 and 200 mg/mL acrylamide were prepared and blended while pouring between the plates (gap ~2 mm) using a gradient mixer. A stacking gel mixture with 40 mg/mL acrylamide was placed on top of the gradient separation gel after ~60 min, and the gels were left overnight for complete polymerisation. Sample preparation was according to Appendix A.2; however, 30 µL were injected to the sample wells. The separation was achieved by applying 200 V for ~6.5 h, and the gels were subsequently stained with Coomassie Brilliant Blue (see Appendix A.2).

Appendix A.4. Size Exclusion Chromatography

Two pre-packed columns from GE Healthcare Europe GmbH (Freiburg, Germany) were used individually or in combination: Superose 6 Increase 10/300 GL, and Superdex 200 Increase 10/300 GL. The elution buffer (pH 6.8) contained 6 mol/L urea, 0.1 mol/L NaCl, 0.1 mol/L Na2HPO4, and 1 g/L 3-[(3-Cholamidopropyl)dimethylammonio]-1-propanesulphonate (CHAPS). For sample preparation, casein solutions were blended 7.5:92.5 (v/v) with elution buffer, which, unless stated otherwise, contained 100 mg/mL dithiothreitol, and stored overnight for cleavage of disulphide bonds. Measurements were carried out at ambient temperature with an isocratic flow rate of 0.5 mL/min using an AZURA Assistant ASM 2.1L system (Knauer Wissenschaftliche Geräte GmbH, Berlin, Germany). Casein was detected at 280 nm, and ClarityChrom v.3.0.7 (Knauer Wissenschaftliche Geräte GmbH, Berlin, Germany) was used for data aquisition. Whey protein isolate (Bulk Powders, Colchester, UK) and reconstituted skim milk (100 g/kg dry matter) from low heat skim milk powder (Sachsenmilch Leppersdorf GmbH, Leppersdorf, Germany) were analysed for comparison.

References

  1. Farrell, H.M., Jr.; Jimenez-Flores, R.; Bleck, G.T.; Brown, E.M.; Butler, J.E.; Creamer, L.K.; Hicks, C.L.; Hollar, C.M.; Ng-Kwai-Hang, K.F.; Swaisgood, H.E. Nomenclature of the Proteins of Cows’ Milk—Sixth Revision. J. Dairy Sci. 2004, 87, 1641–1674. [Google Scholar] [CrossRef]
  2. O’Mahony, J.A.; Fox, P.F. Milk Proteins: Introduction and Historical Aspects. In Advanced Dairy Chemistry, 4th ed.; McSweeney, P.L.H., Fox, P.F., Eds.; Springer: Boston, MA, USA, 2013; pp. 43–85. [Google Scholar]
  3. Dalgleish, D.G. On the Structural Models of Bovine Casein Micelles—Review and Possible Improvements. Soft Matter 2011, 7, 2265–2272. [Google Scholar] [CrossRef]
  4. De Kruif, C.G.; Huppertz, T.; Urban, V.S.; Petukhov, A.V. Casein Micelles and Their Internal Structure. Adv. Colloid Interface Sci. 2012, 171–172, 36–52. [Google Scholar] [CrossRef] [PubMed]
  5. McMahon, D.J.; Oommen, B.S. Supramolecular Structure of the Casein Micelle. J. Dairy Sci. 2008, 91, 1709–1721. [Google Scholar] [CrossRef] [PubMed]
  6. De Kruif, C.G. Supra-Aggregates of Casein Micelles as a Prelude to Coagulation. J. Dairy Sci. 1998, 81, 3019–3028. [Google Scholar] [CrossRef]
  7. Horne, D.S. Casein Structure, Self-Assembly and Gelation. Curr. Opin. Colloid Interface Sci. 2002, 7, 456–461. [Google Scholar] [CrossRef]
  8. Horne, D.S. Casein Micelle Structure: Models and Muddles. Curr. Opin. Colloid Interface Sci. 2006, 11, 148–153. [Google Scholar] [CrossRef]
  9. Holt, C.; Carver, J.A.; Ecroyd, H.; Thorn, D.C. Caseins and the Casein Micelle: Their Biological Functions, Structures, and Behavior in Foods. J. Dairy Sci. 2013, 96, 6127–6146. [Google Scholar] [CrossRef] [PubMed]
  10. Thorn, D.C.; Ecroyd, H.; Carver, J.A.; Holt, C. Casein Structures in the Context of Unfolded Proteins. Int. Dairy J. 2015, 46, 2–11. [Google Scholar] [CrossRef]
  11. Carver, J.A.; Thorn, D.C.; Ecroyd, H.; Holt, C. Letter to the Editor: A Response to Horne and Lucey (2017). J. Dairy Sci. 2017, 100, 5121–5124. [Google Scholar] [CrossRef] [PubMed]
  12. Horne, D.S. A Balanced View of Casein Interactions. Curr. Opin. Colloid Interface Sci. 2017, 28, 74–86. [Google Scholar] [CrossRef]
  13. Horne, D.; Lucey, J.A. Letter to the Editor: Hydrophobic Interactions in the Caseins: Challenging Their Dismissal by Holt et al. (2013). J. Dairy Sci. 2017, 100, 5119–5120. [Google Scholar] [CrossRef] [PubMed]
  14. McMahon, D.J.; Du, H.; McManus, W.R.; Larsen, K.M. Microstructural Changes in Casein Supramolecules during Acidification of Skim Milk. J. Dairy Sci. 2009, 92, 5854–5867. [Google Scholar] [CrossRef] [PubMed]
  15. McMahon, D.J. Letter to the Editor: The Dynamic Casein Supramolecule: A Response to Horne (2010). J. Dairy Sci. 2010, 93, 3404. [Google Scholar] [CrossRef]
  16. Horne, D.S. Letter to the Editor: Casein Micelles or Casein Supramolecules? J. Dairy Sci. 2010, 93, 3403. [Google Scholar] [CrossRef] [PubMed]
  17. Huppertz, T. Chemistry of the Caseins. In Advanced Dairy Chemistry, 4th ed.; McSweeney, P.L.H., Fox, P.F., Eds.; Springer: Boston, MA, USA, 2013; pp. 135–160. [Google Scholar]
  18. Lucey, J.A. Formation and Physical Properties of Milk Protein Gels. J. Dairy Sci. 2002, 85, 281–294. [Google Scholar] [CrossRef]
  19. Lucey, J.A.; Singh, H. Formation and Physical Properties of Acid Milk Gels: A Review. Food Res. Int. 1997, 30, 529–542. [Google Scholar] [CrossRef]
  20. O’Regan, J.; Mulvihill, D.M. Caseins and Caseinates, Industrial Production, Compositional Standards, Specifications, and Regulatory Aspects. In Encyclopedia of Dairy Science, 2nd ed.; Fuquay, J.W., Fox, P.F., McSweeney, P.L.H., Eds.; Academic Press: San Diego, CA, USA, 2011; Volume 3, pp. 855–863. [Google Scholar]
  21. Ando, H.; Adachi, M.; Umeda, K.; Matsuura, A.; Nonaka, M.; Uchio, R.; Tanaka, H.; Motoki, M. Purification and Characteristics of a Novel Transglutaminase Derived from Microorganisms. Agric. Biol. Chem. 1989, 53, 2613–2617. [Google Scholar]
  22. Martins, I.M.; Matos, M.; Costa, R.; Silva, F.; Pascoal, A.; Estevinho, L.M.; Choupina, A.B. Transglutaminases: Recent Achievements and New Sources. Appl. Microbiol. Biotechnol. 2014, 98, 6957–6964. [Google Scholar] [CrossRef] [PubMed]
  23. Buchert, J.; Ercili Cura, D.; Ma, H.; Gasparetti, C.; Monogioudi, E.; Faccio, G.; Mattinen, M.; Boer, H.; Partanen, R.; Selinheimo, E.; et al. Crosslinking Food Proteins for Improved Functionality. Ann. Rev. Food Sci. Technol. 2010, 1, 113–138. [Google Scholar] [CrossRef] [PubMed]
  24. Gaspar, A.L.C.; de Góes-Favoni, S.P. Action of Microbial Transglutaminase (MTGase) in the Modification of Food Proteins: A Review. Food Chem. 2015, 171, 315–322. [Google Scholar] [CrossRef] [PubMed]
  25. Jaros, D.; Partschefeld, C.; Henle, T.; Rohm, H. Transglutaminase in Dairy Products: Chemistry, Physics, Applications. J. Texture Stud. 2006, 37, 113–155. [Google Scholar] [CrossRef]
  26. Özrenk, E. The Use of Transglutaminase in Dairy Products. Int. J. Dairy Technol. 2006, 59, 1–7. [Google Scholar] [CrossRef]
  27. Romeih, E.; Walker, G. Recent Advances on Microbial Transglutaminase and Dairy Application. Trends Food Sci. Technol. 2017, 62, 133–140. [Google Scholar] [CrossRef]
  28. Zeeb, B.; Fischer, L.; Weiss, J. Stabilization of Food Dispersions by Enzymes. Food Funct. 2014, 5, 198–213. [Google Scholar] [CrossRef] [PubMed]
  29. Nemes, Z.; Petrovski, G.; Fésüs, L. Tools for the Detection and Quantitation of Protein Transglutamination. Anal. Biochem. 2005, 342, 1–10. [Google Scholar] [CrossRef] [PubMed]
  30. Jaros, D.; Schwarzenbolz, U.; Raak, N.; Löbner, J.; Henle, T.; Rohm, H. Cross-Linking with Microbial Transglutaminase: Relationship between Polymerisation Degree and Stiffness of Acid Casein Gels. Int. Dairy J. 2014, 38, 174–178. [Google Scholar] [CrossRef]
  31. Jaros, D.; Schwarzenbolz, U.; Raak, N.; Löbner, J.; Henle, T.; Rohm, H. Cross-Linking with Microbial Transglutaminase: Relationship between Polymerisation Degree and Stiffness of Acid Casein Gels. Int. Dairy J. 2014, 38, 174–178, reprinted in Int. Dairy J. 2014, 39, 345–347. [Google Scholar] [CrossRef]
  32. Raak, N.; Rohm, H.; Jaros, D. Cross-Linking with Microbial Transglutaminase: Isopeptide Bonds and Polymer Size as Drivers for Acid Casein Gel Stiffness. Int. Dairy J. 2017, 66, 49–55. [Google Scholar] [CrossRef]
  33. Monogioudi, E.; Permi, P.; Filpponen, I.; Lienemann, M.; Li, B.; Argyropoulos, D.; Buchert, J.; Mattinen, M.-L. Protein Analysis by 31P NMR Spectroscopy in Ionic Liquid: Quantitative Determination of Enzymatically Created Cross-Links. J. Agric. Food Chem. 2011, 59, 1352–1362. [Google Scholar] [CrossRef] [PubMed]
  34. Mokoonlall, A.; Pfannstiel, J.; Struch, M.; Berger, R.G.; Hinrichs, J. Structure Modification of Stirred Fermented Milk Gel Due to Laccase-Catalysed Protein Crosslinking in a Post-Processing Step. Inn. Food Sci. Emerg. Technol. 2016, 33, 563–570. [Google Scholar] [CrossRef]
  35. Mokoonlall, A.; Sykora, L.; Pfannstiel, J.; Nöbel, S.; Weiss, J.; Hinrichs, J. A Feasibility Study on the Application of a Laccase-Mediator System in Stirred Yoghurt at the Pilot Scale. Food Hydrocoll. 2016, 60, 119–127. [Google Scholar] [CrossRef]
  36. Mokoonlall, A.; Hippich, M.; Struch, M.; Berger, R.G.; Weiss, J.; Hinrichs, J. Antioxidant Activity of Milk Suppresses Laccase Induced Radicals and the Subsequent Modification of Acidified Milk Protein Gels. Int. Dairy J. 2016, 60, 24–31. [Google Scholar] [CrossRef]
  37. Maillard, L.C. Action des Acides Aminés sur les Sucres; Formation des Mélanoïdines par voie Méthodique (in French). C. R. Acad. Sci. 1912, 154, 66–68. [Google Scholar]
  38. De Oliveira, F.C.; dos Reis Coimbra, J.S.; de Oliveira, E.B.; Zuñiga, A.D.G.; Rojas, E.E.G. Food Protein-Polysaccharide Conjugates Obtained via the Maillard Reaction: A Review. Crit. Rev. Food Sci. Nutr. 2016, 56, 1108–1125. [Google Scholar] [CrossRef] [PubMed]
  39. Liu, J.; Ru, Q.; Ding, Y. Glycation a Promising Method for Food Protein Modification: Physicochemical Properties and Structure, A Review. Food Res. Int. 2012, 49, 170–183. [Google Scholar] [CrossRef]
  40. Lund, M.N.; Ray, C.A. Control of Maillard Reactions in Foods: Strategies and Chemical Mechanisms. J. Agric. Food Chem. 2017, 65, 4537–4552. [Google Scholar] [CrossRef] [PubMed]
  41. O’Mahony, J.A.; Drapala, K.P.; Mulcahy, E.M.; Mulvihill, D.M. Controlled Glycation of Milk Proteins and Peptides: Functional Properties. Int. Dairy J. 2017, 67, 16–34. [Google Scholar] [CrossRef]
  42. Gerrard, J.A. Protein–Protein Crosslinking in Food: Methods, Consequences, Applications. Trends Food Sci. Technol. 2002, 13, 391–399. [Google Scholar] [CrossRef]
  43. Pellegrino, L.; van Boekel, M.A.J.S.; Gruppen, H.; Resmini, P.; Pagani, M.A. Heat-Induced Aggregation and Covalent Linkages in β-Casein Model Systems. Int. Dairy J. 1999, 9, 255–260. [Google Scholar] [CrossRef]
  44. Lauber, S.; Klostermeyer, H.; Henle, T. On the Influence of Non-Enzymatic Crosslinking of Caseins on the Gel Strength of Yoghurt. Nahrung/Food 2001, 45, 215–217. [Google Scholar] [CrossRef]
  45. Schwarzenbolz, U.; Henle, T. Non-Enzymatic Modifications of Proteins under High-Pressure Treatment. High Press. Res. 2010, 30, 458–465. [Google Scholar] [CrossRef]
  46. Al-Saadi, J.M.S.; Easa, A.M.; Deeth, H.C. Effect of Lactose on Cross-Linking of Milk Proteins during Heat Treatments. Int. J. Dairy Technol. 2013, 66, 1–6. [Google Scholar] [CrossRef]
  47. Bulca, S.; Dumpler, J.; Kulozik, U. Kinetic Description of Heat-Induced Cross-Linking Reactions of Whey Protein-Free Casein Solutions. Int. J. Dairy Technol. 2016, 69, 489–496. [Google Scholar] [CrossRef]
  48. Moeckel, U.; Duerasch, A.; Weiz, A.; Ruck, M.; Henle, T. Glycation Reactions of Casein Micelles. J. Agric. Food Chem. 2016, 64, 2953–2961. [Google Scholar] [CrossRef] [PubMed]
  49. Friedman, M. Chemistry, Biochemistry, Nutrition, and Microbiology of Lysinoalanine, Lanthionine, and Histidinoalanine in Food and Other Proteins. J. Agric. Food Chem. 1999, 47, 1295–1319. [Google Scholar] [CrossRef] [PubMed]
  50. Singh, H. Modification of Food Proteins by Covalent Crosslinking. Trends Food Sci. Technol. 1991, 2, 196–200. [Google Scholar] [CrossRef]
  51. Famelart, M.-H.; Le, N.H.T.; Croguennec, T.; Rousseau, F. Are Disulphide Bonds Formed during Acid Gelation of Preheated Milk? Int. J. Food Sci. Technol. 2013, 48, 1940–1948. [Google Scholar] [CrossRef]
  52. Koch, L.; Hummel, L.; Schuchmann, H.P.; Emin, M.A. Influence of Defined Shear Rates on Structural Changes and Functional Properties of Highly Concentrated Whey Protein Isolate-Citrus Pectin Blends at Elevated Temperatures. Food Biophys. 2017, 12, 309–322. [Google Scholar] [CrossRef]
  53. Lauber, S.; Henle, T.; Klostermeyer, H. Relationship between the Crosslinking of Caseins by Transglutaminase and the Gel Strength of Yoghurt. Eur. Food Res. Technol. 2000, 210, 305–309. [Google Scholar] [CrossRef]
  54. Menéndez, O.; Schwarzenbolz, U.; Rohm, H.; Henle, T. Casein Gelation under Simultaneous Action of Transglutaminase and Glucono-δ-Lactone. Nahrung/Food 2004, 48, 165–168. [Google Scholar] [CrossRef] [PubMed]
  55. Casanova, F.; Nogueira Silva, N.F.; Gaucheron, F.; Nogueira, M.H.; Teixeira, A.V.N.C.; Perrone, I.T.; Alves, M.P.; Fidelis, P.C.; de Carvalho, A.F. Stability of Casein Micelles Cross-Linked with Genipin: A Physicochemical Study as a Function of pH. Int. Dairy J. 2017, 68, 70–74. [Google Scholar] [CrossRef]
  56. Chou, W.-L.; Lin, L.T.-W.; Shih, Y.-Y.; Li, C.-T.; Kao, C.-Y.; Tsai, W.-B.; Wang, S.S.-S. Aggregation Behavior of Casein is Correlated With the Type of Glycation-Inducing Agent. J. Taiwan Inst. Chem. Eng. 2014, 45, 393–403. [Google Scholar] [CrossRef]
  57. Ghosh, A.; Ali, M.A.; Dias, G.J. Effect of Cross-Linking on Microstructure and Physical Performance of Casein Protein. Biomacromolecules 2009, 10, 1681–1688. [Google Scholar] [CrossRef] [PubMed]
  58. Le, T.T.; Holland, J.W.; Bhandari, B.; Alewood, P.F.; Deeth, H.C. Direct Evidence for the Role of Maillard Reaction Products in Protein Cross-Linking in Milk Powder during Storage. Int. Dairy J. 2013, 31, 83–91. [Google Scholar] [CrossRef]
  59. Nogueira Silva, N.F.; Saint-Jalmes, A.; de Carvalho, A.F.; Gaucheron, F. Development of Casein Microgels from Cross-Linking of Casein Micelles by Genipin. Langmuir 2014, 30, 10167–10175. [Google Scholar] [CrossRef] [PubMed]
  60. Silva, C.J.S.M.; Sousa, F.; Gübitz, G.; Cavaco-Paulo, A. Chemical Modifications on Proteins Using Glutaraldehyde. Food Technol. Biotechnol. 2004, 42, 51–56. [Google Scholar]
  61. Westermeier, R. Electrophoresis in Gels. In Protein Purification: Principles, High Resolution Methods, and Applications, 3rd ed.; Janson, J.-C., Ed.; John Wiley & Sons, Inc.: Hoboken, NJ, USA, 2011; pp. 365–377. [Google Scholar]
  62. O’Mahony, J.A.; Ardö, Y.; McSweeney, P.L.H. Analysis, Electrophoresis. In Encyclopedia of Dairy Sciences; Roginski, H., Fuquay, J.W., Fox, P.F., Eds.; Academic Press: New York, 2002; pp. 67–74. [Google Scholar]
  63. Laemmli, U.K. Cleavage of Structural Proteins during the Assembly of the Head of Bacteriophage T4. Nature 1970, 227, 680–685. [Google Scholar] [CrossRef] [PubMed]
  64. Chakraborty, A.; Basak, S. Effect of Surfactants on Casein Structure: A Spectroscopic Study. Colloids Surf. B Biointerfaces 2008, 63, 83–90. [Google Scholar] [CrossRef] [PubMed]
  65. Bjellqvist, B.; Ek, K.; Giorgio Righetti, P.; Gianazza, E.; Görg, A.; Westermeier, R.; Postel, W. Isoelectric Focusing in Immobilized pH Gradients: Principle, Methodology and Some Applications. J. Biochem. Biophys. Meth. 1982, 6, 317–339. [Google Scholar] [CrossRef]
  66. Righetti, P.G.; Fasoli, E.; Righetti, S.C. Conventional Isoelectric Focusing in Gel Slabs and Capillaries and Immobilized pH Gradients. In Protein Purification: Principles, High Resolution Methods, and Applications; Janson, J.-C., Ed.; John Wiley & Sons, Inc.: Hoboken, NJ, USA, 2011; pp. 365–377. [Google Scholar]
  67. Westermeier, R.; Görg, A. Two-Dimensional Electrophoresis in Proteomics. In Protein Purification: Principles, High Resolution Methods, and Applications, 3rd ed.; Janson, J.-C., Ed.; John Wiley & Sons, Inc.: Hoboken, NJ, USA, 2011; pp. 411–439. [Google Scholar]
  68. O’Farrell, P.H. High Resolution Two-Dimensional Electrophoresis of Proteins. J. Biol. Chem. 1975, 250, 4007–4021. [Google Scholar] [PubMed]
  69. O’Farrell, P.Z.; Goodman, H.M.; O’Farrell, P.H. High Resolution Two-Dimensional Electrophoresis of Basic as well as Acidic Proteins. Cell 1977, 12, 1133–1142. [Google Scholar] [CrossRef]
  70. Blomberg, A.; Blomberg, L.; Norbeck, J.; Fey, S.J.; Larsen, P.M.; Larsen, M.; Roepstorff, P.; Degand, H.; Boutry, M.; Posch, A.; et al. Interlaboratory Reproducibility of Yeast Protein Patterns Analyzed by Immobilized pH Gradient Two-Dimensional Gel Electrophoresis. Electrophoresis 1995, 16, 1935–1945. [Google Scholar] [CrossRef] [PubMed]
  71. Görg, A.; Obermaier, C.; Boguth, G.; Harder, A.; Scheibe, B.; Wildgruber, R.; Weiss, W. The Current State of Two-Dimensional Electrophoresis with Immobilized pH Gradients. Electrophoresis 2000, 21, 1037–1053. [Google Scholar] [CrossRef]
  72. O’Donnell, R.; Holland, J.W.; Deeth, H.C.; Alewood, P. Milk Proteomics. Int. Dairy J. 2004, 14, 1013–1023. [Google Scholar] [CrossRef]
  73. Abd El-Salam, M.H. Application of Proteomics to the Areas of Milk Production, Processing and Quality Control—A Review. Int. J. Dairy Technol. 2014, 67, 153–166. [Google Scholar] [CrossRef]
  74. Le, T.T.; Deeth, H.C.; Larsen, L.B. Proteomics of Major Bovine Milk Proteins: Novel Insights. Int. Dairy J. 2017, 67, 2–15. [Google Scholar] [CrossRef]
  75. O’Sullivan, M.M.; Kelly, A.L.; Fox, P.F. Influence of Transglutaminase Treatment on Some Physico-Chemical Properties of Milk. J. Dairy Res. 2002, 69, 433–442. [Google Scholar] [CrossRef] [PubMed]
  76. Flanagan, J.; Gunning, Y.; FitzGerald, R.J. Effect of Cross-Linking with Transglutaminase on the Heat Stability and Some Functional Characteristics of Sodium Caseinate. Food Res. Int. 2003, 36, 267–274. [Google Scholar] [CrossRef]
  77. Ercili Cura, D.; Lille, M.; Partanen, R.; Kruus, K.; Buchert, J.; Lantto, R. Effect of Trichoderma reesei Tyrosinase on Rheology and Microstructure of Acidified Milk Gels. Int. Dairy J. 2010, 20, 830–837. [Google Scholar] [CrossRef]
  78. Jaros, D.; Jacob, M.; Otto, C.; Rohm, H. Excessive Cross-Linking of Caseins by Microbial Transglutaminase and Its Impact on Physical Properties of Acidified Milk Gels. Int. Dairy J. 2010, 20, 321–327. [Google Scholar] [CrossRef]
  79. Creamer, L.K.; Richardson, T. Anomalous Behavior of Bovine αs1- and β-Caseins on Gel Electrophoresis in Sodium Dodecyl Sulfate Buffers. Arch. Biochem. Biophys. 1984, 234, 476–486. [Google Scholar] [CrossRef]
  80. Macierzanka, A.; Bordron, F.; Rigby, N.M.; Mills, E.N.C.; Lille, M.; Poutanen, K.; Mackie, A.R. Transglutaminase Cross-Linking Kinetics of Sodium Caseinate is Changed After Emulsification. Food Hydrocoll. 2011, 25, 843–850. [Google Scholar] [CrossRef]
  81. Raak, N.; Rohm, H.; Jaros, D. Enzymatic Cross-Linking of Casein Facilitates Gel Structure Weakening Induced by Overacidification. Food Biophys. 2017, 12, 261–268. [Google Scholar] [CrossRef]
  82. Liu, M.; Damodaran, S. Effect of Transglutaminase-Catalyzed Polymerization of β-Casein on Its Emulsifying Properties. J. Agric. Food Chem. 1999, 47, 1514–1519. [Google Scholar] [CrossRef] [PubMed]
  83. Lauber, S.; Noack, I.; Klostermeyer, H.; Henle, T. Oligomerization of β-Lactoglobulin by Microbial Transglutaminase during High Pressure Treatment. Eur. Food Res. Technol. 2001, 213, 246–247. [Google Scholar] [CrossRef]
  84. Truong, V.-D.; Clare, D.A.; Catignani, G.L.; Swaisgood, H.E. Cross-Linking and Rheological Changes of Whey Proteins Treated with Microbial Transglutaminase. J. Agric. Food Chem. 2004, 52, 1170–1176. [Google Scholar] [CrossRef] [PubMed]
  85. Steffensen, C.L.; Andersen, M.L.; Degn, P.E.; Nielsen, J.H. Cross-Linking Proteins by Laccase-Catalyzed Oxidation: Importance Relative to Other Modifications. J. Agric. Food Chem. 2008, 56, 12002–12010. [Google Scholar] [CrossRef] [PubMed]
  86. Heijnis, W.H.; Wierenga, P.A.; van Berkel, W.J.H.; Gruppen, H. Directing the Oligomer Size Distribution of Peroxidase-Mediated Cross-Linked Bovine α-Lactalbumin. J. Agric. Food Chem. 2010, 58, 5692–5697. [Google Scholar] [CrossRef] [PubMed]
  87. Ercili-Cura, D.; Partanen, R.; Husband, F.; Ridout, M.; Macierzanka, A.; Lille, M.; Boer, H.; Lantto, R.; Buchert, J.; Mackie, A.R. Enzymatic Cross-Linking of β-Lactoglobulin in Solution and at Air–Water Interface: Structural Constraints. Food Hydrocoll. 2012, 28, 1–9. [Google Scholar] [CrossRef]
  88. Lauber, S.; Krause, I.; Klostermeyer, H.; Henle, T. Microbial Transglutaminase Crosslinks β-Casein and β-Lactoglobulin to Heterologous Oligomers under High Pressure. Eur. Food Res. Technol. 2003, 216, 15–17. [Google Scholar] [CrossRef]
  89. Tang, C.; Yang, X.-Q.; Chen, Z.; Wu, H.; Peng, Z.-Y. Physicochemical and Structural Characteristics of Sodium Caseinate Biopolymers Induced by Microbial Transglutaminase. J. Food Biochem. 2005, 29, 402–421. [Google Scholar] [CrossRef]
  90. Ozer, B.; Avni Kirmaci, H.; Oztekin, S.; Hayaloglu, A.; Atamer, M. Incorporation of Microbial Transglutaminase into Non-Fat Yogurt Production. Int. Dairy J. 2007, 17, 199–207. [Google Scholar] [CrossRef]
  91. Monogioudi, E.; Creusot, N.; Kruus, K.; Gruppen, H.; Buchert, J.; Mattinen, M.-L. Cross-Linking of β-Casein by Trichoderma reesei Tyrosinase and Streptoverticillium mobaraense Transglutaminase Followed by SEC–MALLS. Food Hydrocoll. 2009, 23, 2008–2015. [Google Scholar] [CrossRef]
  92. Smiddy, M.A.; Martin, J.-E.G.H.; Kelly, A.L.; de Kruif, C.G.; Huppertz, T. Stability of Casein Micelles Cross-Linked by Transglutaminase. J. Dairy Sci. 2006, 89, 1906–1914. [Google Scholar] [CrossRef]
  93. Moon, J.-H.; Hong, Y.-H.; Huppertz, T.; Fox, P.F.; Kelly, A.L. Properties of Casein Micelles Cross-Linked by Transglutaminase. Int. J. Dairy Technol. 2009, 62, 27–32. [Google Scholar] [CrossRef]
  94. Raak, N. Aggregatgröße und Polymerisierungsgrad Enzymatisch Verknüpfter Caseine in Säureinduzierten Gelen (in German). Diploma Thesis, Technische Universität Dresden, Dresden, Germany, 30 November 2013. [Google Scholar]
  95. Ikura, K.; Kometani, T.; Yoshikawa, M.; Sasaki, R.; Chiba, H. Crosslinking of Casein Components by Transglutaminase. Agric. Biol. Chem. 1980, 44, 1567–1573. [Google Scholar]
  96. De Jong, G.A.H.; Wijngaards, G.; Koppelman, S.J. Transglutaminase Inhibitor from Milk. J. Food Sci. 2003, 68, 820–825. [Google Scholar] [CrossRef]
  97. Aaltonen, T.; Huumonen, I.; Myllärinen, P. Controlled Transglutaminase Treatment in Edam Cheese-Making. Int. Dairy J. 2014, 38, 179–182. [Google Scholar] [CrossRef]
  98. Struch, M.; Krahe, N.-K.; Linke, D.; Mokoonlall, A.; Hinrichs, J.; Berger, R.G. Dose Dependent Effects of a Milk Ion Tolerant Laccase on Yoghurt Gel Structure. LWT-Food Sci. Technol. 2016, 65, 1144–1152. [Google Scholar] [CrossRef]
  99. Struch, M.; Linke, D.; Mokoonlall, A.; Hinrichs, J.; Berger, R.G. Laccase-Catalysed Cross-Linking of a Yoghurt-Like Model System Made from Skimmed Milk With Added Food-Grade Mediators. Int. Dairy J. 2015, 49, 89–94. [Google Scholar] [CrossRef]
  100. Ercili Cura, D.; Lantto, R.; Lille, M.; Andberg, M.; Kruus, K.; Buchert, J. Laccase-Aided Protein Modification: Effects on the Structural Properties of Acidified Sodium Caseinate Gels. Int. Dairy J. 2009, 19, 737–745. [Google Scholar] [CrossRef]
  101. Dinnella, C.; Gargaro, M.T.; Rossano, R.; Monteleone, E. Spectrophotometric Assay Using o-Phtaldialdehyde for the Determination of Transglutaminase Activity on Casein. Food Chem. 2002, 78, 363–368. [Google Scholar] [CrossRef]
  102. Broyard, C.; Gaucheron, F. Modifications of Structures and Functions of Caseins: A Scientific and Technological Challenge. Dairy Sci. Technol. 2015, 95, 831–862. [Google Scholar] [CrossRef]
  103. Sharma, R.; Lorenzen, P.C.; Qvist, K.B. Influence of Transglutaminase Treatment of Skim Milk on the Formation of ε-(γ-Glutamyl)Lysine and the Susceptibility of Individual Proteins Towards Crosslinking. Int. Dairy J. 2001, 11, 785–793. [Google Scholar] [CrossRef]
  104. Hinz, K.; Huppertz, T.; Kulozik, U.; Kelly, A.L. Influence of Enzymatic Cross-Linking on Milk Fat Globules and Emulsifying Properties of Milk Proteins. Int. Dairy J. 2007, 17, 289–293. [Google Scholar] [CrossRef]
  105. Huppertz, T.; de Kruif, C.G. Ethanol Stability of Casein Micelles Cross-Linked with Transglutaminase. Int. Dairy J. 2007, 17, 436–441. [Google Scholar] [CrossRef]
  106. Huppertz, T.; de Kruif, C.G. Rennet-Induced Coagulation of Enzymatically Cross-Linked Casein Micelles. Int. Dairy J. 2007, 17, 442–447. [Google Scholar] [CrossRef]
  107. Ardelean, A.I.; Otto, C.; Jaros, D.; Rohm, H. Transglutaminase Treatment to Improve Physical Properties of Acid Gels from Enriched Goat Milk. Small Ruminant Res. 2012, 106, 47–53. [Google Scholar] [CrossRef]
  108. Ardelean, A.I.; Jaros, D.; Rohm, H. Influence of Microbial Transglutaminase Cross-Linking on Gelation Kinetics and Texture of Acid Gels Made from Whole Goats and Cows Milk. Dairy Sci. Technol. 2013, 93, 63–71. [Google Scholar] [CrossRef]
  109. Rodriguez-Nogales, J.M. Enzymatic Cross-Linking of Ewe’s Milk Proteins by Transglutaminase. Eur. Food Res. Technol. 2005, 221, 692–699. [Google Scholar] [CrossRef]
  110. Rodriguez-Nogales, J.M. Effect of Preheat Treatment on the Transglutaminase-Catalyzed Cross-Linking of Goat Milk Proteins. Process Biochem. 2006, 41, 430–437. [Google Scholar] [CrossRef]
  111. Rodriguez-Nogales, J.M. Enhancement of Transglutaminase-Induced Protein Cross-Linking by Preheat Treatment of Cows’ Milk: A Statistical Approach. Int. Dairy J. 2006, 16, 26–32. [Google Scholar] [CrossRef]
  112. Feng, P.; Fuerer, C.; McMahon, A. Quantification of Whey Protein Content in Infant Formulas by Sodium Dodecyl Sulfate-Capillary Gel Electrophoresis (SDS-CGE): Single-Laboratory Validation, First Action 2016.15. J. AOAC Int. 2017, 100, 1177–1180. [Google Scholar] [CrossRef] [PubMed]
  113. Lilla, S.; Mamone, G.; Nicolai, M.A.; Chianese, L.; Picariello, G.; Caira, S.; Addeo, F. Structural Characterization of Transglutaminase-Catalyzed Casein Cross-Linking. J. Chromatogr. Sep. Tech. 2012, 3, 1000122. [Google Scholar] [CrossRef]
  114. Zacharius, R.M.; Zell, T.E.; Morrison, J.H.; Woodlock, J.J. Glycoprotein Staining Following Electrophoresis on Acrylamide Gels. Anal. Biochem. 1969, 30, 148–152. [Google Scholar] [CrossRef]
  115. Selinheimo, E.; Lampila, P.; Mattinen, M.-L.; Buchert, J. Formation of Protein−Oligosaccharide Conjugates by Laccase and Tyrosinase. J. Agric. Food Chem. 2008, 56, 3118–3128. [Google Scholar] [CrossRef] [PubMed]
  116. O’Regan, J.; Mulvihill, D.M. Preparation, Characterisation and Selected Functional Properties of Sodium Caseinate–Maltodextrin Conjugates. Food Chem. 2009, 115, 1257–1267. [Google Scholar] [CrossRef]
  117. Song, C.-L.; Zhao, X.-H. Rheological, Gelling and Emulsifying Properties of a Glycosylated and Cross-Linked Caseinate Generated by Transglutaminase. Int. J. Food Sci. Technol. 2013, 48, 2595–2602. [Google Scholar] [CrossRef]
  118. Zhang, S.; Gong, Y.; Khanal, S.; Lu, Y.; Lucey, J.A. Properties of Acid Gels Made From Sodium Caseinate-Maltodextrin Conjugates Prepared by a Wet Heating Method. J. Dairy Sci. 2017, 100, 8744–8753. [Google Scholar] [CrossRef] [PubMed]
  119. Partanen, R.; Paananen, A.; Forssell, P.; Linder, M.B.; Lille, M.; Buchert, J.; Lantto, R. Effect of Transglutaminase-Induced Cross-Linking of Sodium Caseinate on the Properties of Equilibrated Interfaces and Foams. Colloids Surf. A Physicochem. Eng. Asp. 2009, 344, 79–85. [Google Scholar] [CrossRef]
  120. Partanen, R.; Forssell, P.; Mackie, A.; Blomberg, E. Interfacial Cross-Linking of β-Casein Changes the Structure of the Adsorbed Layer. Food Hydrocoll. 2013, 32, 271–277. [Google Scholar] [CrossRef]
  121. Myllärinen, P.; Buchert, J.; Autio, K. Effect of Transglutaminase on Rheological Properties and Microstructure of Chemically Acidified Sodium Caseinate Gels. Int. Dairy J. 2007, 17, 800–807. [Google Scholar] [CrossRef]
  122. Partanen, R.; Autio, K.; Myllärinen, P.; Lille, M.; Buchert, J.; Forssell, P. Effect of Transglutaminase on Structure and Syneresis of Neutral and Acidic Sodium Caseinate Gels. Int. Dairy J. 2008, 18, 414–421. [Google Scholar] [CrossRef]
  123. Chevalier, F.; Hirtz, C.; Sommerer, N.; Kelly, A.L. Use of Reducing/Nonreducing Two-Dimensional Electrophoresis for the Study of Disulfide-Mediated Interactions between Proteins in Raw and Heated Bovine Milk. J. Agric. Food Chem. 2009, 57, 5948–5955. [Google Scholar] [CrossRef] [PubMed]
  124. Holland, J.W.; Gupta, R.; Deeth, H.C.; Alewood, P.F. Proteomic Analysis of Temperature-Dependent Changes in Stored UHT Milk. J. Agric. Food Chem. 2011, 59, 1837–1846. [Google Scholar] [CrossRef] [PubMed]
  125. Le, T.T.; Bhandari, B.; Holland, J.W.; Deeth, H.C. Maillard Reaction and Protein Cross-Linking in Relation to the Solubility of Milk Powders. J. Agric. Food Chem. 2011, 59, 12473–12479. [Google Scholar] [CrossRef] [PubMed]
  126. Hsieh, J.F.; Pan, P.H. Proteomic Profiling of Microbial Transglutaminase-Induced Polymerization of Milk Proteins. J. Dairy Sci. 2012, 95, 580–589. [Google Scholar] [CrossRef] [PubMed]
  127. Chen, C.-C.; Hsieh, J.-F. Microwave-Assisted Cross-Linking of Milk Proteins Induced by Microbial Transglutaminase. Sci. Rep. 2016, 6, 39040. [Google Scholar] [CrossRef] [PubMed]
  128. Hagel, L. Gel Filtration: Size Exclusion Chromatography. In Protein Purification: Principles, High Resolution Methods, and Applications, 3rd ed.; Janson, J.-C., Ed.; John Wiley & Sons, Inc.: Hoboken, NJ, USA, 2011; pp. 51–91. [Google Scholar]
  129. Striegel, A.M.; Yau, W.W.; Kirkland, J.J.; Bly, D.D. Modern Size-Exclusion Liquid Chromatography: Practice of Gel Permeation and Gel Filtration Chromatography, 2nd ed.; Wiley: Hoboken, NJ, USA, 2009. [Google Scholar]
  130. Pasch, H.; Trathnigg, B. Multidimensional HPLC of Polymers; Springer: Berlin, Germany, 2013. [Google Scholar]
  131. Hiller, B.; Lorenzen, P.-C. Effect of Buffer Systems on the Extent of Enzymatic Oligomerisation of Milk Proteins. LWT-Food Sci. Technol. 2008, 41, 1140–1144. [Google Scholar] [CrossRef]
  132. Boeriu, C.G.; Oudgenoeg, G.; Spekking, W.T.J.; Berendsen, L.B.J.M.; Vancon, L.; Boumans, H.; Gruppen, H.; van Berkel, W.J.H.; Laane, C.; Voragen, A.G.J. Horseradish Peroxidase-Catalyzed Cross-Linking of Feruloylated Arabinoxylans with β-Casein. J. Agric. Food Chem. 2004, 52, 6633–6639. [Google Scholar] [CrossRef] [PubMed]
  133. Corzo-Martínez, M.; Moreno, F.J.; Villamiel, M.; Harte, F.M. Characterization and Improvement of Rheological Properties of Sodium Caseinate Glycated with Galactose, Lactose and Dextran. Food Hydrocoll. 2010, 24, 88–97. [Google Scholar] [CrossRef] [Green Version]
  134. Lauber, S.; Noack, I.; Klostermeyer, H.; Henle, T. Stability of Microbial Transglutaminase to High Pressure Treatment. Eur. Food Res. Technol. 2001, 213, 273–276. [Google Scholar] [CrossRef]
  135. Bönisch, M.P.; Lauber, S.; Kulozik, U. Effect of Ultra-High Temperature Treatment on the Enzymatic Cross-linking of Micellar Casein and Sodium Caseinate by Transglutaminase. J. Food Sci. 2004, 69, E398–E404. [Google Scholar] [CrossRef]
  136. Bönisch, M.P.; Tolkach, A.; Kulozik, U. Inactivation of an Indigenous Transglutaminase Inhibitor in Milk Serum by Means of UHT-Treatment and Membrane Separation Techniques. Int. Dairy J. 2006, 16, 669–678. [Google Scholar] [CrossRef]
  137. Bönisch, M.P.; Lauber, S.; Kulozik, U. Improvement of Enzymatic Cross-Linking of Casein Micelles with Transglutaminase by Glutathione Addition. Int. Dairy J. 2007, 17, 3–11. [Google Scholar] [CrossRef]
  138. Bönisch, M.P.; Huss, M.; Lauber, S.; Kulozik, U. Yoghurt Gel Formation by Means of Enzymatic Protein Cross-Linking during Microbial Fermentation. Food Hydrocoll. 2007, 21, 585–595. [Google Scholar] [CrossRef]
  139. Bönisch, M.P.; Huss, M.; Weitl, K.; Kulozik, U. Transglutaminase Cross-Linking of Milk Proteins and Impact on Yoghurt Gel Properties. Int. Dairy J. 2007, 17, 1360–1371. [Google Scholar] [CrossRef]
  140. Menéndez, O.; Schwarzenbolz, U.; Partschefeld, C.; Henle, T. Affinity of Microbial Transglutaminase to αs1-, β-, and Acid Casein under Atmospheric and High Pressure Conditions. J. Agric. Food Chem. 2009, 57, 4177–4184. [Google Scholar] [CrossRef] [PubMed]
  141. Hiller, B.; Lorenzen, P.C. Effect of Phosphatase/Transglutaminase Treatment on Molar Mass Distribution and Techno-Functional Properties of Sodium Caseinate. LWT-Food Sci. Technol. 2009, 42, 87–92. [Google Scholar] [CrossRef]
  142. Hiller, B.; Lorenzen, P.C. Functional Properties of Milk Proteins as Affected by Enzymatic Oligomerisation. Food Res. Int. 2009, 42, 899–908. [Google Scholar] [CrossRef]
  143. Partschefeld, C.; Schreiner, J.; Schwarzenbolz, U.; Henle, T. Studies on Enzymatic Crosslinking of Casein Micelles. Czech J. Food Sci. 2009, 27, 99–101. [Google Scholar] [CrossRef]
  144. Guyot, C.; Kulozik, U. Effect of Transglutaminase-Treated Milk Powders on the Properties of Skim Milk Yoghurt. Int. Dairy J. 2011, 21, 628–635. [Google Scholar] [CrossRef]
  145. Özer, B.; Guyot, C.; Kulozik, U. Simultaneous Use of Transglutaminase and Rennet in Milk Coagulation: Effect of Initial Milk pH and Renneting Temperature. Int. Dairy J. 2012, 24, 1–7. [Google Scholar] [CrossRef]
  146. Rohm, H.; Ullrich, F.; Schmidt, C.; Löbner, J.; Jaros, D. Gelation of Cross-Linked Casein under Small and Large Shear Strain. J. Texture Stud. 2014, 45, 130–137. [Google Scholar] [CrossRef]
  147. Kizzie-Hayford, N.; Jaros, D.; Rohm, H. Enrichment of Tiger Nut Milk with Microbial Transglutaminase Cross-Linked Protein Improves the Physico-Chemical Properties of the Fermented System. LWT-Food Sci. Technol. 2017, 81, 226–232. [Google Scholar] [CrossRef]
  148. Raak, N.; Schöne, C.; Rohm, H.; Jaros, D. Acid-Induced Gelation of Enzymatically Cross-Linked Caseinate in Different Ionic Milieus. Food Hydrocoll. 2018. [Google Scholar] [CrossRef]
  149. Lucey, J.A.; Srinivasan, M.; Singh, H.; Munro, P.A. Characterization of Commercial and Experimental Sodium Caseinates by Multiangle Laser Light Scattering and Size-Exclusion Chromatography. J. Agric. Food Chem. 2000, 48, 1610–1616. [Google Scholar] [CrossRef] [PubMed]
  150. Siegl, T. Studien zur Quervernetzung von Milchproteinen und Zur Bildung Individueller Crosslink-Aminosäuren. Ph.D. Thesis, Technische Universität Dresden, Dresden, Germany, 16 March 2003. (In German). [Google Scholar]
  151. Johnson, K.A.A. Century of Enzyme Kinetic Analysis, 1913 to 2013. FEBS Lett. 2013, 587, 2753–2766. [Google Scholar] [CrossRef] [PubMed]
  152. Holt, C. Casein Micelle Substructure and Calcium Phosphate Interactions Studied by Sephacryl Column Chromatography. J. Dairy Sci. 1998, 81, 2994–3003. [Google Scholar] [CrossRef]
  153. Monogioudi, E.; Faccio, G.; Lille, M.; Poutanen, K.; Buchert, J.; Mattinen, M.-L. Effect of Enzymatic Cross-Linking of β-Casein on Proteolysis by Pepsin. Food Hydrocoll. 2011, 25, 71–81. [Google Scholar] [CrossRef]
  154. Hellwig, M.; Löbner, J.; Schneider, A.; Schwarzenbolz, U.; Henle, T. Release of Protein-Bound N-ε-(γ-glutamyl)-Lysine during Simulated Gastrointestinal Digestion. Czech J. Food Sci. 2009, 27, 153–155. [Google Scholar] [CrossRef]
  155. Hellwig, M.; Matthes, R.; Peto, A.; Löbner, J.; Henle, T. N-ε-Fructosyllysine and N-ε-Carboxymethyllysine, but not Lysinoalanine, are Available for Absorption after Simulated Gastrointestinal Digestion. Amino Acids 2014, 46, 289–299. [Google Scholar] [CrossRef] [PubMed]
  156. Giddings, J.; Yang, F.; Myers, M. Flow-Field-Flow Fractionation: A Versatile New Separation Method. Science 1976, 193, 1244–1245. [Google Scholar] [CrossRef] [PubMed]
  157. Messaud, F.A.; Sanderson, R.D.; Runyon, J.R.; Otte, T.; Pasch, H.; Williams, S.K.R. An Overview on Field-Flow Fractionation Techniques and Their Applications in the Separation and Characterization of Polymers. Prog. Polym. Sci. 2009, 34, 351–368. [Google Scholar] [CrossRef]
  158. Malik, M.I.; Pasch, H. Field-Flow Fractionation: New and Exciting Perspectives in Polymer Analysis. Prog. Polym. Sci. 2016, 63, 42–85. [Google Scholar] [CrossRef]
  159. Ratanathanawongs Williams, S.K.; Lee, D. Field-Flow Fractionation of Proteins, Polysaccharides, Synthetic Polymers, and Supramolecular Assemblies. J. Sep. Sci. 2006, 29, 1720–1732. [Google Scholar] [CrossRef]
  160. Qureshi, R.N.; Kok, W.T. Application of Flow Field-Flow Fractionation for the Characterization of Macromolecules of Biological Interest: A Review. Anal. Bioanal. Chem. 2011, 399, 1401–1411. [Google Scholar] [CrossRef] [PubMed]
  161. Baalousha, M.; Stolpe, B.; Lead, J.R. Flow Field-Flow Fractionation for the Analysis and Characterization of Natural Colloids and Manufactured Nanoparticles in Environmental Systems: A Critical Review. J. Chromatogr. A 2011, 1218, 4078–4103. [Google Scholar] [CrossRef] [PubMed]
  162. Runyon, J.R.; Ulmius, M.; Nilsson, L.A. Perspective on the Characterization of Colloids and Macromolecules Using Asymmetrical Flow Field-Flow Fractionation. Colloids Surf. A Physicochem. Eng. Asp. 2014, 442, 25–33. [Google Scholar] [CrossRef]
  163. Von der Kammer, F.; Legros, S.; Hofmann, T.; Larsen, E.H.; Loeschner, K. Separation and Characterization of Nanoparticles in Complex Food and Environmental Samples by Field-Flow Fractionation. TrAC Trend. Anal. Chem. 2011, 30, 425–436. [Google Scholar] [CrossRef]
  164. Roda, B.; Zattoni, A.; Reschiglian, P.; Moon, M.H.; Mirasoli, M.; Michelini, E.; Roda, A. Field-Flow Fractionation in Bioanalysis: A Review of Recent Trends. Anal. Chim. Acta 2009, 635, 132–143. [Google Scholar] [CrossRef] [PubMed]
  165. Nilsson, L. Separation and Characterization of Food Macromolecules Using Field-Flow Fractionation: A Review. Food Hydrocoll. 2013, 30, 1–11. [Google Scholar] [CrossRef]
  166. Wahlund, K.G.; Giddings, J.C. Properties of an Asymmetrical Flow Field-Flow Fractionation Channel Having One Permeable Wall. Anal. Chem. 1987, 59, 1332–1339. [Google Scholar] [CrossRef] [PubMed]
  167. Perez-Rea, D.; Zielke, C.; Nilsson, L. Co-Elution Effects Can Influence Molar Mass Determination of Large Macromolecules with Asymmetric Flow Field-Flow Fractionation Coupled to Multiangle Light Scattering. J. Chromatogr. A 2017, 1506, 138–141. [Google Scholar] [CrossRef] [PubMed]
  168. Einstein, A. Über die von der molekularkinatischen Theorie der Wärma geforderte Bewegung von in ruhenden Flussigkeiten suspendierten Teilchen. Ann. Phys. 1905, 17, 549–560. (In German) [Google Scholar] [CrossRef]
  169. Wittgren, B.; Wahlund, K.-G. Fast Molecular Mass and Size Characterization of Polysaccharides Using Asymmetrical Flow Field-Flow Fractionation-Multiangle Light Scattering. J. Chromatogr. A 1997, 760, 205–218. [Google Scholar] [CrossRef]
  170. Nilsson, L.; Leeman, M.; Wahlund, K.-G.; Bergenståhl, B. Mechanical Degradation and Changes in Conformation of Hydrophobically Modified Starch. Biomacromolecules 2006, 7, 2671–2679. [Google Scholar] [CrossRef] [PubMed]
  171. Håkansson, A.; Magnusson, E.; Bergenståhl, B.; Nilsson, L. Hydrodynamic Radius Determination with Asymmetrical Flow Field-Flow Fractionation Using Decaying Cross-Flows. Part I. A Theoretical Approach. J. Chromatogr. A 2012, 1253, 120–126. [Google Scholar] [CrossRef] [PubMed]
  172. Magnusson, E.; Håkansson, A.; Janiak, J.; Bergenståhl, B.; Nilsson, L. Hydrodynamic Radius Determination with Asymmetrical Flow Field-Flow Fractionation Using Decaying Cross-Flows. Part II. Experimental Evaluation. J. Chromatogr. A 2012, 1253, 127–133. [Google Scholar] [CrossRef] [PubMed]
  173. Leeman, M.; Wahlund, K.G.; Wittgren, B. Programmed Cross-Flow Asymmetrical Flow Field-Flow Fractionation for the Size Separation of Pullulans and Hydroxypropyl Cellulose. J. Chromatogr. A 2006, 1134, 236–245. [Google Scholar] [CrossRef] [PubMed]
  174. Ariza, M.; Benavente, J. Streaming Potential along the Surface of Polysulfone Membranes: A Comparative Study between Two Different Experimental Systems and Determination of Electrokinetic and Adsorption Parameters. J. Membrane Sci. 2001, 190, 119–132. [Google Scholar] [CrossRef]
  175. Pontié, M. Effect of Aging on UF Membranes by a Streaming Potential (SP) Method. J. Membrane Sci. 1999, 154, 213–220. [Google Scholar] [CrossRef]
  176. Liu, J.; Zhu, Q.; Shire, S.J.; Demeule, B. Assessing and Improving Asymmetric Flow Field-Flow Fractionation of Therapeutic Proteins. In Field-Flow Fractionation in Biopolymer Analysis; Williams, S.K.R., Caldwell, K.D., Eds.; Springer: Vienna, Austria, 2012; pp. 89–101. [Google Scholar]
  177. Boye, S.; Ennen, F.; Scharfenberg, L.; Appelhans, D.; Nilsson, L.; Lederer, A. From 1D Rods to 3D Networks: A Biohybrid Topological Diversity Investigated by Asymmetrical Flow Field-Flow Fractionation. Macromolecules 2015, 48, 4607–4619. [Google Scholar] [CrossRef]
  178. Mes, E.P.C.; de Jonge, H.; Klein, T.; Welz, R.R.; Gillespie, D.T. Characterization of High Molecular Weight Polyethylenes Using High Temperature Asymmetrical Flow Field-Flow Fractionation with On-Line Infrared, Light Scattering, and Viscometry Detection. J. Chromatogr. A 2007, 1154, 319–330. [Google Scholar] [CrossRef] [PubMed]
  179. Hiller, W.; Sinha, P.; Hehn, M.; Pasch, H. Online LC-NMR—From an Expensive Toy to a Powerful Tool in Polymer Analysis. Prog. Polym. Sci. 2014, 39, 979–1016. [Google Scholar] [CrossRef]
  180. Pasch, H.; Makan, A.C.; Chirowodza, H.; Ngaza, N.; Hiller, W. Analysis of Complex Polymers by Multidetector Field-Flow Fractionation. Anal. Bioanal. Chem. 2014, 406, 1585–1596. [Google Scholar] [CrossRef] [PubMed]
  181. Li, P.; Hansen, M.; Giddings, J.C. Advances in Frit-Inlet and Frit-Outlet Flow Field-Flow Fractionation. J. Microcolumn Sep. 1998, 10, 7–18. [Google Scholar] [CrossRef]
  182. Moon, M.H.; Williams, P.S.; Kang, D.; Hwang, I. Field and Flow Programming in Frit-Inlet Asymmetrical Flow Field-Flow Fractionation. J. Chromatogr. A 2002, 955, 263–272. [Google Scholar] [CrossRef]
  183. Schimpf, M.E.; Caldwell, K.; Giddings, J.C. Field Flow Fractionation Handbook; Wiley-Interscience: New York, NY, USA, 2000. [Google Scholar]
  184. HadjSadok, A.; Pitkowski, A.; Nicolai, T.; Benyahia, L.; Moulai-Mostefa, N. Characterisation of Sodium Caseinate as a Function of Ionic Strength, pH and Temperature Using Static and Dynamic Light Scattering. Food Hydrocoll. 2008, 22, 1460–1466. [Google Scholar] [CrossRef]
  185. Huppertz, T.; Gazi, I.; Luyten, H.; Nieuwenhuijse, H.; Alting, A.; Schokker, E. Hydration of Casein Micelles and Caseinates: Implications for Casein Micelle Structure. Int. Dairy J. 2017, 74, 1–11. [Google Scholar] [CrossRef]
  186. Lorenzen, P.C.; Schlimme, E.; Roos, N. Crosslinking of Sodium Caseinate by a Microbial Transglutaminase. Nahrung/Food 1998, 42, 151–154. [Google Scholar] [CrossRef]
  187. McKinnon, I.R.; Beckett, R.; Udabage, P.; Augustin, M.A. The Use of Field Flow Fractionation in the Characterization of Casein Micelles. Int. Dairy J. 1999, 9, 391–392. [Google Scholar] [CrossRef]
  188. Glantz, M.; Håkansson, A.; Lindmark Månsson, H.; Paulsson, M.; Nilsson, L. Revealing the Size, Conformation, and Shape of Casein Micelles and Aggregates with Asymmetrical Flow Field-Flow Fractionation and Multiangle Light Scattering. Langmuir 2010, 26, 12585–12591. [Google Scholar] [CrossRef] [PubMed]
  189. Nogueira Silva, N.N.; Piot, M.; de Carvalho, A.F.; Violleau, F.; Fameau, A.-L.; Gaucheron, F. pH-Induced Demineralization of Casein Micelles Modifies Their Physico-Chemical and Foaming Properties. Food Hydrocoll. 2013, 32, 322–330. [Google Scholar] [CrossRef]
  190. Lazzaro, F.; Saint-Jalmes, A.; Violleau, F.; Lopez, C.; Gaucher-Delmas, M.; Madec, M.-N.; Beaucher, E.; Gaucheron, F. Gradual Disaggregation of the Casein Micelle Improves its Emulsifying Capacity and Decreases the Stability of Dairy Emulsions. Food Hydrocoll. 2017, 63, 189–200. [Google Scholar] [CrossRef]
  191. Guyomarc’h, F.; Violleau, F.; Surel, O.; Famelart, M.-H. Characterization of Heat-Induced Changes in Skim Milk Using Asymmetrical Flow Field-Flow Fractionation Coupled with Multiangle Laser Light Scattering. J. Agric. Food Chem. 2010, 58, 12592–12601. [Google Scholar] [CrossRef] [PubMed]
  192. Cragnell, C.; Choi, J.; Segad, M.; Lee, S.; Nilsson, L.; Skepö, M. Bovine β-Casein has a Polydisperse Distribution of Equilibrium Micelles. Food Hydrocoll. 2017, 70, 65–68. [Google Scholar] [CrossRef]
  193. Wyatt, P.J. Light Scattering and the Absolute Characterization of Macromolecules. Anal. Chim. Acta 1993, 272, 1–40. [Google Scholar] [CrossRef]
  194. Boye, S.; Polikarpov, N.; Appelhans, D.; Lederer, A. An Alternative Route to Dye–Polymer Complexation Study Using Asymmetrical Flow Field-Flow Fractionation. J. Chromatogr. A 2010, 1217, 4841–4849. [Google Scholar] [CrossRef] [PubMed]
  195. Boye, S.; Appelhans, D.; Boyko, V.; Zschoche, S.; Komber, H.; Friedel, P.; Formanek, P.; Janke, A.; Voit, B.I.; Lederer, A. pH-Triggered Aggregate Shape of Different Generations Lysine-Dendronized Maleimide Copolymers with Maltose Shell. Biomacromolecules 2012, 13, 4222–4235. [Google Scholar] [CrossRef] [PubMed]
  196. Yassin, M.A.; Appelhans, D.; Wiedemuth, R.; Formanek, P.; Boye, S.; Lederer, A.; Temme, A.; Voit, B. Overcoming Concealment Effects of Targeting Moieties in the PEG Corona: Controlled Permeable Polymersomes Decorated with Folate-Antennae for Selective Targeting of Tumor Cells. Small 2015, 11, 1580–1591. [Google Scholar] [CrossRef] [PubMed]
  197. Mai, T.; Rakhmatullina, E.; Bleek, K.; Boye, S.; Yuan, J.; Völkel, A.; Gräwert, M.; Cheaib, Z.; Eick, S.; Günter, C.; et al. Poly(ethylene oxide)-b-poly(3-sulfopropyl methacrylate) Block Copolymers for Calcium Phosphate Mineralization and Biofilm Inhibition. Biomacromolecules 2014, 15, 3901–3914. [Google Scholar] [CrossRef] [PubMed]
  198. Zimm, B.H. The Scattering of Light and the Radial Distribution Function of High Polymer Solutions. J. Chem. Phys. 1948, 16, 1093. [Google Scholar] [CrossRef]
  199. Andersson, M.; Wittgren, B.; Wahlund, K.G. Accuracy in Multiangle Light Scattering Measurements for Molar Mass and Radius Estimations. Model Calculations and Experiments. Anal. Chem. 2003, 75, 4279–4291. [Google Scholar] [CrossRef] [PubMed]
  200. Brewer, A.K.; Striegel, A.M. Characterizing the Size, Shape, and Compactness of a Polydisperse Prolate Ellipsoidal Particle via Quadruple-Detector Hydrodynamic Chromatography. Analyst 2011, 136, 515–519. [Google Scholar] [CrossRef] [PubMed]
  201. Ennen, F.; Boye, S.; Lederer, A.; Cernescu, M.; Komber, H.; Brutschy, B.; Voit, B.; Appelhans, D. Biohybrid Structures Consisting of Biotinylated Glycodendrimers and Proteins: Influence of the Biotin Ligand’s Number and Chemical Nature on the Biotin–Avidin Conjugation. Polym. Chem. 2014, 5, 1323–1339. [Google Scholar] [CrossRef]
  202. Ennen, F.; Fenner, P.; Boye, S.; Lederer, A.; Komber, H.; Voit, B.; Appelhans, D. Sphere-Like Protein–Glycopolymer Nanostructures Tailored by Polyassociation. Biomacromolecules 2016, 17, 32–45. [Google Scholar] [CrossRef] [PubMed]
  203. Haladjova, E.; Rangelov, S.; Geisler, M.; Boye, S.; Lederer, A.; Mountrichas, G.; Pispas, S. Asymmetric Flow Field-Flow Fractionation Investigation of Magnetopolyplexes. Macromol. Chem. Phys. 2015, 216, 1862–1867. [Google Scholar] [CrossRef]
  204. Nzé, R.-P.; Nicolai, T.; Chassenieux, C.; Nicol, E.; Boye, S.; Lederer, A. Effect of Connectivity on the Structure and the Liquid–Solid Transition of Dense Suspensions of Soft Colloids. Macromolecules 2015, 48, 7995–8002. [Google Scholar] [CrossRef]
  205. Zessin, J.; Fischer, F.; Heerwig, A.; Kick, A.; Boye, S.; Stamm, M.; Kiriy, A.; Mertig, M. Tunable Fluorescence of a Semiconducting Polythiophene Positioned on DNA Origami. Nano Lett. 2017, 17, 5163–5170. [Google Scholar] [CrossRef] [PubMed]
  206. Burchard, W. Solution Properties of Branched Macromolecules. In Branched Polymers II; Roovers, J., Ed.; Springer: Berlin, Germany, 1999; Volume 143, pp. 113–194. [Google Scholar]
  207. Marchin, S.; Putaux, J.-L.; Pignon, F.; Léonil, J. Effects of the Environmental Factors on the Casein Micelle Structure Studied by Cryo Transmission Electron Microscopy and Small-Angle X-Ray Scattering/Ultrasmall-Angle X-Ray Scattering. J. Chem. Phys. 2007, 126, 045101. [Google Scholar] [CrossRef] [PubMed]
  208. Moitzi, C.; Portnaya, I.; Glatter, O.; Ramon, O.; Danino, D. Effect of Temperature on Self-Assembly of Bovine β-Casein above and below Isoelectric pH. Structural Analysis by Cryogenic-Transmission Electron Microscopy and Small-Angle X-ray Scattering. Langmuir 2008, 24, 3020–3029. [Google Scholar] [CrossRef] [PubMed]
  209. International Dairy Federation. Caseins and Caseinates—Determination of Protein Content (Reference Method); IDF Standard 92: Brussels, Belgium, 1979. [Google Scholar]
Figure 1. Schematic illustration of the casein micelle structure, incorporated calcium phosphate nanoclusters (grey) with their attached caseins (red), the surface-located κ-casein (green), and hydrophobically bound mobile β-casein (blue). Individual components are not to scale. Reproduced with permission from [3], copyright by The Royal Society of Chemistry, 2011.
Separations 05 00014 g001
Figure 2. Reaction scheme of protein polymerisation by transglutaminase.
Separations 05 00014 g002
Figure 3. Summary of non-enzymatic cross-linking reactions that can occur during food processing, organised according to the amino acids that can react. Circles imply protein backbones. Reproduced with permission from [42], copyright by Elsevier Science Ltd., 2003.
Separations 05 00014 g003
Figure 4. (a) Separation principle of gel electrophoresis: proteins with different net charges (−) and sizes (MW) migrate in an electric field (E) with different velocities (v) over time (t). Adapted from [61], reproduced with permission from John Wiley and Sons, 2011; (b) Linear sodium dodecyl sulphate polyacrylamide gel electrophoresis of globular proteins from two commercial molar mass markers (see Appendix A.2 for experimental details).
Separations 05 00014 g004
Figure 5. Schematic illustration of the necklace-like structure of casein-sodium dodecyl sulphate complexes. Reproduced with permission from [64], copyright by Elsevier Science Ltd., 2007.
Separations 05 00014 g005
Figure 6. Principle of protein separation of two-dimensional gel electrophoresis: firstly, separation according to isoelectric points in a gel matrix with heterogeneous pH; secondly, size separation by sodium dodecyl sulphate polyacrylamide gel electrophoresis after equilibration in sodium dodecyl sulphate buffer. Adapted from [67], reproduced with permission from John Wiley and Sons, 2011.
Separations 05 00014 g006
Figure 7. (a) Linear sodium dodecyl sulphate polyacrylamide gel electrophoresis (SDS-PAGE) of cross-linked casein in phosphate buffer (CN-PB) in comparison to uncross-linked β-casein (β-CN) and a molecular weight marker (see Appendix A.2 for experimental details); (b) Gradient SDS-PAGE of cross-linked CN-PB, β-CN, and κ-casein (κ-CN) (originally presented in [94]; see also Appendix A.3). The thresholds between stacking and separating gels are indicated by (*). Numbers refer to time (h) of cross-linking with transglutaminase (see Appendix A.1).
Separations 05 00014 g007
Figure 8. Separation principle of size exclusion chromatography showing the packed column (left) and one selected bead (right) during injection (top), separation (middle), and elution (bottom) of a three-component mixture. Proteins are separated according to decreasing size due to a reduction in available pore volume for larger molecules. Adapted from [128], reproduced with permission from John Wiley and Sons, 2011.
Separations 05 00014 g008
Figure 9. Typical size exclusion chromatograms (Superdex 200 column) of unreduced (without dithiothreitol; full line) and reduced (with dithiothreitol; dashed line) casein in phosphate buffer prior to cross-linking experiments (see Appendix A.1 and Appendix A.4 for experimental details).
Separations 05 00014 g009
Figure 10. Sections of typical size exclusion chromatograms of casein samples obtained from (1) Superdex 200, (2) Superose 6, or (3) both columns in sequence under denaturing and reducing conditions (see Appendix A.1 and Appendix A.4 for experimental details). (a) Casein in phosphate buffer (CN-PB) cross-linked with transglutaminase for 0 (black), 1 (orange), 3 (green), or 24 h (violet); (b) Peak positions of αS-casein (violet), β-casein (green) and κ-casein (orange) in comparison to uncross-linked CN-PB (black); (c) Reconstituted skim milk (black) and whey protein isolate (blue) with the two peaks for α-lactalbumin (α-La) and β-lactoglobulin (β-Lg).
Separations 05 00014 g010
Figure 11. Sections of typical size exclusion chromatograms (Superdex 200 column) of cross-linked (a) casein in phosphate buffer (CN-PB), (b) β-casein, and (c) κ-casein depicting monomers (~12 mL) and dimers (~10 mL) (originally presented in [94]; see also Appendix A.4). Samples were incubated with transglutaminase for 1 (orange), 2 (blue), or 3 h (green) (see Appendix A.1 for experimental details).
Separations 05 00014 g011
Figure 12. Schematic illustration of the separation mechanism using asymmetrical flow field flow fractionation.
Separations 05 00014 g012
Figure 13. Hydrodynamic relaxation in frit-inlet channel asymmetrical flow field flow fractionation (by courtesy of Wyatt Technology Europe GmbH).
Separations 05 00014 g013
Figure 14. (a) Molar mass (□) and normalised refractive index signal (-) vs. elution time, and (b) radius of gyration (Rg; ▲) and normalised Rayleigh ratio (90° scattering angle; ◌) vs. elution time for casein micelles in milk. Reproduced with permission from [188]. Copyright by American Chemical Society, 2000.
Separations 05 00014 g014
Figure 15. Fractograms of β-casein assemblies obtained by asymmetrical flow field flow fractionation together with the distribution of the molar mass and radius of gyration (Rg). Reproduced with permission from [192], copyright by Elsevier Science Ltd., 2017.
Separations 05 00014 g015
Figure 16. Comparison between the size range of different separation and detection techniques suitable for size determination of casein.
Separations 05 00014 g016
Figure 17. (a) Apparent density calculated from the radius of gyration (Rg; ▲) and the hydrodynamic radius (Rh; □) vs. Rg, and (b) Rg/Rh (●) and differential mass distribution (-) vs. Rg for casein micelles in milk. Reproduced with permission from [184]. Copyright by American Chemical Society, 2010.
Separations 05 00014 g017
Table 1. Characteristics of main casein types in bovine milk [17].
Casein TypeApprox. Percentage from Total Casein (%)Number of Amino AcidsApprox. Molar Mass (kg/mol)Isoelectric Point (-)Grand Average of Hydropathicity (-) 1
αS1-casein4019923.64.42−0.704
αS2-casein1020725.24.95−0.918
β-casein3520924.04.65−0.355
κ-casein1516919.15.60−0.557
1 Ranges from −2 to +2. Higher values indicate higher hydrophobicity.

