Article

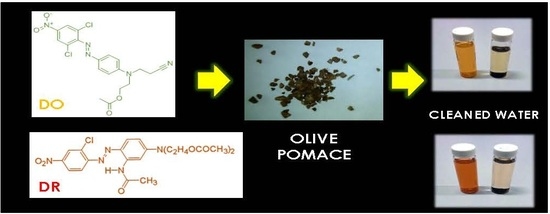
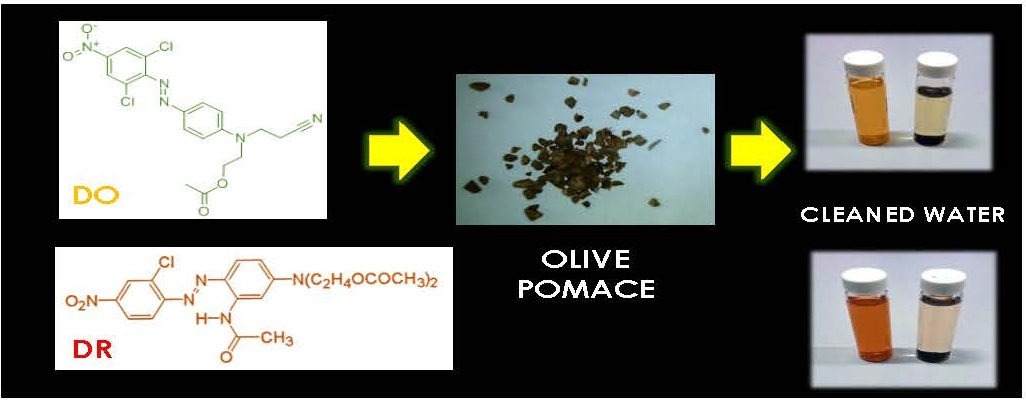
An Alternative Use of Olive Pomace as a Wide-Ranging Bioremediation Strategy to Adsorb and Recover Disperse Orange and Disperse Red Industrial Dyes from Wastewater

1
Università degli Studi “Aldo Moro” di Bari, Dip. Chimica, Via Orabona, 4, 70126 Bari, Italy
2
Università degli Studi “Aldo Moro” di Bari, Dip. di Farmacia-Scienze del Farmaco, Via Orabona 4, 70126 Bari, Italy
3
Consiglio Nazionale delle Ricerche CNR-IPCF, UOS Bari, Via Orabona, 4, 70126 Bari, Italy
4
Dipartimento di Ingegneria Civile, Ambientale, Edile, del Territorio e di Chimica, Politecnico di Bari, Orabona, 4, 70125 Bari, Italy
*
Author to whom correspondence should be addressed.
Separations 2017, 4(4), 29; https://doi.org/10.3390/separations4040029
Submission received: 13 June 2017 / Revised: 27 July 2017 / Accepted: 22 August 2017 / Published: 25 September 2017
(This article belongs to the Special Issue Separation Techniques in Waste Water Treatment)

Abstract

:
In this paper, industrial dyes, Disperse Red and Disperse Orange, were studied as model pollutants to show the excellent performance of olive pomace (OP) in sequestering and recovering these dangerous dyes from wastewater. The nature of interactions involved between dyes and OP were inferred by changing several parameters: contact time, pomace dosage, pH and temperature values. Visible spectroscopy was mainly used to obtain the percentage of the removed dyes, while SEM (scanning electron microscopy), FTIR-ATR (Fourier transform infra-red spectroscopy in total attenuated reflectance), TG (thermo gravimetric) and XPS (X-ray photoelectron spectroscopy) analyses were used to carefully investigate the systems. The recovery of dyes was also obtained using glacial acetic acid, the auxiliary solvent used during the dyeing processes, enabling the recycling of both of the adsorbent material and dyes presenting a green and a wide-ranging strategic approach.

Graphical Abstract

1. Introduction

A healthy ecosystem ensures fertile soil, clean water, timber and food, reducing the spread of diseases [1]. Among the latter, as well considering a worldwide alarm, the lack of clean and fresh water greatly affects the ecosystem. As documented by Shannon et al. [2], millions of people annually die from diseases ascribed to the use of unsafe water. Moreover, in industrialized nations, the number of contaminants flowing in water thus affecting the human life is rapidly increasing [2]. The textile industry is one of the major sectors using great amounts of water for wet processing operations, and, unfortunately, for a wide number of processes, it employs a large number of toxic substances. Indeed, since during the textile production the use of high organic dye concentrations and additives is required, the dyeing step is considered an important environmental risk. Overall, during the textile dyeing process, the amount of used dyestuff is in large excess, and the problem gets worse when disperse dyes are considered. These dyes are extensively used in textile industries due to their chemical properties [3,4,5]. As described in literature [3], disperse dyes are organic non-ionic compounds, scarcely soluble in water, applied in aqueous solution by simple immersion of textiles, requiring a large use of water. Consequently, up to 40% of the total used dyestuff is not fixed to fibers and it is discharged, as the main pollutant, in wastewater [5]. The disperse dyestuff majority includes both azo and anthraquinone dyes, used to color synthetic fibers such as polyester, nylon, acetate and cellulose [6]. Actually, the azo dye toxicity is especially well documented [7,8]. In mammals, the azo dyes are metabolized to their parent amines by intestinal microflora with mutagenic effects, which could lead to cancer [7]. The dyestuffs present in wastewater not only induce effects on human health, but also affect the global ecosystem life. Ferraz et al. [8] report that the environment pollution with these compounds, along with the problem arising from the colored water, changes the biological cycles mainly affecting the photosynthetic processes [8].
Only small amounts, of reversed industrial water, less than 10%, is treated: the great part remains untreated and serious pollution complications are induced [7]. Various techniques applied to decolorize wastewaters were thus studied and proposed in literature [9,10], and, among them, adsorption, precipitation, chemical, electrochemical and photochemical degradation, and biodegradation were usually applied [11,12]. However, numerous low cost alternatives have been proposed [12,13,14,15]. For example, as physical adsorbent, olive pomace (OP), an agricultural waste, i.e., the olive solid residues discharged during the olive oil production process is presented by Rizzi et al. [15]. As well described in Reference [15], OP consists of cellulose, lignin, amino acid, protein, uronic acids and polyphenolic compounds and only a small amount of this residue is used as natural fertilizer, or as a source of heat energy or as an additive in animal food [15]. For that reason, this waste material could be considered a promising low-cost adsorbent for environmental applications [15]. Therefore, the important focus of this paper is the decreasing of the high amount of pollution induced by textile disperse dyes with the recycling of an agricultural waste. Overall, the environmental impact is reduced [16]. Indeed, it is worth mentioning that the European Union is the principal producer and consumer of olive oil in the world, with a high increase registered in the last years [15]. The main world producer countries are reported to be Spain, Italy, Greece, Turkey, Syria and Tunisia with the results that millions of tons, ranging from 2 × 10⁶ to 4 × 10⁶, of olive mill wastes are produced in this area. Consequently, the Mediterranean area is the most affected by olive wastes and solutions for this problem should be taken into account [15]. Interestingly, OP has been presented in the literature for several years, and was mainly exploited in the metal ion removal from water [17,18,19,20,21,22,23]. The OP use for removing dyes was presented from 2000, but as an active carbon source [15]. The dye removal from water using OP, as received, was treated in only a few papers [15,18], and, among them, it is worth mentioning the removal of an anthraquinone-type dye [15]. Conversely, in the present paper, the removal of two different disperse azoic dyes, Disperse Orange (DO) and Disperse Red (DR), is studied, proposing both the recovery of dyes and the reuse of the biosorbent presenting extraordinary efficiencies. The dyes were totally removed from water in a few minutes and recovered with a simple strategy. A comprehensive investigation studying the parameters affecting the adsorption process was thus presented. For this aim, the contact time, pomace dosage, pH and temperature values were changed. In order to better provide evidence of the effect of the pH values and the role of functional groups present in DO and DR structures, the comparison with Direct Blue 73 (dB), an azo direct dye presenting charged functional groups, is presented. Accordingly, OP, as a wide-ranging material to remove different dyes from water, is thus proposed. DO and DR are chosen as models of azo disperse dye to show how OP is able to remove this class of molecules under the typical conditions adopted during industrial textiles dyeing processes. A virtuous cycle to protect the environment is thus presented.

2. Materials and Methods
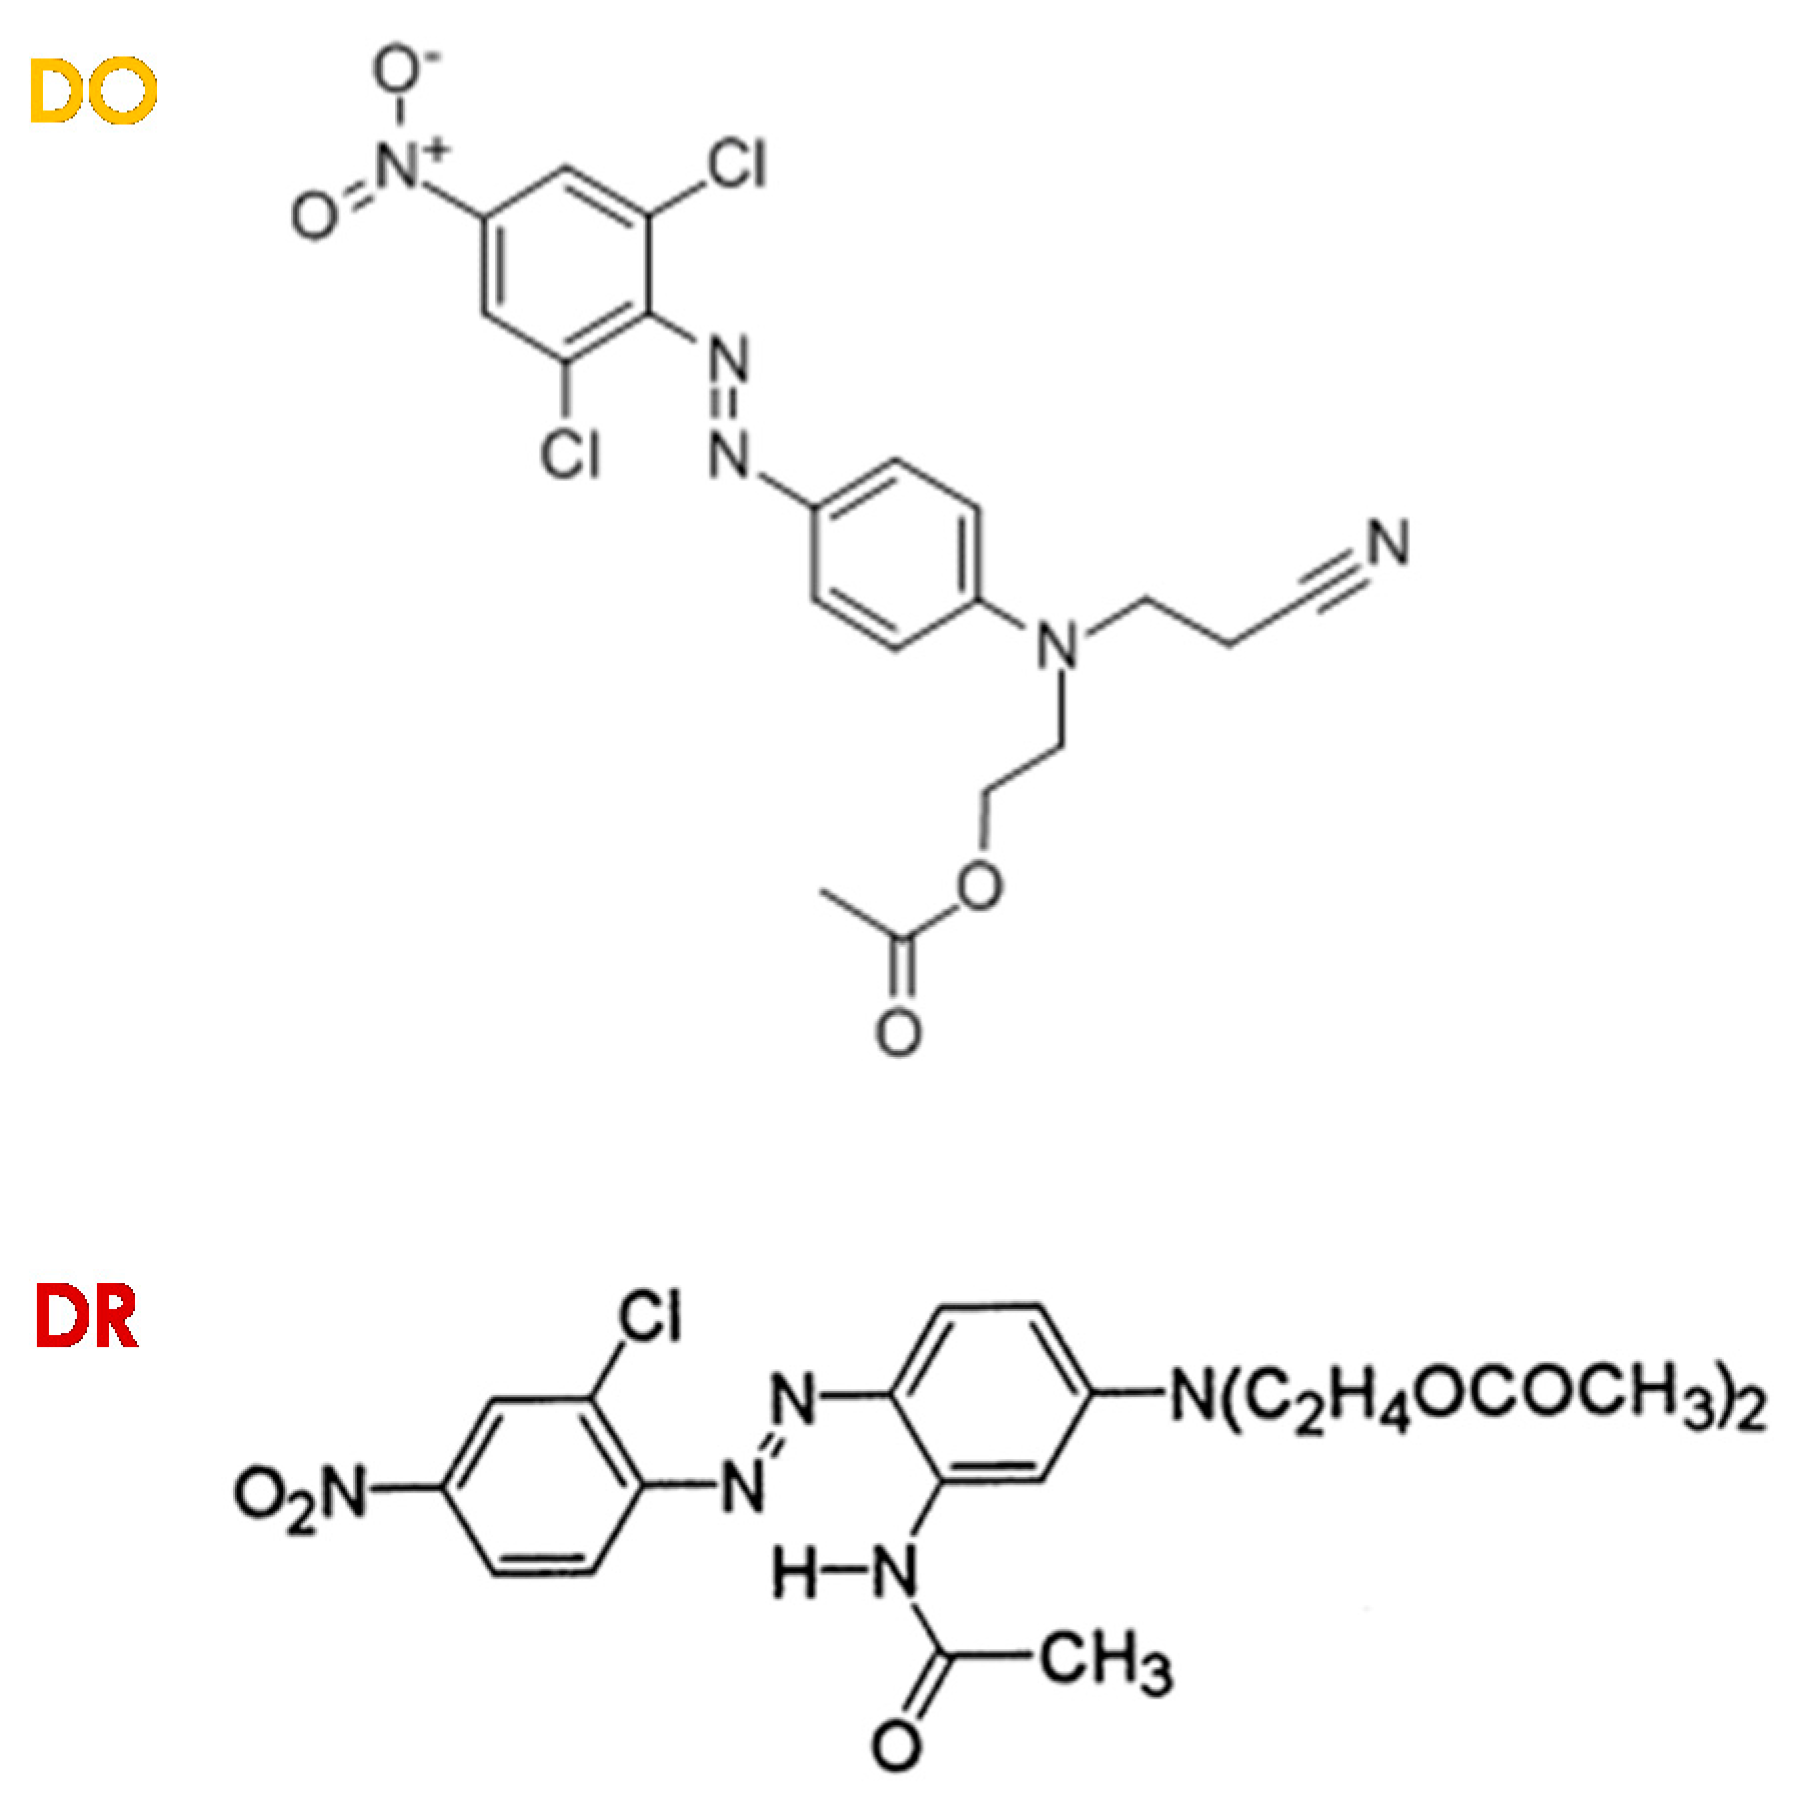
2.1. Chemicals

All the chemicals used were of analytical grade and samples were prepared using double distilled water. Acetic acid (99.9%) was purchased from Sigma-Aldrich, Milan, Italy. Disperse Orange 30 (DO, C19H17Cl2N5O4, MW: 450.27 g·mol−1) and Disperse Red 167 (DR, C22H24ClN5O7, MW: 519.93 g·mol−1) were received by Colorprint Fashion (Muro di Alcoi, Alacant, Spain), a Spanish textiles industry, and used without further purification. In particular, the former was a mix of colors, but the majority compound was DO, with 25% to 50% of the composition. The dye molecular structures were reported in Scheme 1. In order to mimic the fabric dyeing conditions (proposed by Colorprint Fashion), DO and DR stock solutions (1 × 10⁻⁴ M) were prepared in double distilled water containing an appropriate amount of acetic acid. Direct Blue 73 (C42H25N7Na4O13S4, MW: 1055.1 g·mol−1, Scheme S1) was obtained from the same source; however, in that case, the dye solution was obtained in the absence of acetic acid.

2.2. Preparation of the Biosorbent

The biosorbent material was the exhausted solid waste of olives, Olive Pomace, obtained during the oil production. OP was given by a local oil industry settled in Bari, in the south of Italy.
In order to remove adhering dirt and soluble impurities, OP was repeatedly washed with deionized water, at 100 °C (until clean water was obtained), and then dried at 100 °C in an oven, to obtain a constant weight [15]. Experiments were performed both using OP as obtained after the treatment and sieved (OPP) for obtaining a finer powder. The density of the used material was measured using a helium pycnometer (Ultrapyc 1200e Automatic Gas Pycnometer, Quantachrome Instruments, Boynton Beach, FL, USA) and was estimated to be 1.4570 ± 0.0020 g/cm3 and 1.5240 ± 0.0020 g/cm3 for OP and OPP, respectively. The size distributions of used materials was also calculated using certified test sieves (Giuliani, series ASTM, American Society for Testing and Materials International), and were 3000 ± 800 μm and 350 ± 200 μm for OP and OPP, respectively.

2.3. Experimental Procedures

Experiments were conducted in glass beakers (40 mL) containing dye solutions at known concentrations as mixtures of water and acetic acid at pH 3.5. In the case of Direct Blue (dB), the pH was around 6.0 units. The effects of the biosorbent and dye dosages on dye removal from wastewater were assessed changing the amount of OP/OPP, from 0.25 to 3.00 g for liter of dye solution, 6.25 g/L to 75 g/L, with dye concentration settled at 5 × 10⁻⁵ M—23 mg/L for DO and 25 mg/L for DR, respectively. The dye biosorption was examined at constant temperatures of 25, 50, 80 and 100 °C; however, the adsorption of disperse dyes occurred only at 100 °C. The evaporated water was collected preventing the volume loss in the adsorption medium. The pH effect on the biosorption process was also investigated both removing acetic acid from disperse dye solutions (DO and DR) and changing the pH values in the range of 2–9 when dB solutions were considered. The mixtures were stirred at 140 rpm for different contact times using a digitally controlled magnetic stirrer. Regarding the adsorption process, the UV-Vis absorption spectra were acquired and the absorbance values were read at 440 nm (pH 3.5), 501 nm (pH 3.5) and 605 nm (in water, pH 6.0) for DO, DR and dB, respectively. These values in conjunction with the dye analytical concentration (5 × 10⁻⁵ M) were used to evaluate the molar absorption coefficients (ε) of each dye. The following values, expressed in M−1 cm−1 units, were obtained: 7000 for DO (pH 3.5), 4400 for DR (pH 3.5) and 20,000 for dB 4000 (pH 6.0), and were used to infer the dye concentrations, at several contact times when in the presence of OP. In accordance with literature [13,15,24], the OP adsorption capacity qt (mg g−1) at time t for each dye, was calculated by applying the following equation:
q t = C 0 C t W × V ,
where V represents the adopted total volume of solution (herein 40 mL), W is the weight of the dry adsorbent material (g), C0 and Ct represent the initial concentration and the concentration at time t of the dye (mg·L−1).

2.4. UV-Visible and Fourier Transform Infra-Red Spectroscopy in Total Attenuated Reflectance (FTIR-ATR) Measurements

UV-Visible (UV-Vis) absorption spectra were recorded using a Varian CARY 5 UV-Vis-NIR spectrophotometer (Varian Inc., now Agilent Technologies Inc., Santa Clara, CA, USA). FTIR-ATR spectra were recorded within the 600–4000 cm−1 range using a spectrometer 670-IR (Varian Inc., now Agilent Technologies Inc., Santa Clara, CA, USA), whose resolution was set to 4 cm−1. Thirty-two scans were summed for each acquisition.

2.5. X-Ray Photoelectron Spectroscopy (XPS) Analysis

XPS analyses were performed using a Thermo Electron Theta Probe spectrometer (Waltham, MA, USA) equipped with a monochromatic Al Ka X-ray source (1486.6 eV) operated at a spot size of 300 µm corresponding to a power of 70 W. Survey (0–1400 eV) and high resolution (C1s, O1s, N1s) spectra were recorded in FAT (fixed analyzer transmission) mode at pass energy of 200 and 100 eV, respectively. All spectra were acquired at a takeoff angle of 37° with respect to the sample surface. Charge compensation was accomplished by a low energy electron flood gun (1 eV). Charge correction of the spectra was performed by taking the hydrocarbon (C–C, C–H) component of the C1s spectrum as internal reference (binding energy, BE = 285.0 eV). Atomic percentages were calculated from the high resolution spectra using the Scofield sensitivity factors set in the Thermo Avantage V4.87 software (version, Thermo Fisher Corporation, Waltham, MA, USA) and a nonlinear Shirley background subtraction algorithm. The best-fitting of the high-resolution XPS spectra was performed using with mixed Gaussian–Lorentzian peaks after a Shirley background subtraction; a maximum relative standard deviation of 10% was estimated on the area percentages of the curve-fitting components, while the determined standard deviation in their position was ±0.2 eV.

2.6. Scanning Electron Microscopy (SEM)

The surface morphology of olive pomace was investigated using FEI Quanta FEG 250 (Hillsboro, OR, USA). Samples were placed on an aluminum stub.

2.7. Thermogravimetry Analysis (TGA)

TGA were performed using an STA (Simultaneous thermal analysis) 449 F1 Jupiter, Netzsch apparatus (Verona, Italy). The samples were analyzed in the range 25–550 °C at the heating speed of 3 °C·min−1 and in air atmosphere.

2.8. Desorption Studies

The desorption studies were performed in glacial acetic acid. In addition, 1.00 g of the adsorbent material after the dye adsorption was placed in contact with 40 mL of acetic acid and the percentage of the desorbed dye was calculated monitoring the UV-Vis absorption spectra of dyes in acetic acid. A calibration curve was previously evaluated in the same conditions. When consecutive cycles of adsorption were performed, the pomace loaded with dyes was removed from water, washed, and then added to another solution of disperse dyes.

3. Results and Discussion

Olive pomace grains, as macroscopically observed in Figure S1A, appeared rough with an irregular surface better evidenced by the SEM image (Figure S1B). The displayed high porosity makes OP a valid biosorbent to clean water from pollutants, as confirmed when disperse dye solutions were in contact with the material. The images in Figure S1C,D show the obtained results, related to OP after the adsorption of DR and DO, respectively. OP appeared with brilliant red and orange colors. The experiments were performed using 5 × 10⁻⁵ M as dye concentration and 1.00 g of OP, maintaining the temperature value of the dye solutions at 100 °C. The absence of results was observed at lower temperature values. Interestingly, since the textile dyeing processes are carried out at high temperature values, producing hot colored wastewater [15], the conditions for the DO and DR efficient adsorption onto OP appearing promising for industrial applications. Moreover, the adsorption settings suggested the endothermic character of the process itself, as recently evidenced by Rizzi et al. [15]. An increase of the dye molecule mobility, under these conditions, probably also occurred. Furthermore, Senthilkumaar et al. [25] suggested that an increase of the temperature values induces the adsorbent pore size enlargement enhancing the adsorption process. Moreover, the fast diffusion of dye molecules is proposed [25]. As a qualitative evaluation, the performance of OP can be also evidenced observing the dye solutions after the adsorption process (Figure S2A,B). The clean water can be easily observed.
Both DO and DR dyes exhibited well-shaped absorption bands in the visible region of the spectrum with absorption maxima located at 440 nm and 501 nm, respectively (Figure S2C). These bands, being the more diagnostic, were used in order to carry out a quantitative evaluation of the dye uptake percentage from water, following their absorbance changes in time. As it can be seen from disperse dye UV-Vis spectra (Figure S2C), these molecules show broad absorption bands due to the overlap of a π − π* (permitted, large molar coefficient) and a n − π* (forbidden by symmetry [26], small molar coefficient) type transitions [27], with the band in the visible region ascribable to the n − π* type transition, while the band at about 281 nm is ascribable to the π − π* one localized on phenyl groups [26]. Additionally, due to the nitro group moiety conjugated with the chromophore, there is also a charge transfer band superimposed on the previous ones [27], described as a flow of electron density (intramolecular charge transfer) from the electron-donor group by way of the p-electron bridge to the electron acceptor group [26].
As yet discussed, following the DO and DR visible absorption bands, the efficiency of OP, both in grain and in powder (OPP), in dye removal was calculated and is reported in Table 1. The percentage of adsorption indicated as % is reported in this Table.
Maintaining constant the dye concentration at 5 × 10⁻⁵ M, different amounts of OP were exploited. Both for OP and OPP, by increasing the amount of sorbent material, the time necessary for dye adsorption, with high efficiencies, decreased. Interestingly, OPP exhibited excellent results if compared with OP. Starting from DO, passing from 0.25 g to 3.00 g of OP, the percentage of DO removed from water changed from 85% to 98%, with a very short contact time (from 180 min to 30 min). Additionally, considering the olive pomace lowest amount, i.e., 0.25 g, the percentage of dye removed (85% in 180 min) increased if the sorbent is powdered (OPP, 99% in 40 min). These results, along with the importance of active sites present on the olive pomace surface that increment at the increasing of the biosorbent amount, showed the importance of a larger surface area when OPP was used. As already suggested in our recent paper [15], at high adsorbent dosages, the adsorption sites not being saturated, an increased dye adsorption percentage by olive pomace was determined. This effect was also observed when DR was studied. In particular, the necessary contact time for dye removal from water appeared slightly shorter than in the case of DO. This finding was confirmed, observing the excellent percentage values relative to dye removal, by using both OP and OPP ranging from 0.25 g to 3.00 g. Overall, 1.00 g of OPP was enough to remove both DO and DR in a reasonable contact time of 10 min with an almost complete dye removal from water.
Since excellent results were obtained using OPP, the attention was focused on the fine powdered OP, as adsorbent material. Accordingly, to provide better evidence of the effect of OPP dosage in sequestering dye molecules from water, the qt values were calculated using Equation (1). Figure 1A,B show the corresponding results, evidencing that the maximum adsorption percentage from water was rapidly obtained, after a few minutes, employing 3.00 g and 1.00 g of biosorbent. On the other hand, reducing the OPP amount, more time was necessary to obtain the same efficiency under the same experimental conditions. The effect can be easily observed by looking at the time necessary to obtain the point in which the qt values reach a plateau, which represents the maximum amount of dye adsorbed per gram of OPP. In all examined conditions, this point was close to the expected values corresponding to the theoretical total adsorption of dye molecules from the pomace.
Overall, the presented data suggested the importance and the role of active sites in the dye adsorption [28], and this aspect was better evidenced performing consecutive cycles of DO and DR adsorption on the OP.

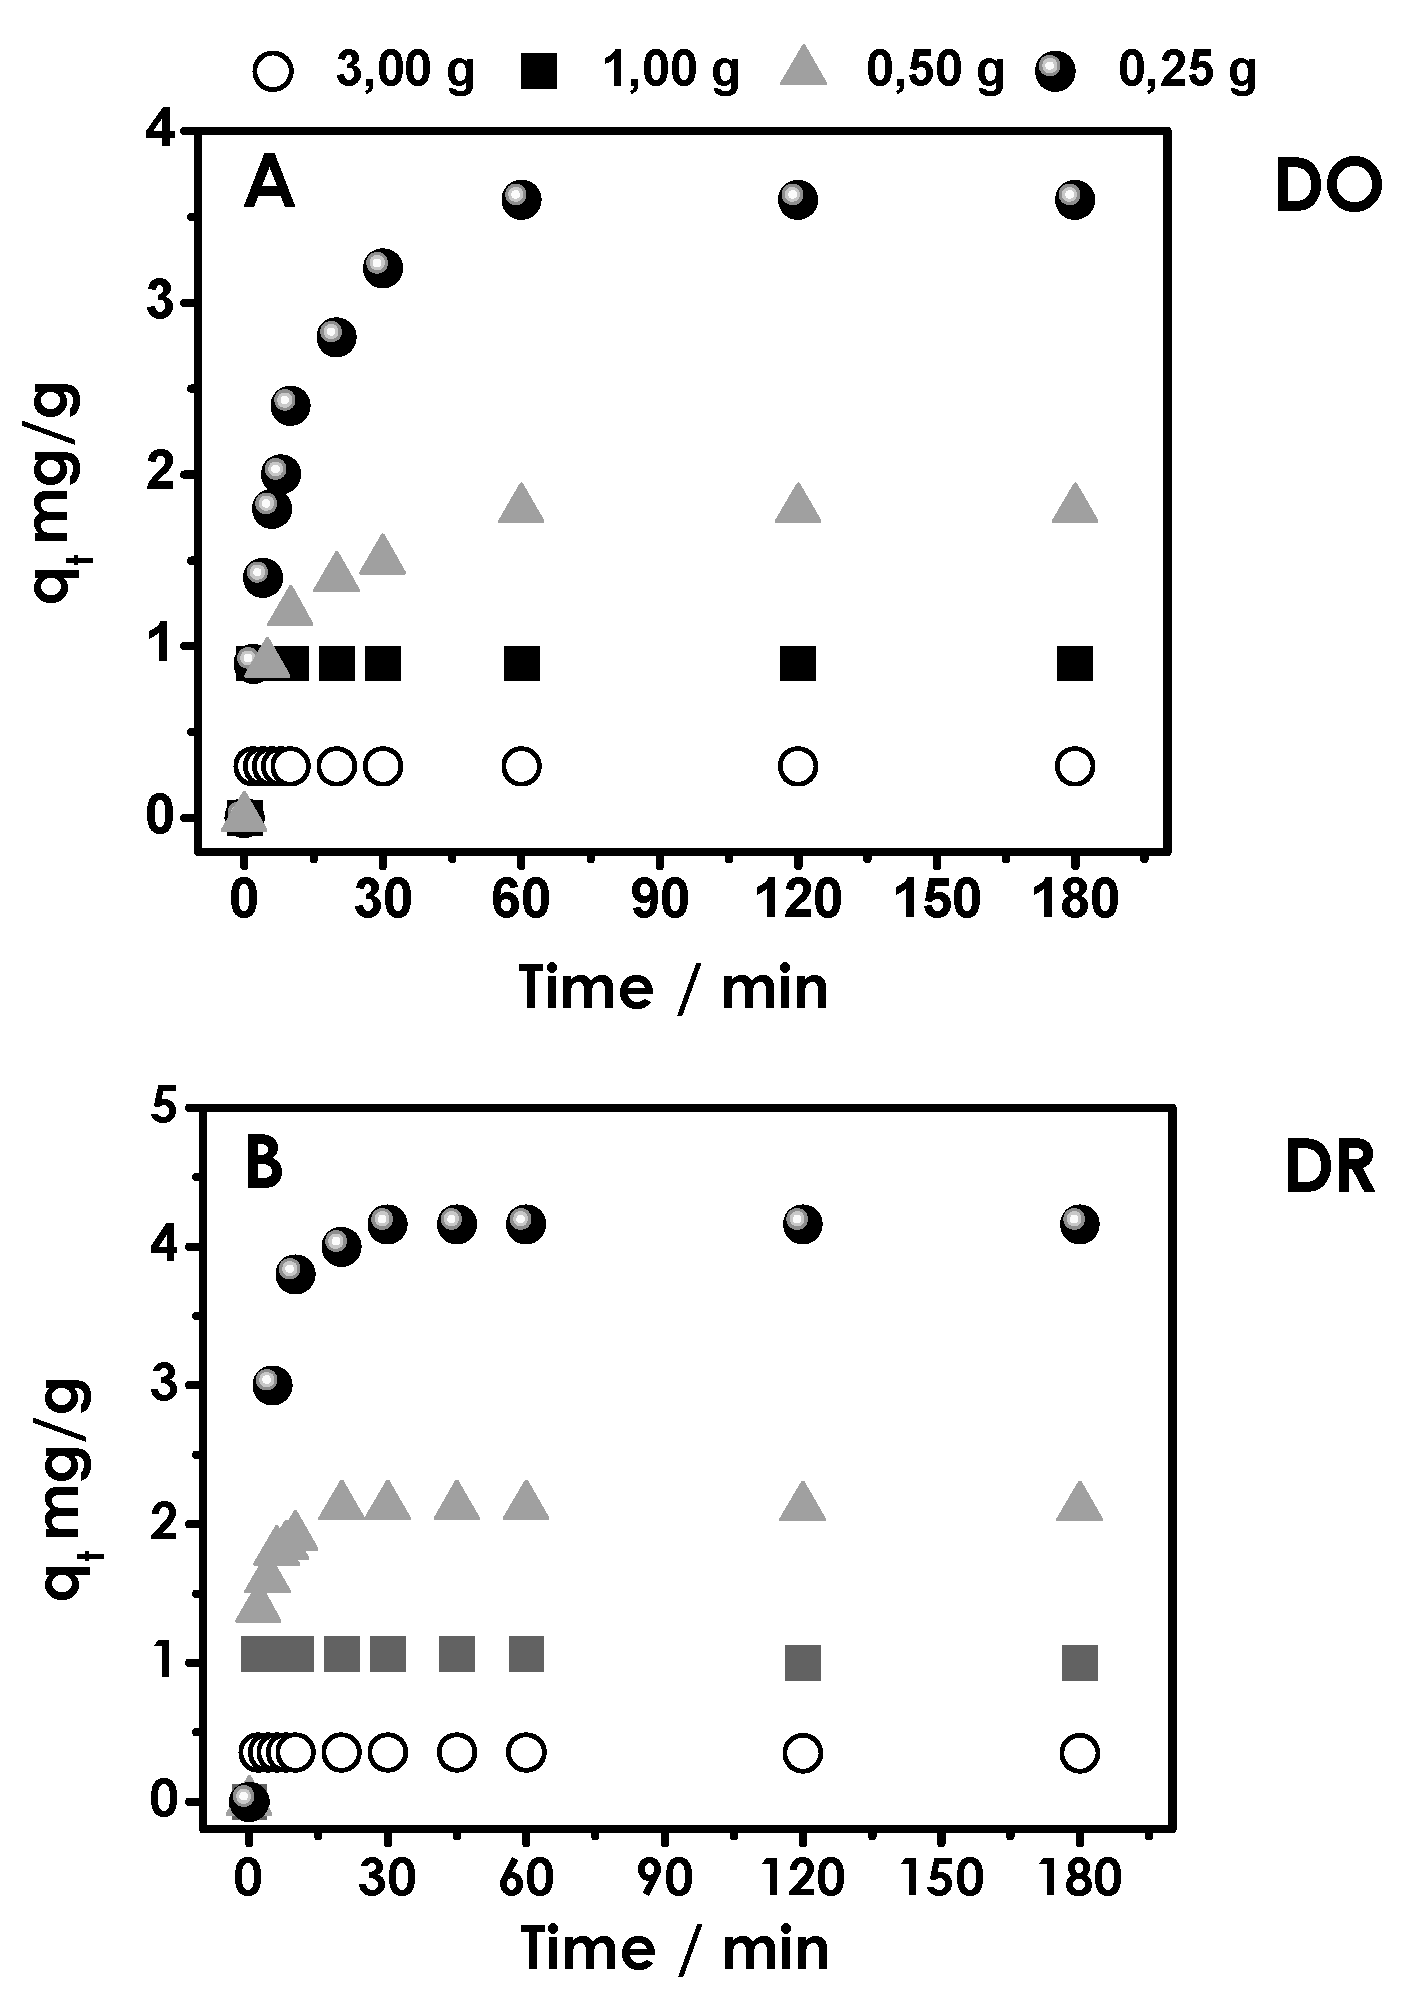
3.1. Cycles of Consecutive Adsorption of Disperse Orange and Red Dyes

The possibility of performing consecutive cycles of DO and DR adsorption on OPP was also evaluated. The obtained results are reported in Table 2 and are related to five consecutive cycles of adsorption. For both dyes, using 1.00 g of OPP, after two consecutive cycles of adsorption, the contact time is the same: in 10 min, an important percentage of dyes removal was obtained, while after the 3rd cycle, the contact time increased from 10 to 20 min, maintaining the same efficiency. These results highlighted the fashionable performance of OPP and the role of active sites involved in the adsorption process. After several cycles, the sites tend to be saturated, hindering the further adsorption of dye molecules.
If the obtained results are compared with similar studies, i.e., works related to the removal of disperse dyes reported in references [4,5,6,8,9,12,13,14], the performance of the pomace appears, removing in a few minutes a very great amount of dyes. Additional values are also put forward, considering the desorption of dyes, proposing the recovery of both the adsorbent and dyes in a reasonable short time and with a simple method.

3.2. Desorption Studies

The extraordinary performance of our adsorbent material acquired a great importance considering a green and environmental friendly cycle, when the possibility to reuse both the adsorbed dyes and the biosorbent itself was ascertained. As a first step, the pH effect on dye desorption was examined. In addition, 1.00 g of OPP + DO and OPP + DR was placed in contact with water solutions having different pH values ranging from 2 to 12 units, by using HCl and NaOH. The dye molecule release was not obtained under these experimental conditions suggesting the scarce role of electrostatic interactions between adsorbent and adsorbate [15]. The use of organic acids was proposed and glacial acetic acid, at room temperature, showed very significant results. In fact, 1.00 g dye-loaded OPP was placed in 40 mL of CH3COOH monitoring the dye release by means of the UV-Vis absorption spectroscopy. In acetic acid, DO and DR show absorption maxima at 400 nm and 500 nm, respectively (Figure S3), with additional changes in the signal intensity if compared with absorption spectra in water (Figure S2).
As a whole, for both dyes, several cycles of adsorption/desorption were accomplished and reported in Table 3. In detail, at the increasing of the number of adsorption/desorption cycles, the time necessary for adsorbing and desorbing the dye increased. In all listed experiments, DO exhibited excellent efficiencies in its removal and recovery and thus in the OPP reuse. On the other hand, DR resulted in being less efficient, showing good results for the adsorption process, but a mean value of 85% of recovered dye for each cycle (Table 3), with the last desorption cycle even lower (about the 75% of dye was desorbed). The obtained results, i.e., the reversibility of the process, suggested that the adsorption could be ascribed to the onset of weak forces between dyes and OPP [28], with a different dye/biosorbent affinity, responsible for the different recovery efficiencies observed. Indeed, not surprisingly, DR exhibited a high efficiency in its removal from water (see Table 3), in agreement with the results obtained during its recovery, which instead appeared less efficient. It is also worth mentioning that the DO and DR absorption spectra in acetic acid after the desorption were characterized by the same shape lines reported in Figure S3, recorded when the dyes were directly dissolved in acetic acid, indicating that the chemical-physical dye properties were retained, not being affected by the adsorption/desorption processes. This opens a new horizon for an industrial green and cyclic application of this system, proposing the reuse of both OPP and DO/DR. These results were further emphasized considering preliminary experiments related to a mixture of the dyestuffs. Indeed, both DR and DO were adsorbed and recovered as a mixture. Considering the work reported in Rizzi et al. [15], referring to an anthraquinone dye [15], excellent results were also obtained by mixing these three different disperse dyes (Figure S4). Moreover, another important aspect to be considered is that, as suggested by Colorprint Fashion, the disperse dyes are industrially applied using a mixture of water and acetic acid. Therefore, the dye recovery process developed in this paper, making use of the same solvent (acetic acid), could be considered a virtuous more eco-sustainable cycle, in comparison with similar papers [4,5,6,8,9,12,13,14].
Starting from these considerations, as a second step of this study, the nature of interactions involved in the adsorption processes of both dyes was clarified adopting several complementary techniques: FTIR-ATR absorption spectroscopy, TG and XPS analyses. Moreover, with the aim to clarify the possible role of electrostatic interaction, along with the change of pH values of disperse dye solutions, another dye different from DO and DR was used as a comparison. In the Electronic Supporting Material (ESI), more detailed information are thus reported.

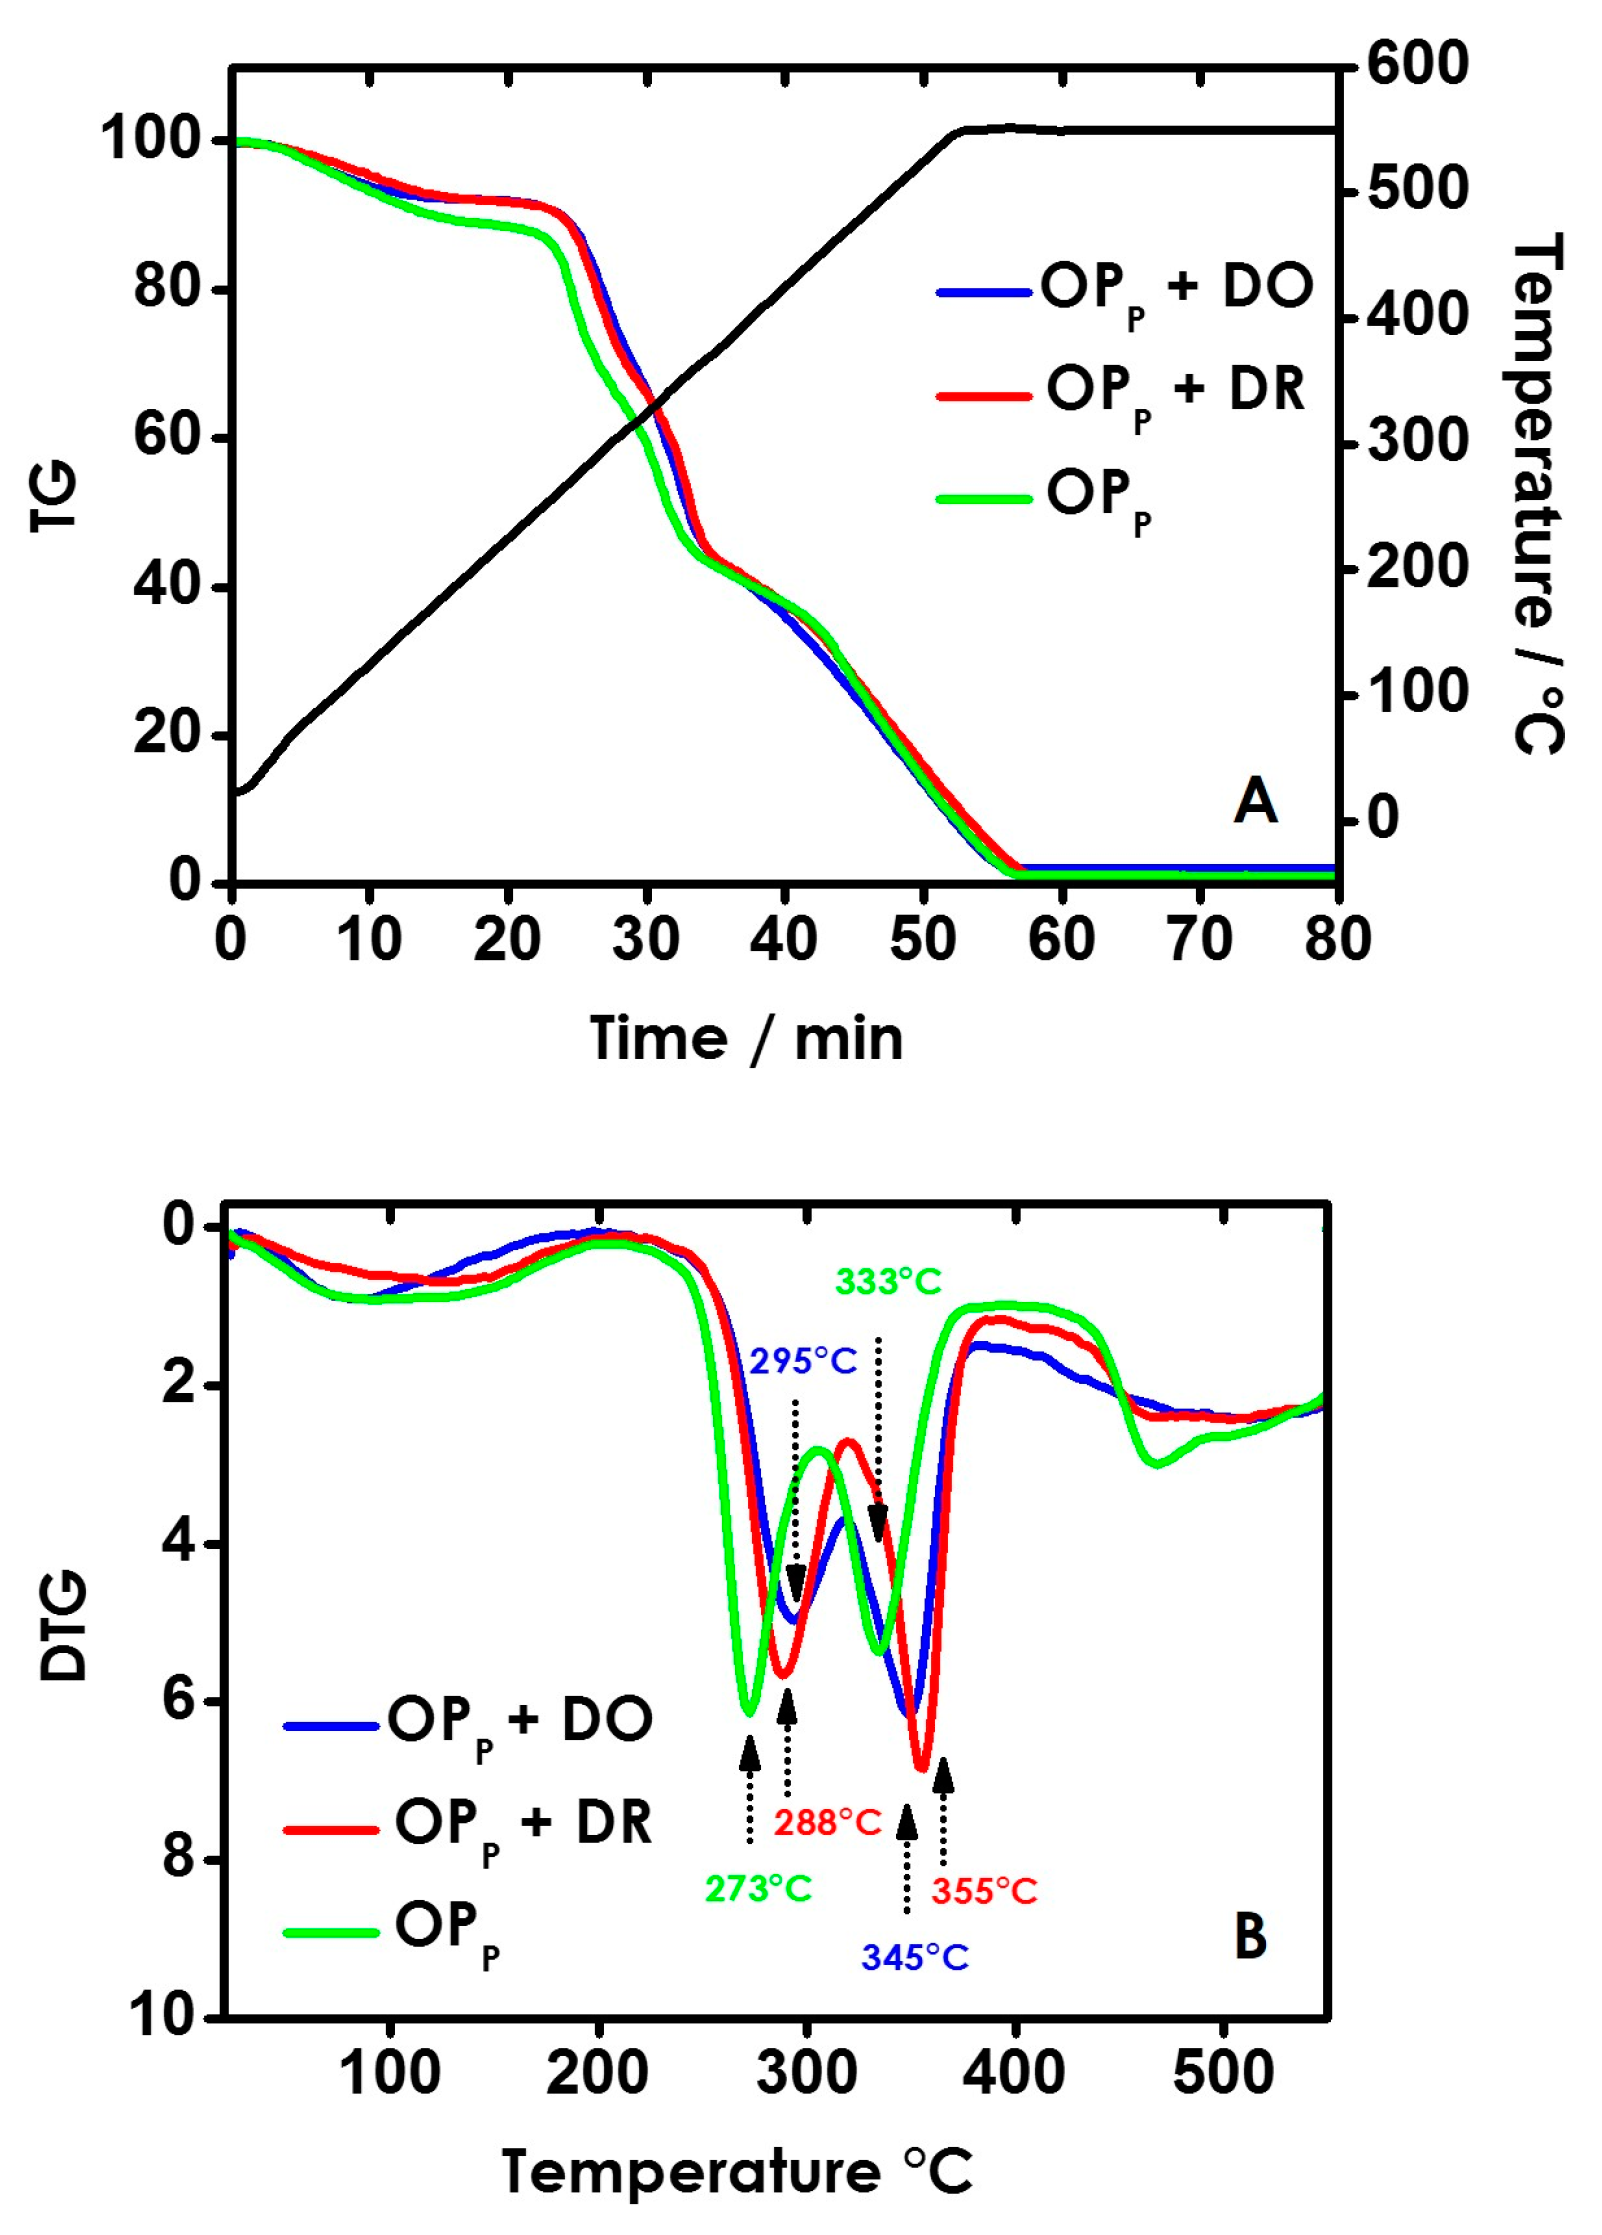
3.3. Thermogravimetric Analyses (TGA)

TGA analyses are showed in Figure 2A,B. The derivative thermogravimetry (DTG) results are also reported, providing evidence of the point inflection in the TGA curves correlated to temperature values in which the lost mass occurred rapidly [29]. OPP (Figure 2, green curve) showed the typical curve already observed by Rizzi et al. [15] that appeared similar in shape to the results referred to OPP in presence of dyes. In all reported curves, the evaporation of water was observed. Subsequently, increasing the temperature values the evaporation of water entrapped by the OPP component (in this case, mainly associated to lignine and cellulose materials) was observed [15]. A significant weight loss was observed when the temperature increased from 250 to 400 °C and up to 430 °C. The cellulose/hemicellulose degradation and lignin decomposition were observed with a tail up to 430 °C ascribed to the slow degradation of the main components [30,31,32]. DTG curves provided better evidence of the presence of olive pomace components. In particular, the weight loss observed at 273 °C indicated the presence of hemicellulose. On the other hand, the peak observed at 333 °C assessed the presence of cellulose. Lignin decomposition was observed at around the same temperature of hemicellulose degradation and up to 600 °C. When dye molecules were adsorbed by OPP (Figure 2B, red and blue lines), the hemicellulose and cellulose degradation shifted from 273 °C to 295 °C and 288 °C and from 333 °C to 345 °C and 355 °C, for OPP + DO and OPP + DR, respectively [15]. In addition, the lignin decomposition appeared affected. In the whole, the degradation temperatures of the main components of olive pomace resulted in being changed, suggesting the presence of interactions involving dye molecules and the main components of OPP, such as cellulose, hemicelluloses and lignin. As well described in Reference [15] and references therein, the protective role of adsorbed dyes with respect to the oxidation of the ligneous biomolecules was observed [15].

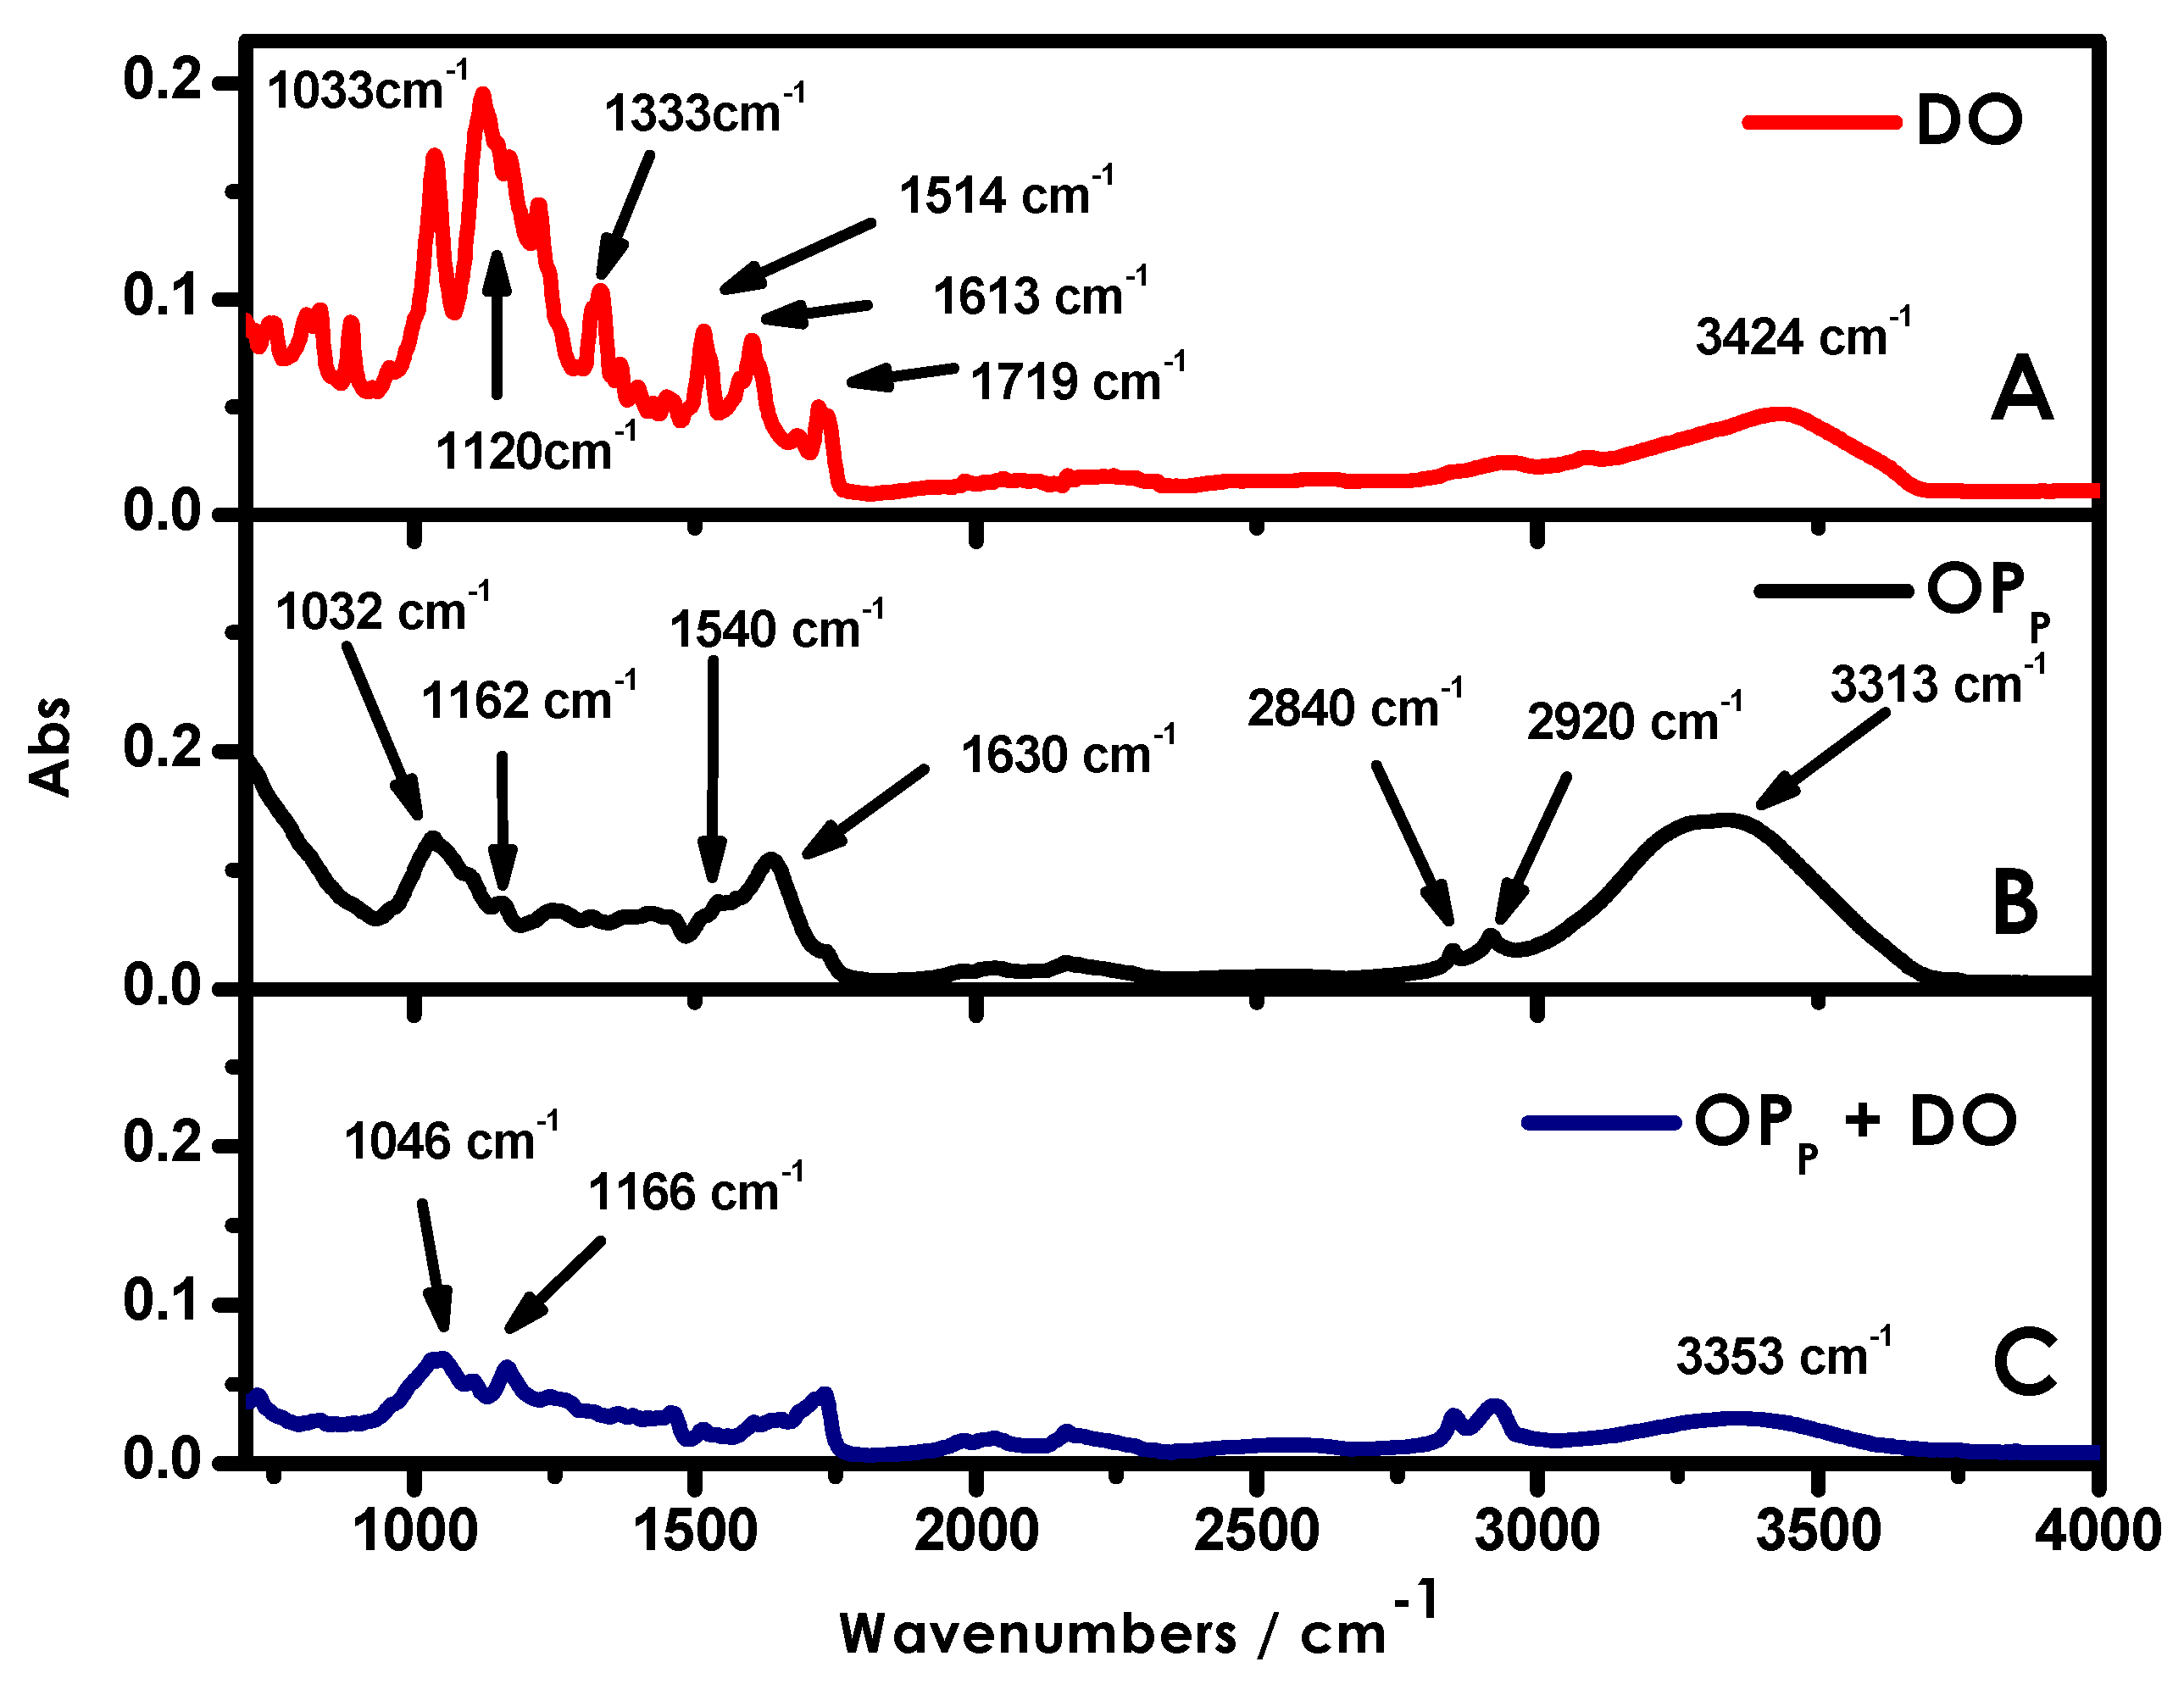
3.4. FTIR-ATR Spectroscopic Measurements

Figure 3 and Figure S7 show the OPP FTIR-ATR spectra in the presence and absence of dye molecules, together with the characteristic IR spectra of each dye. The attribution of these bands are well discussed in Rizzi et al. [15], Mao et al. [33,34] and are in accordance with the molecular structures of dyes reported in Scheme 1 [15,33,34].
The FTIR spectrum of OPP without dyes is reported in Figure 3 (black curve). In accordance with Akar et al. [35] and Rizzi et al. [15], the reported spectrum provided evidence of the presence of the main components of olive pomace [15,36,37]. Bands were observed in the wavenumbers region between 3600–2800 cm−1 and 1800–800 cm−1. The signal at 3313 cm−1 indicated the hydroxyl and amino group stretchings. The presence of methyl and methylene groups in the lignin structure [36] was evidenced by bands detected at 2920 cm−1 and 2840 cm−1, respectively. The bending vibrations of aliphatic –CH were observed in the range of 1366–1320 cm−1. The peak between 1520 and 1540 cm−1, as suggested by Calero et al. [36], was ascribed to esters present in the lignin [36]. The signals at 1540 cm−1 and 1630 cm−1 suggested the presence of amino and carboxyl groups stretching. The broad bands near 1250 cm−1 were attributed to vibrations of carboxylic acids, and bands in the range 1160–1000 cm−1 represented the vibration of C–O–C and O–H of polysaccharides. Finally, the peaks in region below 900 cm−1 were assigned to C–H aliphatics or aromatics [15].
FTIR spectra of OPP after the dye adsorption showed appreciable changes with respect to untreated OPP (Figure 3, blue curve). The presence of dye molecules (Figure 3 and Figure S7, blue curves) affected the olive pomace spectrum, shifting the broad O–H and N–H band detected at 3313 cm−1 to 3353 cm−1 and 3366 cm−1 for DO and DR, respectively. Interestingly, the intensity of these bands appeared significantly decreased. On the whole, the IR spectra of OPP + DO and OPP + DR showed lower intensity values than the spectrum recorded for OPP without dyes. Moreover, when DO dye was taken into account (Figure 3, blue curve), the carboxyl and amino group vibration modes, at 1540 and 1630 cm−1, significantly decreased their intensities with the signals at 1032 cm−1 and 1162 cm−1 shifted toward higher wavenumber values (1046 cm−1 and 1166 cm−1, respectively). As already observed for the disperse blue dye [15], these findings suggested the presence of interaction between DO and DR and OPP via hydrogen bonds and van der Waals forces involving the main components of olive pomace and dye molecules. The interaction with cellulose or cellulose-like structure was thus suggested [36]; in fact, not surprisingly, disperse dyes are used to color cellulose fibers [35,36,37,38,39]. The absence of the main IR bands in OPP + dyes spectra suggested that the dye molecules were blocked inside olive pomace matrix, deshielding them from detection [15,39].

4. Conclusions

DR and DO removal and recovery was presented using several complementary techniques, obtaining information both about the efficiency of removal and recovery and the nature of forces involved during the adsorption process. Lignin, cellulose and cellulose like-structure, the main components of OPP, are deeply involved in the adsorption process through weak and hydrophobic interaction forces between DO/DR and the OPP pores cavities. Adsorbed dyes show a protective role in the degradation temperature of the main OPP components. Furthermore, the excellent results obtained at high temperature make OPP a good biosorbent for real industrial application, since, during the dyeing processes, hot wastewater is generated.

Supplementary Materials

The following are available online at https://www.mdpi.com/2297-8739/4/4/29/s1.

Acknowledgments

We gratefully acknowledge the skillful and excellent technical assistance of Sergio Nuzzo and the precious collaboration of Luisa De Cola, Eko Adi Prasetyanto, Pengkun Chen for XPS, TGA and SEM measurements (University of Strasbourg (France), the Institut de Science et d’Ingénierie Supramoléculaires) and Colorprint Fashion, the Spanish textile industry.

Author Contributions

Vito Rizzi and Pinalysa Cosma conceived and designed the experiments and wrote the paper; Francesco D’Agostino performed the experiments; Paola Fini analyzed calorimetric data; Andrea Petrella, Jennifer Gubitosa, Paola Semeraro and Angela Agostiano contributed to analysis tools.

Conflicts of Interest

The authors declare no conflict of interest.

References

  1. Holzman, D.C. Accounting for Nature’s Benefits: The Dollar Value of Ecosystem Services. Environ. Health Perspect. 2012, 120, 152–157. [Google Scholar] [CrossRef] [PubMed]
  2. Shannon, M.A.; Bohn, P.W.; Elimelech, M.; Georgiadis, J.G.; Marin, B.J.; Mayes, A.M. Science and technology for water purification in the coming decades. Nature 2008, 452, 301–310. [Google Scholar] [CrossRef] [PubMed]
  3. Merzouk, B.; Gourich, B.; Madani, K.; Vial, C.; Sekk, A. Removal of a disperse red dye from synthetic wastewater by chemical coagulation and continuous electrocoagulation, A comparative study. Desalination 2011, 272, 246–253. [Google Scholar] [CrossRef]
  4. Sirianuntapiboon, S.; Srisornsak, P. Removal of disperse dyes from textile wastewater using bio-sludge. Bioresour. Technol. 2007, 98, 1057–1066. [Google Scholar] [CrossRef] [PubMed]
  5. Kurade, M.B.; Waghmode, T.R.; Kagalkar, A.N.; Govindwar, S.P. Decolorization of textile industry effluent containing disperse dye Scarlet RR by a newly developed bacterial-yeast consortium BL-GG. Chem. Eng. J. 2012, 184, 33–41. [Google Scholar] [CrossRef]
  6. Gercel, O.; Gercel, H.F.; Savas Koparal, A.; Ogutveren, U.B. Removal of disperse dye from aqueous solution by novel adsorbent prepared from biomass plant material. J. Hazard. Mater. 2008, 160, 668–674. [Google Scholar] [CrossRef] [PubMed]
  7. Suryavathi, V.; Sharma, S.; Saxena, P.; Pandey, S.; Grover, R.; Kumar, S.; Sharma, K.B. Acute toxicity of textile dye wastewaters (untreated and treated) of Sanganer on male reproductive systems of albino rats and mice. Reprod. Toxicol. 2005, 19, 547–556. [Google Scholar] [CrossRef] [PubMed]
  8. Ferraz, E.R.A.; Grando, M.D.; Oliveira, D.P. The azo dye Disperse Orange 1 induces DNA damage and cytotoxic effects but does not cause ecotoxic effects in Daphnia similis and Vibrio fischeri. J. Hazard. Mater. 2011, 192, 628–633. [Google Scholar] [CrossRef] [PubMed]
  9. Chu, W. Dye removal from textile dye wastewater using recycled alum sludge. Water Res. 2001, 35, 3147–3152. [Google Scholar] [CrossRef]
  10. Robinson, T.; McMullan, G.; Marchant, R.; Nigam, P. Remediation of dyes in textile effluent: A critical review on current treatment technologies with a proposed alternative. Bioresour. Technol. 2001, 77, 247–255. [Google Scholar] [CrossRef]
  11. Arruda Guelli Ulson de Souza, S.M.; Forgiarini, E.; Ulson de Souza, A.A. Toxicity of textile dyes and their degradation by the enzyme horseradish peroxidase (HRP). J. Hazard. Mater. 2007, 147, 1073–1078. [Google Scholar] [CrossRef] [PubMed]
  12. Isa, M.H.; Lang, L.S.; Asaari, F.A.H.; Aziz, H.A.; Ramli, N.A.; Dhas, J.P.A. Low cost removal of disperse dyes from aqueous solution using palm ash. Dyes Pigment. 2007, 74, 446–453. [Google Scholar]
  13. Rizzi, V.; Longo, A.; Fini, P.; Semeraro, P.; Cosma, P.; Franco, E.; García, R.; Ferrándiz, M.; Núñez, E.; Gabaldón, J.A.; et al. Applicative study (Part I): The excellent conditions to remove in batch direct textile dyes (Direct red Direct blue and Direct yellow) from aqueous solutions by adsorption processes on low-cost chitosan films under different conditions. Adv. Chem. Eng. Sci. 2014, 4, 454–469. [Google Scholar] [CrossRef]
  14. Semeraro, P.; Rizzi, V.; Fini, P.; Matera, S.; Cosma, P.; Franco, E.; García, R.; Ferrándiz, M.; Núñez, E.; Gabaldón, J.A.; et al. Interaction of industrial textile dyes and cyclodextrins. Dyes Pigment. 2015, 119, 84–94. [Google Scholar] [CrossRef]
  15. Rizzi, V.; D’Agostino, F.; Fini, P.; Semeraro, P.; Cosma, P. An interesting environmental friendly cleanup: The excellent potential of olive pomace for disperse blue adsorption/desorption from wastewater. Dyes Pigment. 2017, 140, 480–490. [Google Scholar] [CrossRef]
  16. Rizzi, V.; Mongiovì, C.; Fini, P.; Petrella, A.; Semeraro, P.; Cosma, P. Operational parameters affecting the removal and recycling of direct blue industrial dye from wastewater using bleached oil mill waste as alternative adsorbent material. IJEAB 2017, 2, 1560–1572. [Google Scholar] [CrossRef]
  17. Bhatnagar, A.; Kaczala, F.; Hogland, W.; Marques, M.; Paraskeva, C.A.; Papadakis, V.G.; Sillanpää, M. Valorization of solid waste products from olive oil industry as potential adsorbents for water pollution control—A review. Environ. Sci. Pollut. Res. 2014, 21, 268–298. [Google Scholar] [CrossRef] [PubMed]
  18. Vegliò, F.; Beolchini, F.; Prisciandaro, M. Sorption of copper by olive mill residues. Water Res. 2003, 37, 4895–4903. [Google Scholar] [CrossRef]
  19. Gharaibeh, S.H.; Abu-el-sha’r, W.Y.; Al-Kofahi, M.M. Removal of selected heavy metals from aqueous solutions using processed solid residue of olive mill products. Water Res. 1998, 32, 498–502. [Google Scholar] [CrossRef]
  20. Pagnanelli, F.; Toro, L.; Veglio, F. Olive mill solid residues as heavy metal sorbent material: A preliminary study. Waste Manag. 2002, 22, 901–907. [Google Scholar] [CrossRef]
  21. Pagnanelli, F.; Mainelli, S.; Veglio, F.; Toro, L. Heavy metal removal by olive pomace: Biosorbent characterization and equilibrium modelling. Chem. Eng. Sci. 2003, 58, 4709–4717. [Google Scholar] [CrossRef]
  22. Hawari, A.; Rawajfih, Z.; Nsour, N. Equilibrium and thermodynamic analysis of zinc ions adsorption by olive oil mill solid residues. J. Hazard. Mater. 2009, 168, 1284–1289. [Google Scholar] [CrossRef] [PubMed]
  23. Nuhoglu, Y.; Malkoc, E. Thermodynamic and kinetic studies for environmentaly friendly Ni (II) biosorption using waste pomace of olive oil factory. Bioresour. Technol. 2009, 100, 2375–2380. [Google Scholar] [CrossRef] [PubMed]
  24. Anbia, M.; Asl Hariri, S. Removal of methylene blue from aqueous solution using nanoporous SBA-3. Desalination 2010, 261, 61–65. [Google Scholar] [CrossRef]
  25. Senthilkumaar, S.; Kalaamani, P.; Subburaam, C.V. Liquid phase adsorption of crystal violet onto activated carbons derived from male flowers of coconut tree. J. Hazard. Mater. 2006, 136, 800–808. [Google Scholar] [CrossRef] [PubMed]
  26. Cinar, M.; Coruh, A.; Karabacak, M. A comparative study of selected disperse azo dye derivatives based on spectroscopic (FT-IR NMR and UV–Vis) and nonlinear optical behaviors. Spectrochim. Acta Part A 2014, 122, 682–689. [Google Scholar] [CrossRef] [PubMed]
  27. Raditoiu, V.; Raditoiu, A.; Wagner, L.; Amariutei, V.; Raduly, M.; Nicolaerev, C.A. Disperse Dyes Functionalized with Trialkoxysilane Groups. Rev. Chim. (Buchar.) 2011, 62, 409–414. [Google Scholar]
  28. Ip, A.W.M.; Barford, J.P.; McKay, G. Reactive Black dye adsorption/desorption onto different adsorbents, Effect of salt surface chemistry pore size and surface area. J. Colloid Interface Sci. 2009, 337, 32–38. [Google Scholar] [CrossRef] [PubMed]
  29. Tawarah, M.K.; Rababah, R.A. Characterization of some Jordanian crude and exhausted olive pomace samples. Green Sustain. Chem. 2013, 3, 146–162. [Google Scholar] [CrossRef]
  30. Kabakci, S.B.; Aydemir, H. Pyrolysis of Olive Pomace and Copyrolysis of Olive Pomace with Refuse Derived Fuel. Environ. Prog. Sustain. Energy 2013, 33, 649–656. [Google Scholar] [CrossRef]
  31. Sundberg, B.; Mellerowicz, E.; Persson, P. XPS study of living tree. Surf. Interface Anal. 2002, 34, 284–288. [Google Scholar]
  32. La Rubia-García, M.D.; Yebra-Rodríguez, A.; Eliche-Quesada, D.; Corpas-Iglesias, F.A.; Lopez-Galindo, A. Assessment of olive mill solid residue (pomace) as an additive in lightweight brick production. Constr. Build. Mater. 2012, 36, 495–500. [Google Scholar] [CrossRef]
  33. Mao, H.; Wang, C.; Wang, Y. Synthesis of polymeric dyes based on waterborne polyurethane for improved color stability. New J. Chem. 2015, 39, 3543–3550. [Google Scholar] [CrossRef]
  34. Mao, H.; Yang, F.; Wang, C.; Wang, Y.; Yaob, D.; Yina, Y. Anthraquinone chromophore covalently bonded blocked waterborne polyurethanes, synthesis and application. RSC Adv. 2015, 5, 30631–30639. [Google Scholar] [CrossRef]
  35. Akar, T.; Tosun, I.; Kaynak, Z.; Ozkara, E.; Yeni, O.; Sahin, E.N.; Akar, S.T. An attractive agro-industrial by-product in environmental cleanup, dye biosorption potential of untreated olive pomace. J. Hazard. Mater. 2009, 166, 1217–1225. [Google Scholar] [CrossRef] [PubMed]
  36. Calero, M.; Pérez, A.; Blázquez, G.; Ronda, A.; Martín-Lara, M.A. Characterization of chemically modified biosorbents from olive tree pruning for the biosorption of lead. Ecol. Eng. 2013, 58, 344–354. [Google Scholar] [CrossRef]
  37. Timofei, S.; Schmidt, W.; Kurunczi, L.; Simon, Z. A review of QSAR for dye affinity for cellulose fibres. Dyes Pigment. 2000, 47, 5–16. [Google Scholar] [CrossRef]
  38. Dollendorf, C.; Kreth, S.K.; Choi, S.W.; Ritter, H. Polymerization of novel methacrylated anthraquinone dyes. Beilstein J. Org. Chem. 2013, 9, 453–459. [Google Scholar] [CrossRef] [PubMed]
  39. Rizzi, V.; Fini, P.; Fanelli, F.; Placido, T.; Semeraro, P.; Sibillano, T.; Fraix, A.; Sortino, S.; Agostiano, A.; Giannini, C.; et al. Molecular interactions characterization and photoactivity of Chlorophyll a/chitosan/2-HP-β-cyclodextrin composite films as functional and active surfaces for ROS production. Food Hydrocoll. 2016, 58, 98–112. [Google Scholar] [CrossRef]
Scheme 1. Chemical structures of Disperse Orange 30 (DO) and Disperse Red 167 (DR) dyes.
Separations 04 00029 sch001
Figure 1. Effect of sieved Olive Pomace (OPP) amount (gram for 40 mL of dye solutions) on the adsorption capacity qt (mg·g−1) for Direct Orange (DO) (A) and Direct Red (DR) (B) dyes removal from aqueous/acetic acid (5 × 10⁻⁵ M) solutions, pH 3.5.
Separations 04 00029 g001
Figure 2. Thermogravimetric analyses (TG) of OPP (Black line), and OPP + DO, OPP + DR composite materials (blue and red lines) (A); differential Thermogravimetric analyses (DTG) of the same samples (B).
Separations 04 00029 g002
Figure 3. Comparison between detailed views (wavenumbers range: 600–4000 cm-1) of FTIR-ATR spectra of DO (A); of OPP (B) and of OPP + DO composite material (C).
Separations 04 00029 g003
Table 1. Effect of Olive pomace (OP) and sieved Olive Pomace (OPP ) amount (in grams for 40 mL of dye solutions) on the contact time enough to ensure the reported uptake (% of adsorption) of Direct Red (DR) and Direct Orange (DO) dye molecules from aqueous/acetic acid solutions (5 × 10⁻⁵ M, pH 3.5).
OP or OPPOP + DOOP + DR
g%OP Time (min)%OPP Time (min)%OP Time (min)%OPP Time (min)
0.25851809840991809830
0.50991809730971209720
1.009760991098309910
3.009830971097109710
Table 2. Effect of consecutive cycles of DO and DR dye adsorption on contact time evaluated fixing the OPP amount (1.00 g) and ensuring the maximum uptake of dyestuffs from aqueous/acetic acid solutions (Volume 40 mL, pH 3.5). Dye concentration 5 × 10⁻⁵ M.
CyclesOPP + DOOPP + DR
Efficiency (%)Time (min)Efficiency (%)Time (min)
197109710
298109810
396209520
495209520
595209620
Table 3. Effect of DO and DR dye adsorption/desorption on the contact time evaluated considering the most efficient uptake or recovery of dye molecules from aqueous/acetic acid solutions (Volume 40 mL, pH 3.5. Dye concentration 5 × 10⁻⁵ M, amount of OPP 1.00 g.
CyclesAdsorption/DesorptionOPP + DOOPP + DR
Efficiency (%)Time (min)Efficiency (%)Time (min)
1Adsorption99109710
Desorption9812086120
2Adsorption98209830
Desorption9712085120
3Adsorption97309630
Desorption9812084120
4Adsorption96409960
Desorption9712098120
5Adsorption97309660
Desorption9812075120

