Article

A Novel Protocol to Monitor Trace Levels of Selected Polycyclic Aromatic Hydrocarbons in Environmental Water Using Fabric Phase Sorptive Extraction Followed by High Performance Liquid Chromatography-Fluorescence Detection

by
Shivender Singh Saini
1,
Abuzar Kabir
2,*,
Avasarala Lakshmi Jagannadha Rao
1,
Ashok Kumar Malik
1,* and
Kenneth G. Furton
2
1
Department of Chemistry, Punjabi University, Patiala 147002, India
2
International Forensic Research Institute, Department of Chemistry and Biochemistry, Florida International University, Miami, FL 33193, USA
*
Authors to whom correspondence should be addressed.
Separations 2017, 4(2), 22; https://doi.org/10.3390/separations4020022
Submission received: 21 March 2017 / Revised: 9 May 2017 / Accepted: 25 May 2017 / Published: 8 June 2017
(This article belongs to the Special Issue Trends in Microextraction Techniques for Sample Preparation)

Abstract

:
Fabric phase sorptive extraction (FPSE) combines the advanced material properties of sol–gel derived microextraction sorbents and the flexibility and permeability of fabric to create a robust, simple and green sample preparation device. It simultaneously improves the extraction sensitivity and the speed of the extraction by incorporating high volumes of sponge-like, porous sol–gel hybrid inorganic–organic sorbents into permeable fabric substrates that are capable of extracting target analytes directly from both simple and complex aqueous sample matrices. For the first time, this technique was applied to the trace-level determination of selected polycyclic aromatic hydrocarbons (PAHs) in environmental water samples using a non-polar sol–gel C18 coated FPSE media. Several extraction parameters were optimized to improve the extraction efficiency and to achieve a high detection sensitivity. Validation tests of spiked samples showed good linearity for four selected PAHs (R2 = 0.9983–0.9997) over a wide range of concentrations (0.010–10 ng/mL). Limits of detection (LODs) and quantification (LOQs) were measured at pg/mL levels; 0.1–1 pg/mL and 0.3–3 pg/mL, respectively. Inter- and intra-day precision tests showed variations of 1.1%–4.1% for four selected PAHs. Average absolute recovery values were in the range of 88.1%–90.5% with relative standard deviations below 5%, surpassing the values predicted by the recovery prediction model. Finally, the developed FPSE-HPLC-FLD protocol was applied to analyze 8 environmental water samples. Out of four selected PAHs, fluoranthene (Flu) and phenanthrene (Phen) were the most frequently detected in four samples, at concentrations of 5.6–7.7 ng/mL and 4.1–11 ng/mL, respectively, followed by anthracene (Anth) and pyrene (Pyr) in two samples. The newly developed FPSE-HPLC-FLD protocol is simple, green, fast and economical, with adequate sensitivity for trace levels of four selected PAHs and seems to be promising for routine monitoring of water quality and safety.

1. Introduction

Polycyclic aromatic hydrocarbons are toxic, carcinogenic and mutagenic organic compounds, and can exert immunologic and reproductive effects. They are introduced into the environment from both natural and anthropogenic sources, typically formed as unintentional byproducts of the incomplete combustion of organic matter. PAHs are ubiquitous in nature and the most damaging pollutants with regard to the ecosystem [1,2,3,4,5]. Although they have low water solubility and exist in the environment at very low concentrations, PAHs are strongly bioaccumulative (e.g., by fish) and can, therefore, pass up the food chain to top predators, including humans [6,7]. Natural inputs such as forest and prairie fires, volcanic eruptions and anthropogenic inputs, such as oil spills, waste incineration, coke and asphalt production, oil refining, aluminum production, urban runoff, emissions from combustion and industrial processes are the main sources of PAHs in the environment [8,9,10]. The elevated concentrations of PAHs in the environment, together with their ecological toxicity and health risk for humans, have spawned numerous environmental studies [11,12,13,14]. Due to their environmental concern, PAHs are included in the USEPA (United States Environmental Protection Agency) and in the EU (European Union) priority lists of pollutants [15]. Human exposure to PAHs occurs mainly by direct inhalation of polluted air and tobacco smoke, dietary intake of smoked food stuffs, direct intake of and contact with contaminated water, direct contact with contaminated soil and dermal contact with soot, tars and oils [16]. PAHs enter the aquatic environment through run off from contaminated roads or sealed parking lots [17], urban and industrial waste water discharge, direct spillage and wet and dry deposition of atmospheric contaminants [18]. Therefore, trace determination of PAHs in water matrices [19] is considered to be a valuable tool in risk assessment, remediation and management of PAHs in the environment.
In this study, four selected small PAHS including anthracene (a linear three ring PAH), phenanthrene (a fused three ring PAH), pyrene (a fused four ring PAH), and fluoranthene (a non-alternant four ring PAH) (Figure 1).
Anthracene is used as a raw material in the industrial production of hydrogen peroxide and in the manufacturing of alizarin and anthraquinone dyes for cotton fibers [20]. Phenanthrene, a tricyclic aromatic hydrocarbon, has a “K-region” and a “bay-region”, where the main carcinogenic species can be formed and is therefore commonly used as a model substrate for carcinogenic studies [21]. Fluoranthene, a non-alternant PAH, contains a five-member ring and is a persistent environmental organic pollutant structurally similar to other environmentally important compounds such as fluorene, dibenzothiophene, acenaphthylene, carbazole, dibenzofuran, and dibenzodioxin, i.e., compounds of [22,23]. Pyrene occurs at relatively high concentrations in PAH mixtures and is one of the most highly concentrated PAHs detected in drinking water [24].
Until now, numerous protocols comprising gas chromatography (GC) and high-performance liquid chromatography (HPLC) have been successfully developed for the determination of PAHs in the environment [25,26,27,28,29]. However, since PAHs are generally present at trace levels in the environment and are accompanied by diversified matrices, they cannot be directly handled by analytical instruments. This means that sample pre-treatment is required, with the aim of concentrating the PAHs, as well as eliminating or decreasing interference [30]. For the isolation of PAHs in environmental matrices, various sample pre-treatment techniques have been proposed, including solid-phase extraction (SPE) [31,32], liquid-liquid extraction (LLE) [33], miniaturized homogeneous liquid-liquid extraction (MHLLE) [34], solid-phase microextraction (SPME) [35,36] and single drop microextraction (SDME) [37,38]. Although these techniques are very useful, they possess some serious drawbacks. For example, LLE and SPE are laborious, time consuming, utilize high volumes of organic solvents and sample solutions, often incur significant loss of analytes and have poor reproducibility. The shortcomings of SPME include high cost, fragility of the fiber, low thermal and chemical stability, swelling if exposed to organic solvents, limited lifetime and sample carry-over problems [39,40]. Breaking of the organic drop due to fast stirring, reduced extraction rate due to air bubble formation, time-consumption and non-equilibrium are the major drawbacks associated with SDME [41].
Nowadays, a number of unique materials have been synthesized and applied as sorbents for PAH extraction, including multi-walled carbon nanotubes [32], magnetic nanoparticles [42], and metal-organic frameworks [43]. However, the synthesis process of such materials is rather complex and often consumes large amounts of organic solvents and time. Therefore, new, versatile and high-performance adsorbents with a simple preparation process are still highly desirable.
Kabir et.al., in 2014 integrated the rich surface chemistry of cellulose cotton fabric substrates and sol–gel technology to develop a novel sorptive microextraction technique called fabric phase sorptive extraction (FPSE) The inherent advantages of the synthesized sorptive material include (1) a flexible hydrophobic/hydrophilic fabric substrate that can be bent, twisted and squeezed to insert directly into unmodified samples; (2) the ability to extract target analytes directly from a raw sample matrix i.e., environmental water, whole milk, whole blood, urine, saliva containing proteins, lipids, particulates, biomasses or debris without any sample pre-treatment; (3) a high loading capacity with unique and tunable selectivity; (4) the possibility of using any organic or aqueous-organic solvent mixture for elution/solvent back-extraction; (5) the capability to extract polar, nonpolar, acidic, and basic compounds; (6) the absence of a requirement for solvent evaporation and analyte reconstitution; (7) the fact that its operational simplicity meets green analytical chemistry and economic criteria as well. One major advantage of FPSE is its ability to immobilize highly polar polymers in a sol–gel hybrid organic–inorganic network, chemically bonded to the fabric substrate, resulting in a microextraction material that can efficiently extract both polar and nonpolar analytes directly from an aqueous sample matrix. This has been used in the analysis of a wide variety of analytes in environmental and biological samples [44,45,46,47].
PAHs are inherently nonpolar, hydrophobic compounds which do not ionize in water. Intuitively, the selective extraction of highly nonpolar analytes, such as PAHs, from an aqueous sample matrix would be facilitated by a hydrophobic sorbent as the extraction phase material [48] and consequently sol–gel C18 coated FPSE media containing long hydrophobic C18 chains has been evaluated and successfully applied in this case.
Herein, we describe the design and preparation of sol–gel C18 coated FPSE media and the development of a novel application protocol for the efficient extraction of trace amounts of four selected small PAHs of high environmental interest from aqueous solutions. The hydrophilic cellulose fabric substrate incorporated in the core of the adsorbent aids in the extraction kinetics by attracting water molecules containing PAHs towards its surface for a successful sorbent-analyte interaction, resulting in the trapping of the analyte on the FPSE media. Our strategy offers the following advantages in water analysis: (1) highly efficient analysis of PAHs (to ppt level concentrations); (2) simultaneous determination of four different PAHs in water using just one adsorbent; (3) facile regeneration of the adsorbent; (4) no solvent evaporation or analyte reconstitution is needed and (5) the FPSE strategy can be extended to design a range of adsorbents for sensitive determination of related pollutant compounds. This study serves the analytical and environmental community by providing a better and superior pathway for effective extraction and determination of trace PAHs in water matrices of domestic and environmental interest. In addition, HPLC-FLD was used for chromatographic separation of four PAHs with the advantage of a shorter analysis time and superior resolution and sensitivity. Finally, and most importantly, this is the first manuscript presenting the application of FPSE for the trace analysis of polycyclic aromatic hydrocarbons in aqueous media.

2. Materials and Methods

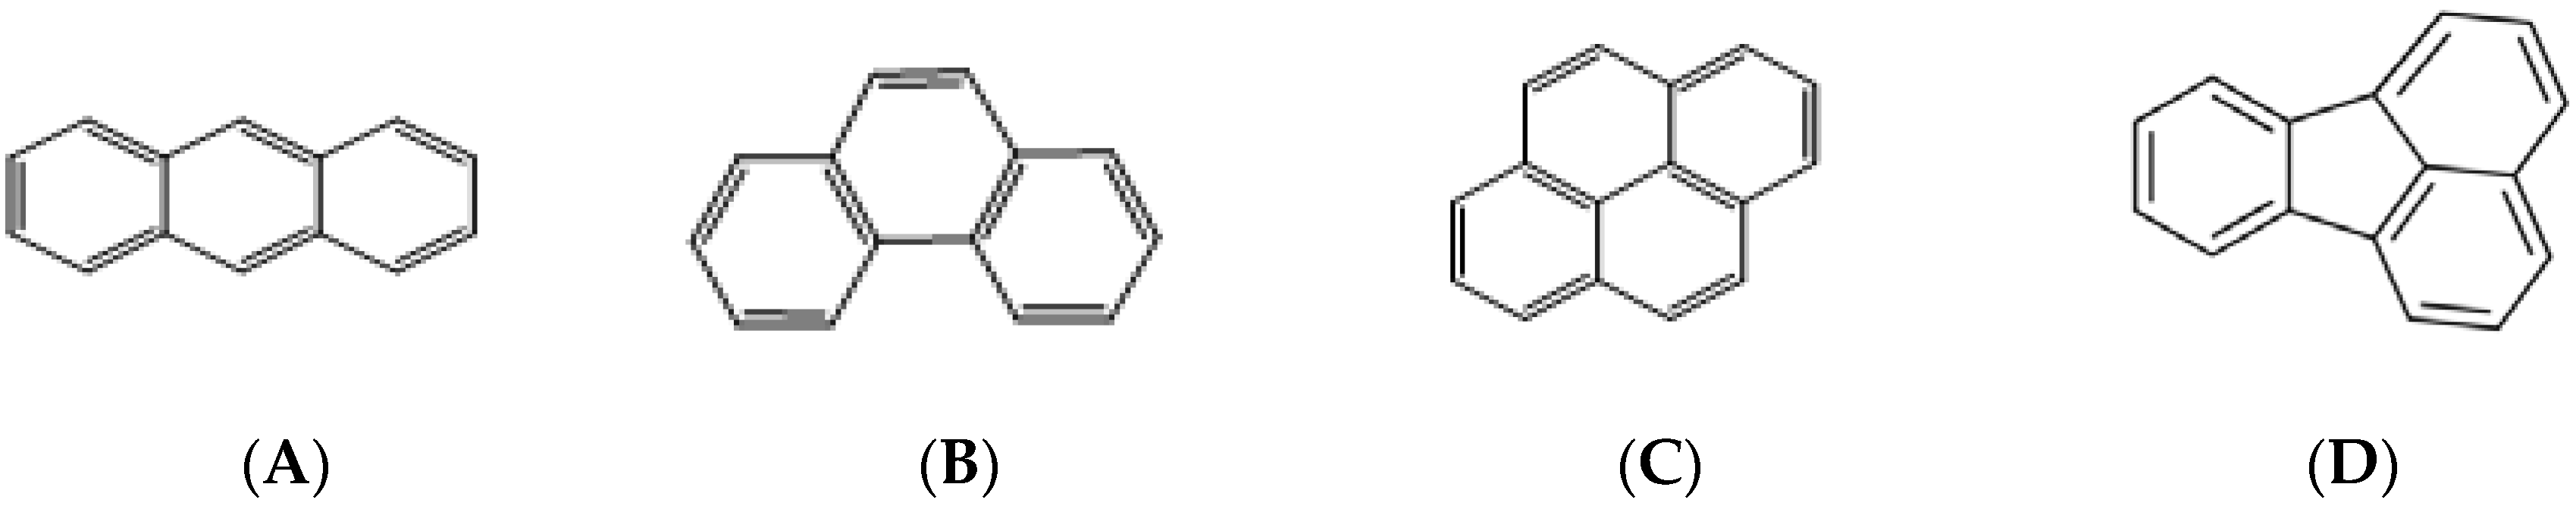
2.1. Choice of Target PAHs

The four selected small, low molecular weight PAHs are in the list of 16 priority PAHs designated by USEPA [1] and are source markers in water with diagnostic ratios for discriminating petrogenic from pyrolytic sources (fluoranthene/pyrene) [27], a model substrate for cancer studies (phenanthrene) [21], and the PAHs most detected in the highest concentrations in drinking water (fluoranthene, phenanthrene, pyrene, and anthracene) [49]. In addition to the feasibility of HPLC-FLD analysis, the commercial availability of PAHs for analytical standards was also considered.

2.2. Chemicals and Materials

The Muslin 100% cotton cellulose substrate for the creation of sol–gel C18 coated FPSE media was purchased from Jo-Ann Fabric (Miami, FL, USA). The precursors for sol–gel synthesis, octadecyl trimethoxysilane, tetramethyl orthosilicate, trifluoroacetic acid (TFA) and organic solvents such as acetone and dichloromethane were purchased from Sigma-Aldrich (St. Louis, MO, USA). Sodium hydroxide and hydrochloric acid were purchased from Thermo Fisher Scientific (Milwaukee, WI, USA).
Certified analytical standards of anthracene (Anth), fluoranthene (Flu), pyrene (Pyr), and phenanthrene (Phen) were purchased from Sigma-Aldrich (Darmstadt, Germany). HPLC grade methanol, acetonitrile and water were purchased from Sigma-Aldrich (Darmstadt, Germany) and filtered through a 0.22 μm filter before use. Stock solutions of each PAH were made at a concentration of 1 mg/mL, and a standard mixture of all four PAHs (1 mg/mL each) was prepared in methanol to achieve a response at the comparable level in HPLC-FLD. Working solutions were freshly prepared by diluting the mixed standard solution with HPLC-grade water to the required concentrations. All standards and working solutions were stored at 4 °C. All other reagents were of analytical grade.

2.3. Instrumentation

HPLC-FLD analysis of four PAHs was performed with a Dionex P680 HPLC pump (Germering, Germany) equipped with a Dionex Ultimate 3000 Fluorescence detector and the Chromeleon chromatography management software (Dionex, Germering, Germany). An Acentis Express reverse-phase C18 column (10 cm × 4.6 mm, particle size 5 µm, Supelco, Darmstadt, Germany) maintained at 25 °C was used for separation. Ultrasonic degassing was performed with an ultrasonic bath (Sarthak Scientific Services, Panchkula, India). The mobile phase consisted of water (solvent A) and acetonitrile (solvent B) and the flow rate was 1 mL/min. The isocratic elution mobile phase was set as follows: 15% A and 85% B with a total chromatographic run time of 10 min at λex = 260 nm and λem = 420 nm using a fluorescent detector. The injection volume was 20 μL.

2.4. Water Sample Collection

The water samples selected for the investigation included two river water samples collected from the Chakki river (Pathankot, Punjab, India), two rain water samples and two bore-well drinking water samples collected from the Punjabi university campus (Patiala, Punjab, India), two metal factory wastewater samples were collected from a chemical factory (Patiala, India). Before the experiments were performed, all the water samples were filtered through Whatman filter paper and then through 0.22 µm micropore membranes and stored at 4 °C in a refrigerator.

2.5. Preparation of Sol–Gel C18 Coated FPSE Media

Due to the presence of starch and other finishing chemicals on the commercially available cellulose fabric used in apparel making, the substrate required a thorough cleaning. At the same time, a chemical treatment was applied to the substrate that maximizes the number of available hydroxyl groups which are required to effectively bind the sol–gel network via a condensation reaction. Preliminary cleaning of the substrate was accomplished by immersing a 100 cm2 section of cotton cellulose fabric in deionized water for 30 min under constant sonication, followed by multiple rinsing steps with excess deionized (DI) water. For the surface chemical activation, the fabric was immersed in 1M NaOH solution for an hour under constant sonication. This step was followed by thorough rinsing with DI water and treatment with a 0.1M HCl solution for an hour to neutralize any residual NaOH which might still be on the fabric surface. Finally, the cleaned and activated cellulose substrate was dried and stored in an air-tight container until it was used for sol–gel C18 coating.
The sol solution used to create the sol–gel C18 coated FPSE media was prepared by sequentially mixing the sol–gel precursors methyl trimethoxysilane (MTMS); solvents methylene chloride and acetone; organically modified sol–gel precursor, octadecyl trimethoxysilane; sol–gel catalyst, trifluoroacetic acid (TFA) and water. In order to obtain a uniform sol solution for coating the fabric substrate, the molar ratio between methyl trimethoxysilane precursor:methylene chloride:acetone:trifluoroacetic acid:water was maintained at 1:2.33:1.94:0.5:0.20. The molar ratio between methyl trimethoxysilane and octadecyl trimethoxysilane was maintained at 1:0.38. To ensure that all the sol solution ingredients mixed homogeneously, the sol solution was vigorously vortexed for 3 min after adding each of the ingredients. The final sol solution was centrifuged for 5 min, followed by collection of the supernatant into a clean 3 oz. amber-colored glass reaction bottle. The solution was then sonicated for 10 min to remove trapped gaseous molecules from the sol solution.
The cleaned and pretreated cellulose fabric substrate was then gently immersed into the sol solution to initiate the substrate coating via a dip-coating process. The substrates were kept in the appropriate sol solutions for 2 h. During this surface coating period, a three-dimensional sol–gel network chemically bonded to the substrate was formed. At the end of the coating period, the sol solutions were expelled from the reaction bottle, the coated fabrics were dried in a desiccator and finally the sol–gel sorbent coated FPSE media was conditioned/aged in a home-made thermal conditioning device built inside a gas chromatography oven with continuous helium gas flow at 50 °C for 24 h. After conditioning/ageing, the sol–gel C18 coated FPSE media were cleaned sequentially with dichloromethane and methanol. Finally, the FPSE media were dried in the presence of continuous helium gas flow at 50 °C for 1 h. The FPSE media were then cut into 2.5 cm × 2.0 cm pieces, the typical application size for FPSE, and were stored in an airtight glass container for future use.

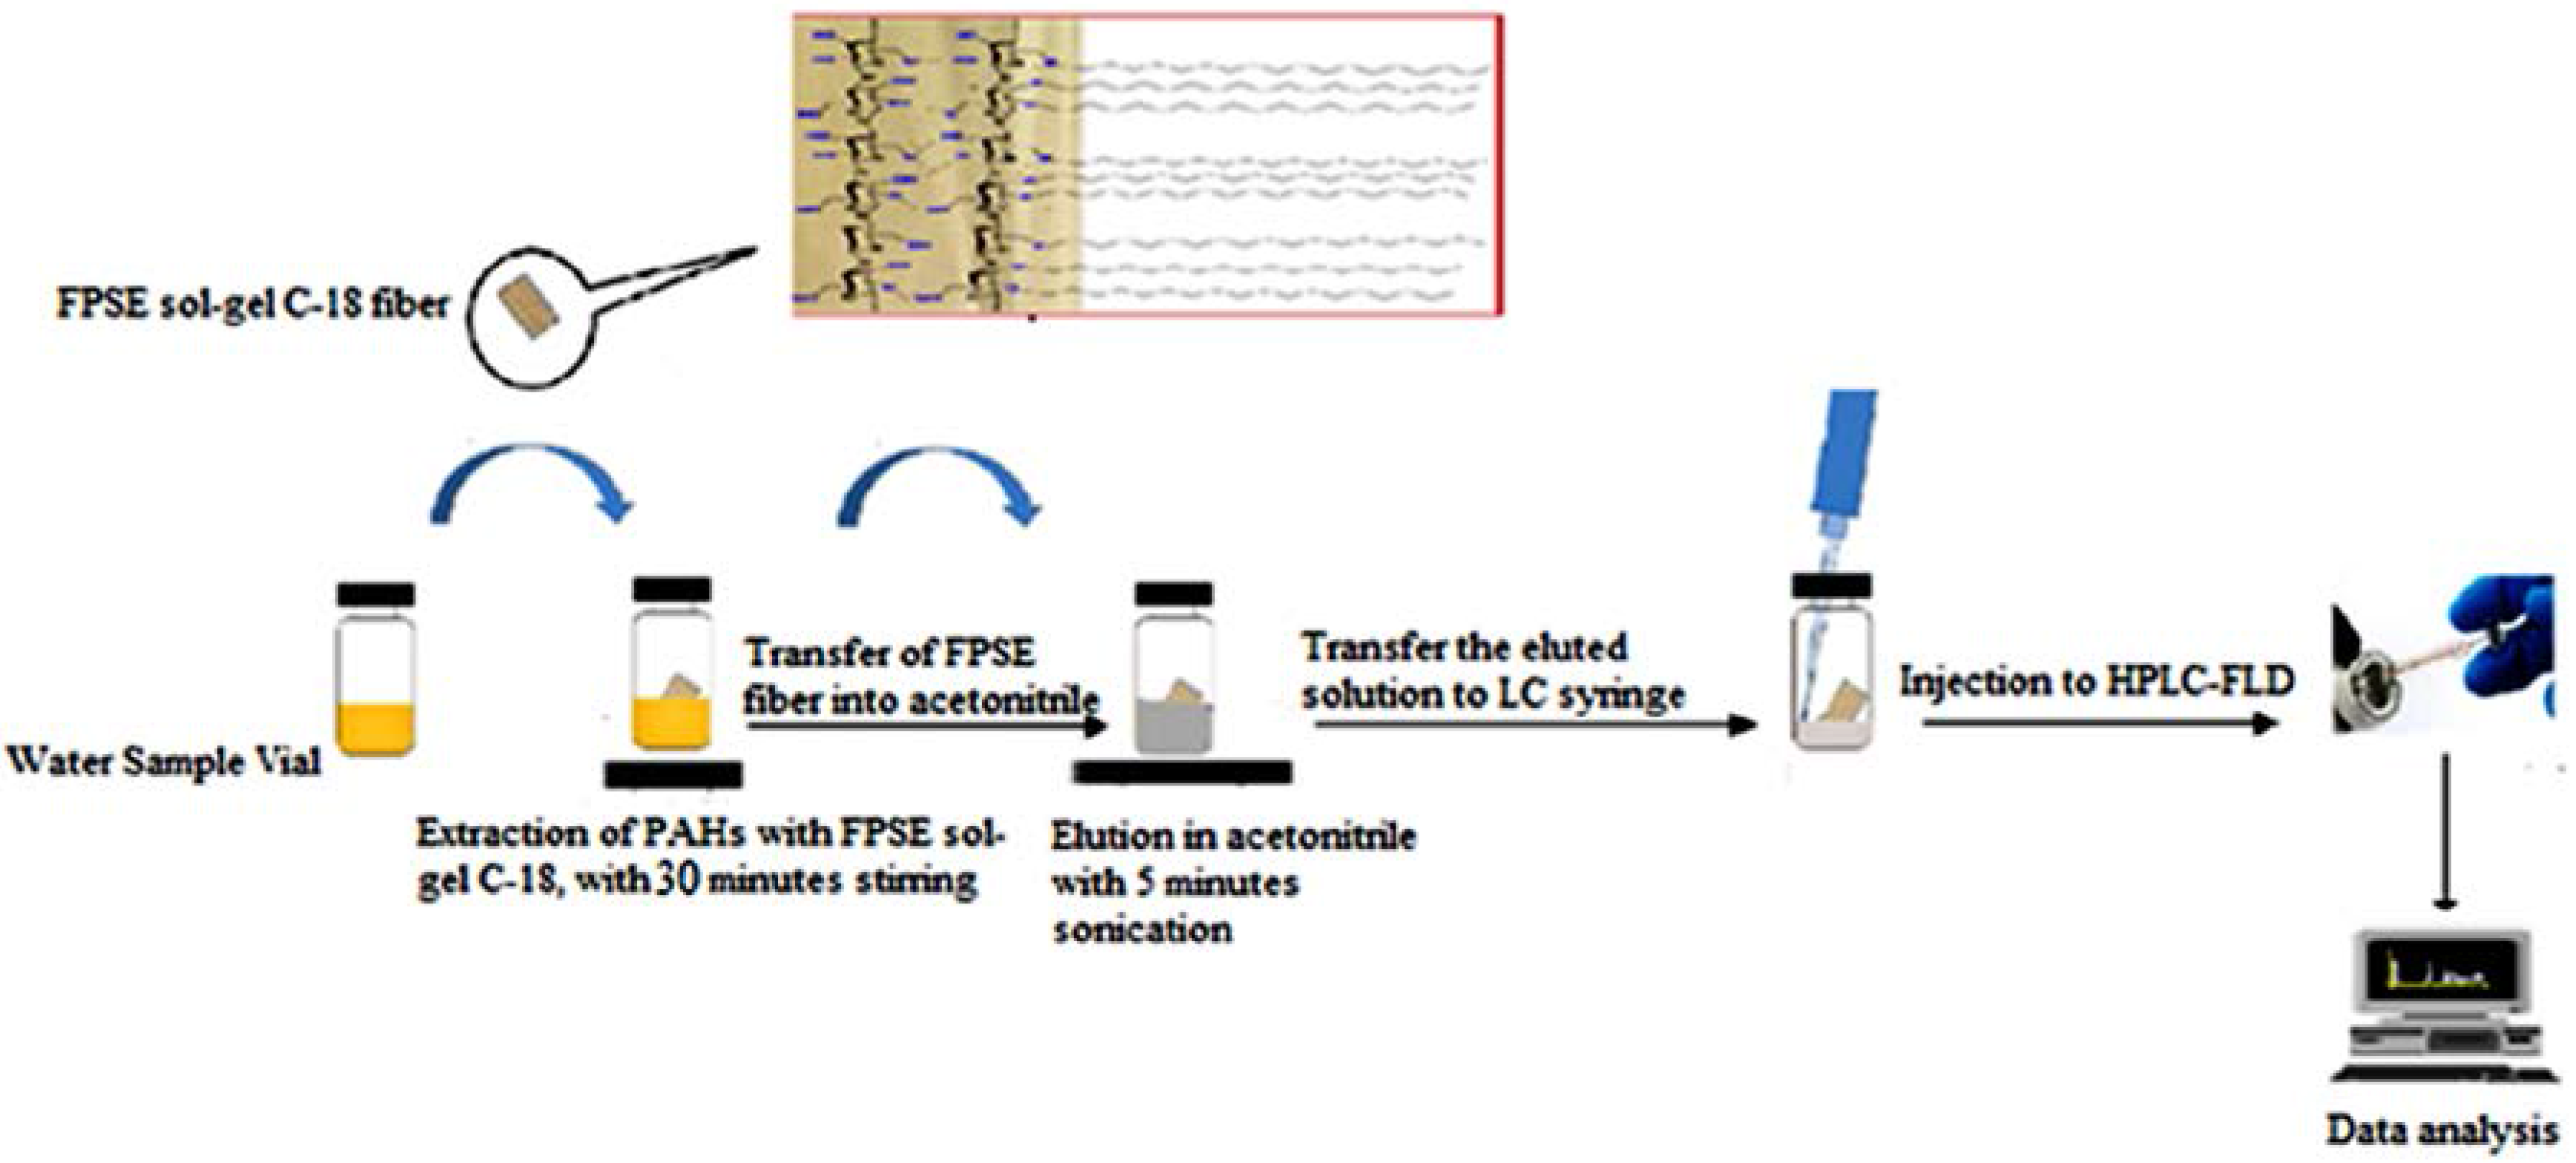
2.6. Fabric Phase Sorptive Extraction Procedure

Firstly, the sol–gel C18-coated FPSE media was conditioned in a mixture of 1 mL methanol and 1 mL acetonitrile for 5 min and then rinsed with 2 mL deionized water to remove any residual organic solvent. The FPSE procedure is shown in Figure 2.
The extraction process was performed quickly in a 20 mL glass vial containing 10 mL of the aqueous sample solution. A piece of sol–gel C18 coated FPSE media was directly immersed in the sample solution for 30 min under constant stirring at 1000 rpm at room temperature. After extraction from the sample solution, the PAHs were eluted from the sol–gel C18-coated FPSE media in 300 µL of acetonitrile with sonication for 5 min. Finally, 20 µL of this solution was injected directly into the HPLC-FLD system for analysis.

3. Results and Discussion

3.1. Selection of Fabric Phase Sorptive Extraction Sorbent Chemistry

Taking the nonpolar, hydrophobic characteristics of the selected PAHs into consideration (log Kow values between 4.45 and 5.16), it is obvious that a nonpolar sorbent would provide the best affinity towards the PAHs to selectively isolate them from complex environmental water sample matrix. As such, octadecyl trimethoxysilane was selected as the source of the C18 pendant group in the sol–gel silica network during the sol solution design. C18 has long been known as a nonpolar sorbent in solid phase extraction and in nonpolar stationary phase in reversed phase liquid chromatography. It is worth mentioning that the selectivity of commercially available C18 sorbent is substantially different from that of sol–gel C18 sorbent and often the latter demonstrates unique selectivity towards a wide range of analytes including polar, moderately polar and nonpolar analytes due the presence of residual surface silanol groups in the sol–gel C18 sorbent matrix.
Unlike the substrate used in C18 sorbent (silica particles), the substrate used in FPSE plays an active role in determining the overall polarity and selectivity of the FPSE media. A fabric substrate made of 100% cotton cellulose was selected as the support for sol–gel C18 coating because the hydrophilic nature of the substrate can cause water molecules to come close to the extraction device during extraction so that the requisite interactions between the C18 pendant groups and the PAHs can result in successful extraction of PAHs onto the FPSE media. The permeable structure of the fabric support also plays an important role as a pseudo-solid phase extraction disk and facilitates rapid analyte extraction due to the continuous diffusion of water through the FPSE media when under the influence of magnetic stirring during the extraction.

3.2. Characterization of Sol–Gel C18 Coated FPSE Media

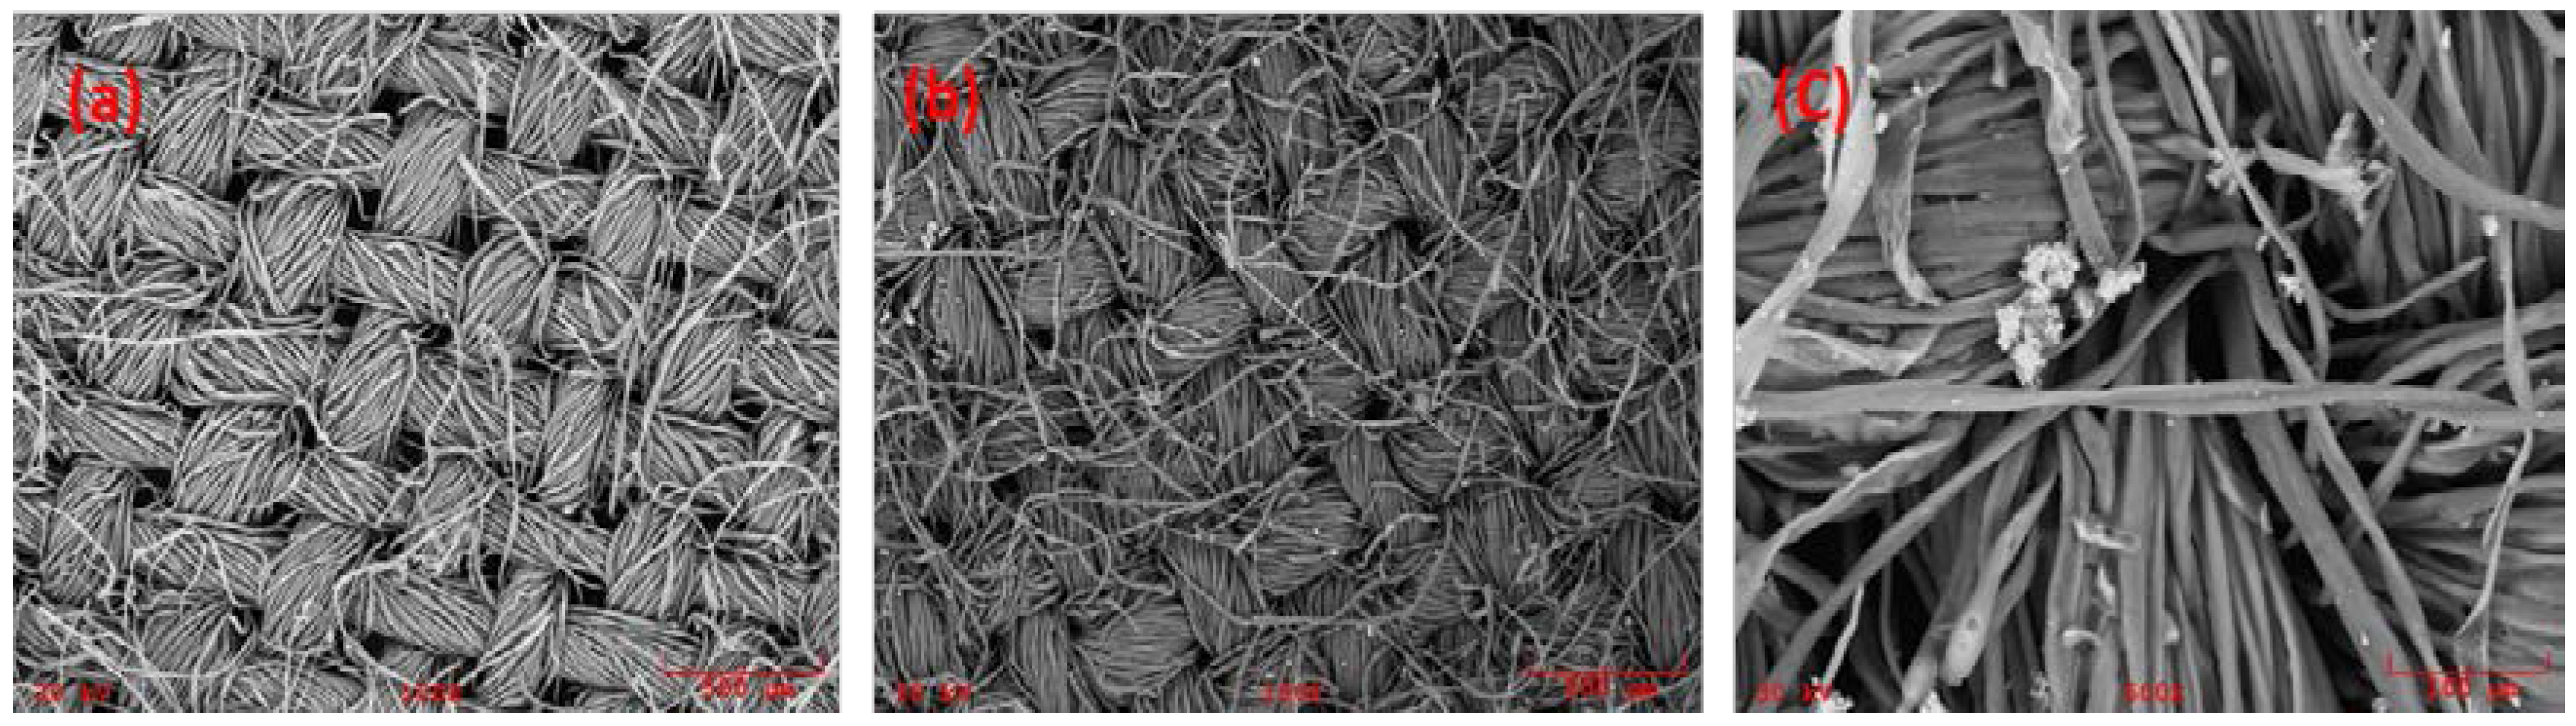
3.2.1. Scanning Electron Microscopy

Figure 3 represents the scanning electron micrographs (SEM) of (a) the uncoated Muslin cotton (100% cellulose) substrate at 100× magnification; (b) sol–gel C18 coated fabric phase sorptive extraction media at 100× magnification; and (c) sol–gel C18 coated fabric phase sorptive extraction media at 500× magnification.
The extraction efficiency of FPSE primarily depends on the sponge-like porous architecture of the sol–gel sorbent coating (for faster analyte diffusion) and the permeability of the fabric substrate that mimics a solid phase extraction disk. The highly porous sorbent coating as well as the permeability and hydrophilicity of the cellulose fabric synergistically allow the aqueous sample matrix to flow through the FPSE medium, leading to rapid interaction between the sorbent and the analytes. Consequently, the analytes are adsorbed on the sorbent with high efficiency in a short period of time. As such, it is important to study the surface morphology of the FPSE media before and after the coating to ensure that the pores of the fabric substrate are well maintained even after the sol–gel coating.
The SEM images demonstrated that the microstructures and the pores of the cellulose substrate were well preserved even after the sol–gel C18 sorbent coating. This flow-through extraction mechanism is only exploited in solid phase extraction (SPE), and is totally absent in solid phase microextraction and related techniques (such as stir bar sorptive extraction, thin film microextraction, etc.) due to the impermeable nature of the substrate used in these microextraction techniques. The flow-through extraction system consequently helps to achieve faster extraction equilibrium. The enlarged image of the sol–gel C18-coated FPSE media demonstrates that C18 coatings are homogeneously distributed on the fabric substrate surface while maintaining the pores of the substrate.

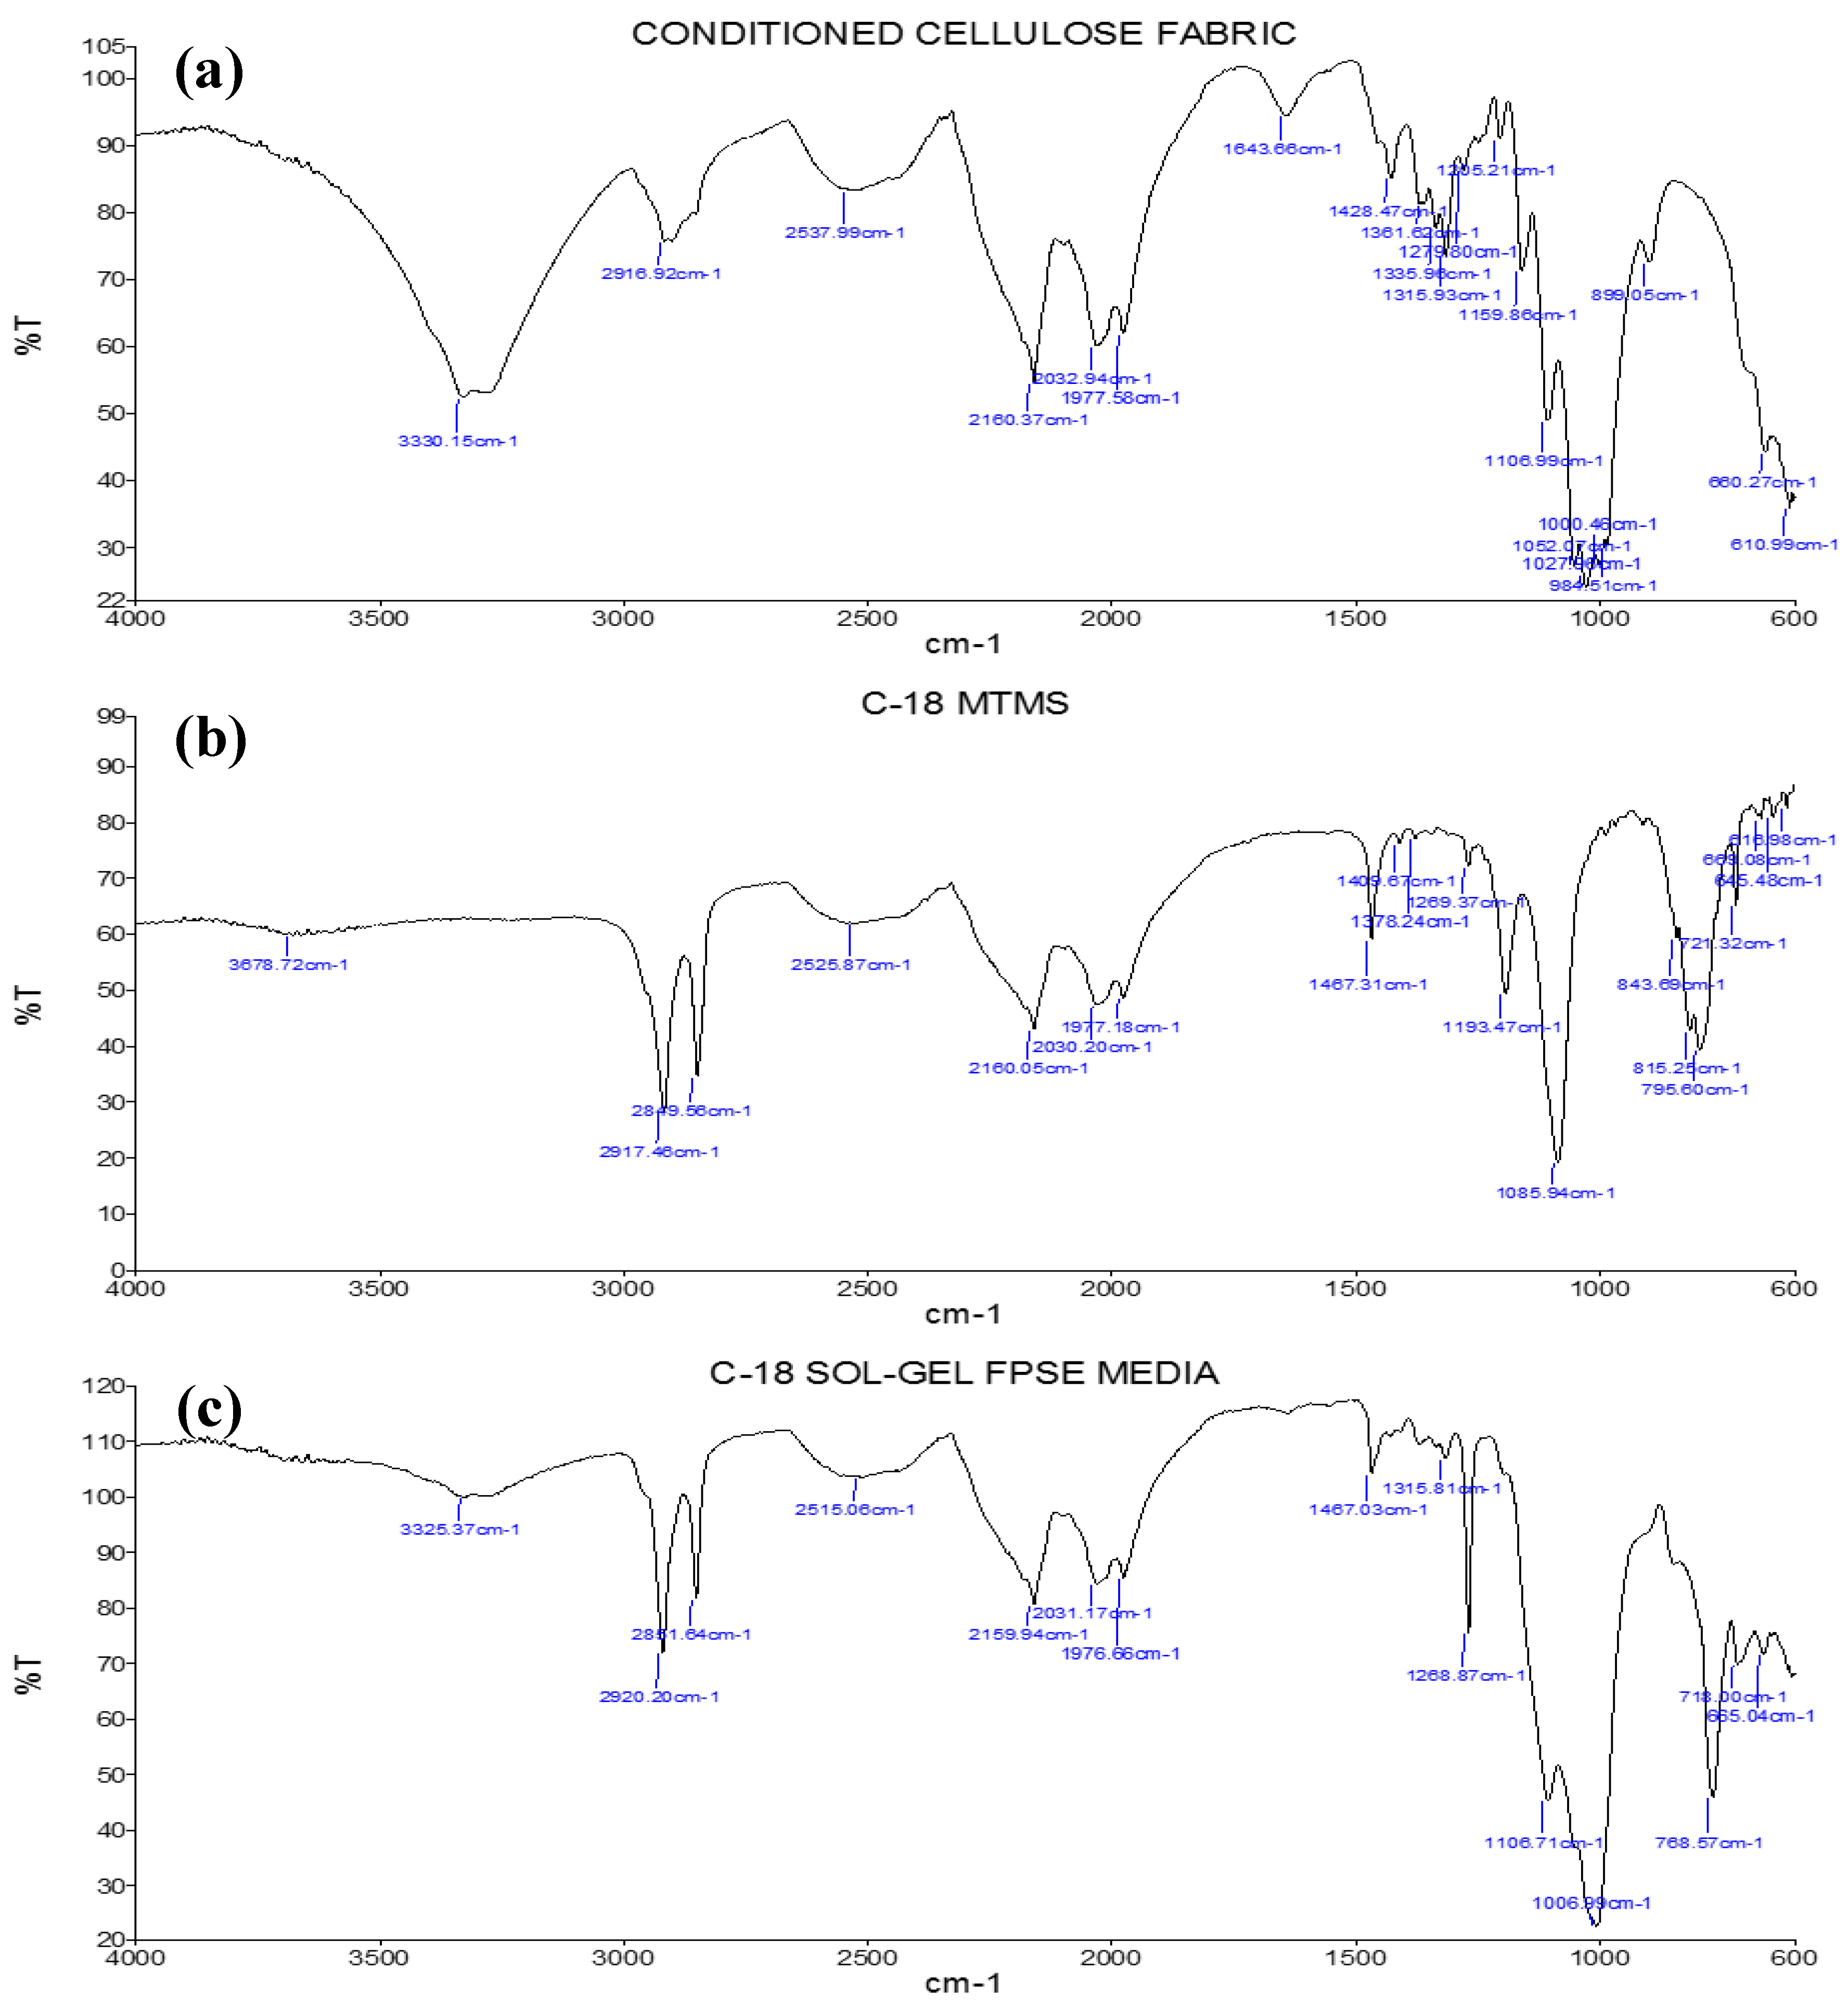
3.2.2. Fourier-Transform Infrared Spectroscopy (FT-IR)

Figure 4 illustrates FT-IR spectra representing (a) uncoated Muslin cotton (100% cellulose) fabric; (b) octadecyl trimethoxysilane; (c) sol–gel C18 coated fabric phase sorptive extraction media.
The FT-IR spectra of the uncoated Muslin cotton 100% cellulose fabric demonstrates characteristic absorption bands at ~3330 cm−1, 2916 cm−1, 1315 cm−1, and 1028 cm−1 that correspond to O–H, C–H, C–O vibration and C–H bending vibration, respectively [50]. The characteristic peaks of octadecyl trimethoxysilane appear at 2917 cm−1, and 2849 cm−1 which correspond to asymmetric and symmetric vibrations of –CH2–, –CH2– groups, respectively [51]. The strong peak at 1467 cm−1 and 1085 cm−1 are due to the vibration absorption of Si–O–C, and Si–O–Si, respectively. The strong peak at 815 cm−1 is assigned to Si–C bonds and the peak at 795 cm−1 is assigned to the vibration of (–CH2–)n (n ≥ 4) [52]. The characteristic peaks of sol–gel C18-coated FPSE media appeared at 2890 cm−1 and 2851 cm−1 which represent symmetric vibration of –CH2– and asymmetric vibration of –CH3, respectively. The same characteristic peaks are also seen in octadecyl trimethoxysilane spectra. In addition, the presence of ~1467 cm−1, ~1268 cm−1, ~1977 cm−1 in both the sol–gel C18 coated FPSE media and octadecyl trimethoxysilane strongly suggests the successful integration of octadecyl moieties into the sol–gel network. The substantial reduction of the O–H stretching vibrations (at 3325 cm−1) in sol–gel C18 coated FPSE media compared to uncoated cotton (100% cellulose) indicates the chemical integration of the sol–gel C18 network to the cellulose structure via condensation. Due to the chemical integration of sol–gel sorbent to the substrate surface, the resulting FPSE media offers a remarkably superior thermal, solvent and chemical stability than its commercial counterparts such as SPME, SBSE etc.

3.3. Optimization of the FPSE Procedure

In order to achieve accurate and sensitive chromatographic quantification of the trace PAHs in the water samples, the optimum conditions for using sol–gel C18 coated FPSE media were investigated. Several conditions affecting the extraction efficiency were optimized, including extraction time, sample volume, eluting solvent, elution time, volume of organic modifier, and salt concentration. Optimization experiments were performed using a standard aqueous solution of PAHs containing 0.10 µg/mL each of four PAHs to ensure a comparable level of response to each compound.

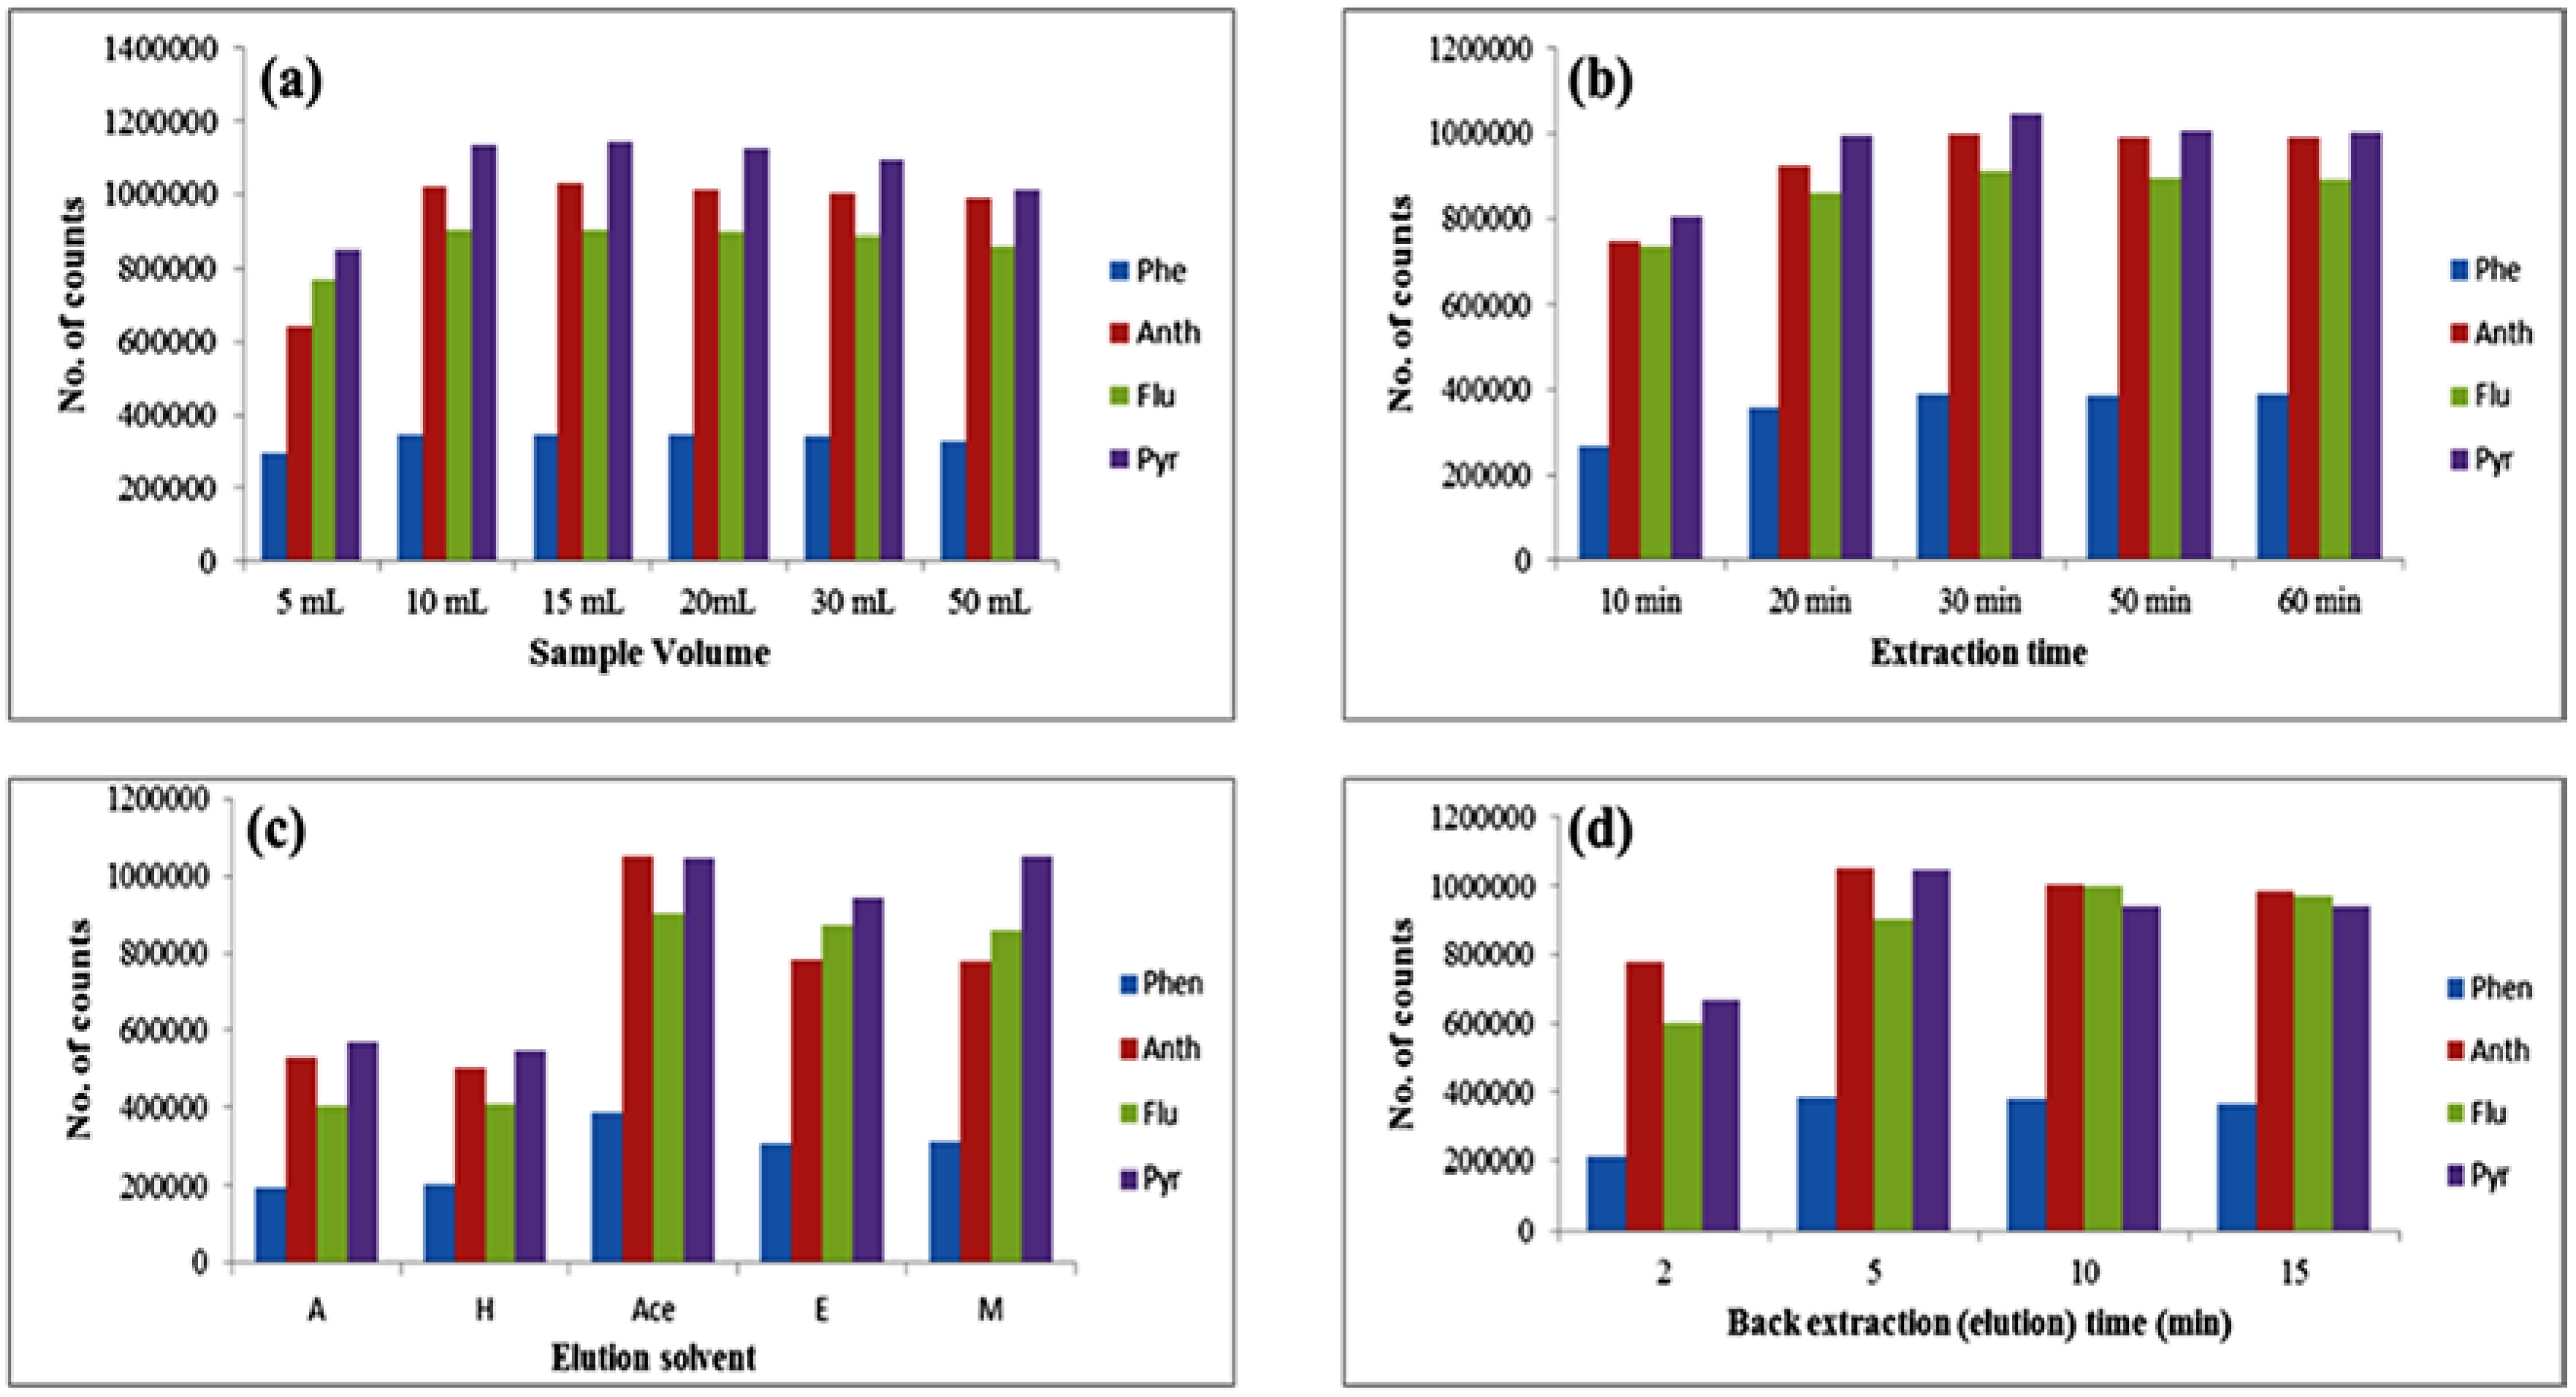
3.3.1. Optimization of Sample Volume

To obtain high enrichment factors and high recoveries for all PAHs, the initial sample volume should be as large as possible. Therefore, different volumes (5 mL, 10 mL, 15 mL, 20 mL) of an aqueous solution were investigated. It was found that the highest extraction efficiency was obtained with a sample volume of 10 mL, as shown in Figure 5a. As the sample volume was increased up to 15 mL, recovery increased and after 15 up to 20 mL no obvious change was observed. After 20 mL, recovery decreased up to 50 mL, inferring that the extraction efficiency was insufficient at volumes above 20 mL. Therefore, the initial sample volume was set at 15 mL for future FPSE protocols.

3.3.2. Optimization of Extraction Time

Another key factor affecting extraction efficiency is the extraction time and it so it was imperative that this factor be thoroughly investigated. The extraction time was set from 10 to 60 min. As shown in Figure 5b, recoveries of all four PAHs increased with extraction time as it was increased from 10 to 30 min, and then remained unchanged even when the time was increased up to 60 min, implying that the extraction equilibrium was achieved at about 30 min. Thirty minutes was therefore selected as the extraction time of FPSE protocol.

3.3.3. Optimization of Desorption Solvent and Time

As far as the FPSE protocol is concerned, PAH desorption from the sol–gel C18 coated FPSE media can significantly affect the sensitivity of PAH extraction. Therefore, choice of an appropriate elution solvent plays a key role in the process. Having considered the properties of PAHs, acetone (A), n-hexane (H), acetonitrile (Ace), ethanol (E) and methanol (M) were selected as potential elution solvents in this experiment. As shown in Figure 5c, acetone and n-hexane were poor eluents for PAHs. Methanol yielded the highest recovery for Pyr, whereas acetonitrile was preferable for recovery of all four PAHs. Therefore, acetonitrile was chosen as the elution solvent and was used for further studies. Furthermore, the elution efficiency also relies on the volume of the elution solvent. As shown in Supplementary Figure S1, for most of the PAHs, the recovery increased as the eluent volume increased from 100 µL to 300 µL, but remains nearly unchanged if the volume is further increased from 300 µL to 700 µL, after which dilution causes a decrease in recovery. To get maximum recovery with minimum solvent use, 300 µL of acetonitrile was selected for desorption.
In order to resolve any possible carry-over problems and to avoid any loss of PAHs, the sonication desorption time was further optimized. The process of desorption was carried out in an ultrasonic bath with desorption times of 1, 3, 5 and 10 min. The results shown in Figure 5d prove that the peak areas of PAHs increased as the desorption time increased from 1 min to 5 min, but remained unchanged as the desorption time was increased further. Therefore, 5 min was sufficient to achieve maximum desorption.

3.3.4. Effect of Salt Concentration and Organic Modifiers

Salt ions in the sample might also affect FPSE by competitive interaction between the salting-in and the salting-out effect. The salting-out effect causes the analyte to enhance its partition onto the sol–gel C18-coated FPSE media by decreasing its solubility in water, while the salting-in effect has the opposite effect. Thus, the effect of the addition of salt to the samples was investigated and is shown in Supplementary Figure S2. No obvious change was observed for the recoveries with KCl at 0–0.15 M, indicating that salt ion addition does not affect extraction efficiency. This is probably due to the low polarity of all four PAHs. Thus, no salt was added in the following experiments.
Addition of an organic modifier, such as methanol, might promote the extraction efficiency of FPSE for PAHs by preventing the FPSE C18 carbon chains from cross-linking and thus retaining the ability to contact the target analytes completely. It was found that methanol addition (0–3 mL) did not cause any changes in extraction efficiency as shown in Supplementary Figure S3. This was probably because of the fact that FPSE media coated with C18 hydrophobic long chains spreads out well in the form of a uniform film on both sides of cellulose fabric substrate, due to strong chemical bonding between the sol–gel sorbent and the fabric substrate. Therefore, no organic modifier is needed. This indicates that the sol–gel C18 coated FPSE media is stable in various solutions, and the extraction efficiency is independent of the salinity and the presence of an organic modifier.

3.4. Regeneration and Reusability of Sol–Gel C18 Coated FPSE Media

The durability of sol–gel C18 coated FPSE media was also investigated by extracting PAHs from a water sample 30 times using the same FPSE media. The FPSE media was regenerated with sonication in 10 mL acetonitrile for 15 min. The extraction efficiency of the sol–gel C18 coated FPSE media was almost unchanged after 30 extraction procedures the results of which are shown in Supplementary Figure S4. These results indicate that sol–gel C18 coated FPSE media can be repeatedly used for extraction.

3.5. Analytical Performance

All data were subjected to strict quality control procedures. The linearities of the chromatographic responses of the protocol were tested with calibration standards at seven concentration levels ranging from 0.01 to 10 ng/mL. Good linearities were observed for the four target PAHs, with all the correlation coefficients (R2) above 0.99. Limits of quantification (LOQs) (signal-to-noise ratio = 10) and limits of detection (LODs) (signal-to-noise ratio = 3) of the four target compounds are shown in Table 1.
The accuracy, precision and recovery studies were performed on 15 mL deionized organic-free water spiked with (low, medium, and high concentration levels) 0.01, 0.5 and 5 ng of each PAH per mL (five replicates). Mean recoveries ranged from 88.1% to 90.5% for all the target compounds. The mixture of standards was analyzed five times within a day. The relative standard deviations (RSD) of concentrations for all the targets ranged from 1.1% to 4.1% (Table 2), demonstrating the high precision of the analytical protocol. In order to ensure the accuracy of the analysis, all samples were replicated five times, and the final concentration averages were used.

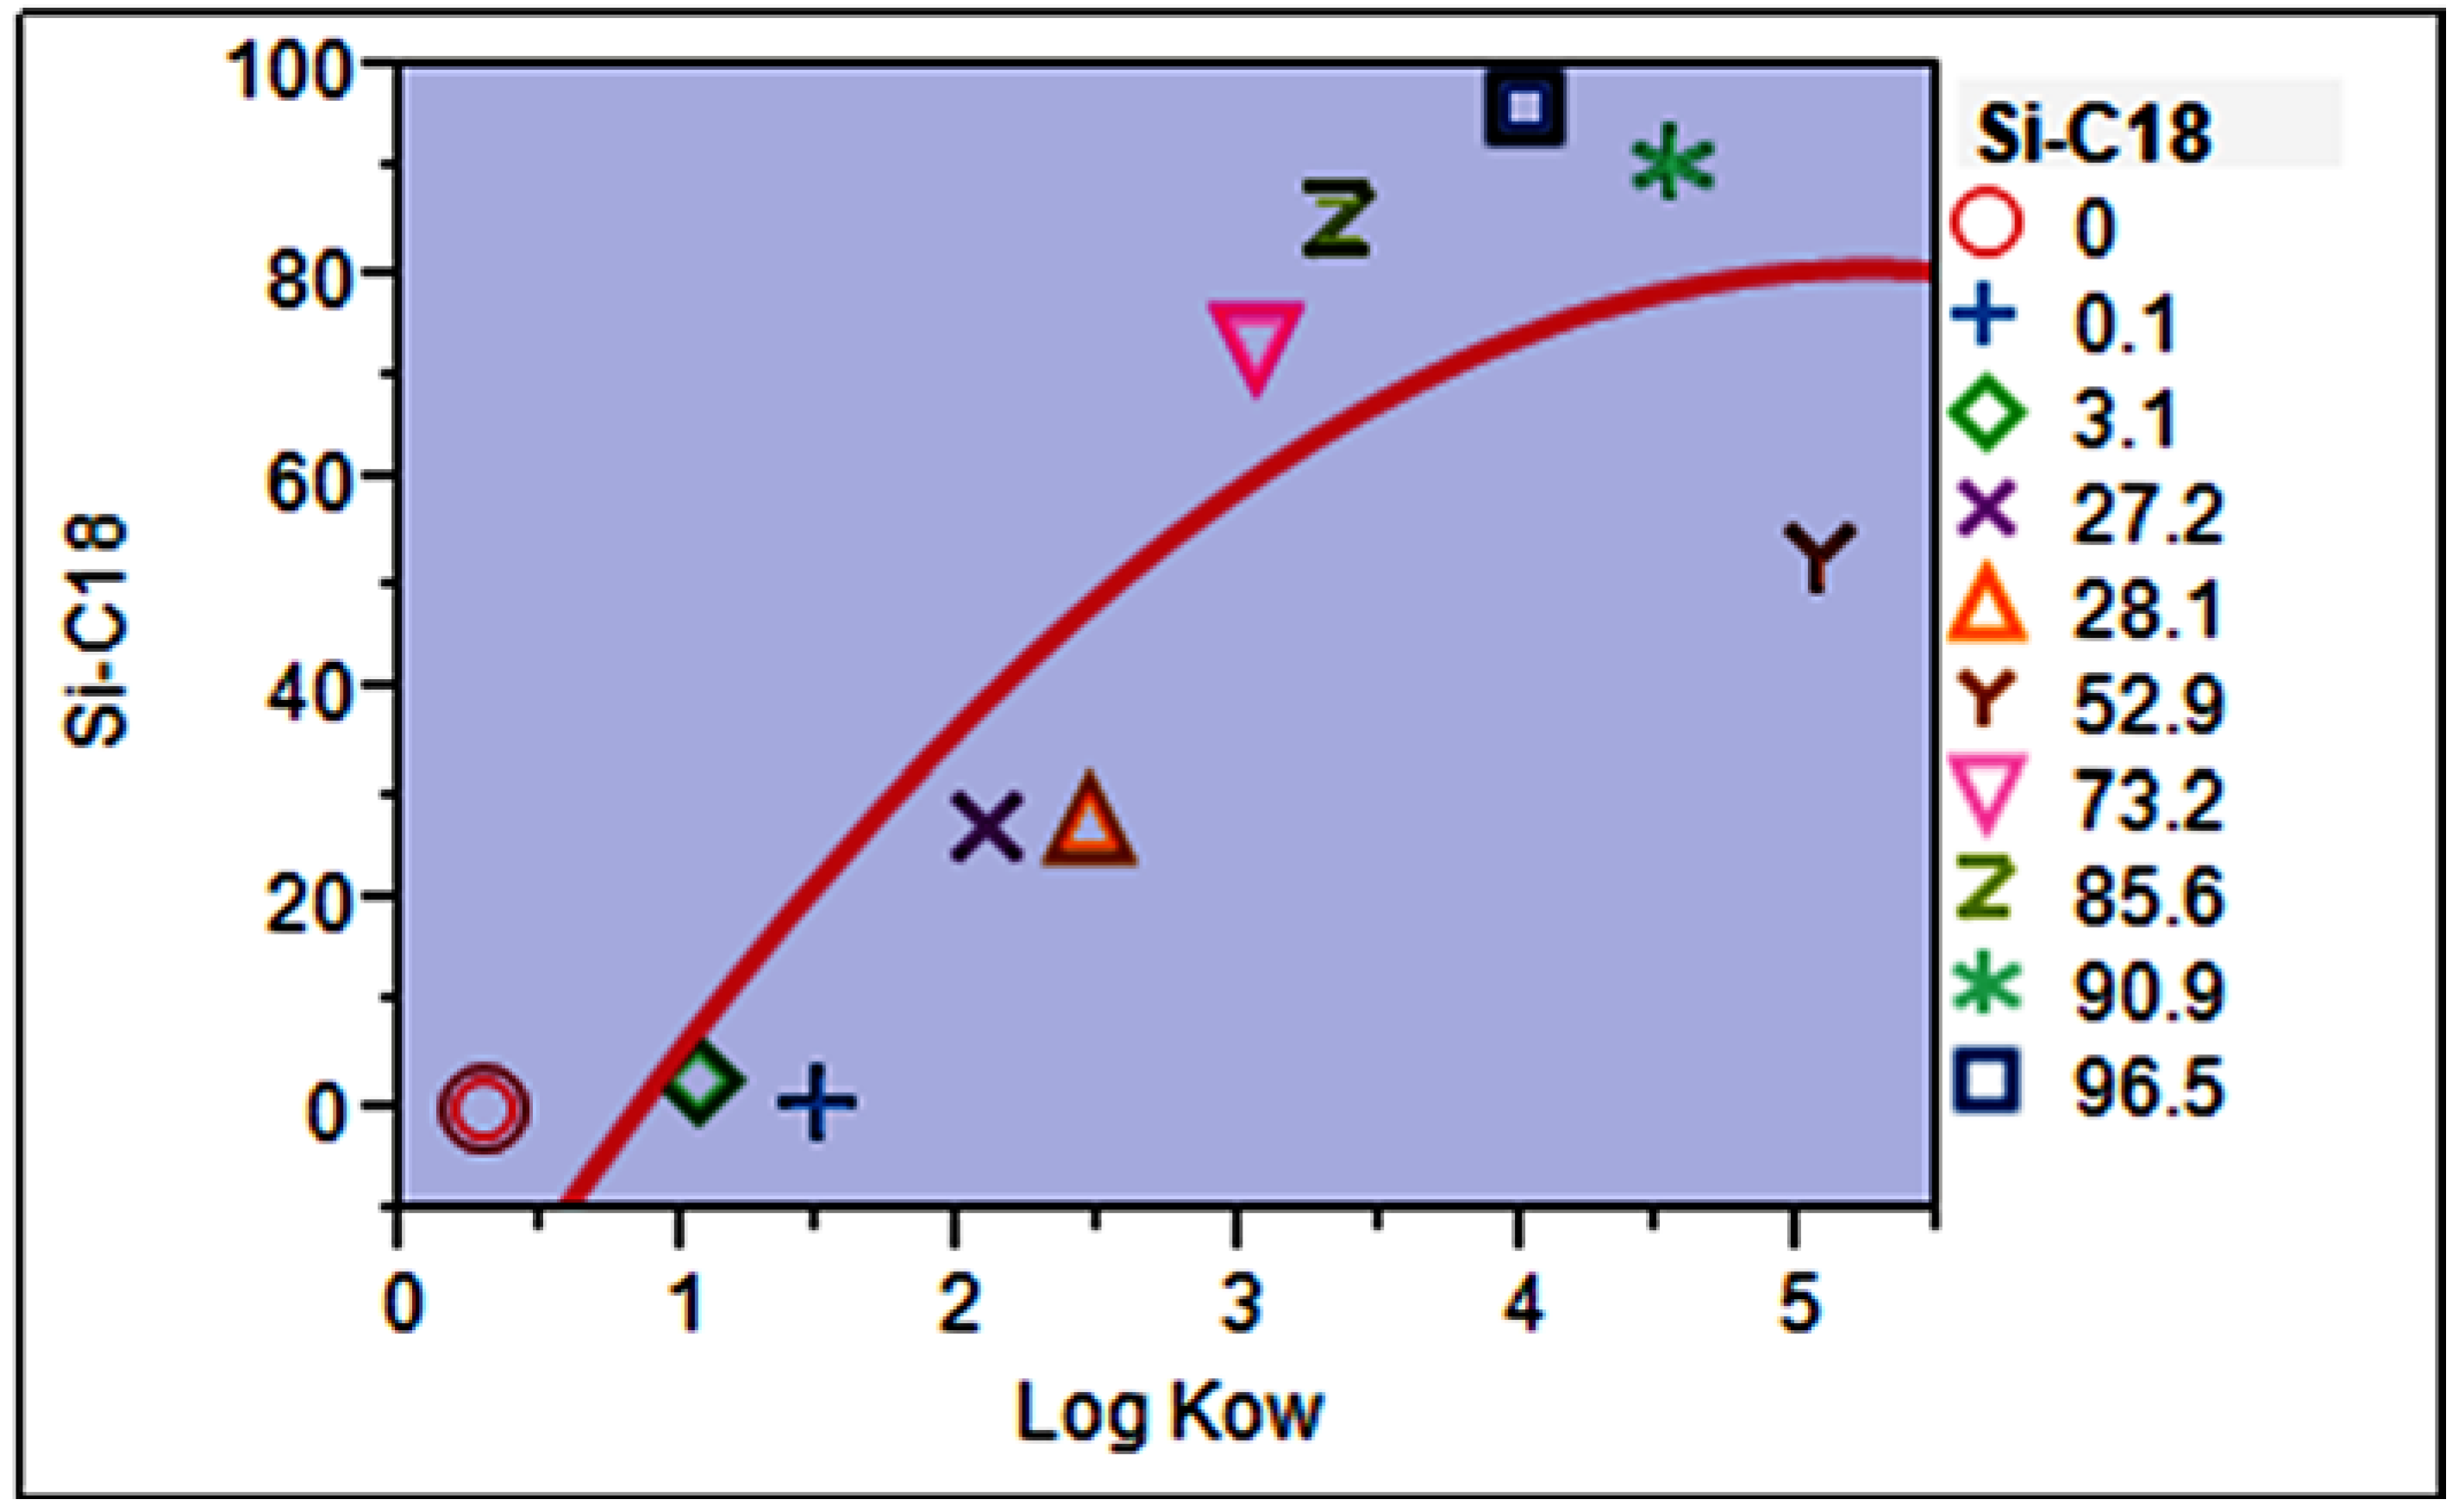
3.6. Mathematical Model for Predicting Extraction Efficiency (Absolute Recovery, %)

A mathematical model was created for sol–gel C18 coated FPSE media that can be used as a predictive tool to assess the extraction efficiency (expressed as the absolute recovery) of analytes on sol–gel C18-coated FPSE media using their log Kow values. A carefully chosen test mixture was created to develop the mathematical model, consisting of 10 compounds representing different polarity and functionality (log Kow values ranging from 0.3 to 5.07). The selected test compounds included piperonal (PIP), phenol (PHE), furfuryl alcohol (FA), benzodioxole (BDO), naphthalene (NAP), 4-nitrotoluene (4NT), 9-anthracene methanol (9AM), 1,2,4,5-tetramethyl benzene (TMB), triclosan (TCL) and diethylstilbestrol (DESB). The extraction recovery value of each compound from an aqueous solution of the test mixture was determined and the values were plotted against their log Kow values to obtain a second order mathematical model: Extraction efficiency (absolute recovery, %) = −2.274875 + 20.816015 × log Kow − 4.1478973 × (log Kow − 2.737)2. This second order mathematical model can be used to predict the extraction efficiency of sol–gel C18-coated FPSE media for a given analyte using its log Kow value. A graphical representation of the model is shown in Figure 6.
The predicted recovery values for four PAHs using the mathematical model and their actual recovery values are given in Table 3.
For all the target PAHs, the actual extraction recovery values were found to be higher than the predicted values obtained from the model. This was attributed to the strong hydrophobic interactions between the PAHs and the sol–gel C18 sorbent, in addition to efficient trapping of the PAHs on the sol-gel C18 extraction media with high primary contact surface area, high loading of sol–gel nanocomposite sorbent (in the form of ultrathin film), as well as the permeability of the extraction device that mimics a solid phase extraction disk (characterized by exhaustive extraction).

3.7. Application to Real Water Samples

Subsequently, the FPSE-HPLC-FLD protocol developed was applied for PAH determination in real environmental water samples: bore-well water, river water, rain water and factory wastewater. Quintuplicate analyses were performed and the concentrations found for the target PAHs are summarized in Table 3. In the four types of environmental water samples, the target four PAHs were not detected in bore-well water and rain water. Phen and Flu were detected in two river water samples and all four target PAHs were found in each of the two metal-fabrication factory wastewater samples (Table 4).
The two river water samples, collected from two different locations in the Chakki River in Pathankot were analyzed. At one outlet point of metal factory wastewater, Phen, Anth, Flu, Pyr were detected at 11 ng/mL, 7.8 ng/mL, 7.5 ng/mL and 5.8 ng/mL, respectively, while at second outlet point, Phen, Anth, Flu, Pyr were detected at 4.1 ng/mL, 3.7 ng/mL, 7.7 ng/mL and 3.0 ng/mL, respectively, (shown in Table 3); suggesting that the PAHs came mainly from the wastewater. These results indicated that the method could be successfully applied to PAH analysis in real water samples. The typical chromatograms of a river water sample and a metal factory waste water sample are presented in Figure 7.

3.8. Comparison of Sol–Gel C18 Coated FPSE Media with Other Sorbent Materials

The performance of the new analytical protocol with the sol–gel C18-coated FPSE media as the adsorbent material was also compared with other materials reported in the literature (as shown in Table 5).
The time required in sorbent preparation and the LOD values were compared. The LOD values achieved in the present research are lower than those reported in the literature. Furthermore, sol–gel C18-coated FPSE media as a sorbent has obvious advantages: preparation of sorbents often requires several days to complete the synthesis process, involves dozens or hundreds of milliliters of organic solvents, is time consuming and may cause environment pollution, whereas sol–gel C18-coated FPSE media, an advanced inorganic–organic hybrid material with tunable porosity, selectivity, thermal and chemical stability, high reproducibility and solvent resistance, requires less organic solvents, is fast and is a green analytical endeavor. Therefore, the proposed FPSE-HPLC-FLD protocol is proven to be a green, convenient, efficient and reliable method for the pre-concentration of trace PAHs from water samples.

4. Conclusions

In summary, for the first time, sol–gel C18-coated FPSE media was directly and successfully applied as a selective adsorbent for PAH analysis in real environmental water samples. The LODs obtained for four target PAH compounds using the novel analytical protocol were 0.1–1 pg/mL. Compared to traditional SPE methods, the sol–gel C18-coated FPSE media is simple to prepare and regenerate for recurring usage, thereby meeting the need for rapid analysis. In addition, the costs of the preparation of the sol–gel C18-coated FPSE media are economical and organic solvent consumption is minimal. Sol–gel C18-coated FPSE media can also be regenerated and reused more than 30 times. The FPSE media is also degradable and therefore more environment friendly. Utilizing the unique attributes of FPSE, a novel, simple, efficient, fast, sensitive, green, economical and reliable FPSE-HPLC-FLD protocol is presented for trace level determination of four environmentally important PAHs. This protocol is suitable for many applications in health-related water contamination studies and offers new analytical capabilities for water quality assurance, particularly for routine monitoring of the presence of PAHs in water samples in order to ensure water quality, safety and consumer protection.

Supplementary Materials

The following are available online at https://www.mdpi.com/2297-8739/4/2/22/s1, Figure S1: Effect of eluent solvent volume: Extraction conditions: Sample volume, 15 mL; extraction time: 30 min; eluent solvent: acetonitrile; sonication desorption time 5 min. Figure S2: Effect of salt concentration: Extraction conditions: sample volume, 15 mL; extraction time: 30 min; eluent solvent, acetonitrile; volume of elution solvent, 300 µL desorption time, 5 min. Figure S3: Effect of organic modifier volume: Extraction conditions: sample volume, 15 mL; extraction time: 30 min; eluent solvent, acetonitrile; volume of elution solvent, 300 µL desorption time, 5 min. Figure S4: Regeneration and reusability of sol–gel C18 coated FPSE media. Extraction conditions: sample volume, 15 mL; extraction time: 30 min; eluent solvent: acetonitrile; volume of elution solvent: 300 µL desorption time, 5 min.

Acknowledgments

This study was financially supported by University Grants Commission (UGC), New Delhi, India.

Author Contributions

Shivender Singh Saini and Abuzar Kabir conceived and designed the experiments; Shivender Singh Saini and Abuzar Kabir performed the experiments; Shivender Singh Saini and Abuzar Kabir analyzed the data; Avasarala Lakshmi Jagannadha Rao, Ashok Kumar Malik and Kenneth G. Furton contributed reagents/materials/analysis tools; Shivender Singh Saini and Abuzar Kabir wrote the paper. Avasarala Lakshmi Jagannadha Rao, Ashok Kumar Malik and Kenneth G. Furton reviewed and edited the paper.

Conflicts of Interest

The authors declare no conflict of interest.

References

  1. Agency for Toxic Substances and Drug Registry (ATSDR). Toxicological Profile for Polycyclic Aromatic Hydrocarbons (PAHs) Update; Agency for Toxic Substances and Drug Registry (ATSDR): Washington, DC, USA, 1995; Chapter 1; pp. 1–9. [Google Scholar]
  2. Agency for Toxic Substances and Drug Registry (ATSDR). Toxicological Profile for Polycyclic Aromatic Hydrocarbons (PAHs) Update; Agency for Toxic Substances and Drug Registry (ATSDR): Washington, DC, USA, 1995; Chapter 2; pp. 11–207. [Google Scholar]
  3. Bostrom, C.E.; Gerde, P.; Hanberg, A.; Jernstrom, B.; Johansson, C.; Kyrklund, T.; Rannug, A.; Tornqvist, M.; Victorin, K.; Westerholm, R. Cancer risk assessment, indicators, and guidelines for polycyclic aromatic hydrocarbons in the ambient air. Environ. Health Perspect. 2002, 110, 451–488. [Google Scholar] [CrossRef] [PubMed]
  4. White, K.L. An overview of immunotoxicology and carcinogenic polycyclic aromatic hydrocarbons. Environ. Carcinog. Rev. 1986, 4, 163–202. [Google Scholar] [CrossRef]
  5. Srogi, K. Monitoring of environmental exposure to polycyclic aromatic hydrocarbons: A review. Environ. Chem. Lett. 2007, 5, 169–195. [Google Scholar] [CrossRef]
  6. Beyer, J.; Jonsson, G.; Porte, C.; Krah, M.M.; Ariese, F. Analytical methods for determining metabolites of polycyclic aromatic hydrocarbon (PAH) pollutants in fish bile: A review. Environ. Toxicol. Pharmacol. 2010, 30, 224–244. [Google Scholar] [CrossRef] [PubMed]
  7. Van der Oost, R.; Beyer, J.; Vermeulen, N.P.E. Fish bioaccumulation and biomarkers in environmental risk assessment: A review. Environ. Toxicol. Pharmacol. 2003, 13, 57–149. [Google Scholar] [CrossRef]
  8. Liu, L.Y.; Wang, J.Z.; Wei, G.L.; Guan, Y.F.; Wong, C.S.; Zeng, E.Y. Sediment records of polycyclic aromatic hydrocarbons (PAHs) in the continental shelf of China: Implications for evolving anthropogenic impacts. Environ. Sci. Technol. 2012, 46, 6497–6504. [Google Scholar] [CrossRef] [PubMed]
  9. Baek, S.O.; Field, R.A.; Goldstone, M.E.; Kirk, P.W.; Lester, J.N.; Perry, R. A review of atmospheric polycyclic aromatic hydrocarbons: Sources, fate and behavior. Water Air Soil Pollut. 1991, 60, 279–300. [Google Scholar] [CrossRef]
  10. Chen, H.Y.; Teng, Y.G.; Wang, J.S.; Song, L.T.; Zuo, R. Source apportionment of sediment PAHs in the Pearl River Delta region (China) using nonnegative matrix factorization analysis with effective weighted variance solution. Sci. Total Environ. 2013, 444, 401–408. [Google Scholar] [CrossRef] [PubMed]
  11. Weinstein, J.E.; Crawford, K.D.; Garner, T.R.; Flemming, A.J. Screening level ecological and human health risk assessment of polycyclic aromatic hydrocarbons in stormwater detention pond sediments of Coastal South Carolina, USA. J. Hazard. Mater. 2010, 178, 906–916. [Google Scholar] [CrossRef] [PubMed]
  12. Guo, J.F.; Guo, Q.Z.; Yan, G.P. Determination of polycyclic aromatic hydrocarbons in water samples by hollow fiber extraction coupled with GC-MS. Anal. Methods 2015, 7, 1071–1075. [Google Scholar] [CrossRef]
  13. Shamsipur, M.; Hashemi, B. Extraction and determination of polycyclic aromatic hydrocarbons in water samples using stir bar sorptive extraction (SBSE) combined with dispersive liquid-liquid microextraction based on the solidification of floating organic drop (DLLME-SFO) followed by HPLC-UV. RSC Adv. 2015, 5, 20339–20345. [Google Scholar]
  14. Zhou, Q.; Gao, Y. Determination of polycyclic aromatic hydrocarbons in water samples by temperature-controlled ionic liquid dispersive liquid-liquid microextraction combined with high performance liquid chromatography. Anal. Methods 2014, 6, 2553–2559. [Google Scholar] [CrossRef]
  15. Manoli, E.; Samara, C. Polycyclic aromatic hydrocarbons in natural waters: Sources, occurrence and analysis. TrAC Trends Anal. Chem. 1999, 18, 417–428. [Google Scholar] [CrossRef]
  16. Pánková, K. IACR Monographs on the Evaluation of the Carcinogenicity Risk of Chemical to Humans. Biol. Plant. 1986, 28, 354. [Google Scholar] [CrossRef]
  17. Mahler, B.J.; Van Metre, P.C.; Bashara, T.J.; Wilson, J.T.; Johns, D.A. Parking lot sealcoat: An unrecognized source of urban polycyclic aromatic hydrocarbons. Environ. Sci. Technol. 2005, 39, 5560–5566. [Google Scholar] [CrossRef] [PubMed]
  18. Dickhut, R.M.; Canuel, E.A.; Gustafson, K.E.; Liu, K.; Arzayus, K.M.; Walker, S.E.; Edgecombe, G.; Gaylor, M.O.; MacDonald, E.H. Automotive sources of carcinogenic polycyclic aromatic hydrocarbons associated with particulate matter in the Chesapeake Bay region. Environ. Sci. Technol. 2000, 34, 4635–4640. [Google Scholar] [CrossRef]
  19. Sicre, M.A.; Marty, J.C.; Saliot, A.; Aparicio, X.; Grimalt, J.; Albaiges, J. Aliphatic and aromatic hydrocarbons in different sized aerosols over the Mediterranean Sea: Occurrence and origin. Atmos. Environ. 1967, 21, 2247–2259. [Google Scholar] [CrossRef]
  20. Fermin, L.; Valley, C.; Alonso, E.J.; Olmo, M.D.; Vilchez, J.L. Determination of ultra-traces of anthracene in water samples by solid-phase spectrofluorometry. Anal. Sci. 1993, 9, 117–120. [Google Scholar]
  21. Arbabi, M.; Nasseri, S.; Mesdaghinia, A.R.; Rezaie, S.; Naddafi, K.; Omrani, G.H.; Yunesian, M. Survey on physical, chemical and microbiological characteristics of PAH-contaminated soils in Iran. Iran. J. Environ. Health Sci. Eng. 2004, 1, 26–33. [Google Scholar]
  22. Kanaly, R.; Harayama, S. Biodegradation of high-molecular-weight polycyclic aromatic hydrocarbons by bacteria. J. Bacteriol. 2000, 182, 2059–2067. [Google Scholar] [CrossRef] [PubMed]
  23. Kweon, O.; Kim, S.J.; Jones, R.C.; Freeman, J.P.; Adjei, M.D.; Edmondson, R.D.; Cerniglia, C.E. A polyomic approach to elucidate the fluoranthene-degradative pathway in Mycobacterium vanbaalenii PYR-1. J. Bacteriol. 2007, 189, 4635–4647. [Google Scholar] [CrossRef] [PubMed]
  24. Zhang, X.J.; Shi, Z.; Lyv, J.X.; He, X.; Englert, N.A.; Zhang, S.Y. Pyrene is a novel constitutive androstane receptor (CAR) activator and causes hepatotoxicity by CAR. Toxicol. Sci. 2015, 147, 436–445. [Google Scholar] [CrossRef] [PubMed]
  25. Hollosi, L.; Wenzl, T. Development and optimisation of a dopant assisted liquid chromatographic-atmospheric pressure photo ionisation-tandem mass spectrometric method for the determination of 15 + 1 EU priority PAHs in edible oils. J. Chromatogr. A 2011, 1218, 23–31. [Google Scholar] [CrossRef] [PubMed]
  26. Purcaro, G.; Moret, S.; Bucar-Miklavcic, M.; Conte, L.S. Ultra-high performance liquid chromatographic method for the determination of polycyclic aromatic hydrocarbons in a passive environmental sampler. J. Sep. Sci. 2012, 35, 922–928. [Google Scholar] [CrossRef] [PubMed]
  27. Zhao, B.; Zhang, S.; Zhou, Y.; He, D.; Li, Y.; Ren, M.; Xu, Z.; Fang, J. Characterization and quantification of PAH atmospheric pollution from a large petrochemical complex in Guangzhou: GC–MS/MS analysis. Microchem. J. 2015, 119, 140–144. [Google Scholar] [CrossRef]
  28. Mirivel, G.; Riffault, V.; Galloo, J.C. Simultaneous determination by ultra-performance liquid chromatography-atmospheric pressure chemical ionization time-of-flight mass spectrometry of nitrated and oxygenated PAHs found in air and soot particles. Anal. Bioanal. Chem. 2010, 397, 243–256. [Google Scholar] [CrossRef] [PubMed]
  29. Fujiwara, F.; Guinez, M.; Cerutti, S.; Smichowski, P. UHPLC-(+)APCI-MS/MS determination of oxygenated and nitrated polycyclic aromatic hydrocarbons in airborne particulate matter and tree barks collected in Buenos Aires city. Microchem. J. 2014, 116, 118–124. [Google Scholar] [CrossRef]
  30. Cruz-Vera, M.; Lucena, R.; Ardenas, S.C.; Valcarcel, M. One-step in-syringe ionic liquid-based dispersive liquid-liquid microextraction. J. Chromatogr. A 2009, 1216, 6459–6465. [Google Scholar] [CrossRef] [PubMed]
  31. Wang, W.D.; Huang, Y.M.; Shu, W.Q.; Cao, J. Multiwalled carbon nanotubes as adsorbents of solid-phase extraction for determination of polycyclic aromatic hydrocarbons in environmental waters coupled with high-performance liquid chromatography. J. Chromatogr. A 2007, 1173, 27–36. [Google Scholar] [CrossRef] [PubMed]
  32. Ma, J.; Xiao, R.; Li, J.; Yu, J.; Zhang, Y.; Chen, L. Determination of 16 polycyclic aromatic hydrocarbons in environmental water samples by solid-phase extraction using multi-walled carbon nanotubes as adsorbent coupled with gas chromatography-mass spectrometry. J. Chromatogr. A 2010, 1217, 5462–5469. [Google Scholar] [CrossRef] [PubMed]
  33. Brum, D.M.; Cassella, R.J.; Pereira Netto, A.D. Multivariate optimization of a liquid-liquid extraction of the EPA-PAHs from natural contaminated waters prior to determination by liquid chromatography with fluorescence detection. Talanta 2008, 74, 1392–1399. [Google Scholar] [CrossRef] [PubMed]
  34. Shamsipur, M.; Hassan, J. A novel miniaturized homogenous liquid-liquid solvent extraction-high performance liquid chromatographic-fluorescence method for determination of ultra traces of polycyclic aromatic hydrocarbons in sediment samples. J. Chromatogr. A 2010, 1217, 4877–4882. [Google Scholar] [CrossRef] [PubMed]
  35. Elisabeth, R.; Rajasekhar, B. Optimization and validation of solid phase micro-extraction (SPME) method for analysis of polycyclic aromatic hydrocarbons in rainwater and stormwater. Phys. Chem. Earth 2009, 34, 857–865. [Google Scholar]
  36. Bagheri, H.; Babanezhad, E.; Es-haghi, A. An aniline-based fiber coating for solid phase microextraction of polycyclic aromatic hydrocarbons from water followed by gas chromatography-mass spectrometry. J. Chromatogr. A 2007, 1152, 168–174. [Google Scholar] [CrossRef] [PubMed]
  37. Wu, Y.L.; Xia, L.B.; Chen, R.; Hu, B. Headspace single drop microextraction combined with HPLC for the determination of trace polycyclic aromatic hydrocarbons in environmental samples. Talanta 2008, 74, 470–477. [Google Scholar] [CrossRef] [PubMed]
  38. Yao, C.; Twu, P.; Anderson, J.L. Headspace single drop microextraction using micellar ionic liquid extraction solvents. Chromatographia 2010, 72, 393–402. [Google Scholar] [CrossRef]
  39. Djozan, D.J.; Assadi, Y. Modified pencil lead as a new fiber for solid-phase microextraction. Chromatographia 2004, 60, 313–317. [Google Scholar] [CrossRef]
  40. Djozan, D.; Assadi, Y.; Haddadi, S.H. Anodized aluminum wire as a solid-phase microextraction fiber. Anal. Chem. 2001, 73, 4054–4058. [Google Scholar]
  41. Bai, D.S.; Li, J.H.; Chen, S.B.; Chen, B.H. A novel cloud-point extraction process for preconcentrating selected polycyclic aromatic hydrocarbons in aqueous solution. Environ. Sci. Technol. 2001, 35, 3936–3940. [Google Scholar] [CrossRef] [PubMed]
  42. Heidari, H.; Razmi, H.; Jouyban, A. Preparation and characterization of ceramic/carbon coated Fe3O4 magnetic nanoparticle nanocomposite as a solid-phase microextraction adsorbent. J. Chromatogr. A 2012, 1245, 1–7. [Google Scholar] [CrossRef] [PubMed]
  43. Yang, S.; Chen, C.; Yan, Z.; Cai, Q.; Yao, S. Evaluation of metal-organic framework 5 as a new SPE material for the determination of polycyclic aromatic hydrocarbons in environmental waters. J. Sep. Sci. 2013, 36, 1283–1290. [Google Scholar] [CrossRef] [PubMed]
  44. Kabir, A.; Furton, K.G. Fabric Phase Sorptive Extractors. U.S. Patent 9,283,544, 15 March 2016. [Google Scholar]
  45. Racamonde, I.; Rodit, R.; Quintana, J.B.; Sieira, J.B.; Kabir, A.; Furton, K.G.; Cela, R. Fabric phase sorptive extraction: A new sorptive microextraction technique for the determination of non-steroidal anti-inflammatory drugs from environmental water samples. Anal. Chim. Acta 2015, 865, 22–30. [Google Scholar] [CrossRef] [PubMed]
  46. Rodríguez-Gomez, R.; Roldan-Pijuan, M.; Lucena, R.; Cárdenas, S.; Zafra-Gómez, A.; Ballesteros, O.; Valcárcel, M. Stir-membrane solid-liquid-liquid microextraction for the determination of parabens in human breast milk samples by ultra high performance liquid chromatography-tandem mass spectrometry. J. Chromatogr. A 2014, 1354, 26–33. [Google Scholar] [CrossRef] [PubMed]
  47. Samanidou, V.; Kabir, A.; Galanopoulos, L.D.; Furton, K.G. Fast extraction of amphenicols residues from raw milk using novel fabric phase sorptive extraction followed by high-performance liquid chromatography-diode array detection. Anal. Chim. Acta 2015, 855, 41–50. [Google Scholar] [CrossRef] [PubMed]
  48. Kayillo, S.; Dennis, G.R.; Shalliker, R.A. An assessment of the retention behaviour of polycyclic aromatic hydrocarbons on reversed phase stationary phases: Selectivity and retention on C18 and phenyl-type surfaces. J. Chromatogr. A 2006, 1126, 283–297. [Google Scholar] [CrossRef] [PubMed]
  49. World Health Organization. Guidelines for Drinking-Water Quality, 2nd ed.; World Health Organization: Geneva, Switzerland, 1997. [Google Scholar]
  50. Kumar, R.; Heena, G.; Malik, A.K.; Kabir, A.; Furton, K.G. Efficient analysis of selected estrogens using fabric phase sorptive extraction and high performance liquid chromatography-fluorescence detection. J. Chromatogr. A 2014, 1359, 16–25. [Google Scholar] [CrossRef] [PubMed]
  51. Brambilla, R.; Pires, G.P.; dos Santos, J.H.Z.; Miranda, M.S.L.; Chornik, B. Octadecylsilane-modified silicas prepared by grafting and sol–gel methods. J. Electron Spectrosc. Relat. Phenom. 2007, 156, 413–420. [Google Scholar] [CrossRef]
  52. Pan, H.; Wang, X.D.; Xiao, S.S.; Yu, L.G.; Zhang, Z.J. Preparation and characterization of TiO2 nanoparticles surface-modified by octadecyltrimethoxysilane. Indian J. Eng. Mater. Sci. 2013, 20, 561–567. [Google Scholar]
  53. Long, Y.; Chen, Y.; Yang, F.; Chen, C.; Pan, D.; Cai, Q.; Yao, S. Triphenylamine-functionalized magnetic microparticles as a new adsorbent coupled with high performance liquid chromatography for the analysis of trace polycyclic aromatic hydrocarbons in aqueous samples. Analyst 2012, 137, 2716–2722. [Google Scholar] [CrossRef] [PubMed]
  54. Zhang, H.; Low, W.P.; Lee, H.K. Evaluation of sulfonated graphene sheets as sorbent for micro-solid-phase extraction combined with gas chromatography-mass spectrometry. J. Chromatogr. A 2012, 1233, 16–21. [Google Scholar] [CrossRef] [PubMed]
  55. Song, X.; Li, J.; Xu, S.; Ying, R.; Ma, J.; Liao, C.; Liu, D.; Yu, J.; Chen, L. Determination of 16 polycyclic aromatic hydrocarbons in seawater using molecularly imprinted solid-phase extraction coupled with gas chromatography-mass spectrometry. Talanta 2012, 99, 75–82. [Google Scholar] [CrossRef] [PubMed]
  56. Wang, J.; Liu, S.; Chen, C.; Zou, Y.; Hu, H.; Cai, Q.; Yao, S. Natural cotton fibers as adsorbent for solid phase extraction of polycyclic aromatic hydrocarbons in water samples. Analyst 2014, 139, 3593–3599. [Google Scholar] [CrossRef] [PubMed]
Figure 1. Chemical structures of four selected polycyclic aromatic hydrocarbons (PAHs): (A) Anthracene; (B) Phenanthrene; (C) Pyrene; (D) Fluoranthene.
Separations 04 00022 g001
Figure 2. Chemical structure of sol–gel C18 coated fabric phase sorptive extraction (FPSE) media and the schematic representation of FPSE protocol.
Separations 04 00022 g002
Figure 3. Scanning electron microscopy images of (a) uncoated cotton (100%) cellulose fabric substrate at 100× magnification; (b) uniformly coated sol–gel C18 sorbent coating on fabric matrix at 100× magnification; (c) sol–gel C18 coated FPSE media at 500× magnification.
Separations 04 00022 g003
Figure 4. FT-IR spectra of (a) uncoated cellulose substrate; (b) octadecyl trimethoxysilane; and (c) sol–gel C18 coated FPSE medium.
Separations 04 00022 g004
Figure 5. (a) Effect of sample volume; (b) Effect of extraction time; (c) Selection of the best elution solvent; (d) Optimization of back-extraction time. Extraction conditions: extraction time: 30 min; eluent solvent: acetonitrile; volume of elution solvent: 300 µL, desorption time: 5 min.
Separations 04 00022 g005
Figure 6. Correlation curve between absolute recovery and logarithmic values of octanol-coefficients of analytes with wide polarity range.
Separations 04 00022 g006
Figure 7. Chromatogram representing analysis of real environmental samples: (a) Chakki river water sample 2; (b) factory wastewater sample 2.
Separations 04 00022 g007
Table 1. Linear range, linearity curve, correlation coefficients, limits of detection (LODs) and limits of quantification (LOQs) for the determination of PAHs (n = 5).
AnalyteLinear Range (ng/mL)Linearity CurveR2LOD (pg/mL)LOQ (pg/mL)
Phen0.010–10y = 34,591x + 7720.999713.33
Anth0.010–10y = 104,873x + 21470.99970.10.33
Flu0.010–10y = 90,258x + 2470.99870.72.33
Pyr0.010–10y = 114,921x + 4970.99830.41.33
Table 2. Precision, accuracy and recovery of four selected PAHs in spiked deionized organic-free water at (low, medium, and high concentration levels) (n = 5).
AnalytePhenAnthFluPyr
Precision (RSD%)0.010.550.010.550.010.550.010.55
Intra-day5.64.73.61.92.82.22.12.81.81.92.11.1
Inter-day4.95.014.12.22.32.51.82.91.93.12.72.0
Accuracy (%)
Intra-day88879090929191.190.192.190.891.692.8
Inter-day868989.4919089.3919092908991
Recovery (%) (RSD%)88.1 (2.9)88 (4.1)88.4 (3.8)88.6 (3.1)88 (3.2)88.1 (2.4)92 (2.2)91 (2.8)90.5 (1.8)90.7 (3.2)91 (4.2)90.1 (1.4)
Table 3. Data demonstrating model predicted absolute recovery (%) and actual recovery (%) obtained by FPSE–HPLC–FLD method.
CompoundLog KowExpected Recovery (%)Actual Recovery (%)
Phen4.4678.3088.4
Anth4.4578.2488.1
Flu5.1680.8590.5
Pyr4.8880.3290.1
Table 4. The four selected PAHs concentrations detected in real water samples (n = 5).
SamplePhen (ng/mL)Anth (ng/mL)Flu (ng/mL)Pyr (ng/mL)
A an.dn.dn.dn.d
B an.dn.dn.dn.d
C b7.8 ± 2.6n.d5.6 ± 3.3n.d
D b8.8 ± 2.9n.d6.8 ± 3.4n.d
E cn.dn.dn.dn.d
F cn.dn.dn.dn.d
G d11 ± 3.17.8 ± 2.57.5 ± 3.85.8 ± 4.1
H d4.1± 3.23.7 ± 3.17.7 ± 3.33.0 ± 2.8
a: bore-well water; b: river water; c: rain water; d: factory waste water; n.d: not detected.
Table 5. Comparisons of the analytical performance of the method developed with reported methods in the literature.
MethodSorbent MaterialSorbent Preparation Time (Hours)LOD (pg/mL)References
MSPE-HPLC-FLDTPA-functionalized MNPs37.50.04–3.75[53]
µ-SPE-GC-MSFunctionalized graphene sheet29.50.8–3.9[54]
SPE-HPLC-FLDCotton fiber0.50.1–2[55]
MIPs-SPE-GC-MSImprinted sol-gel adsorbent385.2–12.6[56]
FPSE-HPLC-FLDSol-gel C18 (Cellulose)240.1–1Current work
Abbreviations: MIPs: molecularly imprinted polymers; MSPE: magnetic solid-phase extraction; TPA-functionalized MNPs: triphenylamine functionalized magnetic microspheres. HPLC-FLD: high performance liquid chromatography with fluorescence detector; GC-MS: gas chromatography mass spectrometry.

