Article

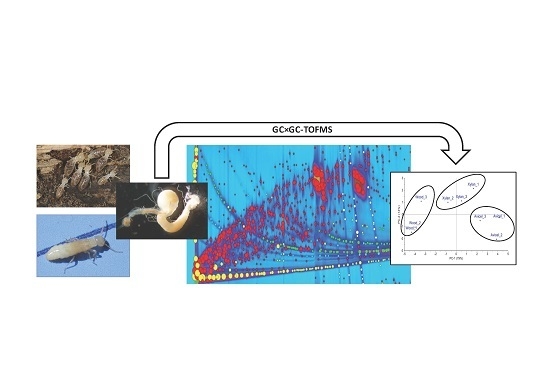
GC×GC-TOFMS for the Analysis of Metabolites Produced by Termites (Reticulitermes flavipes) Bred on Different Carbon Sources

1
Organic and Biological Analytical Chemistry, Department of Chemistry, University of Liège, Sart-Tilman, Liège B-4000, Belgium
2
Mass Spectrometry Laboratory, Department of Chemistry, University of Liège, Sart-Tilman, Liège B-4000, Belgium
3
Department of Functional and Evolutionary Entomology, Gembloux Agro-Bio Tech, University of Liège, Gembloux B-5030, Belgium
4
Department of Bio-Industries, Gembloux Agro-Bio Tech, University of Liège, Gembloux B-5030, Belgium
5
Department of Microbiology and Genomics, Gembloux Agro-Bio Tech, University of Liège, Gembloux B-5030, Belgium
*
Author to whom correspondence should be addressed.
Separations 2016, 3(2), 19; https://doi.org/10.3390/separations3020019
Submission received: 29 April 2016 / Revised: 17 May 2016 / Accepted: 19 May 2016 / Published: 13 June 2016
(This article belongs to the Special Issue Two-Dimensional Gas Chromatography)

Abstract

:
More and more studies are dedicated to termites and their symbionts, to better understand how they efficiently produce energy from lignocellulose. In that context, a powerful analytical method was developed to perform the detection, separation and identification of compounds in the 1 µL fluid volume of the gut of the termite Reticulitermes flavipes. Comprehensive two-dimensional gas chromatography (GC×GC) coupled to time-of-flight mass spectrometry (TOFMS) was tested with three different column combinations: (1) low-polar/mid-polar; (2) polar/low-polar and (3) mid-polar/low-polar. The column set (3) offered the best separation and was chosen for further analysis and comparison study. Metabolites were detected in the samples, including amino acids, sugars, amines and organic acids. Samples collected from termites fed for 30 days on Avicel cellulose or xylan powder diets were analyzed and compared with the wood diet. Principal component analysis (PCA) of metabolite profiles demonstrated a separation of different clusters corresponding to the three different diets, with a similar trend for diets containing cellulose. The Analysis of variance (ANOVA) (one way-ANOVA and Tukey’s test) was used to compare compound levels between these three different diets. Significant differences were observed, including higher levels of aromatic derivatives in the wood diet and higher levels of sugar alcohols in the xylan diet. A higher accumulation of uric acid was observed with the artificial diets (cellulose and xylan), likely to be related to the nitrogen deficiency. The present study highlighted the capability of adaptation of the termite system to non-optimal carbon sources and the subsequent modification of the metabolite profile. These results demonstrate the potential interest to investigate metabolite profiling with state-of-the-art separation science tools, in order to extract information that could be integrated with other omics data to provide more insight into the termite-symbiont digestion system.

Graphical Abstract

1. Introduction

Termites are important bioreactors on the planet as they efficiently convert cellulose into glucose, the omnipresent source of energy [1]. They have always intrigued the scientific community, especially for their ability to thrive on lignocellulosic material. Lignocellulose is a complex association of cellulose, hemicellulose and lignin. These compounds are closely linked and recalcitrant to the break-up into bio-convertible substrates, making their commercial utilization as a biomass resource difficult [2]. Termites have an efficient strategy to convert lignocellulose, with the aid of their associated microbial symbionts. A broad range of microorganisms are present in termites, including bacteria, archaea, protists (only present in some families of termites, called the group of “lower termites”) and fungi [3,4]. These make termites a very interesting source of enzymes, although the isolation and cultivation of the symbionts remain a difficult step [5]. The majority of termite gut microbiota has still escaped proper cultivation, probably because termites offer a very specific internal environment, both oxic and anoxic with microenvironments and substrate gradients [6]. Such conditions are difficult to reproduce in batch culture, which limit the possibility of material amplification for identification and characterization.
With the revolution of “omics” technologies, it is interesting to apply advanced studies on termites such as metagenomics, transcriptomics or proteomics [7,8,9]. These technologies offer the possibility to improve the screening for new enzymes and to study the system as a whole. This is important to enhance the understanding of the termite-microbiota symbiotic association [10], with the need to reproduce their efficient lignocellulolytic system at a larger scale [11]. Metabolomics is the study of small molecule profiles related to biochemical processes. To our knowledge, there is only one recent study on comprehensive metabolomic profiling of termites [12]. It used 13C-labelled cellulose and two-dimensional nuclear magnetic resonance (2D-NMR) to follow cellulose digestion in the dampwood termite Hodotermopsis sjostedti. In the present study, we propose a different approach to analyze metabolites in the termite Reticulitermes flavipes, using comprehensive two-dimensional gas chromatography coupled to time-of-flight mass spectrometry (GC×GC-TOFMS). The main advantages of this technique for metabolite study have already been demonstrated [13,14]. The great peak capacity, provided by the combination of two different chromatographic columns, as well as the sensitivity, are two important criteria for the analysis of the complex termite samples. In the GC×GC system used for our study, the sensitivity is enhanced by the cryogenic zone compression (CZC) process, implemented by the use of a modulator at the interface between the first dimension (1D) and the second dimension (2D) columns (dimensions) [15]. Sensitivity is a key aspect to challenge the detection of compounds in the very low volume of material available from the internal volume gut of R. flavipes, estimated at 1 µL [16]. R. flavipes is a widespread and well-studied termite species [17]. These termites belong to the subterranean species, and are smaller in size compared to drywood and dampwood species [18]. Previous studies successfully analyzed metabolites produced by cockroaches (closely related to termites) or by cellulolytic cultivated microorganisms, using high-performance liquid chromatography coupled to infrared spectroscopy (HPLC-IR), or gas chromatography coupled to time-of-flight mass spectrometry (GC-TOFMS), respectively [19,20]. The development of a sensitive and powerful analytical method is of interest to perform similar studies on termites, especially for the smaller species.
For the implementation of an efficient GC×GC-TOFMS method, different column sets were tested, in order to obtain the best separation of the compounds and specifically provide more resolution for the polar compounds. The different phase combinations included low-polar, mid-polar and highly polar columns. The highly polar column was one of the recently introduced ionic liquid (IL) capillary GC columns. These IL columns present an attractive alternative to polysiloxane phases and offer unique selectivity for polar compounds. They are of high potential for metabolomics studies but have not yet been tested much [21].
For the present study, R. flavipes was grown on poplar wood, mainly composed of cellulose (45%), hemicelluloses (25%) and lignin (20%) [22]. Artificial diets were tested with microcrystalline cellulose (Avicel) and xylan powders. Cellulose is a polymer of β,1-4 glucose. Xylans are hemicelluloses that consist of a backbone of xylose, often acetylated or branched with arabinose and acidic sugars with various compositions. Statistical analyses were used to identify trends and specific compounds produced, related to the influence of the diet. The purpose was to identify the effect of the diet on the metabolites detected and evaluate how the termite’s system adapts depending on the carbon source.

2. Materials and Methods

2.1. Termites, Culture Conditions and Artificial Diets

Reticulitermes flavipes (ex santonensis De Feytaud [23]) were collected on Oleron Island, France. The culture was maintained in a laboratory on wet wood (pine wood gradually replaced by poplar wood) at 27 °C and 70% humidity. Only worker-caste termites were collected for experiments. For artificial diets, termites were placed in tubes containing sterile disks prepared with 20% carbon source, 1.5% agar, 0.06% β-sisterol and water. Carbon sources used in this study were microcrystalline cellulose (Avicel) and xylan from beech wood. All substrates were purchased from Sigma-Aldrich (St. Louis, MO, USA). Termites were collected after 30 days of feeding.

2.2. Chemicals

Methanol, chloroform and ethanol were analytical grade and purchased from VWR International (Leuven, Belgium). Water was purified with a Milli-Q® filtration system (Merck Chemicals, Overijse, Belgium). Methoxyamine and pyridine were purchased from Sigma-Aldrich. N-methyl-N-trimethylsilyltrifluoroacetamide (MSTFA) with 1% trimethylsilyl chloride (TMCS) was purchased from Pierce, Thermo Scientific (Bellefonte, PA, USA). Addition of TMCS aids derivatization of amides, secondary amines, and hindered hydroxyls not derivatized by MSTFA alone. Standards of carbohydrates were purchased from Sigma-Aldrich.

2.3. Sample Preparation and Derivatization

Samples of five guts were collected in triplicate from each diet (each gut included fore-mid- and hind parts). Samples were homogenized using a piston pellet (Eppendorf, Nijmegen, The Netherlands) in 200 µL of a mixture of methanol/water (v/v: 50/50). 300 µL of a cold mixture of methanol/water/chloroform (v/v/v: 1/1/1) were added and the samples were vortexed. Centrifugation was performed at 4 °C (relative centrifugal force (rcf) of 16,100 for 10 min). The supernatant was transferred into a GC vial and evaporated to dry under a nitrogen stream. The extract was kept at −20 °C until derivatization and GC×GC-TOFMS analysis.
The extract was derivatized in two-steps with 25 µL of a solution of 30 mg/mL methoxyamine hydrochloride in pyridine, incubated at 70 °C during 60 min, then 75 µL of MSTFA + 1% TMCS, were incubated at 30 °C during 2 h. A blank procedure of extraction and derivatization was included. For carbohydrate standard analysis, 5 mM solutions were prepared in a mixture of ethanol/water. The solutions were evaporated to dryness and derivatized with the same procedure used for the extracts.

2.4. GC×GC-TOFMS Analysis

Analyses were performed with a DANI MasterTOF GC-MS system (DANI Instruments SpA, Milano, Italy) equipped with a ZX1-LN2 Cooled Loop Modulation GC×GC System (Zoex Corp., Houston, TX, USA). The different column sets tested were (1) 1D low-polarity Crossbond® (5% diphenyl/95% dimethyl polysiloxane phase (Rtx®-5 (Restek Corp., Bellefonte, PA, USA), 30 m × 0.18 mm, 0.20 μm) and 2D mid-polarity Crossbond® 50% diphenyl/50% dimethyl polysiloxane phase (Rxi®-17 (Restek Corp.), 2 m × 0.10 mm, 0.10 μm); (2) 1D high-polarity ionic liquid non-bonded 1,12-di(tripropylphosphonium)dodecane bis(trifluoromethylsulfonyl)imide trifluoromethylsulfonate phase (SLB®-IL-61 (Sigma-Aldrich, St. Louis, MO, USA), 30 m × 0.25 mm, 0.20 µm) and 2D Rtx®-5 (2 m × 0.10 mm, 0.10 µm); and (3) 1D mid-polarity Crossbond® trifluoropropylmethyl polysiloxane phase (Rtx®-200 (Restek Corp.), 30 m × 0.25 mm, 0.25 µm) and 2D low-polarity Crossbond® 1,4-bis(dimethylesiloxy)phenylene dimethyl polysiloxane phase (Rxi®-5Sil MS (Restek Corp.), 2 m × 0.10 mm, 0.10 µm). The modulation period (PM) was set at 4 or 6 s, with a hot pulse duration of 600 ms. The GC oven temperature programs were: for column combination (1) 70 °C for 2 min, 5 °C/min to 300 °C held for 5 min, column combination (2) 50 °C for 5 min, 5 °C/min to 280 °C held for 10 min, and for column combination (3) 60 °C held for 1 min, 20 °C/min to 120 °C then 5 °C/min to 280 °C held for 5 min. A volume of 1 µL of the final extract was injected into a split/splitless injector held at 250 °C and used in splitless mode. Helium was used as the carrier gas at a constant flow rate of 1.0 mL/min. The MS transfer line temperature was held at 280 °C. The temperature of the ion source was set to 200 °C. The TOFMS was operated in Electron Ionization (EI) mode at 70 eV and tuned to 1000 mass resolution. The collected mass range was 35–550 amu with an acquisition rate of 100 spectra/s.

2.5. Data Processing and Statistical Analyses

The DANI software Master Lab 2.03 (DANI Instruments, Milan, Italy) was used for data acquisition. The data were exported in computable document format (CDF) and processed with GC ImageTM 2.4 (Zoex Corp., Houston, TX, USA). Automated peak finding was performed with a defined volume threshold. Further processes were applied to remove the chromatographic noise using Computer Language for Chemical Identification (CLIC expression). Comparative analyses of the samples were performed using the Image Investigator tool of GC ImageTM (Zoex Corp.), for advanced analysis of multiple chromatograms. The triplicated samples from each diet were compared and examined for statistical characteristics and trends. Multivariate analysis was performed on the data using principal component analysis (PCA) (The Unscrambler® 10.3, CAMO Software Inc., Woodbridge, NJ, USA). The matrix was set with the termite samples on different diets as objects, and the variables were the Percent Response of the compounds detected (ratio of volume to sum of all volumes as percent). This projection method was used to show a potential structure within the data related to the diet. The levels of each compound detected in the samples were also compared using analysis of variance (one way-ANOVA). As there were three groups (three diets), the F-test was used to compare the between-group variance with the within-group variance. F-values were considered with 5% significance level. Then, the Tukey’s test was used to compare all possible pairs of means. The Tukey’s test was chosen over the Fisher test for the pair-wise comparison as it includes a correction for multiple testing and has a higher power. The identification of compounds was carried out by mass spectral data comparison against the 2011 National Institute of Standards and Technology (NIST) library. Only compounds with a library match score > 700 were named and reported as metabolites. For carbohydrates, standards were analyzed to confirm the library identification.

3. Results and Discussion

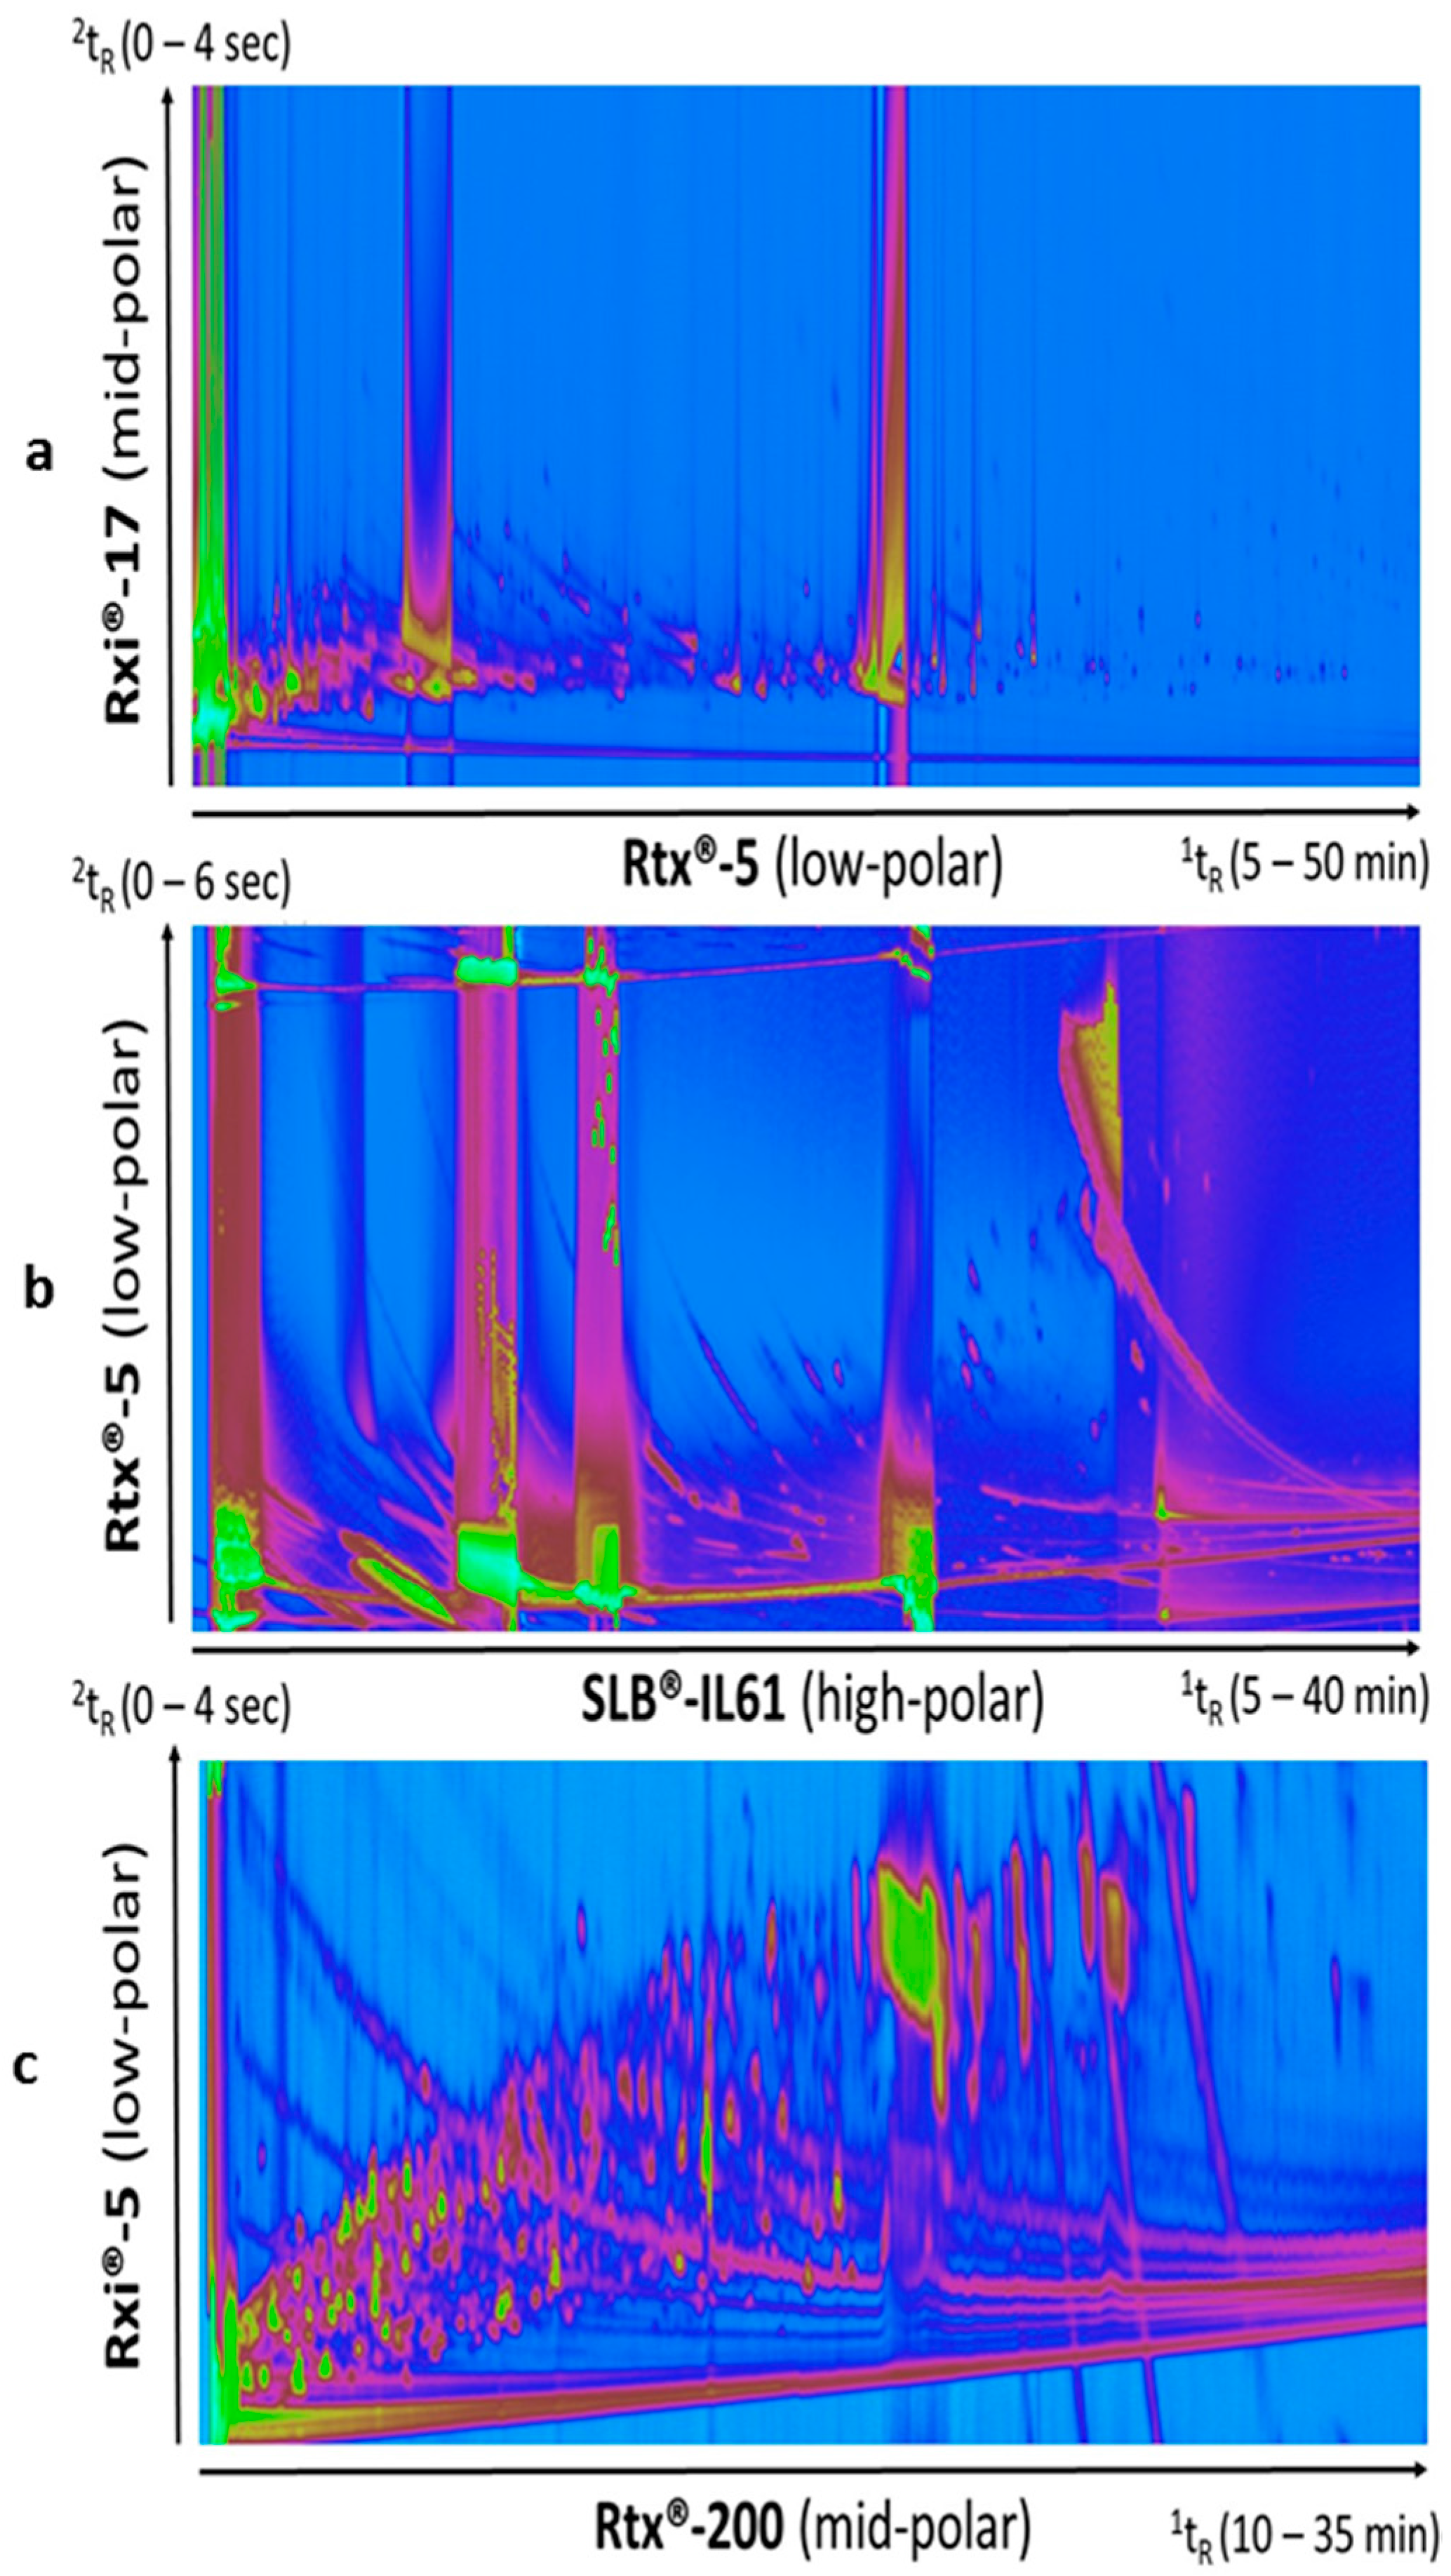
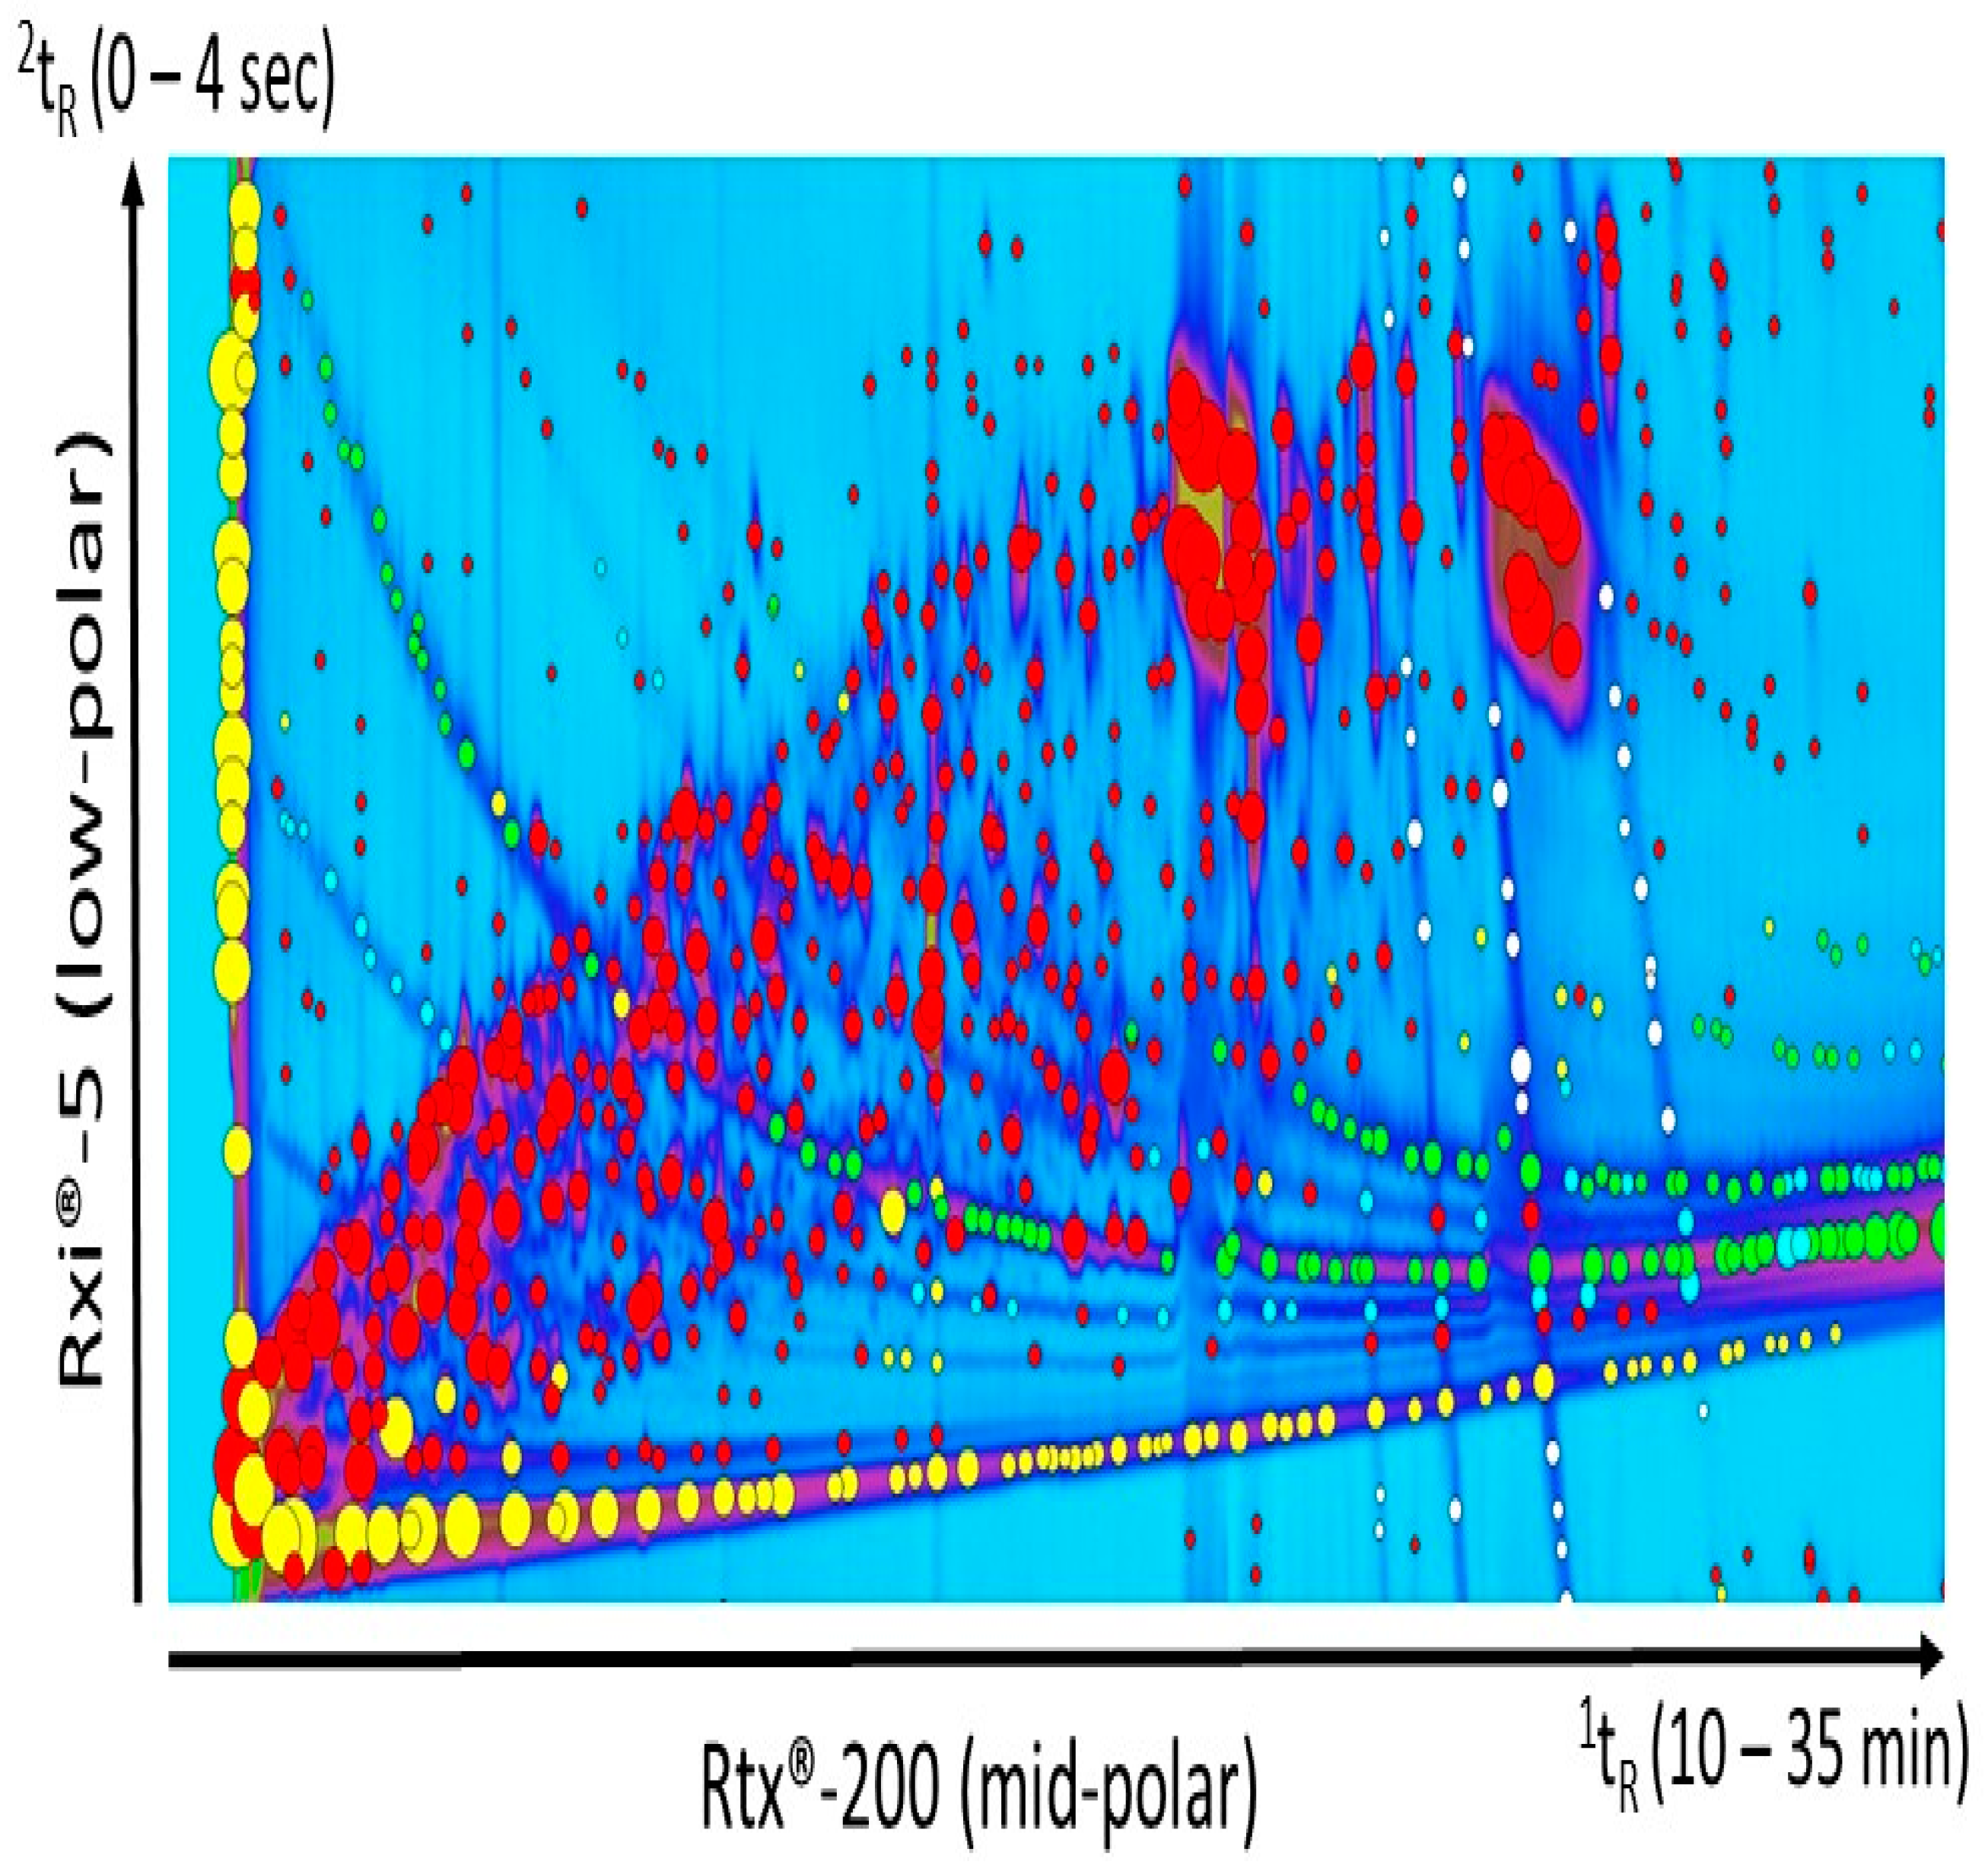
3.1. Test of Different Column Sets

A sample from termites cultured on wood was analyzed with a 1D low-polar/2D mid-polar column combination (Column set 1). The two-dimensional chromatogram plot (Figure 1a) showed that a limited separation was achieved without taking advantage of most of the peak capacity available from the 2D system. It also highlighted the large dynamic range of compounds in such samples with overloading issues. To optimize the separation of polar compounds, a reverse column set was tested (Column set 2). The ionic liquid phase was chosen for its particularly high polarity while keeping more thermal stability (up to 290 °C) than classical more common polyethylene glycol/wax column phases. With this column set, the peak occupation in the second dimension was somehow improved (Figure 1b). However, the column bleed was very important in the chromatogram. This rendered data difficult to be processed as the proper peak detection was not achievable anymore, resulting in essentially interferences and background noise produced from the derivatization reagents and column bleed to be found, despite fine tuning of peak finding parameters. A different reverse column set (Column set 3) was tested with a less polar trifluoropropyl methyl polysiloxane stationary phase as 1D. This particular crossbond phase exhibits low bleed and provides an interesting selectivity for compounds with intermediate polarity, including organic acids and nitro-containing compounds. Amongst the three sets, Column set 3 (Figure 1c) offered the best separation and chromatographic fingerprint. As the volumes of samples were very small (internal termite volume gut < 1 µL), the sample preparation was limited to liquid extraction without an additional purification step, in order to extract as many compounds as possible, and avoid loss of material. The main challenges for the analysis of these complex samples were the large dynamic range to consider and the resulting overloading of some compounds and interferences. Column set 3 offered the best fingerprint for data processing and was chosen for the diet comparison study.

3.2. Filtering Out Column Bleed and Noise in Derivatized Samples

Peak tables generated after processing the samples included peaks from column bleed and derivatization reagents. The manual selection of the regions of chromatograms to exclude from the peak detection processing was difficult and required extensive care in order to avoid the exclusion of compounds of interest. As depicted in Figure 2, the noise and column bleed was not only located at the baseline, but they also crossed the entire chromatogram. Because samples were derivatized with trimethylsilyl groups (TMS), filtering column bleed related signals was not possible using a “sil” keyword-based approach through the list of compound names obtained from the library search identification. Instead, the “trifluoro” keyword was used to remove noise peaks corresponding to the derivatizing reagent MSTFA. Additional background was present and its origin was difficult to identify. The mass spectra probably resulted from a mixture of column bleed and pyridine derivatives. Simple scripts (CLIC expression) were used to recognize feature of these unwanted peaks in the mass spectra, based on two mass spectral specific fragments expressing the highest intensities. The expressions “(Ordinal (59) < = 2) & (Ordinal (137) < = 2)” and “(Ordinal (137) < = 2) & (Ordinal (215) < = 2)” were able to specifically select most of the unwanted peaks. It was efficient to quickly and simply clean up the peak table. Additionally, “(Ordinal (294) < = 2) & (Ordinal (309) < = 2) was used to remove other unwanted peaks identified as silanol trimethyl- rhenium complex. Specific selection resulting from each command and expression is shown in Figure 2. The mass spectra of the unwanted peaks are available in supporting information (Figure S1).

3.3. Principal Component Analysis of Metabolite Profiles of Termites Cultured on Different Carbon Sources

Samples of termites fed with wood, microcrystalline cellulose (Avicel) or xylan were analyzed and compared. Samples of five termite guts were collected in triplicate for each diet. Comparison of the multiple chromatograms was carried out towards the creation of a composite image and resulted in the highlight of 314 compounds compared in all the samples. These compounds were mainly amino acids, amines, sugars, sugar derivatives, and organic acids. It included metabolites involved in major pathways like tricarboxylic acid (TCA) cycle, purine metabolism and fermentation. Table 1 lists detected metabolites and compounds, based on their chemical structures. Retention times, peak volume and percent response data are available in supplementary information (Tables S1–S3). Only the compounds with a library match score identification >700 (or identified with standards), and not found in blank procedures were reported in the table. The principal component analysis (PCA) demonstrated a trend towards the separation of the samples related to the carbon source used by the termites (Figure 3). The first principal component (PC-1, 79%) covered a great part of the variation, separating the three different diets. The second principal component (PC-2, 14%) demonstrated a trend to separate the xylan diet from the wood and Avicel diets. This secondary separation could possibly reflect the influence of cellulose as a carbon source in the diet, as Avicel is a pure cellulose powder and cellulose is the main constituent of the wood (45%). The multivariate analysis demonstrated that the metabolite profile in the termite was dependent of the diet.

3.4. Identification of Diet-Specific Compounds

The analysis of variance was used to check for significant differences in compound levels between the three different diets. The one-way ANOVA compared the variance, explained by differences between sample means, to the unexplained variance within the samples. Among the 314 compounds compared in all samples, 41 compounds presented a significant F-value (p < 0.05), ranging from 5.1 to 59.2. The highest F-values were obtained for the compounds phenylpropanoic acid (F = 59.2) and benzoic acid (F = 45.3). The F-test indicates if there is a difference between the groups but does not say who is different from whom. Pair-wise comparisons were achieved with the Tukey’s test, to identify which group was different from another. Only the compounds with good library identification (MF > 700) were reported.

3.4.1. Wood Diet

Main characteristics of the wood diet versus the artificial diets were a lower level of uric acid (F-value = 25.3), and higher levels of phenylpropanoic acid (F = 59.2), benzoic acid (F = 45.3), hexopyranoside (F = 33.0) and a pentose isomer (F = 10.6) (Figure 4). Uric acid is a product of the metabolic breakdown of purine nucleotides. It is the major waste product of nucleic acid and protein metabolism in termites [24]. In wood-feeding termites, uric acid is stored in the uricocytes of the fat body. It was demonstrated that in R. flavipes, uric acid may accumulate to considerable concentrations, and that the gut microbiota plays an important role in helping termites recycle uric acid [25]. The reason why termites keep accumulating uric acid during their entire life, in addition to the lack of symbionts able to help them remobilize uric acid was discussed by Brune and Ohkuma [26]. They made the hypothesis that uric acid is accumulated in bodies to be reingested by nestmates. The transfer of food or other fluids among members of a community through anus-to-mouth feeding is called proctodeal trophallaxis. This behavior is highly developed among termites, and it was observed that the frequency increased with the nitrogen deficiency of the diet [27]. In this study, we observed a higher accumulation of uric acid with low nitrogen diets (cellulose and xylan). This supports the hypothesis that termites accumulate acid uric to be reingested and recycled by nestmates to complement their diet.
Phenyl propanoic acid (PPA) and benzoic acid are lignin-derived aromatic molecules. The detection of these compounds supports the hypothesis that the polymeric backbone of lignin is depolymerized during passage through the termite gut. In a study of Brune et al. [28], it was demonstrated that R. flavipes mineralized ring-labeled benzoic or cinnamic acid only if oxygen was present. In the absence of oxygen, benzoate compounds were not attacked and cinnamate was reduced to phenylpropionate. In addition, a large number of anaerobic ring-modifying microorganisms were present. The detection of benzoic acid and phenylpropanoic acid showed that aromatic compounds are not metabolized efficiently in R. flavipes. In a study of Brune et al. [6], it was demonstrated that, in the termite gut, the oxygen diffuses from the gut wall to the lumen, and the oxygen is consumed before reaching the central part of the gut. The lumen can be therefore considered as an anoxic environment. As aromatic compounds are mostly degraded in aerobic conditions, our results showing intact lignin-phenolic metabolites support the hypothesis of a significant anoxic environment in the termite gut, limiting further lignin oxidation. Higher levels of a hexopyranoside and a pentose isomer in the wood diet is likely to be related to the poplar wood composition, a natural wood that contains other components than glucose and xylose, especially from the hemicellulose content.

3.4.2. Xylan Diet

The main characteristics of the xylan diet versus others were higher levels of meso-erythritol (F = 27.8), 1,2,4-butanetriol (F = 21.3), and phenyl acetic acid (PAA) (F = 14.6) (Figure 4). Meso-erythritol and 1,2,4-butanetriol are 4-carbon sugar alcohols (or polyols). These compounds are likely to be derived from xylose, the major constituent of xylan, as they were emphasized with the xylan diet. An increase of polyol production from xylose metabolism was observed with Aspergillus niger, under oxygen-limited conditions [29]. Aspergillus niger is a filamentous fungus, well-known and studied for its cellulolytic activity and ability to break down lignocellulose from plants. However, the reported polyols included erythritol but not 1,2,4-butanetriol. Butanetriol can be formed from xylose by biosynthetic pathway, combining different bacterial activities [30,31]. This could reflect synergic or multiple enzymatic levels in termites. The detection of these polyols is very interesting as they are likely to be involved in carbohydrate reserves, osmoregulation or storing reducing power strategies. Phenylacetic acid (PAA) was emphasized with the xylan diet. PAA is involved in phenylalanine metabolism pathway. Phenethylamine is produced from phenylalanine biosynthesis, and it can be metabolized into phenylacetic acid, which can be used by many bacteria [32]. The higher production of PAA on xylan diet could be related to a modification of the microflora. The higher production of PAA on the xylan diet could also be related to phenolic contamination present in the beechwood xylan substrate used in this study [33].

3.4.3. Cellulose Diet

The characteristics of the Avicel diet compared to the other diets were a higher level of N-acetyl-lysine (F = 12.7) and a lower level of a derivative of glucopyranosiduronic acid (F = 12.5) (Figure 4). N-acetyl-lysine is an acetyl derivative of the amino acid lysin. The acetylation of lysine residues in protein is involved in an important mechanism of regulation of gene expression. Glucuronic acid is a compound characteristic of xylan composition, also present in hemicelluloses in wood, which could explain why a lower level was detected only with the cellulose diet.

3.5. Influence of Pentoses Versus Hexoses on Metabolite Profile

From pair-wise comparisons, several compounds with a significant F-value were different between only the Avicel and the xylan diets. These results were used to evaluate the influence of pentoses compared to hexoses as a carbon source. No significant differences were observed when compared to the wood diet, which included both pentoses and hexoses from cellulose and hemicellulose content. Higher levels of glyceric acid (F value = 8.2), 5-oxoproline (F = 5.0), and fructofuranose-P (F = 17.4) were found with the Avicel diet, whereas higher levels of arabitinol (F = 7.2) and erythrose (F = 7.1) were found with the xylan diet (Figure 5). For each compound, the wood diet presented an intermediate level.
Glyceric acid and fructofuranose-P are likely to be related to the glycolysis pathway. This could reflect the production of ethanol through glucose fermentation because a higher level was detected when Avicel, a polymer of glucose only, was given as carbon source. Pyroglutamic acid (5-oxoproline) is an amino acid derivative. It is the cyclic lactam of glutamate and an indication of active glutathione metabolism. Proposed functions of free oxoproline in living cells include a role as analogue or reservoir of glutamate and possible osmoprotection [34].
Arabitinol can be produced by reduction of arabinose. The xylan substrate is a polysaccharide of mainly xylose (>90%) but also contains arabinose. No significant difference was obtained with the wood diet that contains hemicelluloses. Erythrose can be produced from dephosphorylation of erythrose-4-P, an intermediate of the pentose phosphate pathway. In the xylan diet, pentoses are the main carbon source.
Some differences of compound levels were significant only between the wood and xylan diets. No significant differences were obtained when compared with the Avicel diet, whereas an intermediate level was observed. Higher levels of myo-inositol (F = 13.9) and fructose (F = 6.6) were detected with the wood diet (Figure 5). Myo-inositol is a 6-carbon polyol, with each carbon hydroxylated. It is involved in the phospholipid metabolism. Phospholipids are complex molecules that are essential for membrane integrity and intracellular signaling. The detection of myo-inositol in the samples is interesting in the field of biofuels. The membranes of yeast and other microorganisms are a target for ethanol damage [35]. In the yeast Saccharomyces cerevisiae, it was demonstrated that the phospholipid composition plays an important role in its ability to tolerate ethanol [36]. In bioreactor environments, a supplementation of inositol in the growth media increased the concentration of phosphatidylinositol (PI) in the cellular membrane, increased the membrane tolerance to ethanol and also increased the concentrations of ethanol produced [37,38]. Inositol can also be used as a way to store carbon source. A number of bacteria can utilize inositol as a carbon source, such as Bacillus subtilis [39], a bacterium already isolated from R. flavipes [40]. The significant decrease of myo-inositol level observed with xylan diet could reflect the utilization of the inositol as a carbon source, to compensate the lack of 6-carbon molecules. Fructose can be produced from dephosphorylation of fructose-6-P. Fructose-6-P is an intermediate of the glycolysis, but it is also an intermediate of the pentose phosphate pathway, in its open-ring form. Wood and Avicel diets both contain glucose. Wood contains both hexoses and pentoses, which could explain why a higher level of fructose was detected.

4. Conclusions

We have investigated the effect of different diets on Reticulitermes flavipes metabolism. The aim was to study the adaptation of the termite-symbiont digestion system depending on the carbon source. The main challenges for the analysis of these complex samples were the low fluid volume available from the termite gut, the large level range of compounds present in the samples and the background noise level related to the sample preparation and derivatization. The GC×GC-TOFMS method using mid-polar/low-polar column combination, comparative data processing and CLIC expressions allowed detection of more than 300 compounds that were compared between the different samples. Multivariate analysis demonstrated a trend towards the separation of the samples related to the carbon source used by the termites. Essential and non-essential amino acids, amines, sugars, organics acids and other compounds were identified. Univariate analysis was used to compare the relative levels of the metabolites. The main variations included polyols and uric acid production, potentially related to redox imbalance, carbon storage and nitrogen recycling. This report demonstrated that in-depth study of metabolites could complement other approaches [11,41] and contribute to a better understanding of how the termite gut ecosystem degrades lignocellulose.

Supplementary Materials

The following are available online at https://www.mdpi.com/2297-8739/3/2/19/s1.

Acknowledgments

This work was supported by a CRA contract (Concerted Research Action; University of Liège agreement No. ARC 08-13/02). The GC columns were kindly provided by Restek (Restek Corp., Bellefonte, PA, USA) and Supelco Sigma-Aldrich (Sigma-Aldrich, St. Louis, MO, USA).

Author Contributions

The manuscript was written through contributions of all authors, and all authors have given approval for the final version. J.B. coordinated the culture and collection of termite samples. J.B., C.T., C.M., C.M., P.T., J.D., F.F, E.H., D.P., M.V., E.D.P. and J.-F.F participated in design and coordination of the study and drafted manuscript.

Conflicts of Interest

The authors declare no conflict of interest.

References

  1. Ohkuma, M. Termite symbiotic systems: Efficient bio-recycling of lignocellulose. Appl. Microbiol. Biotechnol. 2003, 61, 1–9. [Google Scholar] [CrossRef] [PubMed]
  2. Chandel, A.K.; da Silva, S.S. Sustainable degradation of lignocellulosic biomass—Techniques, applications and commercialization. InTech 2013. [Google Scholar] [CrossRef]
  3. Breznak, J.A.; Brune, A. Role of microorganisms in the digestion of lignocellulose by termites. Ann. Rev. Entomol. 1994, 39, 453–487. [Google Scholar] [CrossRef]
  4. Kudo, T. Termite-microbe symbiotic system and its efficient degradation of lignocellulose. Biosci. Biotechnol. Biochem. 2009, 73, 2561–2567. [Google Scholar] [CrossRef] [PubMed]
  5. Hongoh, Y. Toward the functional analysis of uncultivable, symbiotic microorganisms in the termite gut. Cell. Mol. Life Sci. 2011, 68, 1311–1325. [Google Scholar] [CrossRef] [PubMed]
  6. Brune, A.; Emerson, D.; Breznak, J. The termite gut microflora as an oxygen sink: Microelectrode determination of oxygen and pH gradients in guts of lower and higher termites. Appl. Environ. Microbiol. 1995, 61, 2681–2687. [Google Scholar] [PubMed]
  7. Sethi, A.; Slack, J.M.; Kovaleva, E.S.; Buchman, G.W.; Scharf, M.E. Lignin-associated metagene expression in a lignocellulose-digesting termite. Insect Biochem. Mol. Biol. 2013, 43, 91–101. [Google Scholar] [CrossRef] [PubMed]
  8. He, S.; Ivanova, N.; Kirton, E.; Allgaier, M.; Bergin, C.; Scheffrahn, R.H.; Kyrpides, N.C.; Warnecke, F.; Tringe, S.G.; Hugenholtz, P. Comparative metagenomic and metatranscriptomic analysis of hindgut paunch microbiota in wood- and dung-feeding higher termites. PLoS ONE 2013, 8, e61126. [Google Scholar] [CrossRef] [PubMed]
  9. Bauwens, J.; Millet, C.; Tarayre, C.; Brasseur, C.; Destain, J.; Vandenbol, M.; Thonart, P.; Portetelle, D.; De Pauw, E.; Haubruge, E.; et al. Symbiont diversity in Reticulitermes santonensis (Isoptera: Rhinotermitidae): Investigation strategy through Proteomics. Environ. Entomol. 2013, 42, 882–887. [Google Scholar] [CrossRef] [PubMed]
  10. Brune, A. Symbiotic digestion of lignocellulose in termite guts. Nat. Rev. Microbiol. 2014, 12, 168–180. [Google Scholar] [CrossRef] [PubMed]
  11. Xie, S.; Syrenne, R.; Sun, S.; Yuan, J.S. Exploration of Natural Biomass Utilization Systems (NBUS) for advanced biofuel—From systems biology to synthetic design. Curr. Opin. Biotechnol. 2014, 27, 195–203. [Google Scholar] [CrossRef] [PubMed]
  12. Tokuda, G.; Tsuboi, Y.; Kihara, K.; Saitou, S.; Moriya, S.; Lo, N.; Kikuchi, J. Metabolomic profiling of 13C-labelled cellulose digestion in a lower termite: Insights into gut symbiont function. Proc. R. Soc. B. 2014, 281. [Google Scholar] [CrossRef] [PubMed]
  13. Ralston-Hooper, K.; Jannasch, A.; Adamec, J.; Sepulveda, M. The use of two-dimensional gas chromatography-time-of-flight mass spectrometry (GC×GC-TOF-MS) for metabolomic analysis of polar metabolites. Methods Mol. Biol. 2011, 708, 205–211. [Google Scholar] [PubMed]
  14. Kamleh, M.A.; Dow, J.A.; Watson, D.G. Applications of mass spectrometry in metabolomic studies of animal model and invertebrate systems. Brief. Funct. Genom. Proteom. 2009, 8. [Google Scholar] [CrossRef] [PubMed]
  15. Patterson, D.G., Jr.; Welch, S.M.; Turner, W.E.; Sjödin, A.; Focant, J.-F. Cryogenic zone compression for the measurement of dioxins in human serum by isotope dilution at the attogram level using modulated gas chromatography coupled to high resolution magnetic sector mass spectrometry. J. Chromatogr. A 2011, 1218, 3274–3281. [Google Scholar] [CrossRef] [PubMed]
  16. Brune, A. Termite guts: The world’s smallest bioreactors. Trends Biotechnol. 1998, 16, 16–21. [Google Scholar] [CrossRef]
  17. Evans, T.A.; Forschler, B.T.; Grace, J.K. Biology of invasive termites: A worldwide review. Ann. Rev. Entomol. 2013, 58, 455–474. [Google Scholar] [CrossRef] [PubMed]
  18. Lewis, V.R.; Sutherland, M.; Haverty, M.I. Pest Notes: Subterranean and Other Termites. UC ANR Publication 7415 (2014). Available online: http://www.ipm.ucdavis.edu/PDF/PESTNOTES/pntermites.pdf (accessed on 9 March 2016).
  19. Schauer, C.; Thompson, C.L.; Brune, A. The bacterial community in the gut of the cockroach Shelfordella lateralis reflects the close evolutionary relatedness of cockroaches and termites. Appl. Environ. Microbiol. 2012, 78. [Google Scholar] [CrossRef] [PubMed]
  20. Shin, M.H.; Lee, D.Y.; Skogerson, K.; Wohlgemuth, G.; Choi, I.G.; Fiehn, O.; Fiehn, O.; Kim, K.H. Global metabolic profiling of plant cell wall polysaccharide degradation by Saccharophagus degradans. Biotechnol. Bioeng. 2010, 105, 477–488. [Google Scholar] [CrossRef] [PubMed]
  21. Wachsmuth, C.J.; Vogl, F.C.; Oefner, P.J.; Dettmer, K. Gas Chromatographic Techniques in Metabolomics. In Chromatographic Methods in Metabolomics; Hyotylainen, T., Wiedmer, S., Eds.; RCS Publishing: Cambridge, UK, 2013; pp. 87–105. [Google Scholar]
  22. Magel, E. Physiology of cambial growth, storage of reserves and heartwood formation. In Trends in European Forest Tree Physiology Research; Huttunen, S., Heikkila, H., Bucher, J., Sundberg, B., Jarvis, P., Matyssek, R., Eds.; Springer: Dordrecht, The Netherlands, 2001; pp. 19–32. [Google Scholar]
  23. Austin, J.; Szalanski, A.; Scheffrahn, R.; Messenger, M.; Dronnet, S.; Bagnères, A.G. Genetic evidence for the synonymy of two Reticulitermes species: Reticulitermes flavipes and Reticulitermes santonensis. Ann. Entomol. Soc. Am. 2005, 98, 395–401. [Google Scholar] [CrossRef]
  24. Breznak, J.A. Ecology of prokaryotic microbes in the guts of wood- and litter-feeding termites. In Termites: Evolution, Sociality, Symbiosis, Ecology; Abe, T., Bignell, D.E., Higashi, M., Eds.; Kluwer Academic Publishers: Dordrecht, The Netherlands, 2000; pp. 209–231. [Google Scholar]
  25. Potrikus, C.J.; Breznak, J.A. Gut bacteria recycle uric acid nitrogen in termites: A strategy for nutrient conservation. Proc. Natl. Acad. Sci. USA 1981, 78, 4601–4605. [Google Scholar] [CrossRef] [PubMed]
  26. Brune, A.; Ohkuma, M. Role of the Termite gut Microbiota in Symbiotic digestion. In Biology of Termites: A Modern Synthesis; Bignell, D.E., Roisin, Y., Lo, N., Eds.; Springer: Dordrecht, The Netherlands, 2011; pp. 439–475. [Google Scholar]
  27. Machida, M.; Kitade, O.; Miura, T.; Matsumoto, T. Nitrogen recycling through proctodeal trophallaxis in the Japenese damp-wood termite Hodotermopsis japonica (Isoptera). Insectes Soc. 2001, 48, 52–56. [Google Scholar] [CrossRef]
  28. Brune, A.; Miambi, E.; Breznak, J.A. Roles of oxygen and the intestinal microflora in the metabolism of lignin-derived phenylpropanoids and other monoaromatic compounds by termites. Appl. Environ. Microbiol. 1995, 61, 2688–2695. [Google Scholar] [PubMed]
  29. Meijer, S.; Panagiotou, G.; Olsson, L.; Nielsen, J. Physiological characterization of xylose metabolism in Aspergillus niger under oxygen-limited conditions. Biotechnol. Bioeng. 2007, 98, 462–475. [Google Scholar] [CrossRef] [PubMed]
  30. Abdel-Ghany, S.E.; Day, I.; Heuberger, A.L.; Broeckling, C.D.; Reddy, A.S.N. Metabolic engineering of Arabidopsis for butanetriol production using bacterial genes. Metab. Eng. 2013, 20, 109–120. [Google Scholar] [CrossRef] [PubMed]
  31. Niu, W.; Molefe, M.N.; Frost, J.W. Microbial synthesis of the energetic material precursor 1,2,4-butanetriol. J. Am. Chem. Soc. 2003, 125, 12998–12999. [Google Scholar] [CrossRef] [PubMed]
  32. Ramos, J.L.; Filloux, A. Pseudomonas-A Model System in Biology; Springer: New York, NY, USA, 2007. [Google Scholar]
  33. Buslov, D.K.; Kaputski, F.N.; Sushko, N.I.; Torgashev, V.I.; Solov’eva, L.V.; Tsarenkov, V.M.; Zubets, O.V.; Larchenko, L.V. Infrared spectroscopic analysis of the structure of xylans. J. Appl. Spectrosc. 2009, 76, 801–805. [Google Scholar] [CrossRef]
  34. Kumar, A.; Bachhawat, A.K. Pyroglutamic acid: Throwing light on a lightly studied metabolite. Curr. Sci. 2012, 102, 288–297. [Google Scholar]
  35. Ingram, L.O.; Buttke, T.M. Effects of alcohols on micro-organisms. Adv. Microb. Physiol. 1984, 25, 253–300. [Google Scholar] [PubMed]
  36. Chi, Z.; Kohlwein, S.D.; Paltauf, F. Role of phosphatidylinositol (PI) in ethanol production and ethanol tolerance by a high ethanol producing yeast. J. Ind. Microbiol. Biotechnol. 1999, 22, 58–63. [Google Scholar] [CrossRef]
  37. Furukawa, K.; Kitano, H.; Mizoguchi, H.; Hara, S. Effect of cellular inositol content on ethanol tolerance of Saccharomyces cerevisiae in sake brewing. J. Biosci. Bioeng. 2004, 98, 107–113. [Google Scholar] [CrossRef]
  38. Krause, E.L.; Villa-García, M.J.; Henry, S.A.; Walker, L.P. Determining the effects of inositol supplementation and the opi1 mutation on ethanol tolerance of Saccharomyces cerevisiae. Ind. Biotechnol. 2007, 3, 260–268. [Google Scholar] [CrossRef] [PubMed]
  39. Yoshida, K.; Yamaguchi, M.; Morinaga, T.; Kinehara, M.; Ikeuchi, M.; Ashida, H.; Fujita, Y. Myo-inositol catabolism in Bacillus subtilis. J. Biol. Chem. 2008, 283, 10415–10424. [Google Scholar] [CrossRef] [PubMed]
  40. Tarayre, C.; Brognaux, A.; Brasseur, C.; Bauwens, J.; Millet, C.; Mattéotti, C.; Destain, J.; Vandenbol, M.; Portetelle, D.; De Pauw, E.; et al. Isolation and cultivation of a xylanolytic Bacillus Subtilis extracted from the gut of the termite Reticulitermes santonensis. Appl. Biochem. Biotechnol. 2013, 171, 225–245. [Google Scholar] [CrossRef] [PubMed]
  41. Scharf, M.E. Omic research in termites: An overview and a roadmap. Front. Genet. 2015, 6. [Google Scholar] [CrossRef] [PubMed]
Figure 1. Two-dimensional gas chromatography-time-of-flight mass spectrometry (GC×GC-TOFMS) chromatograms obtained from analyses of a rough metabolite extraction of the gut of the termite Reticulitermes santonensis. Column sets 1, 2, and 3 were used for Figure 1a‒c, respectively. Samples were derivatized with the N-Methyl-N-(trimethylsilyl)trifluoroacetamide (MSTFA) silylation reagent. Column set 3 (1D mi-polarity fluoropropyl × 2D low polarity 5% phenyl) provided the best occupation of the two-dimensional capacity and the best chromatographic fingerprint for data processing and comparison study. (a): Rtx®-5 (low-polar); (b): SLB®-IL61 (high-polar); (c): Rtx®-200 (mid-polar).
Separations 03 00019 g001
Figure 2. Computer Language for Chemical Identification (CLIC expression) was used to quickly select and remove unwanted peaks from the chromatogram. The “trifluoro” keyword was used to select the peaks corresponding to the derivatization reagent MSTFA (yellow markers). Simple scripts were used to recognize features of the other unwanted peaks in the mass spectra, based on two specific fragments with the highest intensities: mass-to-charge ratio (m/z) 59 and m/z 137 (green markers), m/z 137 and m/z 215 (blue markers), m/z 294 and m/z 309 (white markers). The red markers correspond to peaks that remained after the cleaning process.
Separations 03 00019 g002
Figure 3. Principal Component Analysis of the termite metabolite profiles obtained with different diets. Three-hundred and fourteen compounds detected in the samples were used as variables (using Percent Response). The termite samples collected from the same diet sat together.
Separations 03 00019 g003
Figure 4. One way-ANOVA and the pair-wise Tukey’s test were used to identify significant differences of compound levels between the different diets. For each compound reported, the diet marked with an asterisk presented a significantly different level than the two others, with p < 0.05 (*) or p < 0.01 (**).
Separations 03 00019 g004
Figure 5. One way-ANOVA was used to identify significant differences of compound levels between the different diets. Pair-wise comparisons, using the Tukey’s test, helped to identify a significant difference only between two diets, specifically, with p < 0.05 (*) or p < 0.01 (**). The diet not marked with an asterisk is not significantly different from the two others.
Separations 03 00019 g005
Table 1. Metabolites identified in the termite guts. The identification is based on a National Institute of Standards and Technology (NIST) library match factor > 700. Sugars were identified using specific standards.
Amino AcidsAminesOrganic AcidsSugarsOthers
Alanine2-Piperidone2-Ketogluconic acidArabitinol1,2,4-butanetriol
AsparagineCadaverine2-Ketoglutaric acidErythrosePhosphate
Aspartic acidNicotinamide2-KetovalineFructosePhosphite
Beta-AlanineN-MethylvaleramideBenzoic acidGalactose
Glutamic acidPutrescineCaproic acidGlucose
Glutamine Citric acidInositol Isomer
Glycine Fumaric acidInositol myo-
Isoleucine Glyceric acidMeso-Erythritol
Leucine Hydroxyphenylacetic acidRhamnose
N-acetyl-lysine Lactic acidXylose
5-oxoproline Malic acid
Ornithine Oxalic acid
Phenylalanine Phenylacetic acid
Serine Phenylpropanoic acid
Threonine Pipecolinic acid
Tyrosine Succinic acid
Valine Uric acid

