Article

Minor Wheat Protein Fractions Analysis by Using Capillary Zone Electrophoresis

by
Angela Rosa Piergiovanni
Istituto di Bioscienze e Biorisorse, Consiglio Nazionale delle Ricerche (IBBR-CNR), via Amendola 165/a, 70126 Bari, Italy
Separations 2016, 3(2), 17; https://doi.org/10.3390/separations3020017
Submission received: 18 January 2016 / Revised: 18 May 2016 / Accepted: 24 May 2016 / Published: 3 June 2016
(This article belongs to the Special Issue Electrophoretic Analyses in Capillaries and Microfluidic Devices)

Abstract

:
The wheat proteins soluble in chloroform-methanol mixtures are associated with several kinds of food allergies. A separation method based on capillary zone electrophoresis (CZE) with UV detection was developed for the analysis of these mixtures. An acidic phosphoric acid/β-alanine (pH 2.5) buffer containing HPMC, urea and acetonitrile was used for the separation. The capillary electrophoresis (CE) was able to complete the analysis in six minutes. The electrophoregrams of extracts of both durum and common wheat commercial cultivars were compared. The registered cultivar (cv.) Kamut® was included as a representative of rustic cereal species. A different number of peaks were detected in the profile relative to the tetraploid and exaploid analyzed cultivars. Three main peaks were observed for all tetraploid cultivars, while four peaks were detected for the common wheat cultivars. The peak corresponding to the α-amylase inhibitor type III was identified in the common wheat electrophoregram. The possibility of quantitative determination of this inhibitor has been investigated.

1. Introduction

Among the cereal crops, wheat is the most widely grown. Much of the world production is consumed by humans after processing to bread, pasta, biscuits, noodles, etc. However, the ingestion of wheat derivatives can trigger IgE-mediated food allergies in about 6–8% of children and 1–3% of adults. Hypersensitivity reactions to wheat may cause a variety of symptoms. For example, ingestion may cause atopic dermatitis, gastrointestinal symptoms or wheat-dependent exercise-induced anaphylaxis; inhalation may cause baker’s asthma; and skin contact may occasionally trigger IgE-mediated contact urticaria [1,2]. More detailed information on wheat allergens is of great importance for the development of both less allergenic flours and better diagnostic tools. Moreover, some studies have established a link between plant food allergens and mechanisms involved in the plant defense against insect and microbial pests [3,4].
Proteins represent about 10–15% (dry weight) of wheat grain. Based on differential solubility, they can be divided into two basic groups: water-/salt-soluble proteins (albumins and globulins) and water-/salt-insoluble proteins (gliadins and glutenins). Although sequential extraction of the protein fractions does not allow clear-cut preparations, so cross-contamination among different fractions may occur, allergens belong primarily to two large protein super families. Mainly salt-soluble proteins seem to be associated with baker’s asthma and gliadins with wheat-dependent exercise-induced anaphylaxis, whereas both fractions react to IgE from food-allergic patients [5,6].
The alpha-amylase family is composed of three major groups: 2S albumins, lipid transfer proteins and alpha-amylase/trypsin inhibitors (α-ATI). The proteins belonging to these groups have related structures, low relative molecular weight (MW) (below 15 kDa) and are stable to thermal processing and proteolysis. The α-ATI family includes the so-called CM proteins, which can be selectively extracted with chloroform/methanol mixtures. They are 12–16 kDa polypeptides with four to five intra-chain disulphide bridges that are essential for the inhibitory activity [1,7]. It has been known that these polypeptides inhibit mammalian and insect amylases but not the wheat endogenous enzymes [8]. The efficiency against the amylases from a particular source is correlated with the inhibitor aggregation state and structural features of protein sequences [4]. Based on the degree of polypeptides aggregation, monomeric, homodimeric and heterotetrameric forms have been identified in wheat flour [9]. Due to the related structures of these proteins, efficient separation techniques are crucial to elucidate their nature. The development of innovative, fast and reproducible methodological approaches would be a formidable goal to increase the knowledge on these protein fractions which are essentially waste when wheat flour is fractionated to give gluten and starch.
Capillary electrophoresis (CE) is an analytical method which offers the advantages of full automated and quantitative analysis, high resolution, short analysis time, and minimal sample requirements. It is well suited for the separation of proteins and has been used for this purpose for over three decades. Nowadays, CE has become a routine method for protein analyses in clinical, forensic and biomedical fields, as well as for the separation of proteins and peptides extracted from vegetable tissues [10]. Capillary zone electrophoresis (CZE) has been extensively applied to the analysis of wheat protein fractions (i.e., gliadins, glutenins and albumins) [11,12,13] for identifying grain variety by comparing the electrophoregrams [14], to investigate the variation of protein profiles within germplasm collections [15], to study the rate of protein accumulation in kernels [16,17], and so on. Despite this great versatility of CE in terms of efficiency and speed of analysis to investigate the different wheat protein fractions, no protocol exists for the investigation of the CM protein fraction.
The aim of the present investigation was to develop a reliable method based on CZE that will provide reproducible and quantitative measures of the wheat grain proteins soluble in chloroform/methanol mixture, some of which are relevant for wheat food allergy.

2. Experimental Section

2.1. Plant Materials

Grains of commercial varieties belonging to different Triticum species were analyzed in this study. They were: Triticum durum desf.—cultivars (cvs.) Castel del Monte (PI 428456), Ariosto and Svevo; T. aestivum L.—cvs. Chopin (PI 573741), Chinese Spring (CI tr 14108), Rio, Autonomia and Bolero. The registered cv. Kamut® (T. turgidum L subsp. turanicum (Jakubz) A. Löve & D. Löve) was included as representative of rustic cereal species. Seed samples, coded PI and CI, were received from USDA, ARS, National Small Grains Germplasm Research Facility, National Small Grains Collection (Aberdeen, ID, USA). The remaining ones were from Italian seed trade companies. Kamut® was obtained from Kamut Enterprise of Europe (Bologna, Italy). Five whole seeds for each sample were manually ground to a fine meal using a mortar and pestle and store at 5 °C until analyzed. Aliquots of the obtained meal were used for the extraction of CM proteins.

2.2. Extraction of CM Protein Fraction

CM protein fraction was extracted from whole meals (1:5, w/v) with a mixture of CHCl3:MeOH (1:1, v/v) for 8 min at room temperature with periodic vortexing (10 s every minute). Then the sample was centrifuged for 15 min at 9000 rpm. The supernatant was analyzed in the same day by capillary electrophoresis. At the end of the day, the capillary was flushed with 0.1 M NaOH for 5 min and with water for 10 min.

2.3. Capillary Zone Electrophoresis (CZE)

A P/ACE MDQ (Beckman-Coulter, Fullerton, CA, USA) equipped with a UV detector set at 200 nm was used to analyze the seed extracts. Separations were achieved using uncoated fused silica capillary 30 cm long (22 cm to the detector) with 50 µm inner diameter of the capillary (i.d.) The separation was carried out by using a 0.1 M phosphoric acid/β-alanine buffer (pH 2.5) containing urea (1 M), hydroxyl-propyl-methyl cellulose (HPMC) 0.05% (w/v) and 20% acetonitrile (ACN) (v/v). The running conditions were applied voltage 15 kV for 8 min, capillary temperature 35 °C. The buffer was prepared in 18 MΩ cm distilled and deionized water (Milli-Q water system Millipore, Billerica, MA, USA). Beckman Karat 8.0 software (Brea, CA, USA) was used for acquiring, storing, comparing the electrophoregrams and integrating the peaks. Peak resolution was calculated applying the formula:
R = 2(t2 − t1)/(w1 + w2)
where t2 and t1 are the migration time of two adjacent peaks; w1 and w2 the baseline peak width.

2.4. Chemicals

Commercial standard of α-amylase inhibitor (α-AI) type I (code A1520) and III (code A3535) from Triticum aestivum (wheat seed) were purchased by Sigma-Aldrich (St. Louis, MO, USA). They are competitive inhibitor of human salivary α-amylase. The Lys-Lys-Lys-Lys peptide (Sigma-Aldrich, St. Louis, MO, USA) was used as internal standard of CZE analyses. The α-AI type I and III as well as the Lys-Lys-Lys-Lys peptide were dissolved in aqueous ethanol (30%, v/v) before the use. Different concentrations of the α-AI type III were prepared by diluting the stock standard solution to construct a calibration plot.
Unless otherwise specified, all chemicals were of analytical reagent grade.

3. Results and Discussion

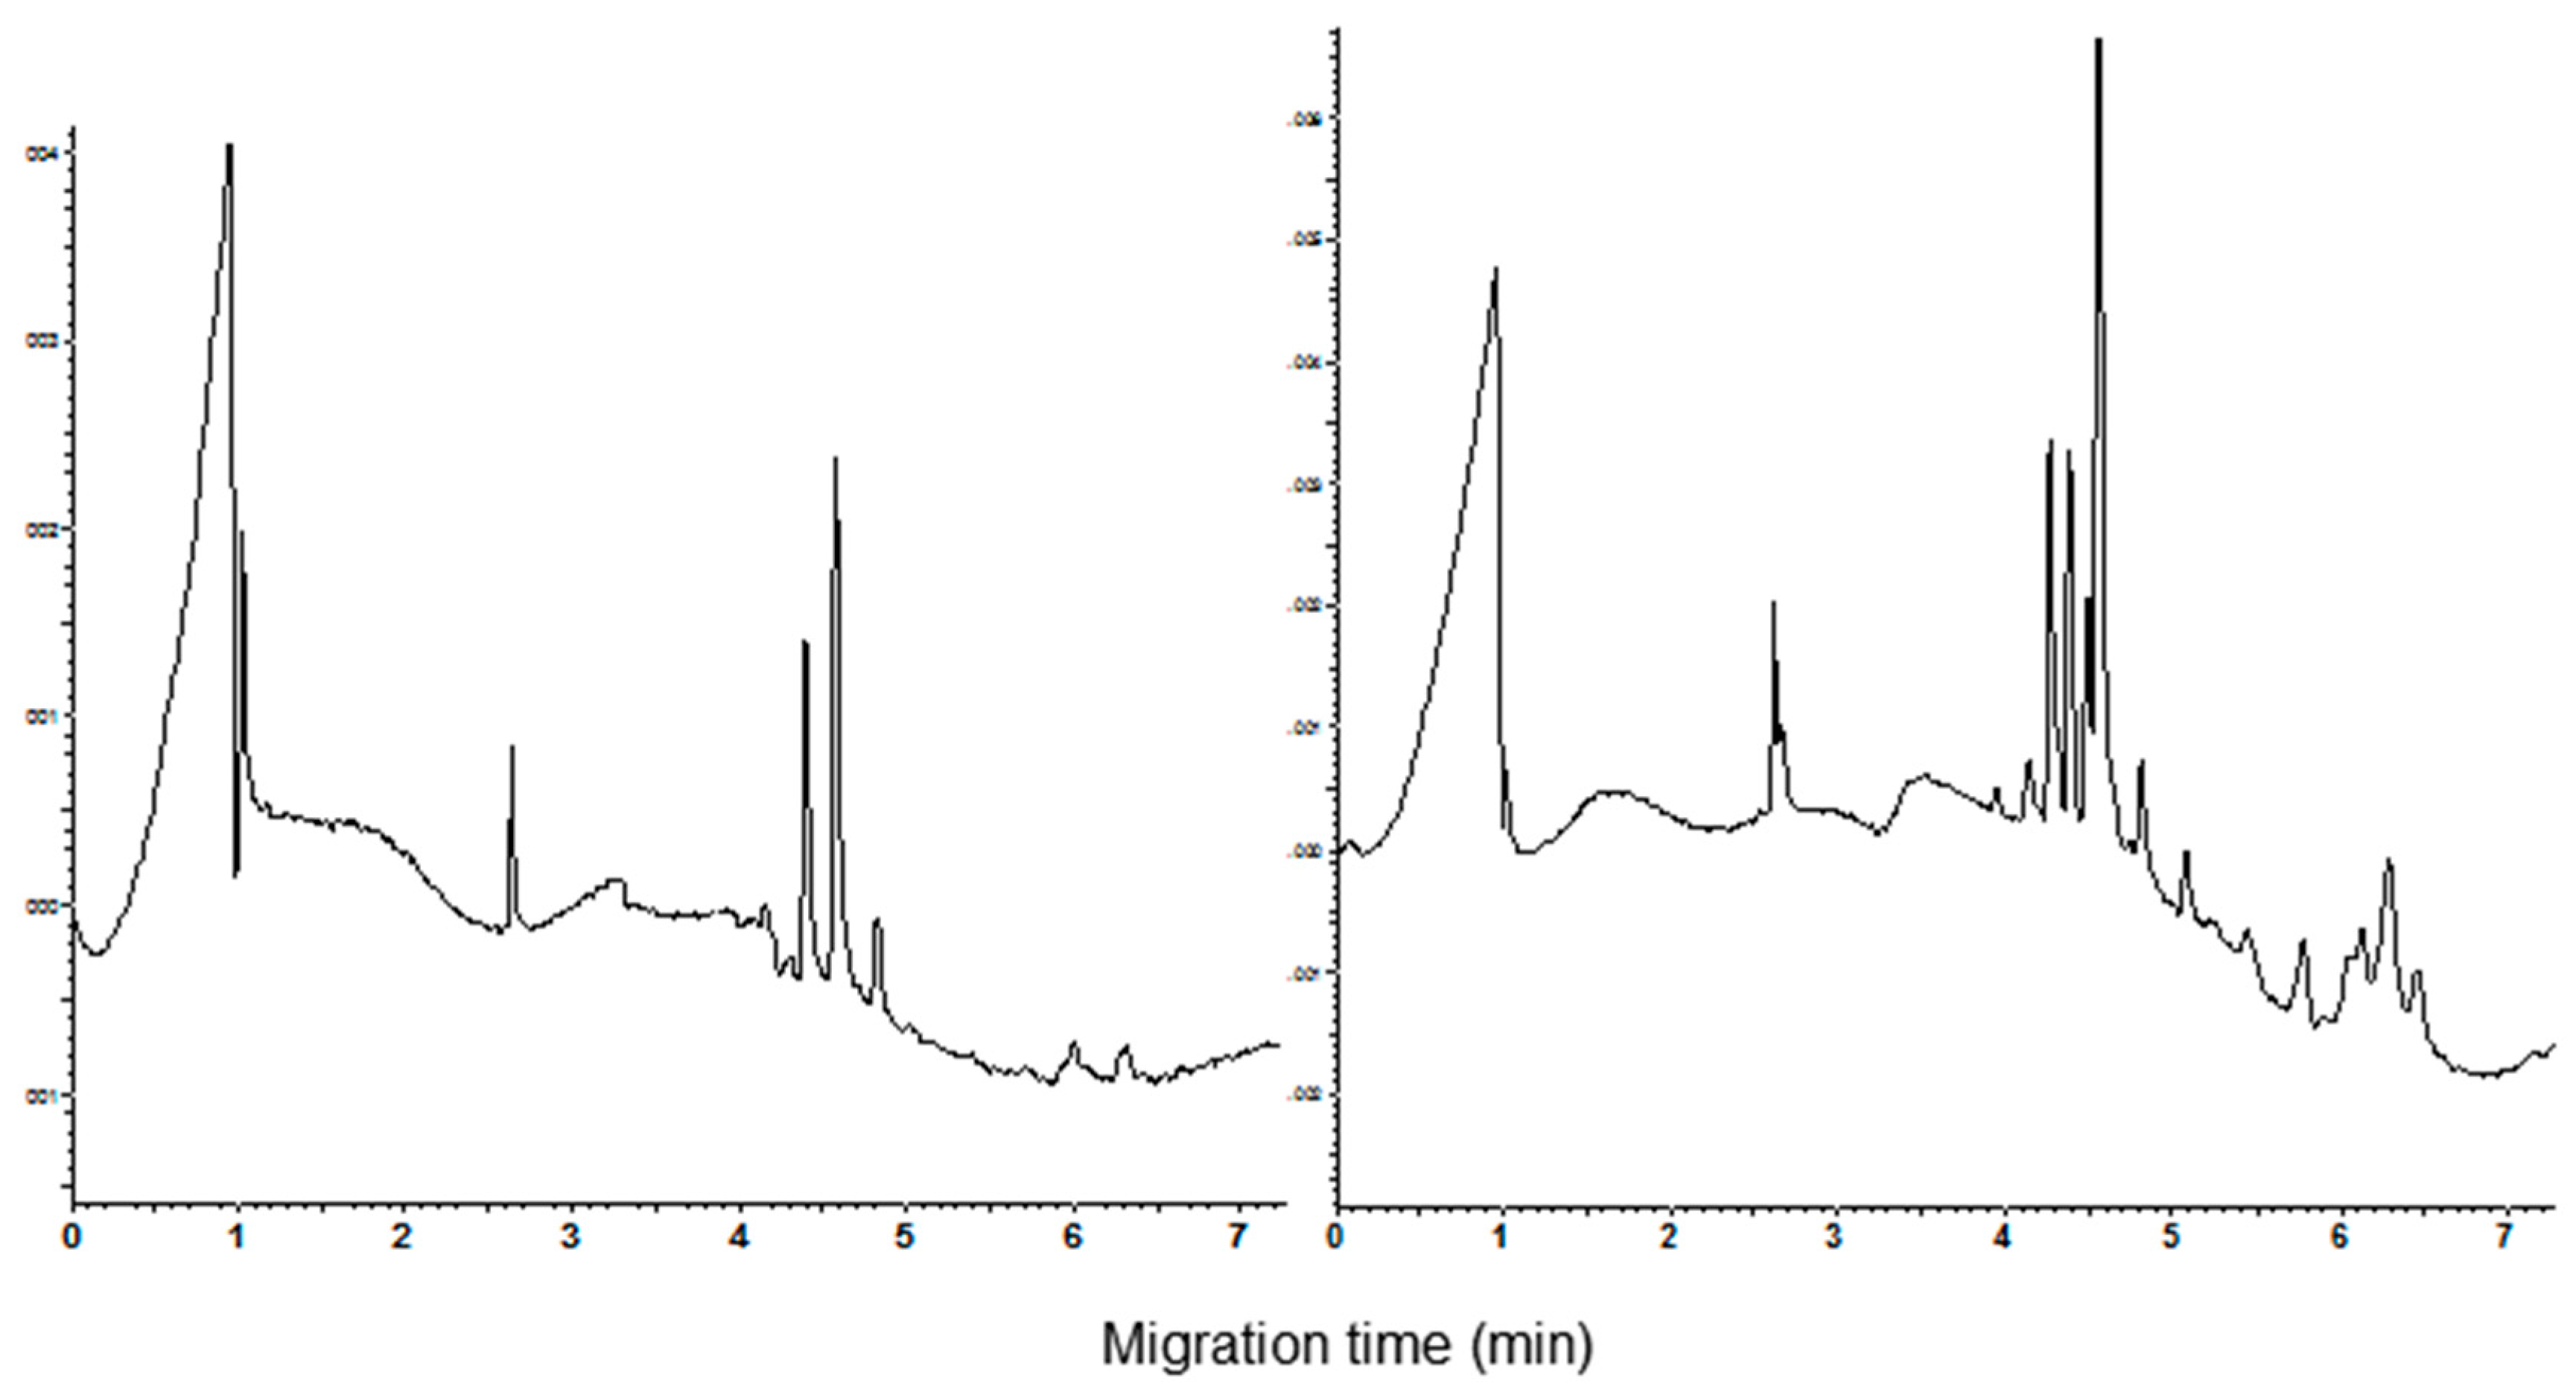
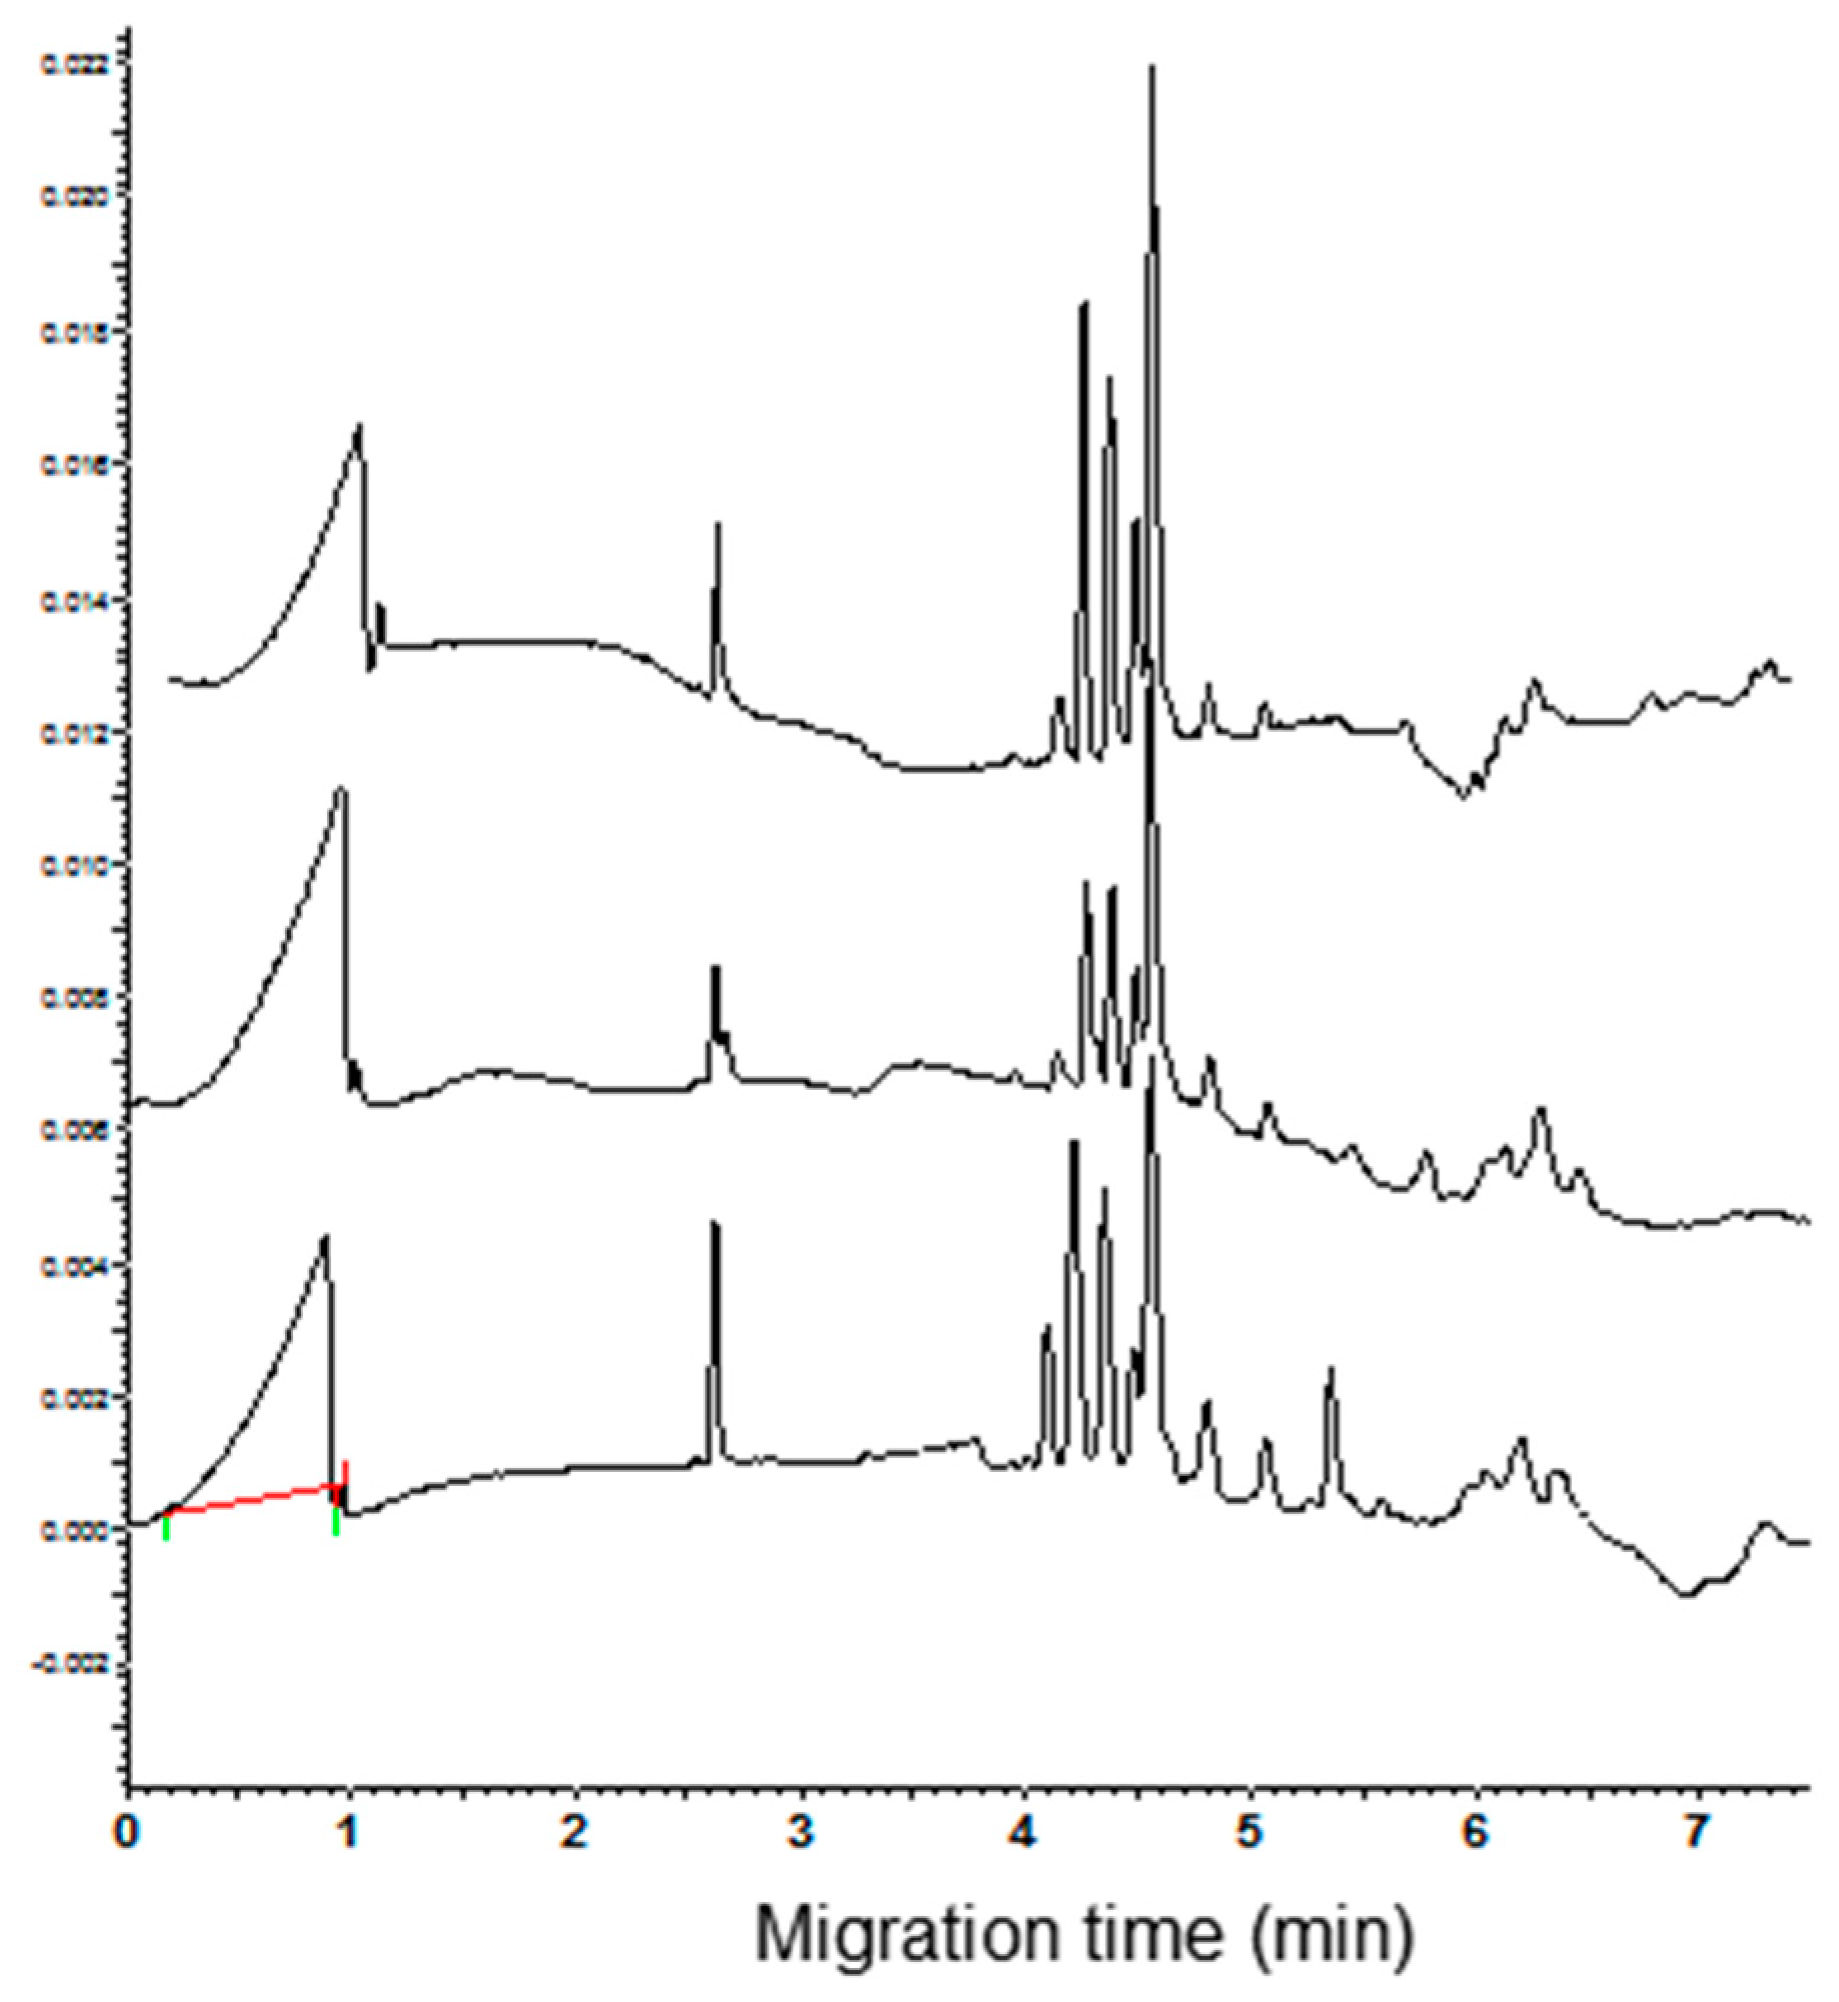
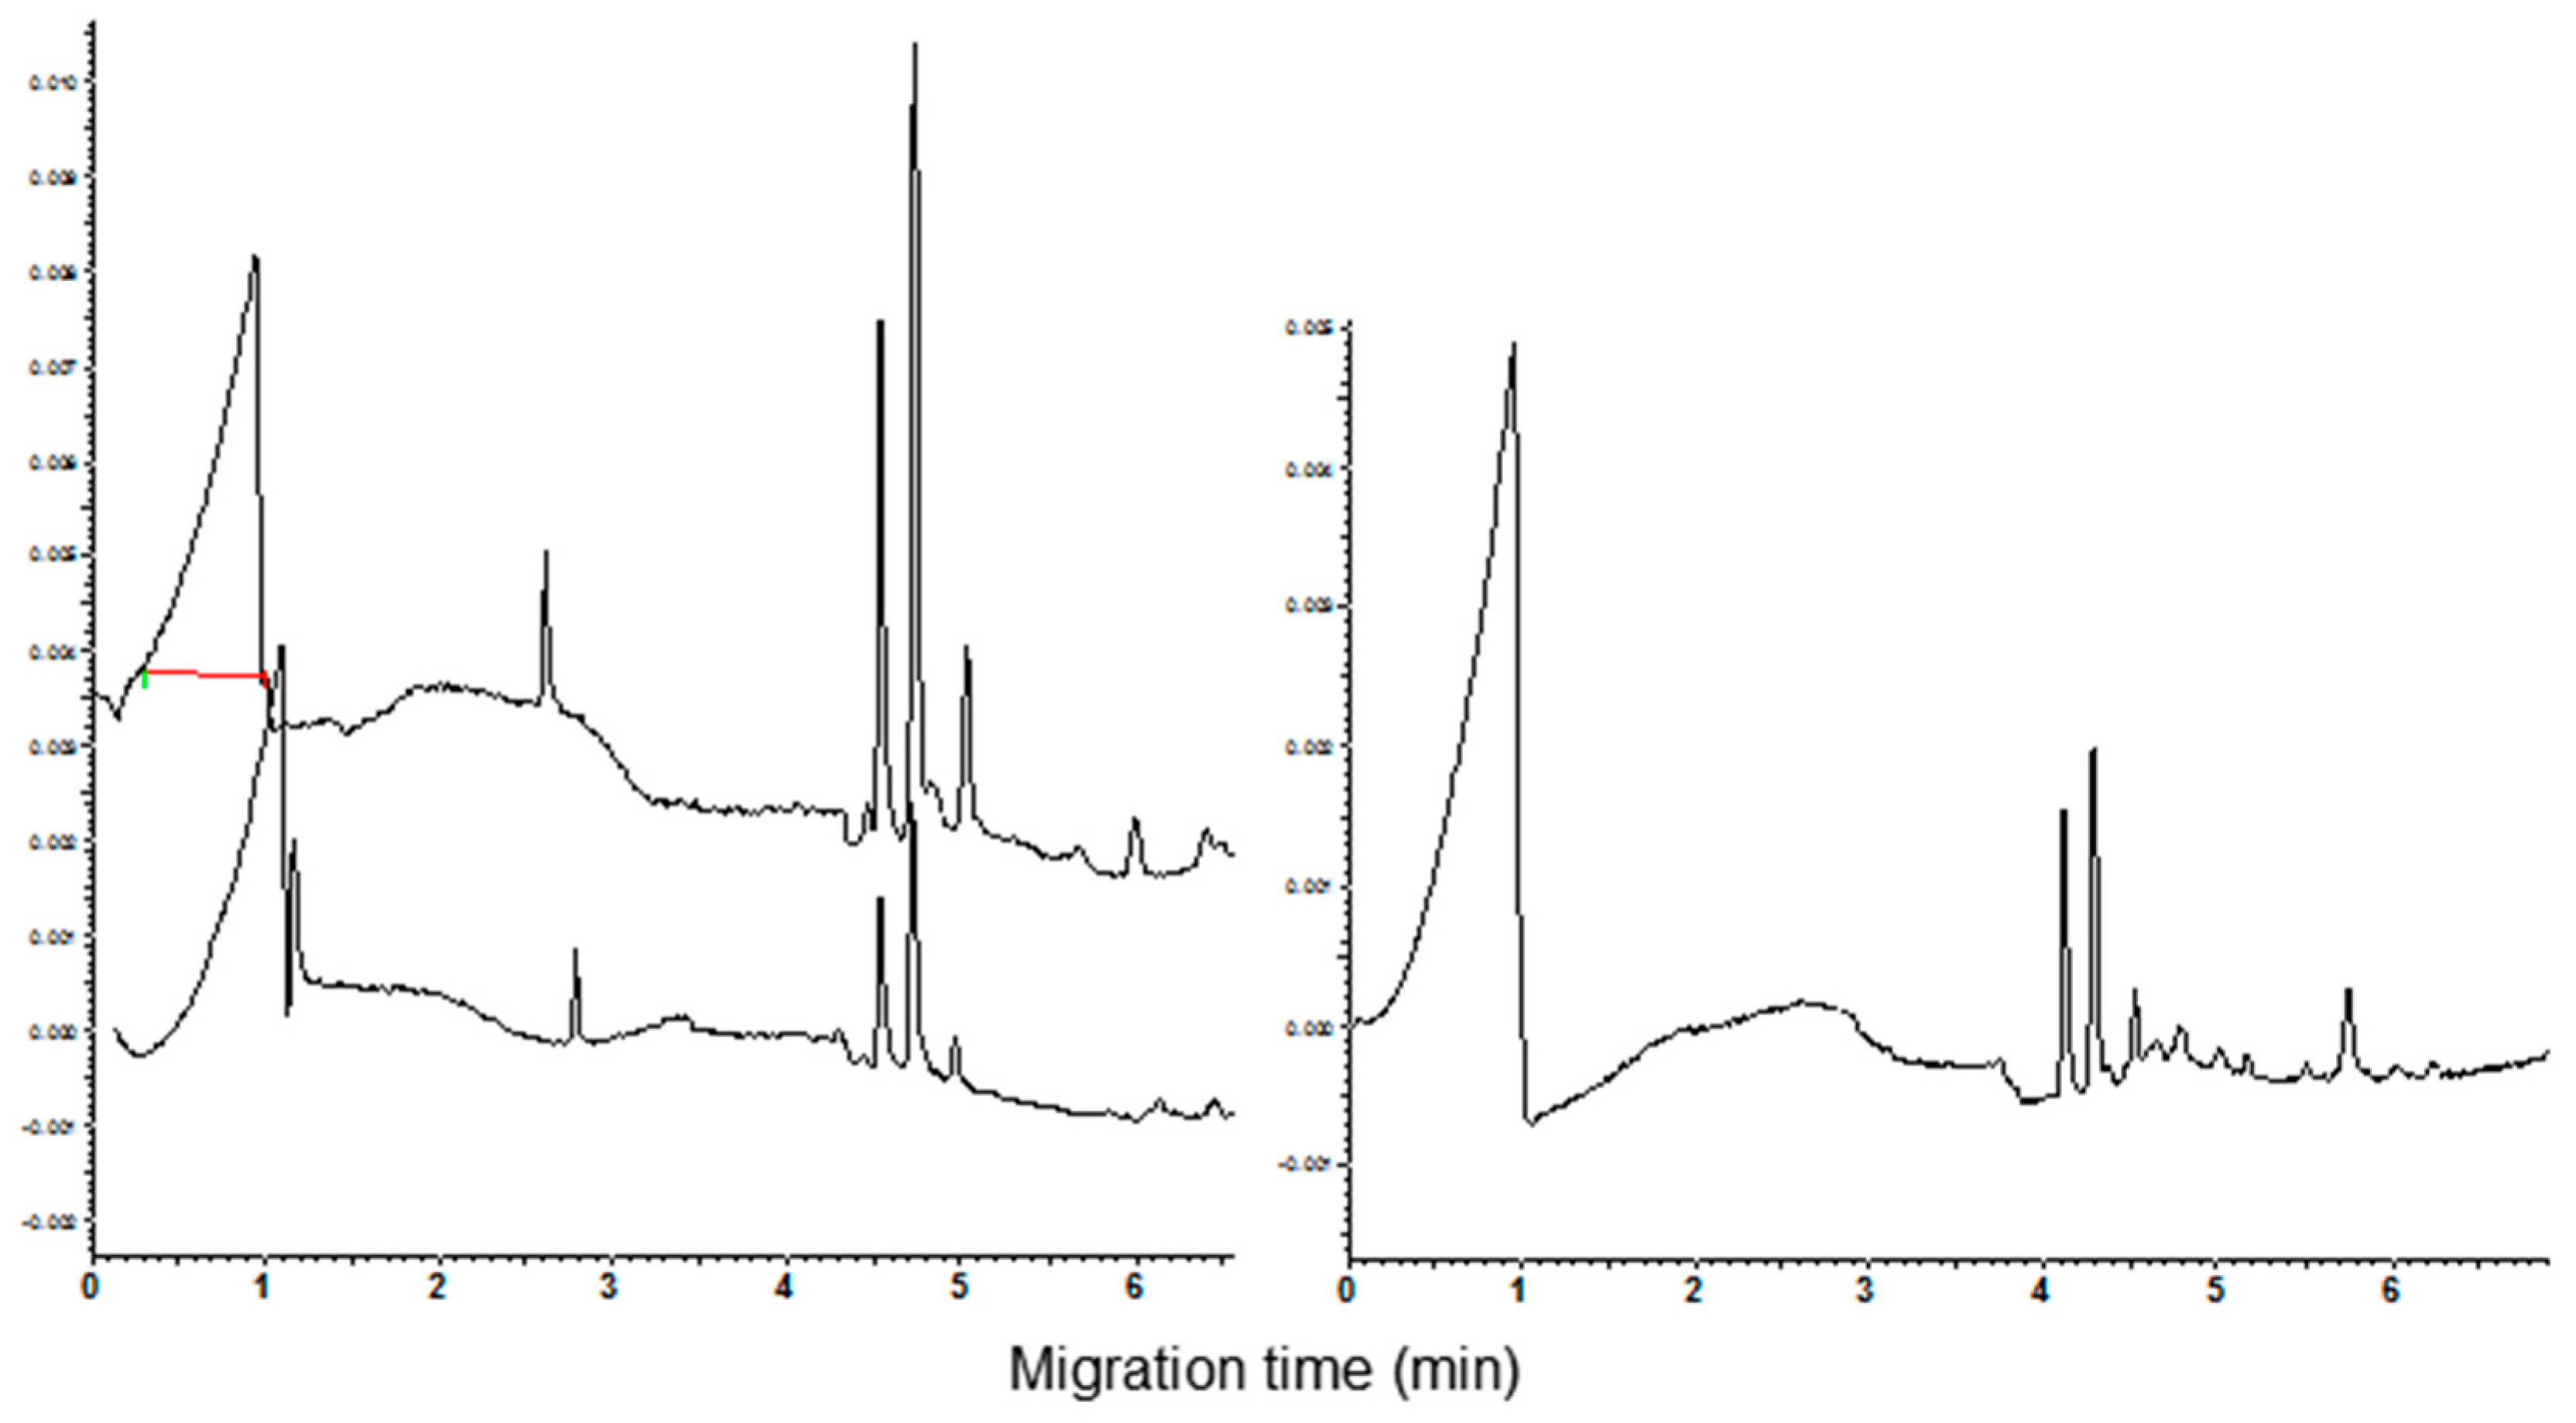
3.1. Polyacrylamide Gel Electrophoresis and Capillary Zone Electrophoresis of CM Extracts

Several studies showed that low MW proteins present in various crop plants might include allergens. For this reason, there is a perceived need to identify and characterize these functionally active proteins. However, low MW proteins cannot always be visualized and adequately investigated due to an insufficient band resolution of the conventional Tris/glycine gel systems that commonly are used. Although the use of tricine should improve the electrophoretic performance, the obtained results were poor. More efficient separations can be obtained by using bi-dimensional electrophoretic protocols or by analyzing partially purified extracts. For example, to study allergenic proteins of wheat Kitta et al. [18] used a two-dimensional electrophoretic protocol with an immobilized pH gradient followed by acetic acid/urea-polyacrilammide gel electrophoresis. Fontanini et al. [5] resolved the CM pool obtained from an emmer accession in a major spot, a minor one and two faint spots, submitting the extract to a semi-preparative RP-HPLC step before the 2-DE analysis. However, the partial purification of close-related proteins using semi-preparative liquid chromatography, ion-exchange chromatography or similar methodologies, before mono or bi-dimensional electrophoretic analyses, being time-consuming procedures, do not allow processing a high number of samples.
In this frame, CZE has attracted attention as being a potentially alternative method to polyacrylamide gel electrophoresis to analyze proteins extracted from vegetable tissues. Generally, the methods developed for the separation of cereal proteins use low pH buffers with one or more additives to improve protein solubility and reduce protein–inner capillary wall interactions that adversely affect peak resolution. Protocols available in the literature for the analysis of protein wheat fractions report the use of several acidic buffers such as those based on sodium phosphate (pH 2.5), phosphate/glycine (pH 2.5), aspartic acid or phosphate/ β-alanine [10,13,14,16].
In the present study, the best resolution of the components of the CM fraction was obtained using the acidic phosphoric acid/β-alanine (pH 2.5) buffer containing HPMC and acetonitrile (0.05% and 20%, respectively). The addition of urea at the concentration 1 M improves the visual peak parameters such as the sharpness, height, and symmetry. Moreover, the current did not show significant fluctuations during the run. Less than 6 min are required to complete the analysis. As example, the electropherograms recorded for the cvs. Castel del Monte and Chopin (durum and common wheat, respectively) are shown in Figure 1. The calculated resolution between the main peaks (migration time from 4.2 to 4.8 min) is good, ranging from 1.00 to 1.66 and from 0.773 to 1.396 for durum and common wheat cvs., respectively. Standard deviation of the migration time (n = 3) was comprised between 0.21 and 0.23 for the main durum wheat peaks, and between 0.25 and 0.26 for the common wheat ones.
The acquired experimental evidence strongly suggests that CE combined with MS detection would contribute considerably to progress in isolation and identification of the proteins soluble in the CHCl3:MeOH mixture. The weight of molecular ion [M + H]+ of each peak could be obtained by MALDI mass spectrum, while MALDI-TOF could give the amino acid sequence of peptides.
The analysis of wheat commercial varieties carried out in this study showed that an invariable number of main peaks was detectable in the electrophoregrams of the samples sharing the same ploidia level.
Three main peaks are present in the profile of tetraploid varieties (Figure 2) such as the durum wheat ones and Kamut®, while four main peaks were detectable in the electrophoregrams of the exaploid common wheat varieties (Figure 3). Among the analyzed common wheat cvs., only in the electrophoregram of Chinese Spring (Figure 3, inferior trace) the peak with a migration time of 4.1 min was found sufficiently high to have analytical relevance.
The invariance of the number of main peaks is not surprising because genes coding for the amylase inhibitor families (mono-, di-, and tetrameric) may be derived from a very limited number of ancestral genes coding for polypeptide sequences with a molecular mass close to 12 kDa. Replication of these ancestral genes and divergence by various mechanisms, for example single nucleotide polymorphisms (SNP), have probably given rise to the three main families of genes coding for the many subunits of the different inhibitors [19]. Genes dispersed on the group 3, 4, 6 and 7 chromosomes of the B and D genomes encode for amylase inhibitors [4,20]. As the D genome is not present in the tetraploid wheat species, the protein pattern of these species will show a different number of components as compared to the exaploid common wheat.
The nature of the minor peaks with migration time more than 6 min, mainly observed in the electrophoregrams of the exaploid cvs., was not clear. However, it should be kept in mind that whole meal extracts should be regarded as dirty samples. Actually, these extracts certainly contain, in addition to the CM proteins, variable amounts of co-extracted compounds that are partially soluble in the used extraction medium. When five-fold volumes of cold acetone were added at the CHCl3:MeOH extracts, a precipitate was obtained after storing at −20 °C for 4 h.
The resuspension of pellet with the CHCl3:MeOH (1:1, v/v) mixture and its subsequent CZE analysis evidenced the disappearance of all the late migrating peaks. In addition, a low peak, partially overlapping at the highest one, appeared in the electrophoregram (Figure 4, see arrow in the lower trace). It can be argued that the addition of acetone, removing the co-extracted compounds, significantly improves the separation of the shoulder detectable at the same time when the extract was analyzed before the removal of minor peaks (Figure 4, see arrow in the upper trace).
It should be underlined that this shoulder was detected in electrophoregrams of all the exaploid cvs. The better separation of the shoulder was the only real improvement of peak separation obtained after precipitation and resuspension of CM proteins. Based on this experimental evidence, the importance of carrying out the precipitation and resuspension of the CM proteins is questionable. Actually, the removal of the late migrating peaks is not crucial to obtain good analyses due to the significant lack of overlap between the ranges of migration time relative to the removed peaks and CM proteins.

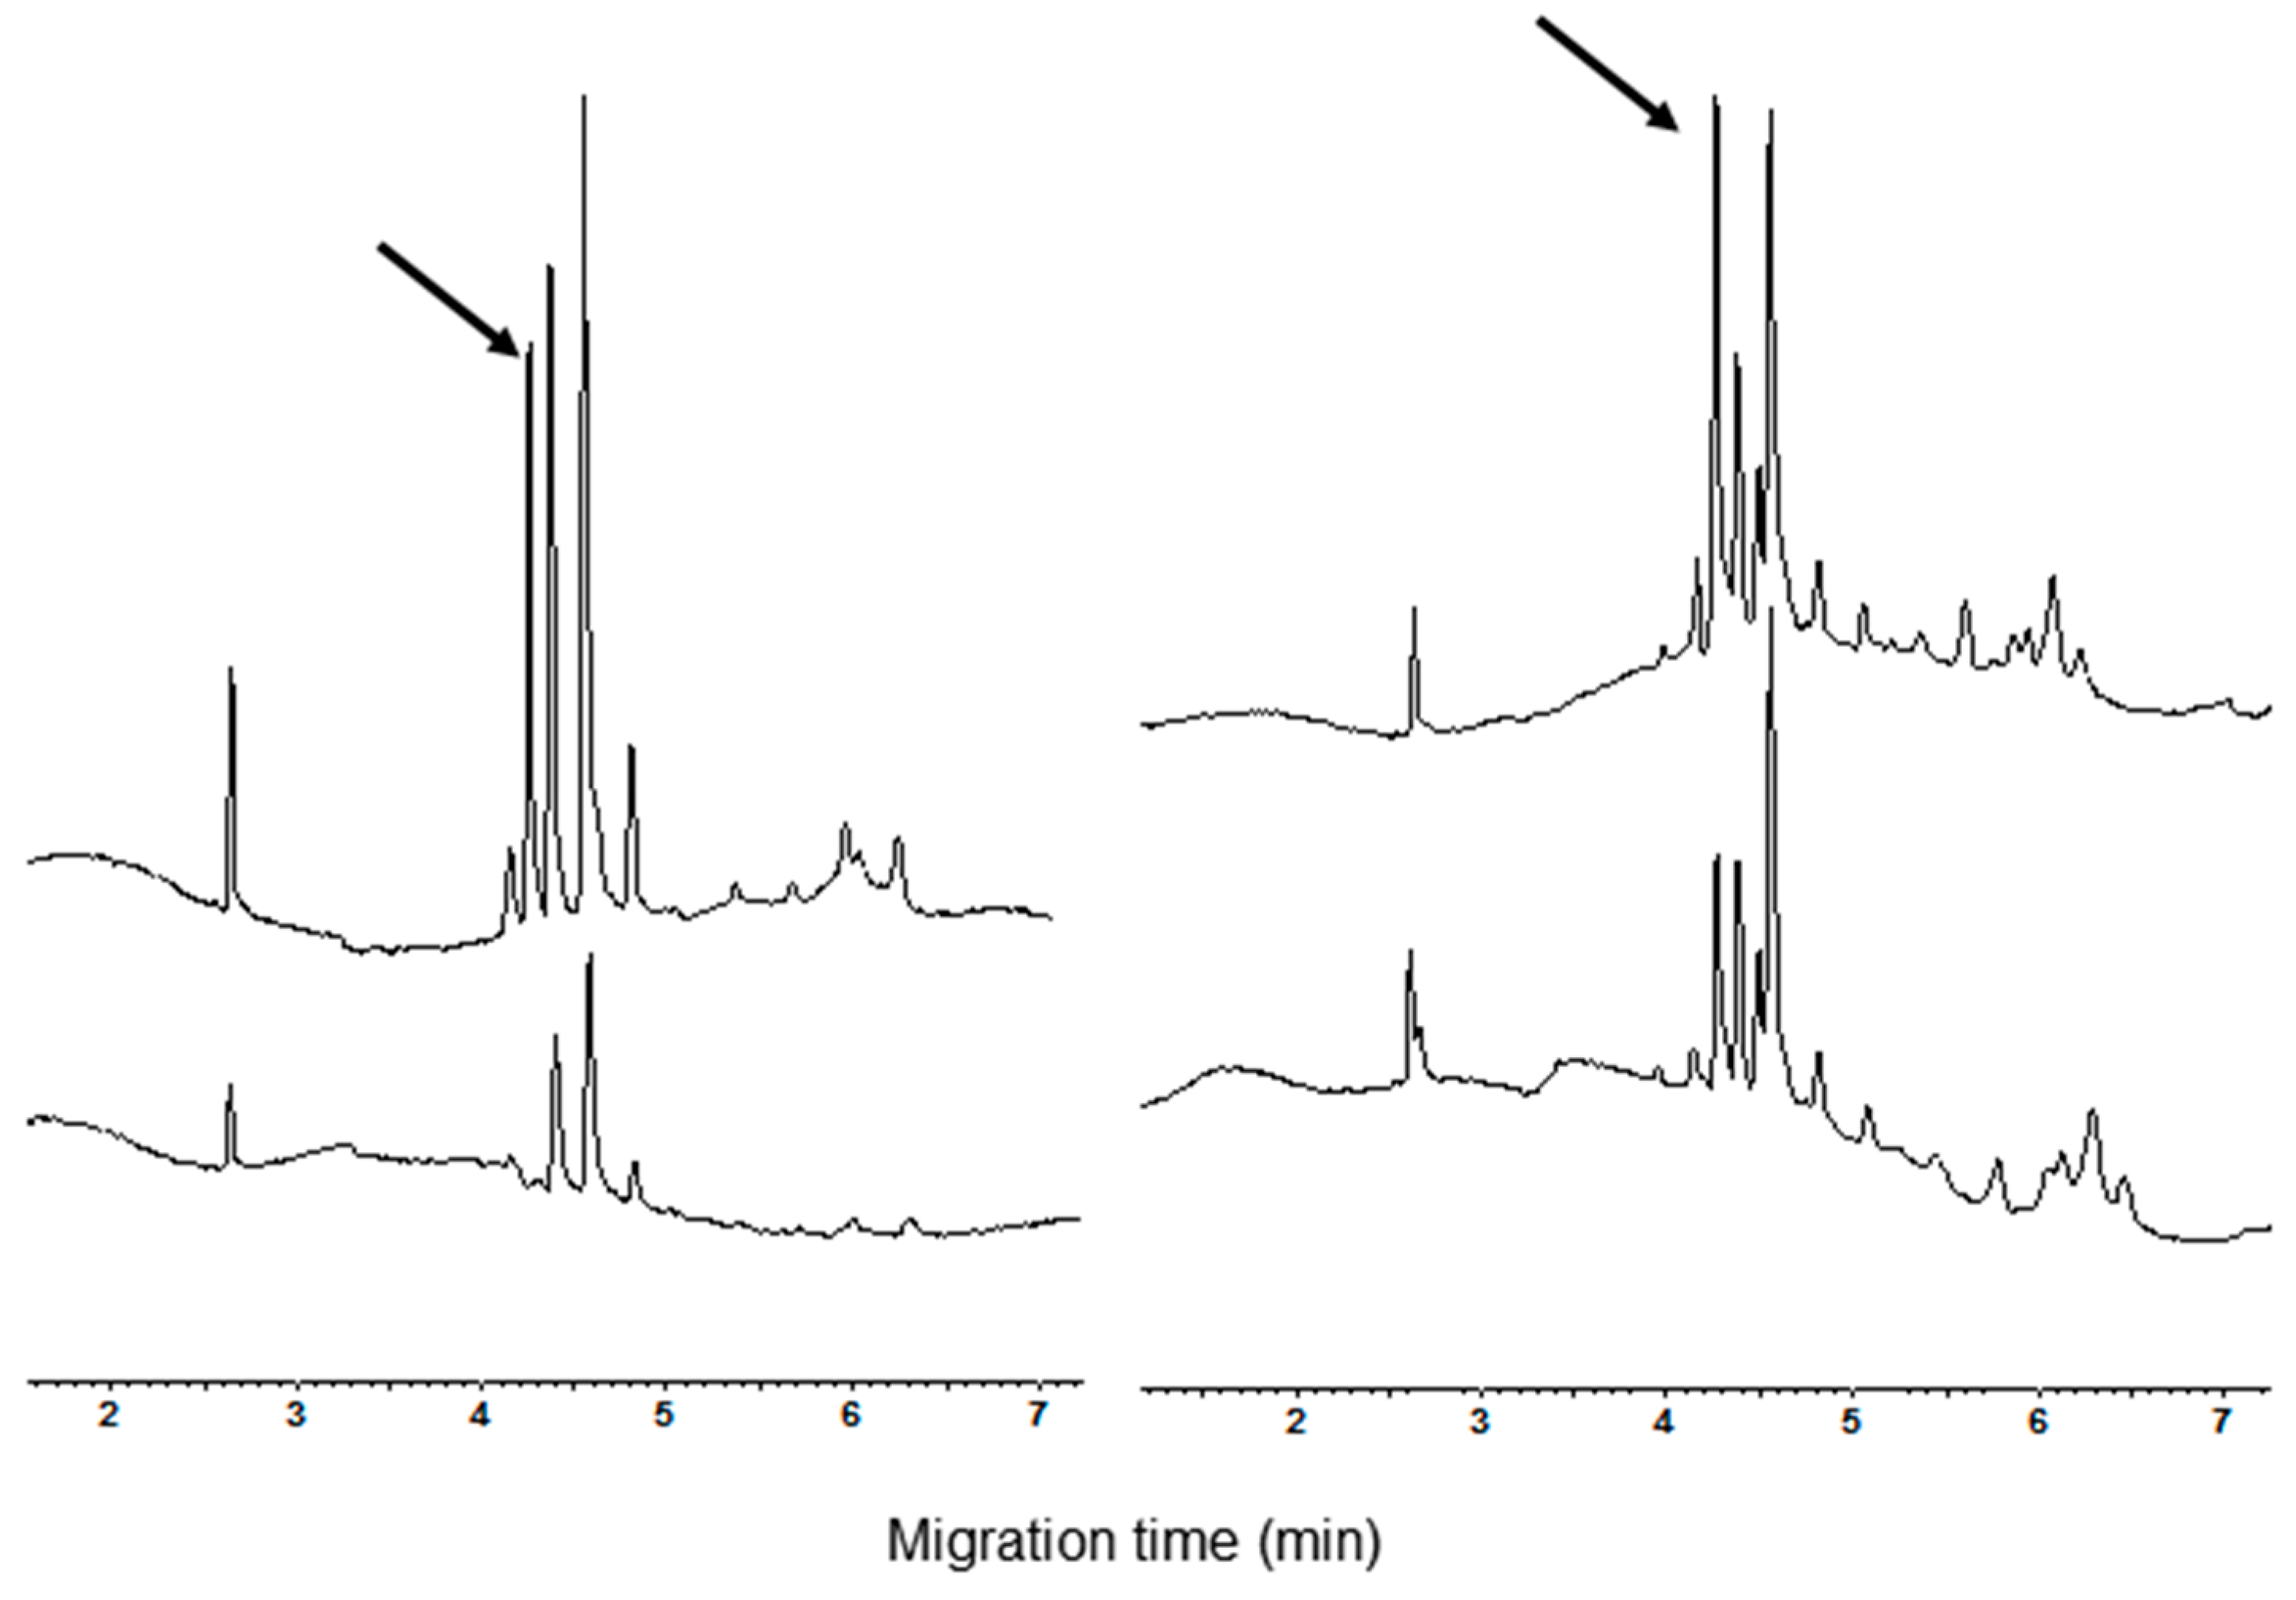
3.2. Qualitative and Quantitative Analysis of CM Peaks

In order to attempt the identification of CM peaks detectable with the described protocol, commercial standards of common wheat α-amylase inhibitors were analyzed under the same conditions. The importance of the peak identification is related to the fact that this protein fraction is considered the major allergen in baker’s asthma, an occupational hypersensitivity disease primarily affecting persons working in the baking and milling industries [21]. On the other hand, the use of α-AIs with high activities against human salivary α-amylase could represent a pharmacological tool or a drug-design target for the treatment of diabetes, obesity and hyperlipemia [22]. Moreover, it is known that α-AIs have an important role in plant defense and protect the starch in the endosperm against degradation [3,4]. The used standards were the α-amylase inhibitor (α-AI) type I and III, both characterized by inhibitory activity against human salivary α-amylase.
As concerns the α-AI type I, the CZE analysis proved that the standard did not have a high purity, showing at least four analytically relevant peaks (Figure 5, bottom trace). The observation that the peaks had a range of migration time overlapping with that of the commercial cultivars suggests that more isoforms could be present in the standard. Consequently, no single attempt to identify the α-AI type I in the electrophoregram of wheat cultivars can be done.
Under the used condition of analysis, the α-AI type III had a migrating time of 4.22 min (n = 10, RSD = 1.3%). This value is the same as the first of the four peaks of CM proteins observed in the electrophoregrams of common wheat cvs. The increase of the height of the peak migrating at this time, recorded when aliquots of the inhibitor were added to CM extracts of common wheat cvs. (Figure 6, see arrow in the right panel), supported the identification of the peak. As expected, being the α-AI type III encoded by the D genome, a new peak compared in the electrophoregram of the tetraploid cvs. when an aliquot of standard solution was added to these extracts (Figure 5, see arrow in the left panel).
Due to the good peak separation under the described CZE condition of analysis, the possibility for quantitative determination of the α-AI type III in the CHCl3:MeOH extracts was evaluated. A calibration plot was constructed by analyzing seven α-AI type III standard solutions with the inhibitor concentration ranging from 0.01 to 0.14 µg/µL. The best linearity (R2 = 0.983) was obtained with the concentration of calibration standards against the peak area. Applying the minimum square rule to the experimental data, the following straight line was obtained:
y = 18.848x + 0.0243
where y is the ratio of the areas of the peak relative to α-AI type III vs. the internal standard one (Lys-Lys-Lys-Lys); x is the α-AI concentration.
Intraday relative standard deviation (RSD%) for the peak area was 3.27% (n = 6). Data relative to the content of α-AI type III in the tested common wheat varieties are listed in Table 1. Although the data in the table refer to material grown in different conditions (year of cultivation, environmental features, agrotechnique, etc.) so the data in the table have a limited significance, this screening showed an appreciable variation of the inhibitor accumulation in the kernels of tested varieties.

4. Conclusions

This study showed that the acidic phosphoric acid/β-alanine buffer (pH 2.5) containing HPMC, urea and acetonitrile allows the separation of CM proteins, extracted from different Triticum species, in their native form with good selectivity and efficiency. More work is needed to further investigate the potentialities of the described CZE methodology. Particular attention should be devoted to combining this CE protocol with MS detection to obtain the protein/peptide sequence of the CM components. Extensive analysis of allergenic molecules is necessary for food source identification, correct allergy diagnosis and the development of treatments. Moreover, inhibitors with high inhibitory activities against human salivary have a high potential as a drug-design target for the treatment of obesity and diabetes.

Conflicts of Interest

The author declare no conflict of interest.

References

  1. Tatham, A.S.; Shewry, P.R. Allergenes in wheat and related cereals. Clin. Exp. Allergy 2008, 38, 1712–1726. [Google Scholar] [PubMed]
  2. Pietzak, M. Celiac disease, wheat allergy, and gluten sensitivity: When gluten free is not a fad. J. Parenter. Enter. Nutr. 2012, 36, 68S–75S. [Google Scholar] [CrossRef] [PubMed]
  3. Franco, O.L.; Rigden, D.J.; Melo, F.R.; Grossi-de-Sá, M.F. Plant alpha-amylase inhibitors and their interaction with insect alpha-amylases. Structure, function and potential for crop protection. Eur. J. Biochem. 2002, 269, 397–412. [Google Scholar] [CrossRef] [PubMed]
  4. Franco, O.L.; Rigden, D.J.; Melo, F.R.; Bloch, C.; Silva, C.P.; Grossi de Sá, M.F. Activity of wheat α-amylase inhibitors towards bruchid α-amylases and structural explanation of observed specificities. Eur. J. Biochem. 2000, 267, 2166–2173. [Google Scholar] [CrossRef] [PubMed]
  5. Fontanini, D.; Capocchi, A.; Muccilli, V.; Saviozzi, F.; Cunsolo, V.; Saletti, R.; Foti, S.; Galleschi, L. Dimeric inhibitors of human salivary alpha-amylase from emmer (Triticum dicoccon Schrank) seeds. J. Agric. Food Chem. 2007, 55, 10452–10460. [Google Scholar] [CrossRef] [PubMed]
  6. Salcedo, G.; Quirce, S.; Diaz-Perales, A. Wheat allergens associated with baker’s asthma. J. Investig. Allergol. Clin. Immunol. 2011, 21, 81–92. [Google Scholar] [PubMed]
  7. Carbonero, P.; Garcia-Olmedo, F. A multigene family of trypsin/alpha-amylase inhibitors from cereals. In Seed Proteins; Shewry, P.R., Casey, R., Eds.; Kluwer Academic Publishers: Dordrecht, The Netherlands, 1999; pp. 617–633. [Google Scholar]
  8. Salcedo, G.; Sanchez-Monge, R.; Garcia-Casado, G.; Amentia, A.; Gomez, L.; Barber, D. The cereal α-amylase/trypsin inhibitor family associated with bakers’ asthma and food allergy. In Plant Food Allergens; Mill, E.N.C., Shewry, P.R., Eds.; Blackwell Publishing Company: Oxford, UK, 2004; pp. 70–86. [Google Scholar]
  9. Zoccatelli, G.; Pellegrina, C.D.; Mosconi, S.; Consolini, M.; Veneri, G.; Chignola, R.; Peruffo, A.; Rizzi, C. Full-fledged proteomic analysis of bioactive wheat amylase inhibitors by a 3-D analytical technique: Identification of new heterodimeric aggregation states. Electrophoresis 2007, 28, 460–466. [Google Scholar] [CrossRef] [PubMed]
  10. Dolnik, V. Capillary electrophoresis of proteins 2005–2007. Electrophoresis 2008, 29, 143–156. [Google Scholar] [CrossRef] [PubMed]
  11. Bean, S.R.; Tilley, M. Separation of water soluble proteins from cereals by free zone capillary electrophoresis. Cereal Chem. 2003, 80, 505–515. [Google Scholar] [CrossRef]
  12. Piergiovanni, A.R. Extraction and separation of water-soluble proteins from different wheat species by acidic capillary electrophoresis. J. Agric. Food Chem. 2007, 55, 3850–3856. [Google Scholar] [CrossRef] [PubMed]
  13. Gao, L.; Ma, W.; Chen, J.; Wang, K.; Li, J.; Wang, S.; Bekes, F.; Appels, R.; Yan, Y. Characterization and comparative analysis of wheat high molecular weight glutenin subunits by SDS-PAGE, RP-HPLC, HPCE and MALDI-TOF-MS. J. Agric. Food Chem. 2010, 58, 2777–2786. [Google Scholar] [CrossRef] [PubMed]
  14. Bean, S.R.; Lookhart, G.L. Ultrafast capillary electrophoretic analysis of cereal storage proteins and its applications to protein characterisation and cultivar differentiation. J. Agric. Food Chem. 2000, 48, 344–353. [Google Scholar] [CrossRef] [PubMed]
  15. Piergiovanni, A.R. Estimating gliadin and albumin variation at intra and inter-accession level in the USDA Oriental wheat (Triticum. turanicum. L. subsp. turanicum (Jakubz.) (A. Löve & D. Löve) collection using capillary zone electrophoresis. Cereal Chem. 2009, 86, 37–43. [Google Scholar]
  16. Scholz, E.; Ganzler, K.; Gergely, S.; Salgo, A. Use of capillary electrophoresis to monitor wheat maturation. Chromatographia 2002, 56, 127–130. [Google Scholar] [CrossRef]
  17. Charmet, G.; Robert, N.; Branlard, G.; Linossier, L.; Martre, P.; Triboit, E. Genetic analysis of dry matter and nitrogen accumulation and protein composition in wheat kernels. Theor. Appl. Genet. 2005, 111, 540–550. [Google Scholar] [CrossRef] [PubMed]
  18. Kitta, K.; Ohnishi-Kameyama, M.; Ogawa, T.; Kawamoto, S. Detection of low-molecular weight allergens resolved on two-dimensional electrophoresis with acid-urea polyacrylamide gel. Anal. Biochem. 2006, 351, 290–296. [Google Scholar] [CrossRef] [PubMed]
  19. Wang, J.R.; Wei, Y.M.; Yan, Z.H.; Zheng, Y.L. Detection of single nucleotide polymorphysms in 24 kDa dimeric alpha-amylase inhibitors from cultivated wheat and its diploid putative progenitors. Biochim. Biophys. Acta 2005, 1723, 309–320. [Google Scholar] [CrossRef] [PubMed]
  20. Wang, J.R.; Yan, Z.H.; Wei, Y.M.; Nevo, E.; Baum, B.R.; Zheng, Y.L. Molecular charactersation of dimeric alpha-amylase inhibitor genes in wheat and development of genome allele-specific primers for the genes located on chromosome 3BS and 3DS. J. Cereal Sci. 2006, 43, 360–368. [Google Scholar] [CrossRef]
  21. Baur, X.; Posch, A. Characterized allergens causing bakers’ asthma. Allergy 1998, 53, 562–566. [Google Scholar] [CrossRef] [PubMed]
  22. Choudhury, A.; Maeda, K.; Murayama, R.; Di Magno, E.P. Character of a wheat amylase inhibitor preparation and effects on fasting human pancreaticobiliary secretions and hormones. Gastroenterology 1996, 111, 1313–1320. [Google Scholar] [CrossRef] [PubMed]
Figure 1. Capillary zone electrophoresis (CZE) pattern of the CHCl3:MeOH extracts. Left: cv. Castel del Monte and right cv. Chopin. Separation conditions as reported in Materials and Methods section. The Lys-Lys-Lys-Lys peptide (migration time 2.7 min) was used as internal standard.
Separations 03 00017 g001
Figure 2. Comparison of protein selectively extracted with chloroform/methanol extracts from tetraploid species. Left: Triticum durum—cv. Svevo (upper trace) and cv. Castel del Monte (bottom trace). Right: T. turgidum L subsp. turanicum—Kamut®.
Separations 03 00017 g002
Figure 3. Comparison of CM protein extracts from meal of some common wheat cultvars. From the bottom to the top: cvs. Chinese Spring, Chopin and Rio.
Separations 03 00017 g003
Figure 4. Comparison of CZE pattern of CM extract from cv. Autonomia before and after acetone precipitation (upper and bottom trace, respectively).
Separations 03 00017 g004
Figure 5. Electrophoregrams of the α-amylase inhibitor (α-AI) commercial standard type I and III (bottom and top trace, respectively).
Separations 03 00017 g005
Figure 6. Comparison of CZE pattern of CM extract before and after α-AI type III standard addition (bottom and top trace, respectively). The arrows indicate the changes in the electrophoregrams. Left: cv. Castel del Monte and right cv. Chopin.
Separations 03 00017 g006
Table 1. Content of α-amylase inhibitor (α-AI) type III relative to the tested common wheat varieties.
cv. Nameα-AI Type III (µg/mg)
Chinese spring1.2
Rio2.1
Chopin2.0
Autonomia2.4
Bolero1.7
(Values are referred to substance).

