1. Introduction
Trihalomethanes (THMs) are normally considered to be of primary concern when naturally occurring organic compounds react with disinfection compounds in a water treatment process. In such cases, the compounds are referred to as disinfection byproducts (DBPs), of which the most prevalent are haloacetic acids (HAAs), haloacetonitriles (HANs), haloketones, chloral hydrate and chloropicrin [
1]. However, THMs and substituted haloalkanes can be naturally produced in soils through the interaction of hydrogen peroxide decay products, if iron (III) is present [
2], and then transported by rainfall or runoff, to the water column whereby they may continue to react to form THM precursors in natural waters [
3]. Further, THMs can be formed naturally in the water column itself, through the interaction of natural bromide and/or chloride concentrations, especially when high dissolved organic matter (DOM) content is present. In North America, organic input from leaf foliage and other decay materials entering surface waters can be significant during the fall of the year, where THM concentrations have been found as high as 300 μg·L
−1 (ppb) without disinfection treatment [
4]. In unpolluted natural waters, bromine and the bromide ion concentrations are generally less the 1 ppm, and about 100 ppb in rainwater [
5,
6]. Typical chloride concentrations in surface waters are in the 10–30 ppm range, but due to component volatility, concentration variance from one water system to another is quite possible. Hydrogen peroxide has been found at concentrations from 1–30 ppb in surface waters. For rainwater, the hydrogen peroxide concentration can vary from 50 ppb to low parts per trillion (ppt) depending upon amount of sunlight exposure [
6,
7].
Brominated THMs are produced through bromination of humic acids in the same way chlorinated THMs are produced; usually from the reaction of HOBr or HOCl (respectively) with acetyl groups in humic acids, which are contained in breakdown products of natural organic matter like lignin [
8]. The bromide ion can undergo a one-electron transfer from chlorine to form aqueous bromine, as demonstrated in Equations (1)–(3).
The bromite ion being more reactive than the chlorite, suggests that hypobromite will be a better brominating reagent than hypochlorite for chlorination [
9]. Hence, brominated THM production might be preferred over their chloro adduct in unpolluted waters [
10]. The exact reaction mechanism is not understood, mainly due to the complexity of the DOM involved. Use of humic model compounds, interpreted from fractions that have been isolated through ion exchange separations of humic acids [
10], suggest that the reaction may follow the haloform reaction route, as demonstrated by 3,5-hydrobenzoic acid under basic conditions of pH > 6.8 in
Figure 1 [
9,
11].
The original THM classification for bromodichloromethane, bromoform, chlorodibromomethane and chloroform has been extended to include a variety of different substituted halogenated compounds. Given the variety of THM precursors possible, the type of THM production may be altered by changes in pH; high pH favors THM adducts produced by way of
Figure 1, low pH favors halonitrile THM adduct production. An increase in temperature also tends to increase the rate of THM production [
12].
Figure 1.
Example of a possible haloform reaction of 3,5-hydroxybenzoic acid at pH > 7.
Figure 1.
Example of a possible haloform reaction of 3,5-hydroxybenzoic acid at pH > 7.
The interest in THMs in the water column are generally due to their deleterious health aspects, where many of the THMs are suspected carcinogens belonging to Group B2 or C of the International Agency for Research on Cancer (IARC) [
13]. Thus it is necessary to monitor drinking water sources for THM contamination. The US Environmental Protection Agency (EPA) and European Union (EU) (respectively) have set maximum allowable (drinking water) limits for total THMs at 80 and 100 ppb (μg·L
−1), where >90 ppb can have adverse effects on liver and kidney functions in humans [
14,
15]. However, prolonged THM intake concentration (exposure) limits have not been agreed upon. Currently, the Newfoundland and Labrador provincial government of Canada monitors 473 public water supplies in the island part of the province, where THM ranges from negligible to 300 ppb (μg·L
−1) [
3]. Current analytical techniques include: LLE, purge-and-trap and photometric detection methods [
15], as in EPA501.2 (using liquid–liquid extraction (LLE)), and THM monitoring methods, as in EPA501.3 (using gas chromatography-mass spectrometry (GC/MS)), are typical. Samples must be analyzed within 10 days of sample collection [
5] and, hence, it is important to utilize detection methods that are fast and robust for representative determination of THM concentrations in the natural waters.
In most occasions, spot (or grab) sampling is usually employed to sample natural waters, where the samples are analyzed in batch analysis later in the lab. Although spot sampling with subsequent THM extraction and analysis can give reasonable indicative data, the technique acquires information of an analyte concentration only at a particular point in time at a specific location. Although a large amount of spot water samples can be obtained, the extraction analysis cannot account for the effects of physical conditions such as episodic contamination or gradient flow. Comparatively, time weight averaging (TWA) sampling in a passive mode may be utilized to extract small amounts of analytes over longer time intervals, which can represent long-term concentrations more accurately than spot sampling.
The literature has shown that use of solid phase microextraction (SPME) technique affords the possibility of sampling THM analytes by either method (spot [
16,
17,
18] and TWA [
19,
20,
21]) with easy incorporation to subsequent GC/MS analysis. Work by Stack [
22] and Valencia [
23] have shown the utility of headspace- (HS-) SPME with GC/MS for measurement of THMs from swimming pools and chlorinated drinking waters. SPME is based upon analytes in the sample interacting with a selected polymeric fiber in a multiphase equilibration process, with analytes migrating along the phases until equilibrium is reached. This method of sampling can be used to extract analytes from a sealed vial by HS- or by direct immersion- (DI-) SPME sample extraction. As such, the mass of an analyte extracted by the SPME device fiber is related to the overall equilibrium of the analyte in the phases. Because the total mass of an analyte should be constant throughout the extraction, the mass balance formula for the analyte is given in Equation (4) [
24].
where
Co is the initial concentration of analyte in the sample,
Cf,
Ch, and
Cs are the equilibrium concentrations of the analyte in the fiber coating, headspace, and sample, respectively, and where
Vf,
Vh, and
Vs are the volumes of the fiber film coating, headspace, and sample.
For HS-SPME extraction, if the coating/gas distribution constant is taken to be
Kfh =
Cf/
Ch, and the gas/sample matrix distribution constant is taken to be
Khs =
Ch/
Cs, the mass of the analyte absorbed by the coating can be expressed [
24] in Equation (5).
For DI-SPME extraction, there will be a single distribution constant to describe the equilibrium between the fiber and the sample,
Kfs. As such, an equation to describe the amount of analyte adsorbed onto the fiber,
n, shown in Equation (6):
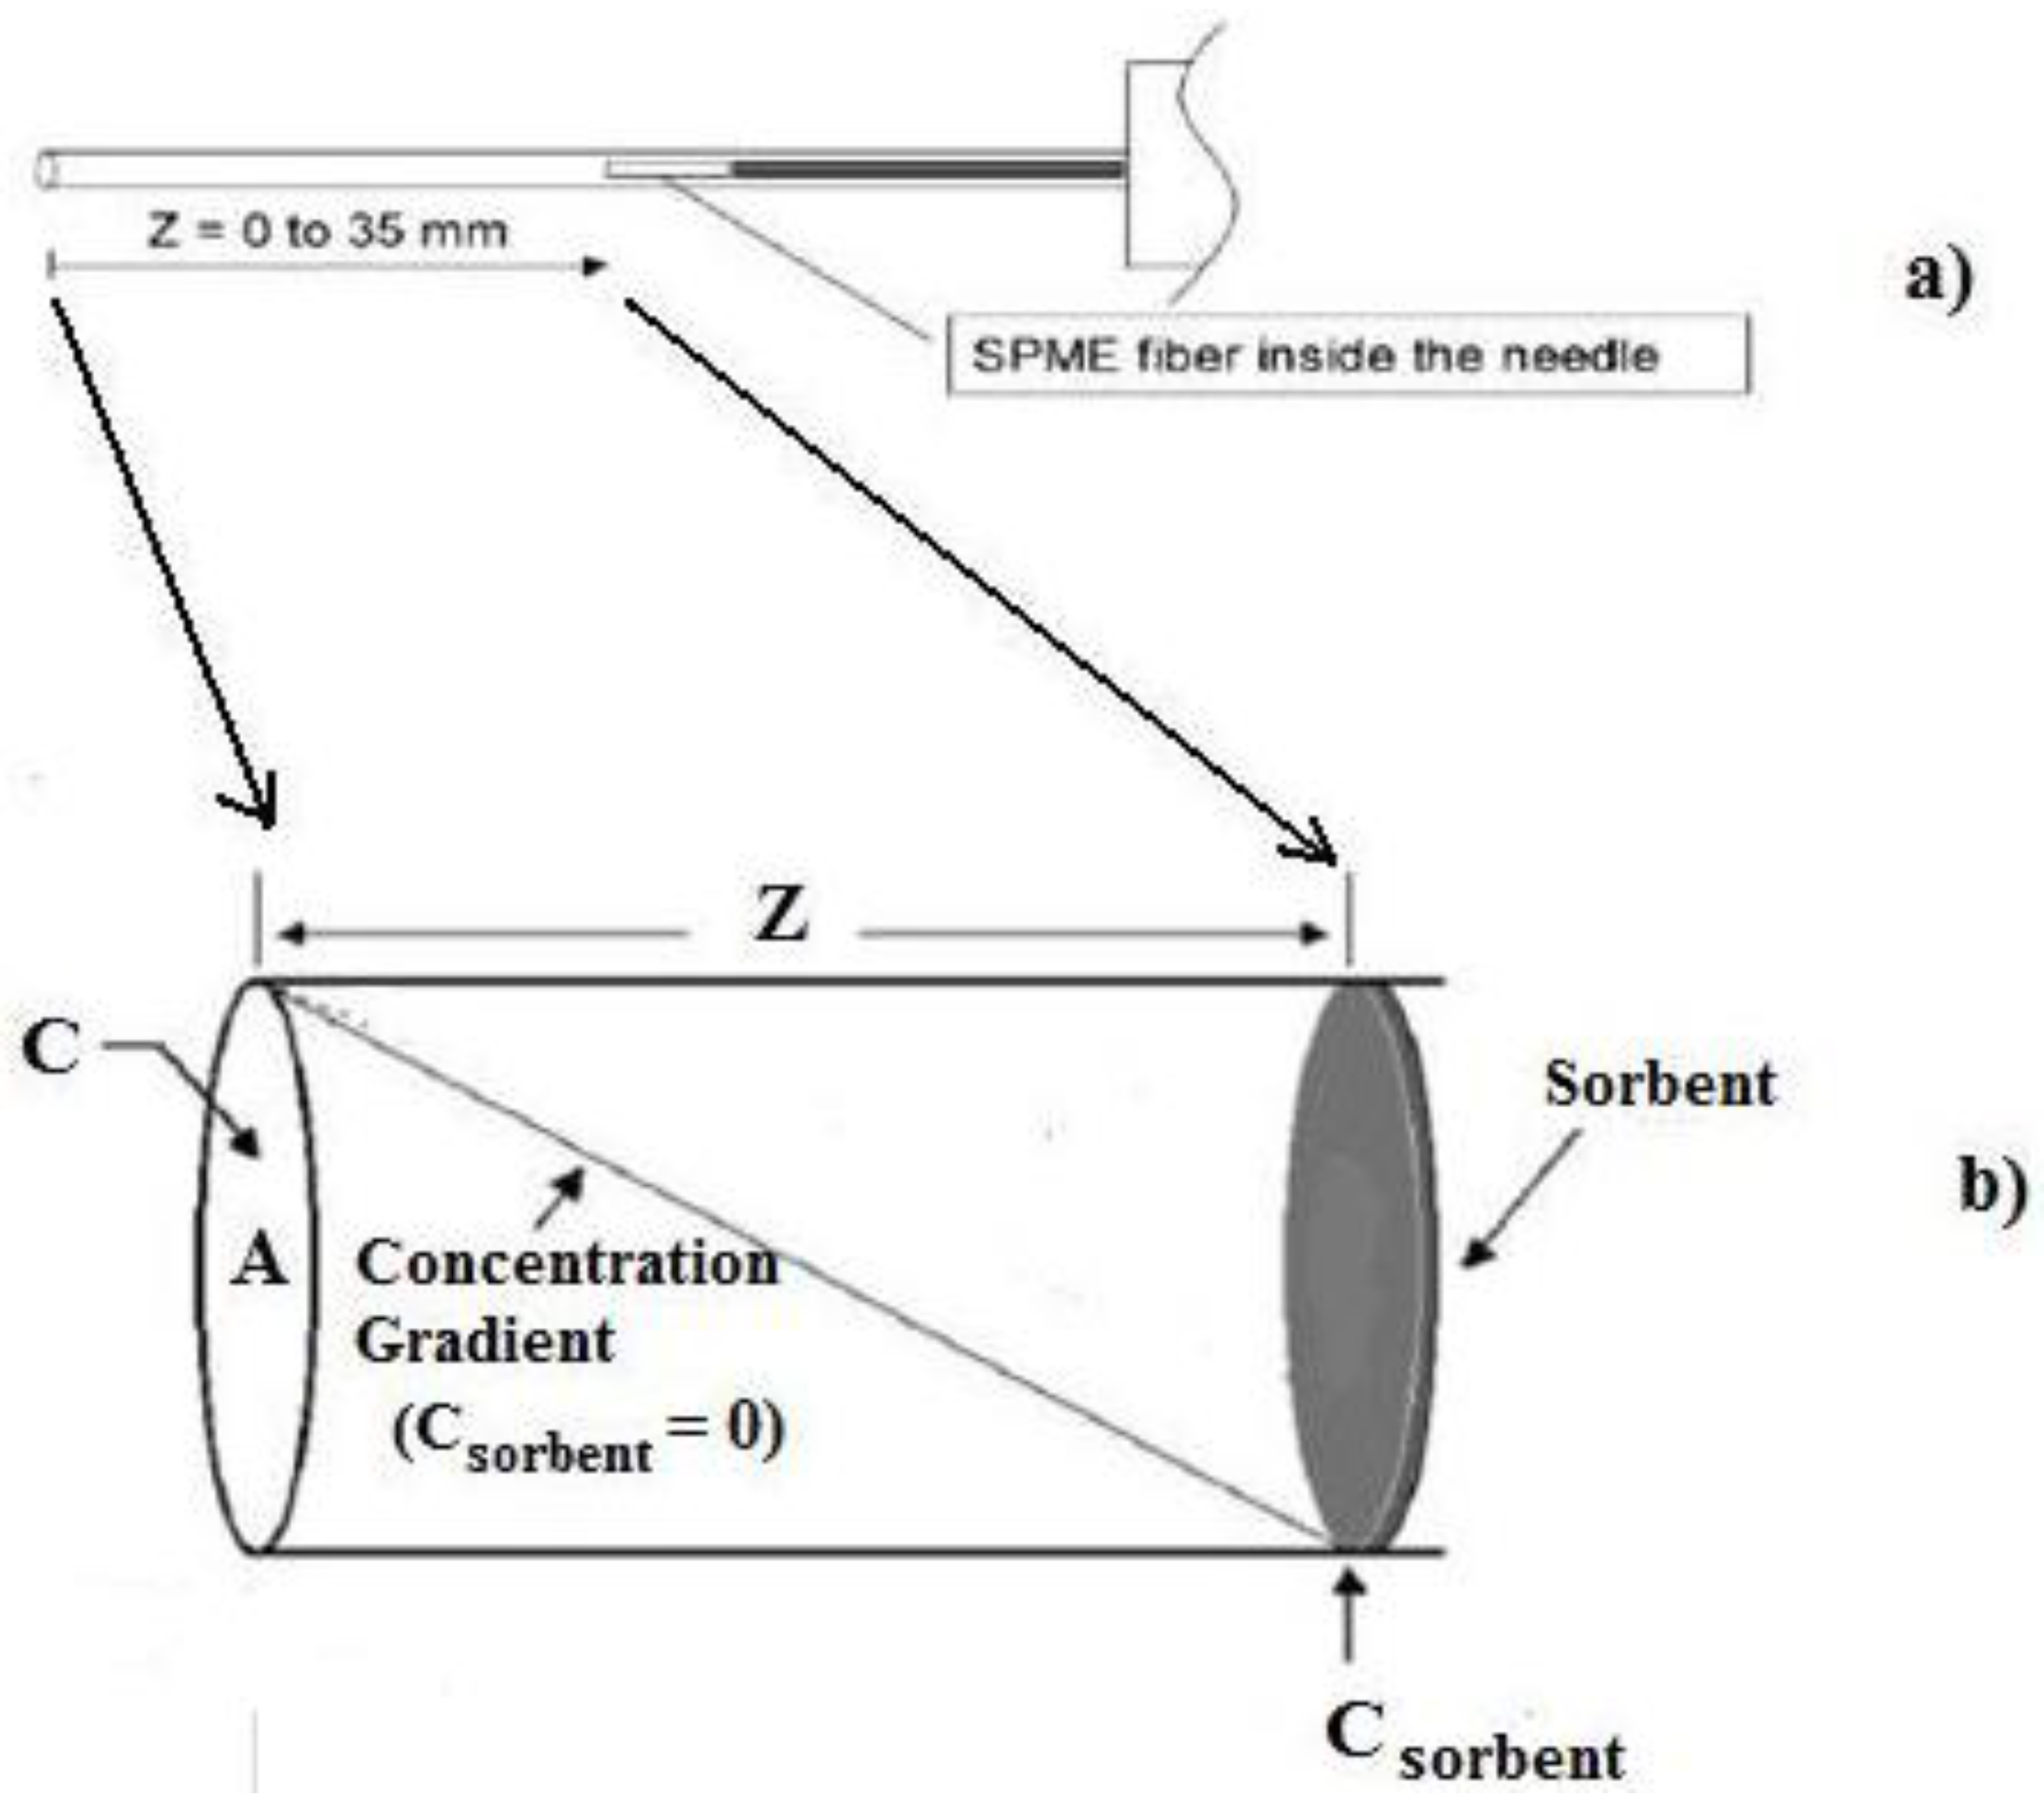
For TWA-SPME sampling, the coated fiber is retracted into the needle casing at a known distance from the end of the sheath during the sampling period. Under such conditions, the SPME device can be used as a TWA diffusive sampler (see
Figure 2) whereby the sampler is allowed to stay in contact with the water [
21,
24]. During the process of diffusion, a linear concentration profile exists across the sampling distance
Z, as shown in
Figure 2b and where the sampling rate of the device,
SR, can be computed using Equation (7) [
24]:
where
D is the diffusion coefficient of the analyte,
A is the needle opening’s surface area, and
Z is the diffusion path length, that is, the distance the fiber is retracted into the needle. The amount of analyte loaded onto the fiber coating,
n, during the sampling time,
t, can be found using Equation (8):
where
C(
t) is a time dependent concentration of the analyte at the needle opening. Using Equation (8), the sampling rate for a particular compound can be experimentally determined by Equation (9), using a known concentration and the SPME fiber retraction distance from the casing end.
Figure 2.
Diffusion volume (z) of a solid phase microextraction (SPME) needle and fiber. (a) Showing possible retraction distance of the fiber within the needle casing; (b) Enlargement of the resulting diffusion volume for Diffusion time weighted average (TWA) analysis.
Figure 2.
Diffusion volume (z) of a solid phase microextraction (SPME) needle and fiber. (a) Showing possible retraction distance of the fiber within the needle casing; (b) Enlargement of the resulting diffusion volume for Diffusion time weighted average (TWA) analysis.
The
SR for a compound can be used to quantify unknown concentrations by simply finding the amount of analyte
n on the fiber over time
t, using Equation (10) [
21]:
A current review [
21] has discussed the utility of TWA and similar techniques and cites analyses of a variety of volatile organics [
19] and polyaromatic hydrocarbons (PAHs) [
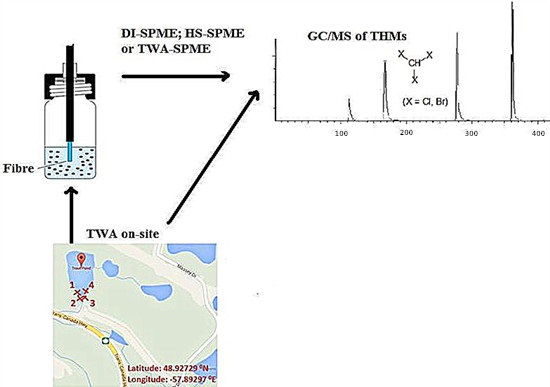
20] from aqueous matrices. This paper explores the sampling, extraction and analysis of THMs from non-disinfected water samples. It compares spot sampling by both direct (DI-) and headspace (HS-) SPME and extraction with subsequent GC/MS analysis, to passive TWA sampling GC/MS methods using similar SPME fibers. Based on calibration standards and real sample analysis, the approaches to the analyses of volatile THM adducts are compared and discussed.
2. Experimental Section
2.1. Materials
The THM reference standards (with purity): bromoform (96%), bromodichloromethane (98%), and dibromochloromethane (98%) were purchased from Sigma-Aldrich (Oakville, ON, Canada) and chloroform (99.9%), 1,2-dibromoethane (99%), and 1,2-dichloroethane (99.5%) were supplied by Fisher Scientific (Nepean, ON, Canada). Ultrapure water, generated by a Barnstead water purifier (Dubuque, IA, USA), was used as the solvent for all standards and also as the solvent for the continuous flow system. Co-solvents like methanol were of Analar grade and used without further purification and obtained from Fisher Scientific, Nepean, ON, Canada. SPME fibers: 7 and 100 µm poly(dimethylsiloxane), (PDMS); 75 and 85 µm Carboxen(CAR)/PDMS; 65 µm PDMS/poly(divinylbenzene) (DVB); 65 µm Carbowax(CW)/DVB; 50 µm DVB/CAR/PDMS were purchased from Supelco, Belefonte, PA, USA and were conditioned under nitrogen as per manufacturer instructions. Fibers were further conditioned at 250 °C for 15 min prior to an analysis. Analytical analysis utilized screw top Teflon-Teflon coated septum-sealed capped amber HS-vials (Canadian Scientific, Peterborough, ON, Canada).
2.2. Sample Descriptions and Sampling Area
Water and TWA sampling were carried out at the two municipal surface water sites for the city of Corner Brook, NL, Canada: Trout Pond (Lat: 48.92567°N; Long: −57.89312°E) and Three Mile Pond (Lat: 48.93987°N; Long: −58.00831°E). The sample sites selected, had been monitored for THMs over a number of years, where values varied between 110 and 160 ppb, and hence THM detection could be expected. Trout Pond samples were taken from left side of the dock extending in the south quadrant of the pond, where there were trees, shrubs, and short grass on the bank. The bottom topography was formed from sand, pebble, and cobble sized material. Three Mile Pond samples were taken from the north-northeast section of the pond in shallow water, where there was a high density of trees and short grass on bank. The bottom topography was silt with an intermediate density of decaying vegetation. All samples were collected at the same depth (1/3 m below water surface) in triplicate and were sampled over a two days period during the fall of the year. Samples were analyzed on site for conductivity, dissolved solids, pH, temperature, and within 12 h of collection for trihalomethanes (THMs). For spot sampling, triplicate real water samples were collected each day over the two days period in the two ponds during the fall of the year. For TWA sampling, triplicate SPME fibers were positioned and left attached on a stand for a two days period that was placed in the pond at the same depth as was used for spot sampling.
2.3. Instrumentation
A Saturn 2000 and/or Saturn Star 3 GC/ion trap MS (Varian, Mississauga, ON, Canada) instruments with identical setups were used for analysis, where both ionization and mass analysis occur in the same chamber. The GCs were equipped with a 1079 split/splitless injector with SPME glass inserts (Varian) and a 5%-diphenyl-95%-dimethylpolysiloxane HP-5MS fused-silica capillary column (Agilent, Palo Alto, CA, USA) with dimensions: 30 m × 0.25 mm ID with a 0.25 µm phase. UHP helium carrier gas was set to a flow of 0.5 mL·min−1. THM standards and SPME fiber extractions were injected into the GC at 190 °C under 10 psi constant pressure and used an experimentally optimized column temperature program: 40 °C, held for 4 min, to 160 °C at a rate of 30 °C·min−1, and held for 4 min, then ramped to 210 °C at a rate of 50 °C·min−1, and held for 1 min, giving a total run time of 10 min. For the mass spectrometer (MS), the electron multiplier was operating at 2000 V and samples were analyzed by electron impact (70 eV) over an acquired mass range of 40–650 m/z. The transfer line, source, and ion trap temperatures were 170 °C, 100 °C and 120 °C, respectively. Quantification of the THMs from real water samples were performed by selected ion monitoring with a 100-ms dwell time, for limit of detection (LOD) and calibration studies. Selected ions used were m/z: bromoform (Mol. Wt. 252.75) 252, 173, 96; bromodichloromethane (Mol. Wt. 163.83); 163, 128, 93, 84; dibromochloromethane (Mol. Wt. 208.29); 208, 172, 128, 93; 1,2-dibromoethane (Mol. Wt. 187.86); 187, 108, 106; chloroform (Mol. Wt. 119.38): 119, 87, 85; and 1,2-dichloroethane (Mol. Wt. 98.96) 98, 63, 61.
2.4. SPME Extractions
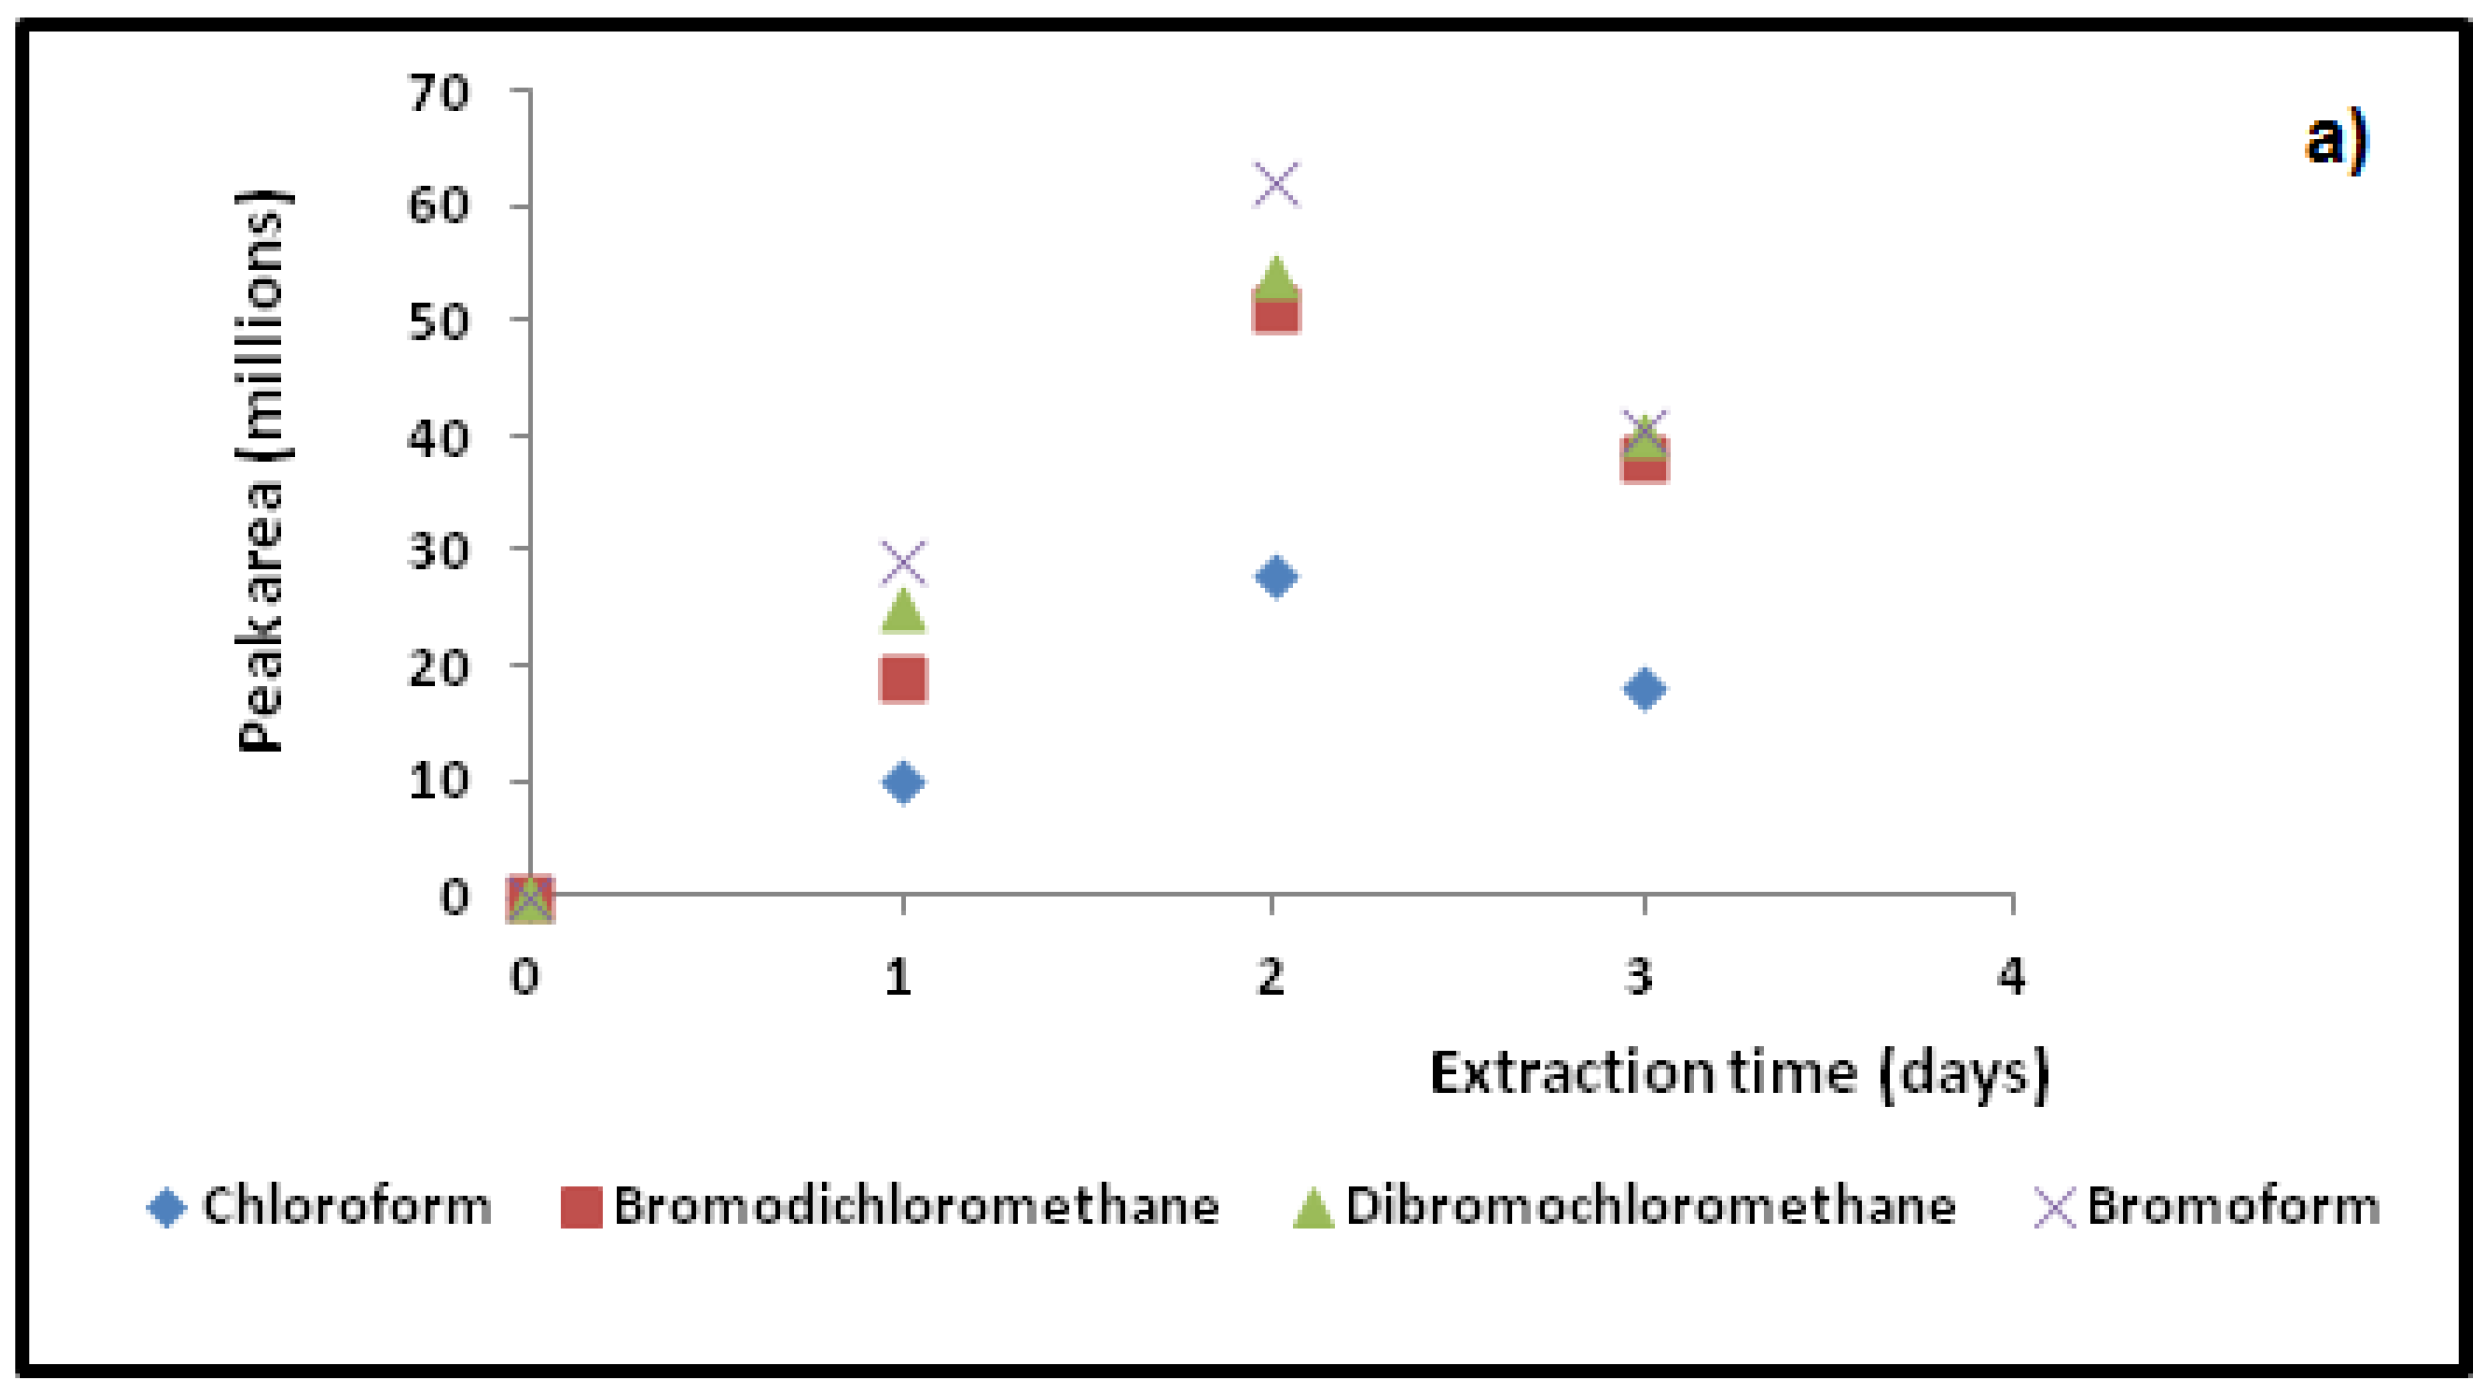
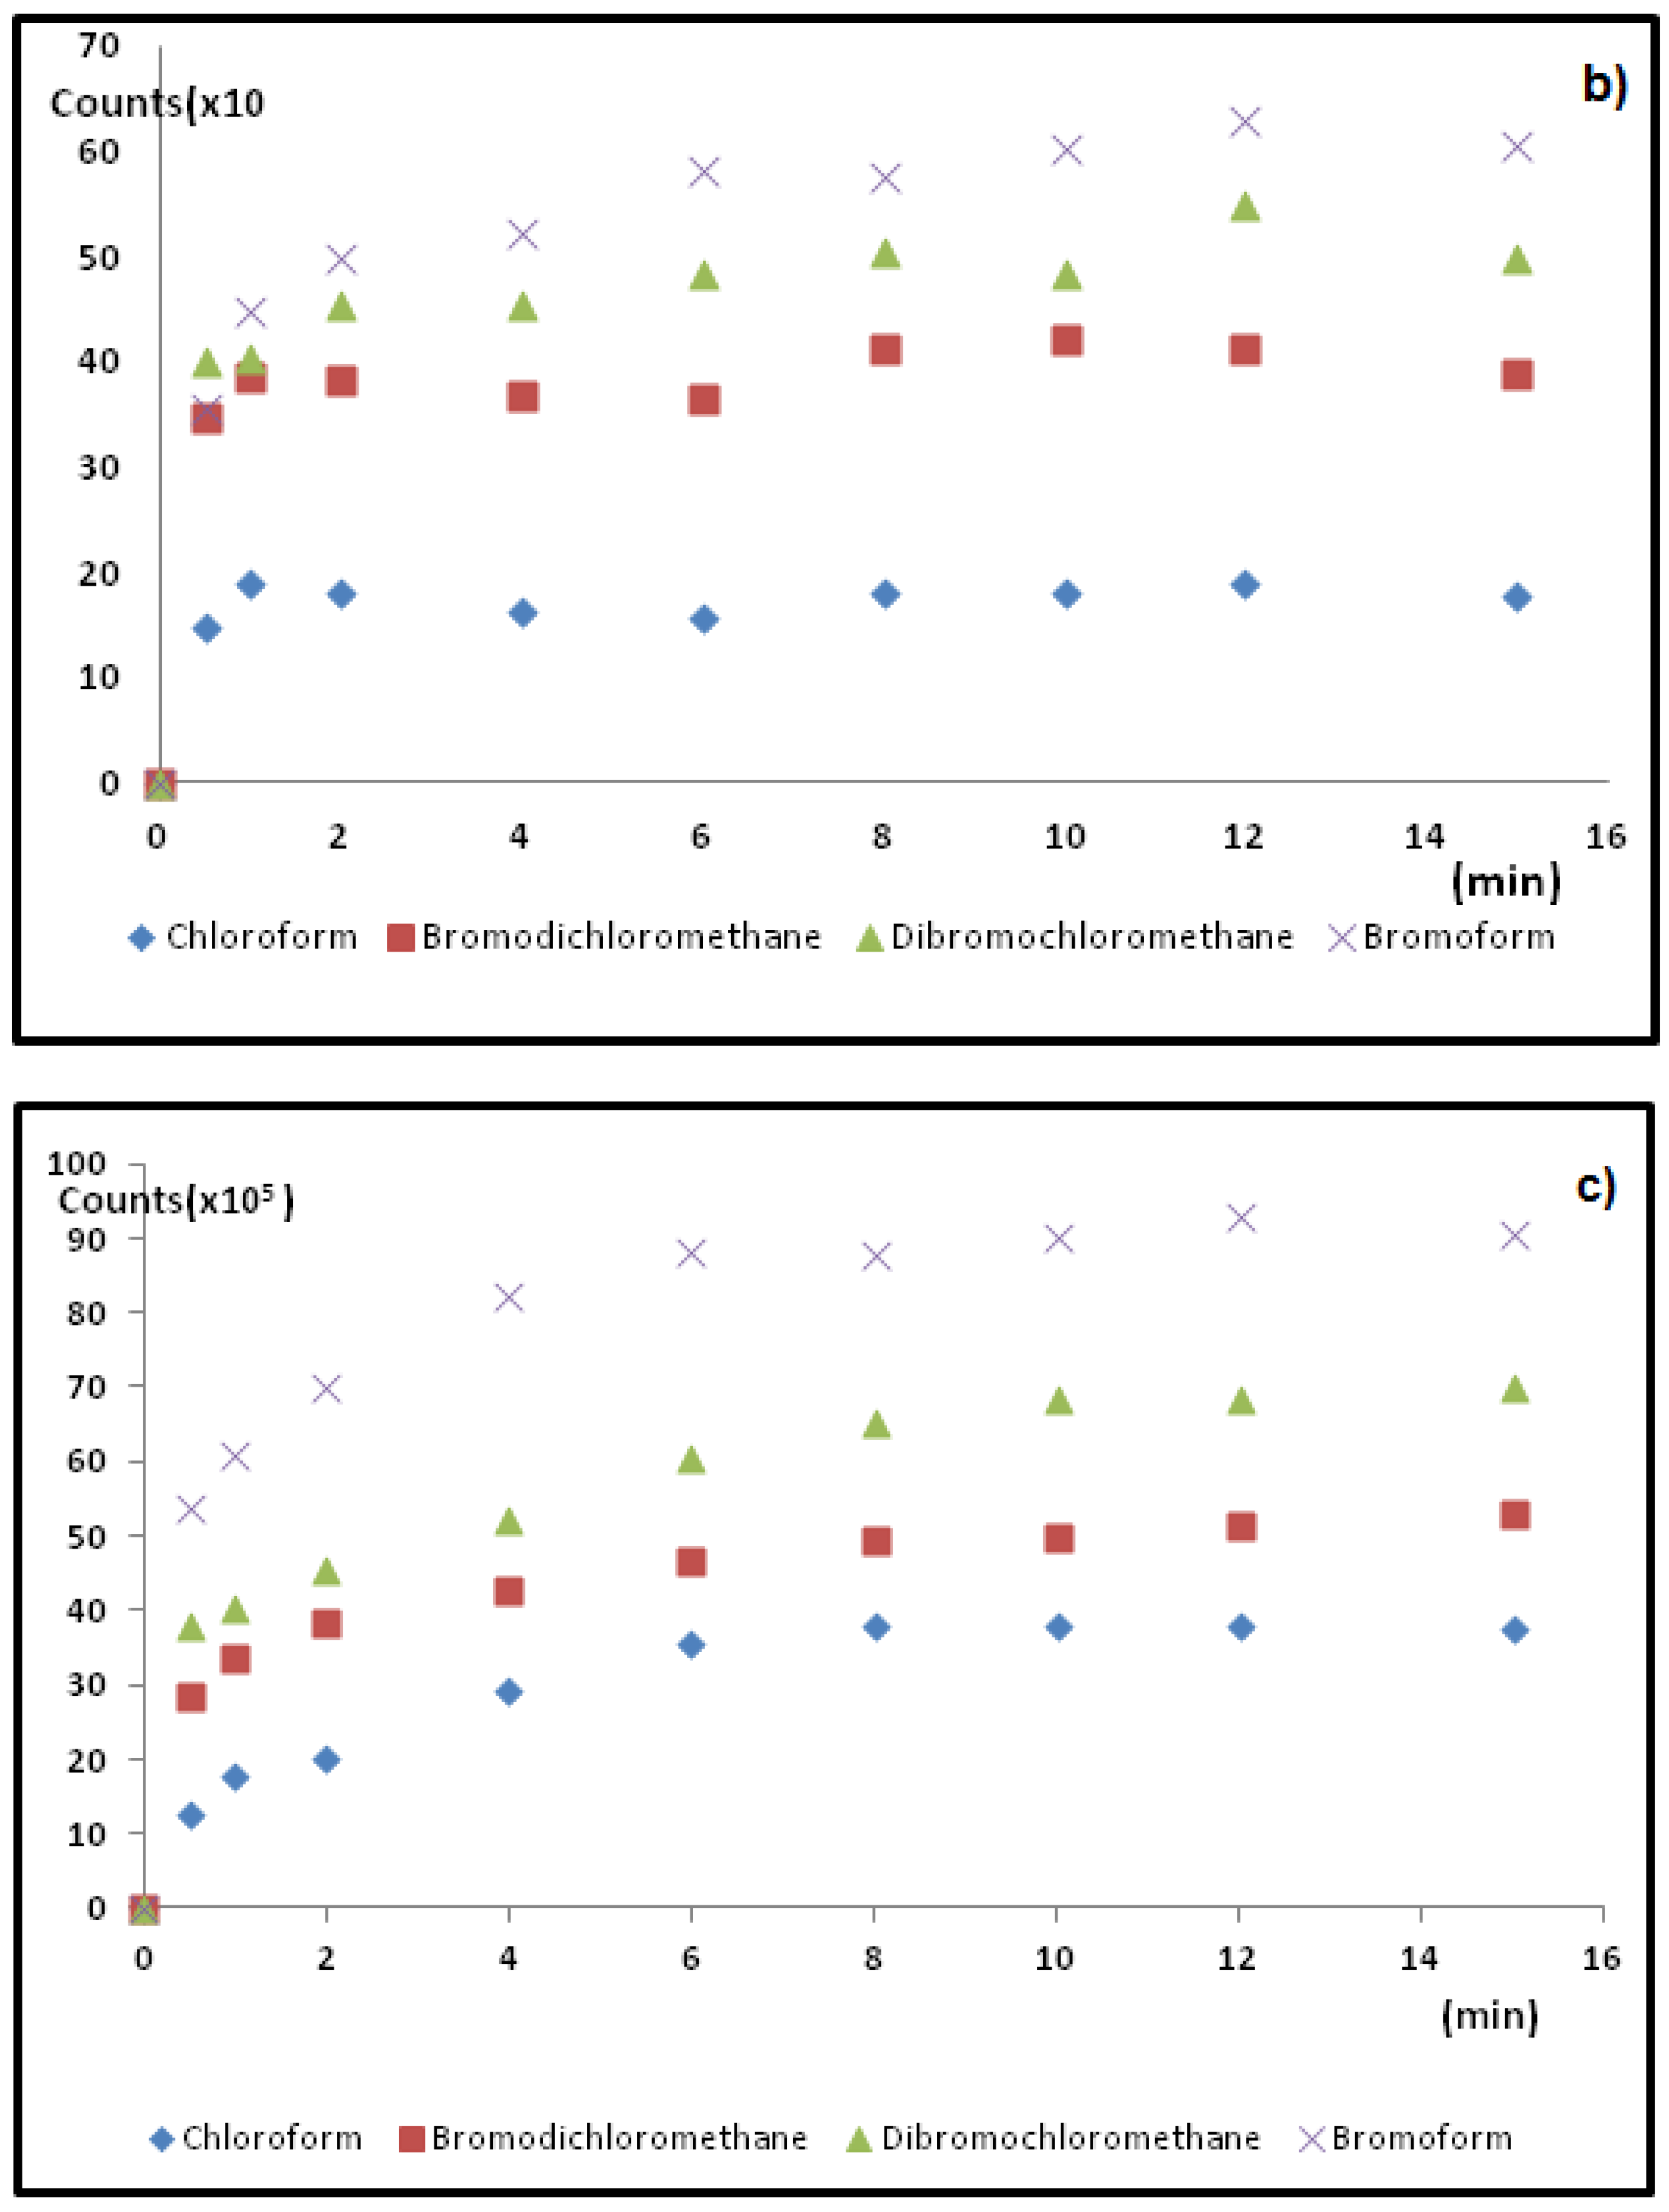
Headspace (HS-SPME) analysis was conducted using seven SPME fibers, in order to assess best THM compound affinities to the different fiber compositions. HS-SPME analysis was conducted using a 40 mL amber glass vial that contained a total volume of 32 mL (of a 2 ppm THM standard and a stir bar) that was sealed with a screw top Teflon-Teflon coated septum cap and which was placed on a stirring mantle. The different fibers were tested toward extraction of target THM standards, under a variety of temperatures (25, 30, 40, 50, 60 and 70 °C), stirring rates (500, 600, 700, 750, 800 and 900 rpm), extraction times of (1, 2, 5, 8, 10, 15, 20, 25, 30, 40 min.) and with and without salt (10% wt./vol. of (NH4)2SO4) to determine optimal conditions. Ascorbic acid was used to re-adjust the pH back to the real sample conditions. Before and after each run, the SPME fiber was conditioned for 2 min at 220 °C. No carry over was noted after such conditioning. The extraction of all THM solutions (standards, spiked THM solutions) for calibration curve to cover the range (0.02, 0.05, 0.1, 0.2, 0.5, 1, 2 and 5 ppm (mg·L−1)) and comparison determinations were performed using the optimized conditions found from the above tests and were subsequently analyzed by optimized GC/MS method. For HS-SPME extractions, the fiber was placed in the sample headspace and for DI-SPME extractions, the fiber was placed directly into the stirred liquid.
2.5. SPME TWA Extractions
A continuous flow system (
Figure 3) was first used to analyze and to optimize THM standard solution conditions for TWA sampling. The system was composed of a mixing compartment, and a series of connecting glassware components with sampling ports positioned to hold SPME fibers. The glassware was connected together using heat shrink tubing. The flow system also had an inlet and an exit port whereby a solvent would run through. The flow was controlled using a Dynamax model SD-200 solvent delivery system (Varian Instruments, Mississauga, ON, Canada) connected to the inlet port, and the flow rate was set to 10.00 ± 0.1 mL·min
−1 at 25 °C ± 1.0 °C. Sample flowed out of the exit port through a loop and back into in the sampling reservoir. Sampling of the flow system was achieved through the use of six sampling ports in the glassware where the six SPME fibers could be inserted and tested simultaneously. The fiber needles had the springs removed in order to enable the fibers to be extended or retracted into the needle casing to specific distances, and held there for the duration of the sampling period. The continuous flow system could be connected to separate reservoirs that contained different mixes of THM standards. Sampling rates of 1, 2, 3, and 5 days, different fiber retracted positions (5, 10, 15, 20, 25 and 30 mm for different diffusion sampling lengths) and where the fiber was fully extended were studied and optimized to give best results for the six THM standards. A 1-ppm (mg·L
−1) concentration was used to assess and optimize conditions. A concentration range of 0.02, 0.05, 0.1, 0.2, 0.5, 1, 2 and 5 ppm of the six THM standards were used to establish the calibration curve for TWA analysis.
Based upon optimized conditions found from the continuous flow system results, TWA sampling of THMs from real water samples was undertaken in two ways: (1) by (triplicate) TWA-SPME sampling of a collected water sample from sealed 40 mL vials using similar optimized HS-SPME conditions but with the optimized TWA sampling time and fiber retraction distance; and (2) by (triplicate) on-site sampling. For (2), each of the SPME fibers was positioned at the optimized retraction distance into their SPME needle casing (see
Figure 2a). Triplicate fibers were then attached to a stand and placed into the pond. In both ponds, the fiber stand was positioned at the same pond point and water depth (1/3 m below water surface) where other water samples (1) were collected. After the optimized extraction time (2 days) the fiber stand was then retrieved and the fibers were taken for subsequent GC/MS analysis under optimized GC/MS conditions.
Figure 3.
A home built continuous flow system used TWA optimization.
Figure 3.
A home built continuous flow system used TWA optimization.
2.6. Zero Sink Test to Determine TWA Fiber Extraction Stability for THMs
To test the fiber ability to retain THM analytes during a TWA analysis, a zero sink test was performed. The SPME fiber was placed at the optimized distance in the needle casing. Then TWA headspace sampling fiber performance was quantified by comparing the GC peak areas obtained by: (1) TWA headspace sampling carried out for 90 min and then analyzed by GC/MS; to (2) TWA headspace sampling carried out for three 30 min intervals of sampling (90 min total) separated by 10 min intervals of TWA headspace sampling of a vial that contained only nitrogen gas, after which the analysis was run. Comparing the peak areas obtained from (1) and (2) results showed minimal loss (<2% peak areas for all six target THMs), suggesting that the THM-fiber extraction was stable. For such cases, the fiber is said to act as a zero sink for THMs compounds.
2.7. Method Validation
In this study, for each of the methods, the optimized parameters to extract THM components were evaluated to assess: calibration linearity, reproducibility and limits of detection and quantification. THM standards were prepared by serial dilution to give a set of aqueous standards for analysis that included concentrations ranging lower and higher of the required analytical calibration range (3 to 800 µg·L
−1). For precision, triplicate analysis on each sample for each method was carried out to estimate component stability on the fiber and reproducibility of the HS-sampling scheme employed. The analysis was repeated randomly over the sampling period and the results were compared, via GC peak areas. Periodically, a spiked standard (10 mg·mL
−1 of 1–2, dibromopropane) was used as an internal calibration marker to assess any bias in runs or methods. No variation (<2%) or loss of any of the 6 THM component peak areas from the fiber were noted. See
Table 1. In addition, for TWA studies, a zero-sink test was performed to check for THM component loss from the fiber after absorption and before injection, though negligible change was found. Results show that acceptable correlation coefficients (
R2: 0.966–0.998) were obtained using the 65 µm PDMS/DVB fiber for particular THM components covering a linear range of over two orders of magnitude. A linear regression method of least squares was used to ascertain linearity. From
Table 2 it is seen that overall the calibration curves achieved for the DI-SPME method gave better
R2 values and slightly lower detection limits than for HS- or TWA- methods. However, for all methods the
R2 obtained using a 10-min (8 min extraction and 2 min desorption) period were satisfactory for quantitation at occurring levels and were similar to those obtained by EPA501.3 method [
15]. The LOD and limit of quantitation (LOQ) were calculated from the S/N, where LOD = 3 × S/N, using a 10 µg/L standards [
16]. The LODs vary for individual THMs and methods but generally fall within a 2.6–5.1 µg·L
−1, which are low enough to detect THMs in natural water samples, (
Table 1). The results obtained for total THMs were similar to Newfoundland and Labrador, Canada provincial data from previous years for the fresh water ponds [
4].
Table 1.
Analysis of Trout and 3 Mile Ponds by Direct (DI)-, headsapace (HS)-, time weighted averaging (TWA)- Vial and Headspace- time weighted averaging (HS-TWA) On-site solid phase microextraction-gas chromatography/ mass spectrometry (SPME-GC/MS) Sampling of THM Standards.
Table 1.
Analysis of Trout and 3 Mile Ponds by Direct (DI)-, headsapace (HS)-, time weighted averaging (TWA)- Vial and Headspace- time weighted averaging (HS-TWA) On-site solid phase microextraction-gas chromatography/ mass spectrometry (SPME-GC/MS) Sampling of THM Standards.
| Detected THMs (µg·L−1) ± 1 | GC Retention Times (min) | DI-, HS- TWA-Vial Sampling a | HS-TWA Vial Sampling b | HS-TWA on-Site Sampling c |
|---|
| Trout Pond | 3 Mile Pond | Trout Pond | 3 Mile Pond | Trout Pond | 3 Mile Pond |
|---|
| Chloroform | 1.88 | 52 | 48 | 60 | 55 | 58 | 52 |
| Bromoform | 6.01 | 26 | 24 | 37 | 33 | 37 | 29 |
| Bromodichloromethane | 2.92 | 19 | 16 | 25 | 19 | 26 | 20 |
| Dibromochloromethane | 4.59 | n.d. | n.d. | n.d. | n.d. | n.d. | n.d. |
| 1,2-dibromoethane | 6.26 | 14 | 10 | 25 | 17 | 25 | 21 |
| 1,2-dichloroethane | 2.21 | n.d. | n.d. | n.d. | n.d. | n.d. | n.d. |
| Water Parameters |
| Total THM std. Detected | 111 | 98 | 147 | 120 | 146 | 122 |
| Temp (°C) ± 0.5 °C | 25 | 25 | 25 | 25 | 9, 10 d | 12, 12 d |
| pH ± 0.1 | 6.4 | 6.7 | 6.4 | 6.7 | 6.4 | 6.7 |
| Conductivity (µS) ± 0.5 | -- e | -- e | 62 | 66 | 62 | 66 |
| Dissolved solids (mg·L−1) ± 1 | -- e | -- e | 29 | 30 | 29 | 30 |
Table 2.
Comparison of Headspace (HS-), Direct (DI-) and Headspace-Time Weighted Averaging (HS-TWA) SPME-GC/MS Sampling for Target THM Standards from Aqueous Samples.
Table 2.
Comparison of Headspace (HS-), Direct (DI-) and Headspace-Time Weighted Averaging (HS-TWA) SPME-GC/MS Sampling for Target THM Standards from Aqueous Samples.
| Compound | LOQ (µg·L−1) | DL (µg·L−1) | Calibration Equation | R2 |
|---|
| HS-SPME Extraction a |
| Chloroform | 12 | 3.6 | y = 20.14x + 2.8 | 0.988 |
| Bromoform | 12 | 3.7 | y = 21.29x + 2.46 | 0.989 |
| Bromodichloromethane | 12 | 3.7 | y = 30.53x + 0.06 | 0.975 |
| Dibromochloromethane | 12 | 3.5 | y = 131x + 1109 | 0.993 |
| 1,2-dibromoethane | 13 | 3.8 | y = 30.54x + 0.4 | 0.998 |
| 1,2-dichloroethane | 13 | 3.9 | y = 20.27x + 0.4 | 0.966 |
| DI-SPME Extraction a |
| Chloroform | 9 | 2.6 | y = 35.9x + 277 | 0.998 |
| Bromoform | 9 | 2.7 | y = 8.9x + 2549 | 0.989 |
| Bromodichloromethane | 9 | 2.7 | y = 19.84x + 3.12 | 0.985 |
| Dibromochloromethane | 8 | 2.5 | y = 17.2x + 3.1 | 0.993 |
| 1,2-dibromoethane | 11 | 3.3 | y = 307.1x + 1132 | 0.998 |
| 1,2-dichloroethane | 12 | 3.6 | y = 13.58x + 4.02 | 0.978 |
| HS-TWA Extraction a |
| Chloroform | 12 | 3.5 | y = 10.97x + 3.62 | 0.989 |
| Bromoform | 12 | 3.5 | y = 11.78x + 3.84 | 0.988 |
| Bromodichloromethane | 11 | 3.2 | y = 11.89x + 3.82 | 0.984 |
| Dibromochloromethane | 12 | 3.4 | y = 11.54x + 4.78 | 0.990 |
| 1,2-dibromoethane | 13 | 3.8 | y = 128x + 593 | 0.997 |
| 1,2-dichloroethane | 12 | 3.7 | y = 10.24x + 4.28 | 0.968 |
| HS-TWA Extraction b |
| Chloroform | 15 | 4.4 | y = 6.63x + 4.82 | 0.988 |
| Bromoform | 15 | 4.6 | y = 4.35x + 4.64 | 0.989 |
| Bromodichloromethane | 16 | 4.7 | y = 5.08x + 4.4 | 0.987 |
| Dibromochloromethane | 16 | 4.8 | y = 7.6x + 2.7 | 0.995 |
| 1,2-dibromoethane | 17 | 5.1 | y = 62.3x + 27848 | 0.996 |
| 1,2-dichloroethane | 16 | 4.8 | y = 14.15x + 4.78 | 0.985 |
4. Conclusions
Three SPME-GC/MS methods (HS-, DI- and HS-TWA-) are compared for the simultaneous analysis of six TMHs from raw aqueous solutions. SPME linking to GC/MS makes the method highly selective toward THM quantitation for water analysis, as demonstrated by the lack of significant signal interferences in both the standards and real sample matrices. Under optimized conditions, which included fiber selection, fiber position, sampling rate, extraction parameters and salt conditions, real samples were analyzed for natural THMs occurring in untreated aqueous waters. Of the seven SPME fibers tested, both the 65 µm DVB/PDMS and the 50-µm CAR/PDMS/DVB fiber performed best towards the six targeted THMs analytes. For our work, the 65 µm PDMS/DVB was selected because it was available and equally able to efficiently target all compounds over the range of molecular weights and volatilities required for this study.
Detection enhancement by addition of salt to the sampling matrix vial cannot be used in on-site TWA sampling conditions. The utility of salt modification in quantification studies on natural waters may very well depend upon the natural conditions. In low conductivity conditions, large deviations can occur if calibration solutions are not corrected for by matrix matching the ionic strength.
The SPME-GC/MS methods allow for simple, fast and simultaneous detection of THM compounds at low ppb levels and as such, may provide insight into the chemistry and the occurrence of halo-analytes in untreated waters. This is important as THMs have potential toxicity and impact to human health. SPME-TWA sampling is easy to perform and to analyze and with its ability to flatten episodic changes in dynamic aqueous systems, TWA methods may give better natural THM estimates and better representative data for determining natural background THM levels in surveys.
The utility of SPME techniques are most profound when the method is automated. This can be easily achieved with current samplers when water samples are collected and put into standard sampling vials. Under these circumstances, total optimization of SPME sampling, extraction and GC/MS injection parameters and analysis can be controlled under current software. However, in the case of on-site analysis, once the fibers have been retrieved, the development of an automated TWA SPME holder carousel would be useful to deliver samples for unattended automated analysis run. Further work to investigate such methodology is ongoing.


