Techno-Economic Analysis of CO2 Capture Technologies in Offshore Natural Gas Field: Implications to Carbon Capture and Storage in Malaysia

 and
and
Abstract
:1. Introduction
2. Materials and Method
2.1. Gas Field Model
2.1.1. CO2 Capture Technologies
- Polymeric membrane
- Chemical absorption amine (MEA)
- Physical absorption solvent (Selexol) (UOP LLC, IL, USA)
- Cryogenic distillation
2.1.2. CO2 Storage and Abandonment
- rock formations have adequate millimeter-sized voids or pores; this is to ensure available capacity to store the CO2;
- pores in the rock are efficiently linked, which is a feature called permeability for injectivity; this is to receive the amount of CO2 at the rate it is injected, allowing the CO2 to move and spread out within the underground storage formation;
- extensive cap rock or barrier at the top of the storage formation; this is to contain the CO2 permanently;
- stable geological environment; this is to avoid any potential geological effect that could compromise the storage site integrity.
2.1.3. Carbon Capture and Storage (CCS) at Tangga Barat
2.2. Revenue Model
2.3. Cost Model
2.4. Cost Evaluation Metrics
2.4.1. Net Present Value (NPV)
2.4.2. Internal Rate of Return (IRR)
2.4.3. Payback Period (PBP)
2.4.4. Sensitivity Analysis (SA)
3. Techno-Economic Model Results and Discussion
3.1. Sensitivity Analysis (SA) Results and Discussion
- Gas price provides input to the project revenue and has long-term uncertainty as it is highly dictated by supply and demand, global market fluctuation, and political–economic decisions;
- Tax is dependent on the country tax requirement as well as its government political decision;
- Discount rate directly affects the present value of future costs and its profits;
- Initial capital cost is highly reliant on the capital outflow investment ability by the oil and gas producers and investors.
- CO2 capture technology cost is highly reliant on the technology provider profit margin and its maturity status;
3.2. Limitation of This Techno-Economic Analysis
4. Conclusions
Author Contributions
Funding
Acknowledgments
Conflicts of Interest
References
- Kostowski, W.J.; Usón, S. Thermoeconomic assessment of a natural gas expansion system integrated with a co-generation unit. Appl. Energy 2013, 101, 58–66. [Google Scholar] [CrossRef]
- Silitonga, A.S.; Masjuki, H.H.; Ong, H.C.; Sebayang, A.H.; Dharma, S.; Kusumo, F.; Siswantoro, J.; Milano, J.; Daud, K.; Mahlia, T.M.I.; et al. Evaluation of the engine performance and exhaust emissions of biodiesel-bioethanol-diesel blends using kernel-based extreme learning machine. Energy 2018, 159, 1075–1087. [Google Scholar] [CrossRef]
- Ong, H.C.; Masjuki, H.H.; Mahlia, T.M.I.; Silitonga, A.S.; Chong, W.T.; Yusaf, T. Engine performance and emissions using Jatropha curcas, Ceiba pentandra and Calophyllum inophyllum biodiesel in a CI diesel engine. Energy 2014, 69, 427–445. [Google Scholar] [CrossRef]
- Silitonga, A.; Shamsuddin, A.; Mahlia, T.; Milano, J.; Kusumo, F.; Siswantoro, J.; Dharma, S.; Sebayang, A.; Masjuki, H.; Ong, H.C. Biodiesel synthesis from Ceiba pentandra oil by microwave irradiation-assisted transesterification: ELM modeling and optimization. Renew. Energy 2020, 146, 1278–1291. [Google Scholar] [CrossRef]
- Ong, H.C.; Milano, J.; Silitonga, A.S.; Hassan, M.H.; Shamsuddin, A.H.; Wang, C.T.; Mahlia, T.M.I.; Siswantoro, J.; Kusumo, F.; Sutrisno, J. Biodiesel production from Calophyllum inophyllum-Ceiba pentandra oil mixture: Optimization and characterization. J. Clean. Prod. 2019, 219, 183–198. [Google Scholar] [CrossRef]
- BP. BP Statistical Review of World Energy; BP: London, UK, 2018. [Google Scholar]
- Calabrese, J. Positioning Malaysia within the Global Energy Landscape. Available online: https://www.mei.edu/publications/positioning-malaysia-within-global-energy-landscape#_ftn28 (accessed on 8 July 2019).
- Rahman, F. Development of innovative membrane for offshore high CO2 separation. In Proceedings of the World gas conference 2012, Kuala Lumpur, Malaysia, 4–8 June 2012. [Google Scholar]
- Harun, N.D.A.R. Technical challenges and solutions on natural gas development in Malaysia. In Proceedings of the Petroleum Policy and Management (PPM) Project 4th Workshop of the China, Beijing, China, 30 May–3 June 2006. [Google Scholar]
- Oh, T.H. Carbon capture and storage potential in coal-fired plant in Malaysia—A review. Renew. Sustain. Energy Rev. 2010, 14, 2697–2709. [Google Scholar] [CrossRef]
- Bernama. Malaysia re-pledges to achieve 45 per cent CO2 emission by 2030. New Straits Times, 22 April 2016. [Google Scholar]
- Silitonga, A.S.; Masjuki, H.H.; Mahlia, T.M.I.; Ong, H.C.; Chong, W.T. Experimental study on performance and exhaust emissions of a diesel engine fuelled with Ceiba pentandra biodiesel blends. Energy Convers. Manag. 2013, 76, 828–836. [Google Scholar] [CrossRef]
- Lokman, T. PM: Malaysia on Course to Reduce Carbon Emissions by 40 Pct by 2020. Available online: https://www.nst.com.my/news/nation/2017/12/310231/pm-malaysia-course-reduce-carbon-emissions-40-pct-2020 (accessed on 5 December 2019).
- Energy Efficiency and Conservation Bill to be tabled end of this year, says minister. Malaymail, 4 July 2019.
- International Energy Agency. KETTHA/IEA CCS Roundtable; International Energy Agency: Paris, France, March 2011. [Google Scholar]
- PETRONAS. PETRONAS Sustainability Report 2017; PETRONAS: Kuala Lumpur, Malaysia, 2017; p. 82. Available online: https://www.petronas.com/ws/sites/default/files/2018-07/sustainability-report-2017.pdf (accessed on 17 October 2019).
- IPCC. Climate Change 2014: Synthesis Report. Contribution of Working Groups I, II and III to the Fifth Assessment Report of Intergovernmental Panel on Climate Change; IPCC: Geneva, Switzerland, 2014. [Google Scholar]
- Nations, U. Summary of the Kyoto Protocol. Available online: http://bigpicture.unfccc.int/#content-the-paris-agreemen (accessed on 17 October 2019).
- Hulme, M. 1.5 degrees C and climate research after the Paris Agreement. Nat. Clim. Chang. 2016, 6, 222–224. [Google Scholar] [CrossRef] [Green Version]
- Rogelj, J.; den Elzen, M.; Hohne, N.; Fransen, T.; Fekete, H.; Winkler, H.; Chaeffer, R.S.; Ha, F.; Riahi, K.; Meinshausen, M. Paris Agreement climate proposals need a boost to keep warming well below 2 degrees C. Nature 2016, 534, 631–639. [Google Scholar] [CrossRef] [Green Version]
- United Nations Economic Commission for Europe. The Role of Fossil Fuels in Delivering a Sustainable Energy Future. Available online: https://energy.gov/sites/prod/files/2016/09/f33/DOE%20-%20Carbon%20Capture%20Utilization%20and%20Storage_2016-09-07.pdf (accessed on 17 October 2019).
- Rubin, E.S.; Davison, J.E.; Herzog, H.J. The cost of CO2 capture and storage. Int. J. Greenh. Gas Control 2015, 40, 378–400. [Google Scholar] [CrossRef]
- Durmaz, T. The economics of CCS: Why have CCS technologies not had an international breakthrough? Renew. Sustain. Energy Rev. 2018, 95, 328–340. [Google Scholar] [CrossRef]
- Budinis, S.; Krevor, S.; Dowell, N.M.; Brandon, N.; Hawkes, A. An assessment of CCS costs, barriers and potential. Energy Strategy Rev. 2018, 22, 61–81. [Google Scholar] [CrossRef]
- Blomen, E.; Hendriks, C.; Neele, F. Capture technologies: Improvements and promising developments. Energy Procedia 2009, 1, 1505–1512. [Google Scholar] [CrossRef] [Green Version]
- Mondal, M.K.; Balsora, H.K.; Varshney, P. Progress and trends in CO2 capture/separation technologies: A review. Energy 2012, 46, 431–441. [Google Scholar] [CrossRef]
- Yang, H.; Xu, Z.; Fan, M.; Gupta, R.; Slimane, R.B.; Bland, A.E.; Wright, I. Progress in carbon dioxide separation and capture: A review. J. Environ. Sci. 2008, 20, 14–27. [Google Scholar] [CrossRef]
- Rubin, E.; Booras, G.; Davison, J.; Eksrom, C.; Matuszewski, M.; McCoy, S.; Short, C. Toward a Common Method for Cost-Estimation for CO2 Capture and Storage at Foosil Fuelower Plant; Global CCS Institute: Melbourne, Australia, 2013. [Google Scholar]
- Allinson, G.; Neal, P.; Ho, M.; Wiley, D.; McKee, G. CCS Economics Methodology and Assumptions; RPT06-0080; School of Petroleum Engineering, The University of New South Wales: Sydney, Australia, 2006. [Google Scholar]
- Malaysian CCS Legal and Regulatory Workshop; Global CCS Institute: Melbourne, Australia, 2013.
- Lai, N.Y.G.; Yap, E.H.; Lee, C.W. Viability of CCS: A broad-based assessment for Malaysia. Renew. Sustain. Energy Rev. 2011, 15, 3608–3616. [Google Scholar] [CrossRef]
- Teh, Y.H.; Theseira, K.; Abdul Karim, A.H.; Hashim, N.S.; Yakob, A.R.; Musa, A.S.; Borhan, N.A.; Muhamad, S.; Sykahar, M.W. Preparing a Gas Field Development Plan: Tangga Barat Cluster Gas Project. In Proceedings of the International Petroleum Technology Conference, Kuala Lumpur, Malaysia, 1 January 2008; p. 10. [Google Scholar]
- Muhamad, S.; Teh, Y.H.; Hassan, N.H.; Sabri, H.A.R.; Arif, I.A.M.; A. Karim, A.H. Acid Gas Removal System for Tangga Barat Cluster Gas Development—Case Study. In Proceedings of the SPE Asia Pacific Oil and Gas Conference and Exhibition, Perth, Australia, 1 January 2008; p. 24. [Google Scholar]
- APEC Energy Working Group. Assessment of the Capture and Storage Potential of CO2 Co-Produced with Natural Gas in South-East Asia; Asia-Pacific Economic Cooperation: Western Australia, Australia, 2010. [Google Scholar]
- Hong Teh, Y.; Theseira, K.; Karim, A.; Shima Hashim, N.; Razak Yakob, A.; Syrhan Musa, A.; Aisyah, N.; Muhamad, S.; Wakif Sykahar, M. Preparing a Gas Field Development Plan: Tangga Barat Cluster Gas Project. In Proceedings of the International Petroleum Technology Conference, Kuala Lumpur, Malaysia, 3–5 December 2008. [Google Scholar] [CrossRef]
- Siagian, U.W.R.; Raksajati, A.; Himma, N.F.; Khoiruddin, K.; Wenten, I.G. Membrane-based carbon capture technologies: Membrane gas separation vs. membrane contactor. J. Nat. Gas Sci. Eng. 2019, 67, 172–195. [Google Scholar] [CrossRef]
- Hashemifard, S.A.; Ahmadi, H.; Ismail, A.F.; Moarefian, A.; Abdullah, M.S. The effect of heat treatment on hollow fiber membrane contactor for CO2 stripping. Sep. Purif. Technol. 2019, 223, 186–195. [Google Scholar] [CrossRef]
- Olajire, A.A. CO2 capture and separation technologies for end-of-pipe applications—A review. Energy 2010, 35, 2610–2628. [Google Scholar] [CrossRef]
- Zhang, Y.; Sunarso, J.; Liu, S.; Wang, R. Current status and development of membranes for CO2/CH4 separation: A review. Int. J. Greenh. Gas Control 2013, 12, 84–107. [Google Scholar] [CrossRef]
- Spigarelli, B.P.; Kawatra, S.K. Opportunities and challenges in carbon dioxide capture. J. CO2 Util. 2013, 1, 69–87. [Google Scholar] [CrossRef]
- Ağralı, S.; Üçtuğ, F.G.; Türkmen, B.A. An optimization model for carbon capture & storage/utilization vs. carbon trading: A case study of fossil-fired power plants in Turkey. J. Environ. Manag. 2018, 215, 305–315. [Google Scholar] [CrossRef]
- Figueroa, J.D.; Fout, T.; Plasynski, S.; McIlvried, H.; Srivastava, R.D. Advances in CO2 capture technology—The U.S. Department of Energy’s Carbon Sequestration Program. Int. J. Greenh. Gas Control 2008, 2, 9–20. [Google Scholar] [CrossRef]
- Demirel, Y.; Matzen, M.; Winters, C.; Gao, X. Capturing and using CO2 as feedstock with chemical looping and hydrothermal technologies. Int. J. Energy Res. 2015, 39, 1011–1047. [Google Scholar] [CrossRef]
- Koytsoumpa, E.I.; Bergins, C.; Kakaras, E. The CO2 economy: Review of CO2 capture and reuse technologies. J. Supercrit. Fluids 2017. [Google Scholar] [CrossRef]
- Rubin, E.S.; Mantripragada, H.; Marks, A.; Versteeg, P.; Kitchin, J. The outlook for improved carbon capture technology. Prog. Energy Combust. Sci. 2012, 38, 630–671. [Google Scholar] [CrossRef]
- Leung, D.Y.C.; Caramanna, G.; Maroto-Valer, M.M. An overview of current status of carbon dioxide capture and storage technologies. Renew. Sustain. Energy Rev. 2014, 39, 426–443. [Google Scholar] [CrossRef] [Green Version]
- Stangeland, A. A model for the CO2 capture potential. Int. J. Greenh. Gas Control 2007, 1, 418–429. [Google Scholar] [CrossRef]
- Aminu, M.D.; Nabavi, S.A.; Rochelle, C.A.; Manovic, V. A review of developments in carbon dioxide storage. Appl. Energy 2017, 208, 1389–1419. [Google Scholar] [CrossRef] [Green Version]
- Bachu, S. Review of CO2 storage efficiency in deep saline aquifers. Int. J. Greenh. Gas Control 2015, 40, 188–202. [Google Scholar] [CrossRef]
- Annual Energy Outlook 2019—With Projections to 2050; US Energy Information Administration: Washington, DC, USA, 2019.
- NEORI. Carbon Dioxide Enhanced Oil Recovery: A Critical Domestic Energy, Economic, and Environmental Opportunity. 2012. Available online: https://www.ourenergypolicy.org/ (accessed on 17 October 2019).
- Rubin, E.S.; Short, C.; Booras, G.; Davison, J.; Ekstrom, C.; Matuszewski, M.; McCoy, S. A proposed methodology for CO2 capture and storage cost estimates. Int. J. Greenh. Gas Control 2013, 17, 488–503. [Google Scholar] [CrossRef]
- Klemeš, J.; Bulatov, I.; Cockerill, T. Techno-economic modelling and cost functions of CO2 capture processes. Comput. Chem. Eng. 2007, 31, 445–455. [Google Scholar] [CrossRef]
- Cardoso, J.; Silva, V.; Eusébio, D. Techno-economic analysis of a biomass gasification power plant dealing with forestry residues blends for electricity production in Portugal. J. Clean. Prod. 2019, 212, 741–753. [Google Scholar] [CrossRef]
- Zhu, Y.; Zhai, R.; Yang, Y.; Reyes Belmonte, M. Techno-Economic Analysis of Solar Tower Aided Coal-Fired Power Generation System. Energies 2017, 10, 1392. [Google Scholar] [CrossRef]
- Malaysia Policy Rate. Available online: https://www.ceicdata.com/en/indicator/malaysia/policy-rate (accessed on 17 November 2019).
- Irlam, L. The Costs of CCS and Other Low-Carbon Technologies in the United States- 2015 Update; Global CCS Institute: Melbourne, Australia, 2015. [Google Scholar]
- Natural Gas Price. Available online: https://oilprice.com/Energy/Natural-Gas (accessed on 10 March 2019).
- Price of CO2. Available online: https://www.iberdrola.com/about-us/utility-of-the-future/regulation-our-vision/price-co2 (accessed on 1 February 2019).
- Khorshidi, Z.; Ho, M.T.; Wiley, D.E. Techno-Economic Study of Biomass Co-Firing with and without CO2 Capture in an Australian Black Coal-Fired Power Plant. Energy Procedia 2013, 37, 6035–6042. [Google Scholar] [CrossRef] [Green Version]
- Pamela Tomski, C.H. Feasibility of Accelerating the Deployment of Carbon Capture, Utilization and Storage in Developing APEC Economies; Asia-Pacific Economic Cooperation: Singapore, 2014; p. 124. [Google Scholar]
- Rubin, E.S. Methods and Measures for CCS Cost; Carnegie Mellon University: Paris, France, 2011. [Google Scholar]


| CO2 Capture Technology | Advantages | Disadvantages |
|---|---|---|
| Membrane |
| |
| Chemical absorption using amine (MEA) |
|
|
| Physical absorption solvent (Selexol) |
|
|
| Cryogenic distillation |
|
|
| Parameter | Input/Definition |
|---|---|
| Gas produced (Million British Thermal Unit (MMBtu)) | Incremental or cumulative natural gas production volume simulated for reservoir performance estimation |
| Gas price (USD) | Average market price of natural gas |
| CO2 produced (tonne) | Incremental or cumulative CO2 production volume simulated for reservoir performance estimation |
| CO2 price (USD) | Average market price of CO2 |
| Gross revenue (USD) | Revenue from natural gas recovered and cost and sold at specified gas price |
| Royalty (%) | 10% of gross revenue |
| Tax (%) | 38% of (revenue- royalty - maintenance cost- abandonment cost - capital cost depreciation) |
| Net revenue (USD) | Revenue after deduction of royalty and tax (Gross revenue ($) − Royalty ($) + Tax ($) |
| Cost Model Parameter | Input/Definition | Study Referenced |
|---|---|---|
| Capital cost | Estimated unit cost for Tangga Barat | Asia-Pacific Economic Cooperation (APEC) and Asia Cooperative Research Centre for Greenhouse Gas Technologies (CO2CRC) [34] |
| CO2 capture cost | Mean percentage increase in capital cost (over reference plant) | Rubin et al. [22] |
| Cost data | Muhamad et al. [33] | |
| Operation and Maintenance (O&M) costs | 2.5% from plant cost | Klemes et al. [53] |
| Abandonment cost | Estimated unit cost for Tangga Barat | APEC and CO2CRC [34] |
| Input Data | Data | Remarks |
|---|---|---|
| Year Enacted | 2020 | |
| Project lifetime (N, year) | 15 | from Reference [34] |
| Interest rate (%) | 3 | from Reference [56] |
| Discount rate (R, %) | 8 | from Reference [57] |
| Plant capacity (MMscf/d) | 440 | from Reference [32] |
| Average gas sales (MMscf/d) | 220 | from Reference [34] |
| Gas price ($/MMBtu) | 2.8 | from Reference [58] |
| CO2 price ($/tonne) | 23 | from Reference [59,60] |
| Volume of CO2 (tonne/d) | 1646 | equivalent to (81 MMScf/d) from Reference [34] |
| Capital cost USD Million | 427.9 | estimate basis constant year 2020 with reference location Malaysia, modified from Reference [34] |
| CO2 capture technologies cost | ||
| (USD Million): | ||
| 212 | modified from Reference [33] |
| 410.79 | 96% increase in capital cost [22] |
| 162.61 | 38% increase in capital cost [22] |
| 289.39 | 91% increase in capital cost [22] |
| Tax (%) | 38 | from Reference [61] |
| Operation and maintenance cost (%) | 2.5 | from Reference [53] |
| Abandonment cost (USD Million) | 50 | from Reference [34] |
| Parameter | Polymeric Membrane | Chemical Absorption (Amine) | Physical Absorption (Selexol) | Cryogenic Distillation |
|---|---|---|---|---|
| Capital cost (USD Million) | 639.90 | 838.69 | 590.51 | 817.29 |
| O&M cost including abandonment cost (USD Million) | 289.96 | 364.51 | 271.44 | 356.49 |
| Net revenue (USD Million) | 1923.06 | 1753.59 | 1965.17 | 1771.83 |
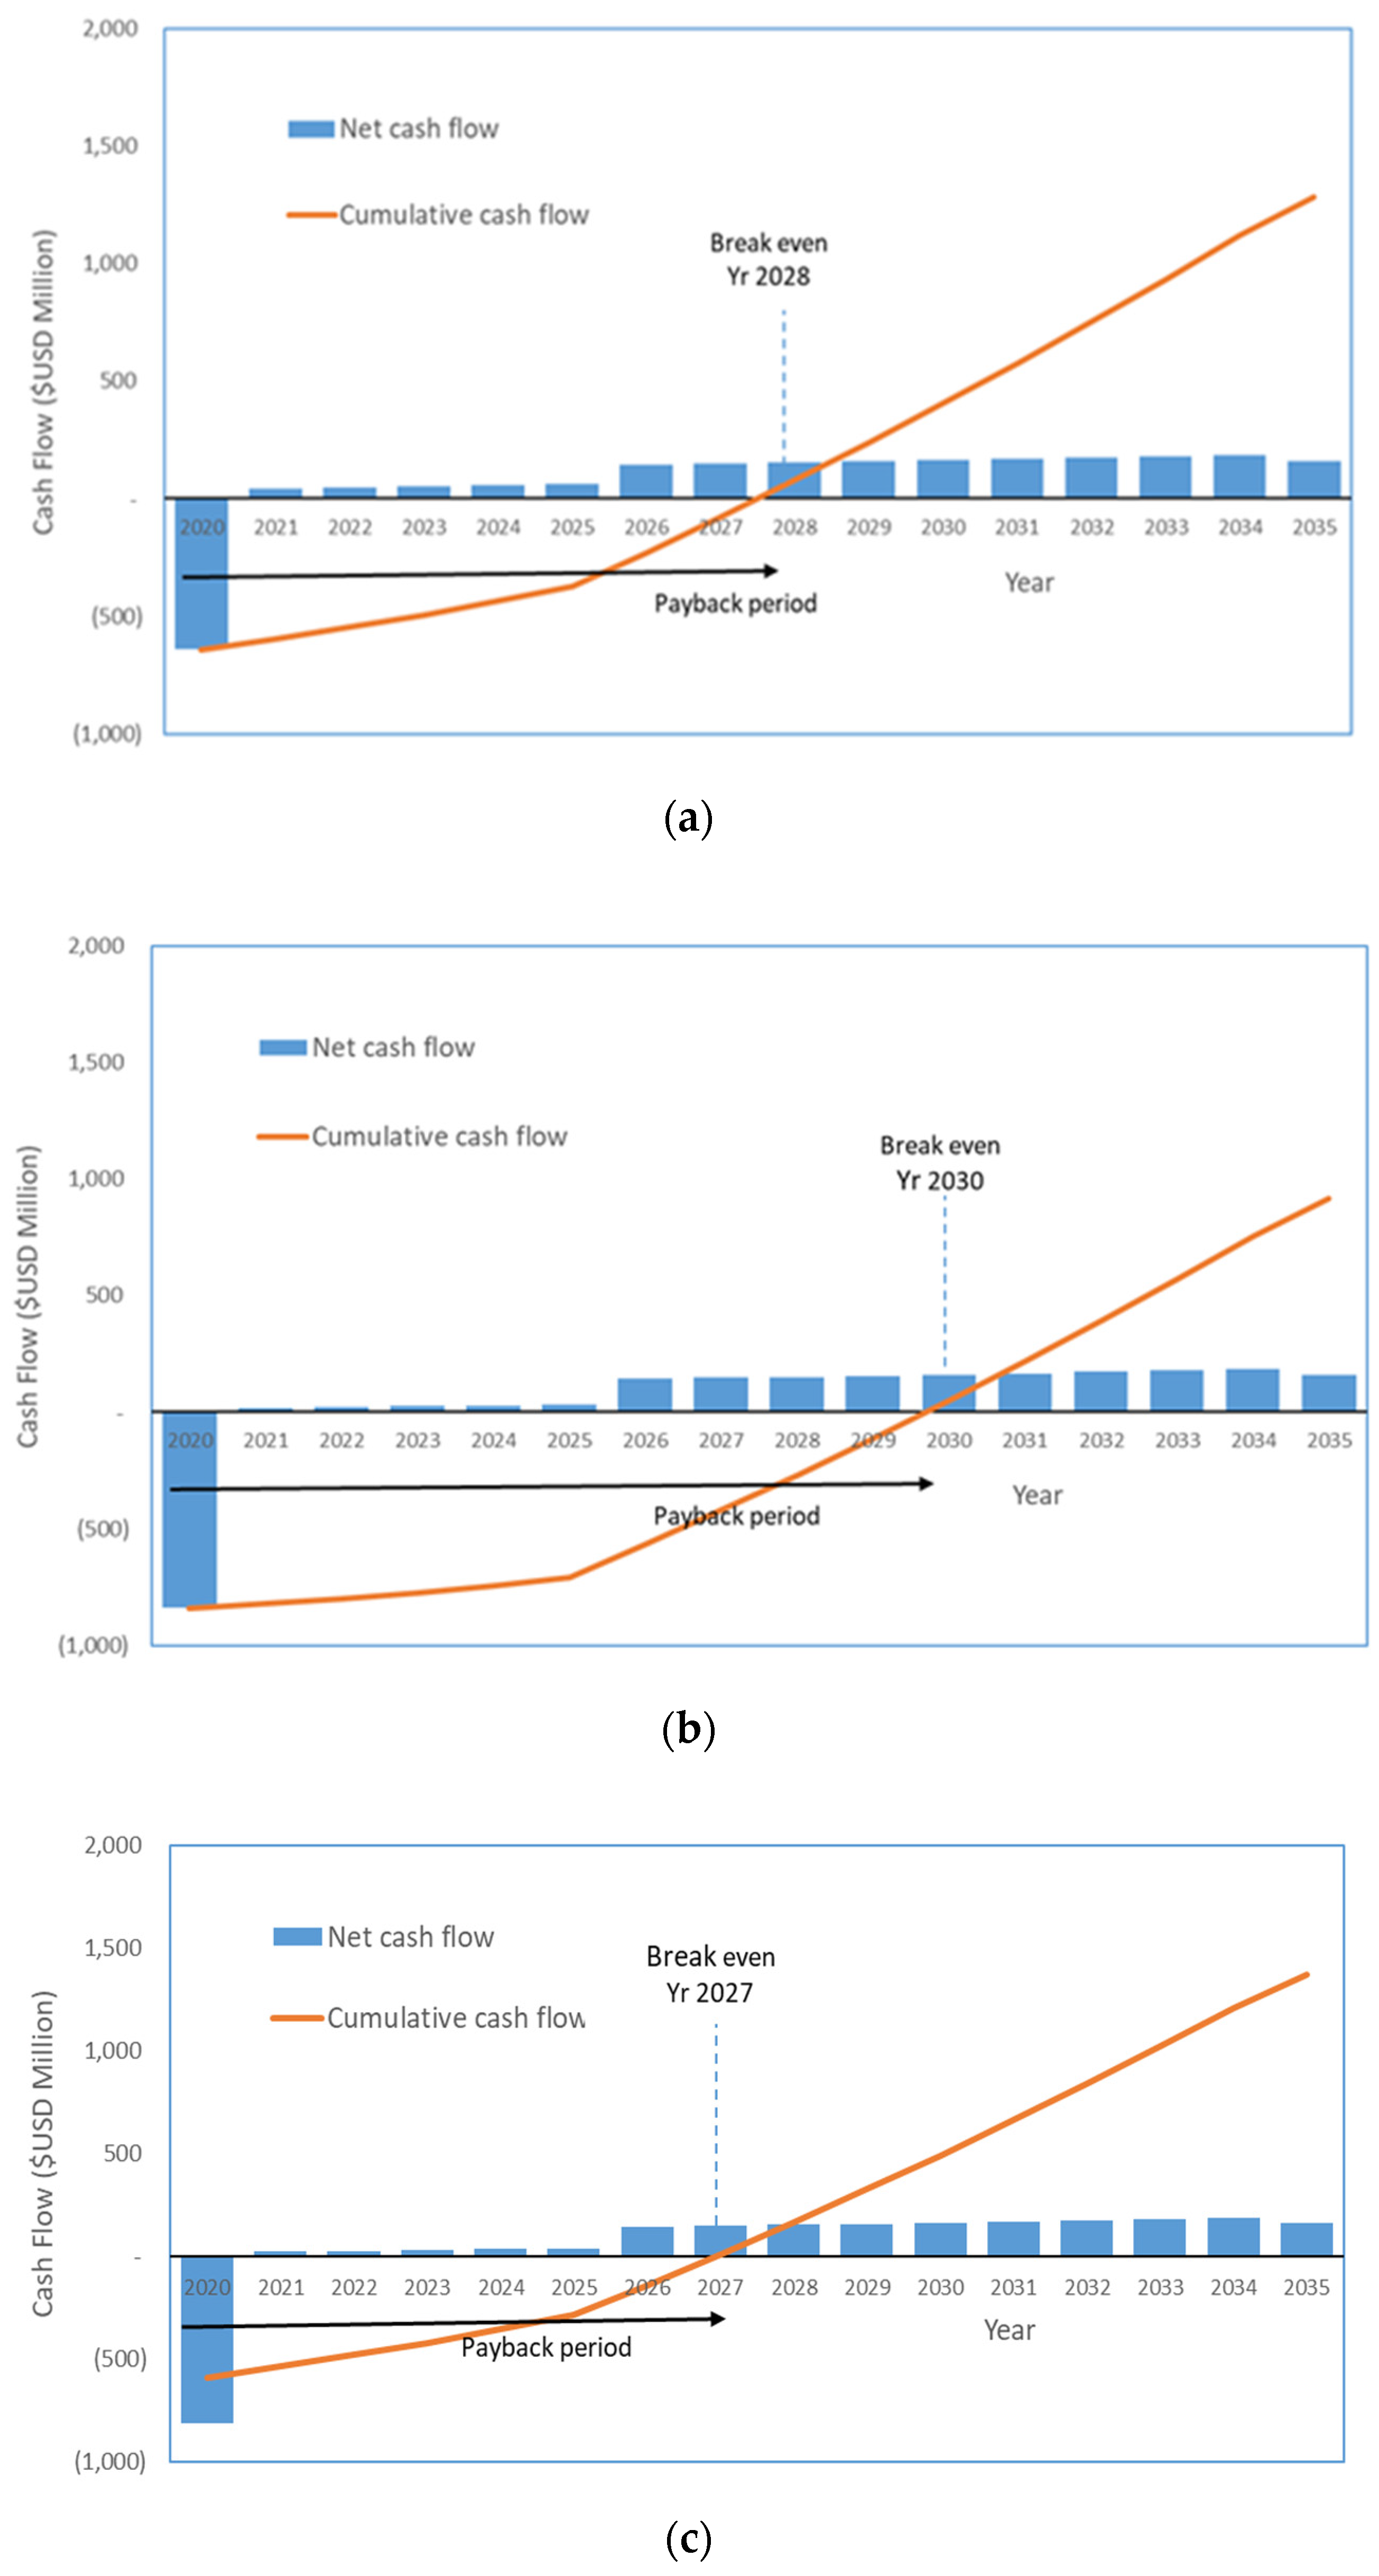
| Payback period (PBP) | 8.55 | 10.68 | 7.94 | 10.45 |
| Net present value (NPV) | 292.94 | (6.67) | 367.39 | 25.58 |
| Internal rate of return (IRR) | 13% | 8% | 15% | 8% |
© 2020 by the authors. Licensee MDPI, Basel, Switzerland. This article is an open access article distributed under the terms and conditions of the Creative Commons Attribution (CC BY) license (http://creativecommons.org/licenses/by/4.0/).
Share and Cite
Sukor, N.R.; Shamsuddin, A.H.; Mahlia, T.M.I.; Mat Isa, M.F. Techno-Economic Analysis of CO2 Capture Technologies in Offshore Natural Gas Field: Implications to Carbon Capture and Storage in Malaysia. Processes 2020, 8, 350. https://doi.org/10.3390/pr8030350
Sukor NR, Shamsuddin AH, Mahlia TMI, Mat Isa MF. Techno-Economic Analysis of CO2 Capture Technologies in Offshore Natural Gas Field: Implications to Carbon Capture and Storage in Malaysia. Processes. 2020; 8(3):350. https://doi.org/10.3390/pr8030350
Chicago/Turabian StyleSukor, Norhasyima Rahmad, Abd Halim Shamsuddin, Teuku Meurah Indra Mahlia, and Md Faudzi Mat Isa. 2020. "Techno-Economic Analysis of CO2 Capture Technologies in Offshore Natural Gas Field: Implications to Carbon Capture and Storage in Malaysia" Processes 8, no. 3: 350. https://doi.org/10.3390/pr8030350