Power Transmission Congestion Management Based on Quasi-Dynamic Thermal Rating


1
School of Mechanical, Electrical and Information Engineering, Shandong University (Weihai), Weihai 264209, China
2
China Telecom, Nanjing 210000, China
3
State Grid Weihai Power Supply Company, Weihai 264200, China
*
Author to whom correspondence should be addressed.
Processes 2019, 7(5), 244; https://doi.org/10.3390/pr7050244
Submission received: 20 March 2019
/
Revised: 17 April 2019
/
Accepted: 24 April 2019
/
Published: 26 April 2019
(This article belongs to the Special Issue Advances in Theoretical and Computational Energy Optimization Processes)
Abstract
:Transmission congestion not only increases the operation risk, but also reduces the operation efficiency of power systems. Applying a quasi-dynamic thermal rating (QDR) to the transmission congestion alarm system can effectively alleviate transmission congestion. In this paper, according to the heat balance equation under the IEEE standard, a calculation method of QDR is proposed based on the threshold of meteorological parameters under 95% confidence level, which is determined by statistical analysis of seven-year meteorological data in Weihai, China. The QDR of transmission lines is calculated at different time scales. A transmission congestion management model based on QDR is established, and the transmission congestion alarm system including conductor temperature judgment is proposed. The case shows that transmission congestion management based on QDR is feasible, which improves the service life and operation flexibility of the power grid in emergencies and avoids power supply shortages caused by unnecessary trip protection.
1. Introduction
In view of the challenges of renewable energy, load growth and obsolete distribution facilities, it is imperative to improve transmission capacity [1]. At the same time, the reliability and safety of power supplies are always primary problems. Transmission congestion aggravates the power supply crisis. In the event of transmission congestion, the use of electricity by enterprises and residents has to be limited, or electricity supplies have to be cut off altogether [2]. Therefore, it is of great significance to alleviate transmission congestion and improve the service life and operation flexibility of power grids in emergency situations.
There are several generator units, transmission lines and loads in power systems. The active power flow on each branch is determined by the system structure and the output of generator unit. The absolute value of the active power flow on each branch is set to a safety limit in order to leave sufficient safety margin for the system to be adjusted in emergency. Once the absolute value of the active power flow exceeds the safety limit, the system will overload or violate voltage safety constraint, resulting in the electricity demand cannot be satisfied, which is called transmission congestion [3].
Managers adopt some protection schemes, such as limiting the use of electricity or planned outage, to regulate power flow and node voltage. It is an effective method to alleviate transmission congestion to maintain the stability and connectivity of the system, which is called transmission congestion management. Considering the system stability and management cost, generator regulation and load shedding are usually adopted [4]. When the transmission congestion is serious, it is necessary to regulate the generation and load side simultaneously. In most cases, load shedding is a remedial measure, and certain compensation should be paid according to the cost of generator rescheduling [5]. Therefore, preventive measures can reduce the management costs which arise due to transmission congestion.
Static thermal rating (STR) is used as the maximum ampacity of transmission lines in traditional preventive measures. If a branch fails, the current on other branches will exceed STR. At this point, some measures, such as trip protection, output reduction and load shedding, will be adopted to regulate the generation or load side, thereby greatly reducing the current of fault-free branch and avoiding thermal overload [6]. STR is a conservative method based on severe weather conditions. The thermal load capacity of transmission lines is often underestimated using STR as a reference for power dispatching, resulting in unreasonable utilization of transmission capacity [7,8]. Compared with STR, dynamic thermal rating (DTR) determines the ampacity by real-time meteorological data. In the favorable conditions of wind speed and ambient temperature, the maximum ampacity of transmission lines is significantly improved [9,10].
At present, the application of DTR technology has been studied in transmission congestion management. In [11], the classical method considering DTR and voltage stability limit was used to solve the optimal power flow in congestion management. A congestion management model based on DTR for distributed robust optimization was proposed in [12]. The thermal overload risk in short-term load forecasting was studied and the possibility of multi-line overload was evaluated to control the overload risk within the system security. In [2], an alternative solution based on DTR to alleviate transmission congestion was presented. Smart adaptations based upon varying weather conditions provided a feasible scenario for DTR of transmission lines. In order to ensure the safety of the system operation, the most perfect scheme is to install thermal sensors on each span of the transmission lines, which aims to obtain the running state and the surrounding meteorological data accurately [13]. However, such a scheme leads to the installation of redundant sensors, and the high cost makes it difficult to implement [14]. At the same time, large-scale deployment of thermal sensors may further lead to calculation complexity and dimensionality reduction in DTR evaluation [15]. Finally, the time variant of DTR increases the complexity of system operation and control.
In addition to above problems, there are some errors between meteorological forecast data and real-time data due to the large fluctuation of meteorological parameters and the short variation interval, which leads to the results of DTR often deviate from the actual value [16]. The concept of quasi-dynamic thermal rating (QDR) was proposed in [17]. QDR is an ideal solution to solve above problems effectively. QDR uses statistical method to determine the thermal rating with a certain confidence level based on the meteorological data defined in time scale. Compared with DTR, as slightly conservative as QDR is, it is more reliable and lower cost. In [18], a market-based real time transmission congestion management algorithm taking QDR into account was proposed, which fully exploit the capability of conductors to withstand different current flows when the system is faced with an emergency situation. The results show that the congestion mitigation, reduction in the congestion costs and load shedding is possible. On the basis of [18], the ampacity calculated by QDR is used as an important reference for overheating alarm in power grid, and the conductor temperature is the core basis for judging thermal overload of lines in this paper. The trip protection, power reduction or load shedding can be adopted to improve the accuracy of system congestion management.
The rest of this paper is organized as follows. In Section 2, the thermal rating model of overhead transmission lines based on IEEE standard is introduced. In Section 3, the key meteorological parameters based on historical meteorological data in Weihai are analyzed, the threshold of meteorological parameters under 95% confidence level is determined, and the QDR at different time scales is obtained by steady-state heat balance equation. A transmission congestion management method based on QDR is proposed in Section 4, which integrates conductor temperature judgment module into transmission congestion alarm system. In Section 5, an improved 14-bus case is given to analyze the variation of currents in fault according to the characteristics of conductor electrothermal under dynamic thermal balance. The trip protection scheme and congestion management decision based on QDR are also given. Conclusions are given in Section 6.
2. Thermal Rating Calculation Model of Transmission Line
The thermal load capacity is determined by the physical properties of conductor. The solution of thermal load capacity is an important issue after determining conductor material, geometric section and maximum allowable operating temperature. The calculation principle is derived from the heat balance equation of conductor. The conductor temperature is affected by its current carrying value and ambient conditions. The main factors are the joule heat caused by the current passing through the line and the heat absorbed from solar radiation. The cooling effects of the transmission line are mainly the convection heat generated by the wind and the radiation heat due to the temperature difference between the conductor temperature and ambient temperature. Therefore, the conductor temperature is a function of current, wind speed, illumination and ambient temperature. According to the IEEE standard, the heat balance equation representing the dynamic change of conductor temperature is shown in Equation (1):
where is the convection heat caused by the wind speed, W/m; is the radiation heat caused by temperature differences, W/m; is the absorption heat from solar radiation, W/m; is the current carrying, A; Tc is the conductor temperature, °C; is the conductor resistance per unit length of the conductor at the temperature of , Ω/m; is the mass per unit length of the conductor, kg/m; is the specific heat capacity of the conductor, J/(kg·°C); is the time, s.
When the current and the weather conditions are constant, the absorption and loss of heat will be in equilibrium. The heat balance equation in the steady state is shown in Equation (2):
It is assumed that the conductor operates at the maximum allowable temperature and the meteorological parameters are known, the ampacity of the transmission lines can be deduced from Equation (2), as shown in Equation (3):
The type of the line in this paper is LGJ-400/50. STR is a conservative method based on severe weather conditions. The wind speed is 0.5 m/s. The ambient temperature is 40 °C, and the sunshine intensity is 1000 W/m2. The STR calculated by Equation (3) is 592 A.
3. Quasi-dynamic Thermal Rating of Transmission Line
DTR determines the ampacity of overhead transmission lines according to the real-time meteorological parameters such as wind speed, ambient temperature and sunshine, which can effectively improve the utilization ratio of transmission lines. However, the time-varying increases the complexity of system. QDR is used to analyze the historical data of key meteorological parameters to determine the threshold values under different confidence levels and time scales (monthly, seasonally and yearly). The thermal ratings in different time scales are calculated by the threshold of each parameter. Theoretically, the selection of time scale for thermal rating can be arbitrary. However, for regions with obvious seasonal variations in meteorological conditions, time scales based on seasonal variations can greatly improve the ampacity of transmission lines. Monthly, seasonally and yearly rating of QDR are mainly studied in this paper. Firstly, the meteorological parameter thresholds under 95% confidence level are calculated based on wind speed and ambient temperature with the interval of 10 min. The meteorological data are from November 24, 2008 to November 23, 2015 in Weihai, China. Next, the QDRs of year, season and month are solved.
3.1. Statistical Analysis of Key Meteorological Parameters
The climate in Weihai belongs to marine monsoon climate, with four distinct seasons, clear monsoon and large wind-force. The seven-year meteorological data of Weihai are analyzed. The statistics of the key meteorological parameters are as follows.
3.1.1. Statistical Analysis of Wind Speed
From November 24, 2008 to November 23, 2015, the maximum wind speed in Weihai is 22.7 m/s. The maximum differences of the maximum frequency wind speed in different years is 0.4 m/s. Similarly, the wind speed difference of the same season in different years is 1.9 m/s, and the difference of the same month in different years is 1.8 m/s. The above differences illustrate that it is necessary to use statistical analysis of meteorological data for many years to drive the thermal rating of the line. In the same years, the maximum differences of the maximum frequency wind speed in different seasons and months of the same year are 3.4 m/s and 3.3 m/s respectively. The differences indicate that different time scales for thermal rating will directly affect the QDR.
The frequency distribution histogram of the seven-year wind speed is shown in Figure 1. It can be seen that wind speed are mainly concentrated in the interval of 0-5 m/s. If the confidence level is set to 95%, there are 368,116 × 95%wind speed data is higher than the threshold and the annual wind speed threshold is 2.2 m/s.
3.1.2. Statistical Analysis of Ambient Temperature
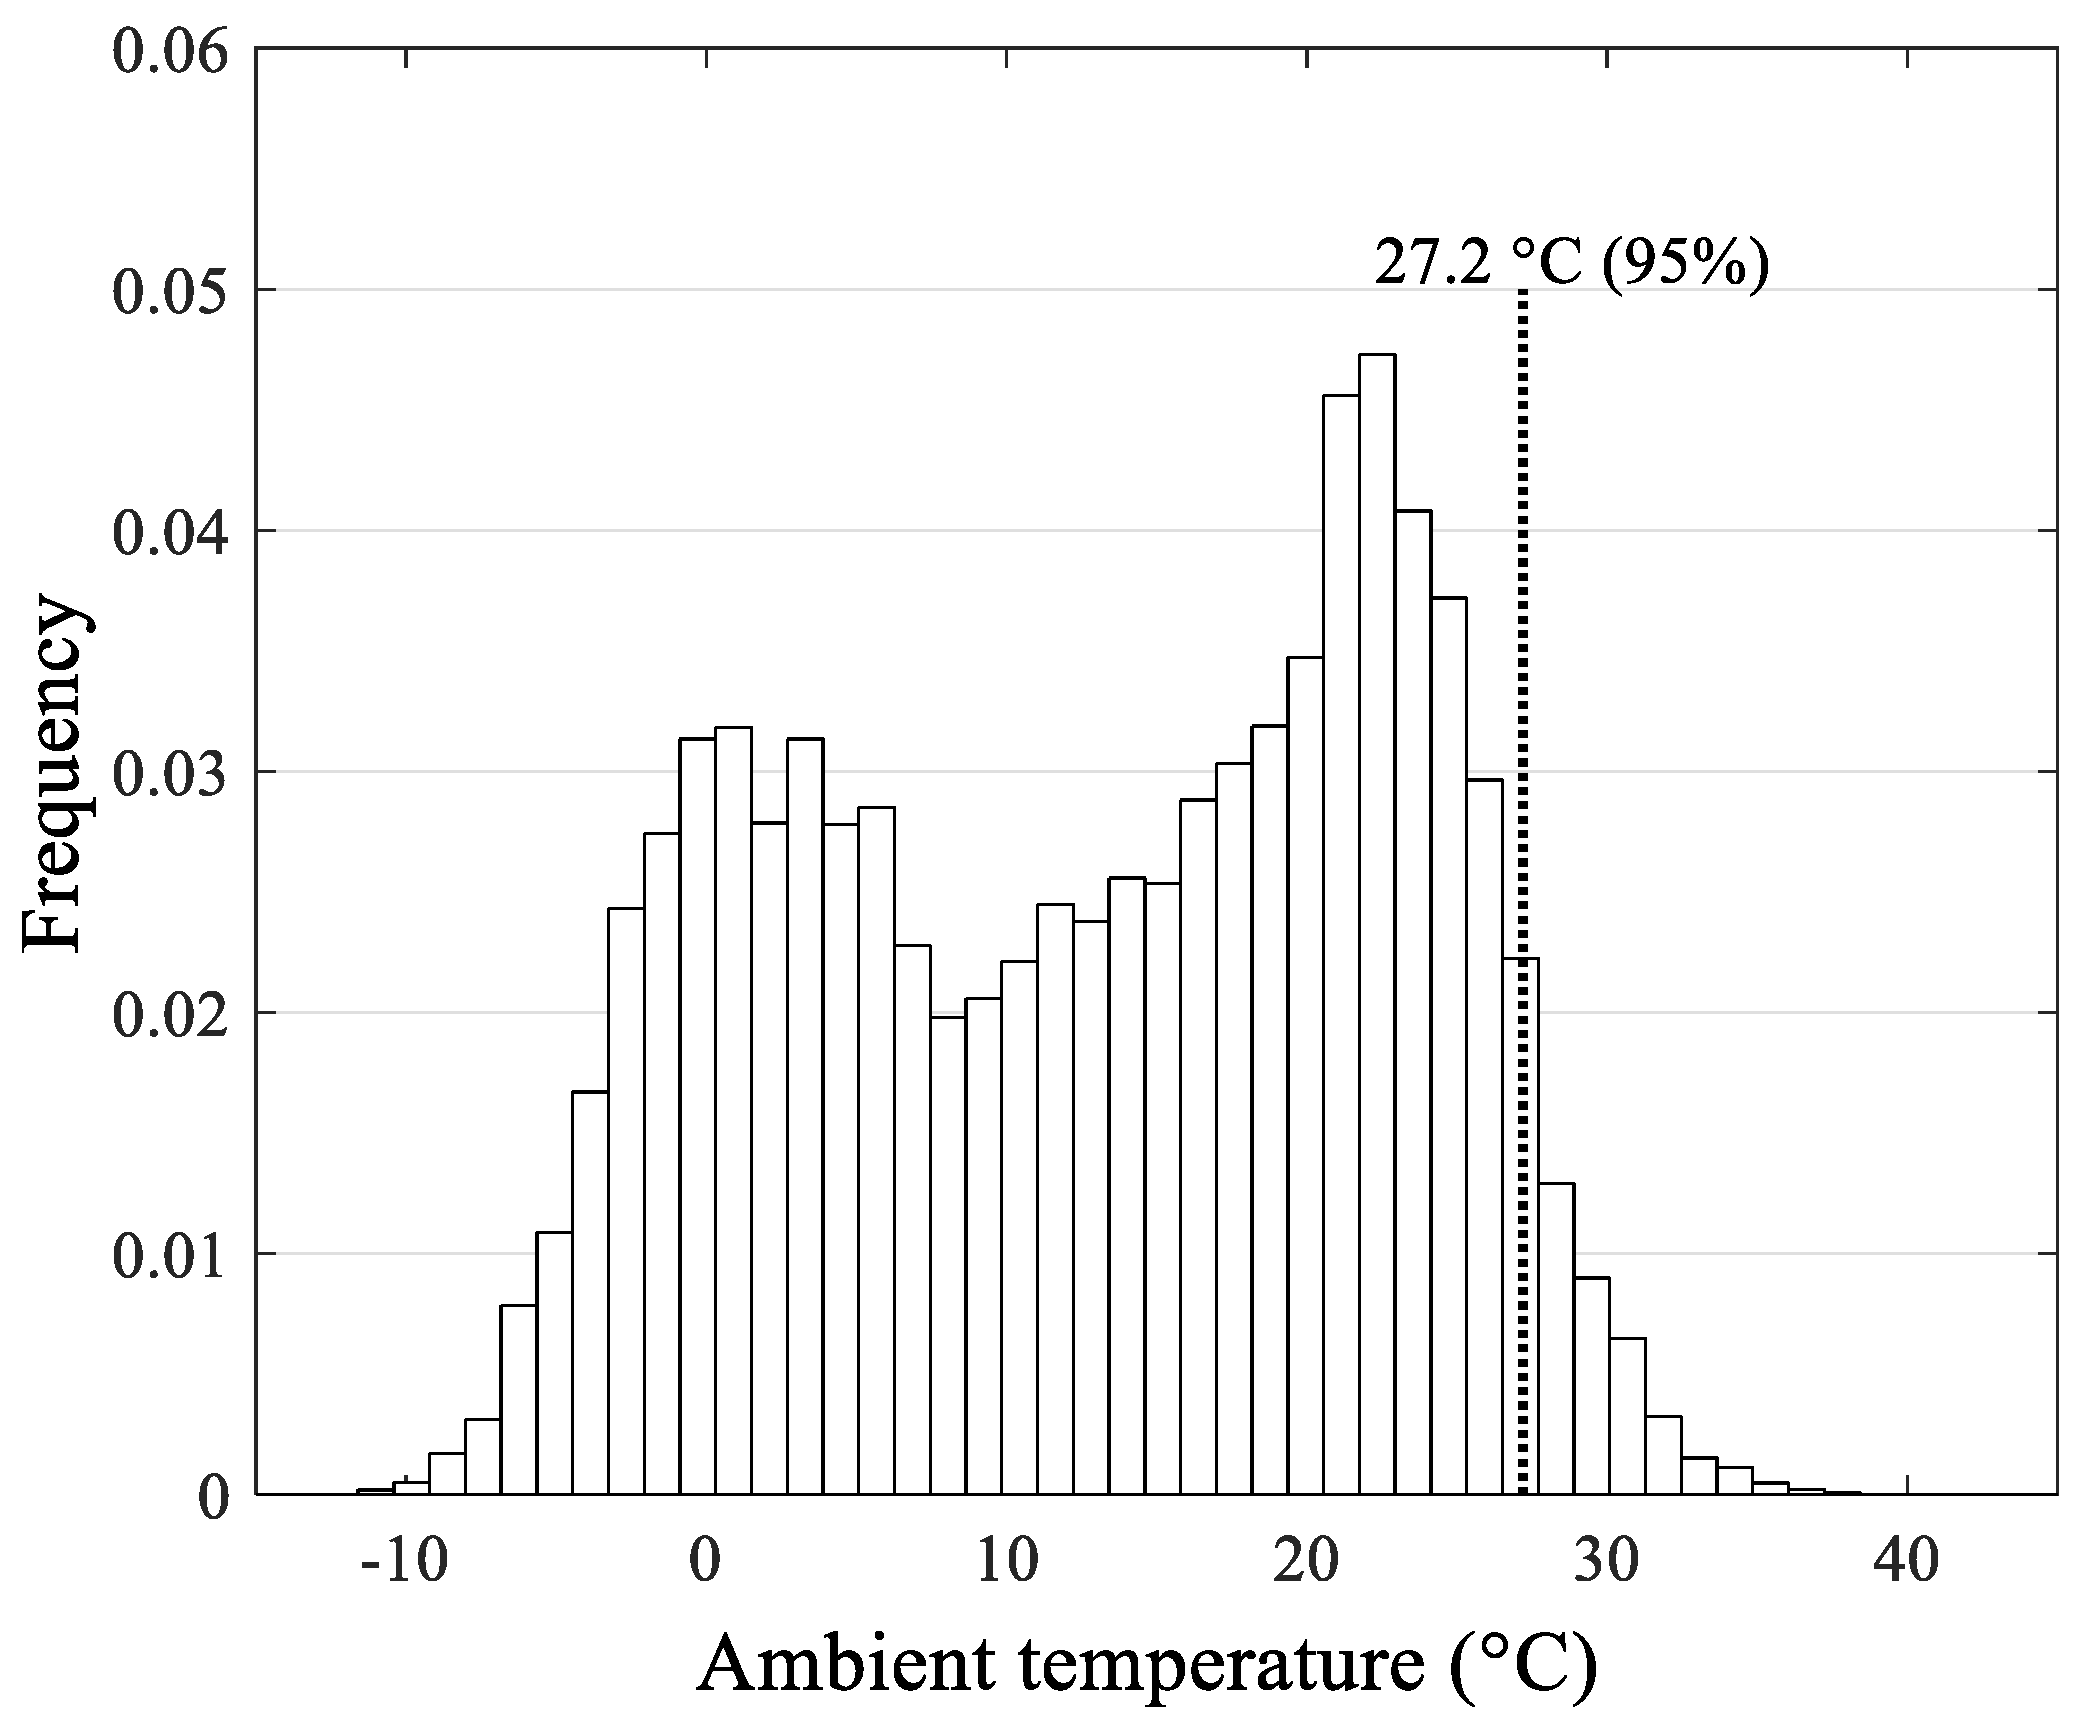
According to statistics, the maximum and minimum temperatures are 42.0 °C and −13.5 °C, respectively. The maximum annual temperature difference is 48.9 °C. The maximum difference of the average temperatures in different years is 1.9 °C. Similarly, the temperature differences of the same seasons in different years, and the same months in different years are 3.5 °C and 4.3 °C respectively. In the same year, the maximum differences of the average temperatures of different seasons and months are 27.8 °C and 30.4 °C, respectively. The above temperature differences show the necessity of thermal rating in different time scales based on meteorological data. The frequency distribution histogram of the seven-year ambient temperature is shown in Figure 2. The conductor ampacity decreases with the increase of ambient temperature, so a high temperature threshold is set. The annual temperature threshold under the confidence level of 95% is 27.2 °C.
In addition, according to the statistical analysis of the wind direction, the wind direction shows a high variability from 0° to 180°, and especially the low wind speed is non-directional. Considering the strong randomness of wind direction and the change of line direction, the distribution of wind incidence angle along the line changes greatly. Therefore, the average value of long-term incidence angle of 45° is used to calculate the thermal rating of the line.
3.2. Quasi-dynamic Thermal Rating
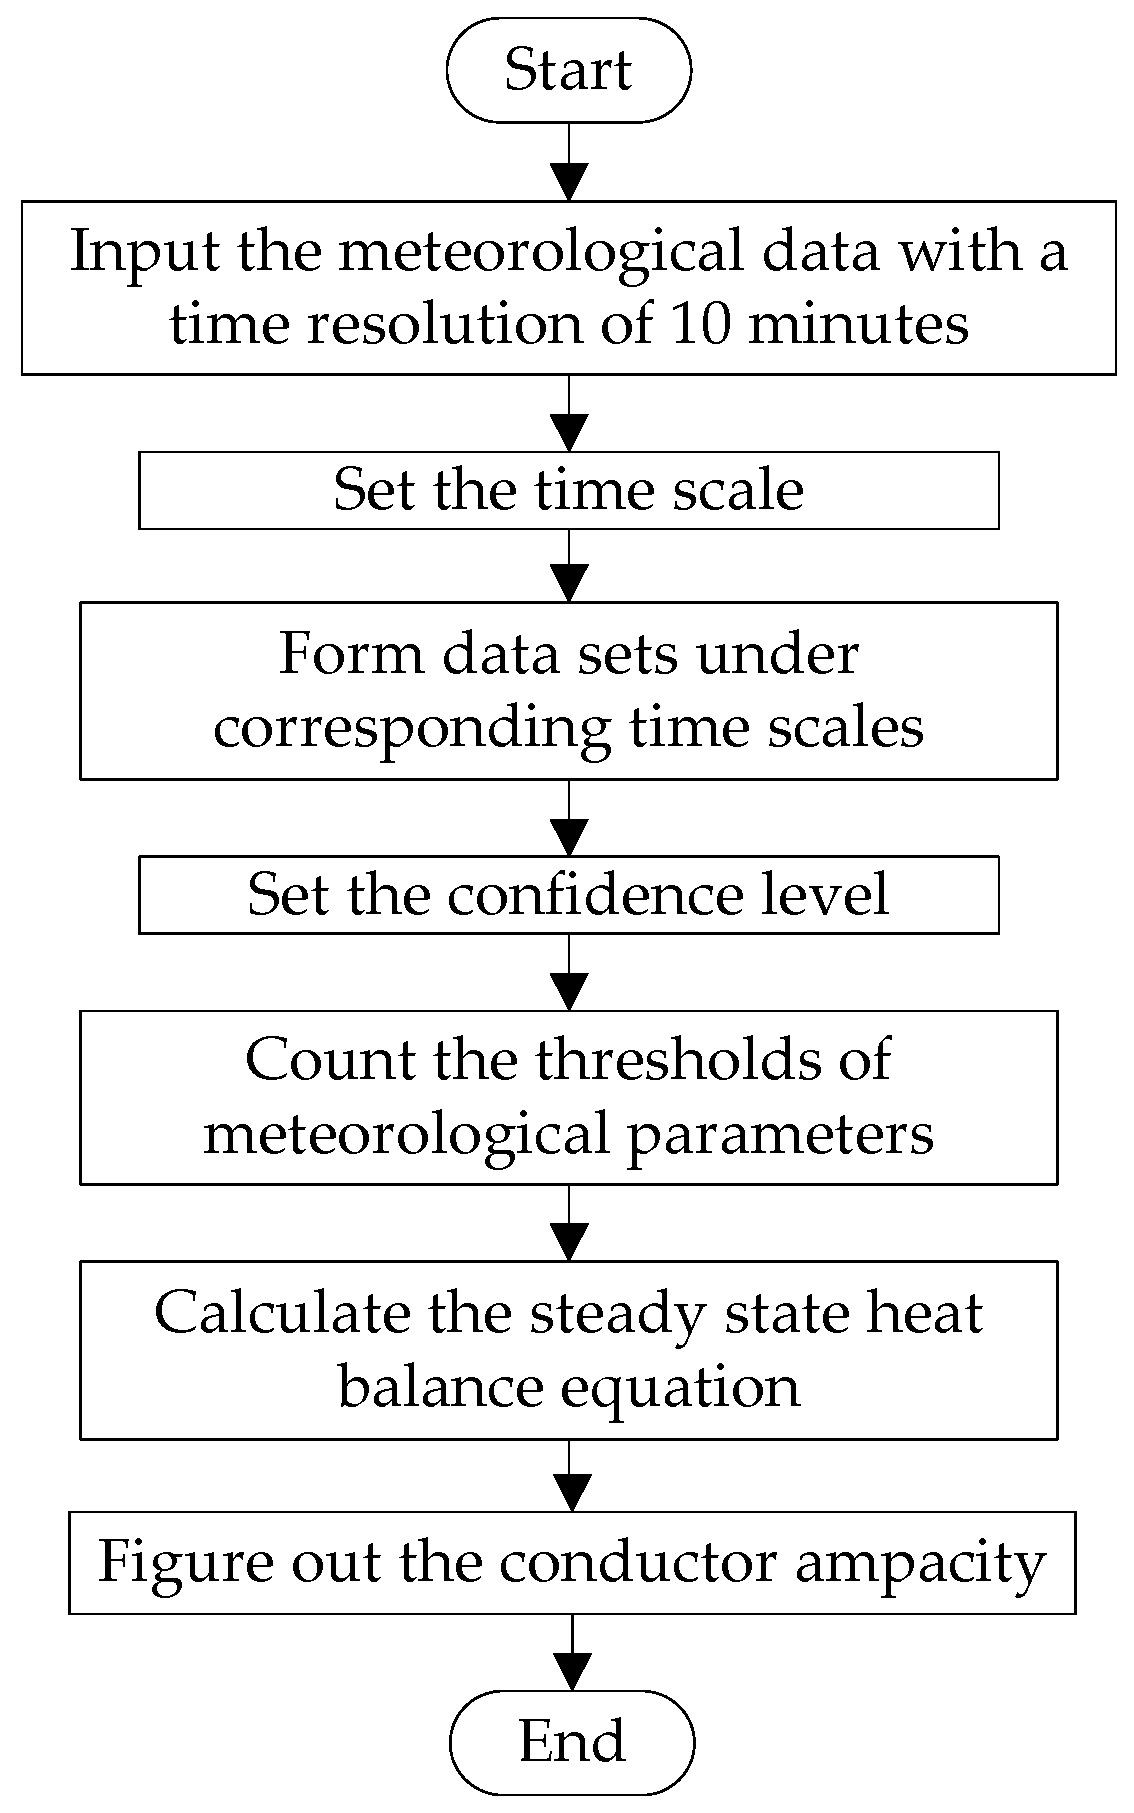
The type of the line in this paper is LGJ-400/50, the typical overhead lines in Weihai of China, whose diameter is 27.63 mm and the maximum allowable operating temperature is 70 °C. With the condition of overhead lines is unknown, the absorptivity and emissivity of sunshine are usually 0.5. The seven-year meteorological data are divided into several subsets according to above time scales, and the frequency distributions of wind speed and ambient temperature in each subset are obtained. Next, the threshold of each parameter is calculated based on confidence level. Using the steady state heat balance equation and the threshold values of meteorological parameters, the thermal ratings of the line in different time scales are calculated. The flow chart of the method is shown in Figure 3.
According to Equation (3) and the meteorological parameter threshold, the wind speed and ambient temperature thresholds at different time scales under the confidence level of 95% are shown in Table 1. The yearly, seasonally and monthly ratings are shown in Figure 4.
As shown in Table 1 and Figure 4, there are obvious differences between meteorological parameters in different months, which makes large difference of carrying capacity. There is much room for improvement of the ampacity with favorable meteorological parameters. The thermal carrying capacity reaches the maximum in the winter of February and the minimum in the summer of August, respectively. The difference between them is 438.5 A. The thermal load capacity of overhead lines is seasonally dependent, which can greatly improve the ampacity in winter. In addition, the average of rating monthly is higher than that of rating seasonally, indicating that shortening the time scale can significantly improve the ampacity. The confidence level and time scale are important parameters affecting the ampacity. With the increase of confidence level, the ampacity is increased. Even if the confidence level is 99%, the rating yearly is 745.5 A, which is much higher than the traditional STR of 592 A, as well as the seasonally and monthly thermal rating under different confidence levels. It is further illustrated that QDR can effectively improve the utilization ratio of lines.
4. Design of Transmission Congestion Management Based on Quasi-dynamic Thermal Rating
STR is replaced by QDR as the maximum ampacity to relax the thermal restriction of transmission lines. When the line fails, real-time meteorological data are used to determine the occurrence and time of thermal overload, so as to regulate the generator.
The method is used to deal with the transmission congestion caused by line fault. The conductor temperature is an important signal to adjust the generation side. The logical design diagram is shown in Figure 5. The current value, the real-time meteorological data, and the circuit breaker state are the input signals of the system. If a fault occurs, the circuit breaker on the fault line will cut off and a breaking signal will feed back to the managers. The regulatory signal will be sent out only the system satisfies the following conditions simultaneously: the open circuit signal is detected; a warning signal is sent out when the current value of the fault-free line exceeds the safety limit of QDR; the real-time conductor temperature exceeds the maximum allowable operating temperature.
The tripping signal is sent out when the conductor overheats. Because the thermal time constant is larger than the electrical time constant, the system security will not be affected as long as the trip protection or load reduction is completed within a short time after receiving the regulatory signal. The delay time in this system is 0.1 s.
5. Case
A 14-bus system is given to analyze the transmission congestion. The base voltage and capacity are 220 kV and 100 MVA, respectively. There are 17 high-voltage transmission lines with the type of LGJ-400/50 and the voltage of 220 kV whose transmission distance is between 100 km and 300 km. Conductor resistance, reactance and susceptance are 0.07875 Ω/km, 0.405 Ω/km and 2.815 × 10⁻⁶ S/km, respectively. The structure of the system is shown in Figure 6.
The parameters of generator, transmission line and load are shown in Table 2, Table 3 and Table 4 respectively, where the voltage, resistance, power and other parameters are expressed as per-unit value.
Under normal operation, the current values of all branches in the system are lower than STR of 592 A. Compared with other branches, the currents of L1, L2, L13, L15 and L18 are larger, but they don’t exceed 592 A. The current values of the five branches are shown in Table 5.
Analysis of Transmission Congestion
Any actions violating the power grid restrictions may cause transmission congestion. The power flow is analyzed in 14-bus system with transmission congestion caused by line fault. With the occurrence of overload, short circuit or undervoltage, the circuit breaker will automatically cut off, resulting in a sharp increase in active power flow on the fault-free lines. Once the current exceeds the rating, the line may be thermal overload, resulting in transmission congestion to endanger the operation of power system.
It is assumed that three classical line faults occur when the system runs to 300 s, at the same time the circuit breaker on the line starts and cuts off the branch.
Fault 1: only L4 fails;
Fault 2: L5 and L12 fail (five seconds apart);
Fault 3: L2, L7 and L17 fail (five seconds apart).
Generally, there are few simultaneous faults of three branches in the system. In order to ensure the stability of the system, it is assumed that the time interval of the line fault is 5s. The power flow of each branch under the three kinds of faults is monitored. The conductor temperature after occurrence of faults is analyzed.
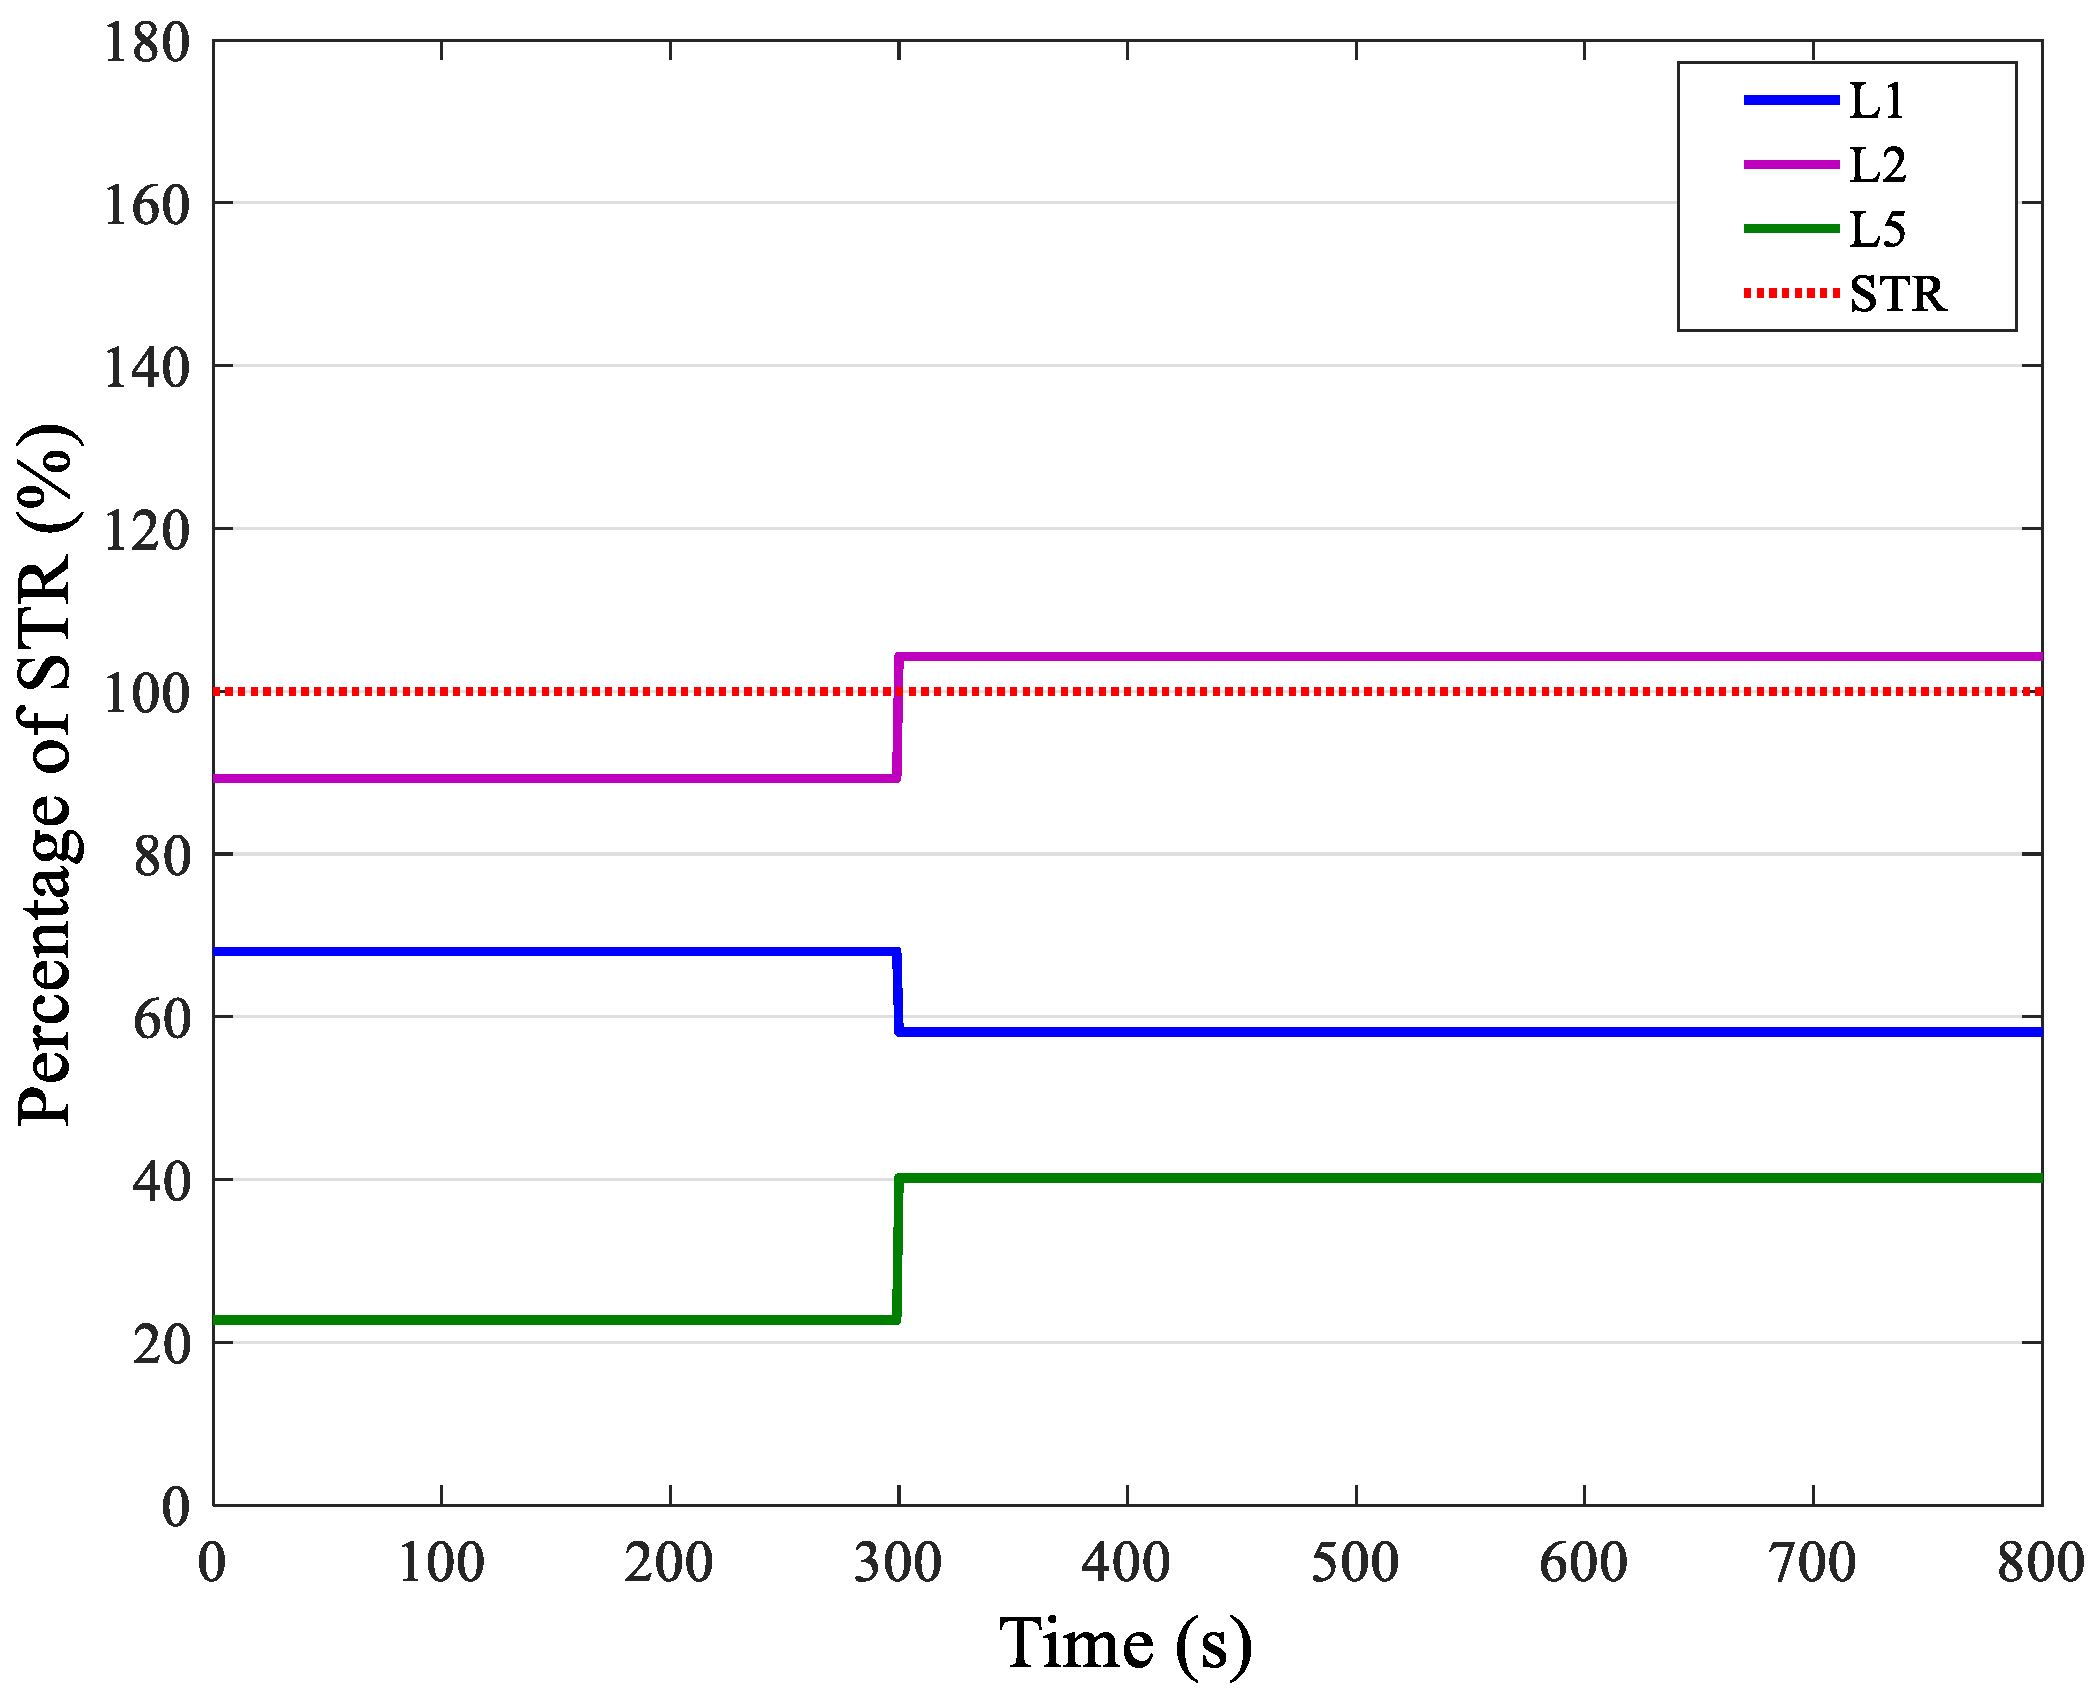
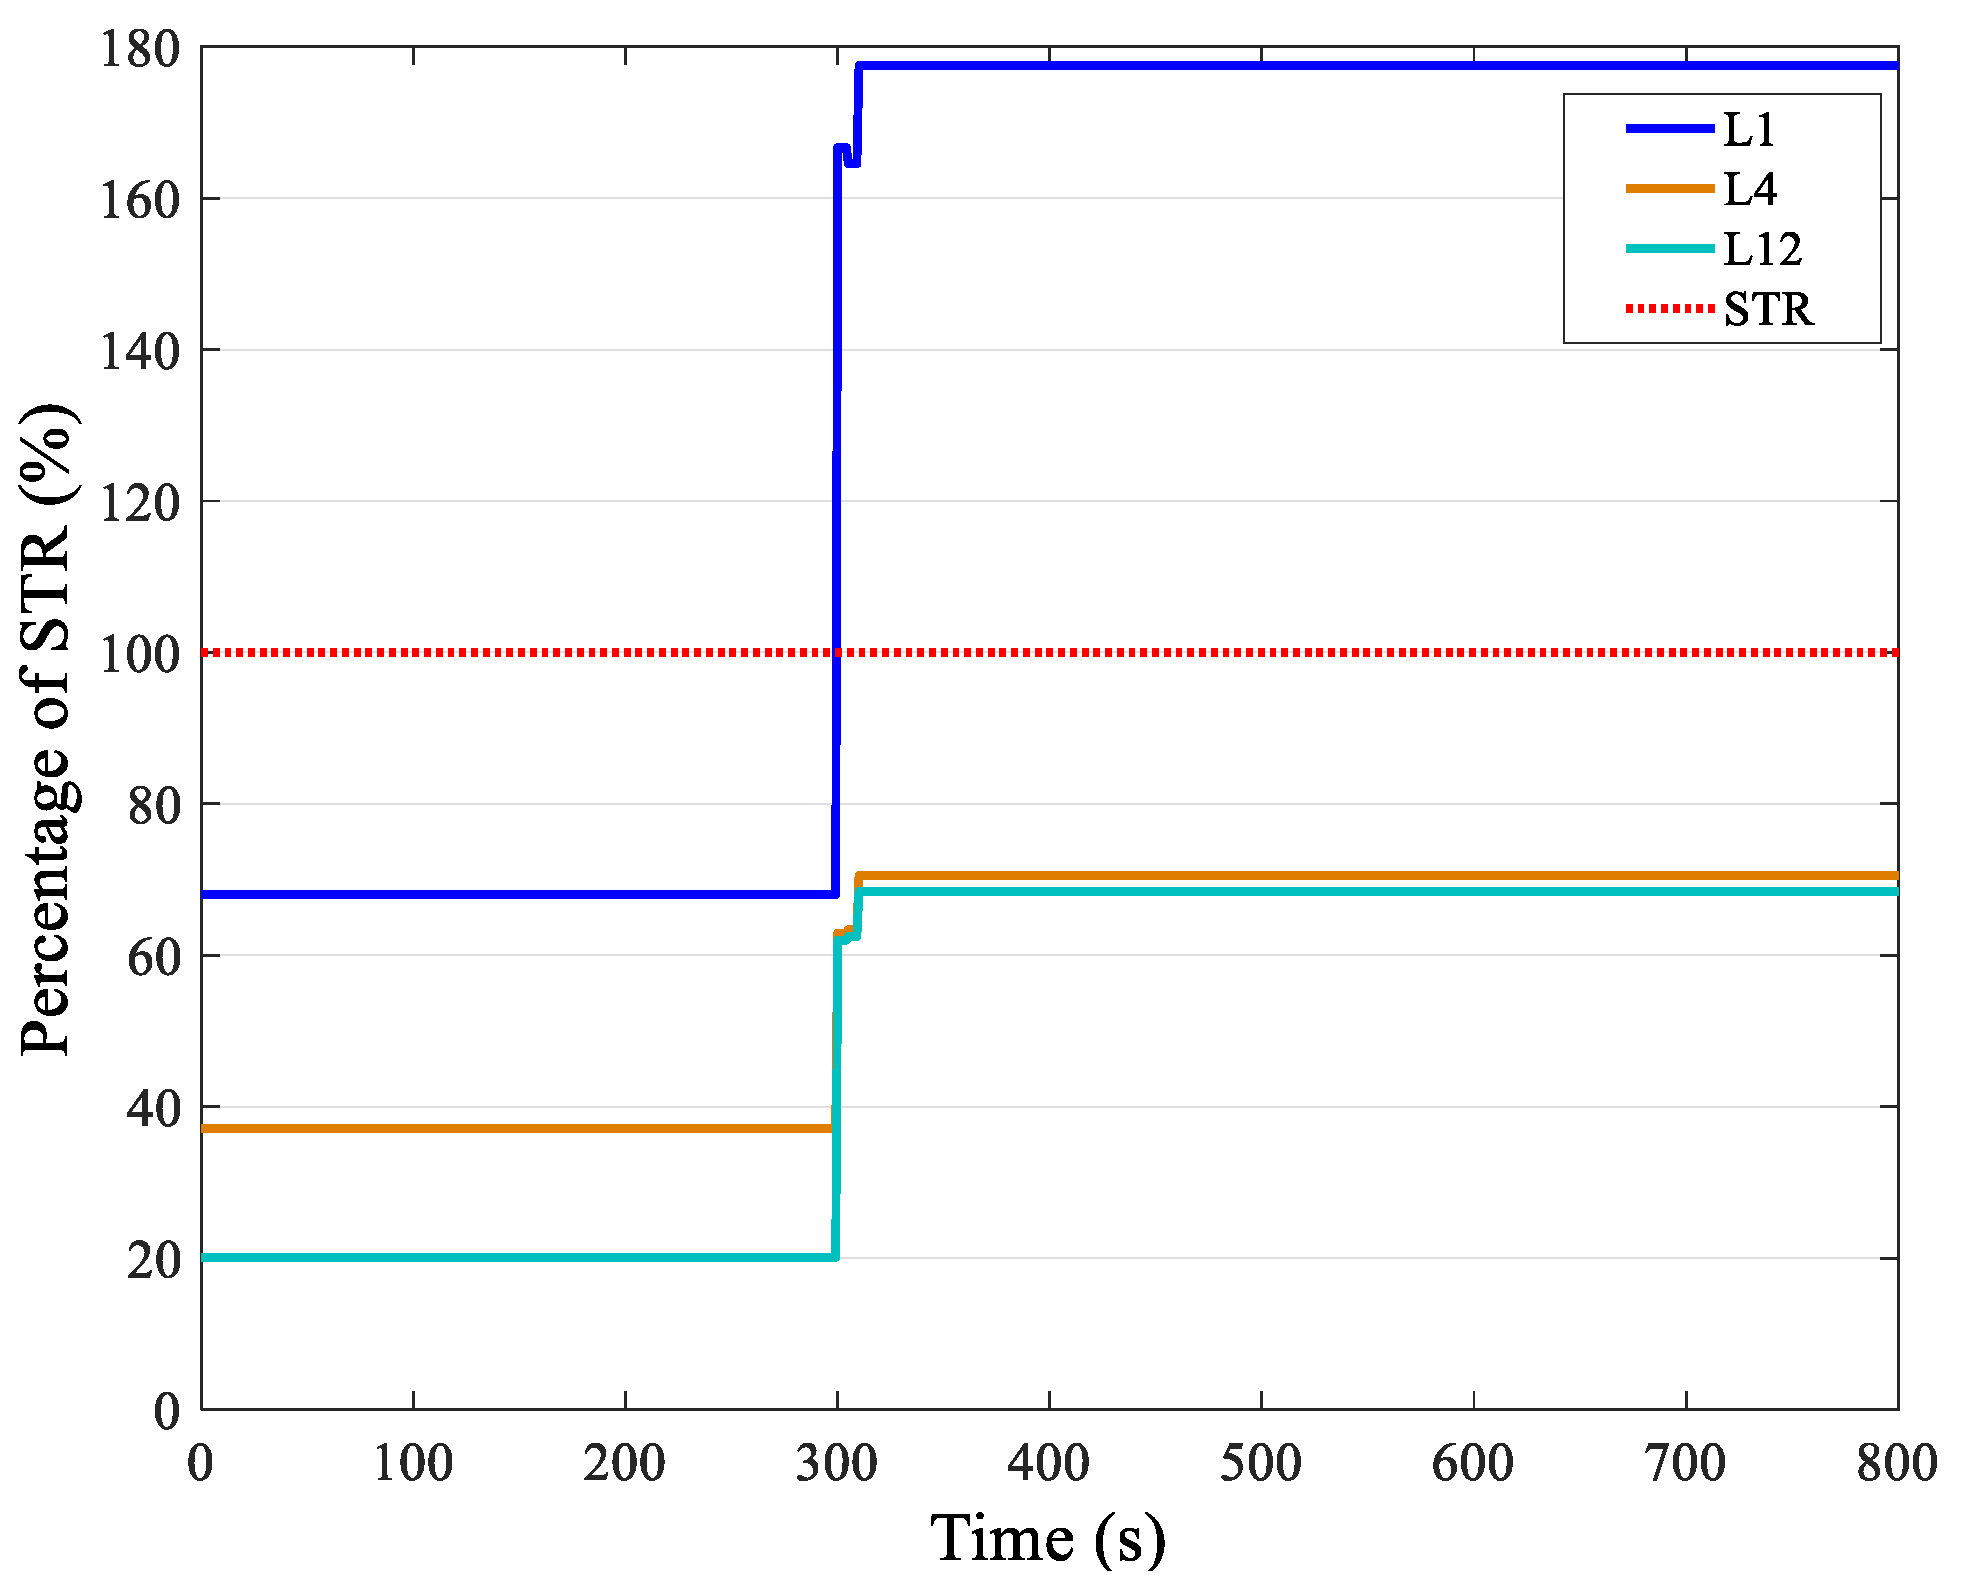
Only the branch with the greatest current change is analyzed after the circuit breaker is cut off. The currents on other branches change insignificantly. The circuit breaker starts up with a break signal at the same time. The current variation of the three faults are shown in Figure 7, Figure 8 and Figure 9, respectively.
For fault 1, L4 fails when the system runs to 300 s, at the same time the circuit breaker on L4 starts. Consequently, as shown in Figure 7, the currents on L1, L2 and L5 change obviously. The current on L1 decreases to lower than 60% of STR, however, the currents on L2 and L5 increase. The current on L5 rises to about 40% of STR still lower than STR. The current on L2 rises to 617.2 A, which is 4.3% higher than STR.
For fault 2, L5 and L12 fail when the system run to 300 s and 305 s respectively. The circuit breakers on L5 and L12 start at 300 s and 305 s, respectively. As shown in Figure 8, at 300 s, the current on L1 decreases and the currents on L2 and L4 rise, and they are all lower than STR. From 300 s to 305 s, only the current on L2 is close to STR. After 305 s, the current on L2 is up to 723.4 A which is 22.2% higher than STR.
For fault 3, it is assumed that the circuit breakers on L2, L7 and L17 start at 300 s, 305 s and 310 s, respectively. As shown in Figure 9, from 300 s to 305 s, the current on L1 rises to 986.6 A. Although the currents on L4 and L12 rise sharply, it is much smaller than STR. From 305 s to 310 s, L2 and L7 are cut off. At the same time, the current on L1 reduces to 974.1 A. After 310 s, all fault branches are cut off. The current on L1 rises to 1065.6 A, reaching 180% of STR. The current on L4 and L12 is still lower than STR. The circuit breaker signals in fault 3 are shown in Figure 10.
The three faults lead to the currents on critical fault-free branches exceed STR. In the case of transmission congestion management based on STR, it is necessary to adopt corrective measures and cut power or load in serious case. A transmission congestion management scheme based on QDR is presented in this paper. In order to ensure the system security, the safety limit of the active power and the confidence level of QDR are set to 90% and 99%, respectively. It is necessary to analyze the conductor temperature and decide to take preventive measures when the current exceeds the safety limit of QDR.
The confidence level of QDR is set at 99% and the safety threshold of judgment module is 90% to keep enough safety margin to prevent conductor temperature from exceeding the thermal limit. The yearly, seasonally, monthly rating under the confidence level of 99% and safety limit of 90% can be obtained using the method proposed in Section 3, as shown in Table 6.
It can be seen that the QDR significantly improves the ampacity of lines. Compared with STR, the yearly safety limits, the average seasonally and monthly safety limits increased by 13.3%, 26.1%, and 30.7%, respectively.
The 14-bus power system with three kinds of transmission congestions is studied. Meteorological data around overhead transmission lines are from the observatory of Shandong University (Weihai). The interval of meteorological data is 5 min. It is assumed that there is no significant change in meteorological data in 5 min. The yearly rating and the winter rating are used as QDR to verify the effectiveness of the method based on QDR.
In order to verify that yearly rating can avoid unnecessary regulation after fault occurs, the ambient parameters are set to the severe value in 2016 (the minimum average wind speed and the maximum average ambient temperature in one hour). According to the statistics of meteorological data, the meteorological data at 11 a.m. on July 24, 2016 are chosen as the most conservative in the whole year. The sampling of meteorological data around the line at 5 min is shown in Table 7.
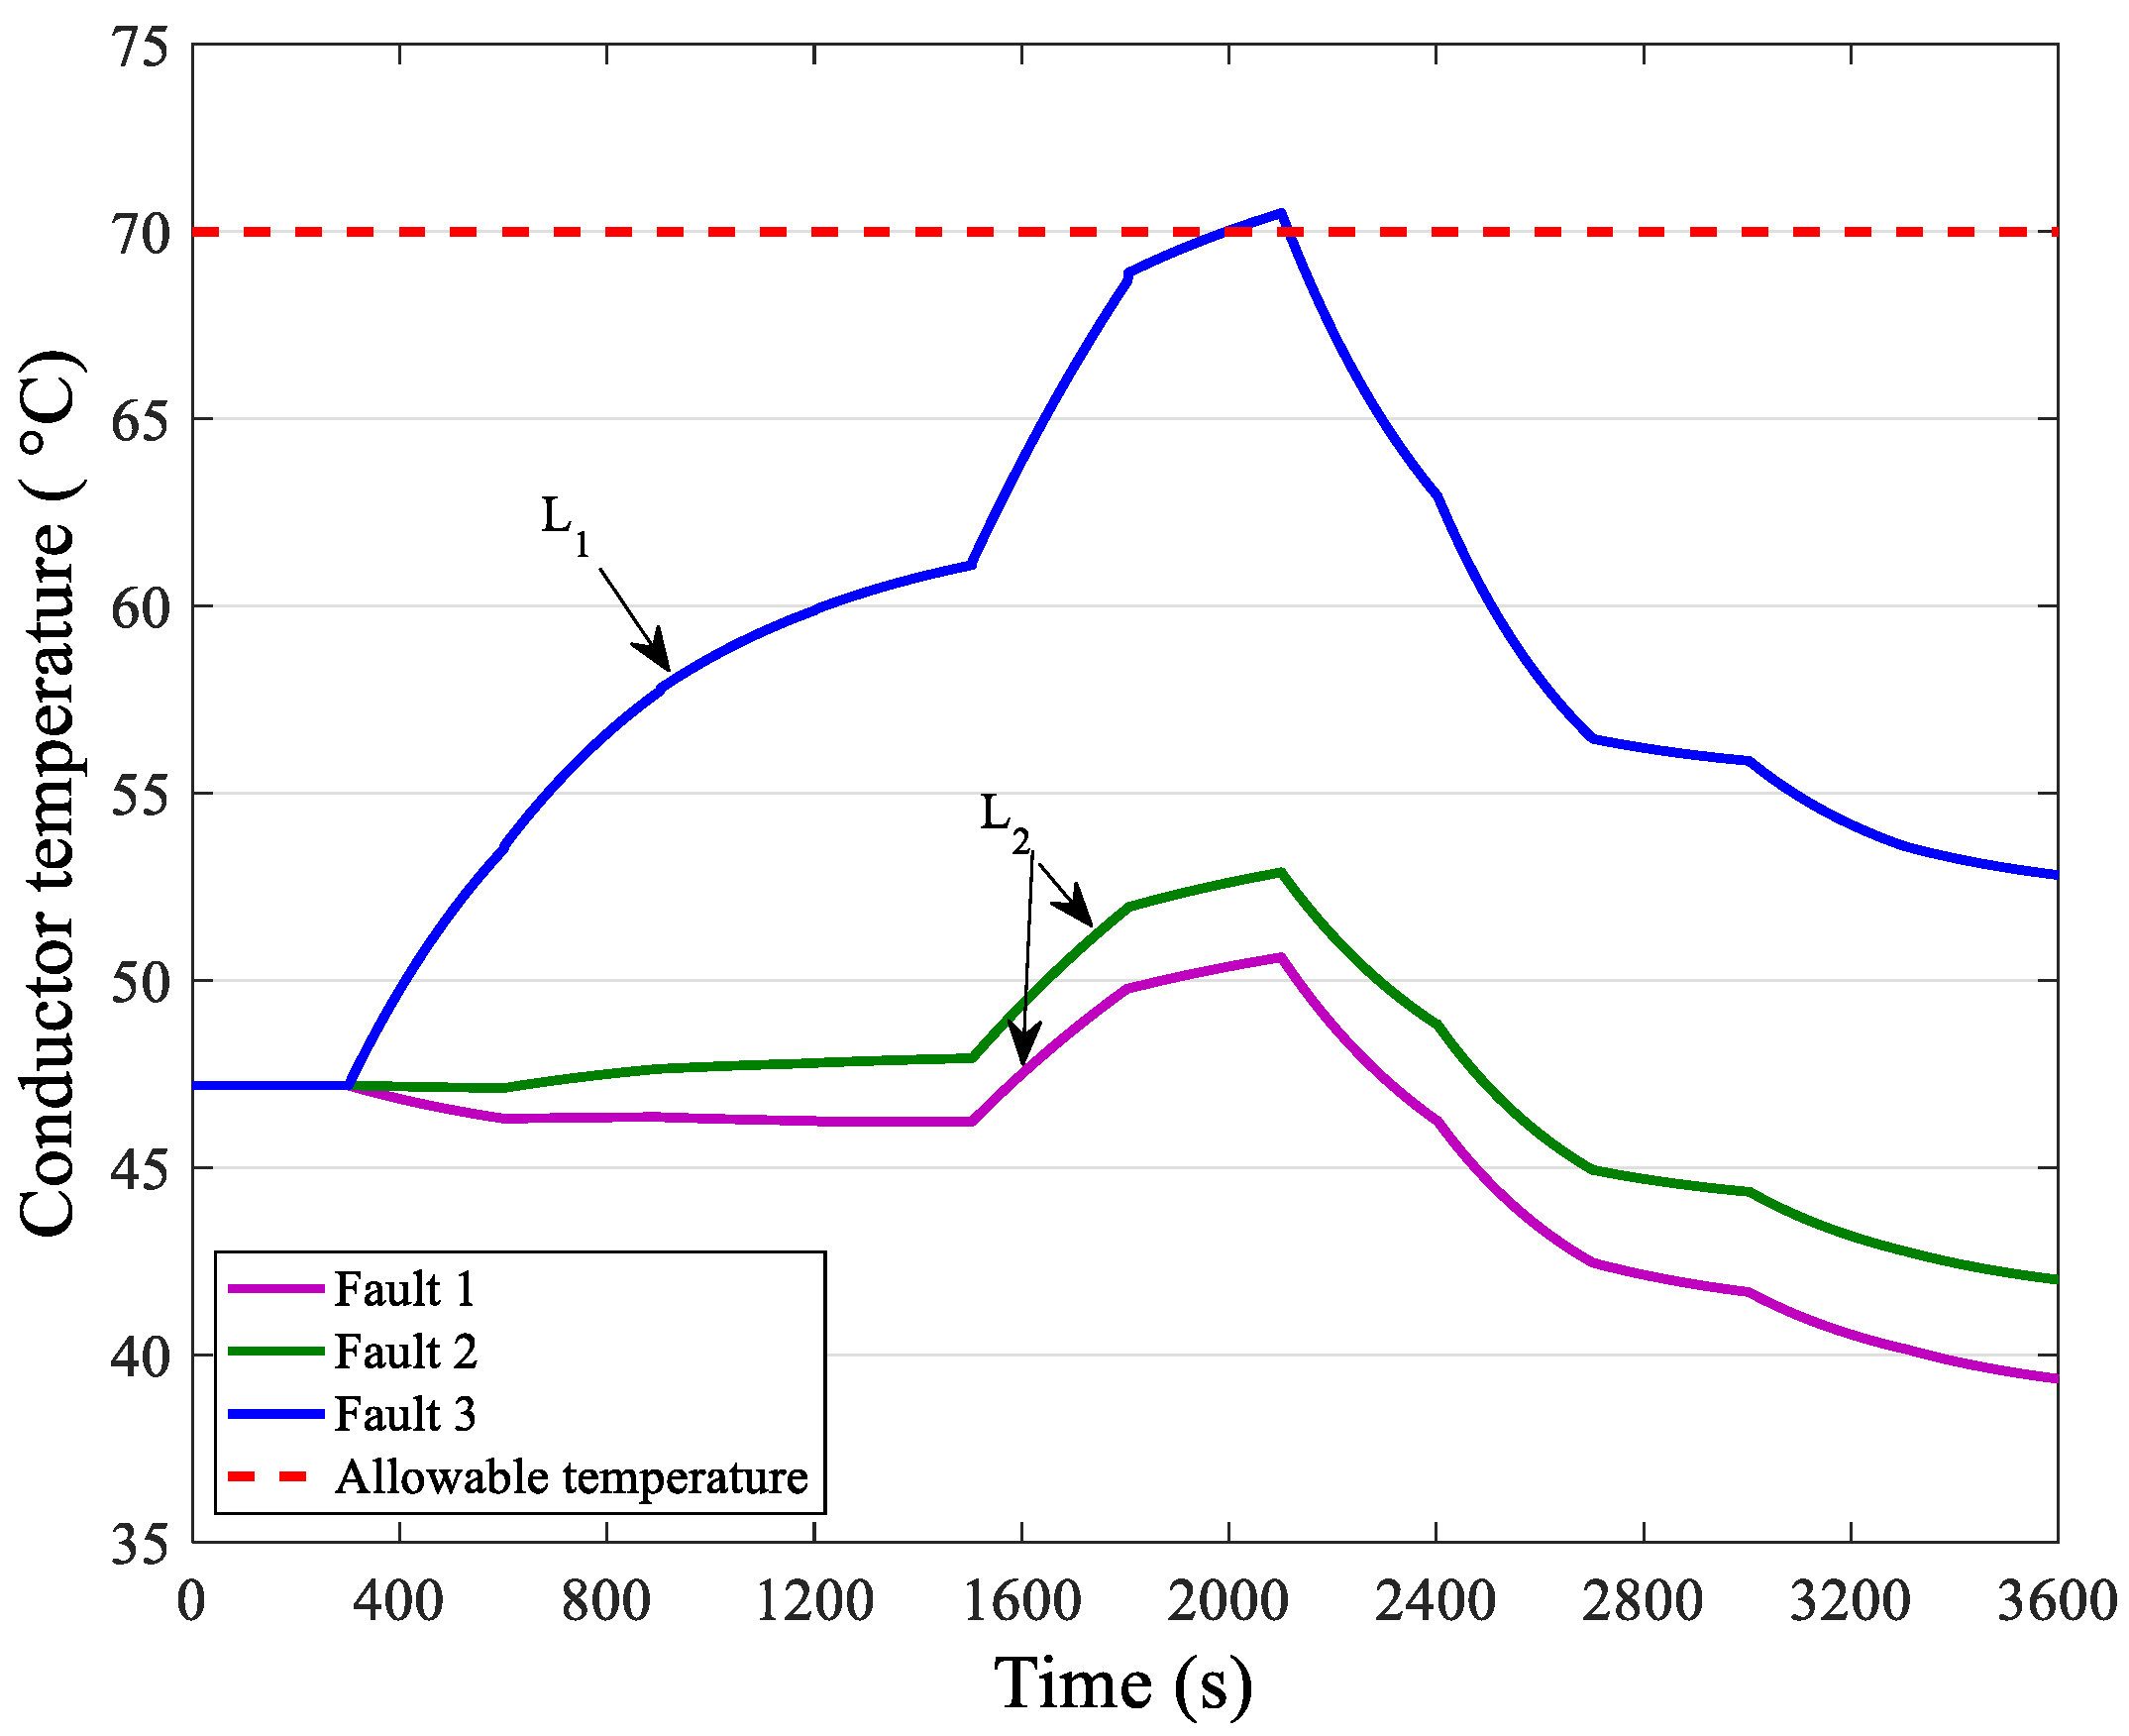
According to the time resolution of meteorological data, the conductor temperatures are divided. The conductor temperatures are analyzed with a line fault. Figure 11 shows the changes of conductor temperature after the occurrence of the fault.
In fault 1, although the current value of L2 is 617.2 A which exceeds STR, it never exceeds the safety limit of yearly rating of 671.0 A. Therefore, the warning signal will not be sent out and the conductor temperature is much smaller than the thermal limit. In fault 2, the current value of L2 is 723.4 A, which exceeds the safety limit of yearly rating. A warning signal will be sent out after 300s. At the same time, the conductor temperature module shows that the conductor temperature is always in allowable range. Therefore, the regulatory signal will not be sent out and it is non-essential to adjust the generator or load. In fault 3, the conductor temperature of L1 is 1065.6 A after 310s, which is much greater than the safety limit of yearly rating. In addition, it can be seen form Figure 11 that the conductor temperature of L1 exceeds the maximum limit at 1995s to cause overload. Meanwhile, the warning and regulatory signals will be sent out at 300s and 1995s, respectively, as shown in Figure 12.
Due to the hysteresis of conductor temperature, the warning and regulatory signals are 28 min apart, which means the managers have enough time to make decision after receiving the warning signal. If the system returns to normal operation within 28 min, there is no need to issue a regulatory signal. If the fault cannot be effectively removed within 28 min, the following methods are adopted according to the power flow after receiving the regulatory signal at 1995s. First, regulate the generator. Open L16 in 0.1s to complete trip protection of generator G5. The current on L1 reduces to 617.5 A, however, it is still the largest. Second, cut the load. After receiving the regulatory signal, the load P1 is cut off and the current on L1 reduces to 663.1 A. The two methods make the current value of L1 fall within the safety limit of the yearly rating to ensure the system security. The current value in the second method is slightly higher than that in the first one. The current and conductor temperature change of L1 are shown in Figure 13.
As shown in Figure 13, the conductor temperature is always lower than 70 °C and runs in safety after regulating the generation side or the load side after fault 3, indicating the congestion management based on yearly rating is effective. The analysis is based on the severe meteorological conditions in 2016. It is feasible to use the yearly rating under the severe meteorological conditions, indicating that the yearly rating can be applied to other meteorological conditions.
Because the difference between the winter rating and the yearly rating is the largest, the winter rating is used to verify the effective of QDR. The meteorological data at 8 a.m. on February 26, 2016 are chosen as the most conservative in winter. The change of meteorological parameters is shown in Table 8.
The ampacity of transmission lines is higher in winter. As shown in Figure 14, the conductor temperature in three faults does not exceed the safety limit in this case. The current value of L1 is 1065.6 A in fault 3, which exceeds the safety limit of the winter rating of 915.8 A. The conductor temperature in three faults does not exceed the safety limit in this case. As shown in Figure 14, the current value of L1 in fault 3 exceeds the safety limit of the winter rating. The conductor temperature peaks at 1806s and later, there is no significant change in conductor temperature. The conductor temperature does not reach the thermal limit after the fault has occurred, so a warning signal is sent out without other actions. Therefore, it is completely feasible to take QDR as the reference for overheating alarm, which not only overcomes the conservation of STR, but also improves the accuracy of the trip protection. Taking the conductor temperature as the main basis for judging the thermal overload of transmission lines can provide safety operation time for fault repairing and improve the accuracy of congestion management.
6. Conclusions
In this paper, a method of transmission congestion management based on QDR is proposed, which integrates QDR technology into the trip protection scheme. The trip protection, based on the characteristic that the thermal time constant is greater than the electrical time constant, can provide sufficient dispatching time for managers without affecting the safety of system. This method predictably regulates the load pressure of line faults by trip protection to alleviate transmission congestion. A warning signal will be sent out to inform managers the overload. The method can improve the accuracy of transmission congestion alarm judgment and can be widely used in power system detection, protection and control. Increasing transmission capacity under real-time weather conditions, providing sufficient time for decision-making, and reducing unnecessary trip protection and load shedding are conducive to improve the utilization of existing transmission lines and economic benefits.
Author Contributions
Conceptualization, Y.W.; Methodology, Z.S.; Writing-original draft, Z.Y.; Writing-review and editing, L.L., F.S. and Z.N.
Funding
This research was funded by the National Natural Science Foundation of China, grant number 51641702, the Science and Technology Development Project of Shandong Province, China, grant number ZR2015ZX045, and the Science and Technology Development Project of Weihai City, China, grant number 2018DXGJ05.
Acknowledgments
We gratefully acknowledge the technical assistance of DL850E ScopeCorder.
Conflicts of Interest
The authors declare no conflict of interest.
References
- Teh, J.; Ooi, C.A.; Cheng, Y.H. Composite reliability evaluation of load demand side management and dynamic thermal rating systems. Energies 2018, 11, 466. [Google Scholar] [CrossRef]
- Zafran, M.; Arbab, M.N.; Ahmad, I. A Case Study on Alleviating Electric Transmission Congestion Using Dynamic Thermal Rating Methodology. In Proceedings of the IEEE International Conference on Energy Systems and Policies, Islamabad, Pakistan, 24–26 November 2014; pp. 1–6. [Google Scholar]
- Anusha, P.; Prabhakar, K.S.; Kothari, D.P. Congestion management in power systems—A review. Int. J. Elec. Power 2015, 70, 83–90. [Google Scholar] [CrossRef]
- Sun, Q.; Peng, J.C.; Pan, J.T.; Li, P. Congestion management considering multi-time interval demand response. Power Syst. Technol. 2010, 34, 139–143. [Google Scholar] [CrossRef]
- Madani, V.; Adamiak, M.; Imai, S. IEEE PSRC report on global industry experiences with system integrity protection schemes. IEEE Trans. Power Deliv. 2010, 25, 2143–2155. [Google Scholar] [CrossRef]
- Cong, Y.; Regulski, P.; Wall, P. On the use of dynamic thermal-line ratings for improving operational tripping schemes. IEEE Trans. Power Deliv. 2016, 31, 1891–1900. [Google Scholar] [CrossRef]
- Heckenbergerová, J.; Musilek, P.; Filimonenkov, K. Quantification of gains and risks of static thermal rating based on typical meteorological year. Int. J. Elec. Power 2013, 44, 227–235. [Google Scholar] [CrossRef]
- Jiashen, T.; Ching-Ming, L.; Nor, A.M.; Chia, A.O.; Yu-Huei, C. Prospects of using the dynamic thermal rating system for reliable electrical networks: A review. IEEE Access 2018, 6, 26765–26778. [Google Scholar] [CrossRef]
- Zhang, H.; Du, M.; Zhao, Q.; Wei, Z.; Zhang, Q. Security Constrained Economic Dispatch with Dynamic Thermal Rating Technology Integration. In Proceedings of the IEEE International Conference on Power and Renewable Energy, Shanghai, China, 21–23 October 2016; pp. 709–713. [Google Scholar]
- Ying, Z.F.; Chen, Y.S.; Feng, K. New DTR estimation method without measured solar and wind data. J. Electr. Eng. Technol. 2017, 12, 576–585. [Google Scholar] [CrossRef]
- Capitanescu, F.; Cutsem, T.V. A unified management of congestions due to voltage instability and thermal overload. Electr. Power Syst. Res. 2007, 77, 1274–1283. [Google Scholar] [CrossRef]
- Qiu, F.; Wang, J. Distributionally robust congestion management with dynamic line ratings. IEEE Trans. Power Syst. 2015, 30, 2198–2199. [Google Scholar] [CrossRef]
- Jiang, J.A.; Wan, J.J.; Zheng, X.Y. A novel weather information-based optimization algorithm for thermal sensor placement in smart grid. IEEE Trans. Smart Grid 2018, 9, 911–922. [Google Scholar] [CrossRef]
- Teh, J.; Cotton, I. Critical span identification model for dynamic thermal rating system placement. IET Gener. Transm. Distrib. 2015, 9, 2644–2652. [Google Scholar] [CrossRef]
- Matus, M.; Saez, D.; Favley, M. Identification of critical spans for monitoring systems in dynamic thermal rating. IEEE Trans. Power Deliv. 2012, 27, 1002–1009. [Google Scholar] [CrossRef]
- Kosec, G.; Maksić, M.; Djurica, V. Dynamic thermal rating of power lines—model and measurements in rainy conditions. Int. J. Elec. Power 2017, 91, 222–229. [Google Scholar] [CrossRef]
- EPRI. Increased Power Flow through Transmission Circuits: Overhead Line Case Studies and Quasi-Dynamic Rating; EPRI Technical Report; EPRI: Palo Alto, CA, USA, 2006. [Google Scholar]
- Esfahani, M.M.; Yousefi, G.R. Real time congestion management in power systems considering quasi-dynamic thermal rating and congestion clearing time. IEEE Trans. Ind. Inf. 2016, 12, 745–754. [Google Scholar] [CrossRef]
Figure 1.
The frequency distribution histogram of wind speed.

Figure 2.
The frequency distribution histogram of ambient temperatures.

Figure 3.
The flow chart of quasi-dynamic thermal rating driven by meteorological data.

Figure 4.
The results of quasi-dynamic thermal ratings under confidence level of 95%.

Figure 5.
Design of transmission congestion management based on quasi-dynamic thermal rating.

Figure 6.
The structure of 14-bus system.

Figure 7.
Current variation of fault 1.

Figure 8.
Current variation of fault 2.

Figure 9.
Current variation of fault 3.

Figure 10.
Circuit breaker signals of fault 3.

Figure 11.
Change of conductor temperature after fault.

Figure 12.
Warning and regulatory signals.

Figure 13.
Change of conductor temperature after load shedding.

Figure 14.
Change of conductor temperature after fault (winter).


Table 1.
Meteorological parameter thresholds and quasi-dynamic thermal ratings under confidence level of 95%.
Table 1.
Meteorological parameter thresholds and quasi-dynamic thermal ratings under confidence level of 95%.
| Time Scale | Wind Speed (m/s) | Ambient Temperature (°C) | QDR (A) | Time Scale | Wind Speed (m/s) | Ambient Temperature (°C) | QDR (A) |
|---|---|---|---|---|---|---|---|
| year | 2.2 | 27.2 | 1109.9 | ||||
| spring | 2.5 | 23.2 | 1236.2 | March | 2.4 | 14.4 | 1341.3 |
| April | 2.4 | 20.5 | 1258.7 | ||||
| May | 2.7 | 26.5 | 1216.4 | ||||
| summer | 1.8 | 30.2 | 1016.5 | June | 2.2 | 28.3 | 1113.1 |
| July | 1.8 | 30.4 | 1013.6 | ||||
| August | 1.6 | 30.9 | 979.3 | ||||
| autumn | 2.1 | 24.7 | 1149.0 | September | 2.0 | 26.8 | 1101.6 |
| October | 2.4 | 21.8 | 1240.1 | ||||
| November | 2.2 | 15.4 | 1292.6 | ||||
| winter | 2.2 | 6.8 | 1399.7 | December | 2.3 | 7.6 | 1409.3 |
| January | 2.2 | 5.4 | 1416.3 | ||||
| February | 2.3 | 6.9 | 1417.8 |
Table 2.
Generator parameters.
| Number | Type | Node Voltage (p. u.) | Active Power (p. u.) |
|---|---|---|---|
| 1 | slack | 1.06 | 3.41 |
| 2 | PV | 1.045 | 0.86 |
| 3 | PV | 1.01 | 1.8 |
| 4 | PV | 1.025 | 1.25 |
| 5 | PV | 1.07 | 0.95 |
Table 3.
Transmission line and transformer parameters.
| Branch | Type | Resistance (p. u.) | Reactance (p. u.) | Susceptance (p. u.) |
|---|---|---|---|---|
| L1 | Transmission line | 0.0163 | 0.0837 | 0.0681 |
| L2 | 0.0244 | 0.1255 | 0.1022 | |
| L3 | 0.0408 | 0.2092 | 0.1703 | |
| L4 | 0.0326 | 0.1674 | 0.1362 | |
| L5 | 0.0489 | 0.2511 | 0.2043 | |
| L6 | 0.0163 | 0.0837 | 0.0681 | |
| L7 | 0.0978 | 0.5022 | 0.4086 | |
| L8 | 0.1565 | 0.8035 | 0.6538 | |
| L9 | 0.1252 | 0.6428 | 0.5230 | |
| L10 | 0.0326 | 0.1674 | 0.1362 | |
| L11 | 0.0782 | 0.4018 | 0.3269 | |
| L12 | 0.0587 | 0.3013 | 0.2452 | |
| L13 | 0.0326 | 0.1674 | 0.1362 | |
| L14 | 0.0326 | 0.1674 | 0.1362 | |
| L15 | 0.0626 | 0.3214 | 0.2615 | |
| L16 | 0.1252 | 0.6428 | 0.5230 | |
| L17 | 0.1565 | 0.8035 | 0.6538 | |
| L18 | Transformer | 0 | 0.2520 | 0 |
| L19 | 0 | 0.2091 | 0 | |
| L20 | 0 | 0.5562 | 0 |
Table 4.
Load parameters.
| Number | Node | Active Power (p. u.) | Reactive Power (p. u.) |
|---|---|---|---|
| 1 | 2 | 1.36 | 0.13 |
| 2 | 3 | 0.94 | 0.15 |
| 3 | 4 | 0.48 | −0.3 |
| 4 | 5 | 0.9 | 0.2 |
| 5 | 6 | 0.9 | 0.35 |
| 6 | 9 | 1.26 | 0.35 |
| 7 | 10 | 0.09 | 0.04 |
| 8 | 11 | 0.04 | 0.01 |
| 9 | 12 | 0.15 | 0.03 |
| 10 | 13 | 1.13 | 0.25 |
| 11 | 14 | 0.14 | 0.05 |
Table 5.
Branch current.
| Branch | Current (A) |
|---|---|
| L1 | 402.8 |
| L2 | 528.6 |
| L13 | 390.9 |
| L15 | 548.6 |
| L18 | 434.3 |
Table 6.
Safety limit of quasi-dynamic thermal rating.
| Time Scale | Rating (A) | Safety Limit (A) | Time Scale | Rating (A) | Safety Limit (A) |
|---|---|---|---|---|---|
| year | 745.5 | 671.0 | STR | 592 | |
| spring | 833.9 | 750.5 | March | 866.1 | 779.5 |
| April | 872.0 | 784.8 | |||
| May | 867.6 | 780.8 | |||
| summer | 685.2 | 616.7 | June | 744.8 | 670.3 |
| July | 681.5 | 613.4 | |||
| August | 672.9 | 605.6 | |||
| autumn | 780.8 | 702.7 | September | 762.4 | 686.2 |
| October | 809.6 | 728.6 | |||
| November | 884.9 | 796.4 | |||
| winter | 1017.5 | 915.8 | December | 977.0 | 879.3 |
| January | 1136.9 | 1023.2 | |||
| February | 1041.1 | 937.0 |
Table 7.
Meteorological data around the line in one hour.
| Time (s) | Wind Speed (m/s) | Ambient Temperature (°C) |
|---|---|---|
| 0–300 | 1.8 | 31.3 |
| 301–600 | 2.2 | 31.1 |
| 601-900 | 1.8 | 30.9 |
| 901–1200 | 1.8 | 30.6 |
| 1201–1500 | 1.8 | 30.7 |
| 1501–1800 | 0.4 | 31.1 |
| 1801–2100 | 0.9 | 31.6 |
| 2101–2400 | 3.1 | 31.5 |
| 2401–2700 | 4.5 | 30.6 |
| 2701–3000 | 3.1 | 30.1 |
| 3001–3300 | 4.0 | 29.3 |
| 3301–3600 | 3.6 | 28.5 |
Table 8.
Meteorological data of rating in winter.
| Time (s) | Wind Speed (m/s) | Ambient Temperature (°C) |
|---|---|---|
| 0–300 | 1.3 | 11.1 |
| 301–600 | 1.3 | 10.7 |
| 601–900 | 1.8 | 10.2 |
| 901–1200 | 0.9 | 9.9 |
| 1201–1500 | 0.4 | 10.7 |
| 1501–1800 | 0.4 | 11.6 |
| 1801–2100 | 0.9 | 12.1 |
| 2101–2400 | 0.9 | 12.0 |
| 2401–2700 | 0.9 | 11.8 |
| 2701–3000 | 0.9 | 11.6 |
| 3001–3300 | 1.3 | 11.2 |
| 3301–3600 | 0.9 | 10.9 |
© 2019 by the authors. Licensee MDPI, Basel, Switzerland. This article is an open access article distributed under the terms and conditions of the Creative Commons Attribution (CC BY) license (http://creativecommons.org/licenses/by/4.0/).
Share and Cite
MDPI and ACS Style
Wang, Y.; Sun, Z.; Yan, Z.; Liang, L.; Song, F.; Niu, Z. Power Transmission Congestion Management Based on Quasi-Dynamic Thermal Rating. Processes 2019, 7, 244. https://doi.org/10.3390/pr7050244
AMA Style
Wang Y, Sun Z, Yan Z, Liang L, Song F, Niu Z. Power Transmission Congestion Management Based on Quasi-Dynamic Thermal Rating. Processes. 2019; 7(5):244. https://doi.org/10.3390/pr7050244
Chicago/Turabian StyleWang, Yanling, Zidan Sun, Zhijie Yan, Likai Liang, Fan Song, and Zhiqiang Niu. 2019. "Power Transmission Congestion Management Based on Quasi-Dynamic Thermal Rating" Processes 7, no. 5: 244. https://doi.org/10.3390/pr7050244
Note that from the first issue of 2016, this journal uses article numbers instead of page numbers. See further details here.