Artificial Neural Networks Approach for a Multi-Objective Cavitation Optimization Design in a Double-Suction Centrifugal Pump


1
National Research Center of Pumps, Jiangsu University, Zhenjiang 212013, China
2
Mechanical Engineering Department, Wa Polytechnic, Wa, Upper West, Ghana
*
Author to whom correspondence should be addressed.
Processes 2019, 7(5), 246; https://doi.org/10.3390/pr7050246
Submission received: 4 April 2019
/
Revised: 22 April 2019
/
Accepted: 24 April 2019
/
Published: 27 April 2019
(This article belongs to the Special Issue Advances in Theoretical and Computational Energy Optimization Processes)
Abstract
:Double-suction centrifugal pumps are widely used in industrial and agricultural applications since their flow rate is twice that of single-suction pumps with the same impeller diameter. They usually run for longer, which makes them susceptible to cavitation, putting the downstream components at risk. A fast approach to predicting the Net Positive Suction Head required was applied to perform a multi-objective optimization on the double-suction centrifugal pump. An L32 (84) orthogonal array was designed to evaluate 8 geometrical parameters at 4 levels each. A two-layer feedforward neural network and genetic algorithm was applied to solve the multi-objective problem into pareto solutions. The results were validated by numerical simulation and compared to the original design. The suction performance was improved by 7.26%, 3.9%, 4.5% and 3.8% at flow conditions 0.6Qd, 0.8Qd, 1.0Qd and 1.2Qd respectively. The efficiency increased by 1.53% 1.0Qd and 1.1% at 0.8Qd. The streamline on the blade surface was improved and the vapor volume fraction of the optimized impeller was much smaller than that of the original impeller. This study established a fast approach to cavitation optimization and a parametric database for both hub and shroud blade angles for double suction centrifugal pump optimization design.
1. Introduction
Over recent years, pump manufacturers have intensified their quest to rapidly develop cost-competitive and high-performance pumps with compact and robust structures to meet consumer’s limitless demands for high end centrifugal pumps, since they offer wide-ranging stable operation both in industrial and agricultural applications. As such, double-suction centrifugal pumps are widely used in various fields, since their flow rate is twice that of single-suction pumps with the same impeller diameter [1]. For systems with large capacity demands, the pumps are usually run for longer periods, making them very susceptible to cavitation; this puts downstream components at risk of being damaged, since, in most cases, the flow passage gets blocked by cavitation bubbles [2].
Recent advances in the design of centrifugal pump systems does not only require energy efficient and quieter systems, but also reductions in design time and lower costs. Engineers have therefore devised optimization methods and algorithms with numerical simulations so that optimization does not rely solely on the designer’s experience [3]. Aside from the optimization algorithms there are other approaches to optimization, such as the experimental design known as the design of experiment (DOE) method, and the application of meta-models as surrogates for optimization [4]. Pei et al. [5] applied the L9 (33) orthogonal design of experiments and computational methods to optimize the cavitation performance in a centrifugal pump to reduce the required Net Positive Suction Head (NPSHr) by 0.63 m. A cavitation performance optimization was also carried out on a large-scale axial flow pump using orthogonal DOE to reduce the cavity length and vapor volume fraction [6]. Nataraj et al. [7] used the Taguchi test design (ODOE) and numerical simulations to optimize the design of the centrifugal pump impeller. Xu et al. [8] conducted a multi-objective and multi-parameter optimization study of a using Taguchi method. The optimized impeller increased in efficiency by 3.09% and reduced critical cavitation point by 1.45 m. Also, the Response Surface Method, Kriging Model and Artificial Neural Networks are popular surrogate models that have been applied in centrifugal pump optimization design [9,10,11]. Jin et al. [12] compared various surrogate models based on several defined criteria, including prediction accuracy, efficiency, and robustness, and concluded that a neural network should be used for higher-order nonlinear problems. Artificial Neural Networks (ANNs) abstract the human brain’s vegetative cell network from the angle of data process, establish an easy model, and form completely different networks which are in step with different affiliation strategies. ANNs have been applied in turbomachinery by various researchers [13,14,15,16]. Pei et al. [17] carried out a multi-objective optimization on the inlet pipe shape of a vertical inline pump and using an ANN and Multi-Objective Generic Algorithm (MOGA) to increase the efficiency over a wide range.
During cavitation optimization designs, a numerical process of optimizing a collection of individual objective functions is simultaneously performed [5,18]. The process involves the calculation of several test cases to determine the NPSHr for each case, which consumes a lot of computational time. Traditionally, during the use of Computational Fluid Dynamics (CFD) for cavitation simulations, the common practice has been to set the inlet boundary to total pressure, while the boundary at the outlet is fixed to the volume flow rate. Although this boundary set has been fruitfully implemented in numerical simulations with and without cavitation models, the choosing of total inlet pressure relies on guesswork if there is no foreknowledge of the NPSHr range [19,20,21,22]. This approach usually requires about 10–15 independent simulations before good accuracy is reached [21,23]. Moreover, this pure guessing game is likely to draw the simulation into severe cavitation conditions, which takes much longer times to converge, especially in situations where transient simulations are required to acquire the necessary accuracy. [24,25]. A recent approach proposed by Ding et al. [26] introduced a controllable and more predictable simulation procedure where the traditional boundary set were substituted by introducing a new boundary pair and an algorithm developed to estimate a good value for a static pressure that correlated to a 3% drop in pump head. The procedure predicted NPSHr at a head drop of 3.3% just in three simulation steps in an industrial centrifugal pump. Despite the fact that this novel approach proved numerically stable for simulating cavitation flows, the application of this method in cavitation flow simulations has been very rare, and has not been applied to the double-suction pump.
In this study, a fast approach to NPSHr prediction was used to perform a multi-objective cavitation design optimization first to improve hydraulic efficiency and secondly to improve the suction performance of the double-suction centrifugal pump. The choice of decision variables was centered on the impeller hub and shroud angles, since there have been several cavitation performance enhancement studies on the blade inlet angle. An L32 (84) orthogonal array was designed to evaluate 8 geometrical parameters at 4 levels each. A two-layer feedforward neural network and genetic algorithm was applied to solve the multi-objective problem into 2D pareto-frontier solutions that meet the objective functions. The study established a fast approach to cavitation optimization design and also created a parametric database of the impeller hub and shroud blade angles for the double-suction centrifugal pump optimization design.
2. Description of Computational Domain
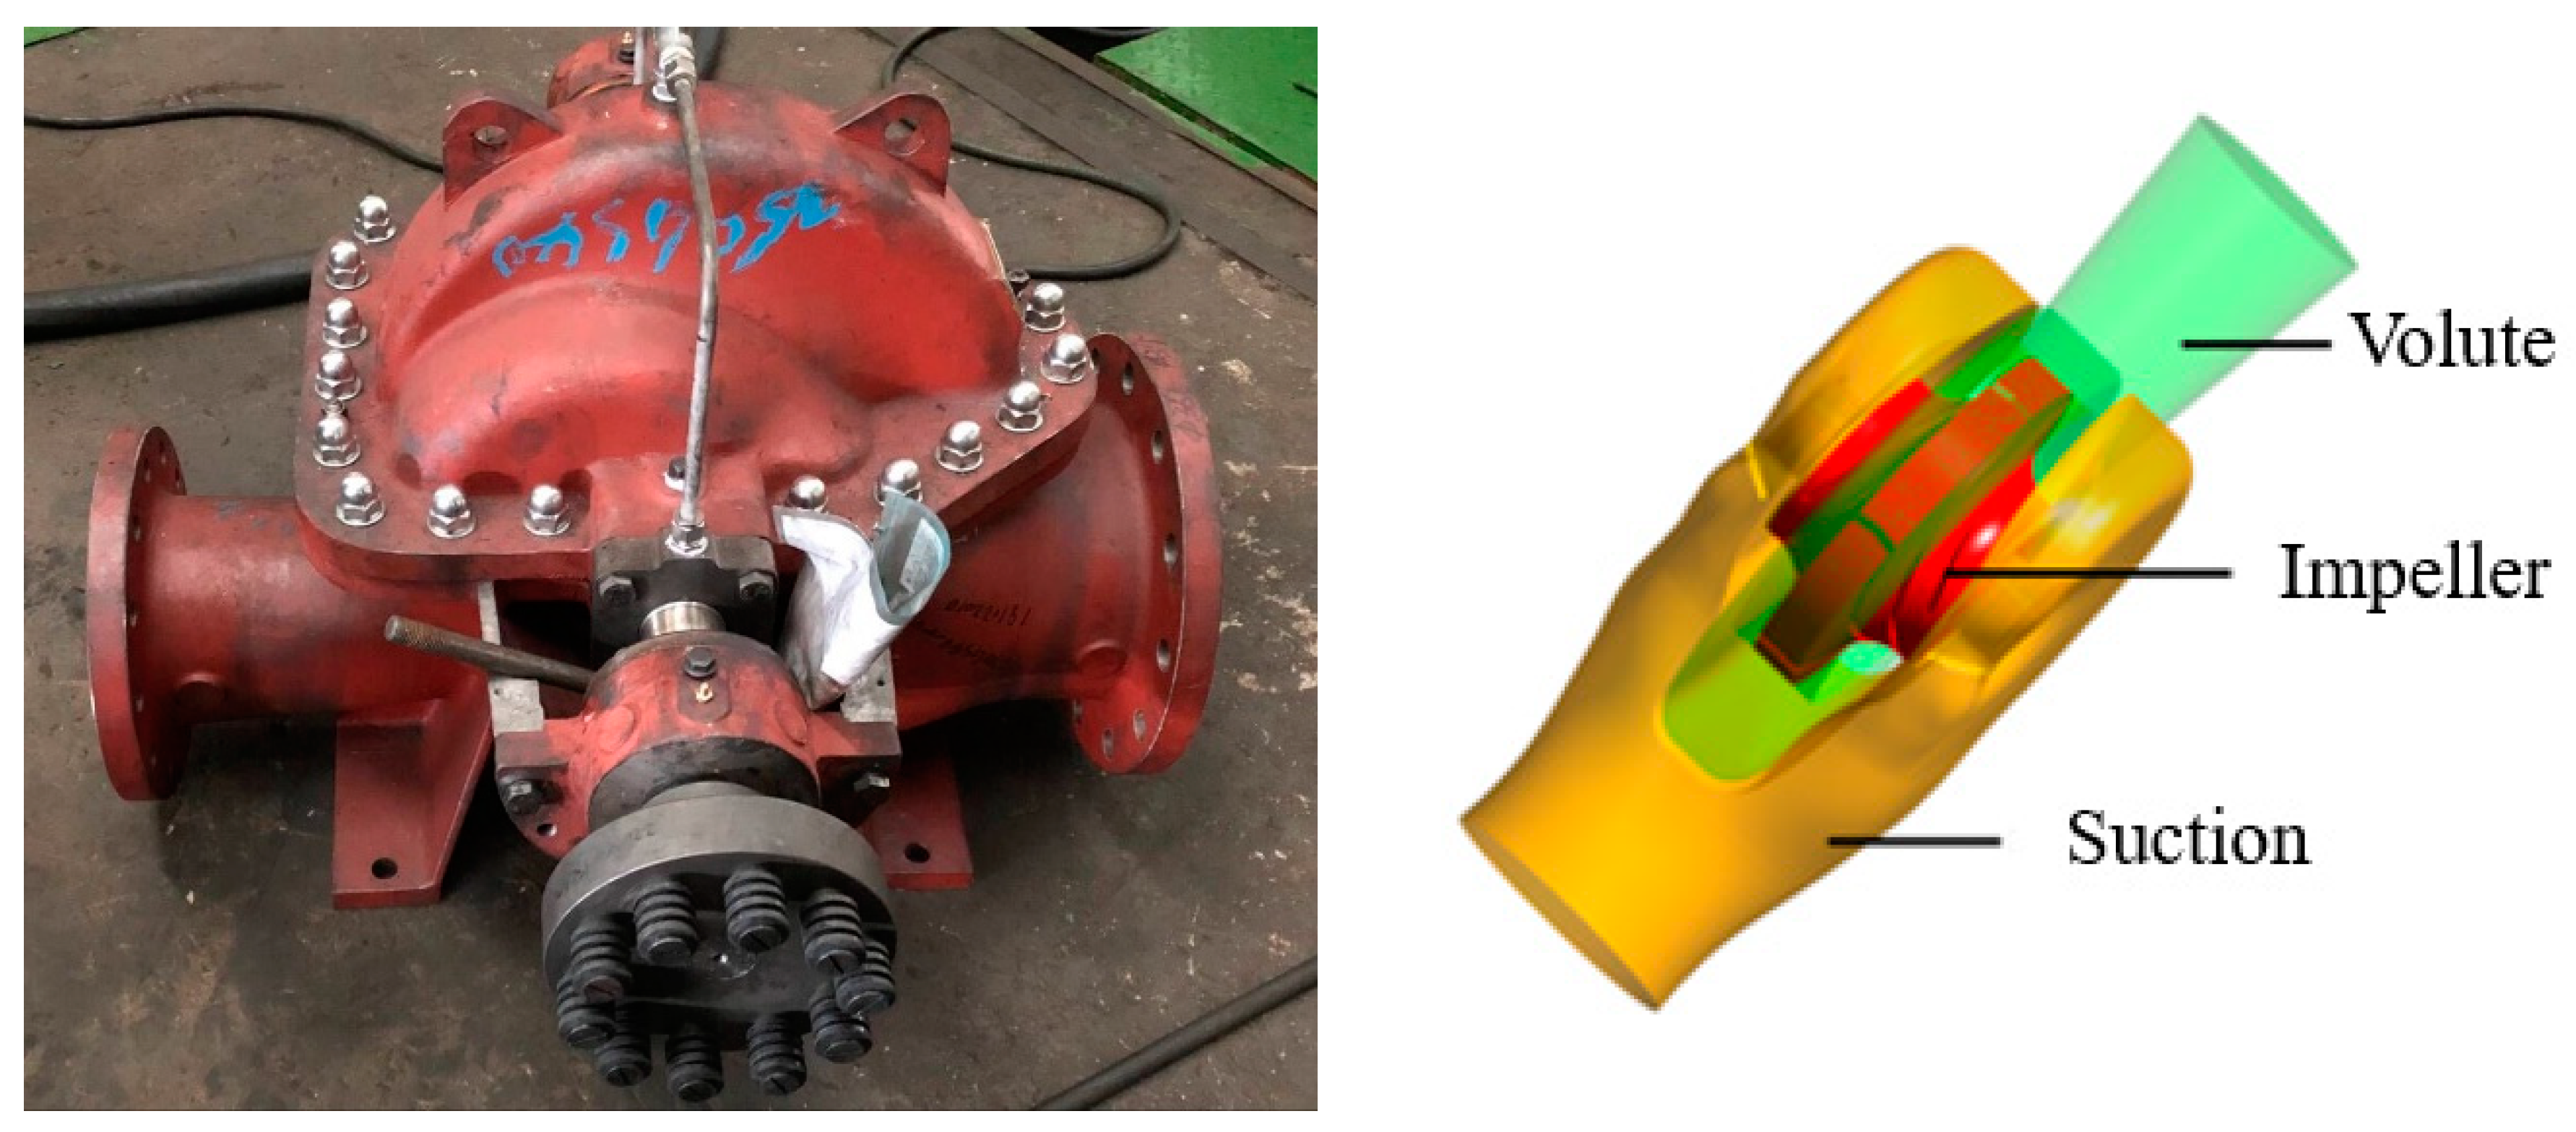
The 250GS40 double-suction centrifugal pump (Figure 1) was developed with PTC Creo parametric 4.0 (Boston, MA, United States). It was designed according to a specific speed of 126.57. It has a shrouded impeller with six twisted blades. The spiral suction domain has flow directing baffles to de-swirl the flow towards the impeller eye. The pump has a single volute; Table 1 presents the design specifics of the pump.
2.1. Computational Grid and Mesh Sensitivity
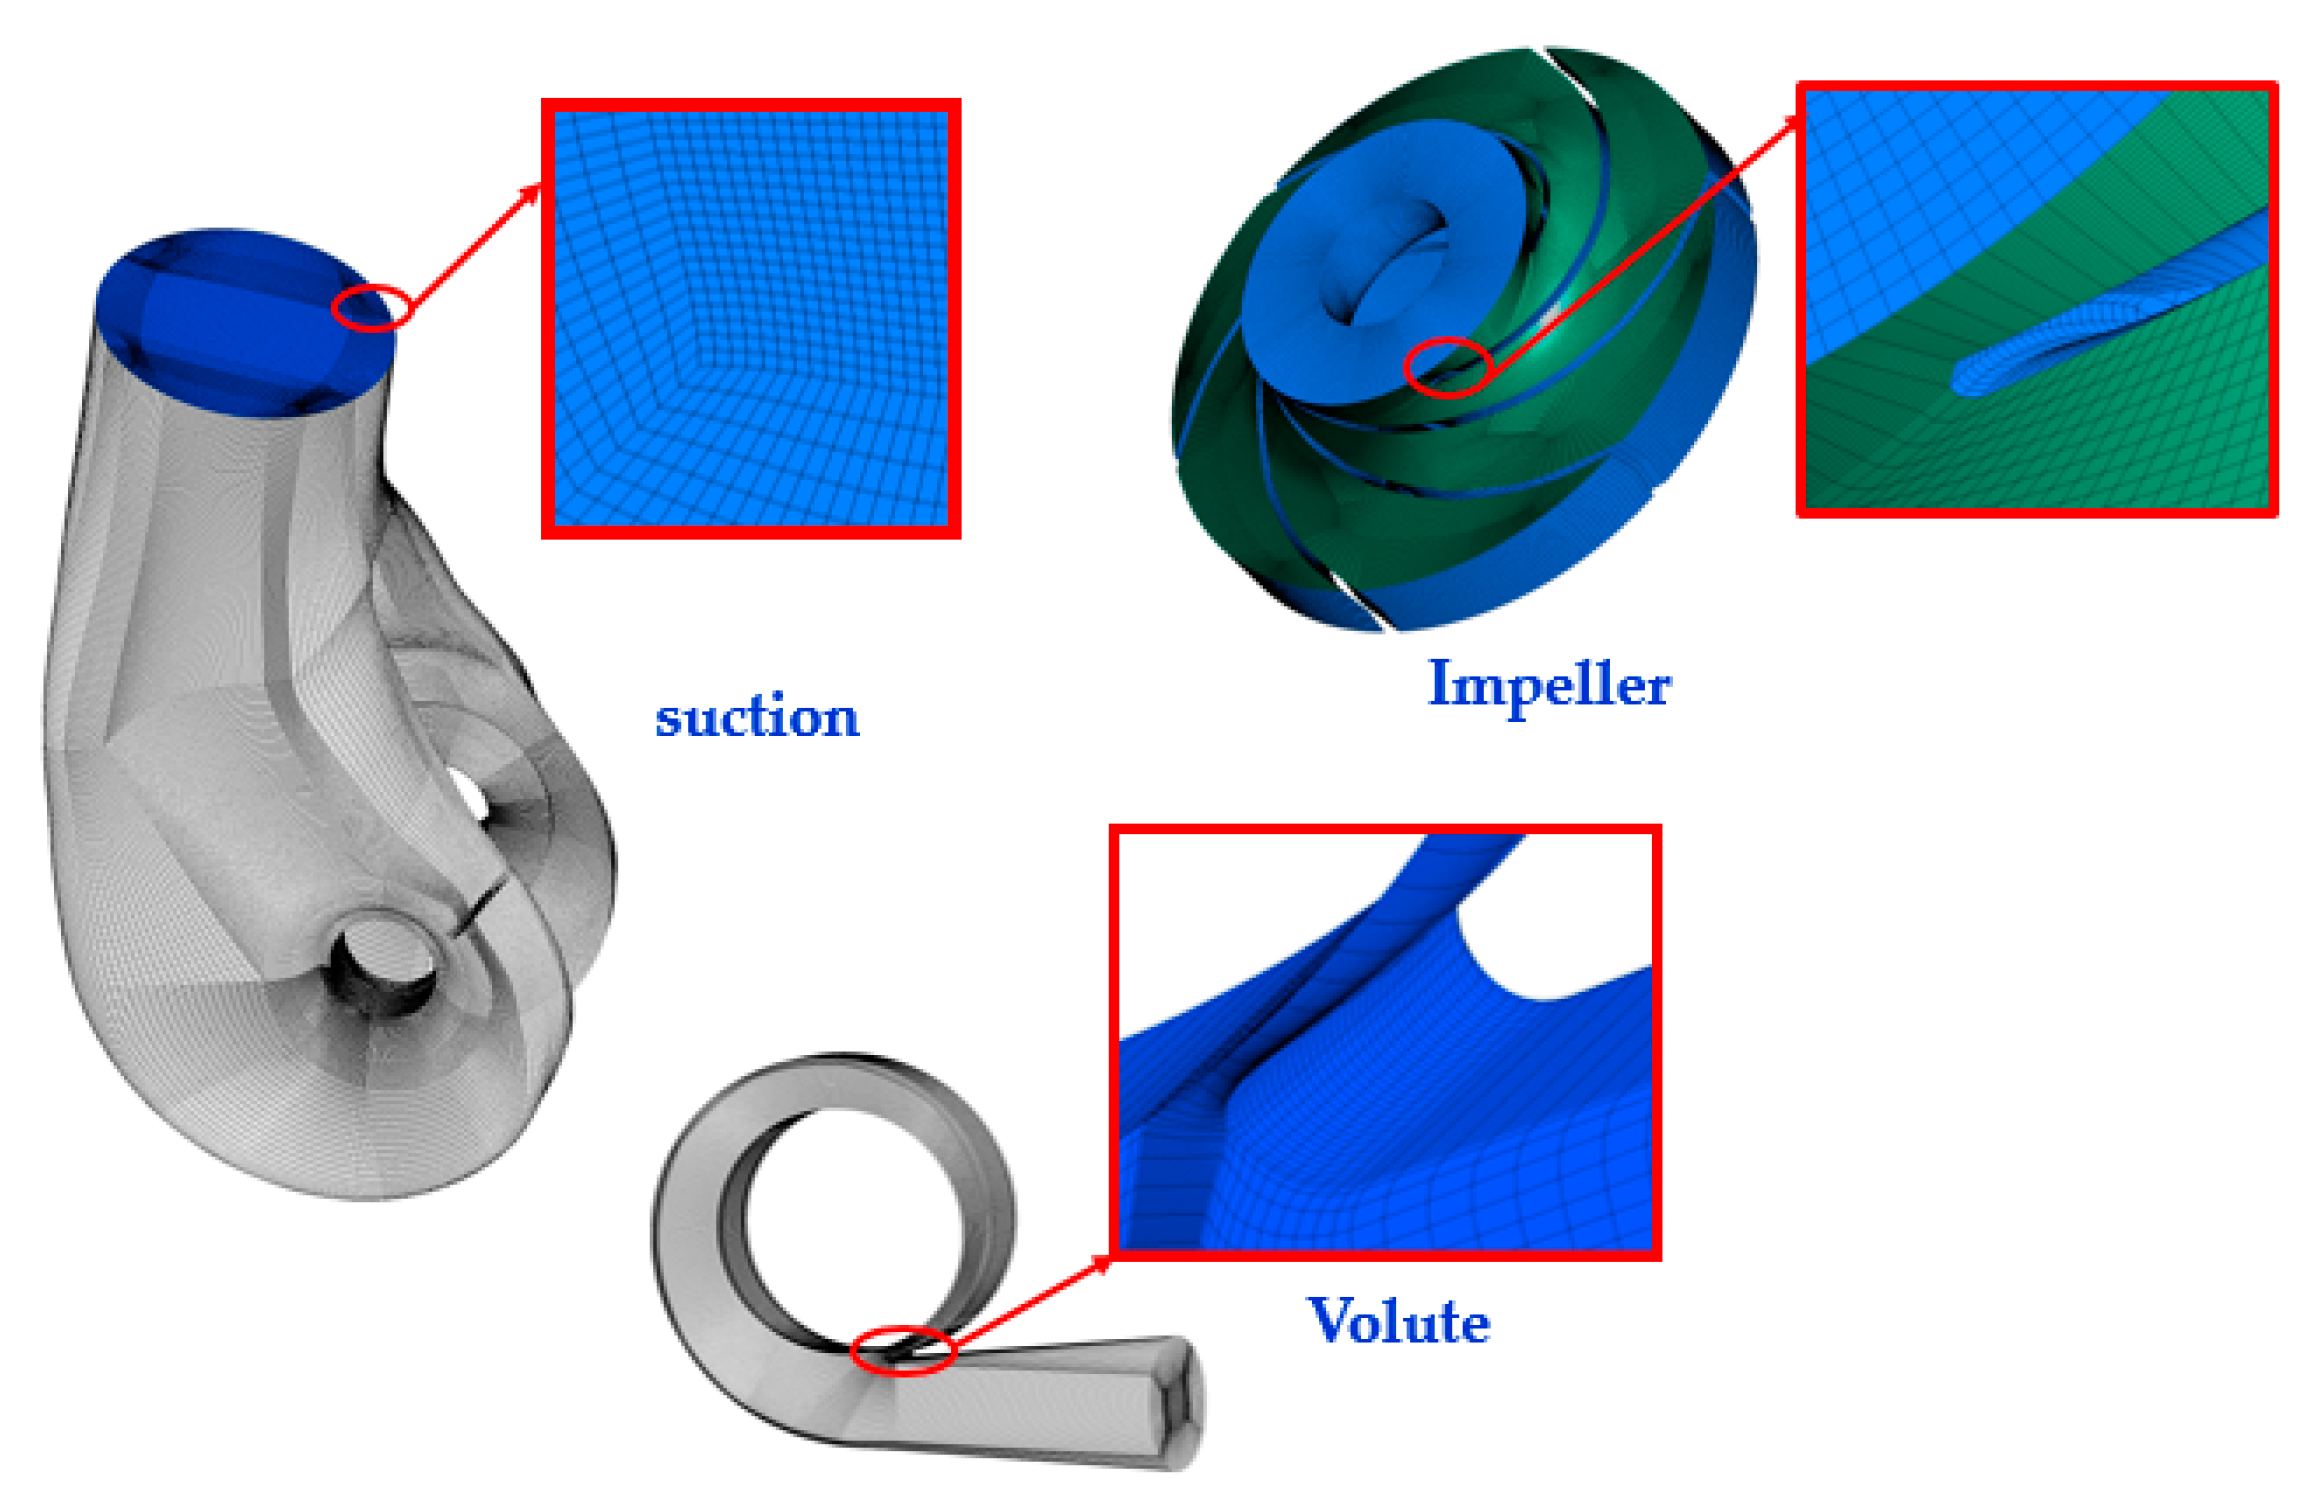
The flow passage for the tested pump was meshed with ANSYS ICEM 18.0 (ANSYS Inc., Canonsburg, PA, United States) mesh tool. High quality structural hexahedral mesh was built to achieve maximum calculation accuracy. The grid size and blocking method was used and the grids for the impeller and suction chamber were refined with large numbers for higher precision. The grids near the walls were refined further to attain boundary motion features. An overview of the computational mesh is shown in Figure 2.
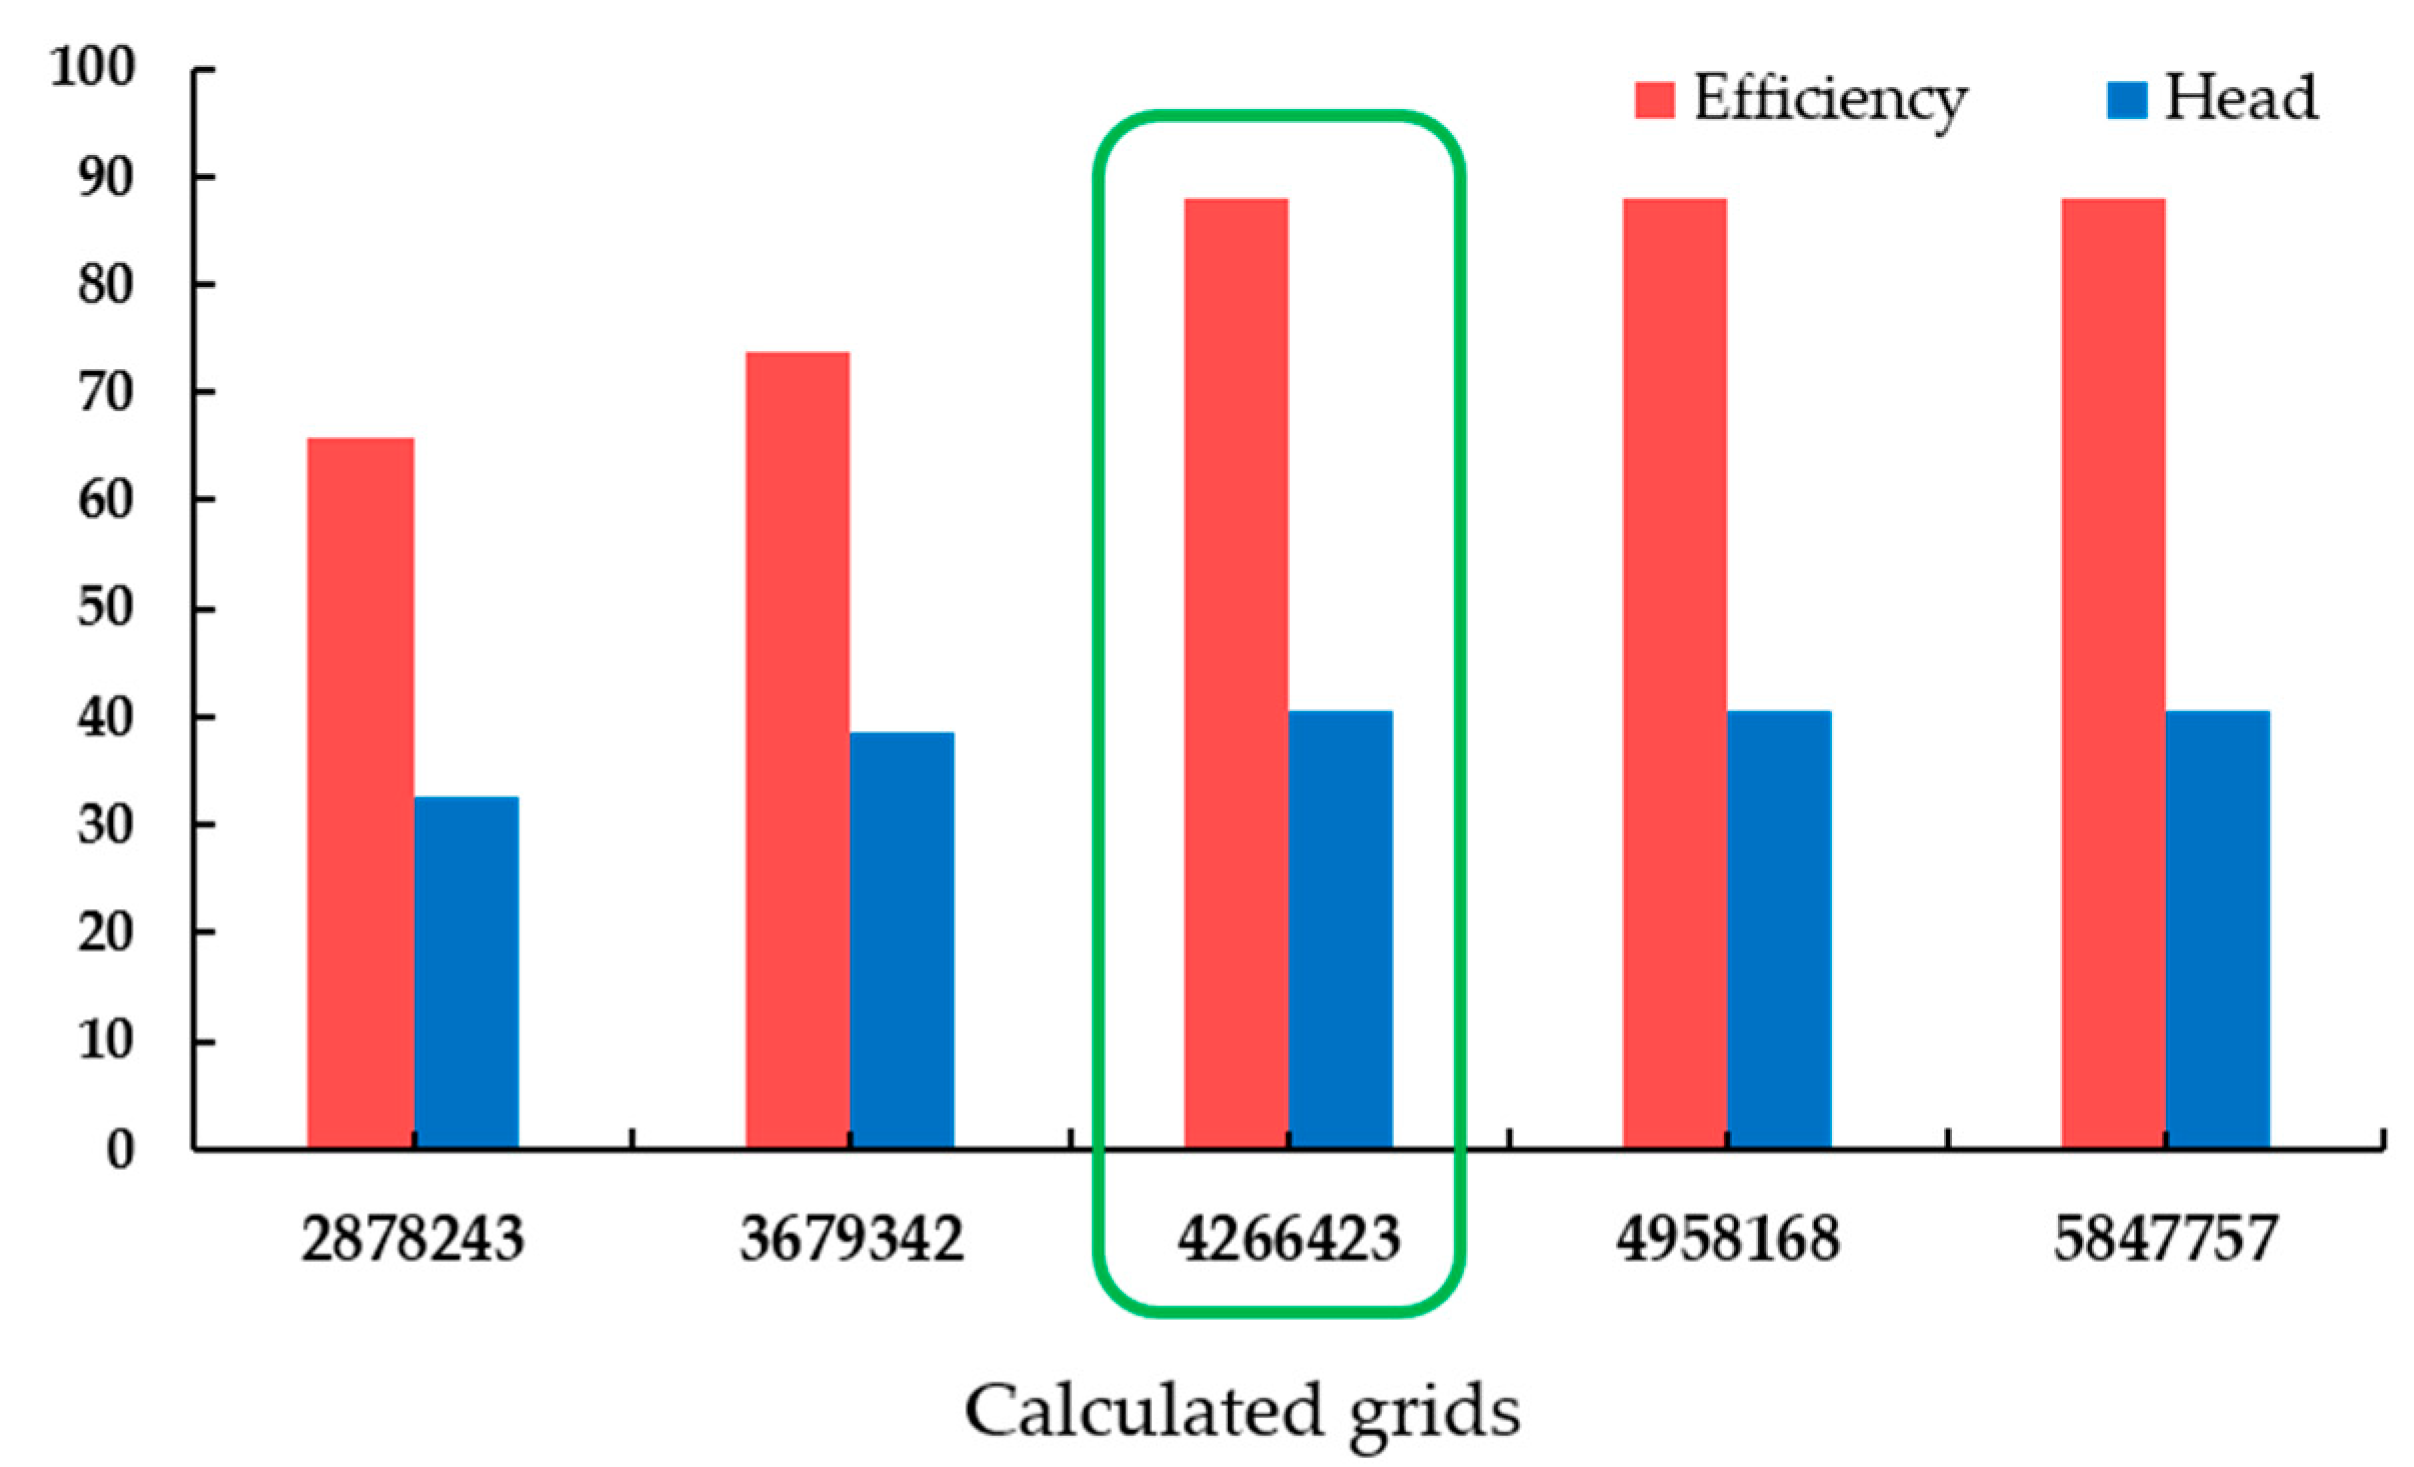
Based on similar works [17,27,28], 5 independent high quality structural hexahedral meshes were built and a grid sensitivity analysis executed. Simulations were performed at the design flow rate of to determine the mesh influence on pump head and efficiency. The effects of the mesh density on the hydraulic performance remained fairly constant when the number of grid elements increased past 4.26 × 10⁶ elements, suggesting that numerical accuracy gradually stabilized as the grid number increased. The mesh density with elements 4,266,423 was therefore used for the computations to reduce calculation load and computation time. Statistics for the selected mesh density is presented in Table 2, and the grid sensitivity of the 5 independent mesh generated is shown in Figure 3.
2.2. Governing Equations
The continuity equation, which is the basic equation governing two-phase flow is adopted from the Navier-Stokes equations [29] which is time dependent, and is given as:
Density and dynamic viscosity mixtures are represented by ρ and μ respectively. Velocity is denoted by u, p for pressure and turbulent viscosity is μt. Variables i and j are axis directions. The turbulence model chosen was SST k–ꞷ, because it exhibits a combined advantage of both the k–ꞷ and k–ɛ turbulence models [30,31]. The cavitation model used is the mass transport equation is deduced from Rayleigh-Plesset’s equation. Transport equation for bubble formation and collapse is expressed as:
where αv denotes the vapor fraction, m+ and m− stands for mass transfer terminology for evaporation and condensation respectively. The coefficients for condensation and evaporation phases are represented as Ccond and Cvap. rg, is the nucleation site volume fraction, Rb, is the bubble radius, ρv, for vapor density, ρl, the liquid density and pv, whch is also the saturation pressure. Standardized values according to literature are: Cvap = 50, Ccond = 0.01, rg = 5 × 10⁻⁴, Rb = 10−6 m, ρv = 0.554 kg/m3, ρl = 1000 kg/m3 and pv = 3169 Pa [32,33].
2.3. NPSHr Prediction Procedure
For a given flow rate condition, three key procedures are required to calculate for the NPSHr. The approach used here is adapted from Ding et al. [26]. There are however two other optional procedural steps (pre and post procedural) that can be applied by discretionally where necessary.
Step 0 (optional): The first step is an optional step of performing a quick simulation with the traditional boundary settings to give an idea of the pump head and can be skipped if the head is already known.
Step 1: Recalculated pump head with new boundary pair to obtain clear-cut reference point in predicting the 3% head drop. The inlet is held fixed to the flow rate and static pressure at the outlet. The outlet static pressure, PSout, is estimated as follows.
Step 2: Set outlet static pressure to 97% of head from step 1. This step prevents the simulation from running into severe cavitation since the estimated NPSHa is not far from the cavitation point.
Here, PSout (2), is used to expressed outlet static pressure for step 2, H100, is the pump head at no head drop calculated from step 1, and HD, is the dynamic head calculated from step 1.
Step 3: This step is to correct the errors in the previous step by adjusting the outlet boundary condition. The predicted results are expected to be as near as possible to the NPSHr.
2.4. Numerical Simulation Setup
Three dimensional Reynolds-Averaged Navier Stokes (3-D RANS) equation for a fully developed flow was solved using the commercial CFD package ANSYS CFX (ANSYS Inc). Water at room temperature was selected as the working fluid for the homogeneous fluid model and the reference pressure was 0 atm. An isothermal heat transfer rate was selected to render the system in thermal equilibrium with its surroundings at 25 °C. In addition, all flow domains were considered to have a surface roughness of 25 with no-slip. Due to additional effects in the viscous sublayer, an automatic near-wall treatment was applied. An inlet viscosity ratio of 10 was chosen to correspond to a medium turbulence intensity level of 5% at the pump inlet. To guarantee consistency, convergence and accuracy during the simulations, a high-resolution upwind scheme was employed to solve both steady and unsteady equations. For no cavitation conditions, pressure opening and flowrate boundary conditions were specified at the inlet and outlet. Cavitation simulations were performed under steady state with boundary conditions specified as static pressure for the outlet and mass flowrate at the inlet. The volume fraction of water (1 − α) was set to 1, whereas the vapor volume fraction, α, set to 0 at the inlet of the pump. Steady state iterations were set to a maximum of 700 for no cavitation conditions and up to 3000 for cavitation conditions. However, iterations converged when maximum residual values were less than or equal to 10−5, and this occured when the flow had reached its stable periodicity.
2.5. Test Setup to Validate Numerical Method
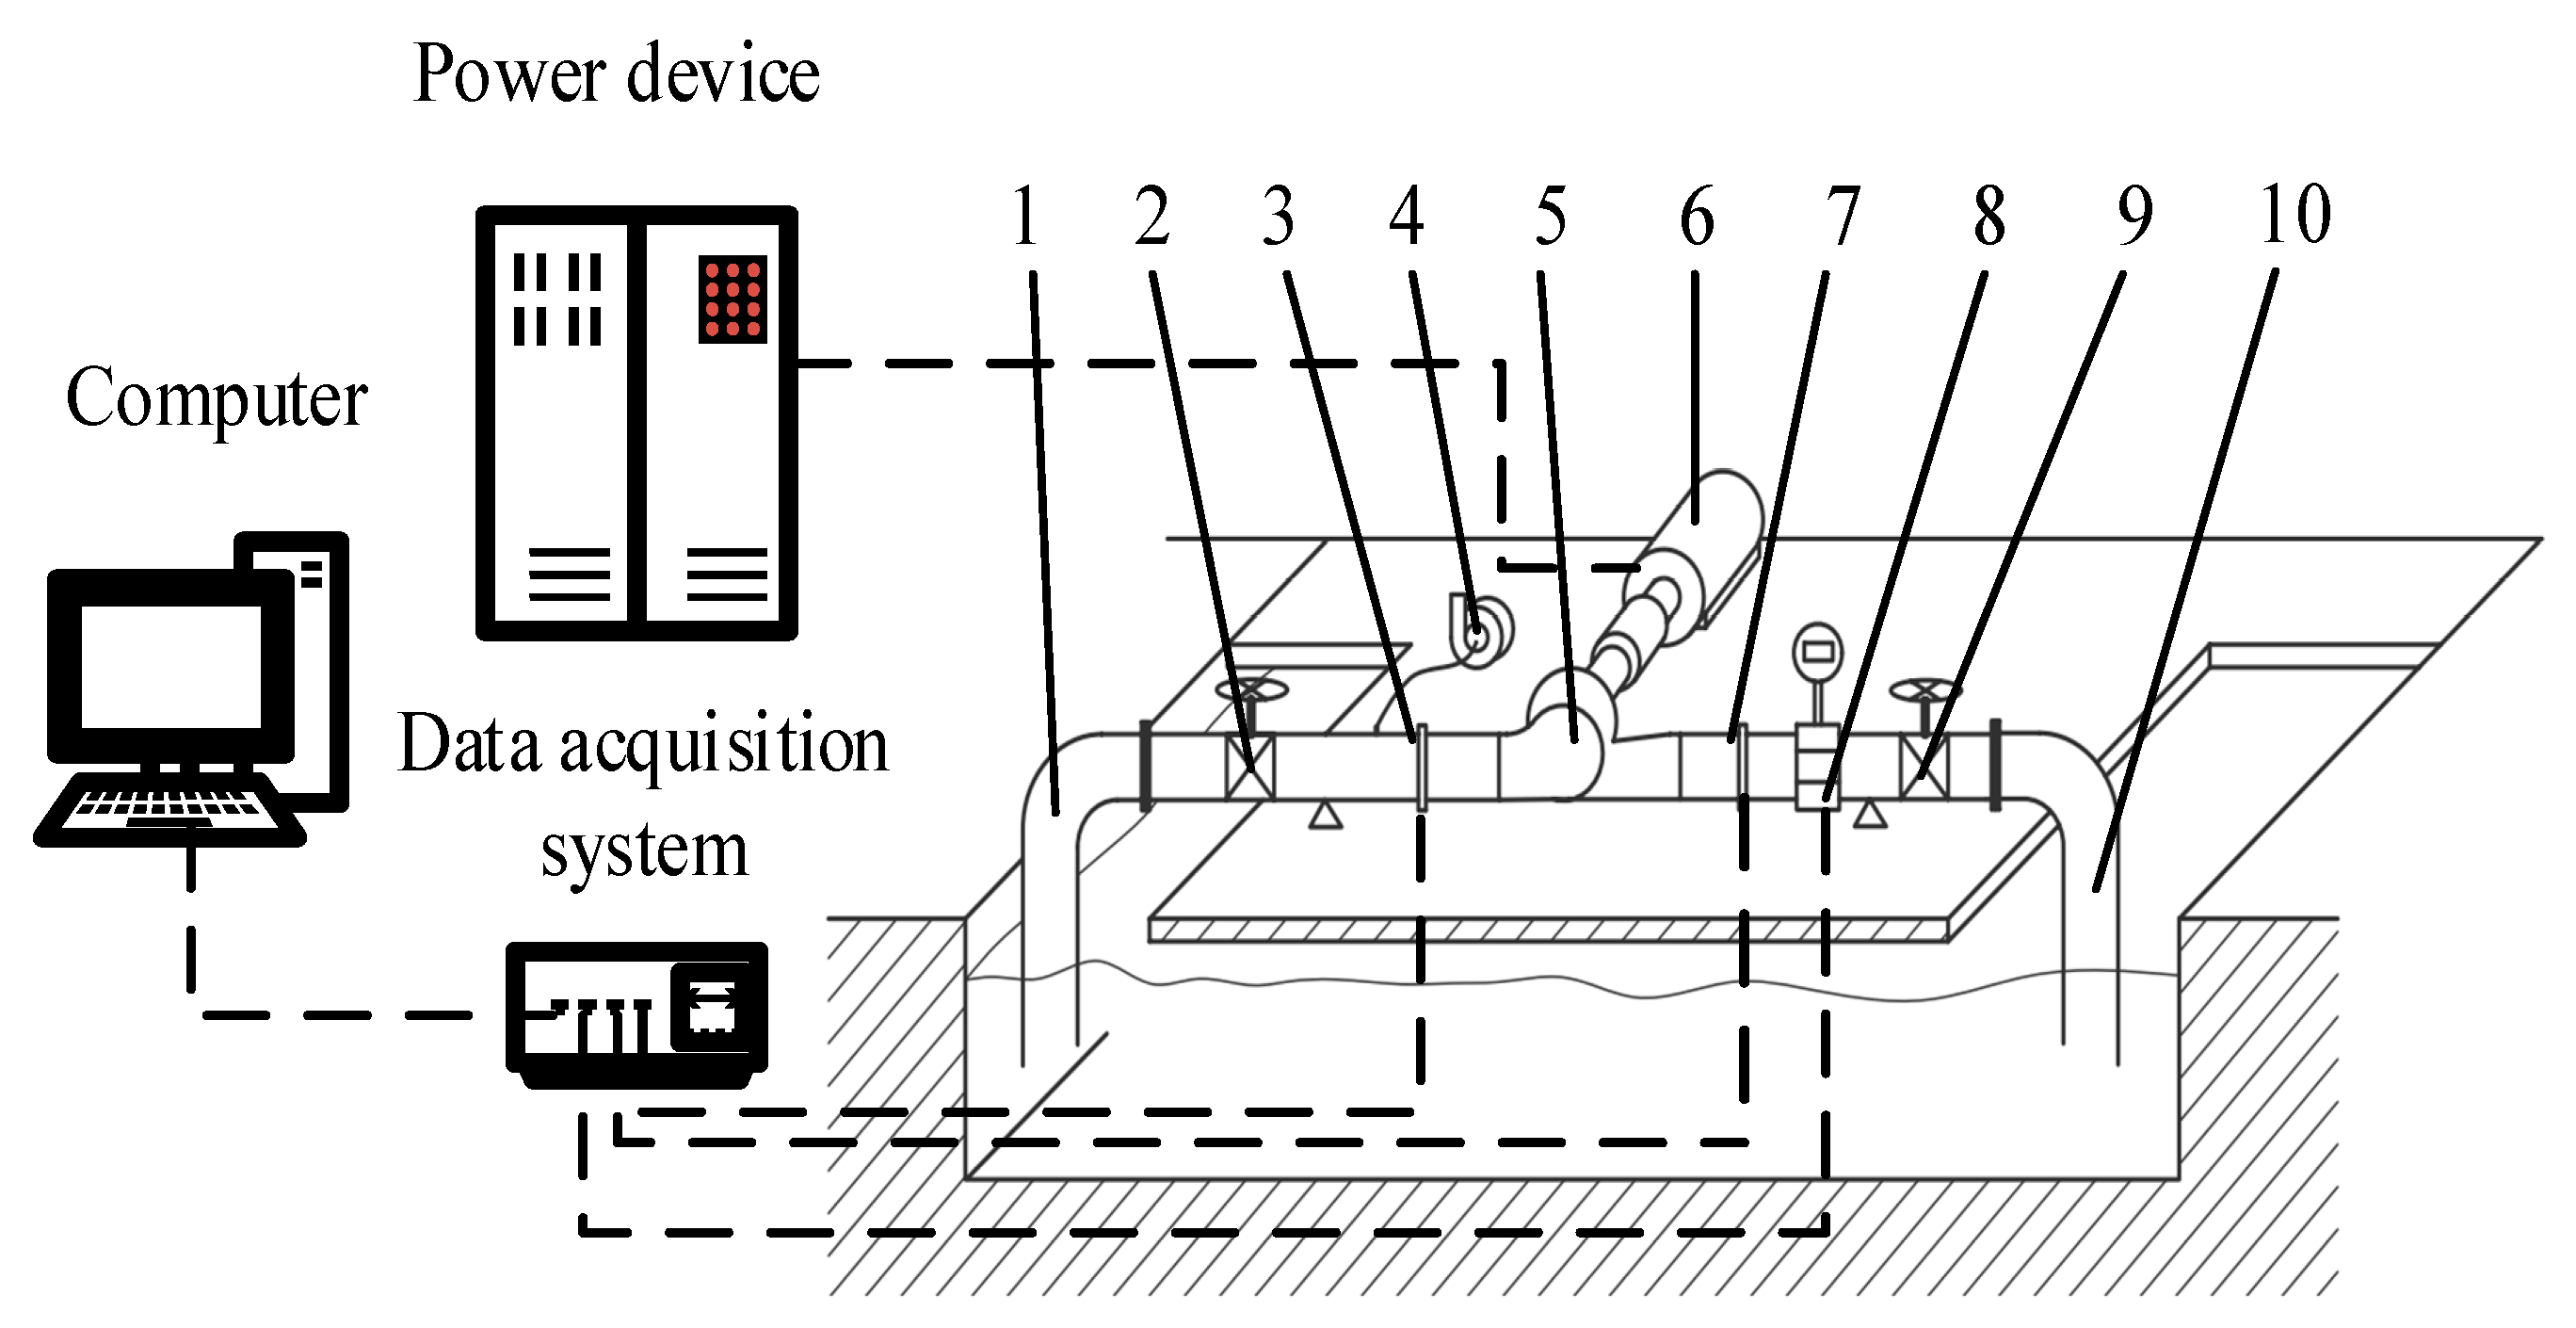
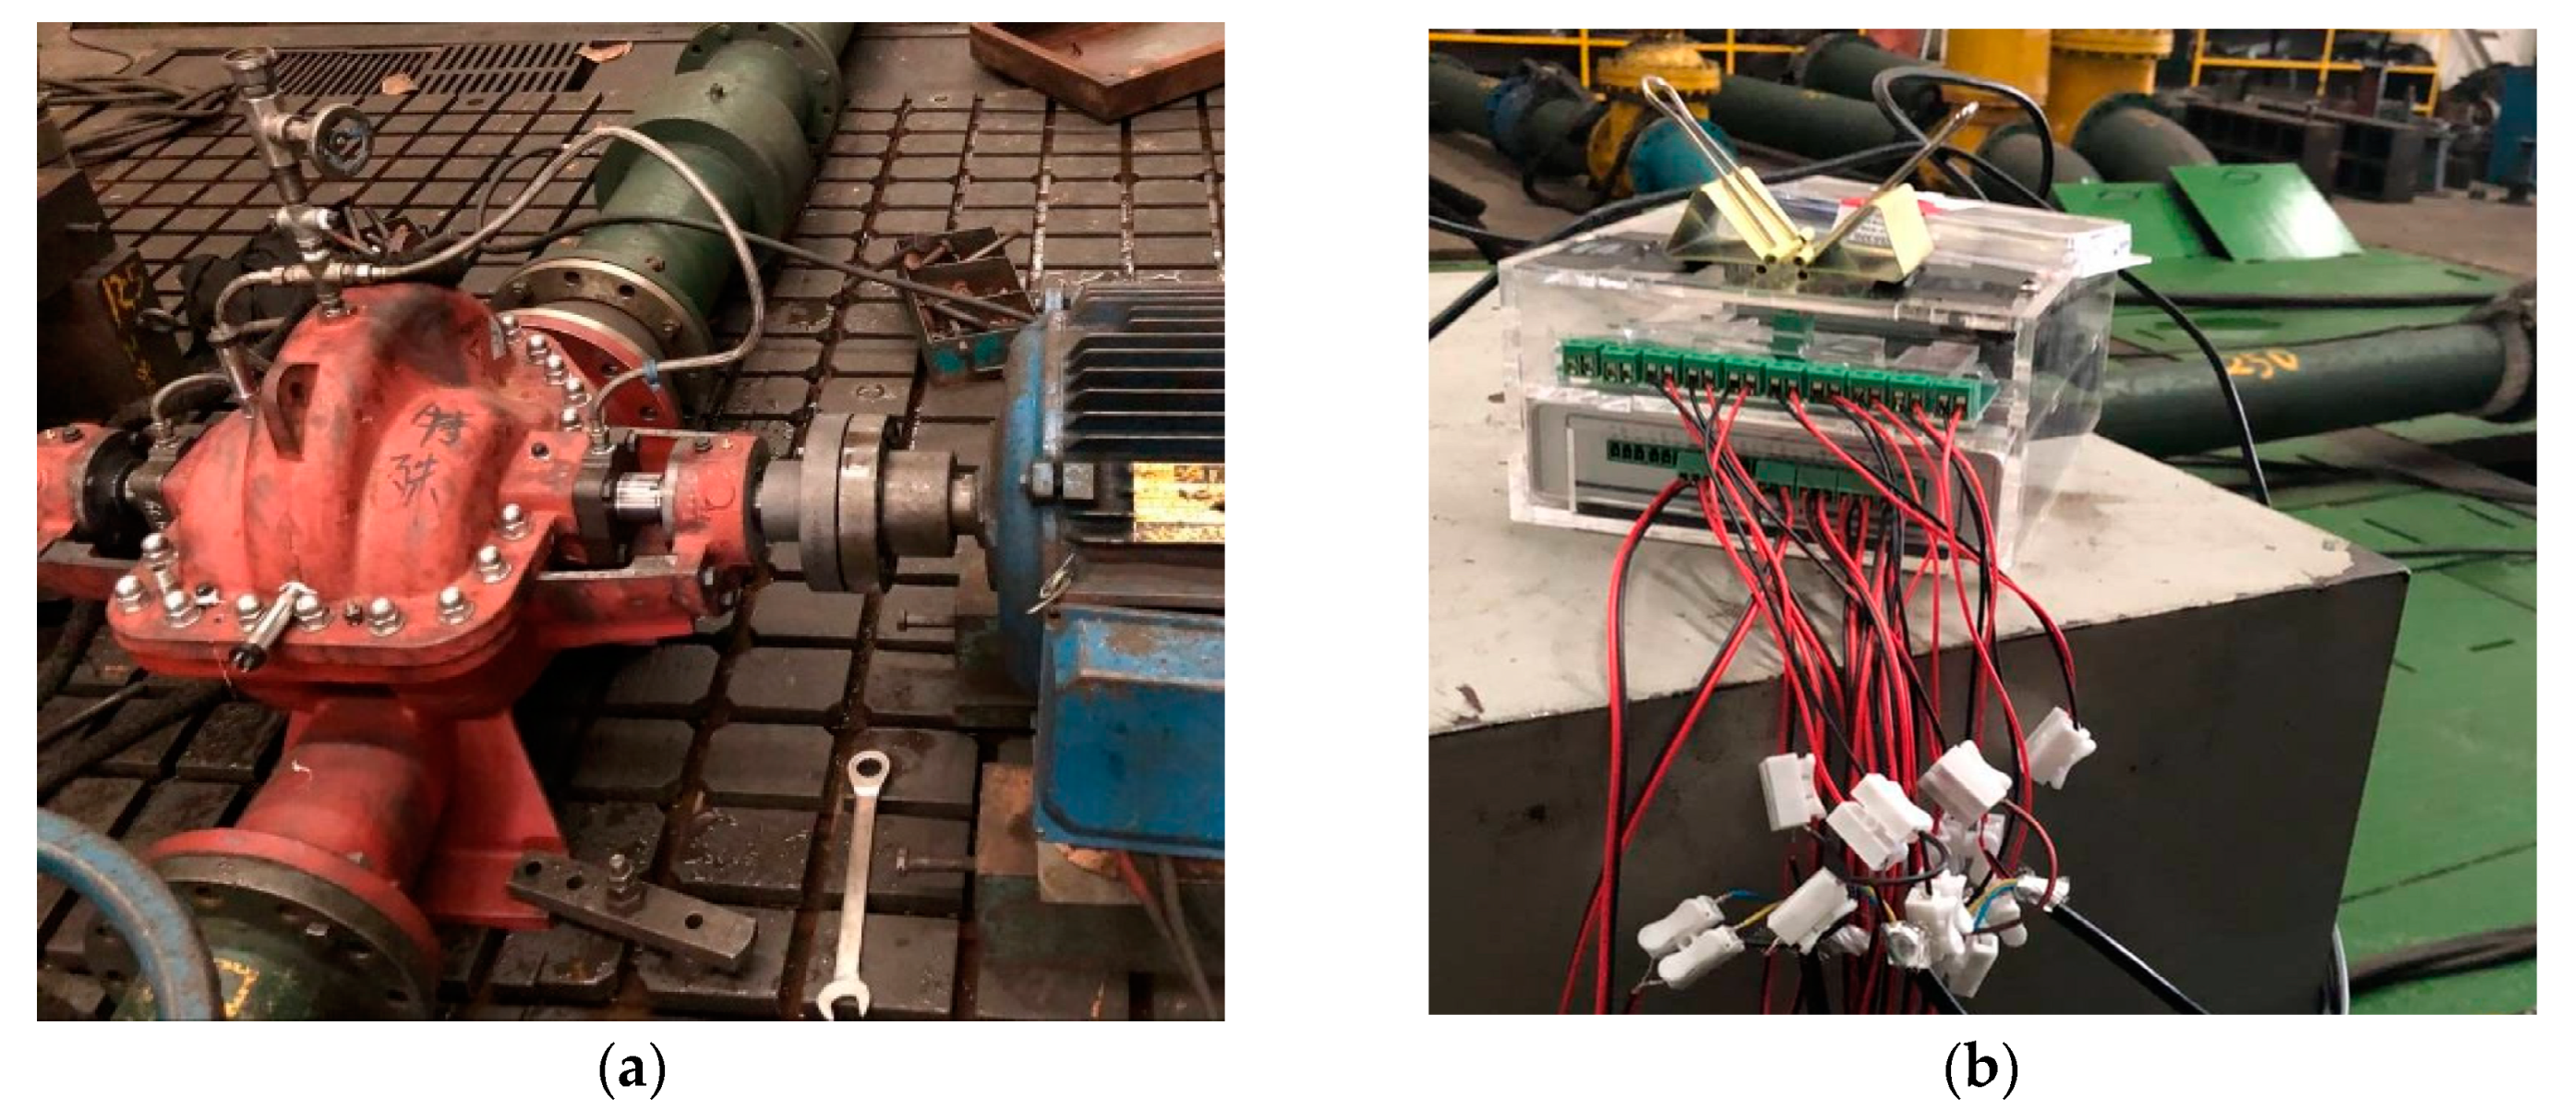
The pump performance tests were done at Shandong Shuanglun Company Ltd., China. The test rig schematics can be seen in Figure 4, and the test setup is shown in Figure 5. The flow rate was measured with LWGY-200A electromagnetic flowmeter from Shanghai Zijiu Instrument Co. Ltd., China, with an error margin of ±0.5%. The fluid pressure was measured with WT200 pressure transmitters from Shanghai Weiltai Instrument Co. Ltd., China, and the uncertainty is less than ±0.1%. Hydraulic performance and cavitation tests were performed and evaluation was done according basic pump theory [34].
3. Optimization Procedure
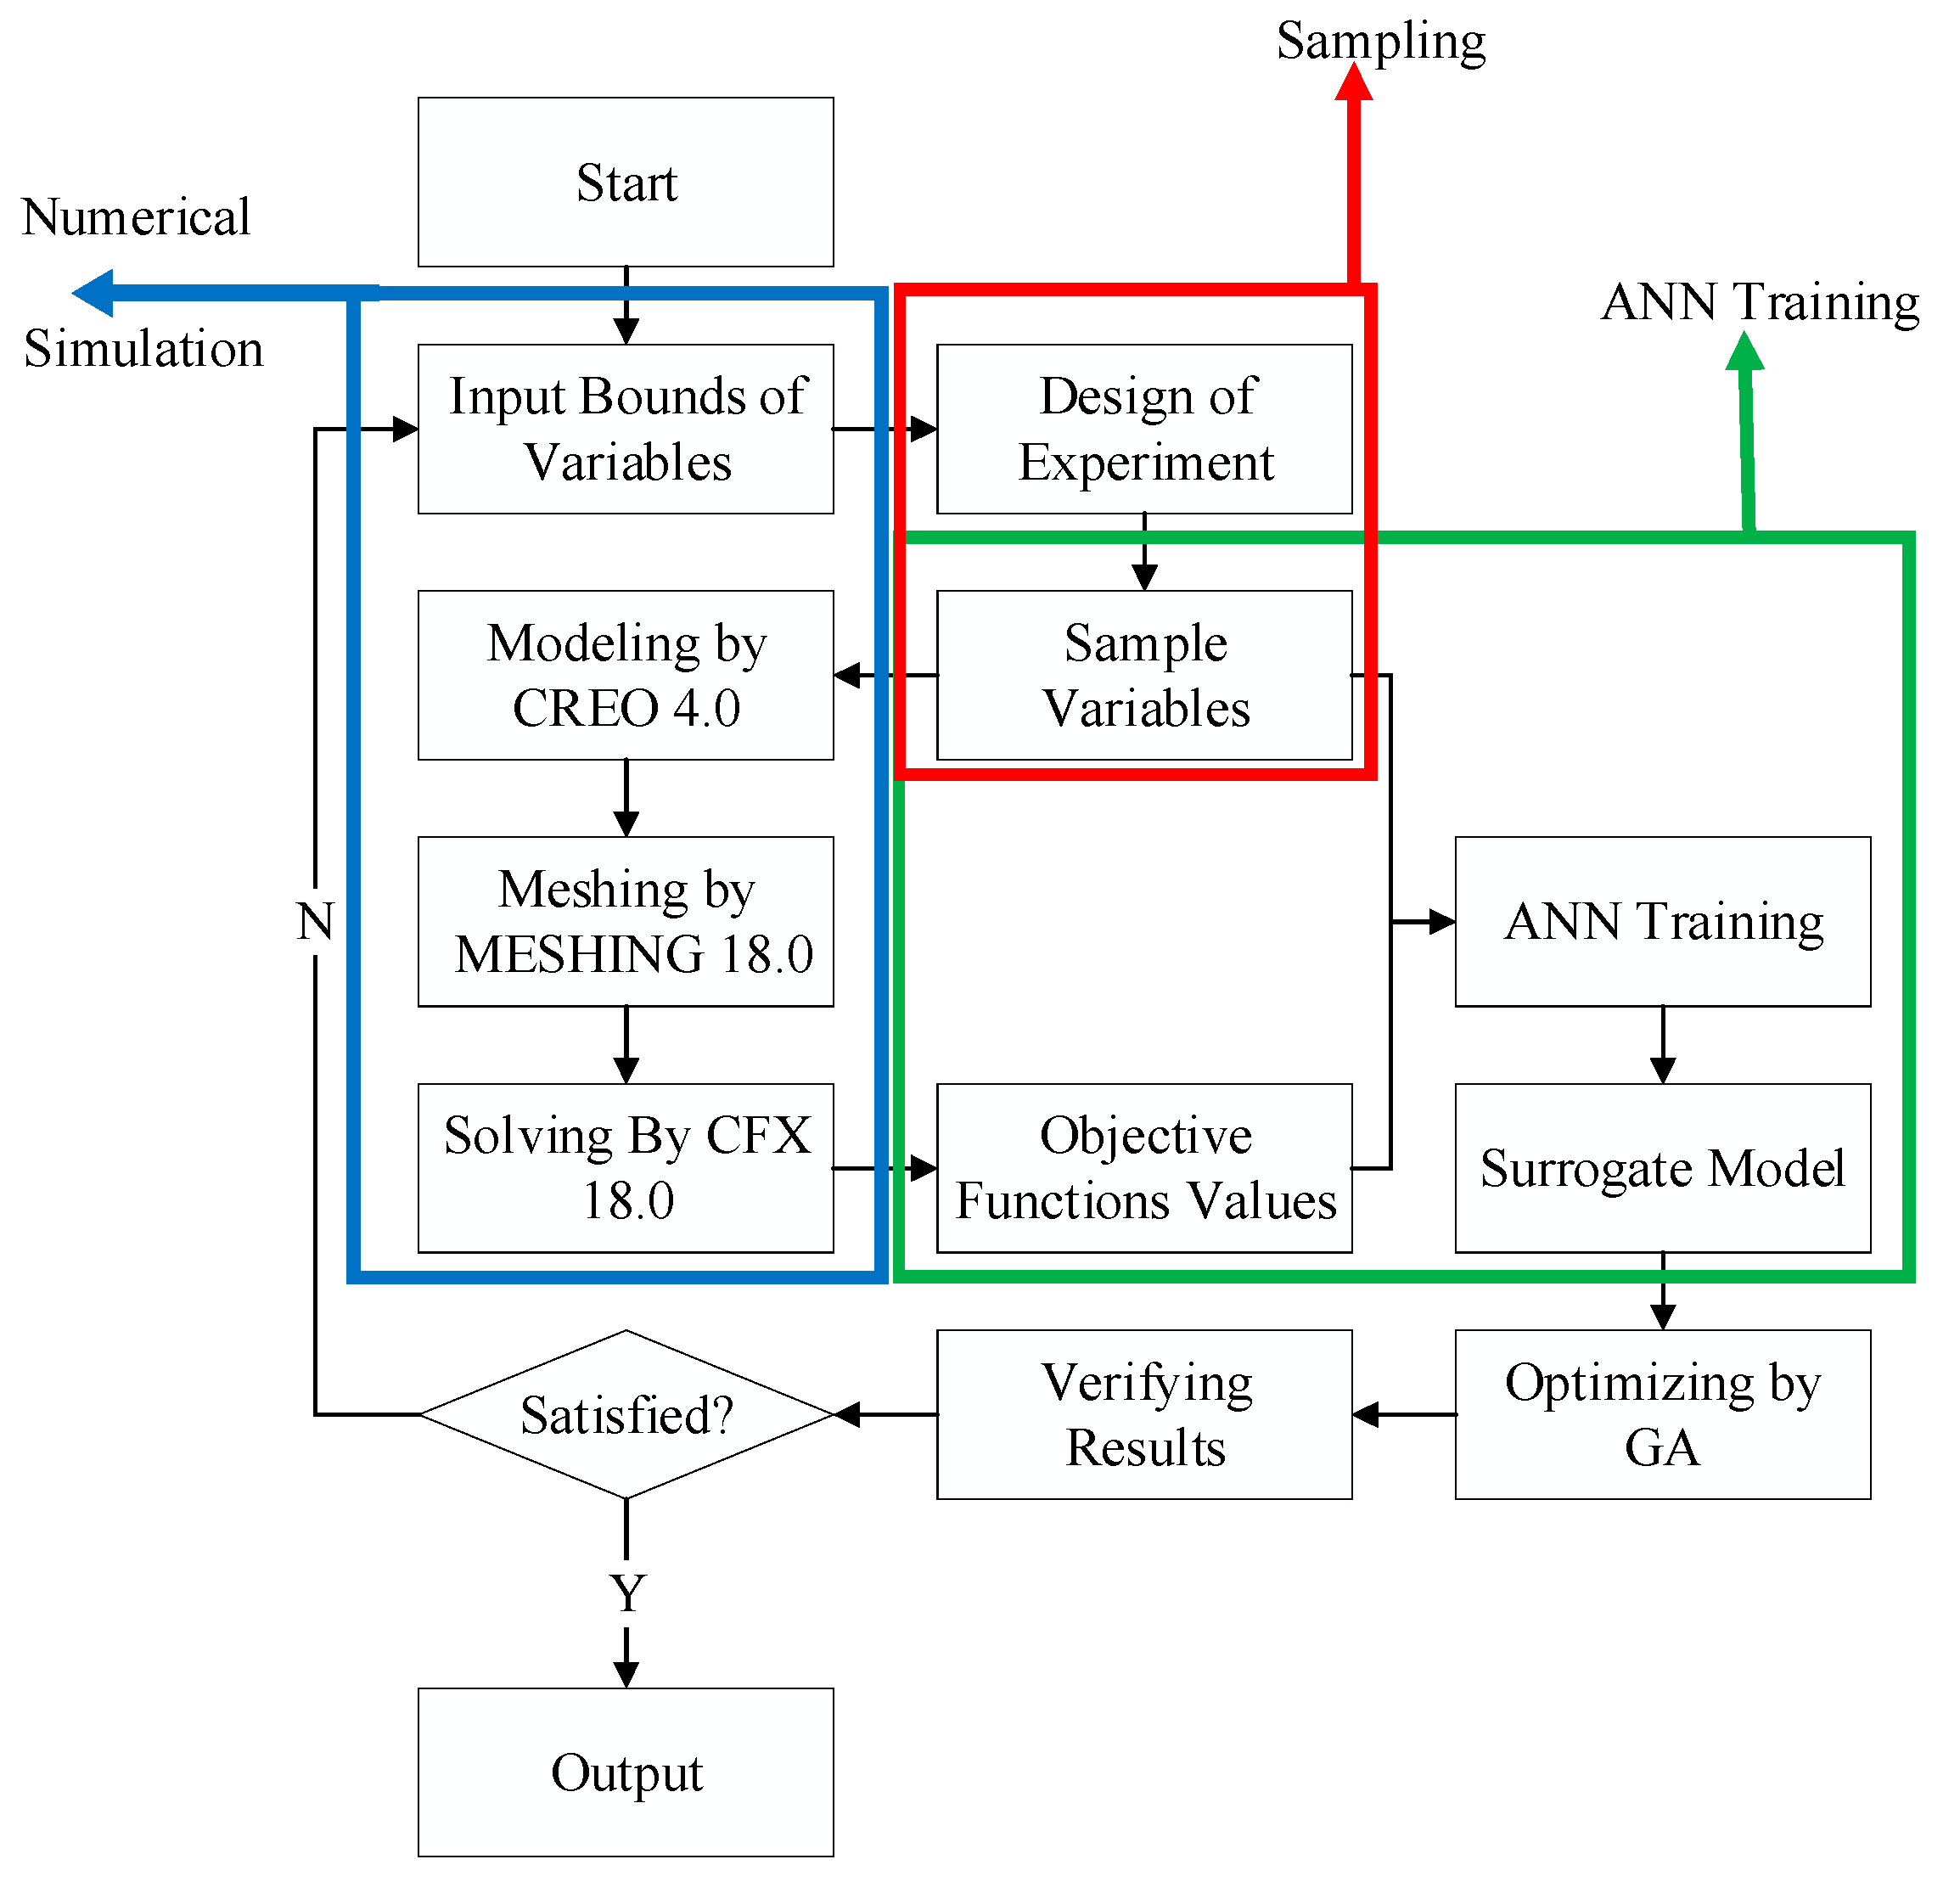
The procedure for optimization is shown in Figure 6. The initial process was to sample the input bound variables based on an orthogonal design of experiment method. Secondly, series of single-suction impellers were designed by the hydraulic design software CFturbo (CFturbo® GmbH, Dresden, Germany). It was then mirrored with PTC Creo parametric 4.0 to obtain the 3D model of the double-suction impeller. ANSYS ICEM 18.0 and CFX 18.0 (ANSYS Inc.) were adopted for the numerical simulations to obtain the efficiencies and NPSHr, and the results were selected as objectives to train the surrogate models. The fourth part was to solve the models using multi-objective genetic algorithm to obtain pareto solutions. Finally, the optimized cases were verified by numerical simulation to improve the reliability of the results.
3.1. Objective Functions
In the design process of centrifugal pump, the optimization goals and targets are considered as significant indexes for performance evaluation. For this study, the efficiency and NPSHr of the double-suction centrifugal pump at the design condition are selected as the optimization targets, and they are obtained by numerical model calculation. The expression for calculating efficiency is:
Here, ρ is density, H is the pump head, Q is the flow discharge, and PS the shaft power. For pump cavitation, NPSHr, which is the minimum pressure required at the suction point to prevent cavitation is a significant performance index. The expression for NPSHr is given as:
Here, Ps and Vs are the reference pressure and velocity, and Pv is vapor pressure.
3.2. Decision variables and Array Orthogonal Design
There were space constraints due the structure of the suction and volute casing; therefore the shape of the impeller was maintained by holding constant the inlet diameter D1, the impeller outlet diameter D2, the hub diameter Dh, and the blade width at outlet b2. Only the blade profile is optimized. Eight geometrical parameters namely hub inlet angle β1 hub, hub exit angle β2 hub, hub wrap angle φ1 hub, leading edge wrap angle at hub Δφ0 hub, shroud inlet angle β3 shroud, shroud exit angle β4 shroud, shroud wrap angle φ2 shroud and the leading edge wrap angle at shroud Δφ0 shroud, were selected as optimization variables. Each parameter is given a set of four values. Table 3 shows the decision variables and their set of values used for the parameterization. Orthogonal Design of Experiment was applied here to design the experimental scheme. The main inputs to the design were the input variables (factors) and the number of values in each variable (levels). From Table 3, an orthogonal scheme of L32 (84) with n levels; p factors; and m schemes was designed in Table 4 according to the formula:
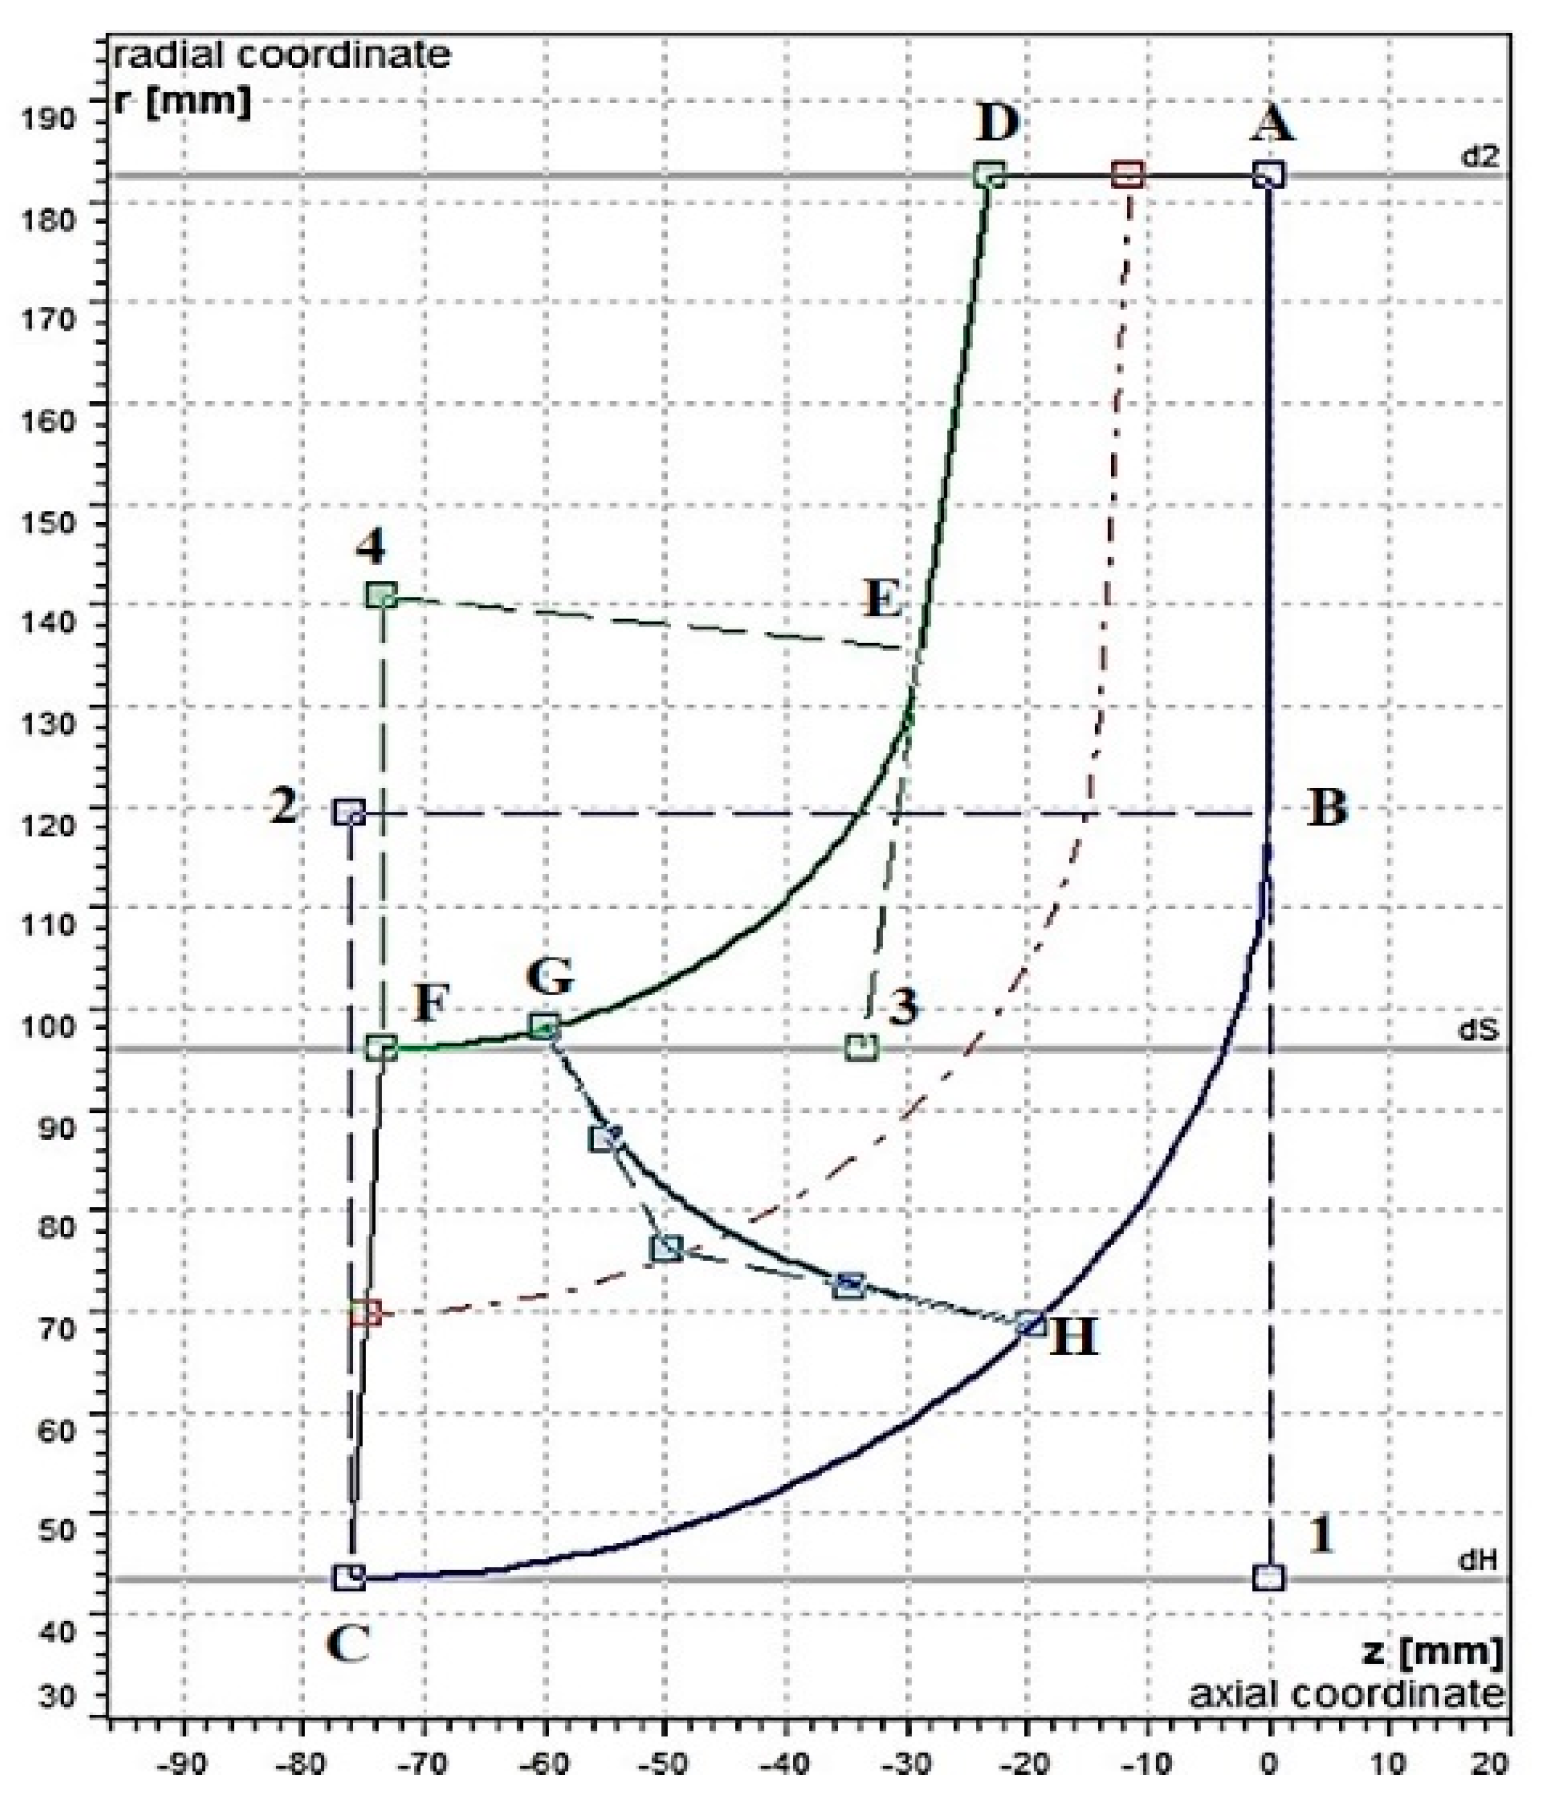
To eliminate the time of 2D hydraulic design and 3D modeling, the 3D hydraulic design software CFturbo 10.3 (CFturbo® GmbH) was used to carry out the 3D parametric design of the double suction impeller. In the parametric design, the focus is to control the blade profile. The meridional shape has 4 points for controlling the lines and the inclination of the angles of the hub and shroud (Figure 7). The position of the inlet edge of the blade is adjusted by a Bézier curve with five points. CFturbo is limited to single-suction impeller design only, and therefore a single-suction impeller was designed according to the hydraulic characteristics and mirrored into a double-suction impeller using PTC PTC Creo 4.0. The 32 design variables were written into the trail files using MATLAB R2017b (Mathworks Inc., Natick, MA, USA), then started PTC Creo with these trail files by BAT codes to complete the modeling process. ANSYS Workbench (ANSYS Inc.) was adopted to combine meshing with CFX solver since it can work in batch mode with a journal file, making it easier to automate meshing and solving using MATLAB and BAT codes.
3.3. Artificial Neural Network Training
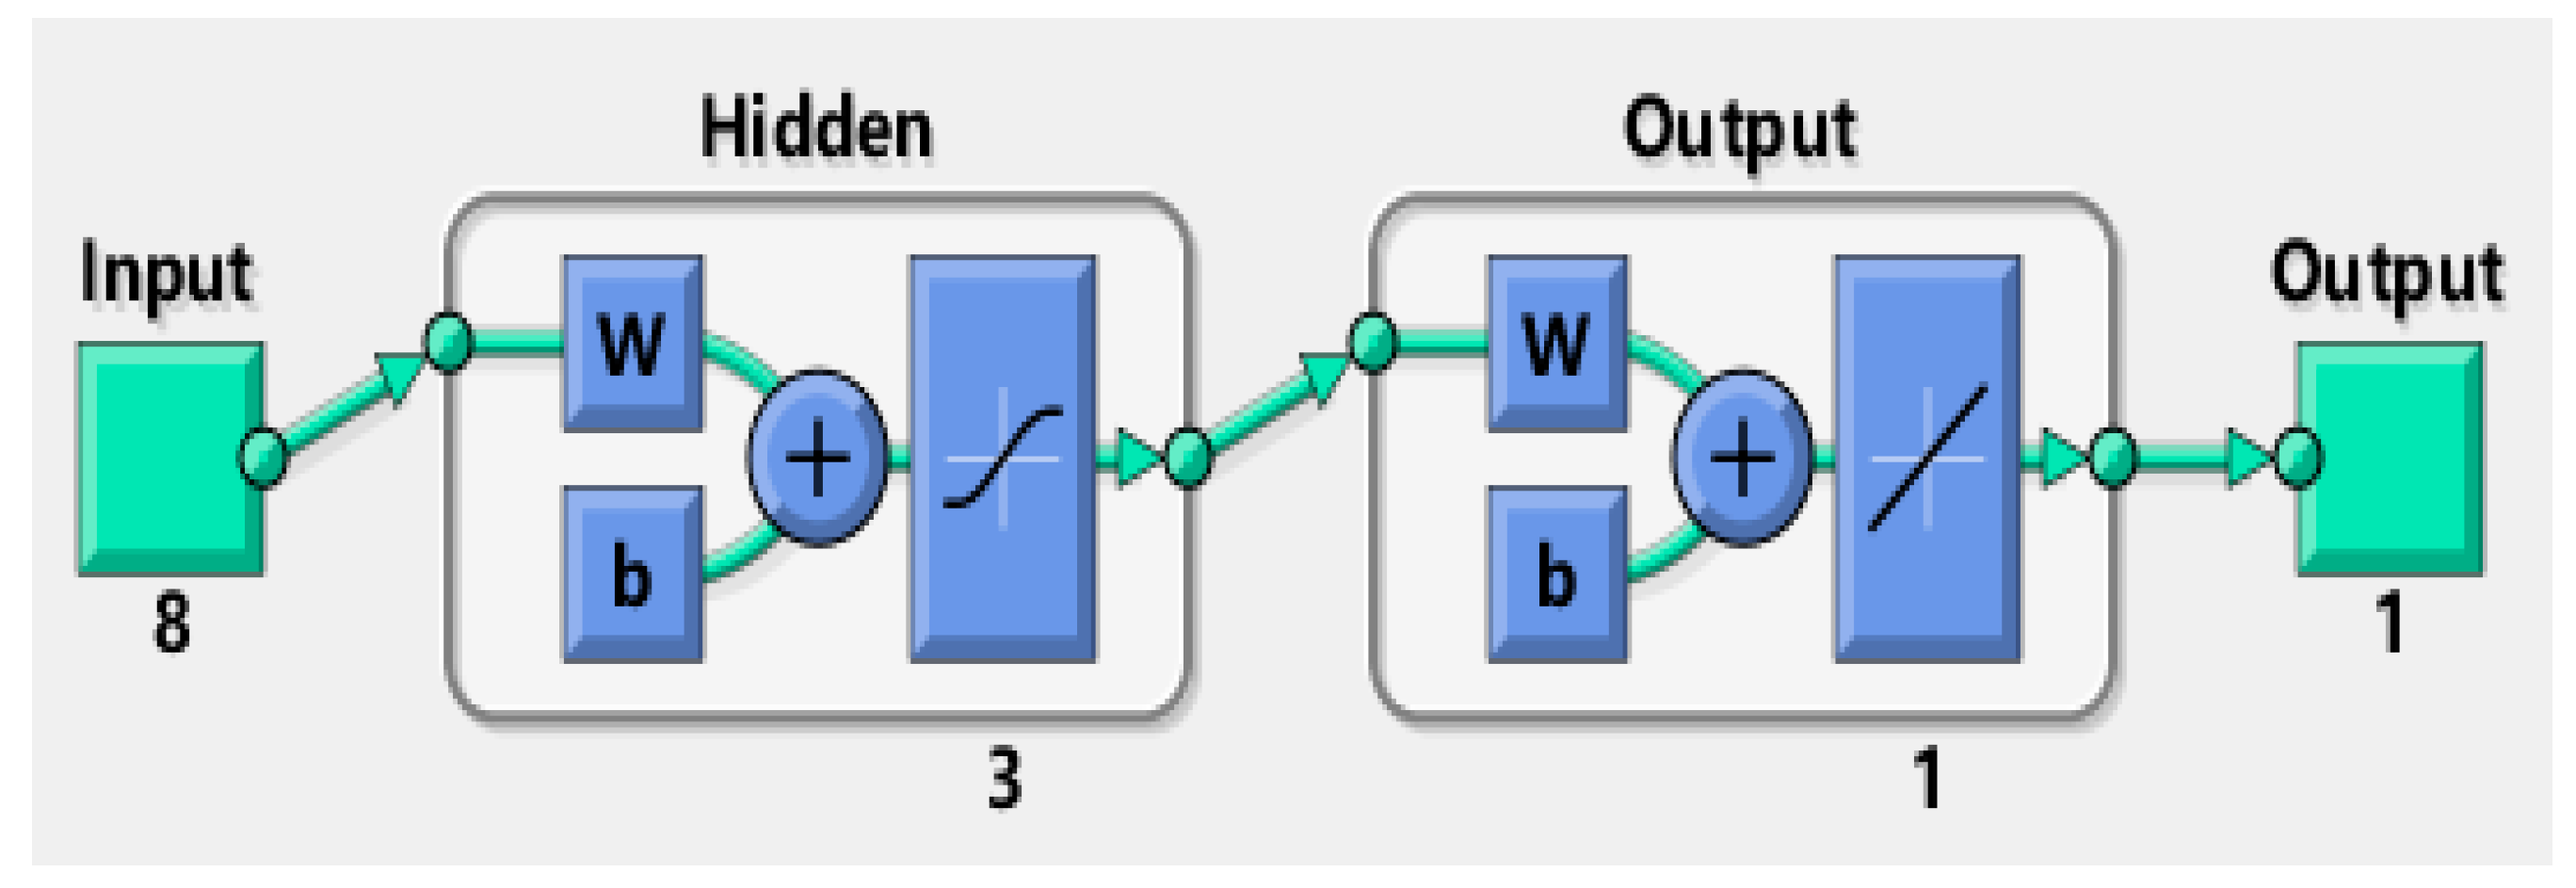
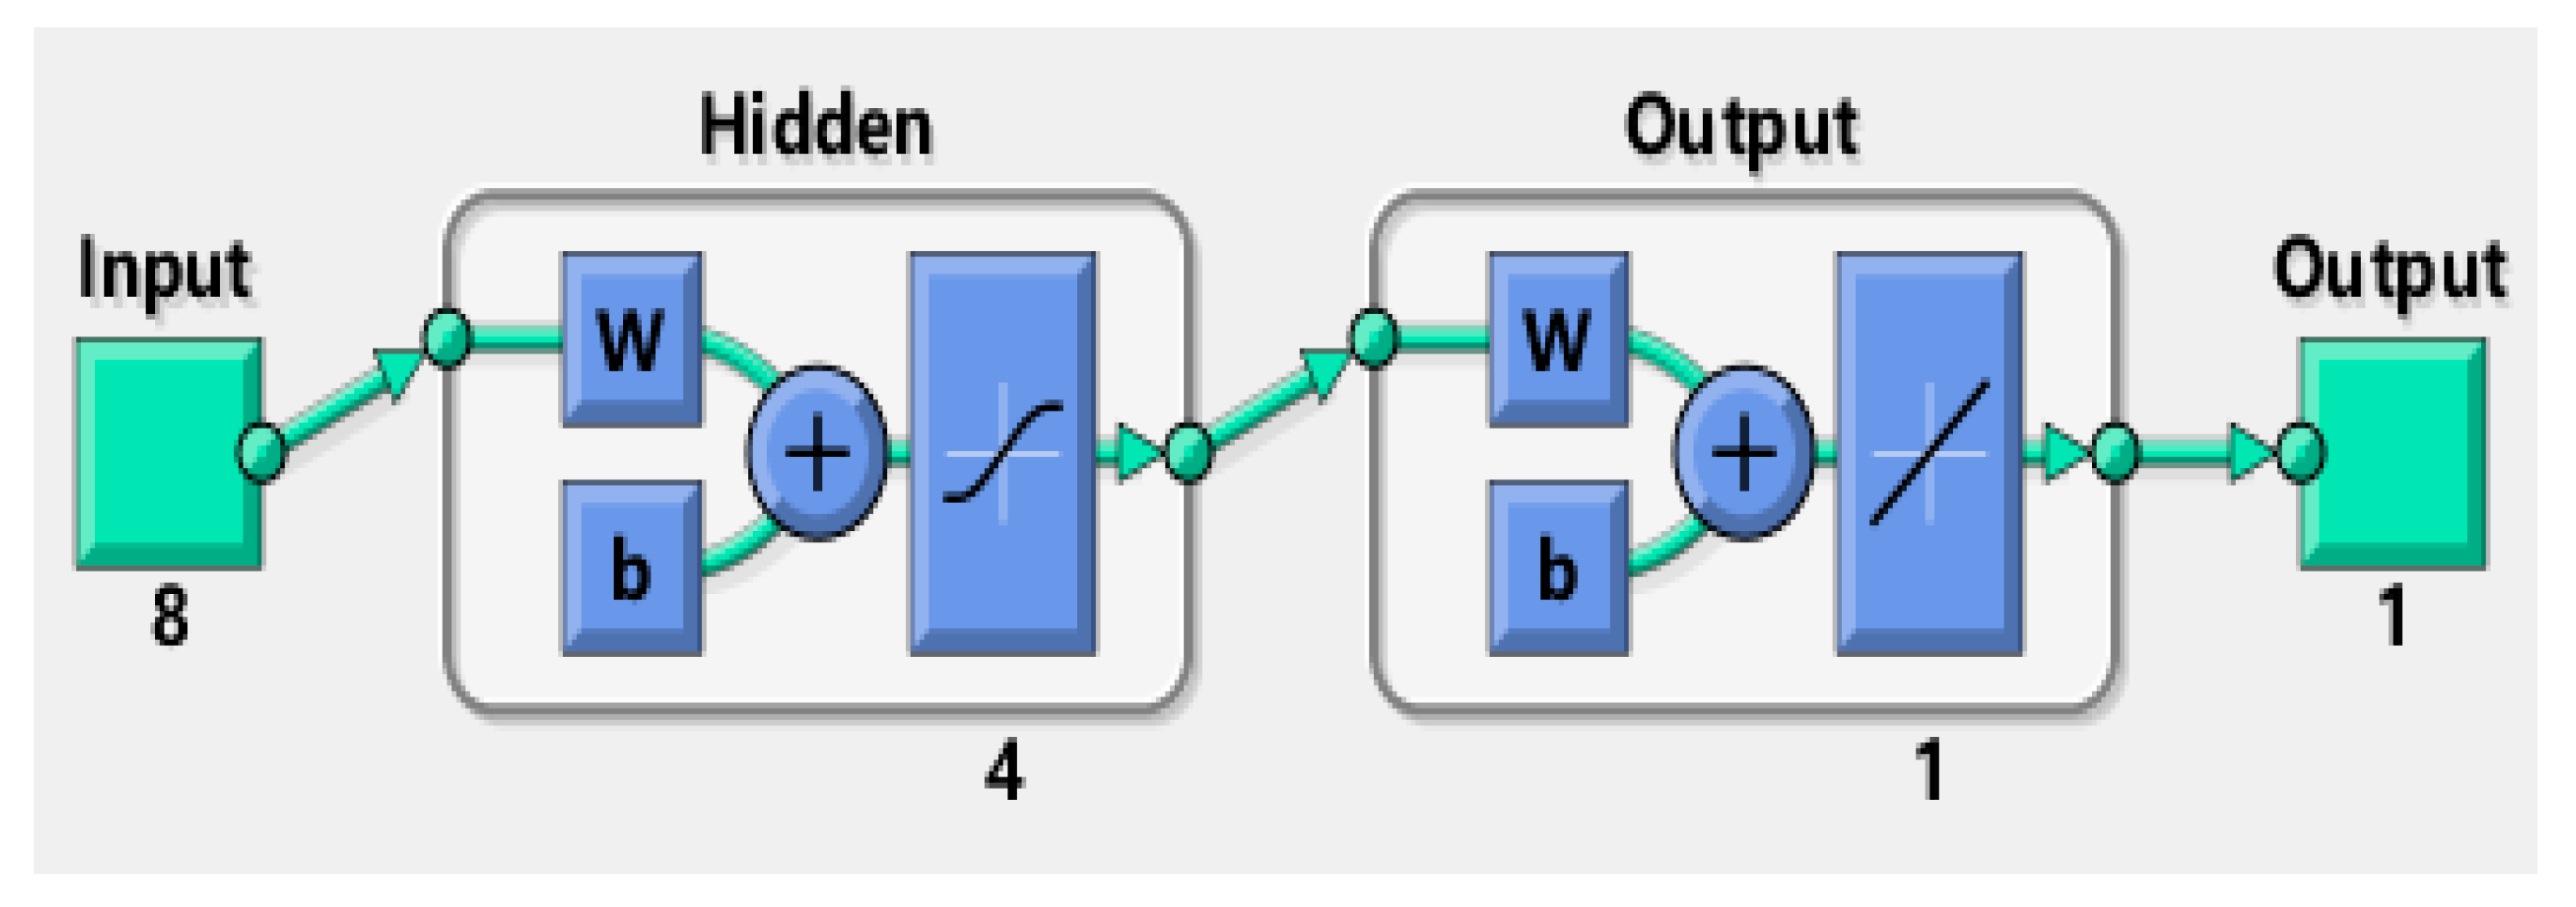
For this study, a dual-layer feed-forward artificial neural network with sigmoid hidden neurons and linear output neurons was adopted to fit the NPSHr and efficiency at the design flow condition and 8 design variables of the impeller. The Levenberg-Marquardt algorithm was adopted as the training algorithm to build the feedforward neural network. This is because compared with the disadvantages of traditional BPNNs, such as slow convergence speed and local minimum problems, the convergence rate of the Levenberg-Marquardt algorithm is the fastest of all traditional or improved networks, and it has been shown to achieve excellent evaluation and prediction results [35,36]. Also, to improve the prediction performance of ANN, it is important to use a much effective activation function in order to obtain a higher prediction accuracy. Therefore, the activation function used for the feedforward NN was the Tangent Hyperbolic Activation Function (tanh). This is because tanh has a much better recognition accuracy for multi-layer neural networks [37,38]. Its main advantage is the ability to produce zero centred output which aids the back-propagation process [39]. Figure 8 and Figure 9 are the dual-layer feedforward neural network structures used for training the efficiency and NPSHr objectives. The mathematical relation for the ANN function is written as Equation (12), the activation function, tanh is written as Equation (13) and the linear function as Equation (14).
Here, weight coefficient is expressed as w, threshold is b. Superscripts 1 and 2 represent the coefficients from the first layer to the second layer, and from the hidden layer to the output layer respectively.
3.4. Multi-objective Optimization Design
The multi-objective problem, which is defined as an N-dimensional problem with M objective functions is mathematically expressed as:
where is the N-dimensional vector;
- are the objective functions;
- is the variables limit.
Hence, the problem for the multi-objective optimization can be described as follows.
The value of each function could not be used to evaluate the individuals since the objective functions were more than one. The expression in Equation (17) was adopted [17] to evaluate the individuals and solve the problem.
where is any single population individual; is the Pareto efficient individual closet to x; is the Euclidean distance between x and y.
To solve this problem, a Pareto-optimal solution was applied to determine the optimal parameter combinations that would best solve the problem. To obtain the global Pareto frontier of the two objective functions, the Multi-objective Generic Algorithm (MOGA) was applied [40]. To invoke the algorithm, gamultiobj a customized MATLAB function [41] was used. This function has the ability to use a controlled elitist individual, which gives it an advantage over the simple genetic algorithm, and has been successfully applied in optimization works [42]. In construction of the Pareto-optimal solutions, the following input parameters were used. Population size of 100, Pareto-front population of 0.8, crossover fraction of 0.85, 1000 generations, and function tolerance of 10.
4. Discussion of results
4.1. Numerical Model Validation
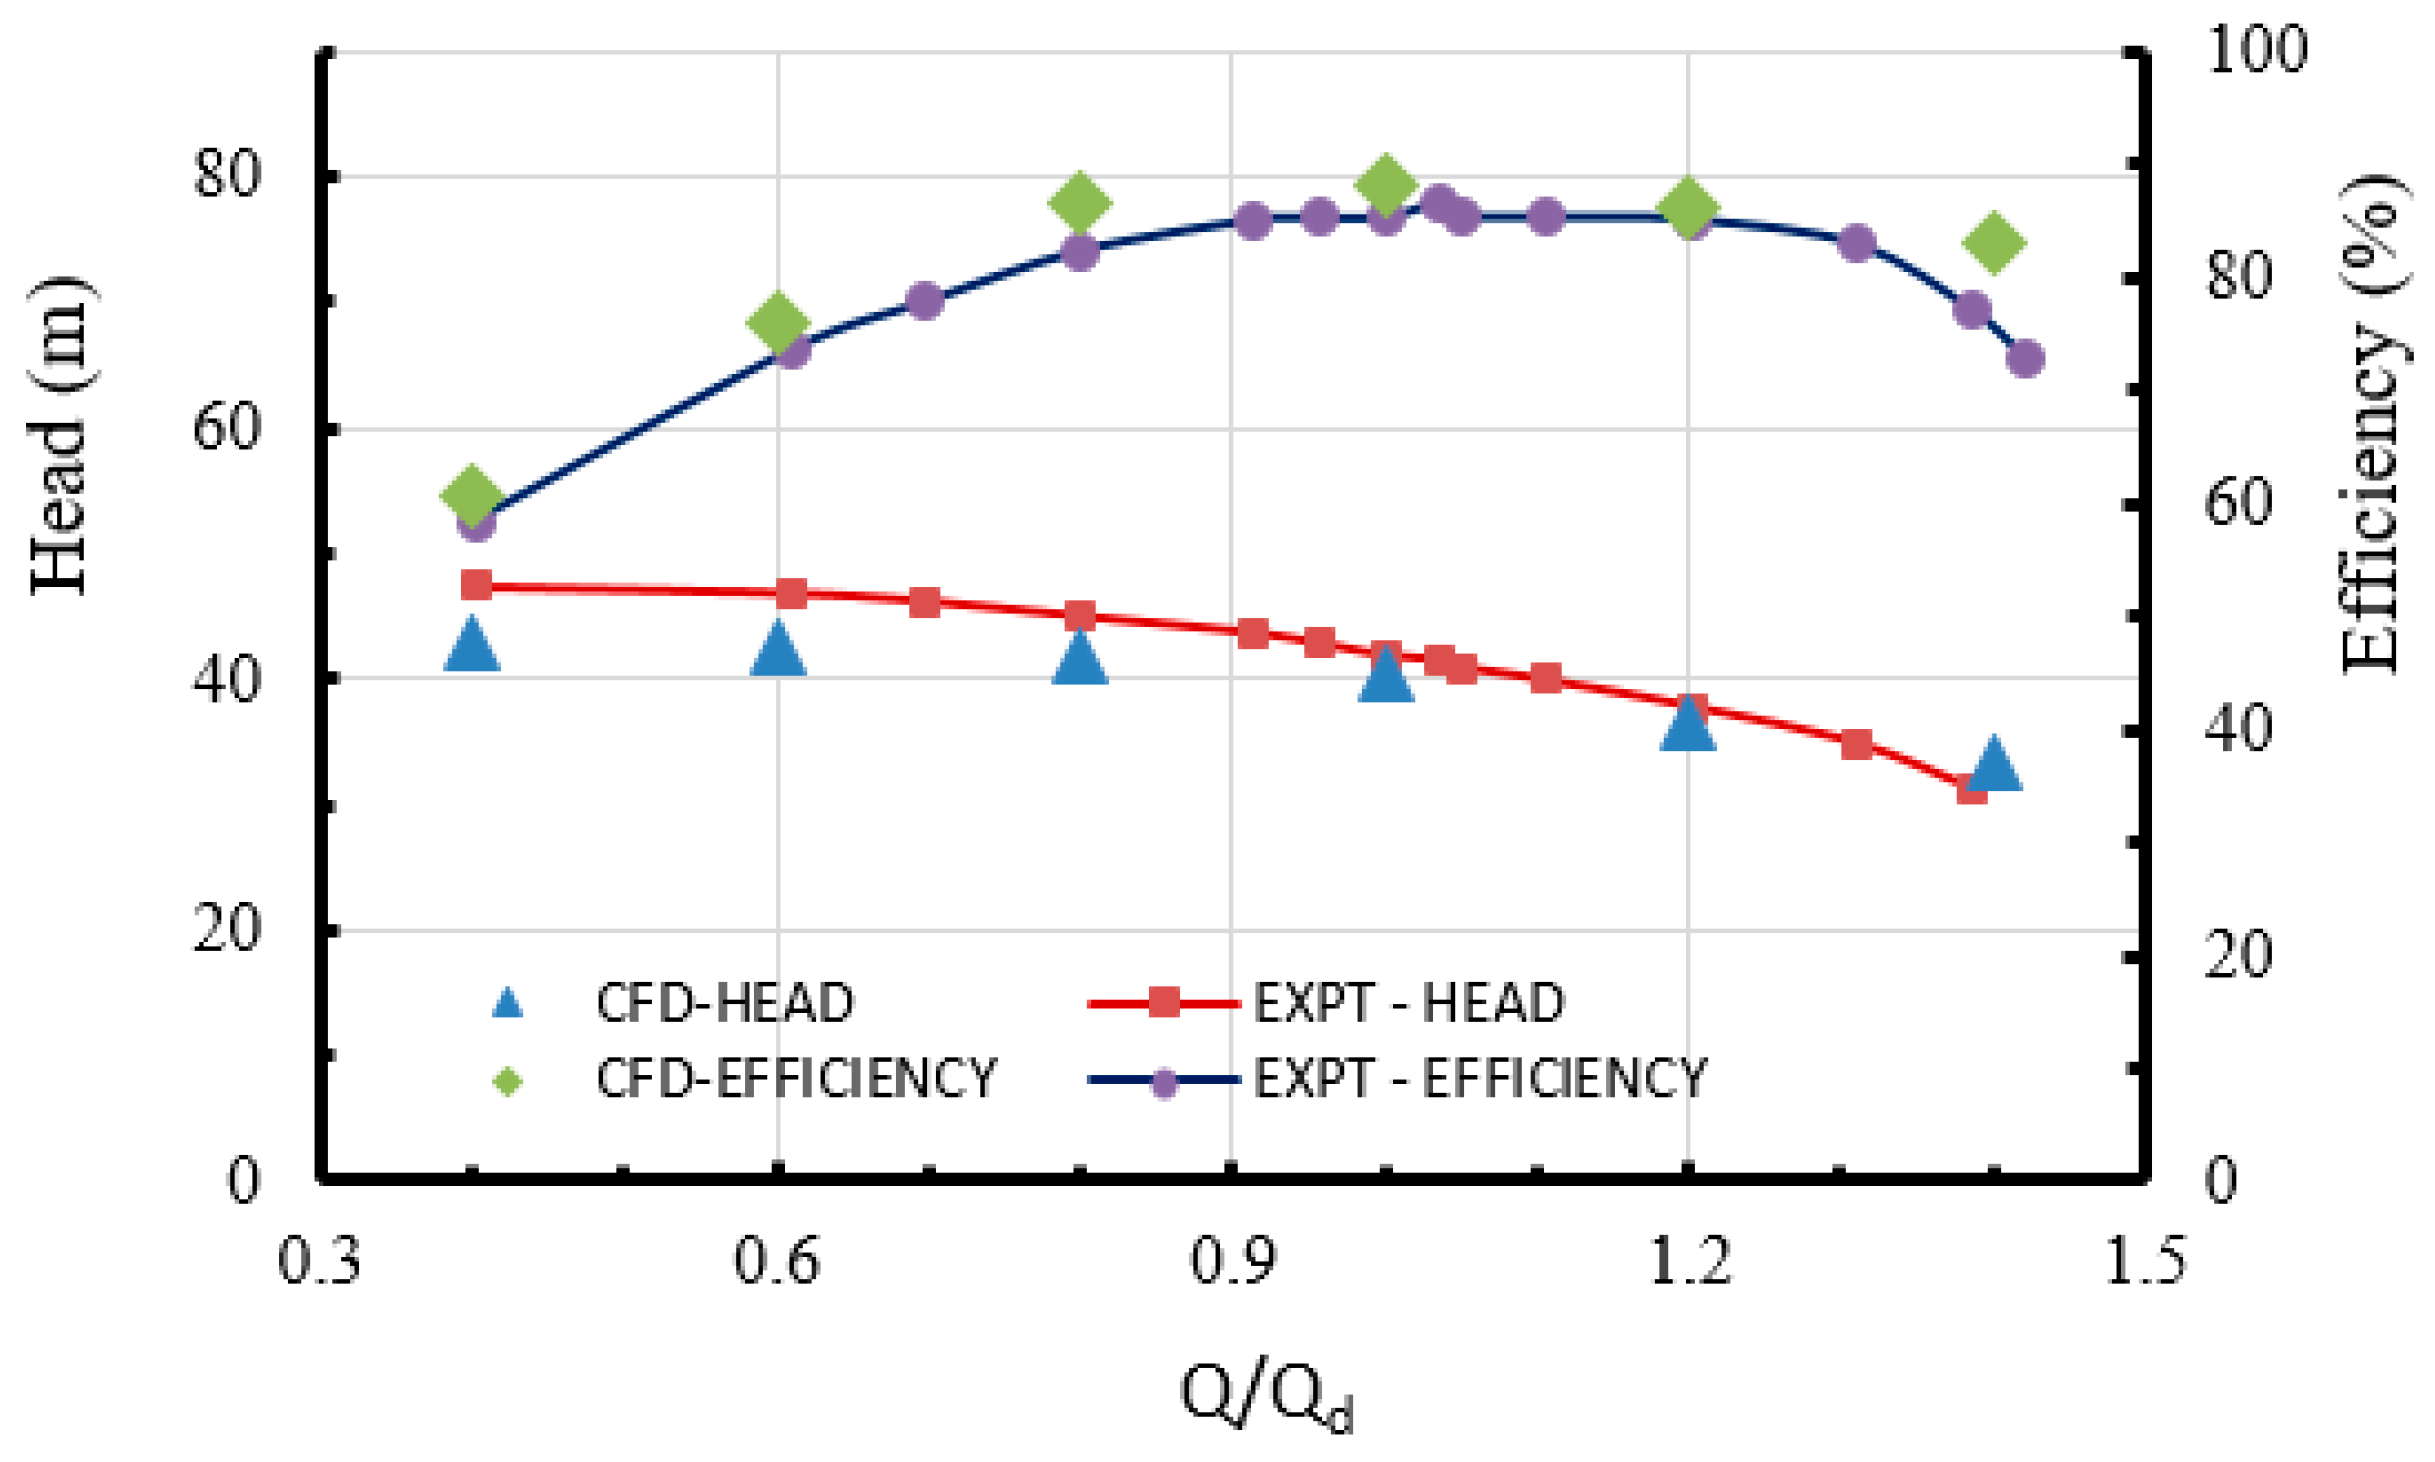
The efficiency calculated from the simulation results is the hydraulic efficiency only. To compare the simulation results with the experimental results, the overall efficiency of the pump, which comprises the hydraulic efficiency , the mechanical efficiency , and the volumetric efficiency has to be considered. This is because the experimental efficiency includes the hydraulic efficiency, volumetric efficiency and mechanical efficiency. Thus, following the examples from [24,43], the efficiency obtained from the simulation is further processed, before comparing with the test results. The mechanical efficiency is expressed as:
The Volumetric efficiency is expressed as:
The relationship between the efficiencies is expressed as:
Computational results from the numerical simulations were matched with the experiments in Figure 10. The pump head dropped gradually as the flow rate was increased, and the trend between the numerical and experimental heads were quite similar. The experimental head was, however, higher than the numerical head whereas the efficiency from the test results was lower than the calculate efficiency. The experimental head at the best efficiency point (BEP) was 41.49 m, and the corresponding efficiency was 86.63%, at a flow rate of 518.57 m3/h, whereas the BEP for the numerical predictions occurred at head 40.24 m and efficiency 88.39 %. The relative errors at the BEP were 3.01% and 2.03% respectively. The experimental head at the design point was 41.83 m and efficiency 85.20%. Overall, the agreement between the results from the experiments and the simulation was very good, and this affirmed the reliability of the numerical approach.
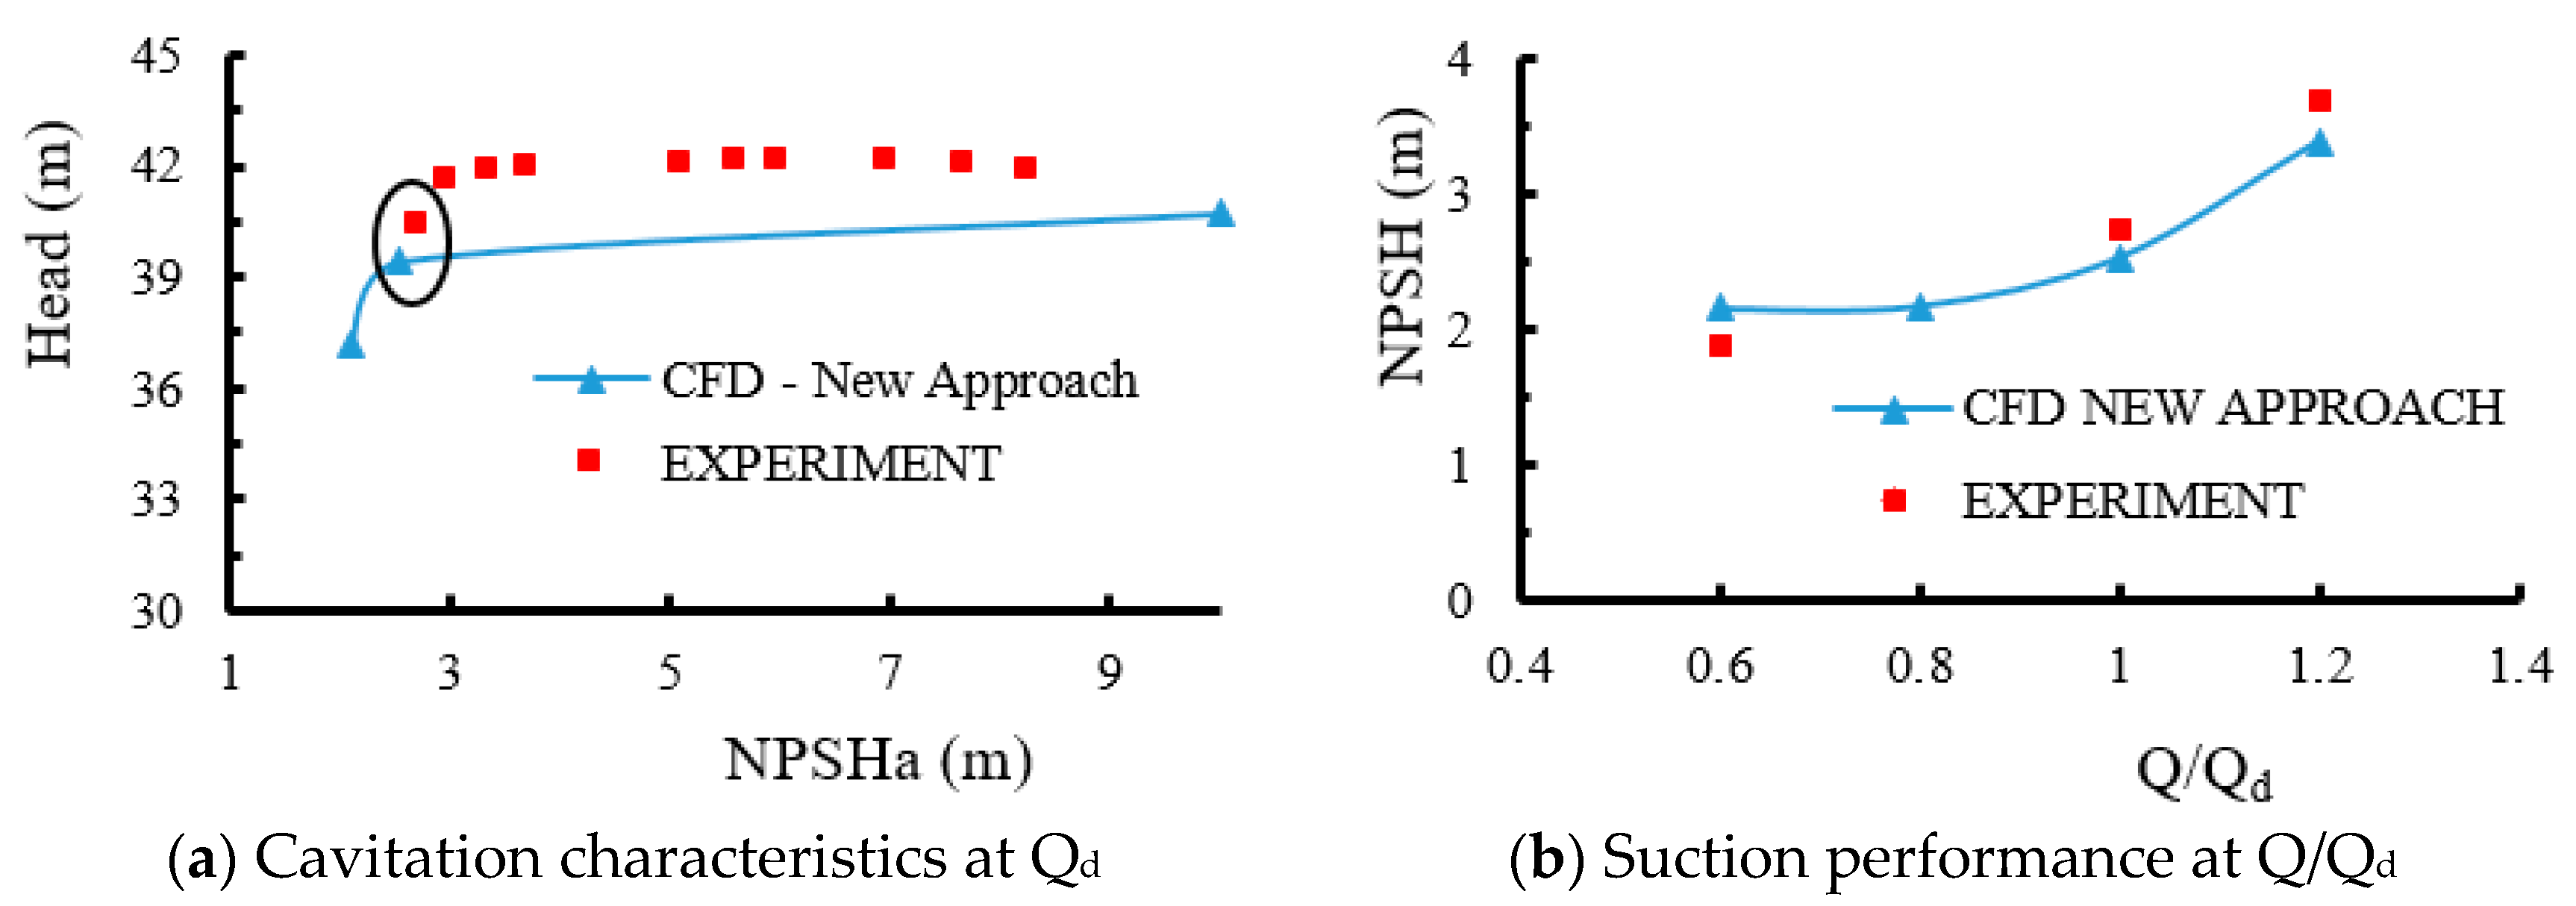
A comparison of the cavitation characteristics at the pump design point, Qd, between the simulation and the experimental results is shown in Figure 11a. The calculated NPSHr was 2.532 m at a corresponding head drop of 3.12%. The deviation between the unsteady simulation and the experimental NPSHr for the design flow rate was calculated as 4.05%. It can be noted that both calculated and the test measurements for the NPSHr did not exceed the design NPSHr, and the characteristic “sudden” head-drop was very well predicted by the numerical simulation. The suction performance at different flow rates for the numerical and experimental results are compared in Figure 11b. The computational results were relatively higher than the experimental test values at part load conditions of O.6Qd and comparatively lower at design and overload conditions. That notwithstanding, the deviations were minimal and therefore the numerical results agreed well with the experimental results to established the suitability of the numerical approach for simulating and predicting cavitation flow in centrifugal pumps.
4.2. Optimization Results
4.2.1. Comparison of CFturbo Impeller to Original Impeller
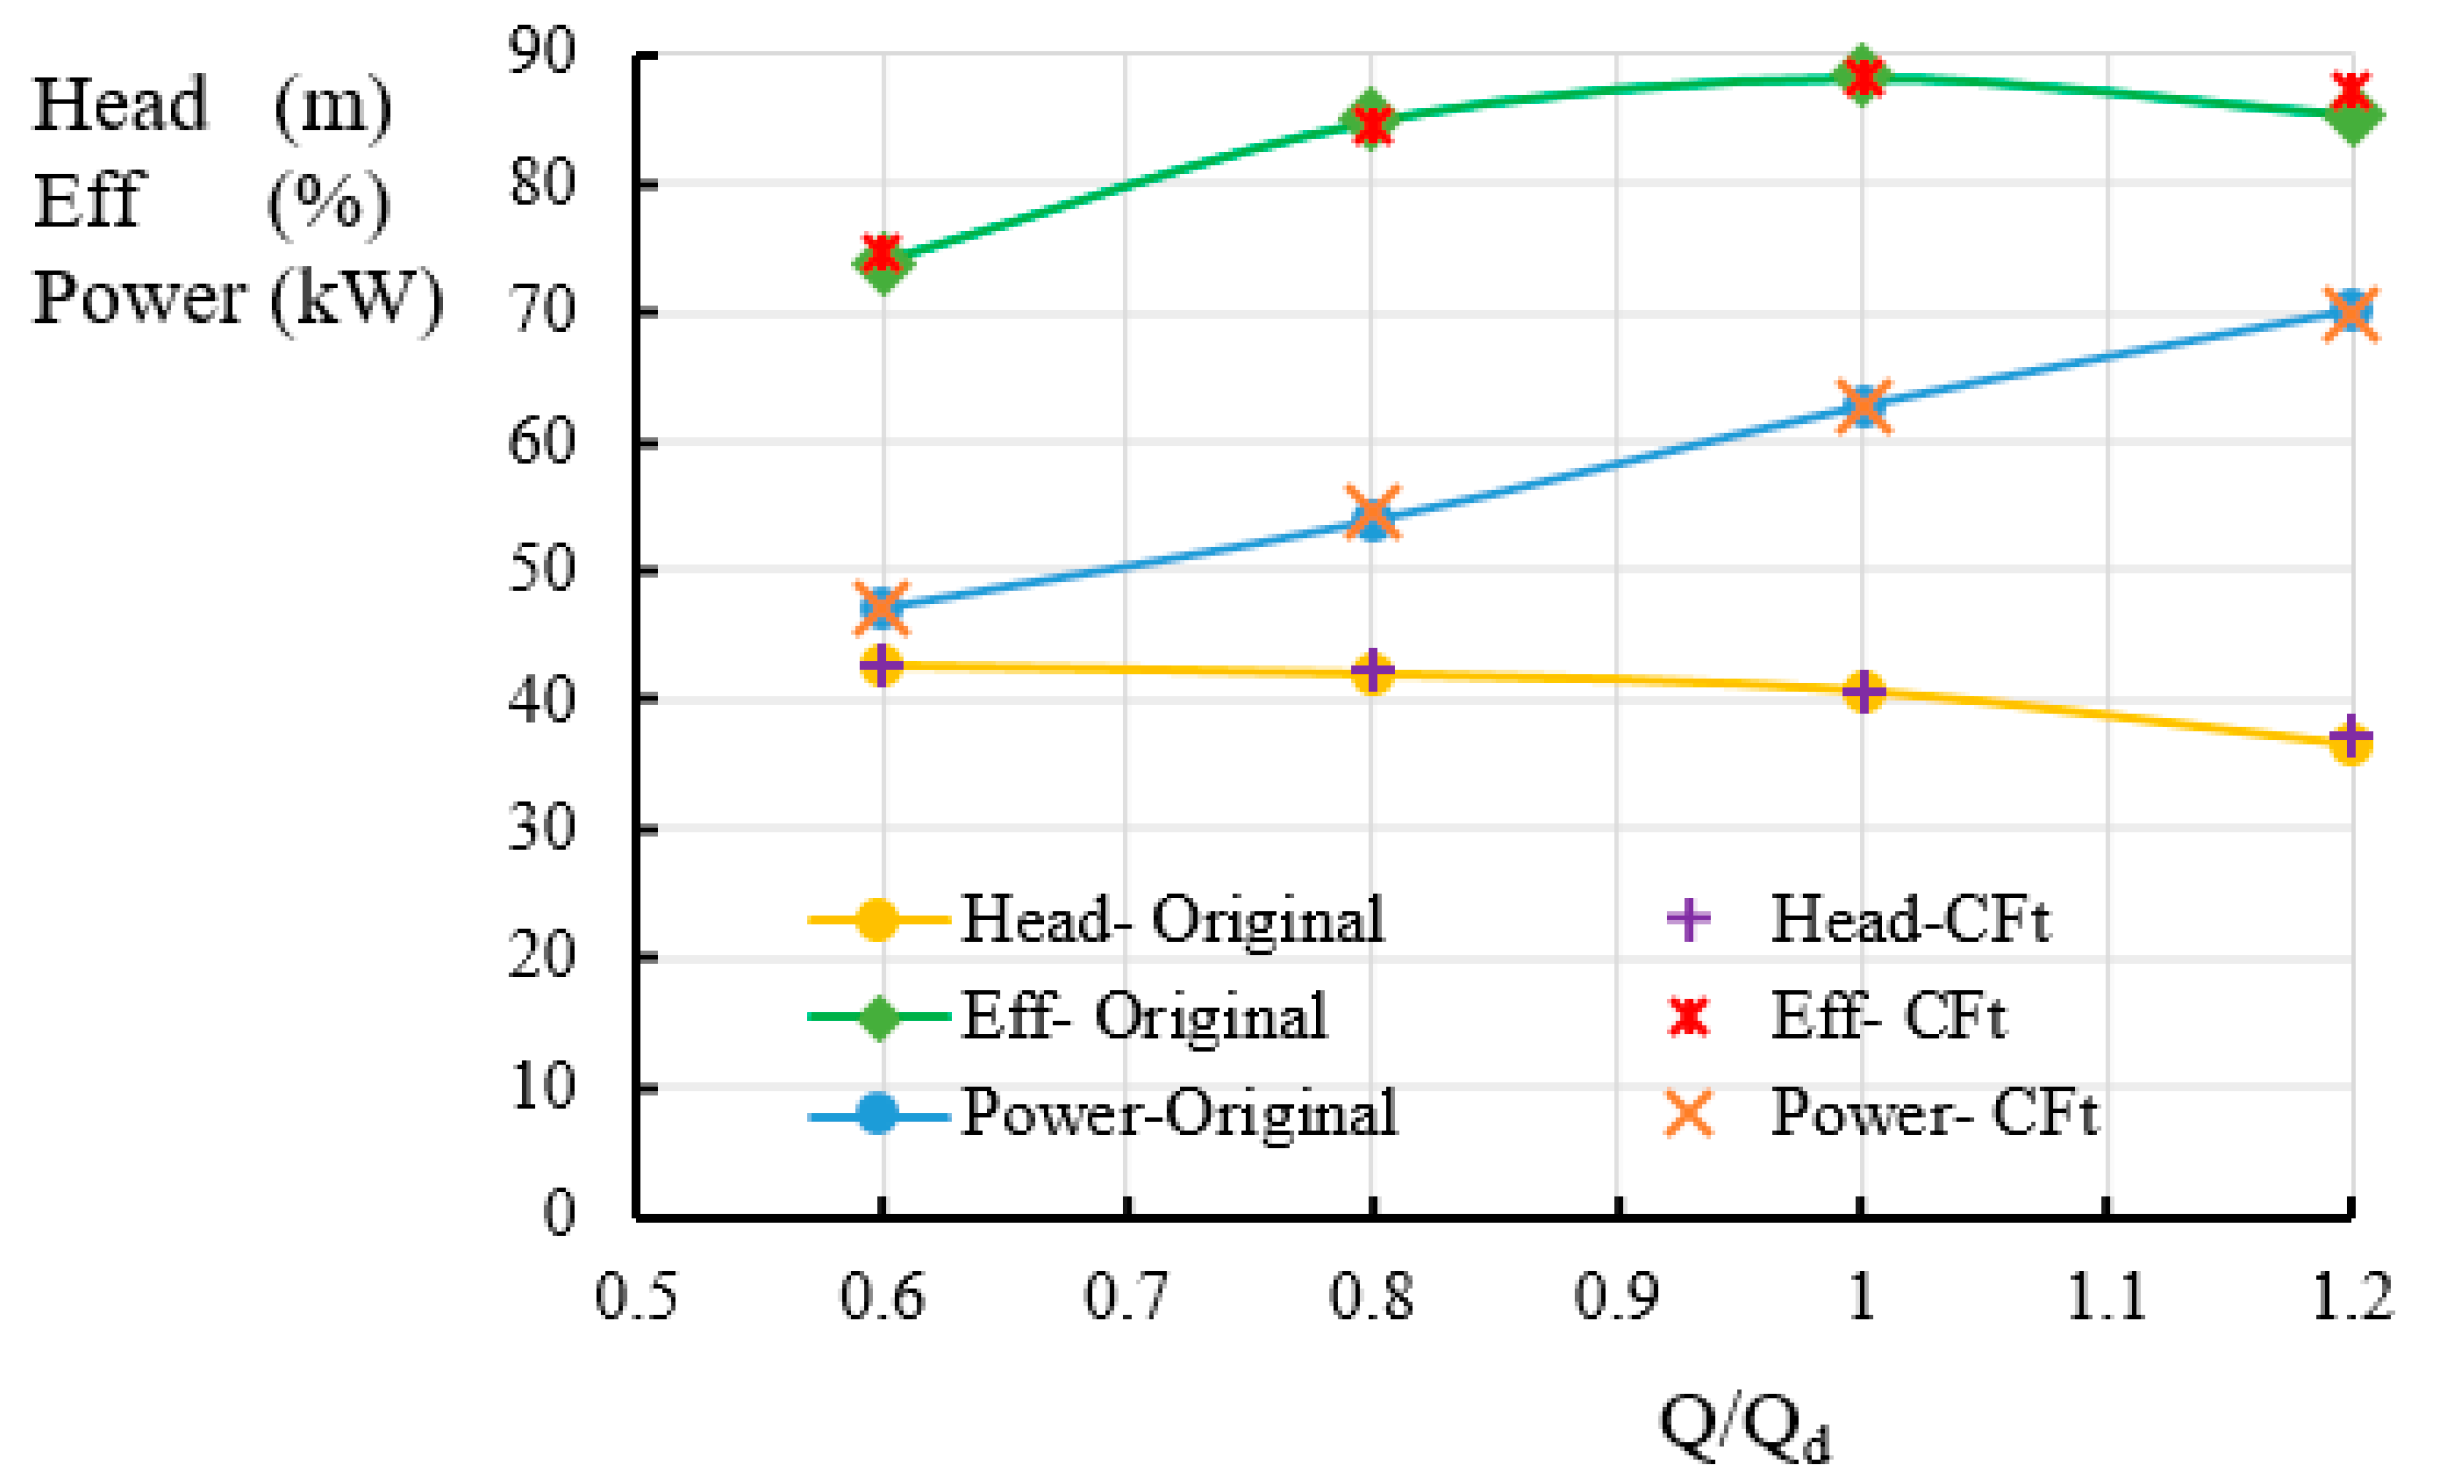
The hydraulic performance characteristics of the design impeller built with CFturbo (CFturbo® GmbH) is compared with the original model. This is to validate the new design schemes to be produced by the CFturbo hydraulic software. For all three characteristics compared, the design condition recorded the lowest deviation of 0.4% for power and head, whereas the deviation in efficiency was 0.03%. This is shown in Figure 12. Looking at the margin of deviation, there was a perfect agreement between the two models, indicating that the model built by Cfturbo hydraulic design software could be used for the design of 3D models according to the design variables.
4.2.2. Orthogonal Test Results
4.2.3. ANN Metamodeling and Validation
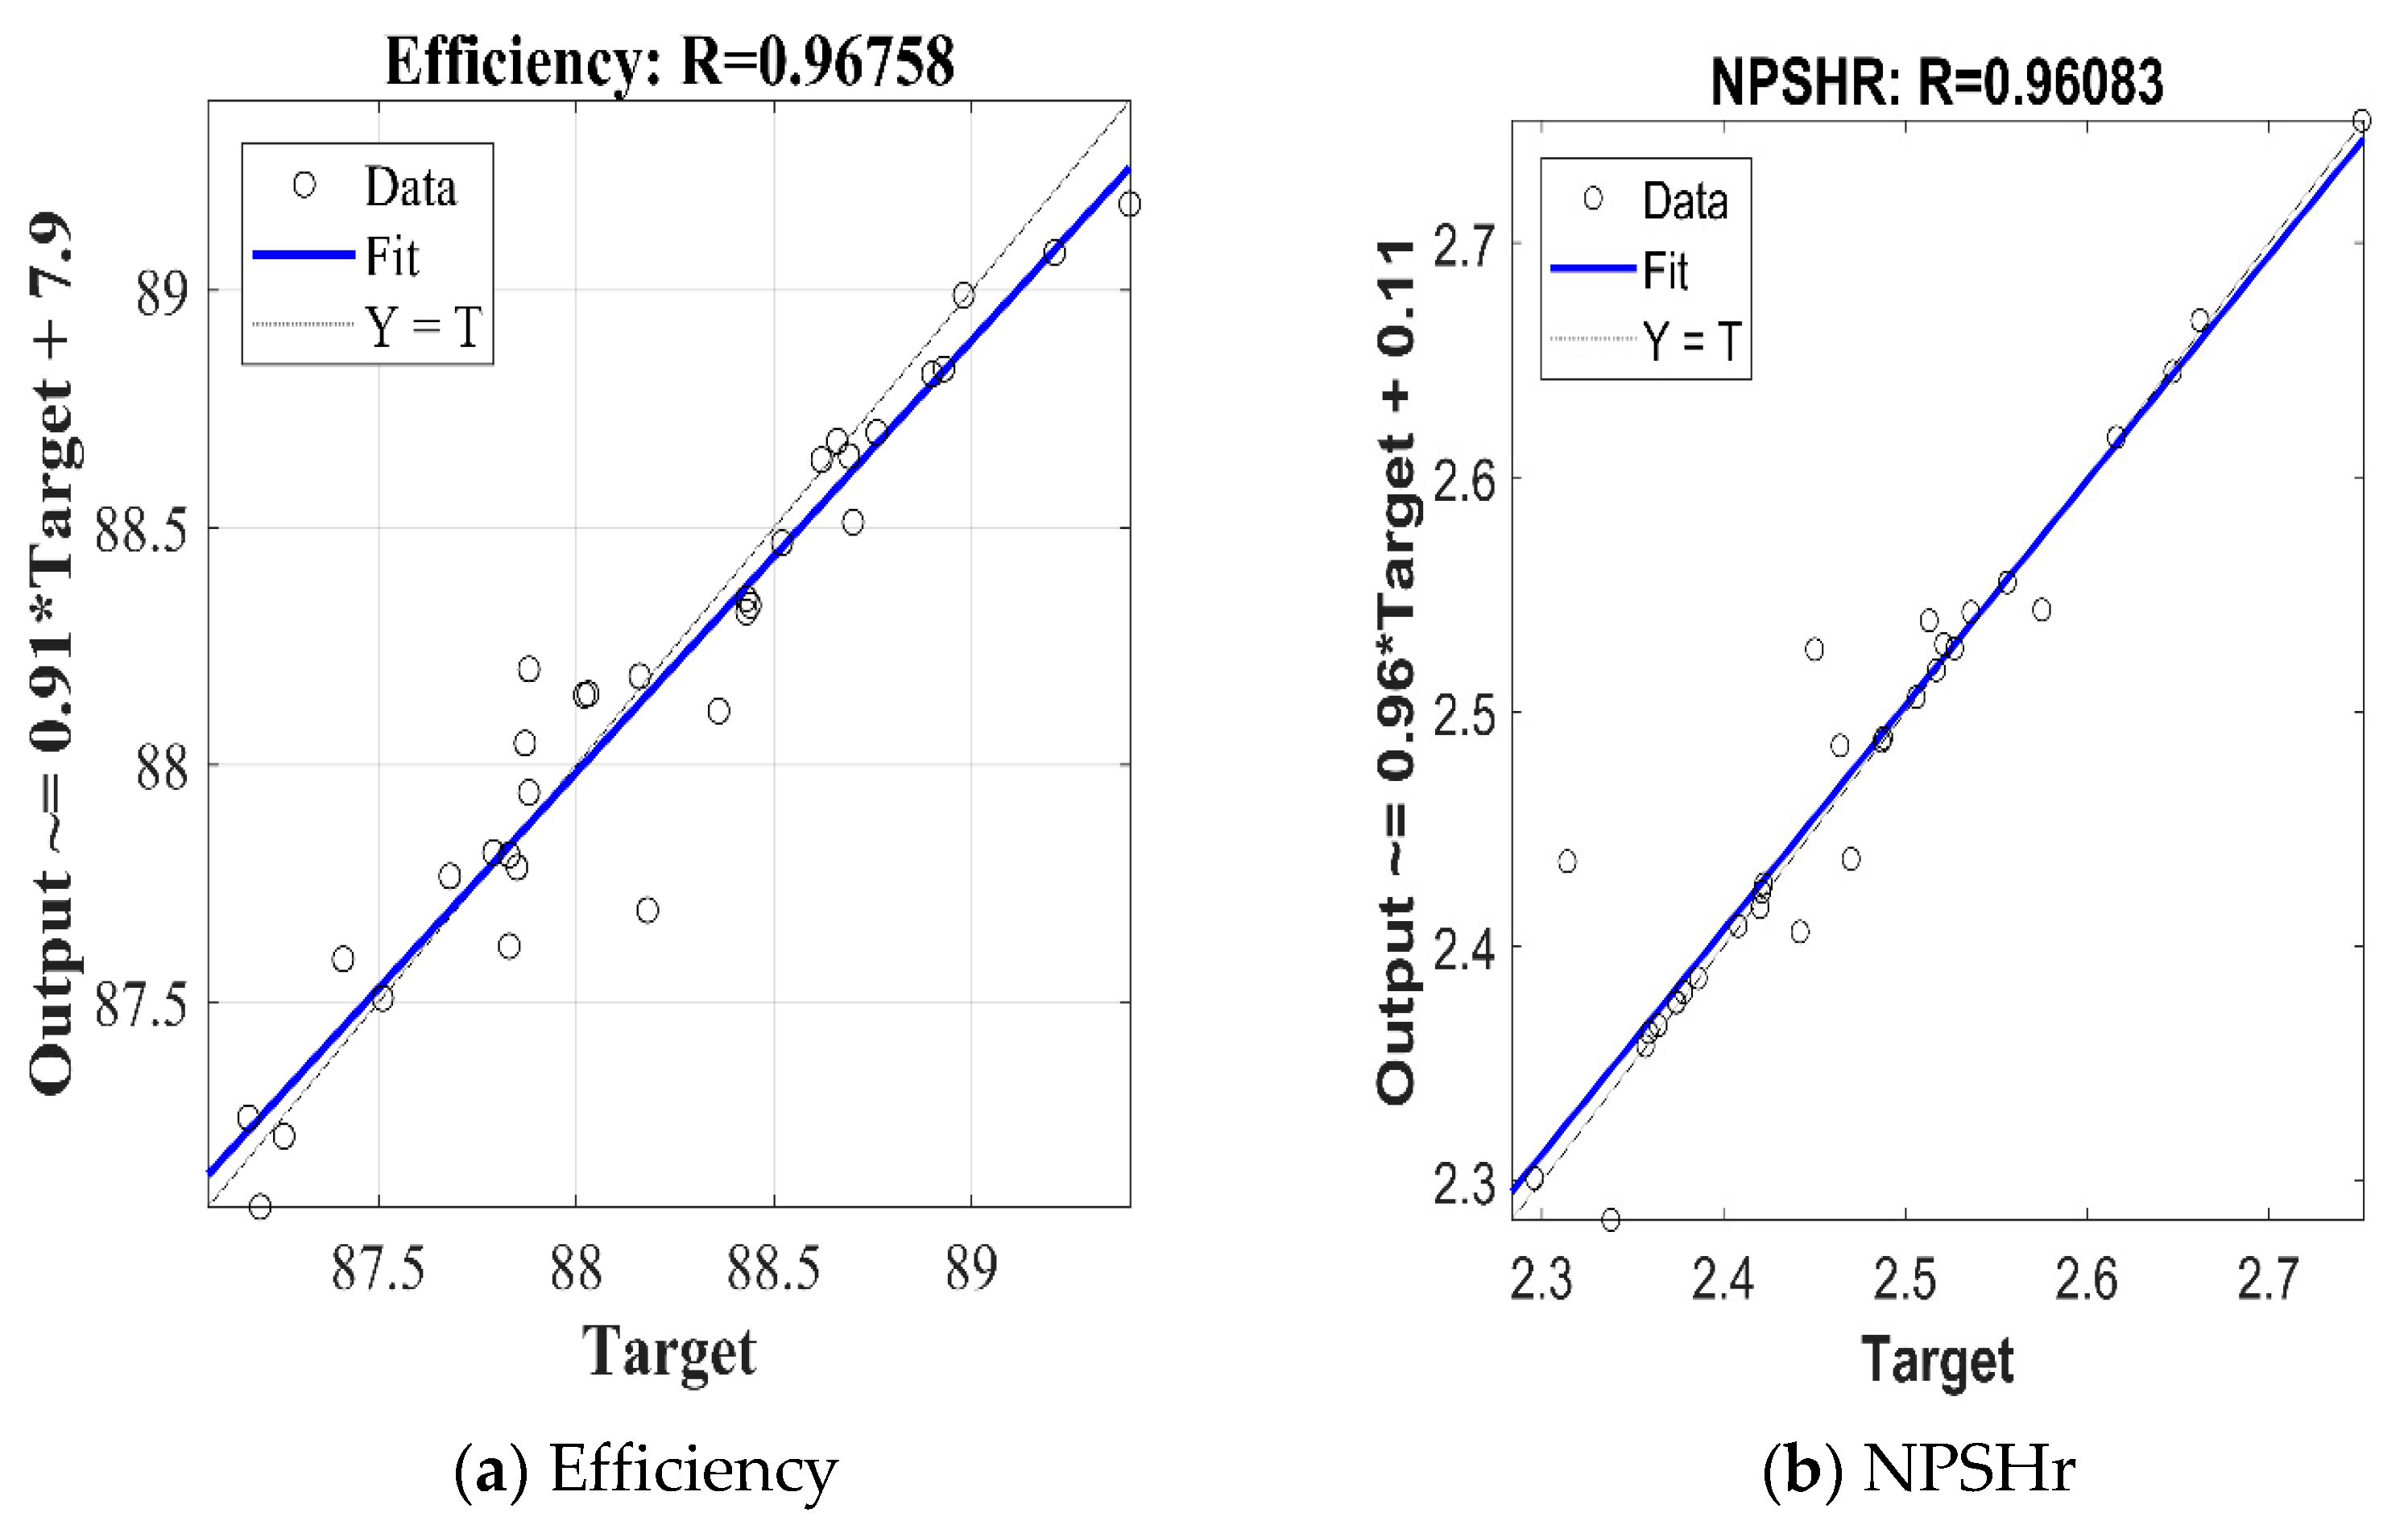
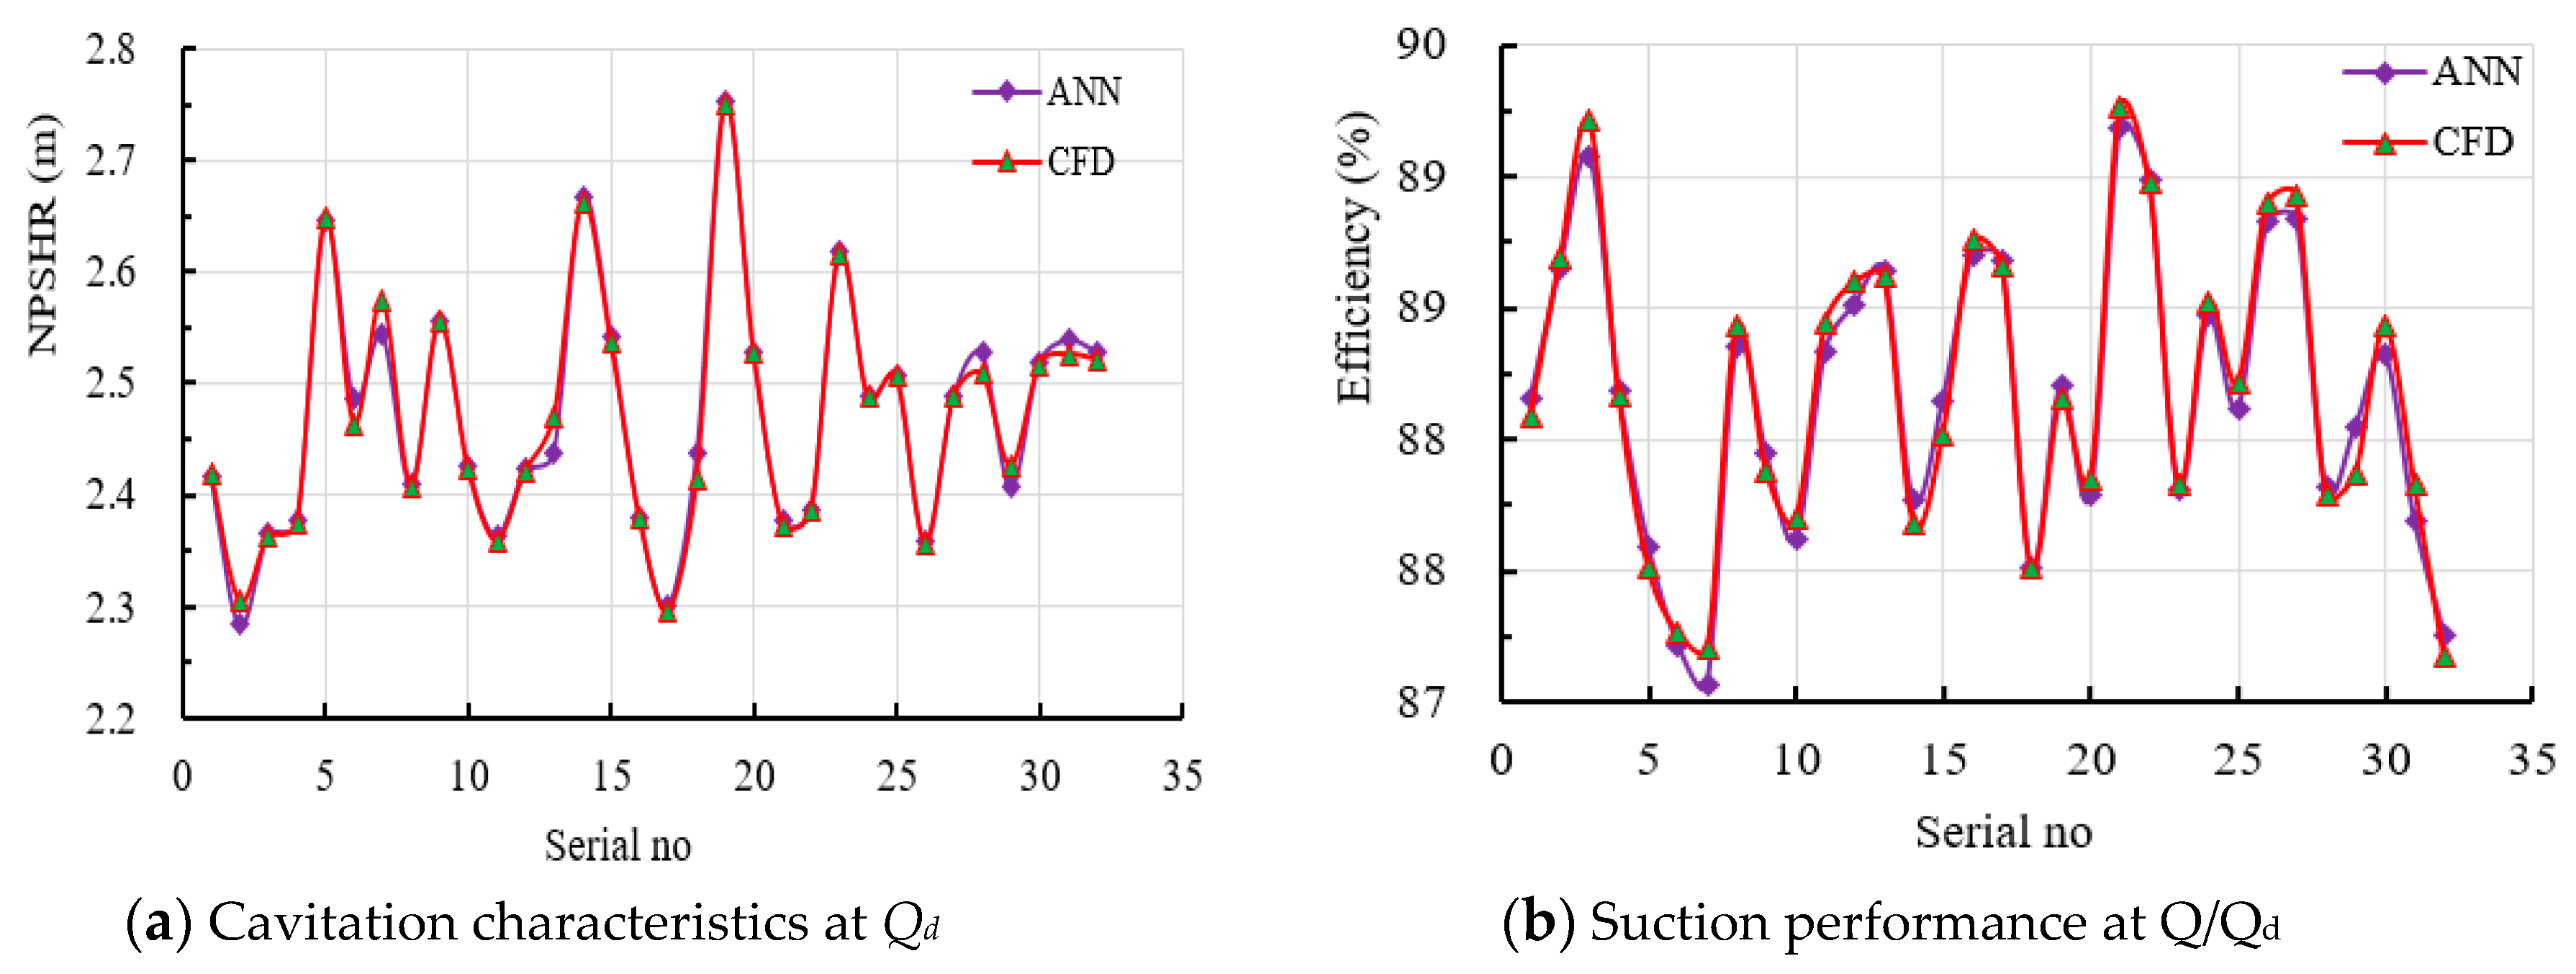
Artificial neural networks were adopted as the metamodel to build the relationship between the two objective functions and the design variables for optimization. To determine the suitability of the surrogates for further optimization, the R-square analysis was carried out to measure the strength of the relationship between the linear model and the dependent variable. Figure 13 shows the R-square of the ANN models of the objective functions. The R-square values for both efficiency and NPSHr were calculated as 0.96758 and 0.96083 respectively, indicating that the ANN models for can be applied to the multi-objective optimization since the prediction accuracy is high enough. As from previous works, validation of a metamodel is a requirement before it can be used as a surrogate [17,44]. A comparison of the ANN prediction and the CFD simulation results from is drawn in Figure 14. From the graph, the predicted ANN model values are in agreement with the CFD simulation values. Hence, both NPSHr and efficiency would be used as objective functions in the multi-objective optimization.
4.2.4. Optimal Solution Solving-MOGA Solutions
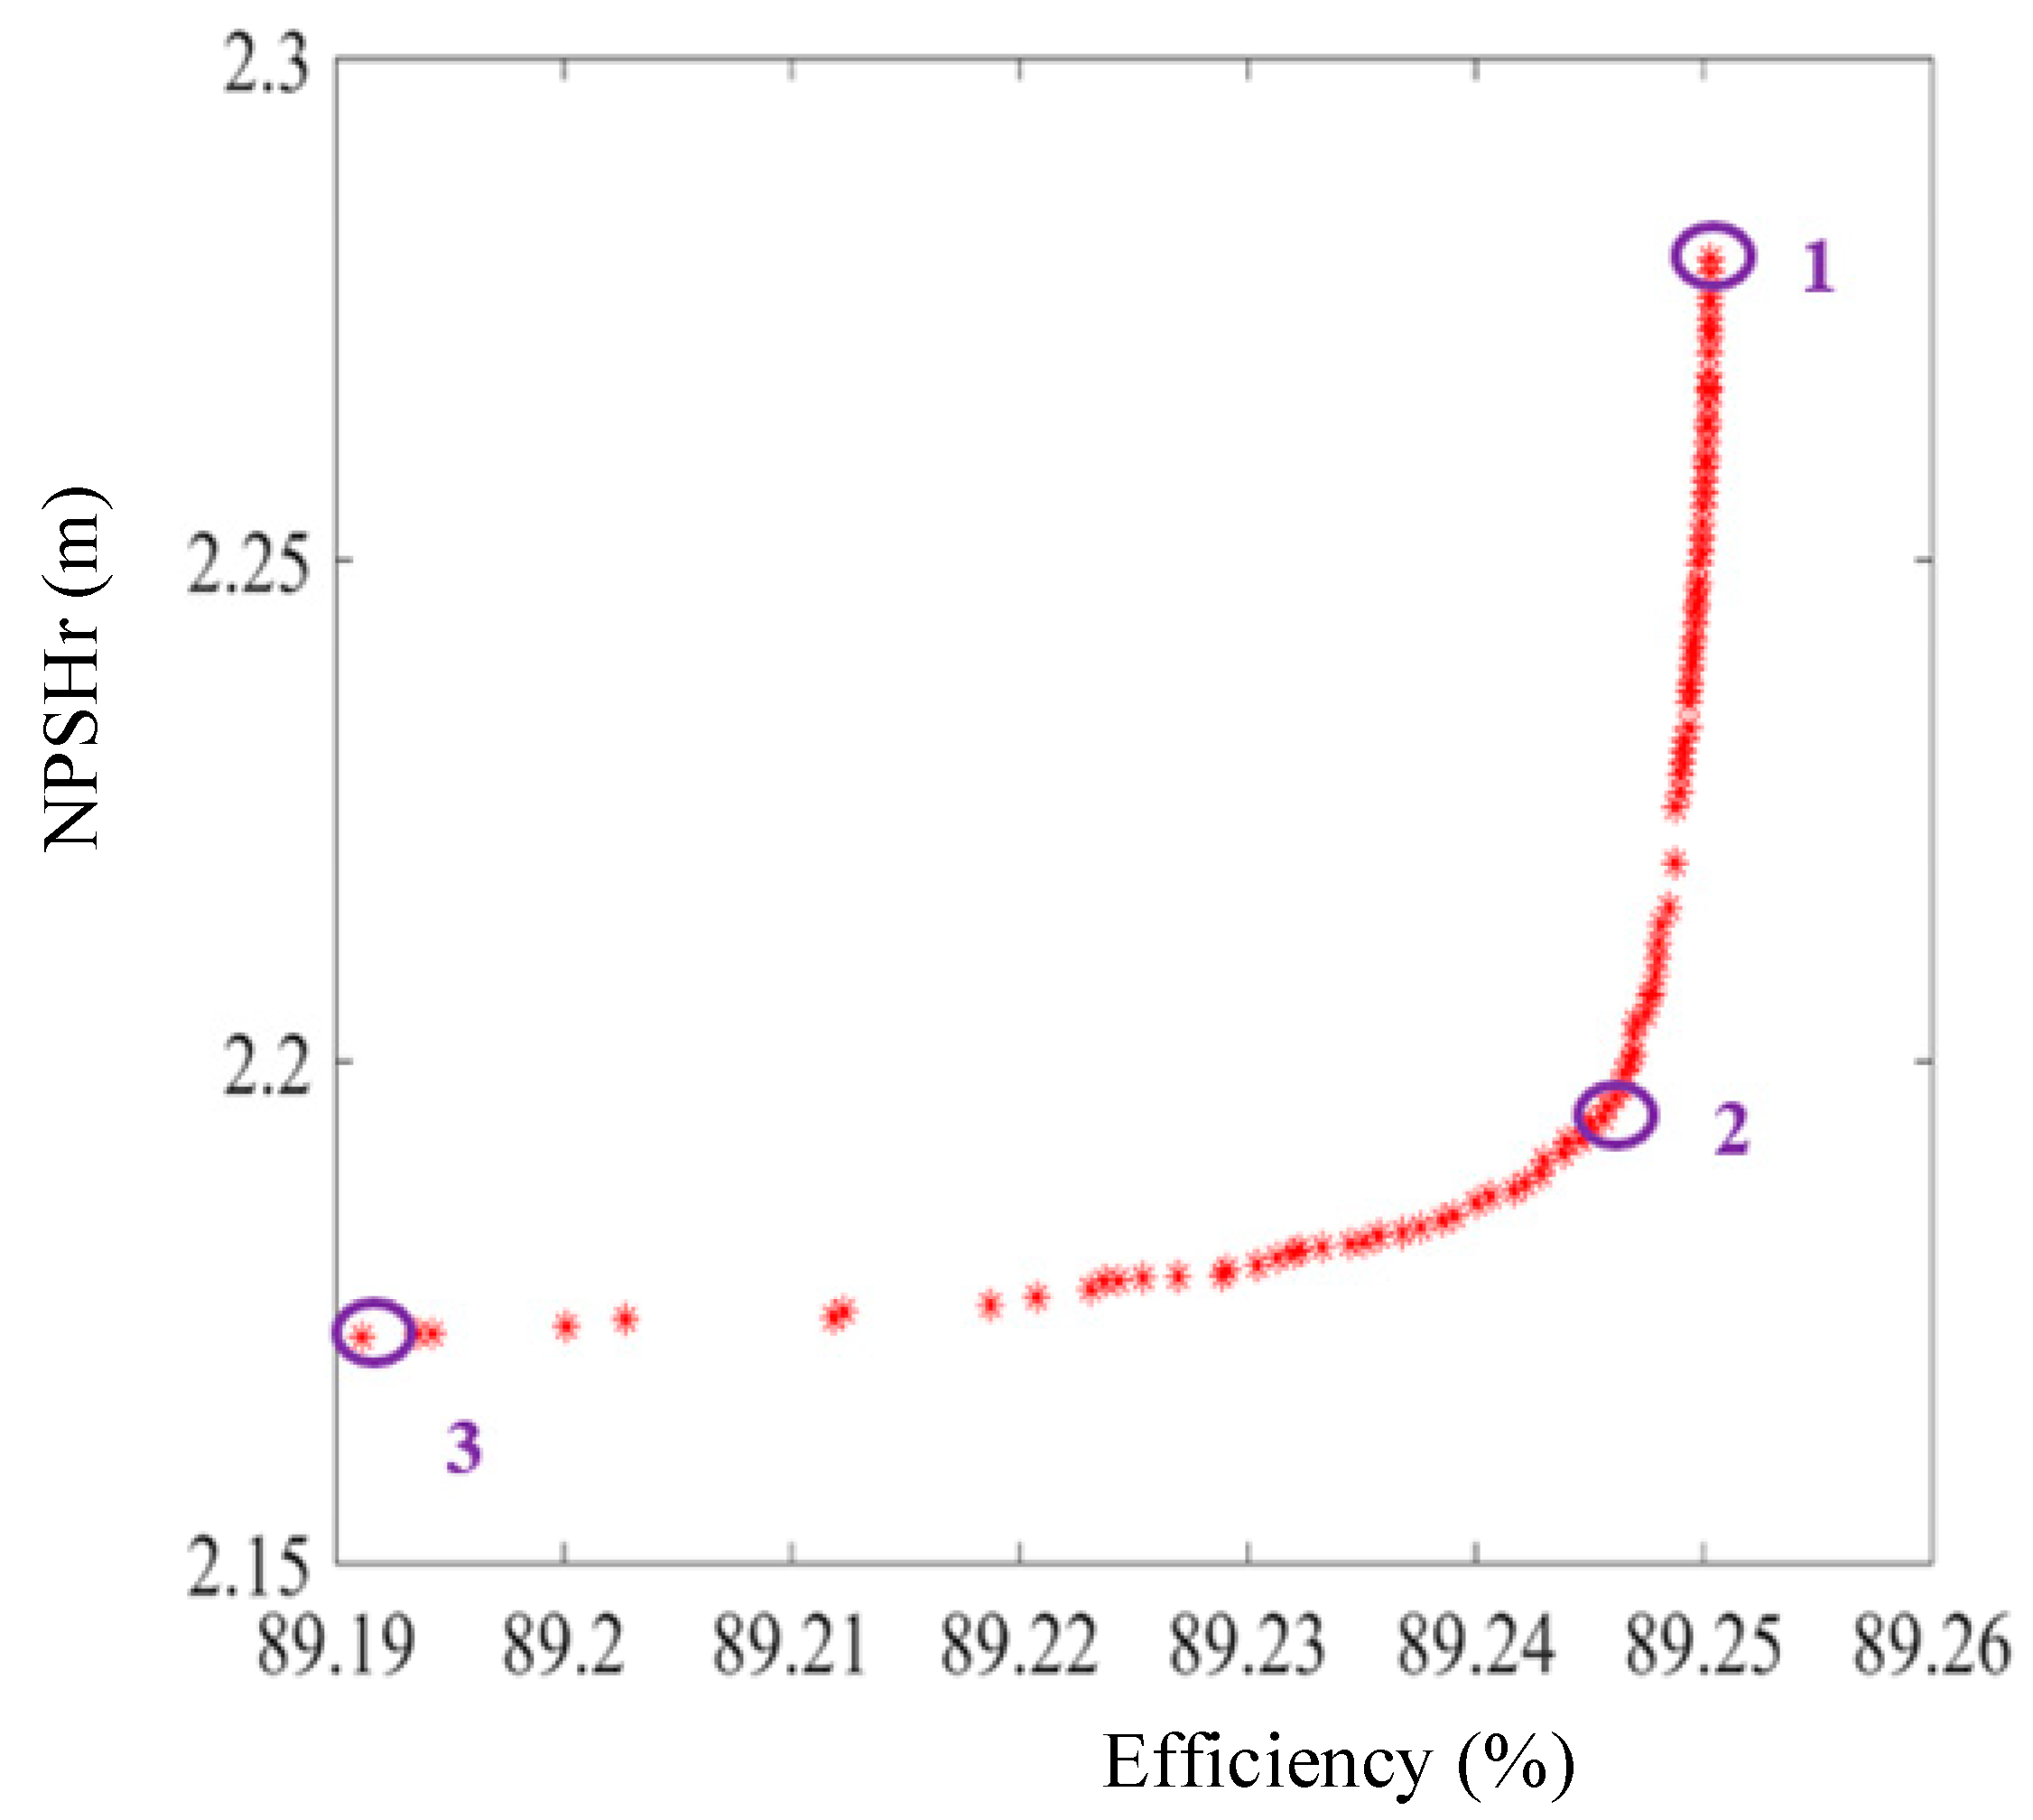
The multi-objective generic algorithm was applied to establish an optimization model with MATLAB. The Pareto frontiers from ANN for the two objective functions have been presented in Figure 15. The pareto solutions presented a set of 100 optimal schemes that satisfied both objective functions. In real pump applications, it is necessary to maximize economic benefits; hence, a maximum efficiency point was considered. Consequently, the lower the suction performance the more resilient the pump is to cavitation, and so the minimum NPSHr point was also considered. A third point, the middle point is also considered. Three impeller schemes were then built according to the optimum decision variables in Table 6 and simulated with ANSYS 19.2 (ANSYS Inc.).
The comparison of the original case and the calculation results from the three optimal cases at the design condition is presented in Table 7. Although the head is not an optimization objective, it shouldn’t be made worse. For all the 3 cases, the head of case 1 reduced by 5% even though it had the highest increase in efficiency of about 2.6%. There increase in efficiency of case 3 is 0.08%, which is almost negligible. Case 2 however increased its efficiency by 1.53%. For NPSHr, the cavitation performance for case 2 improved tremendously by 7.26%, whereas that of case 3 recorded the best cavitation performance by improving 8.21%. Despite case 3 performing slightly better than case 2 for cavitation performance, optimized case 2 would best suit the multi-objective optimization since its increase in efficiency is much significant. The selected best case was modelled with the original suction and volute units and numerically simulated for the optimization objectives.
4.2.5. Comparison of External Characteristics—Optimized with Original Design
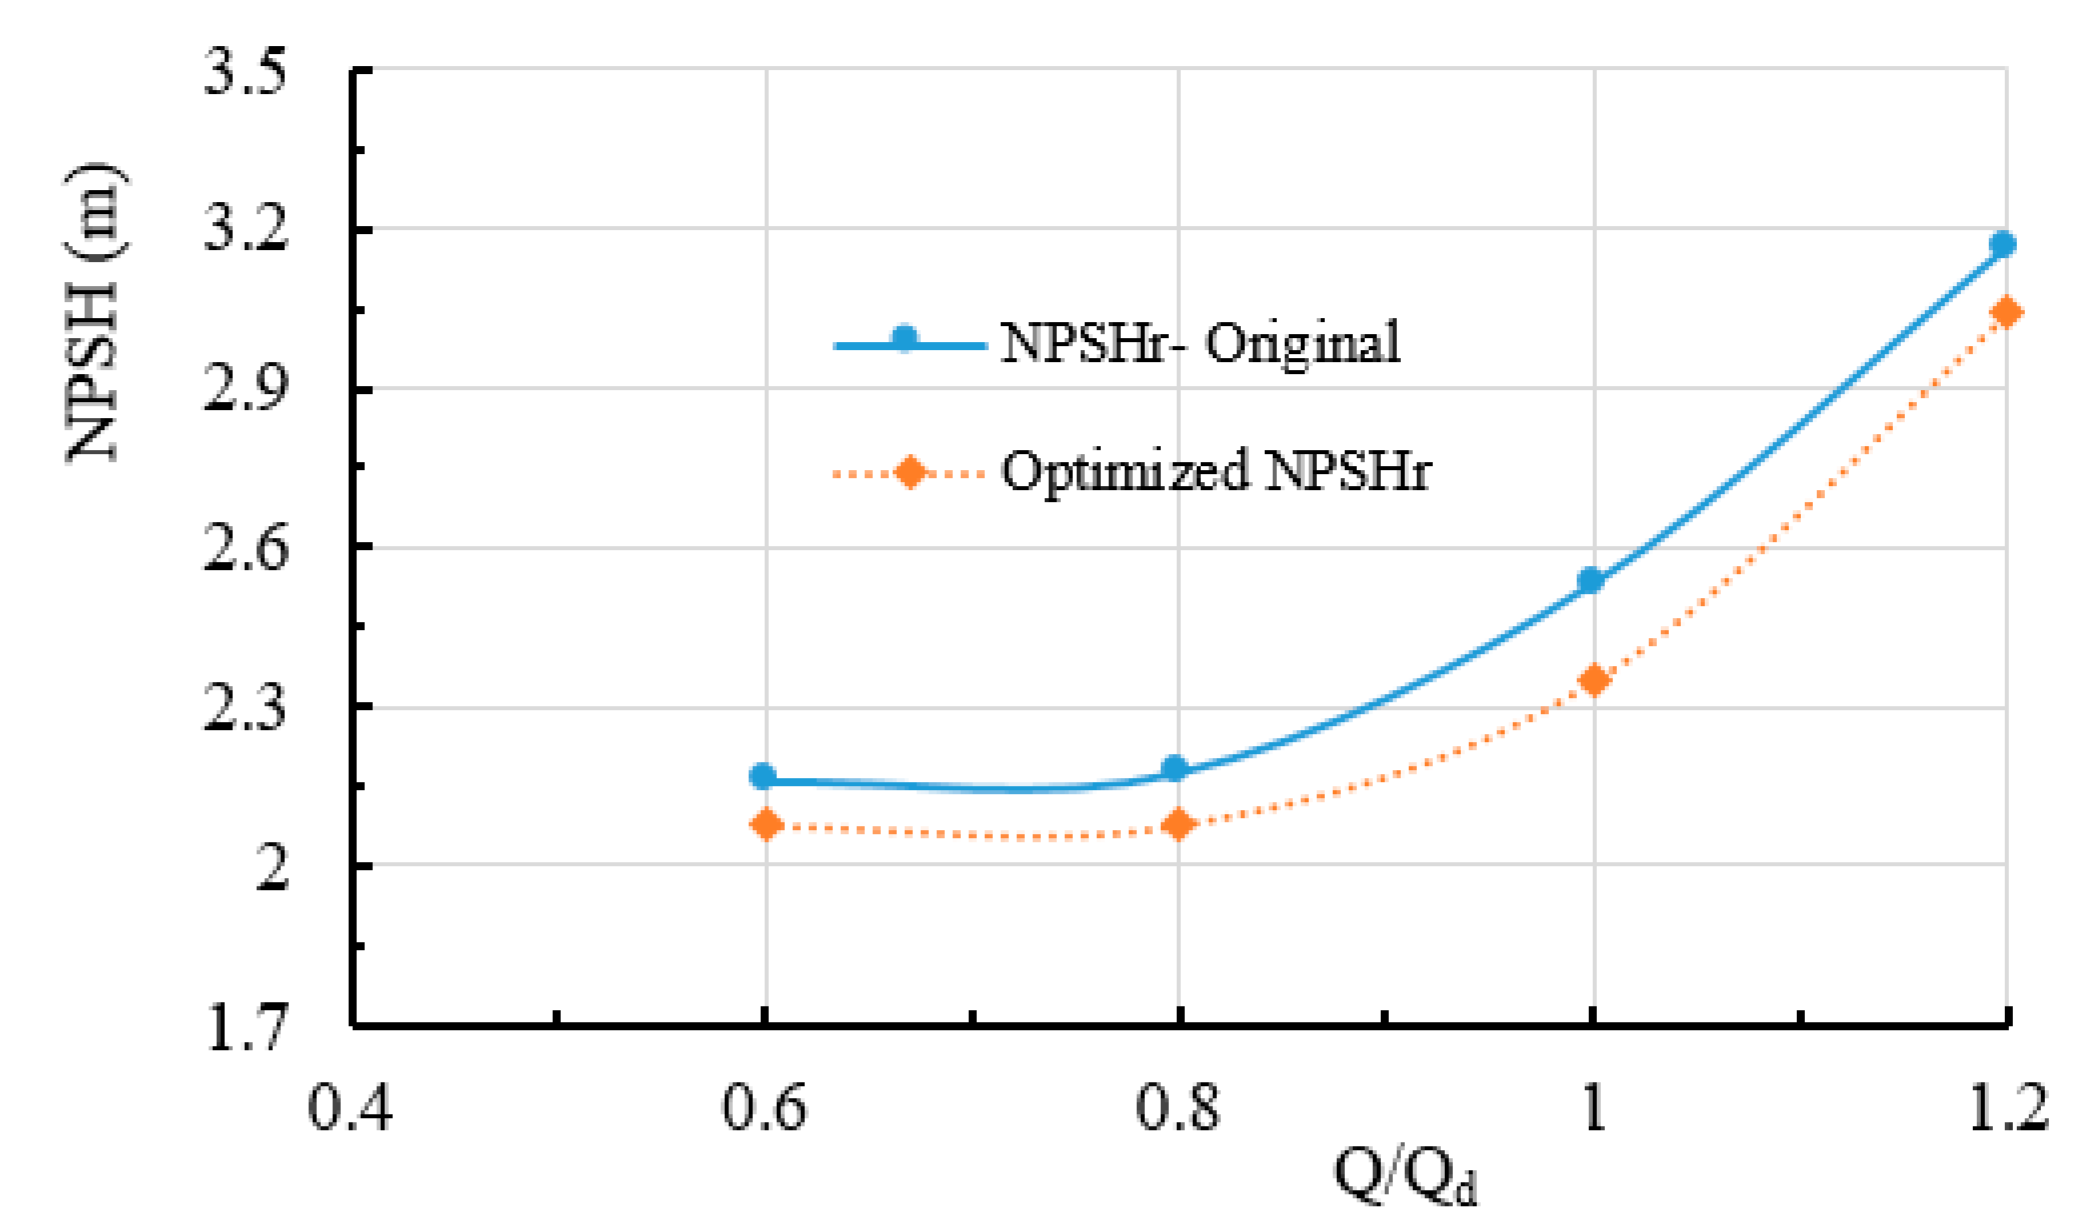
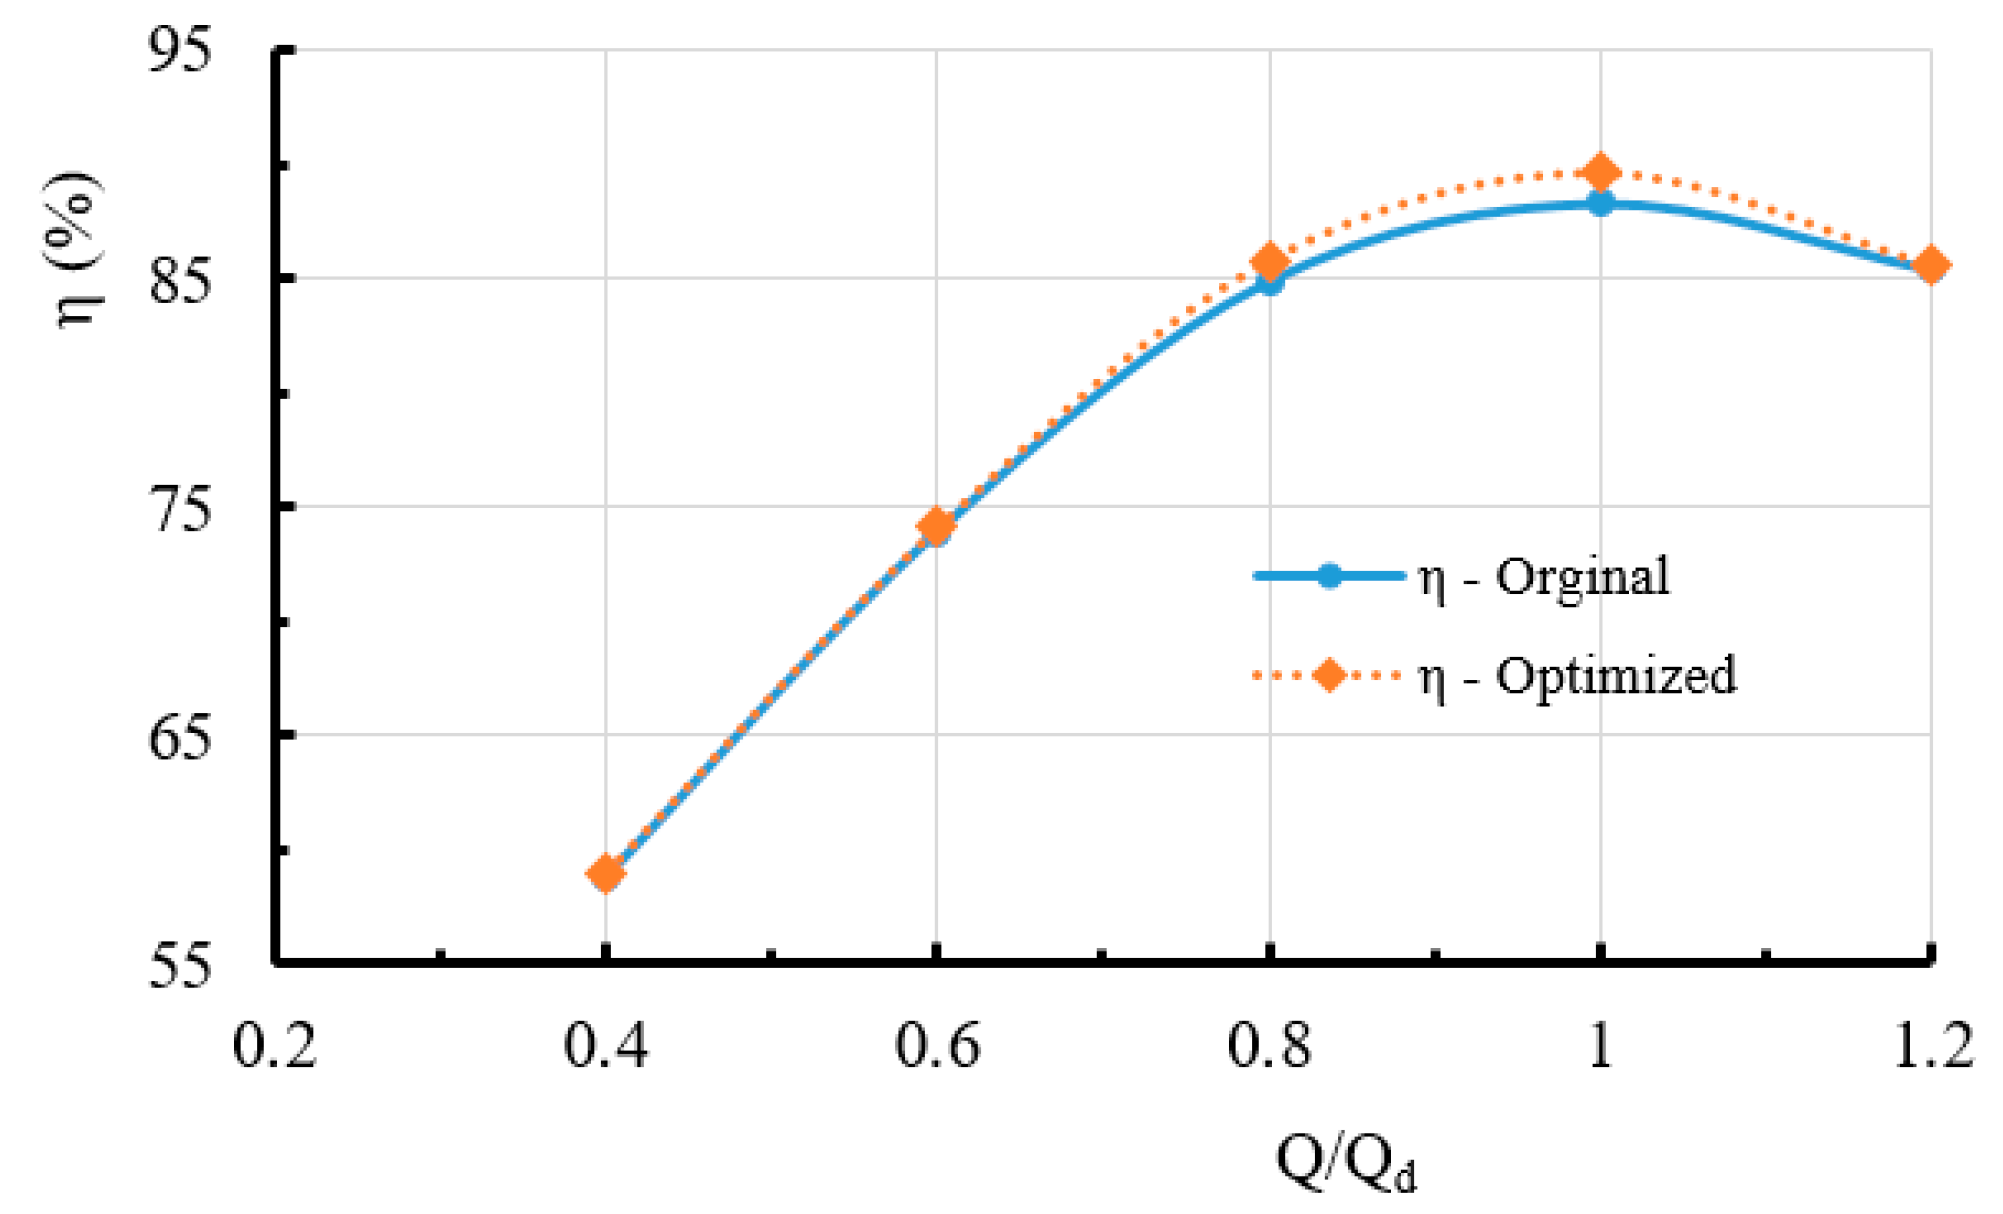
Figure 16 is a comparison of the predicted NPSHr for the optimized impeller and the original model at different flow conditions. It can be seen from the graph that the optimized impeller had improved cavitation performance as compared to the original impeller. There was a 7.26% improvement in suction performance at the design point. Comparatively, the improvement in suction performance decreased slightly as the flow moved from the design point. At 1.2 Qd, the suction performance was improved by 3.9%. At part loads however, the improvement in suction performance was 3.8% and 4.5% for 0.6 Qd and 0.8 Qd flow conditions respectively. The predicted efficiencies for the optimized and original impellers were also compared in Figure 17 at off design conditions. The maximum increase in efficiency which is 1.53% occurred at the nominal flow rate. At 0.8 Qd, there was in increase in efficiency of 1.1%. At overload and deep part loads, the effects of the optimization of hydraulic efficiency was very little, with 0.4 Qd improving by only 0.2%.
4.2.6. Internal Flow Analysis at 1.0 Qd
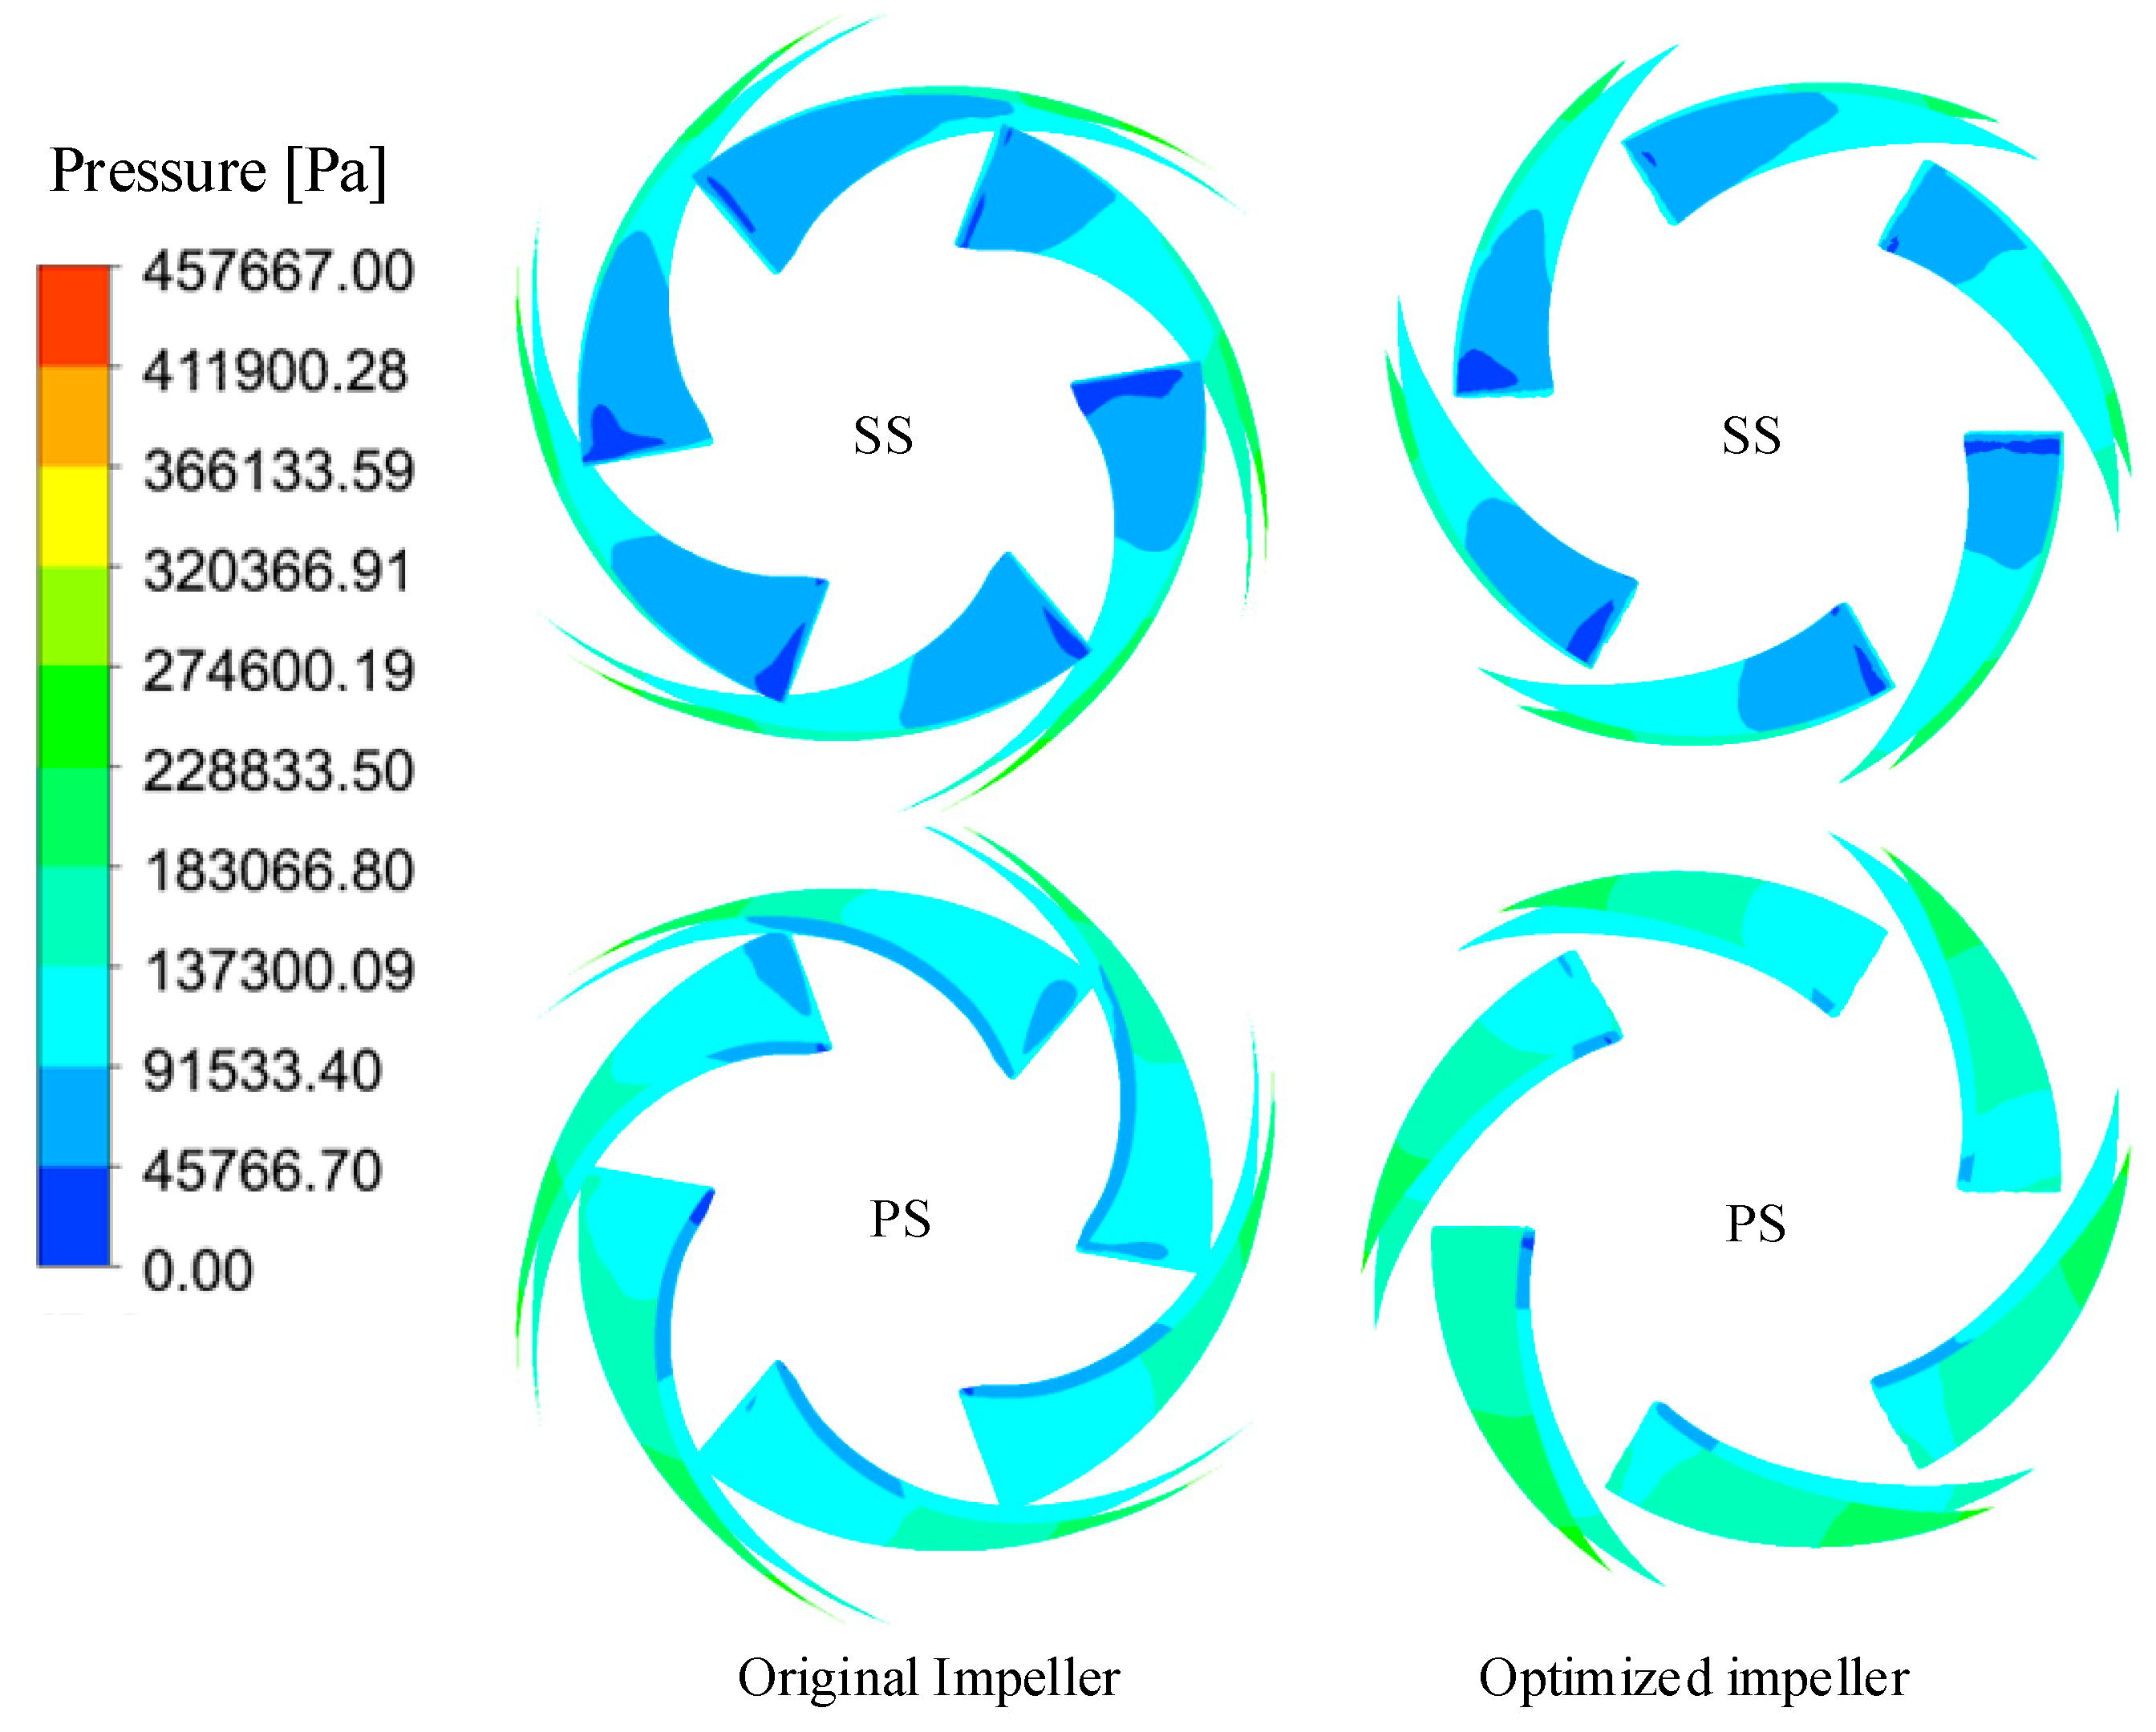
The static pressure distribution on the blade suction and pressure blade surfaces were compared at the design condition in Figure 18. For both the original impeller and the optimized impeller, the static pressure increased steadily with a smooth transition along the impeller’s radial direction. Generally, low pressure gradients existed in the blade leading regions, which moved towards the blade suction surface (SS). The optimized impeller however had relatively higher pressure distributions along the blade surface with original impeller having lower distributions in the leading regions. For the original impeller, the span of the low pressure regions went as far as the middle of the blade for the suction side. At the pressure side (PS) of the blade, the trend was same. Static pressure was much higher than the suction side which is very usual of the blade. The optimized blade saw much improvements in the pressure distribution, with the pockets of low pressure regions disappearing.
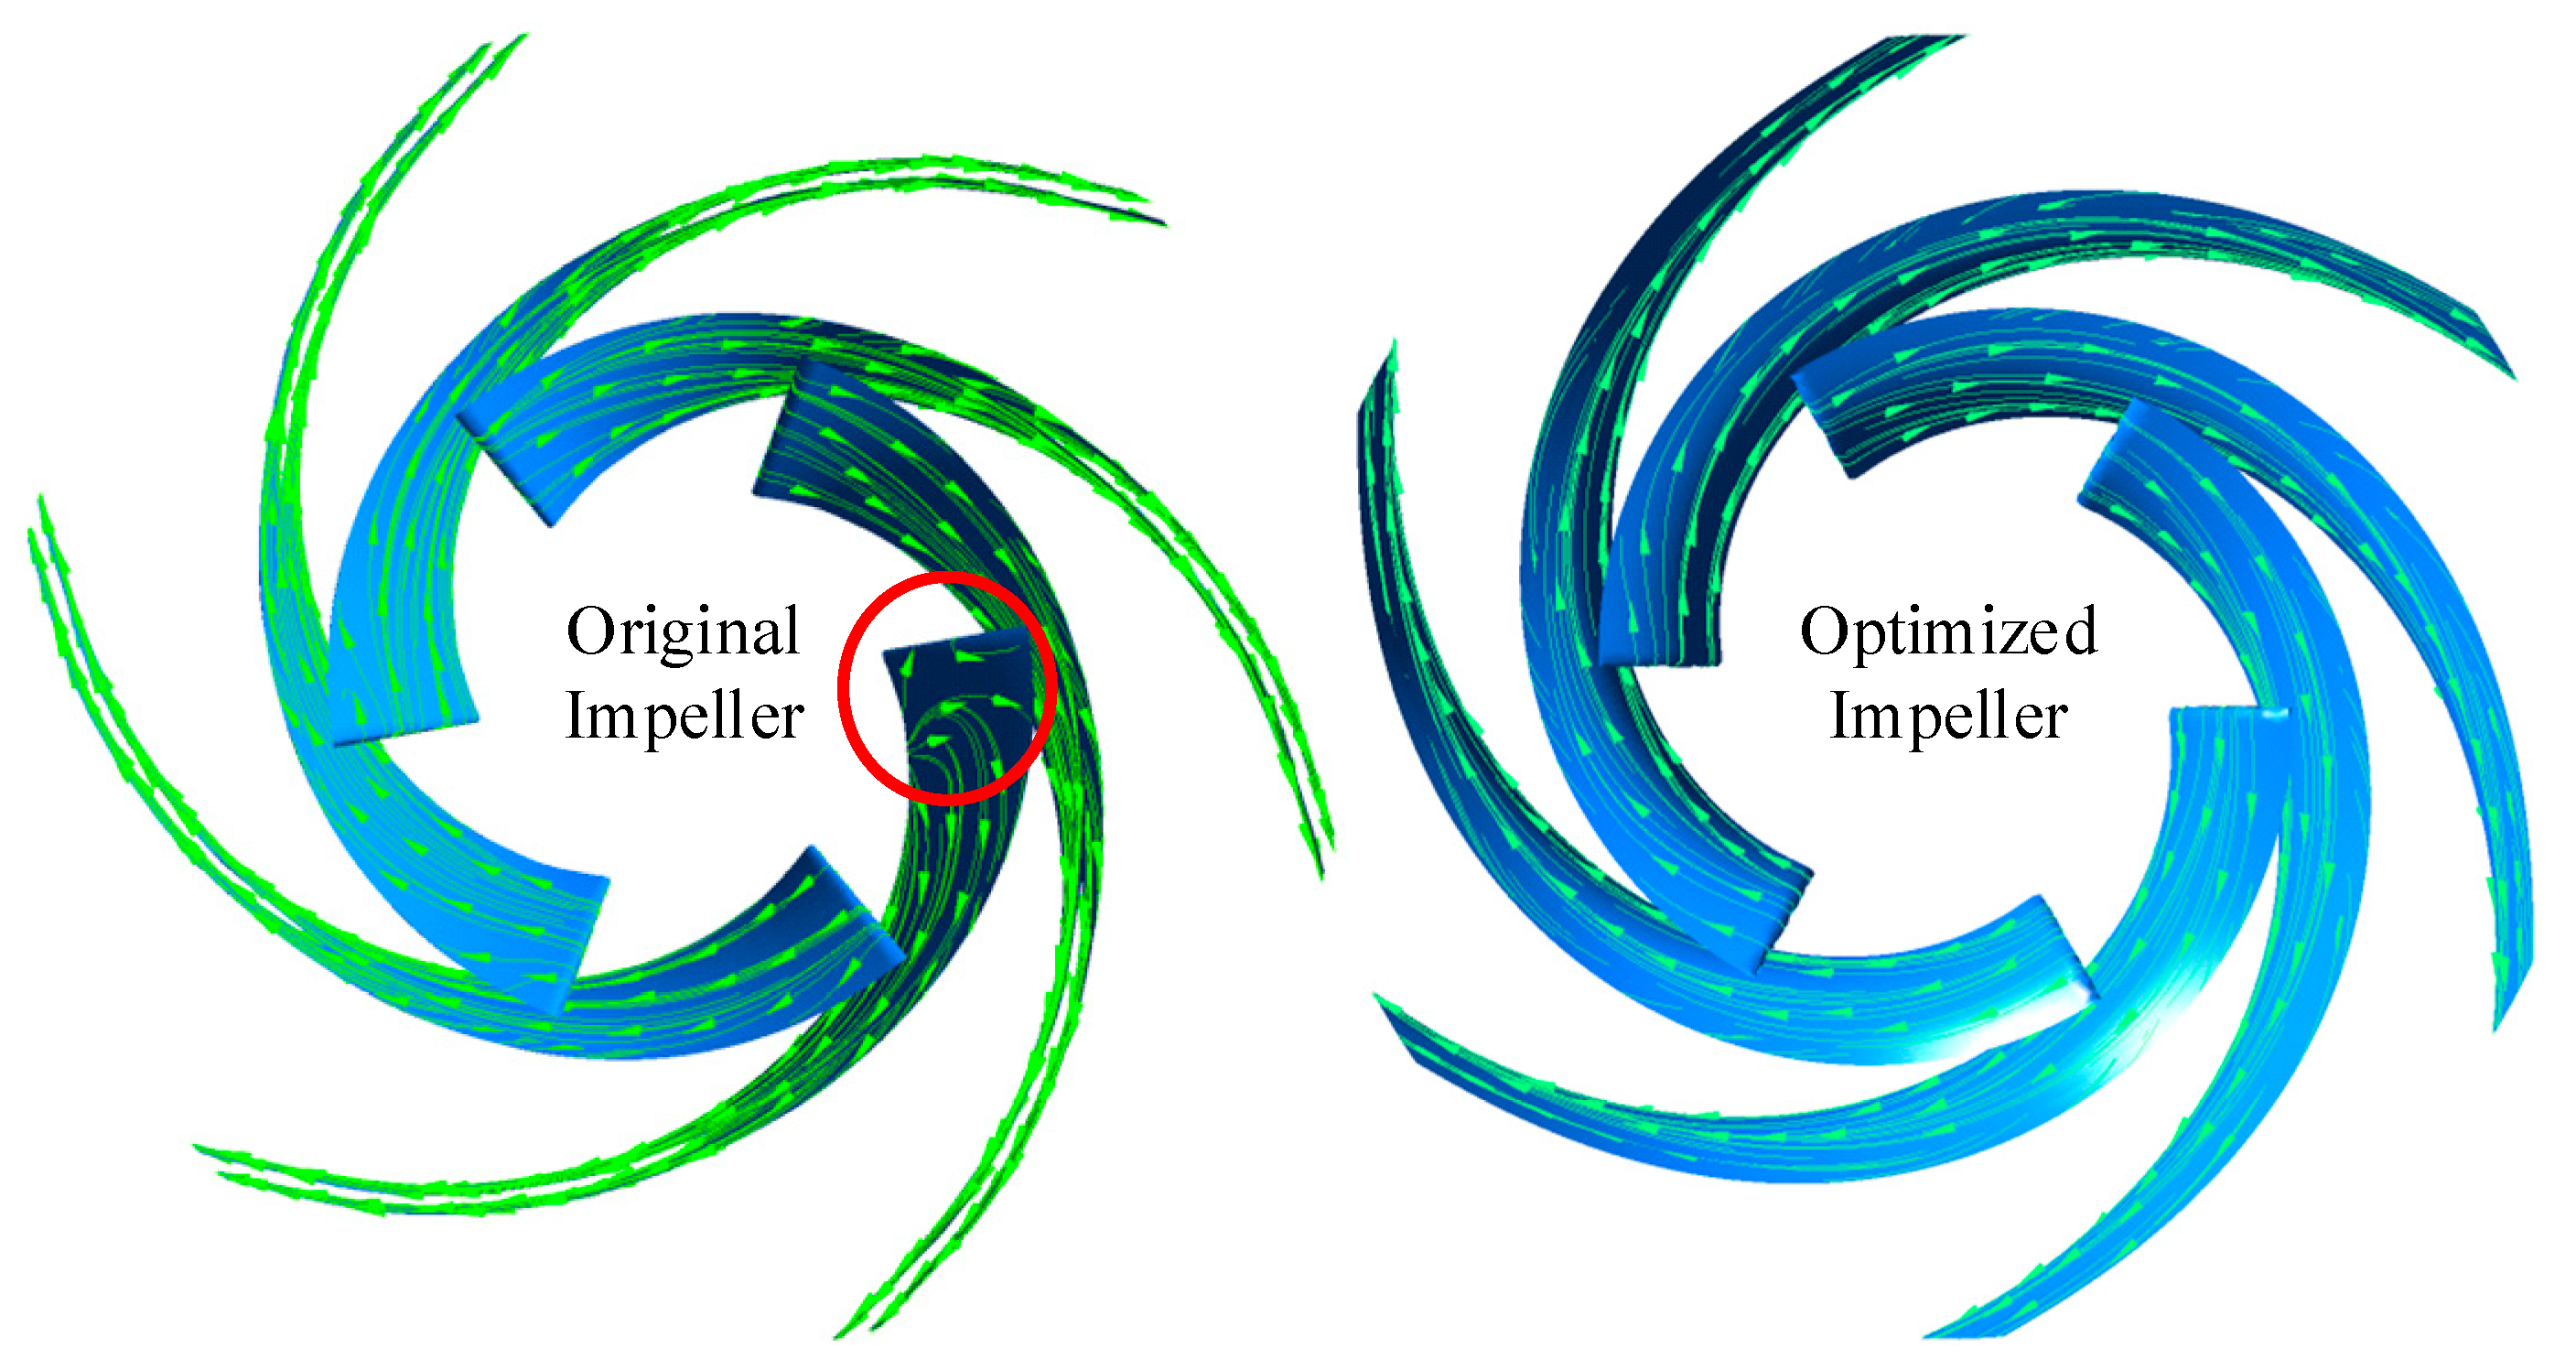
Figure 19 compares the of blade streamlines of the optimum and original designs at no cavitation conditions to illustrate the improvement of pump performance. The streamline distribution along the blade surface is uniform and symmetric. There was some flow distortion observed very close to the leading edge of one of the blades. This however disappeared and the flow distribution became uniform when as the flow moved towards the middle of the blade. In the optimized impeller, no flow distortion was seen. The velocity direction was along with the blade, indicating the ability of the optimized blade to control the fluid much better than the original blade.
At critical cavitation conditions, flow distortions and reverse flow were observed on the blade surface for both designs. As in Figure 20, the suction side of both blades had a smooth distribution at the leading edge. Distortions appeared along the blade surface on different blades up to the middle of the blade where the flow became uniform, and by this, the static pressure would have increased and bubble cavities disappearing. The distortions on the optimized impeller however covered a smaller region as compared to the original impeller; this is also an indication that flow distribution had improved in cavitation conditions. The pressure side of the blade had flow distortions that appeared similar for both the original and optimized schemes. However, a critical look revealed some vortex and reverse flow appearing closer to the leading edge of some blades of the original impeller.
4.2.7. Vapor volume fraction analysis at 1.0 Qd
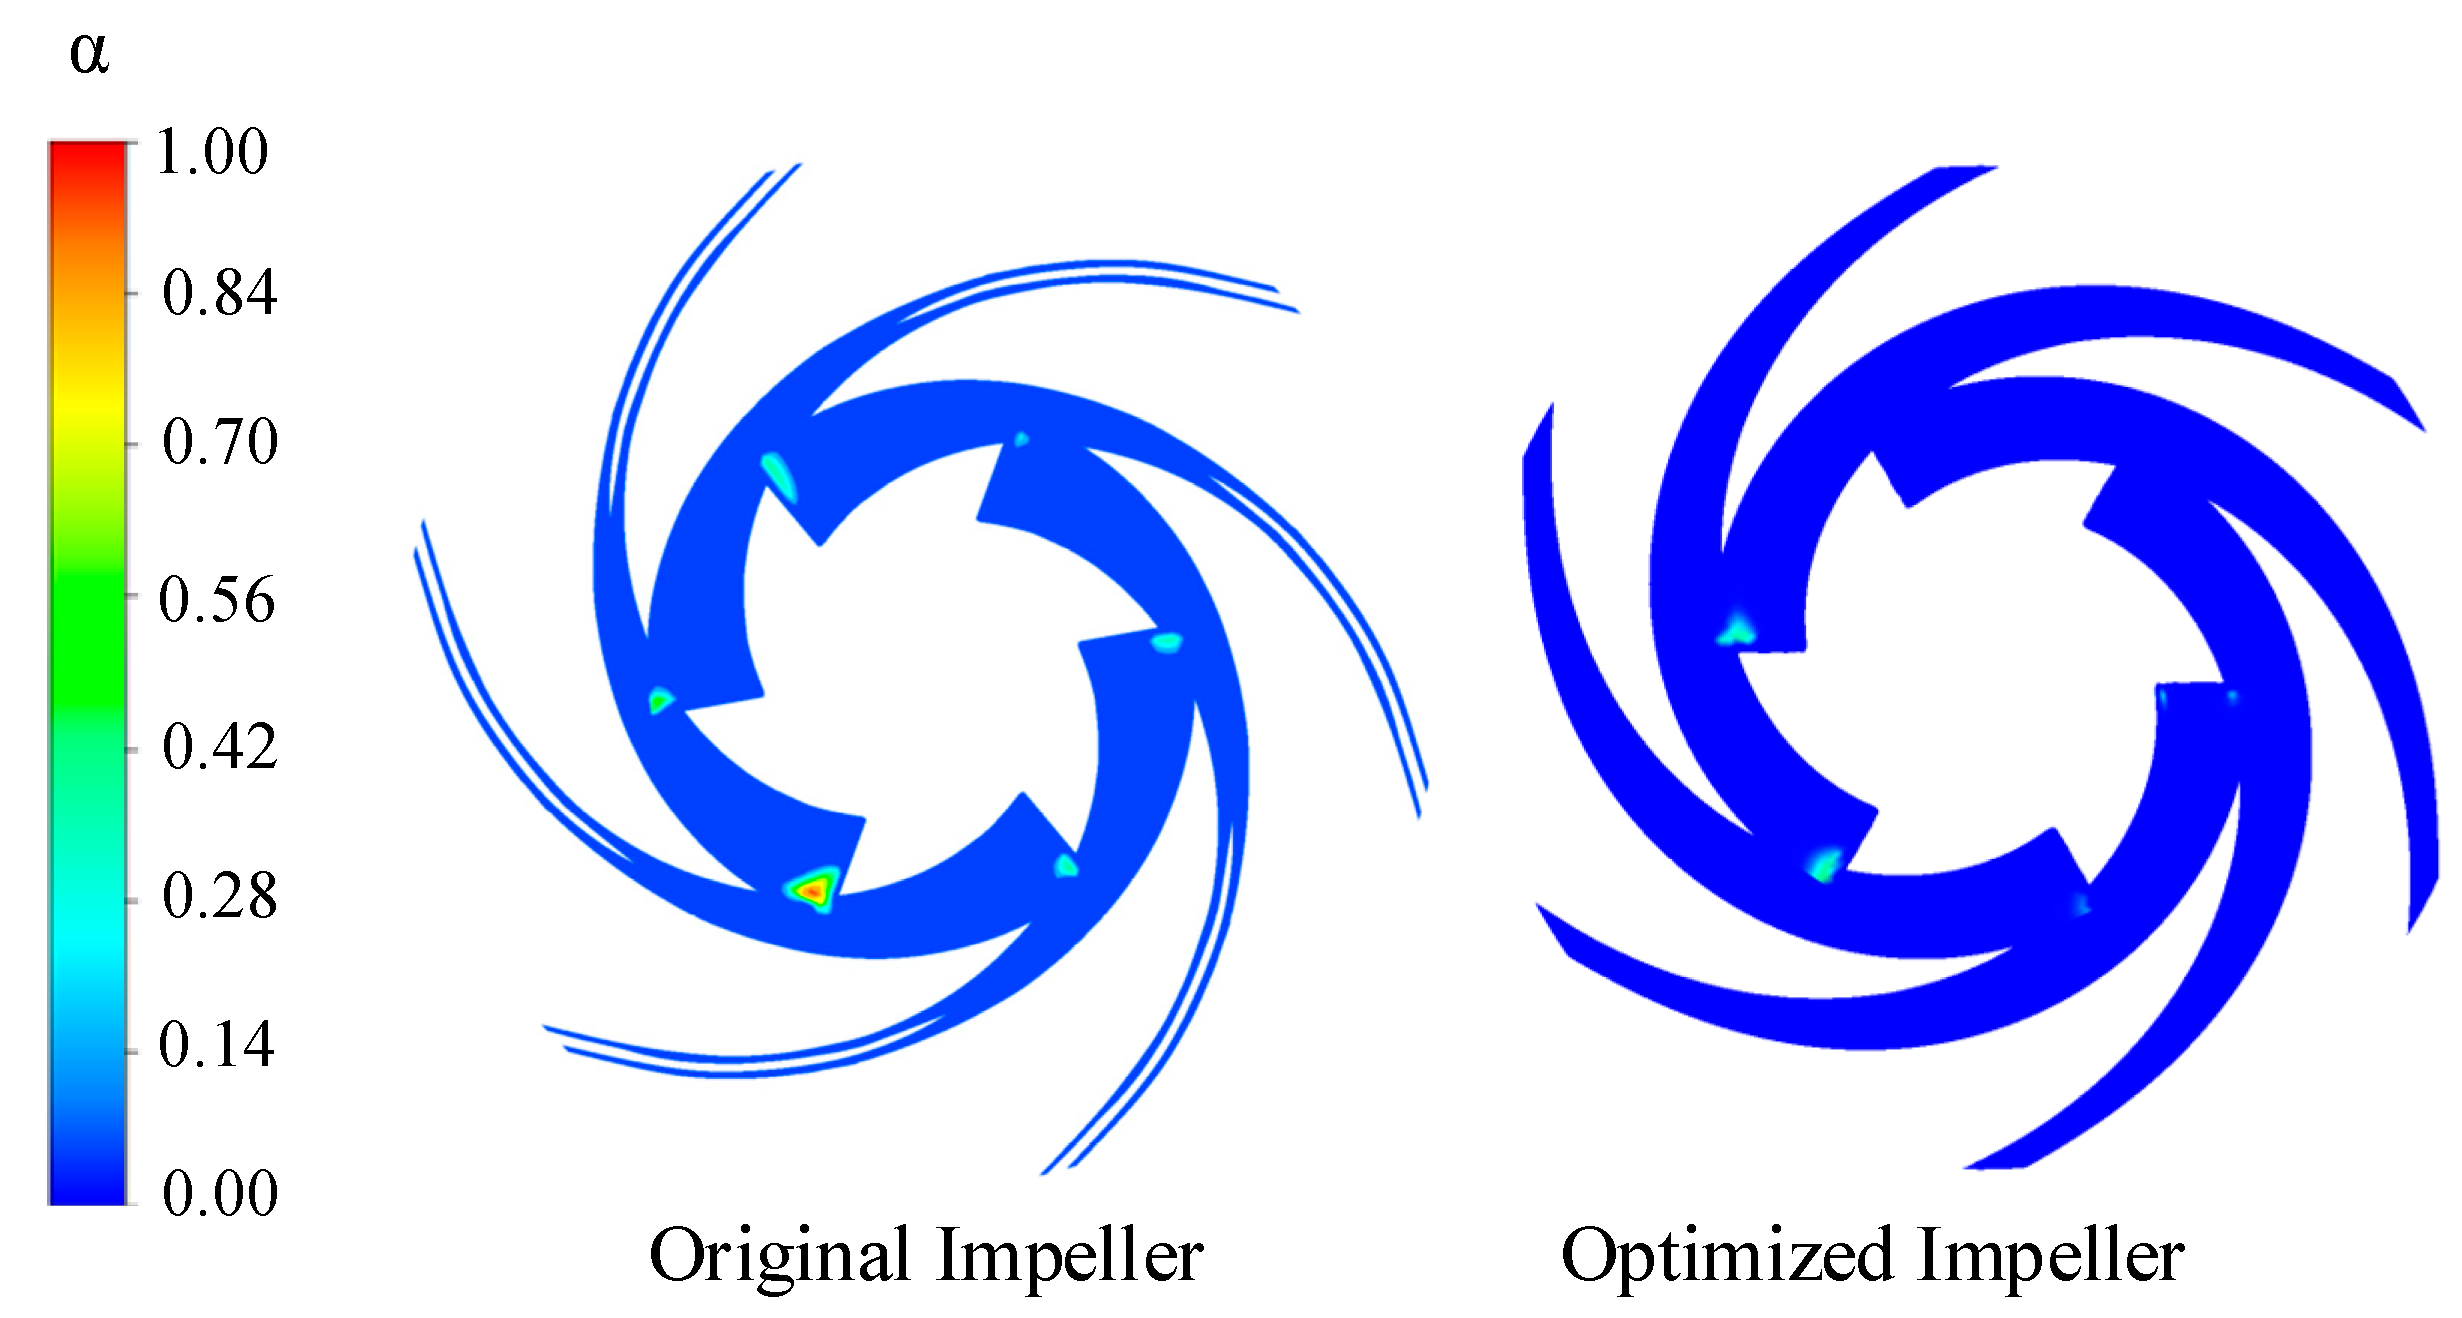
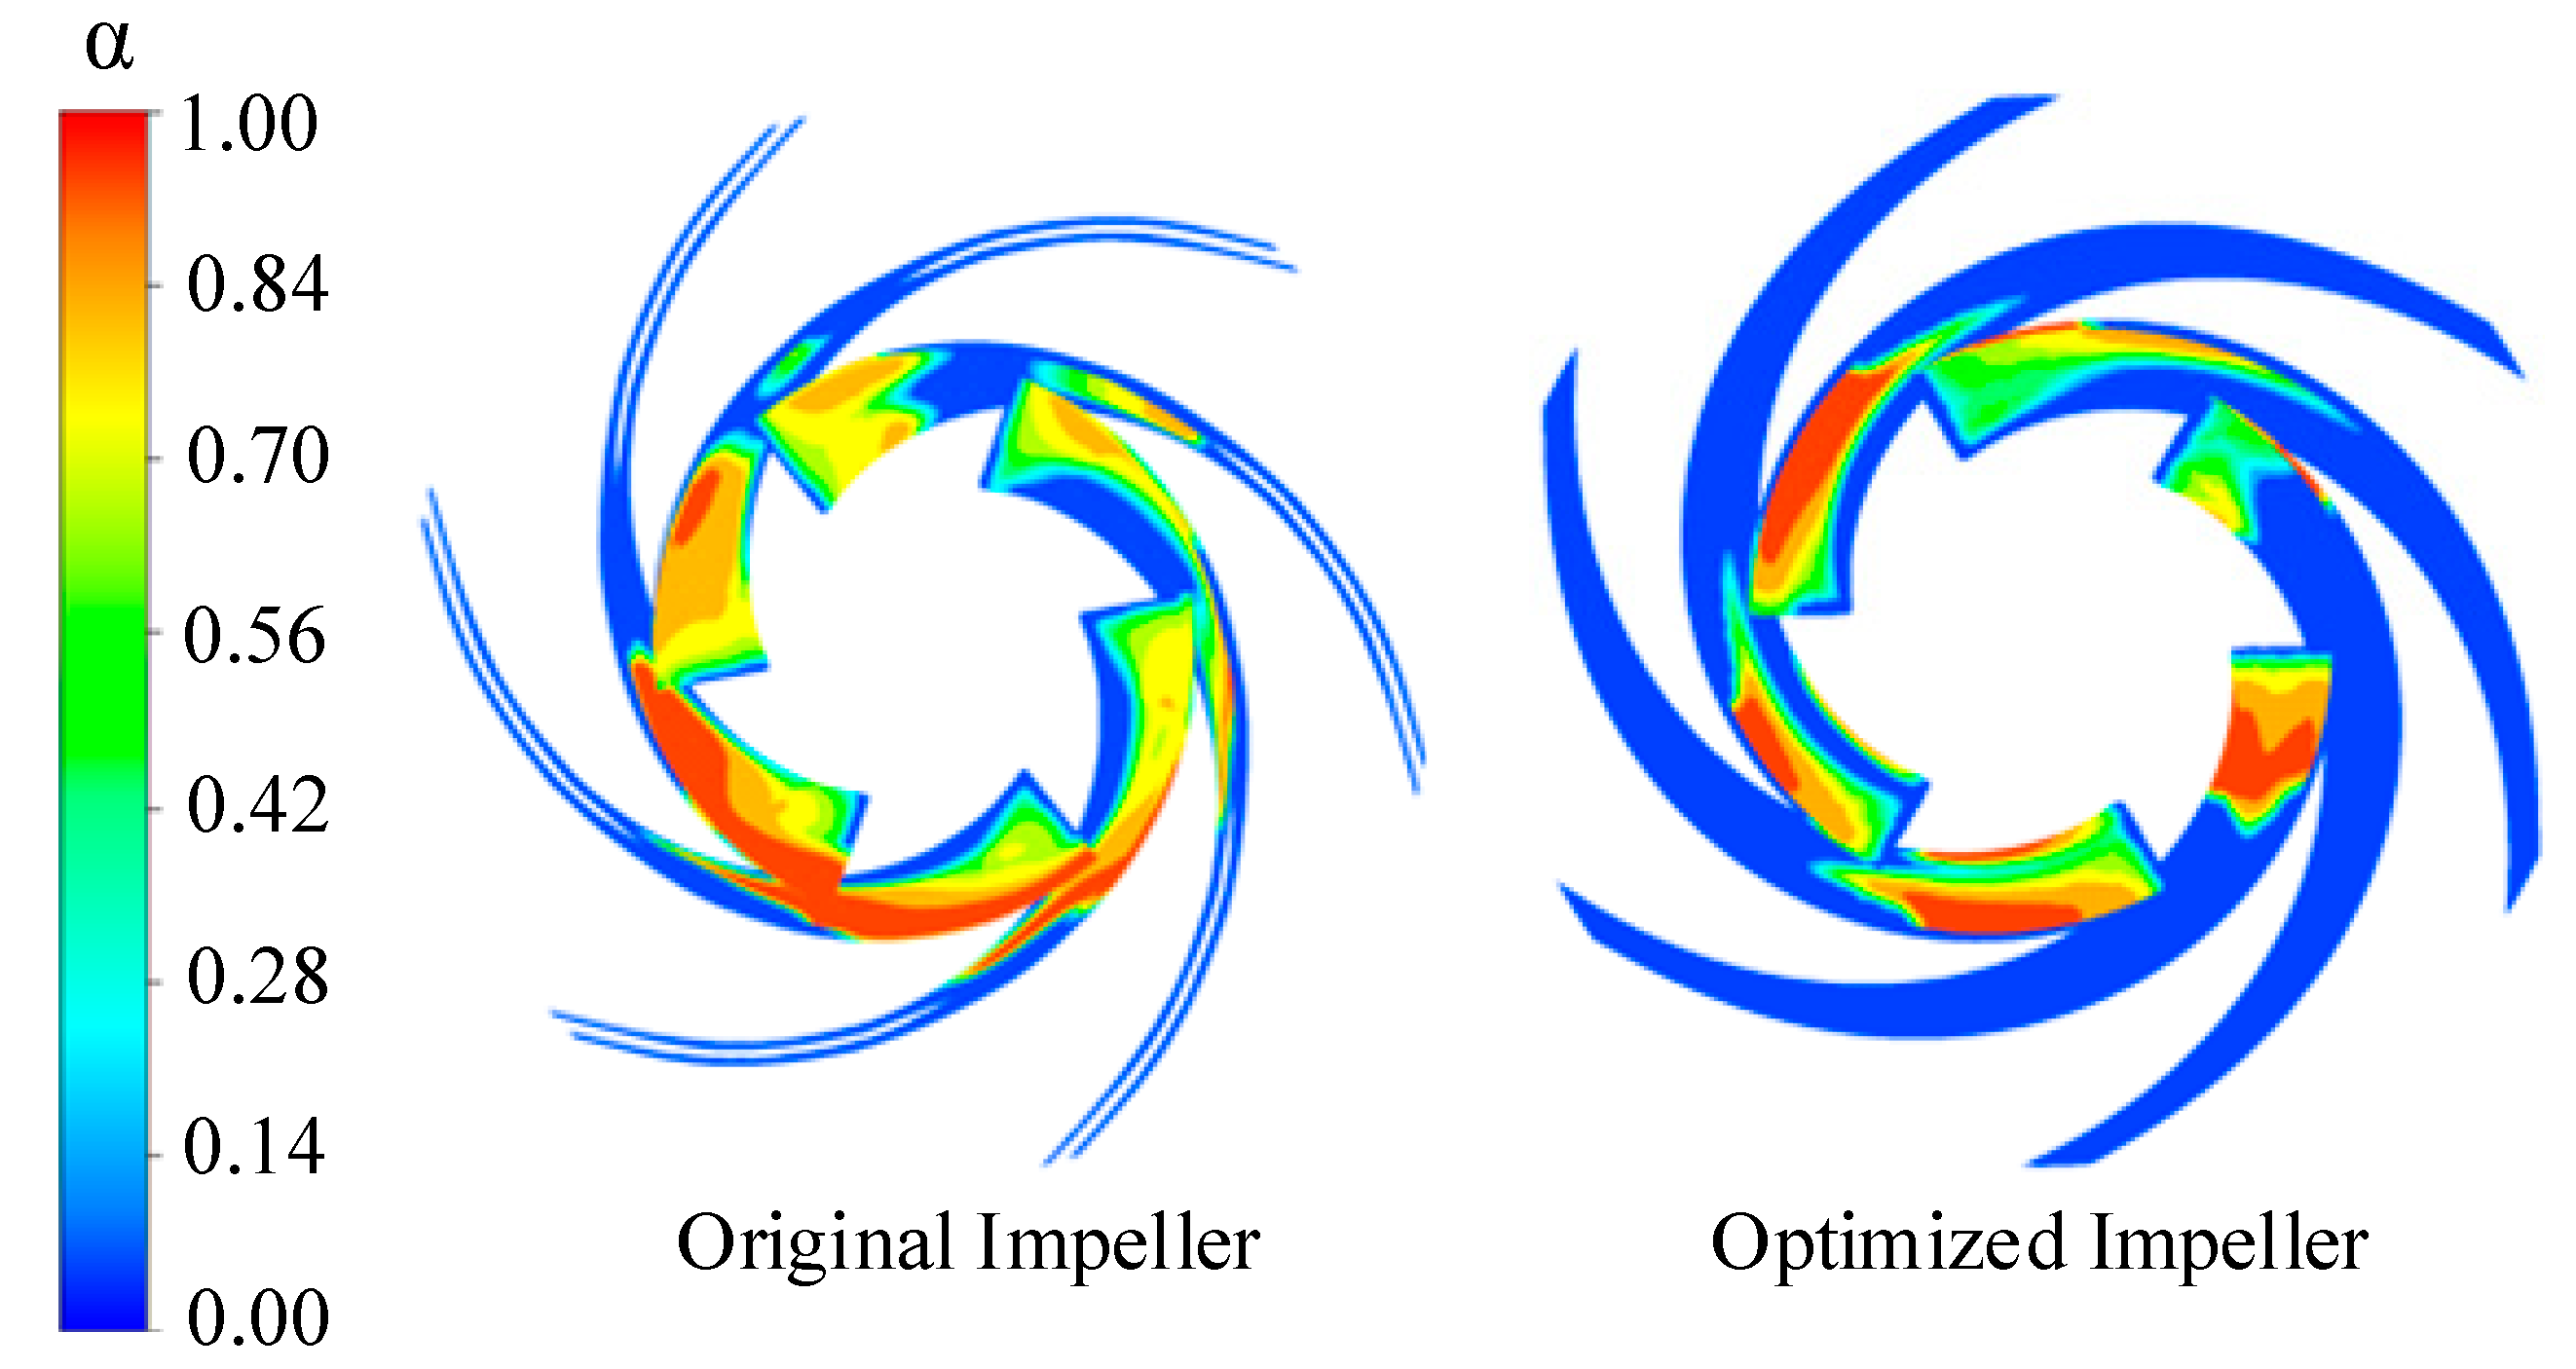
To compare the vapor and bubble distribution within the two schemes, the optimized impeller was first compared with the original impeller at the nominal operating condition. From Figure 21, pockets of vapor above 5% volume fraction could be seen at the right corner of the leading edge for all the blades in the original impeller. The case was rather different for the optimized impeller with vapor cavities appearing on only two blades. This indicates the improvement in cavitation performance by the optimized impeller. For the case of critical cavitation, Figure 22 shows the volume fraction distribution in the impeller for water vapor above 10% volume fraction.
On comparison, the vapor volume fraction of the optimized impeller was shown to be much smaller than that of the original impeller, whereas for most of the blades, the bubble cavities spread up to the middle of the impeller before collapsing, and the bubble distribution was much lower in the optimized impeller, mostly covering just a quarter of the blade length. For the suction domain, vapor cavities formed around the wear rings which indicated the presence of suction ring cavitation for both design schemes. Figure 23 is the bubble distribution in suction domain at critical cavitation condition. The cavity formed around on the suction ring closer to the suction tongue region was not surprising, due to the geometry configuration. However, the bubble distribution in the suction unit was relatively smaller in the optimized impeller other than the original impeller which also proves that the optimized impeller has improved cavitation performance.
5. Conclusion
A multi-parameter and multi-objective optimization was performed on an axially-split double-suction centrifugal pump first to increase efficiency and second to improve cavitation performance. An L32 (84) orthogonal array was designed to evaluate 8 geometrical parameters at 4 levels each. A two-layer feedforward neural network and genetic algorithm was applied to solve the multi-objective problem into pareto solutions that meets the objective functions. Three best cases from the pareto solutions were validated by numerical simulation and compared to the original design. The results from the study are as follows:
- There was a 7.26% improvement in suction performance at the design point. At 1.2 Qd, the suction performance was improved by 3.9%. At part loads, however, the suction performance improved by 3.8% and 4.5% for 0.6 Qd and 0.8 Qd flow conditions respectively.
- The efficiency increased by 1.53% at the nominal flow rate and 1.1% at 0.8 Qd. For overload and deep part loads, the effects of the optimization of hydraulic efficiency was very low.
- For the optimized design, the pressure distribution at the leading regions were comparatively higher and the streamline on the blade surface was improved.
- By comparison, the vapor volume fraction of the optimized impeller was much smaller than that of the original impeller. Also, the bubble distribution in the suction unit was relatively smaller in the optimized impeller.
- This study provides a theoretical reference and a parametric database for both hub and shroud blade angles for double suction centrifugal pump optimization design.
Author Contributions
Conceptualization, M.K.O. and W.W.; Methodology, W.W. AND X.G; Software, X.G.; Validation, M.K.O., W.W. and J.P.; Formal analysis, M.K.O. and J.P.; Writing—original draft preparation, M.K.O.; Writing—Review and Editing, T.Y.; Supervision, J.P.
Funding
This work is supported by the National Key Research and Development Program (Grant No. 2018YFB0606103), National Natural Science Foundation of China (Grant No. 51879121, 51779107, 51809121), Six Talent Peaks Project (GDZB - 047) and Qing Lan Project of Jiangsu Province.
Acknowledgments
The authors are much grateful for the financial support provided by the National Natural Science Foundation of China and the kind help of 4CPump research group.
Conflicts of Interest
The authors declare no conflict of interest. The funders had no role in the design of the study; in the collection, analyses, or interpretation of data; in the writing of the manuscript, or in the decision to publish the results.
Nomenclatures
| Latin symbols | |
| b2 | blade width, mm |
| Ccond | Condensation coefficient |
| Cvap | Evaporation coefficient |
| D | Impeller diameter, mm |
| H | Head, m |
| HD | Dynamic Head, m |
| k | Kinetic energy of turbulence, m2/s2 |
| m+ | Evaporation rate |
| m- | Condensation rate |
| N | Rotational speed, r/min |
| p | Pressure, Pa |
| PS | Shaft power, kW |
| Q | Flow rate, m3/h |
| Rb | Bubble radius, m |
| rg | Nucleation site volume fraction |
| u | Velocity, m/s |
| z | Number of blades |
| Greek symbols | |
| αv | Vapor volume fraction |
| β1 hub | Inlet angle at hub, ° |
| β2 hub | Exit angle at hub, ° |
| β3 shroud | Inlet angle at shroud, ° |
| β4 shroud | Exit angle at shroud, ° |
| ɛ | Turbulence dissipation rate, m2/s3 |
| η | Efficiency, % |
| ρ | Density, kg/m3 |
| μ | Dynamic viscosity, Pa.s |
| μt | Turbulent viscosity, m2/s |
| ꞷ | Specific dissipation of turbulent kinetic energy, s-1 |
| φ1 hub | wrap angle at hub, ° |
| φ2 shroud | wrap angle at shroud, ° |
| Δφ0 hub | leading edge wrap angle at hub, ° |
| Δφ0 shroud | leading edge wrap angle at shroud, ° |
| Abbreviations | |
| 2D | Two-Dimensional |
| 3D | Three-Dimensional |
| ANN | Artificial Neural Network |
| BEP | Best Efficiency Point NPSHr |
| CFD | Computational Fluid Dynamics |
| DOE | Design of Experiment |
| MOGA | Multi-objective Generic Algorithm |
| NPSHr | Net positive suction head required |
| ODOE | Orthogonal Design of Experiment |
| SST | Shear Stress Transport |
| RANS | Reynolds-averaged Navier-Stokes |
References
- Zou, Z.; Wang, F.; Yao, Z.; Tao, R.; Xiao, R.F.; Li, H.C. Impeller Radial Force Evolution in a Large Double-Suction Centrifugal Pump During Startup at the Shut-Off Condition. Nucl. Eng. Des. 2016, 310, 410–417. [Google Scholar] [CrossRef]
- Azizi, R.; Attaran, B.; Hajnayeb, A.; Ghanbarzadeh, A.; Changizian, M. Improving Accuracy of Cavitation Severity Detection in Centrifugal Pumps Using a Hybrid Feature Selection Technique. Measurement 2017, 108, 9–17. [Google Scholar] [CrossRef]
- Li, Z.; Zheng, X. Review of Design Optimization Methods for Turbomachinery Aerodynamics. Prog. Aerosp. Sci. 2017, 93, 1–23. [Google Scholar] [CrossRef]
- Zhou, L.; Shi, W.; Wu, S. Performance Optimization in a Centrifugal Pump Impeller by Orthogonal Experiment and Numerical Simulation. Adv. Mech. Eng. 2013, 5, 385809. [Google Scholar] [CrossRef]
- Pei, J.; Yin, T.; Yuan, S.; Wang, W.J.; Wang, J.B. Cavitation Optimization for a Centrifugal Pump Impeller by Using Orthogonal Design of Experiment. Chin. J. Mech. Eng. 2017, 30, 103–109. [Google Scholar] [CrossRef]
- Yan, H.; Liu, M.; Liang, X.; Shan, Z.B. Numerical Simulation on Cavitation Characteristics of Large-Scale Axial-Flow Pumps Based on Orthogonal Experiment. J. Huazhong Univ. Sci. Technol. (Nat. Sci. Ed.) 2014, 29. (In Chinese) [Google Scholar] [CrossRef]
- Nataraj, M.; Arunachalam, V.P. Optimizing Impeller Geometry for Performance Enhancement of a Centrifugal Pump Using the Taguchi Quality Concept. Proc. Inst. Mech. Eng. Part A J. Pow. Energy 2006, 220, 765–782. [Google Scholar] [CrossRef]
- Xu, Y.; Tan, L.; Cao, S.; Qu, S.H. Multiparameter and Multiobjective Optimization Design of Centrifugal Pump Based on Orthogonal Method. Proc. Inst. Mech. Eng. Part C J. Mech. Eng. Sci. 2017, 231, 2569–2579. [Google Scholar] [CrossRef]
- Kaveh, A.; Laknejadi, K. A New Multi-Swarm Multi-Objective Optimization Method for Structural Design. Adv. Eng. Softw. 2013, 58, 54–69. [Google Scholar] [CrossRef]
- Nourbakhsh, A.; Safikhani, H.; Derakhshan, S. The Comparison of Multi-Objective Particle Swarm Optimization and Nsga Ii Algorithm: Applications in Centrifugal Pumps. Eng. Optim. 2011, 43, 1095–1113. [Google Scholar] [CrossRef]
- Safikhani, H.; Khalkhali, A.; Farajpoor, M. Pareto Based Multi-Objective Optimization of Centrifugal Pumps Using Cfd, Neural Networks and Genetic Algorithms. Eng. Appl. Comput. Fluid Mech. 2011, 5, 37–48. [Google Scholar] [CrossRef]
- Jin, R.; Wei, C.; Simpson, T.W. Comparative Studies of Metamodelling Techniques under Multiple Modelling Criteria. Struct. Multidiscip. Optim. 2001, 23, 1–13. [Google Scholar] [CrossRef]
- Tao, R.; Xiao, R.; Zhu, D.; Wang, F.J. Multi-Objective Optimization of Double Suction Centrifugal Pump. Proc. Inst. Mech. Eng. Part C J. Mech. Eng. Sci. 2018, 232, 1108–1117. [Google Scholar] [CrossRef]
- Wang, G.G.; Shan, S. Review of Metamodeling Techniques in Support of Engineering Design Optimization. J. Mech. Des. 2006, 129, 370–380. [Google Scholar] [CrossRef]
- Mengistu, T.; Ghaly, W. Aerodynamic Optimization of Turbomachinery Blades Using Evolutionary Methods and Ann-Based Surrogate Models. Optim. Eng. 2008, 9, 239–255. [Google Scholar] [CrossRef]
- Derakhshan, S.; Mohammadi, B.; Nourbakhsh, A. Incomplete Sensitivities for 3d Radial Turbomachinery Blade Optimization. Comput. Fluids 2008, 37, 1354–1363. [Google Scholar] [CrossRef]
- Pei, J.; Gan, X.; Wang, W.; Yuan, S.Q.; Tang, Y.J. Multi-Objective Shape Optimization on the Inlet Pipe of a Vertical Inline Pump. J. Fluids Eng. 2019, 141. [Google Scholar] [CrossRef]
- Tao, R.; Xiao, R.; Yang, W.; Wang, F.J.; Liu, W.C. Optimization for Cavitation Inception Performance of Pump-Turbine in Pump Mode Based on Genetic Algorithm. Math. Probl. Eng. 2014, 2014, 234615. [Google Scholar] [CrossRef]
- Goncalves, E.; Patella, R.F. Numerical Simulation of Cavitating Flows with Homogeneous Models. Comput. Fluids 2009, 38, 1682–1696. [Google Scholar] [CrossRef]
- Bakir, F.; Rey, R.; Gerber, A.; Belamri, T.; Hutchinson, B. Numerical and Experimental Investigations of the Cavitating Behavior of an Inducer. Int. J. Rotating Mach. 2004, 10, 15–25. [Google Scholar] [CrossRef]
- Li, X.; Yu, B.; Ji, Y.; Lu, J.X.; Yuan, S.Q. Statistical Characteristics of Suction Pressure Signals for a Centrifugal Pump under Cavitating Conditions. J. Therm. Sci. 2017, 26, 47–53. [Google Scholar] [CrossRef]
- Li, X.; Yuan, S.; Pan, Z.; Yuan, J.P.; Fu, Y.X. Numerical Simulation of Leading Edge Cavitation within the Whole Flow Passage of a Centrifugal Pump. Sci. China Technol. Sci. 2013, 56, 2156–2162. [Google Scholar] [CrossRef]
- Zhang, F.; Yuan, S.; Fu, Q.; Pei, J.; Böhle, M.; Jiang, X.S. Cavitation-Induced Unsteady Flow Characteristics in the First Stage of a Centrifugal Charging Pump. J. Fluids Eng. 2017, 139, 011303. [Google Scholar] [CrossRef]
- Tang, X.L.; Zou, M.D.; Wang, F.J.; Li, X.Q.; Shi, X.Y. Comprehensive Numerical Investigations of Unsteady Internal Flows and Cavitation Characteristics in Double-Suction Centrifugal Pump. Math. Probl. Eng. 2017, 2017, 5013826. [Google Scholar] [CrossRef]
- Lu, J.; Yuan, S.; Luo, Y.; Yuan, J.P.; Zhou, B.L.; Sun, H. Numerical and Experimental Investigation on the Development of Cavitation in a Centrifugal Pump. Proc. Inst. Mech. Eng. Part E J. Proc. Mech. Eng. 2016, 230, 171–182. [Google Scholar] [CrossRef]
- Ding, H.; Visser, F.; Jiang, Y. A Practical Approach to Speed up Npshr Prediction of Centrifugal Pumps Using Cfd Cavitation Model. In Proceedings of the ASME 2012 Fluids Engineering Division Summer Meeting collocated with the ASME 2012 Heat Transfer Summer Conference and the ASME 2012 10th International Conference on Nanochannels, Microchannels, and Minichannels, Rio Grande, PR, USA, 8–12 July 2012; American Society of Mechanical Engineers: New York, NY, USA, 2012. [Google Scholar]
- Gu, Y.; Pei, J.; Yuan, S.; Wang, W.J.; Zhang, F.; Wang, P.; Appiah, D.; Liu, Y. Clocking Effect of Vaned Diffuser on Hydraulic Performance of High-Power Pump by Using the Numerical Flow Loss Visualization Method. Energy 2019, 170, 986–997. [Google Scholar] [CrossRef]
- Pei, J.; Zhang, F.; Appiah, D.; Hu, B.; Yuan, S.Q.; Asomani, S.N. Performance Prediction Based on Effects of Wrapping Angle of a Side Channel Pump. Energies 2019, 12, 139. [Google Scholar] [CrossRef]
- Medvitz, R.B.; Kunz, R.F.; Boger, D.A.; Lindau, J.W.; Yocum, A.M.; Pauley, L.L. Performance Analysis of Cavitating Flow in Centrifugal Pumps Using Multiphase Cfd. J. Fluids Eng. 2002, 124, 377–383. [Google Scholar] [CrossRef]
- Menter, F.R. Two-Equation Eddy-Viscosity Turbulence Models for Engineering Applications. AIAA J. 1994, 32, 1598–1605. [Google Scholar] [CrossRef]
- Bardina, J.; Huang, P.; Coakley, T.; Bardina, J.; Huang, P.; Coakley, T. Turbulence Modeling Validation. In Proceedings of the 28th Fluid Dynamics Conference, Snowmass Village, CO, USA, 29 June–2 July 1997. [Google Scholar]
- Zwart, P.J.; Gerber, A.G.; Belamri, T. A Two-Phase Flow Model for Predicting Cavitation Dynamics. In Proceedings of the Fifth International Conference on Multiphase Flow, Yokohama, Japan, 30 May–3 June 2004. [Google Scholar]
- Mejri, I.; Bakir, F.; Rey, R.; Belamri, T. Comparison of Computational Results Obtained from a Homogeneous Cavitation Model with Experimental Investigations of Three Inducers. J. Fluids Eng. 2006, 128, 1308–1323. [Google Scholar] [CrossRef]
- Gülich, J.F. Centrifugal Pumps; Springer Science & Business Media: Berlin, Germany, 2010. [Google Scholar]
- Yu, H. Levenberg-Marquardt Training. In Intelligent Systems; Springer: Berlin, Germany, 2011. [Google Scholar]
- Zhou, R.; Wu, D.; Fang, L.; Xu, A.J.; Lou, X.W. A Levenberg–Marquardt Backpropagation Neural Network for Predicting Forest Growing Stock Based on the Least-Squares Equation Fitting Parameters. Forests 2018, 9, 757. [Google Scholar] [CrossRef]
- Karlik, B.; Olgac, A.V. Performance Analysis of Various Activation Functions in Generalized Mlp Architectures of Neural Networks. Int. J. Artif. Intell. Expert Syst. 2011, 1, 111–122. [Google Scholar]
- Neal, R.M. Connectionist Learning of Belief Networks. Artif. Intell. 1992, 56, 71–113. [Google Scholar] [CrossRef]
- Nwankpa, C.; Ijomah, W.; Gachagan, A.; Marshall, S. Activation Functions: Comparison of Trends in Practice and Research for Deep Learning. arXiv 2018, arXiv:1811.03378. [Google Scholar]
- Gen, M.; Cheng, R. Genetic Algorithms and Engineering Optimization; John Wiley & Sons: Hoboken, NJ, USA, 2000; Volume 7. [Google Scholar]
- MATLAB. The Language of Technical Computing-Release 14; The MathWorks Inc.: Natick, MA, USA, 2004. [Google Scholar]
- Shim, H.-S.; Kim, K.-Y.; Choi, Y.-S. Three-Objective Optimization of a Centrifugal Pump to Reduce Flow Recirculation and Cavitation. J. Fluids Eng. 2018, 140, 091202. [Google Scholar] [CrossRef]
- Pei, J.; Wang, W.-J.; Yuan, S.-Q. Statistical Analysis of Pressure Fluctuations During Unsteady Flow for Low-Specific-Speed Centrifugal Pumps. J. Cent. South Univ. 2014, 21, 1017–1024. [Google Scholar] [CrossRef]
- Zhang, Y.; Hu, S.; Wu, J.; Zhanga, Y.Q.; Chen, L.P. Multi-Objective Optimization of Double Suction Centrifugal Pump Using Kriging Metamodels. Adv. Eng. Softw. 2014, 74, 16–26. [Google Scholar] [CrossRef]
Figure 1.
Tested pump and computational domain.

Figure 2.
Mesh overview of the flow domains.

Figure 3.
Performance comparison for 5 independent grids.

Figure 4.
Scheme of the test rig. 1: Inlet pipe, 2(9): Valve, 3(7): Pressure transducer, 4: Vacuum pump, 5: Tested pump, 6: Driven motor, 8: Magnetic flow meter, 10: Outlet pipe.
Figure 4.
Scheme of the test rig. 1: Inlet pipe, 2(9): Valve, 3(7): Pressure transducer, 4: Vacuum pump, 5: Tested pump, 6: Driven motor, 8: Magnetic flow meter, 10: Outlet pipe.

Figure 5.
Test Pump (a) and Data Acquisition Device (b).

Figure 6.
Flowchart of Optimization process.

Figure 7.
Meridional shape of impeller and leading edge of blade.

Figure 8.
ANN structure for efficiency objective.

Figure 9.
ANN structure for NPSHr objective.

Figure 10.
Hydraulic performance comparison of test and numerical results.

Figure 11.
Suction performance prediction and comparison.

Figure 12.
Comparison of Cfturbo built impeller to original model.

Figure 13.
R-Square analysis of efficiency and NPSHr.

Figure 14.
Validation of ANN prediction with CFD.

Figure 15.
Pareto-frontiers from ANN.

Figure 16.
Predicted NPSHr comparison at different flow rates.

Figure 17.
Predicted efficiency comparison at different flow rates.

Figure 18.
Comparison of static pressure distribution in impeller blade surface.

Figure 19.
Comparison of streamline on blade surface at no cavitation condition.

Figure 20.
Compare streamline on blade surface at cavitation condition.

Figure 21.
Volume fraction distribution in impeller at NPSH = 8.77 m.

Figure 22.
Volume fraction distribution in impeller at critical cavitation.

Figure 23.
Bubble distribution in suction domain at critical cavitation.


Table 1.
Design specifications of model pump.
| Design Parameters | Value |
|---|---|
| Flow rate, Qd (m3/h) | 500 |
| Head, H (m) | 40 |
| Rotational speed, N (rpm) | 1480 |
| Number of blades, z | 6 |
| Suction diameter, Ds (mm) | 250 |
| Impeller inlet diameter, D1 (mm) | 192 |
| Impeller outlet diameter, D2 (mm) | 365 |
| Delivery diameter, Dd (mm) | 200 |
| Efficiency, η | 84 |
| NPSHr (m) | 3.5 |
Table 2.
Grid cells of the selected mesh.
| Domain | Impeller | Suction | Volute | All Domains |
|---|---|---|---|---|
| No of Elements | 1,199,880 | 1,938,727 | 1,127,816 | 4,266,423 |
| No of Nodes | 1,285,686 | 2,019,162 | 1,159,980 | 4,464,828 |
Table 3.
Range design of variables.
| Trial No | A | B | C | D | E | F | G | H |
|---|---|---|---|---|---|---|---|---|
| β1hub/° | β2hub/° | φ1hub/° | Δφ0hub/° | β3shroud/° | β4shroud/° | φ2shroud/° | Δφ0shroud/° | |
| Original | 17 | 29.43 | 143 | 0 | 15 | 29.43 | 143 | 0 |
| 1 | 15 | 26 | 139 | −5 | 13 | 26 | 139 | −5 |
| 2 | 17 | 28 | 143 | −2.5 | 15 | 28 | 143 | −2.5 |
| 3 | 19 | 30 | 145 | 2.5 | 17 | 30 | 145 | 2.55 |
| 4 | 21 | 32 | 148 | 5 | 19 | 32 | 148 | 5 |
Table 4.
Orthogonal scheme.
| Trial No | A | B | C | D | E | F | G | H |
|---|---|---|---|---|---|---|---|---|
| 1 | 17 | 28 | 148 | −2.5 | 13 | 26 | 148 | −5 |
| 2 | 21 | 28 | 145 | −2.5 | 19 | 28 | 139 | −2.5 |
| 3 | 21 | 26 | 143 | −2.5 | 17 | 26 | 145 | 5 |
| 4 | 21 | 28 | 139 | 5 | 19 | 32 | 145 | −5 |
| 5 | 15 | 28 | 143 | 2.5 | 15 | 32 | 139 | 5 |
| … | … | … | … | … | … | … | … | … |
| 28 | 19 | 32 | 143 | −2.5 | 15 | 30 | 139 | −5 |
| 29 | 15 | 30 | 148 | −2.5 | 19 | 30 | 143 | 5 |
| 30 | 15 | 32 | 145 | 5 | 17 | 28 | 143 | −5 |
| 31 | 15 | 28 | 148 | −5 | 15 | 28 | 145 | 2.5 |
| 32 | 21 | 32 | 143 | −5 | 13 | 32 | 143 | 2.5 |
Table 5.
Orthogonal scheme results.
| Trial No | A | B | C | D | E | F | G | H | η (%) | NPSHr (m) |
|---|---|---|---|---|---|---|---|---|---|---|
| 1 | 17 | 28 | 148 | −2.5 | 13 | 26 | 148 | −5 | 88.03 | 2.420 |
| 2 | 21 | 28 | 145 | −2.5 | 19 | 28 | 139 | −2.5 | 88.69 | 2.338 |
| 3 | 21 | 26 | 143 | −2.5 | 17 | 26 | 145 | 5 | 89.21 | 2.364 |
| 4 | 21 | 28 | 139 | 5 | 19 | 32 | 145 | −5 | 88.16 | 2.374 |
| 5 | 15 | 28 | 143 | 2.5 | 15 | 32 | 139 | 5 | 87.41 | 2.647 |
| 6 | 15 | 32 | 139 | −2.5 | 17 | 32 | 148 | −2.5 | 87.26 | 2.464 |
| … | … | … | … | … | … | … | … | … | … | … |
| 27 | 19 | 32 | 148 | 5 | 15 | 26 | 145 | −2.5 | 88.93 | 2.488 |
| 28 | 19 | 32 | 143 | −2.5 | 15 | 30 | 139 | −5 | 87.79 | 2.450 |
| 29 | 15 | 30 | 148 | −2.5 | 19 | 30 | 143 | 5 | 87.87 | 2.442 |
| 30 | 15 | 32 | 145 | 5 | 17 | 28 | 143 | −5 | 88.43 | 2.517 |
| 31 | 15 | 28 | 148 | −5 | 15 | 28 | 145 | 2.5 | 88.18 | 2.513 |
| 32 | 21 | 32 | 143 | −5 | 13 | 32 | 143 | 2.5 | 87.17 | 2.521 |
Table 6.
Variables for Optimum Cases.
| Cases | β1 | β2 | φ1 | Δφ1 | β 3 | β4 | φ2 | Δφ2 | η (%) | NPSHr (m) |
|---|---|---|---|---|---|---|---|---|---|---|
| 1 | 21.000 | 26.00 | 148.00 | 5.000 | 19.000 | 26.00 | 139.93 | 5.00 | 89.25 | 2.280 |
| 2 | 20.994 | 26.006 | 145.69 | 4.999 | 18.999 | 26.01 | 143.34 | 3.16 | 89.247 | 2.205 |
| 3 | 19.931 | 26.00 | 139.00 | 4.999 | 18.999 | 26.001 | 146.95 | −5.00 | 89.191 | 2.173 |
Table 7.
Comparison of original case and best optimal cases.
| Name | η (%) | NPSHr (m) | Head (m) |
|---|---|---|---|
| Original case | 88.28017 | 2.532 | 40.721 |
| Case 1 | 90.64207 | 2.392 | 38.650 |
| Case 2 | 89.65017 | 2.348 | 40.019 |
| Case 3 | 88.35048 | 2.324 | 40.070 |
© 2019 by the authors. Licensee MDPI, Basel, Switzerland. This article is an open access article distributed under the terms and conditions of the Creative Commons Attribution (CC BY) license (http://creativecommons.org/licenses/by/4.0/).
Share and Cite
MDPI and ACS Style
Wang, W.; Osman, M.K.; Pei, J.; Gan, X.; Yin, T. Artificial Neural Networks Approach for a Multi-Objective Cavitation Optimization Design in a Double-Suction Centrifugal Pump. Processes 2019, 7, 246. https://doi.org/10.3390/pr7050246
AMA Style
Wang W, Osman MK, Pei J, Gan X, Yin T. Artificial Neural Networks Approach for a Multi-Objective Cavitation Optimization Design in a Double-Suction Centrifugal Pump. Processes. 2019; 7(5):246. https://doi.org/10.3390/pr7050246
Chicago/Turabian StyleWang, Wenjie, Majeed Koranteng Osman, Ji Pei, Xingcheng Gan, and Tingyun Yin. 2019. "Artificial Neural Networks Approach for a Multi-Objective Cavitation Optimization Design in a Double-Suction Centrifugal Pump" Processes 7, no. 5: 246. https://doi.org/10.3390/pr7050246
Note that from the first issue of 2016, this journal uses article numbers instead of page numbers. See further details here.