Simulation and Analysis of Oleic Acid Pretreatment for Microwave-Assisted Biodiesel Production
by
 , and
, and
Weiquan Ma
1 ,
,
Tao Hong
2,
Tian Xie
3,
Fengxia Wang
3,
Bin Luo
1,
Jie Zhou
1,
Yang Yang
1,
Huacheng Zhu
1,* and
and
Kama Huang
1 1
College of Electronic and Information Engineering, Sichuan University, Chengdu 610065, China
2
School of Electronic Information Engineering, China West Normal University, Nanchong 637002, China
3
State Key Laboratory of Efficient Utilization for Low Grade Phosphate Rock and Its Associated Resources, Wengfu Group, Guiyang 550014, China
*
Author to whom correspondence should be addressed.
Processes 2018, 6(9), 142; https://doi.org/10.3390/pr6090142
Submission received: 12 June 2018
/
Revised: 22 August 2018
/
Accepted: 24 August 2018
/
Published: 28 August 2018
(This article belongs to the Special Issue Microwave Applications in Chemical Engineering)
Abstract
:Oleic acid needs to be heated when it is utilized for biodiesel production, but, as a low-loss solution, oleic acid is difficult to heat by microwave. An efficient heating method for oleic acid is designed. A high loss material porous media is placed in a quartz tube, and a microwave directly heats the porous medium of the high loss material. The oleic acid flows through the pores of porous media so that the oleic acid exchanges heat during this process and rapid heating of oleic acid is achieved. A coupling model, based on the finite element method, is used to analyze the microwave heating process. The multiphysics model is based on a single mode cavity operating at 2450 MHz. An elaborate experimental system is developed to validate the multiphysics model through temperature measurements carried out for different flow velocities of oleic acid and different microwave power levels. The computational results are in good agreement with the experimental data. Based on the validated model, the effects of different sizes, porosities, and materials on microwave heating efficiency are analyzed.
1. Introduction
As an environmentally-friendly fuel, biodiesel offers the advantages of low toxicity, low CO2 emissions, high safety, excellent combustion performance, and good reproducibility compared with traditional petroleum diesel. The main components of biodiesel are long-chain saturated and unsaturated fatty acids, such as palmitic acid, stearic acid, oleic acid, linoleic acid, and ester compounds formed from short chain alcohols, such as methanol or ethanol [1,2,3,4,5,6]. Oleic acid needs to be heated to esterify. The temperature required for oleic acid in microwave-assisted biodiesel production is 60 °C. Higher reaction temperatures, longer reaction times, and larger amounts of catalyst are often requisite during the esterinterchange reaction. As a new heating method, microwave can greatly improve the reaction rate. Compared with the traditional heating method, microwave possesses numerous advantages, such as improved quality and instantaneous control [7,8]. Due to its unique heating principle, microwave heating has been widely used in various fields. However, its industrial implementation has been less broadly embraced, and it is limited primarily to applications in materials drying and food processing.
Microwave heating depends on the dielectric properties of materials [9,10]. The effects of microwave heating are useful when the microwave acts on polar molecules directly. When the polar molecular medium is placed in the microwave field, the existing molecules will be rotating along with the high-frequency electric field. As the field alternates, the molecules reverse direction. Rotating molecules push, pull, and collide with other molecules (through electrical forces), distributing the energy to adjacent molecules and atoms in the material. The process of energy transfer from the microwave to the sample is a form of radiative heating. In this microscopic process, the more microwave energy that enters the medium, the higher is the temperature of the medium.
Although oleic acid contains a carboxyl group as a carboxylic acid, its dielectric loss is very low. When the temperature is 27 °C and the frequency is 2450 MHz, the imaginary part of complex permittivity is approximately 0.0074, which means that oleic acid is difficult to be directly heated by a microwave.
In this paper, a model has been designed to overcome the problem in which oleic acid cannot be heated by microwave. A porous silicon carbide was employed to absorb the microwave energy and to transfer this energy to oleic acid. Moreover, a multiphysics model, including electromagnetism, fluid heat transfer, and free and porous media flow was built. The temperature increase at different powers and flow velocities was calculated. The model describes a single-mode cavity operating at a frequency of 2450 MHz with a relatively uniform and unidirectional electric field. Next, an elaborate experimental system was developed to validate the multiphysics model through temperature measurements performed for different solution velocities of oleic acid and different microwave powers, and temperature was measured at three points of the outlet for different solution velocities to verify heating uniformity. Finally, the effects of tube size and material porosity on microwave heating efficiency were analyzed. The optimization of the model was completed, and a high efficiency microwave heating system design was achieved.
2. Methodology
2.1. Multiphysics Simulation
2.1.1. Geometry
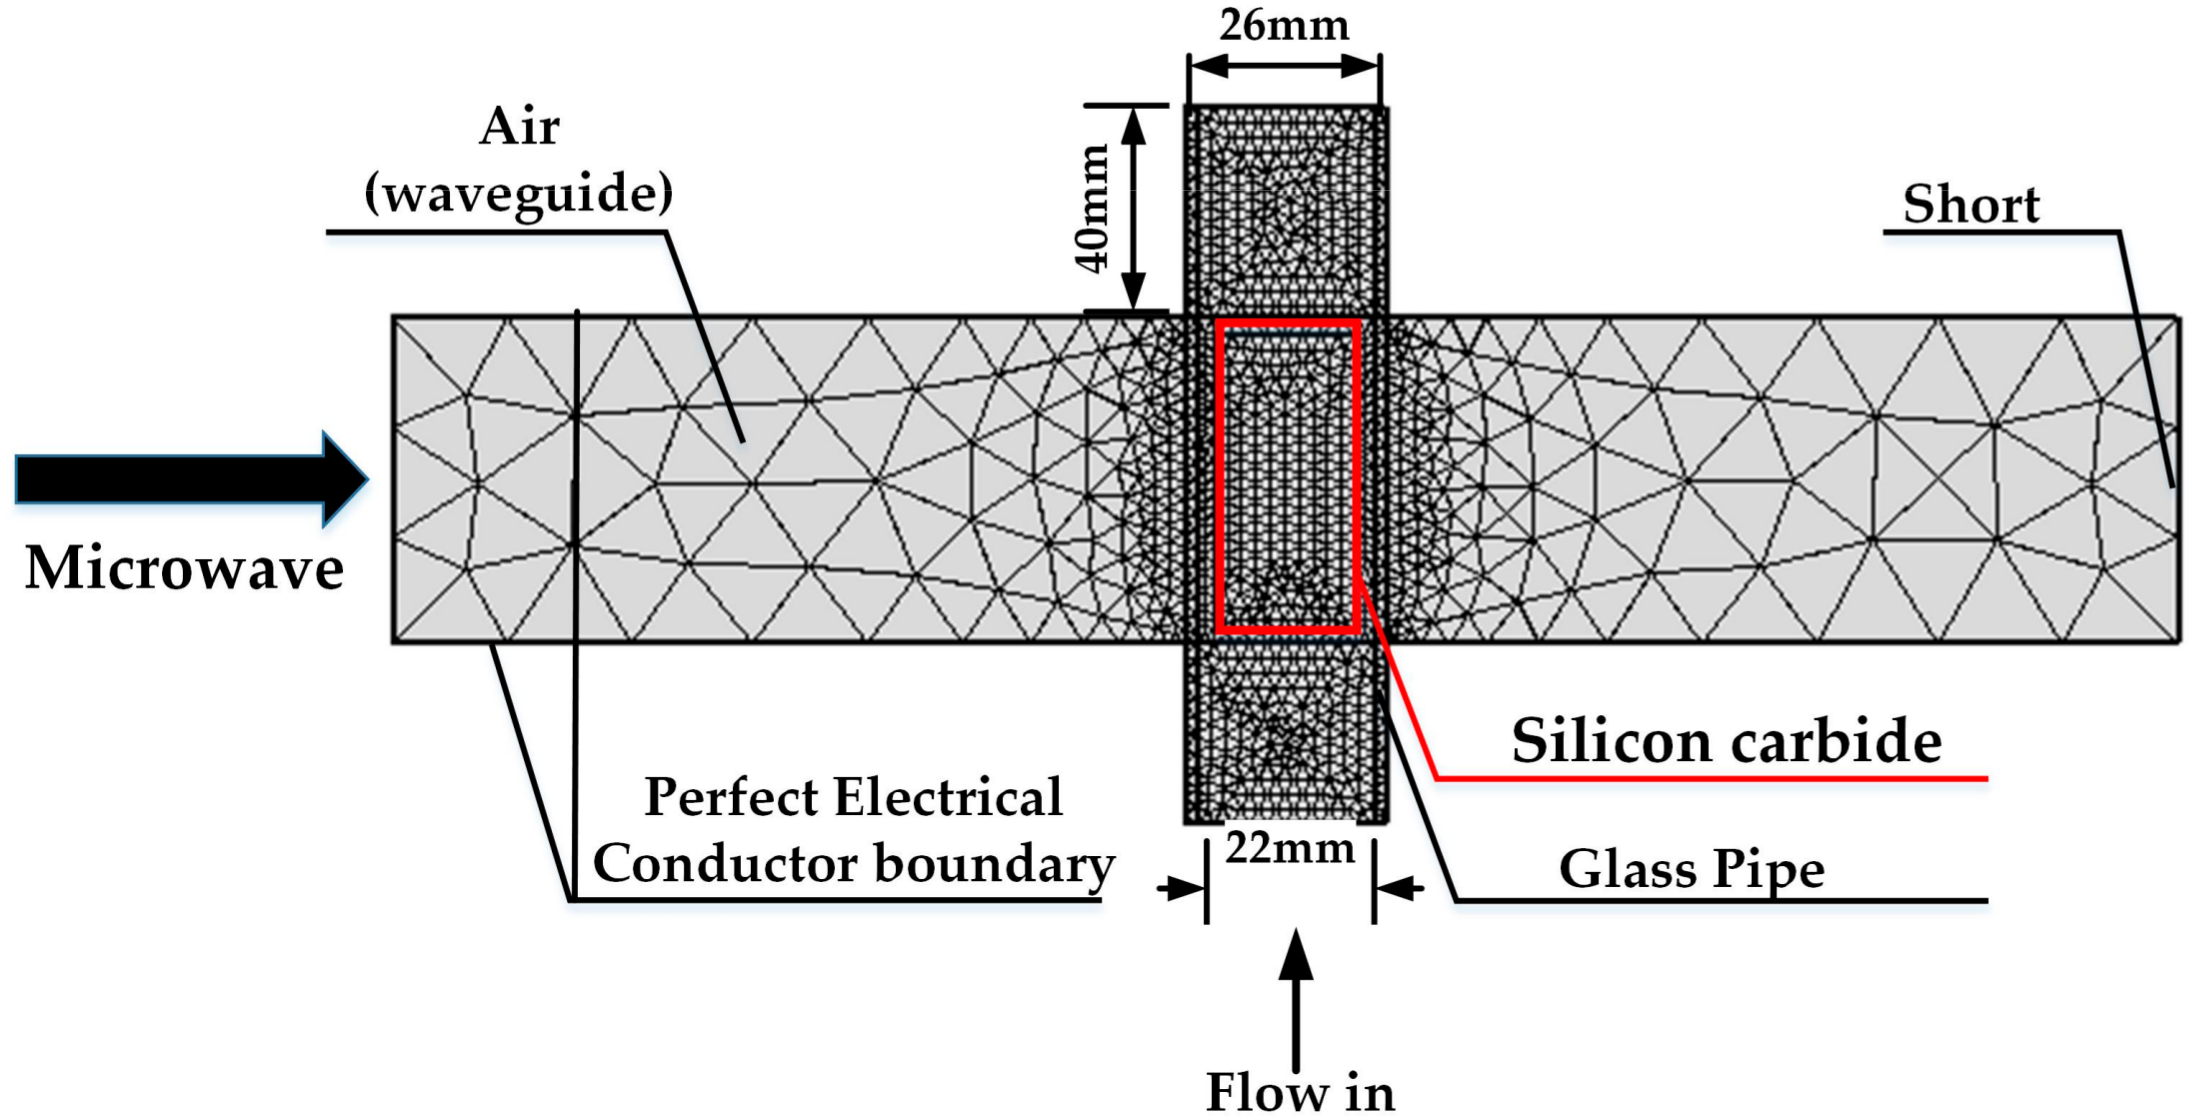
A 3D geometry of the experimental system above was built in commercial finite element software, COMSOL Multiphysics 5.2a (COMSOL Inc., Newton, MA, USA). A 2D cross-section of the geometry is shown in Figure 1. A WR430 (109.2 mm × 54.6 mm) waveguide was used in the geometry, as presented in Figure 1. The waveguide is used to orient the electromagnetic wave. The frequency of the electromagnetic wave transmitted in the WR430 waveguide is from 1.72 GHz to 2.61 GHz. In addition, the dimension of the geometry in the direction perpendicular to the 2D cross section is 109.2 mm. A glass tube was employed to carry the fluid. The height of silicon carbide is 54.6 mm, which is the same as BJ22 waveguide’s height. Four faces of the waveguide were set as a Perfect Electric Conductor. The left side of the waveguide was excitation.
The oleic acid flows through the pores inside of the porous medium and is heated in the form of heat conduction inside of the porous medium. The glass tube has been assumed as a non-loss material. Its dielectric loss factor is zero, and it has a dielectric constant value of 4.2. The porous medium is heated faster by microwave heating, and oleic acid flows through the pores inside of the porous medium to achieve the purpose of rapid heating of oleic acid.
2.1.2. Governing Equations
For the multiphysics calculation of microwave heating oleic acid model, the electromagnetic field, the heat in fluid, and the free and porous media flow modules are coupled with each other.
For the electromagnetic field, it is given by Maxwell’s equations:
where and are the electric field and magnetic field intensity, respectively; is the electric field flux intensity; is the magnetic field flux intensity; is the conduction current; μ is the permeability; and is the free charge density.
The electromagnetic power loss could be obtained from the computed electric field by the following equation [11,12], where is the permittivity of free space; and is the imaginary part of the relative permittivity of the materials.
The temperature distribution of the porous media solid in this model can be computed by the governing equation for heat transfer in solids, as given as [13,14,15].
The temperature of the porous media could be obtained by the heat equation:
where is the fluid density; is the fluid heat capacity at constant pressure; T is the temperature; t is the time; is the heat source; and is the thermal conductivity.
For the fluid modules, flow in the free channel is described by the Navier Stokes equations:
where refers to the velocity in the open channel (m/s), is identity matrix, and p is the pressure (Pa).
In COMSOL Multiphysics, free flow and porous media flow are effortlessly combined using the Brinkman equations:
where η denotes the dynamic viscosity (Pa s), k denotes the permeability of porous medium (m2), ρ is the fluid’s density (kg/m3), the εp is the porosity (dimensionless).
The Darcy’s law is used to calculate a relatively slow flow in a porous medium, where the shear stress effect perpendicular to the flow direction is very small. The Brinkman equations further considers the loss of mechanical energy by viscous shear forces based on Darcy’s law. In addition, the Brinkman equations describe flow through certain porous media as a particular continuum model for a mixture of two materials, where one is modeled as a rigid solid, and the other as an incompressible fluid.
As can be seen from the Navier Stokes equations and Brinkman equations, the momentum transport equations are closely related. They are also utilized to calculate high velocity porous flow [16,17,18,19]. The equations and Brinkman equations can be coupled to calculate solution flow [20,21]. The different terms correspond to the inertial forces, pressure forces, viscous forces, and external forces that are applied to the fluid.
2.1.3. Input Parameters
The thermo-physical properties of the fluid (density, dynamic viscosity, specific heat, and thermal conductivity) were obtained from references, as shown in Table 1. The initial simulation temperature of oleic acid was measured by an experiment.
Relative permittivity constitutes a critical parameter for the calculation of the multiphysics field of microwave heating. This parameter is influenced by both frequency and temperature [28]. In this study, the complex permittivity of oleic acid was obtained by measurement, and the measurement system is shown in Figure 2. The measurement equipment was a vector network analyzer (N5245B, Agilent Technologies, Inc., Santa Clara, CA, USA) and high-performance test probe (N1501A, Agilent Technologies, Inc., Santa Clara, CA, USA). The measurement results are shown in Table 2. When the temperature is within 70 °C, the imaginary part of the oleic acid’s complex permittivity is approximately 0.005. The value is close to zero, and the dipole moment is small. Consequently, the molecules of oleic acid are difficult to deflect in the electric field and thus cannot be directly heated by microwave. Moreover, because the thermal stability of silicon carbide is very good [29,30], its complex permittivity changes very little with temperature rising, so the dielectric constants of silicon carbide and oleic acid are calculated as constants here.
The mixture-averaged Looyenga and Landau, Lifshitz equation is given by [31]:
where vi and εi are the volume fractions and dielectric properties of phase i, respectively. The volume fraction of solid, liquid water, and gas can be written in terms of total porosity. In this model, the vi of oleic acid is 0.1, and the vi of silicon carbide is 0.9.
The parameters of dynamic viscosity, conductivity, heat conductivity coefficient, heat capacity at constant pressure, and density are calculated by using the volume average method in this model.
2.1.4. Boundary Conditions
For the electromagnetic field, the left side of the waveguide is connected to a tunable short circuit. Since the microwave energy comes into the waveguide from the right, we can define it as a perfect electric conductor, except for the microwave feeding port. The mode of the electric field is TE10. The meaning of TE (Transverse Electric wave) is a magnetic field in the direction of wave propagation without existing the electric field. There may be an infinite number of TMmn modes in the rectangular waveguide, and the waveform indexes m, n respectively represent the number of standing wave maximum value of the electromagnetic field along the broad side a and the narrow side b of the waveguide, and the lowest mode in the rectangular waveguide is the TE10 mode.
The governing equation can be expressed as:
where is the unit normal vector of the corresponding surface.
For heat transfer, the initial inlet fluid into the tube’s bottom temperature was set as 24 °C, which is the same as the room temperature.
For the free and porous media flow, a hydrodynamic no-slip boundary was used [32]. The bottom of the tube was set as an inlet, and constant velocities were set as 60 mL/min, 120 mL/min, and 180 mL/min in the model and experiment. The top of the glass tube was set as outflow. For this problem, the interface can be defined as:
where P is the liquid level pressure; and is the inlet velocity. The pressure level at the outlet is used as a reference value.
2.1.5. Mesh Size
Appropriate mesh size is crucial for model simulation. When the grid size is halved, the discretization error may fall to a quarter, while the calculation time will increase by nearly 16 times and the storage requirement will increase by eight times [33]. In order to determine the appropriate mesh size in this model, the normalized power absorption (NPA) of the treated material has been used to complete mesh independent studies [14].
Here, both the NPA with mesh size and the calculation time are studied and shown in Figure 3. According to the mesh independent study, the mesh size used in this paper is defined as:
2.2. Experimental Setup
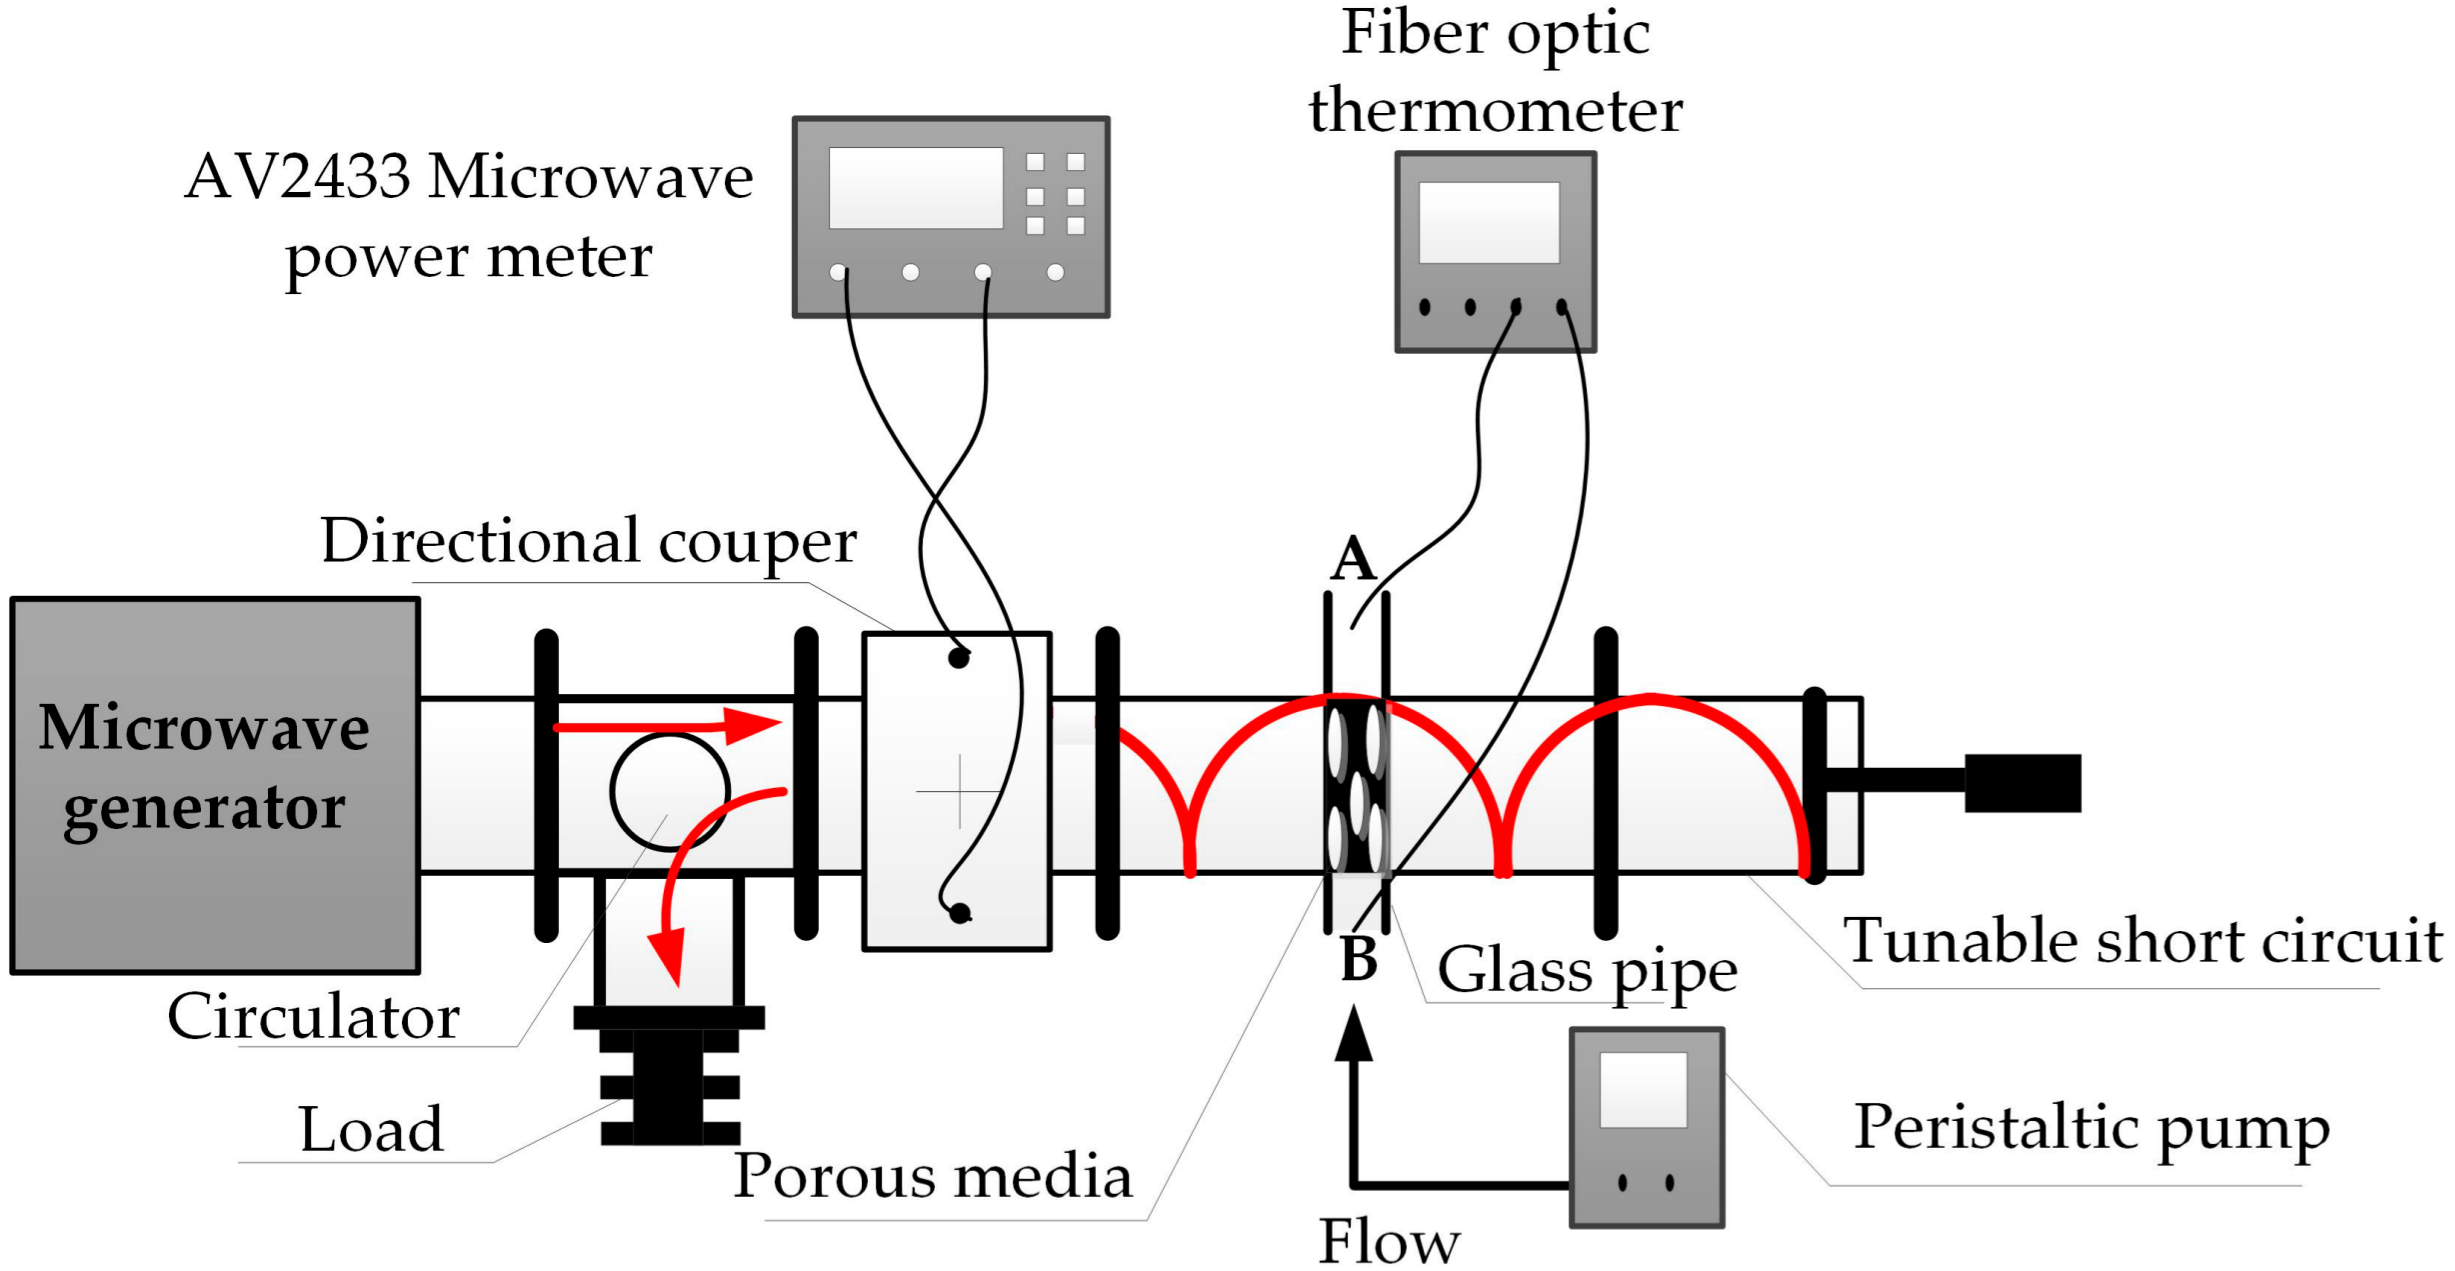
A schematic of the experimental system is shown in Figure 4. In this experiment, the microwave power is given by a solid-state power generator (WSPS-2450-200M, Wattsine, Chengdu, China). For power validation, an extra dual directional coupler is put into the experiment system. The microwave power was measured by a microwave power meter (AV2433, EI41, China Electronic Technology Instruments, Qingdao, China). Three different powers (200 W, 400 W, 600 W) with 2.45 GHz frequency were used to heat in this experiment. A glass tube (22 mm inner diameter and 26 mm outer diameter) was inserted through a BJ-22 waveguide with dimensions of 109.22 mm × 54.61 mm. The length of silicon carbide was 44 mm, and the diameter was 18 mm. The oleic acid flowed in glass tubes at three different flow velocities (60 mL/min, 120 mL/min, 180 mL/min), and the velocity of oleic acid was controlled by peristaltic pump (BT100-2J, Longer, Baoding, China). A fiber optical temperature sensor (FISO FOT-NS-967A, FISO Technologies, Quebec, QC, Canada) was employed to measure the temperature at two locations inside the pipe (A and B), as shown in Figure 3. Site B measured the temperature before the oleic acid was heated. Site A measured the temperature when the oleic acid was heated. Site A is 40 mm above the upper surface of the cavity. The position of the standing wave can be changed by adjusting the position of the short-circuit (HD-22WSS, Hengda Microwave, Xi’an, China) surface to achieve efficient use of microwave energy.
3. Results and Discussion
3.1. Experiment Validation
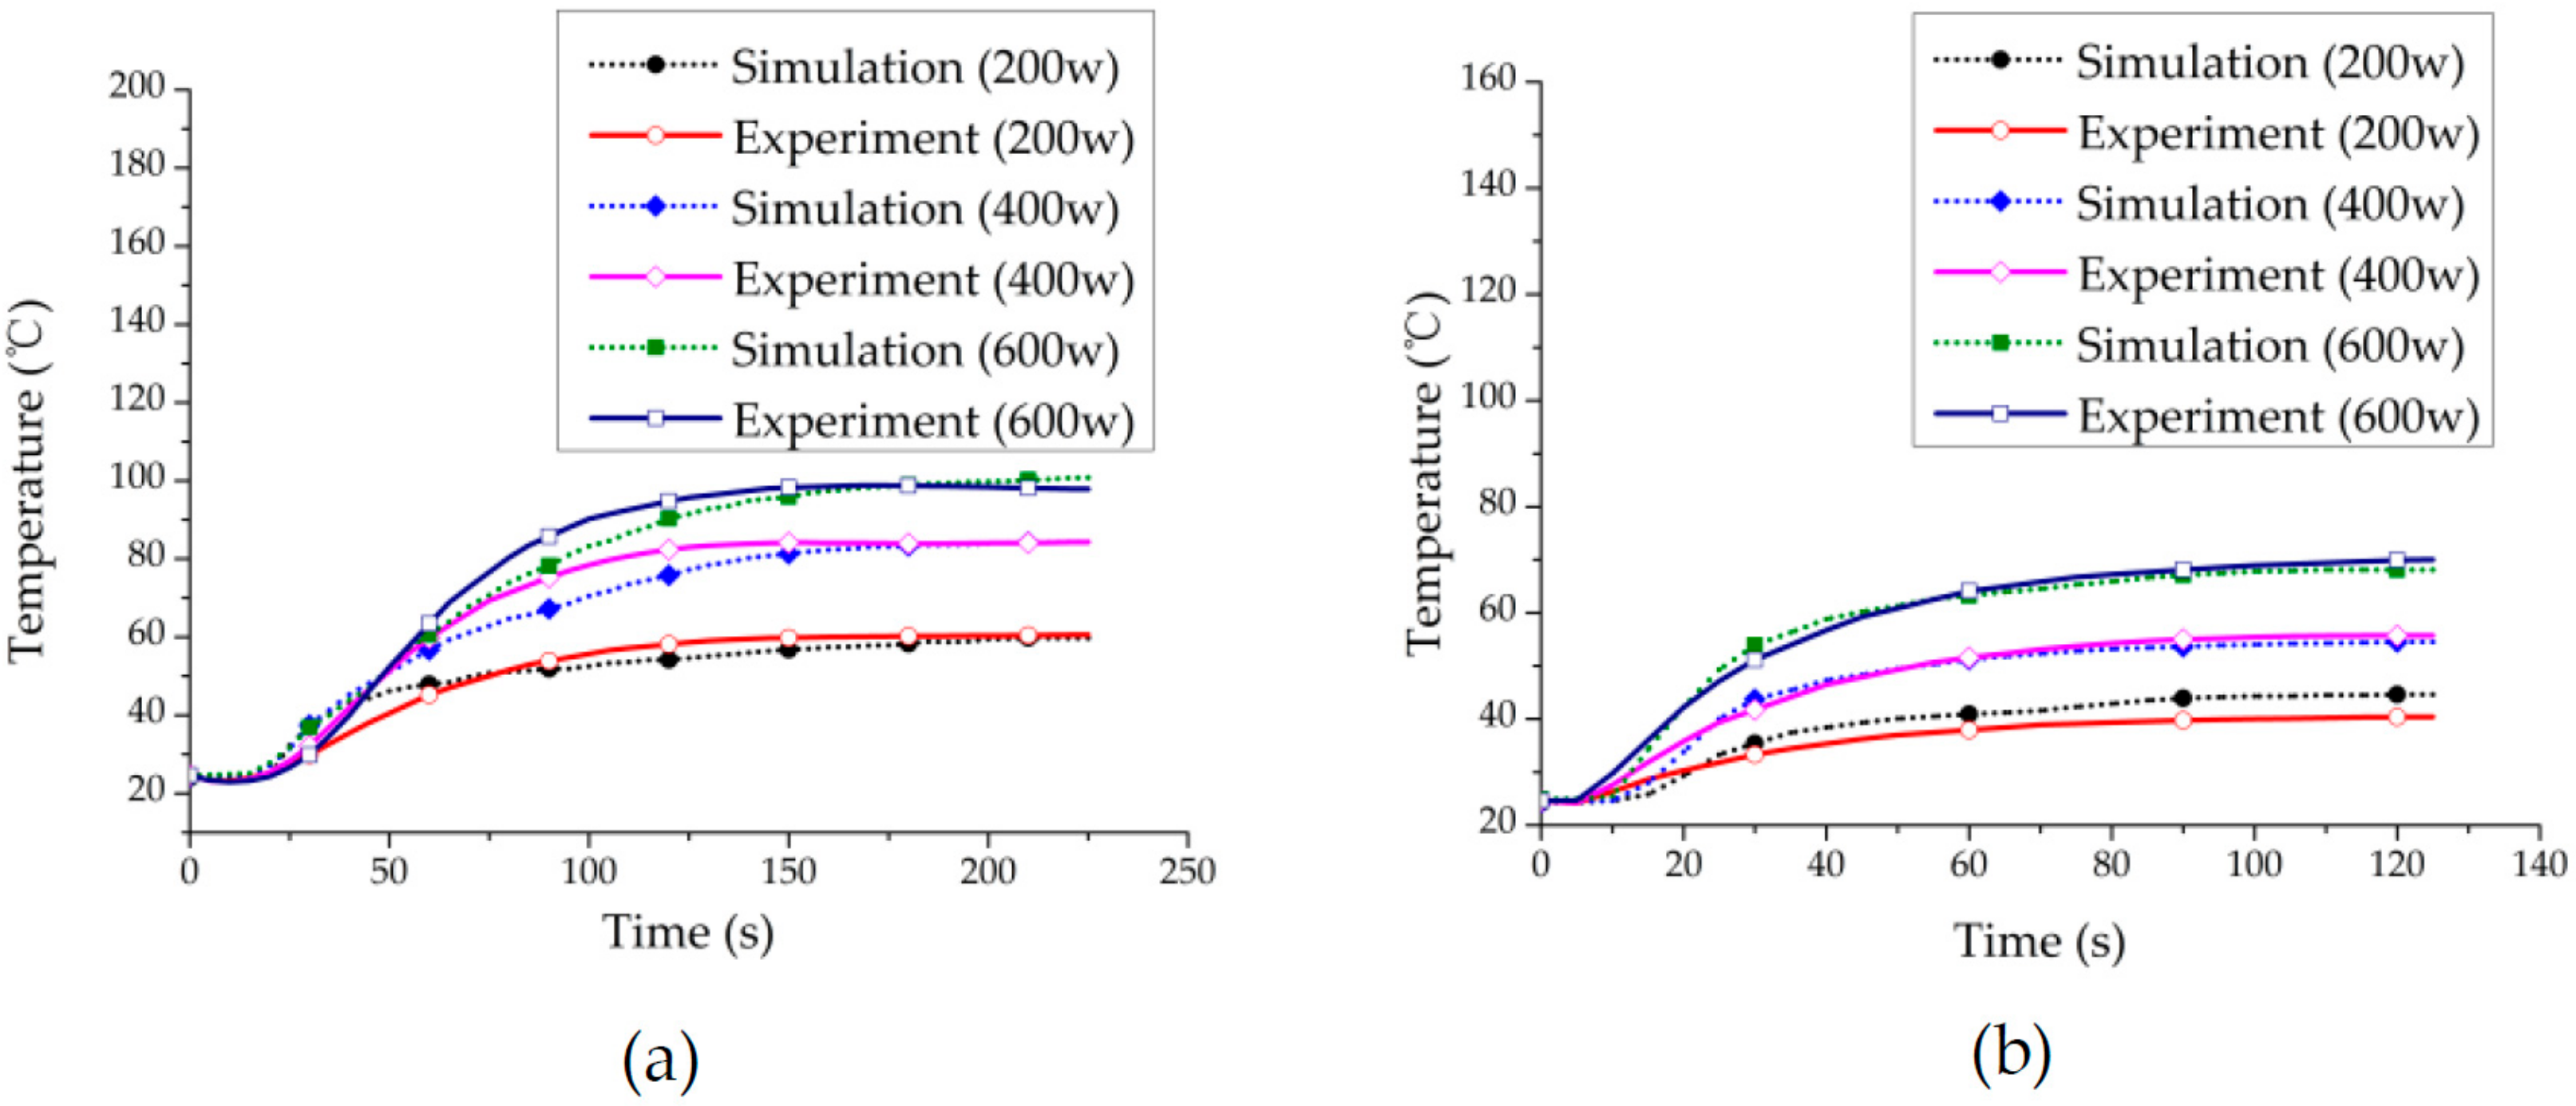
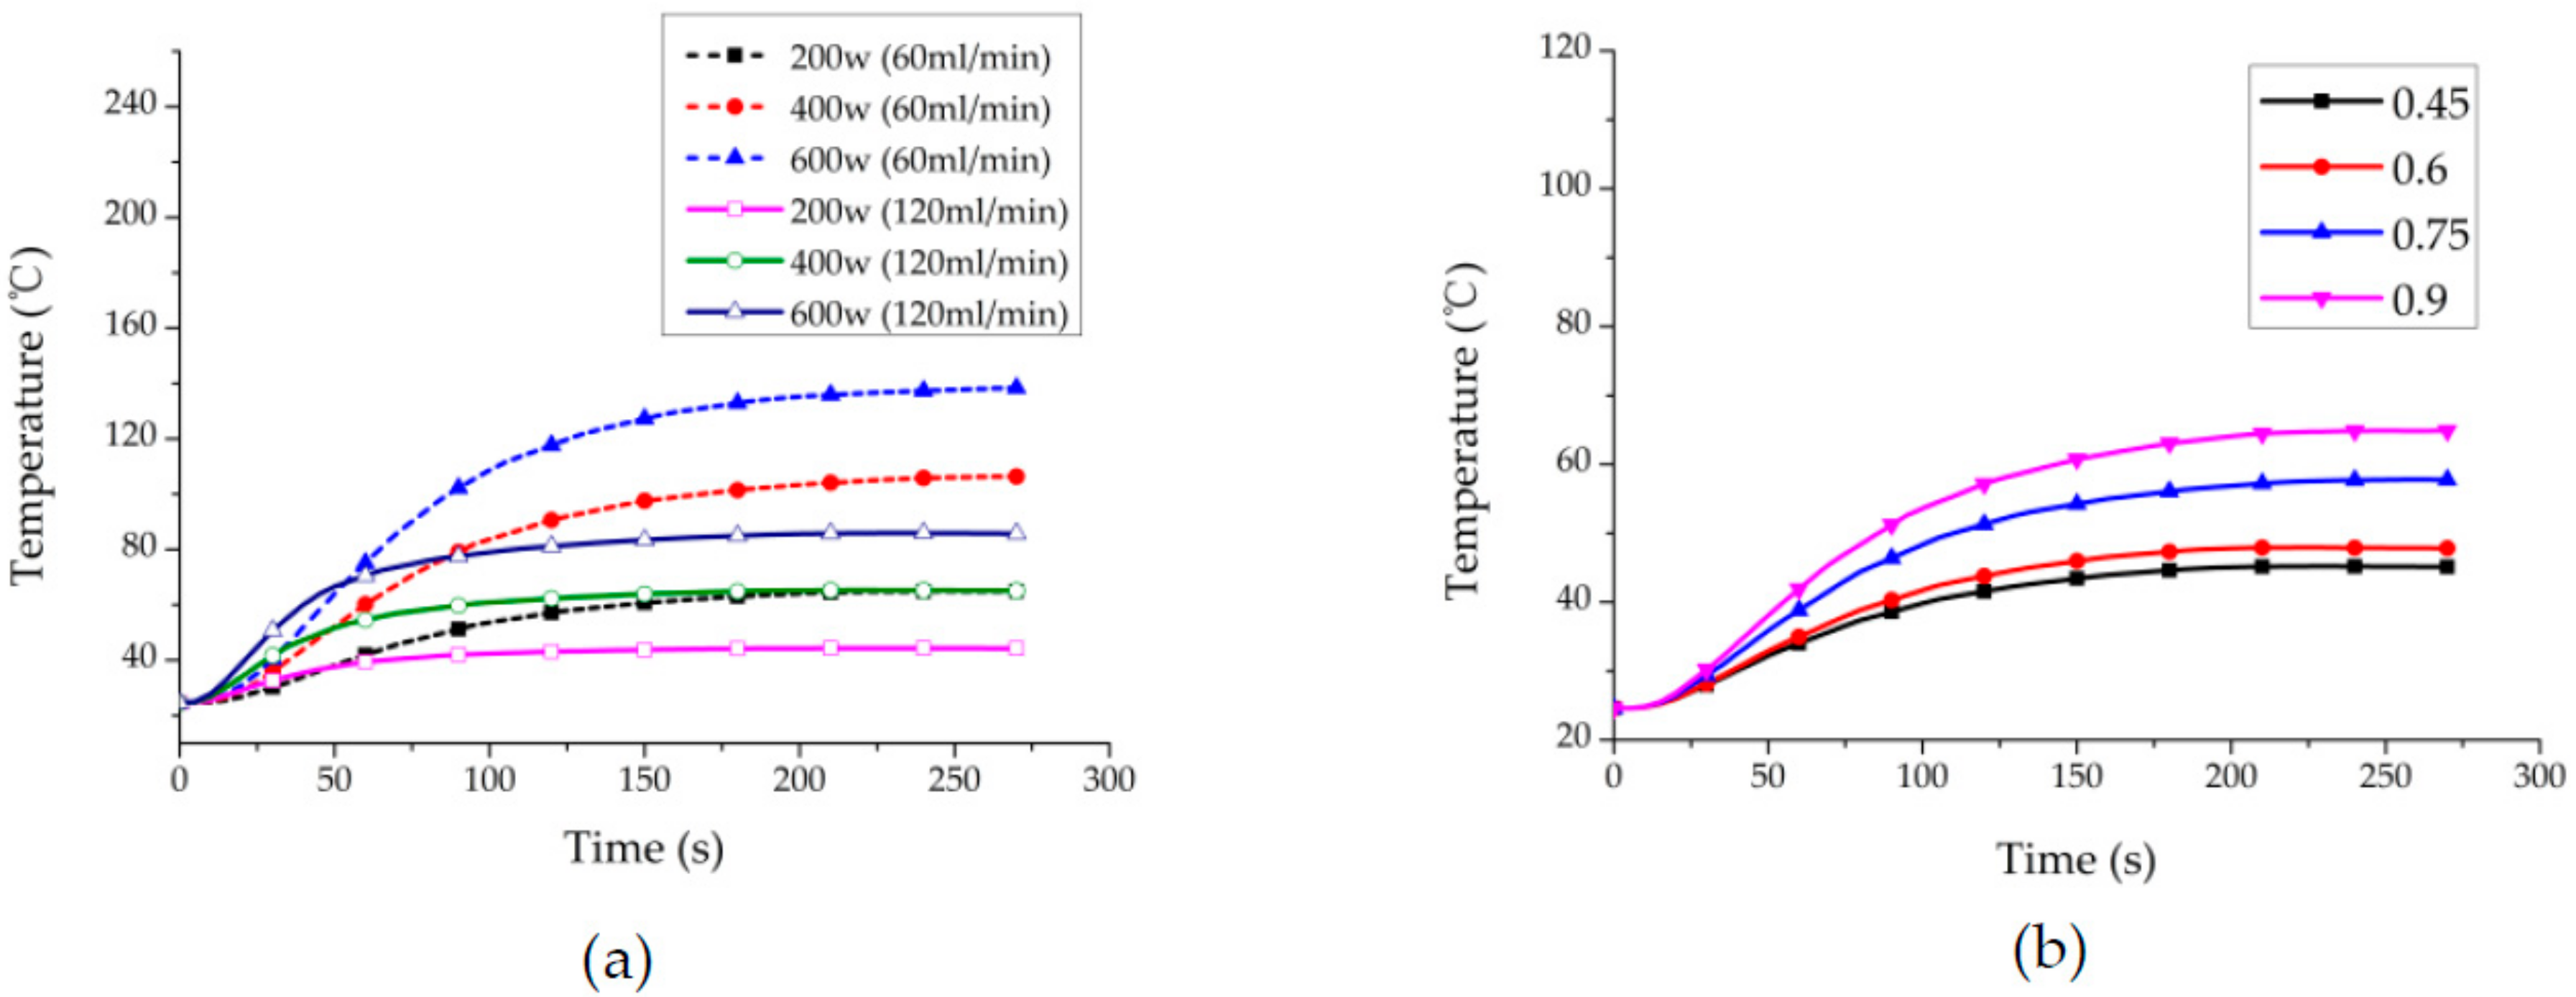
To complete the validation work of the simulation results and silicon carbide as a porous media, the solution was exposed to microwave and heated when it flowed into the microwave cavity via the porous media. Figure 5a–c shows the temperature rise of oleic acid at different microwave powers (200 W, 400 W, 600 W) and different oleic acid velocities (60 mL/min, 120 mL/min, 180 mL/min). The comparison demonstrates that the simulation results match the experiment results well.
The test result agrees well with the simulation. It can be seen from Figure 5 that microwave heating has a rapid heating effect, and it could reach a stable temperature state of heat exchange equilibrium within 150 s. In addition, the lower is the flow velocity, the higher is the temperature that can be achieved when the heat transfer effect reaches the stable liquid outflow.
From Figure 6 and Figure 7, it is evident that uniform temperature distribution has been achieved. The problem that microwave cannot be heated uniformly is solved, which meets the requirement of heating oleic acid in the process of microwave-assisted biodiesel production.
Figure 8 presents the simulation result of temperature rise and microwave power loss density at different positions. It is obvious that the temperatures of both sides of oleic acid are lower than the center, and this is also the case with power loss density. This is consistent with the theory: a higher energy loss due to the absorption of microwave energy increases the temperature.
In order to verify the uniformity of heating, designing the experiment to measure the temperature at three points of the outflow. The positions of the three points are shown in Figure 9. The microwave power used in the experiment was 200 W, and the flow velocities were 60 mL/min, 120 mL/min, and 180 mL/min, for testing the uniformity of heating.
As can be seen from Figure 10, heating uniformity after flowing through the porous medium is basically improved. Moreover, the temperature increasing trends at the three temperature measuring points are consistent, and the temperature is approximately the same. When the temperature was measured, because the three fibers were very difficult to fix, the measured value exhibits small instability. However, the uniformity of microwave heating is essentially realized and can be utilized in practical industrial applications.
3.2. Efficient Heating Method Optimization and Analysis
The effects of different sizes, porosities and materials on the S-parameters are now discussed, and the stable temperature is computed in simulation. Suv is the relationship between input energy from the v port and the output energy from the u port. For example, S11 describes the signal reflected at port 1 for the signal incident at port 1.
The S11 calculation equation:
where represents the input power; and is the reflected power.
Firstly, in the former simulation, the radii of the quartz tube is 11 mm. Different sizes of silicon carbide and tube are now considered. The S11 of different quartz tubes’ radii and silicon carbide’s radii are shown in Table 3. The height of silicon carbide is 54.6 mm in simulation, which is the same as BJ22 waveguide’s height. In addition, the power is 200 W, and the velocity is 60 mL/min.
Next, considering the effect of quartz wall’s thickness on S11, the radius of silicon carbide is 14 mm.
Table 3 and Table 4 show the S11 of different silicon carbide and quartz tube sizes. When the radius of silicon carbide is 14 mm and the tube’s inner radius is 16 mm, the quartz’s wall is 1 mm, and the S11 is −7.93 dB. According to the S11 calculation equation, approximately 84% of the microwave energy is absorbed. This could achieve the efficient use of microwave energy.
Thirdly, the effect of different porosities on microwave efficiency was analyzed. Table 5 presents the calculation result under the condition that microwave power is 200 W and oleic acid velocity is 60 mL/min. As shown in the table, the greater the porosity and the lower the amount of silicon carbide, the smaller the S11 and the higher the temperature when the heat transfer effect is balanced.
Figure 11 shows the temperature rise in a Y–Z cross section at different porosities when microwave power is 200 W and oleic acid velocity is 60 mL/min. As the porosity increases, S11 becomes smaller, more microwave energy is absorbed by silicon carbide, the temperature increase is larger, and the temperature of oleic acid increases. It is evident that a better heating effect can be achieved with a greater porosity.
Finally, silicon nitride was used for simulation. Silicon carbide and silicon nitride are dielectric loss absorbers. They are often utilized as ceramic absorbers [36]. Otherwise, silicon nitride has a good thermal stability and abrasion resistance [37]. The complex permittivity changes very little with temperature rising, so the dielectric constant of silicon nitride is calculated as constants here. Next, Figure 12a shows the simulation results for different power and velocities using silicon nitride. The heating effect was calculated at different porosities when the microwave power was 200 W and the velocity was 60 mL/min.
As shown in Figure 12, the temperature of oleic acid is higher in using silicon nitride than silicon carbide. The reason for this is that the dielectric loss of silicon nitride is greater, and the ability to absorb microwave is stronger. In future work, other materials with high dielectric loss can be used to heat oleic acid for microwave-assisted biodiesel production to achieve efficient uniform heating of microwaves.
4. Conclusions
This paper proposes a method for heating oleic acid by microwave to achieve the pretreatment of microwave-assisted biodiesel production. A general model to compute microwave heating in the fluid–solid coupling situation has been built and computed by COMSOL Multiphysics in the finite element method. An elaborate experimental system was developed to validate the multiphysics model. As a porous media, silicon carbide was utilized to complete the experimental verification. A good heating effect has been achieved. The test results are in good agreement with the simulation results. Moreover, the influence of different sizes, porosities, and materials on microwave absorption efficiency was calculated and used to provide guidance for the subsequent design of high efficiency microwave heating systems. This provides the requisite industrial guidelines for designing larger systems to heat oleic acid to realize large-scale microwave-assisted biodiesel production.
Author Contributions
H.Z. conceived and designed the experiments; W.M. developed the model, performed the experiments, analyzed the data, and wrote the initial draft of the manuscript; B.L., T.X., T.H., J.Z. and Y.Y. reviewed and contributed to the final manuscript; K.H. contributed the location and equipment.
Funding
This work was supported by the National Natural Science Foundation Youth Fund of China (Grant No. 61601312, 61501311). The Sichuan Science and Technology Program (Grant No. 2018FZ0008). State Key Laboratory of Efficient Utilization for Low Grade Phosphate Rock and Its Associated Resources (Grant No. WFKF2017-05).
Conflicts of Interest
The authors declare no conflict of interest.
References
- Leadbeater, N.E.; Stencel, L.M. Fast, easy preparation of biodiesel using microwave heating. Energy Fuels 2006, 20, 2281–2283. [Google Scholar] [CrossRef]
- Du, Z.; Li, Y.; Wang, X.; Wan, Y.; Chen, Q.; Wang, C.; Lin, X.; Liu, Y.; Chen, P.; Ruan, R. Microwave-assisted pyrolysis of microalgae for biofuel production. Bioresour. Technol. 2011, 102, 4890–4896. [Google Scholar] [CrossRef] [PubMed]
- Yu, F.; Deng, S.B.; Chen, P.; Liu, Y.H.; Wan, Y.Q.; Olson, A. Physical and chemical properties of bio-oils from microwave pyrolysis of corn stover. Appl. Biochem. Biotechnol. 2007, 137, 957–970. [Google Scholar] [PubMed]
- Miura, M.; Kaga, H.; Sakurai, A.; Kakuchi, T.; Takahashi, K. Rapid pyrolysis of wood block by microwave heating. J. Anal. Appl. Pyrolysis 2004, 71, 187–199. [Google Scholar] [CrossRef]
- Vyas, A.P.; Verma, J.L.; Subrahmanyam, N. A review on fame production processes. Fuel 2010, 89, 1–9. [Google Scholar] [CrossRef]
- Mansouri, S.S.; Ismail, M.I.; Babi, D.K.; Simasatitkul, L.; Huusom, J.K.; Gani, R. Systematic sustainable process design and analysis of biodiesel processes. Processes 2013, 1, 167–202. [Google Scholar] [CrossRef]
- Lu, X.; Xi, B.; Zhang, Y.; Angelidaki, I. Microwave pretreatment of rape straw for bioethanol production: Focus on energy efficiency. Bioresour. Technol. 2011, 102, 7937–7940. [Google Scholar] [CrossRef] [PubMed]
- Li, J.; Xiong, Q.; Wang, K.; Liang, S.; Gao, M. Combining sliding mode neural network with Cuckoo Search to make a uniform microwave heating process. Int. J. Appl. Electron. 2015, 49, 61–77. [Google Scholar] [CrossRef]
- Mudgett, R.E. Microwave properties and heating characteristics of foods. Food Technol. 1986, 40, 84–87. [Google Scholar]
- Muley, P.D.; Boldor, D. Multiphysics numerical modeling of the continuous flow microwave-assisted transesterification process. J. Microw. Power Electromagn. Energy 2016, 46, 139–162. [Google Scholar] [CrossRef]
- Goldblith, S.A.; Wang, D.I.C. Effect of microwaves on Escherichia coli and Bacillus subtilis. Appl. Microbiol. 1967, 15, 1371–1375. [Google Scholar] [PubMed]
- Huang, K.M.; Liao, Y.H. Transient power loss density of electromagnetic pulse in debye media. IEEE Trans. Microw. Theory Tech. 2015, 63, 135–140. [Google Scholar] [CrossRef]
- Pandit, R.B.; Prasad, S. Finite element analysis of microwave heating of potato–Transient temperature profiles. J. Food Eng. 2003, 60, 193–202. [Google Scholar] [CrossRef]
- Pitchai, K.; Birla, S.L.; Subbiah, J.; Jones, D.; Thippareddi, H. Coupled electromagnetic and heat transfer model for microwave heating in domestic ovens. J. Food Eng. 2012, 112, 100–111. [Google Scholar] [CrossRef] [Green Version]
- Pitchai, K.; Chen, J.; Birla, S.; Gonzalez, R.; Jones, D.; Subbiah, J. A microwave heat transfer model for a rotating multicomponent meal in a domestic oven: Development and validation. J. Food Eng. 2014, 128, 60–71. [Google Scholar] [CrossRef]
- Durlofsky, L.; Brady, J.F. Analysis of the brinkman equation as a model for flow in porous media. Phys. Fluids 1987, 30, 3329–3341. [Google Scholar] [CrossRef]
- Rhodes, M.E. Transport in Heterogeneous Porous Media. Ph.D. Thesis, Imperial College London, London, UK, 2006. [Google Scholar]
- Hwang, S.G.; ADvani, S.G. Numerical simulations of Stokes-Brinkman equations for permeability prediction of dual scale fibrous porous media. Phys. Fluids 2010, 22, 113101. [Google Scholar] [CrossRef]
- Polyanin, A.D.; Aristov, S.N. A new method for constructing exact solutions to three-dimensional Navier-Stokes and Euler equations. Theor. Found. Chem. Eng. 2011, 45, 885–890. [Google Scholar] [CrossRef]
- Jacimovic, N.; Hosoda, T.; Kishida, K.; Ivetic, M. Numerical solution of the Navier-Stokes equations for incompressible flow in porous media with free surface boundary. J. Appl. Mech. 2005, 8, 225–231. [Google Scholar] [CrossRef] [Green Version]
- Drazin, P.G.; Riley, N. The Navier-Stokes equations. A classification of flows and exact solutions, Moduli Spaces. J. Fluid Mech. 2006, 38, 217–220. [Google Scholar]
- Noureddini, H.; Teoh, B.C.; Clements, L.D. Viscosities of vegetable oils and fatty acids. J. Am. Oil Chem. Soc. 1992, 69, 1184–1188. [Google Scholar] [CrossRef]
- Baroncini, C.; Filippo, P.D.; Latini, G.; Pacetti, M. Organic liquid thermal conductivity: A prediction method in the reduced temperature range 0.3 to 0.8. Int. J. Thermophys. 1981, 2, 21–38. [Google Scholar] [CrossRef]
- Zhong, W.; Wu, M. Dieletric properties modeling studies of silicon nitride ceramic in high temperature. Piezoelectr. Acoustoopt. 2014, 36, 857–860. [Google Scholar]
- Sun, X.; Liu, X.; Huang, L. Effects of TiN addition on mechanic properties and electroconductive of Si3N4 matrix materials. J. Ceram. 1999, 20, 196–189. [Google Scholar]
- Wang, S. Fabrication and Properties of Si3N4/SiC Composites Ceramic. Master’s Thesis, Wuhan University of Science and Technology, Wuhan, China, 2012. [Google Scholar]
- Wu, M. Porous Dielectric Material Thermal Behavior Research. Master’s Thesis, University of Electronic Science and Technology of China, Chengdu, China, 2016. [Google Scholar]
- Motasemi, F.; Salema, A.A.; Afzal, M.T. Dielectric characterization of corn stover for microwave processing technology. Fuel Process. Technol. 2015, 131, 370–375. [Google Scholar] [CrossRef]
- Alexandra, K.; Jan, D.; Pavol, S. Thermal shock resistance and fracture toughness of liquid-phase-sintered SiC-based ceramics. J. Eur. Ceram. Soc. 2009, 29, 2387–2394. [Google Scholar]
- Liu, X.; Li, H.; Gao, X. Research progress of foam SiC ceramic materials. Chem. Ind. Eng. Prog. 2012, 30, 2520–2524. [Google Scholar]
- Zhu, H.; Gulati, T.; Datta, A.K.; Huang, K. Microwave drying of spheres: Coupled electromagnetics-multiphase transport modeling with experimentation. Part I: Model development and experimental methodology. Food. Bioprod. Process. 2015, 96, 314–325. [Google Scholar] [CrossRef]
- Zhu, J.; Kuznetsov, A.V.; Sandeep, K.P. Numerical simulation of forced convection in a duct subjected to microwave heating. Heat Mass Transf. 2006, 43, 255–264. [Google Scholar] [CrossRef]
- Rylander, T.; Bondeson, A. Stable FEM-FDTD hybrid method for Maxwell’s equations. Comput Phys Commun. 2000, 125, 75–82. [Google Scholar] [CrossRef]
- Pathak, S.K.; Liu, F.; Tang, J. Finite difference time domain (FDTD) characterization of a single mode applicator. J. Microw. Power Electromagn. Energy 2016, 38, 37–48. [Google Scholar] [CrossRef]
- Hong, Y.; Lin, B.; Li, H.; Dai, H.; Zhu, C.; Yao, H. Three-dimensional simulation of microwave heating coal sample with varying parameters. Appl. Therm. Eng. 2016, 93, 1145–1154. [Google Scholar] [CrossRef]
- Qin, Q.; Zhang, Y.; Zhang, X. Research progress of microwave absorption materials. Electron. Compon. Mater. 2009, 28, 78–81. [Google Scholar]
- Li, Y.; Yang, L.; Hong, L.; Yang, C.; Gao, J. Thermal stability of oxygen containing silicon nitride ceramic fibers in inert atmosphere. Bull. Chin. Ceram. Soc. 2015, 34, 1798–1802. [Google Scholar]
Figure 1.
The geometry of the microwave heating.
Figure 2.
Complex permittivity measurement system.

Figure 3.
Normalized power absorption (NPA) variation of heating computations with different mesh sizes.
Figure 3.
Normalized power absorption (NPA) variation of heating computations with different mesh sizes.
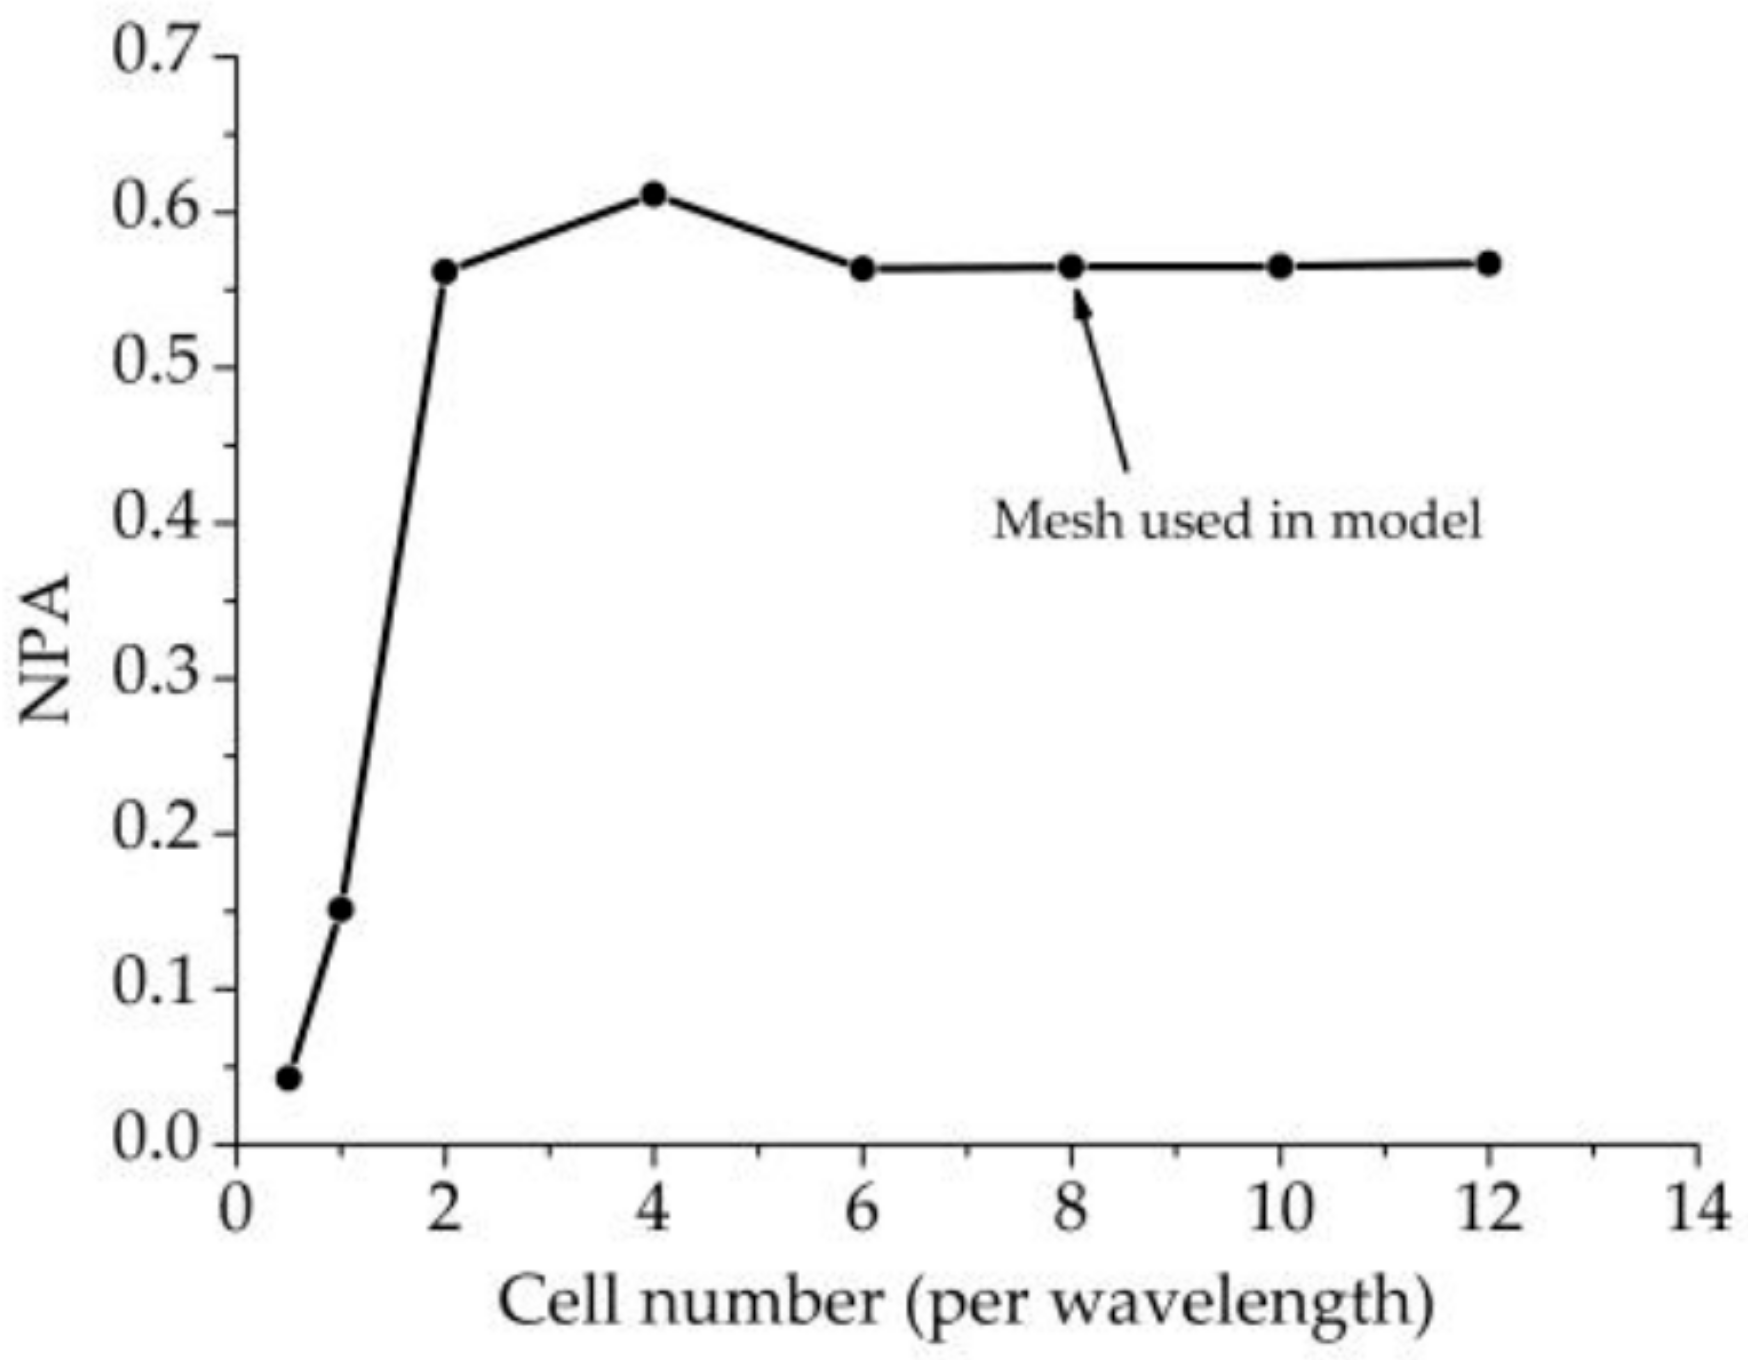
Figure 4.
Schematic of experiment setup.

Figure 5.
Temperature rise (°C) comparisons between the experiment and simulation: (a) temperature rise at a velocity of 60 mL/min; (b) temperature rise at a velocity of 120 mL/min; (c) temperature rise at a velocity of 180 mL/min.
Figure 5.
Temperature rise (°C) comparisons between the experiment and simulation: (a) temperature rise at a velocity of 60 mL/min; (b) temperature rise at a velocity of 120 mL/min; (c) temperature rise at a velocity of 180 mL/min.

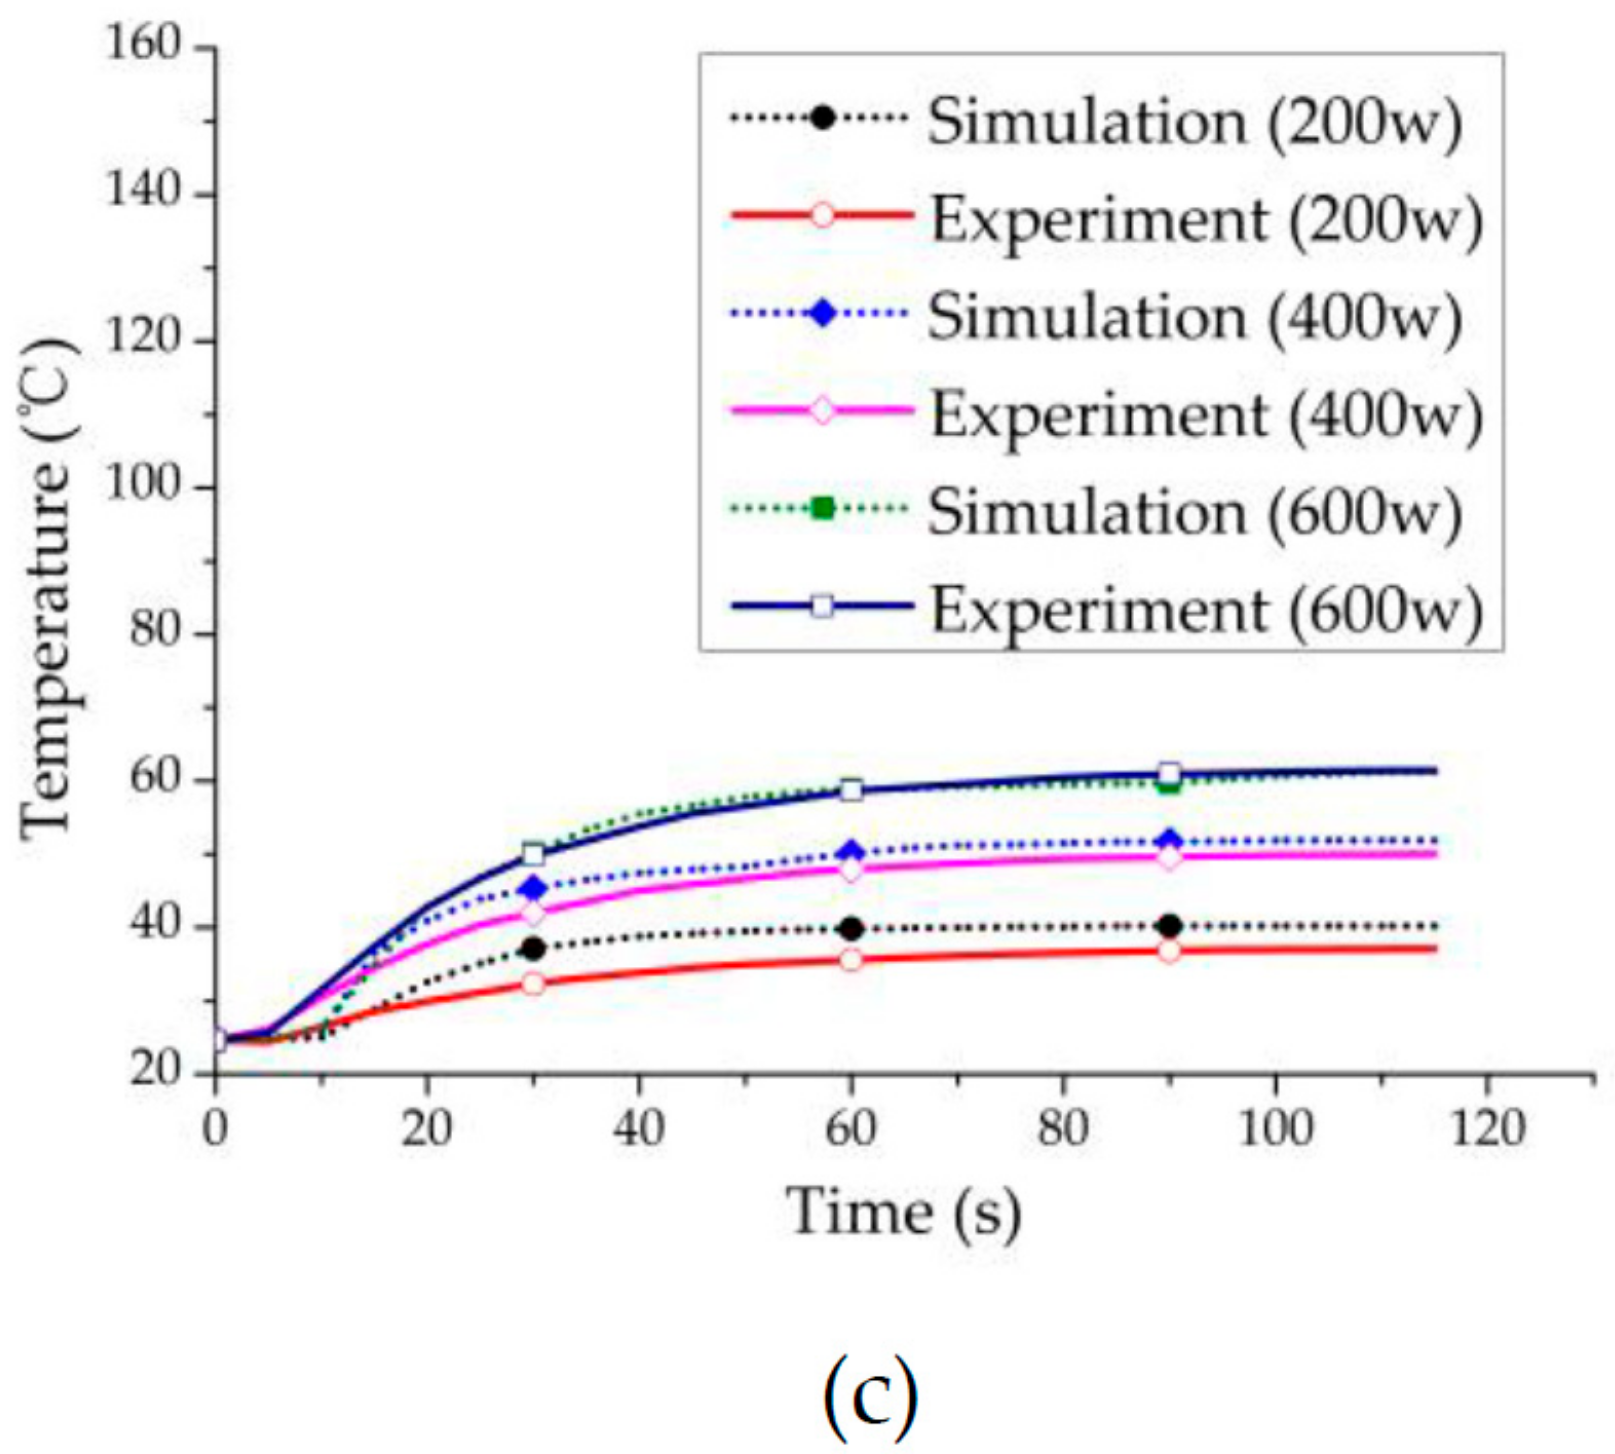
Figure 6.
The cross-sectional temperature (°C) distribution at different velocities when the microwave power is 200 W in the simulation.
Figure 6.
The cross-sectional temperature (°C) distribution at different velocities when the microwave power is 200 W in the simulation.
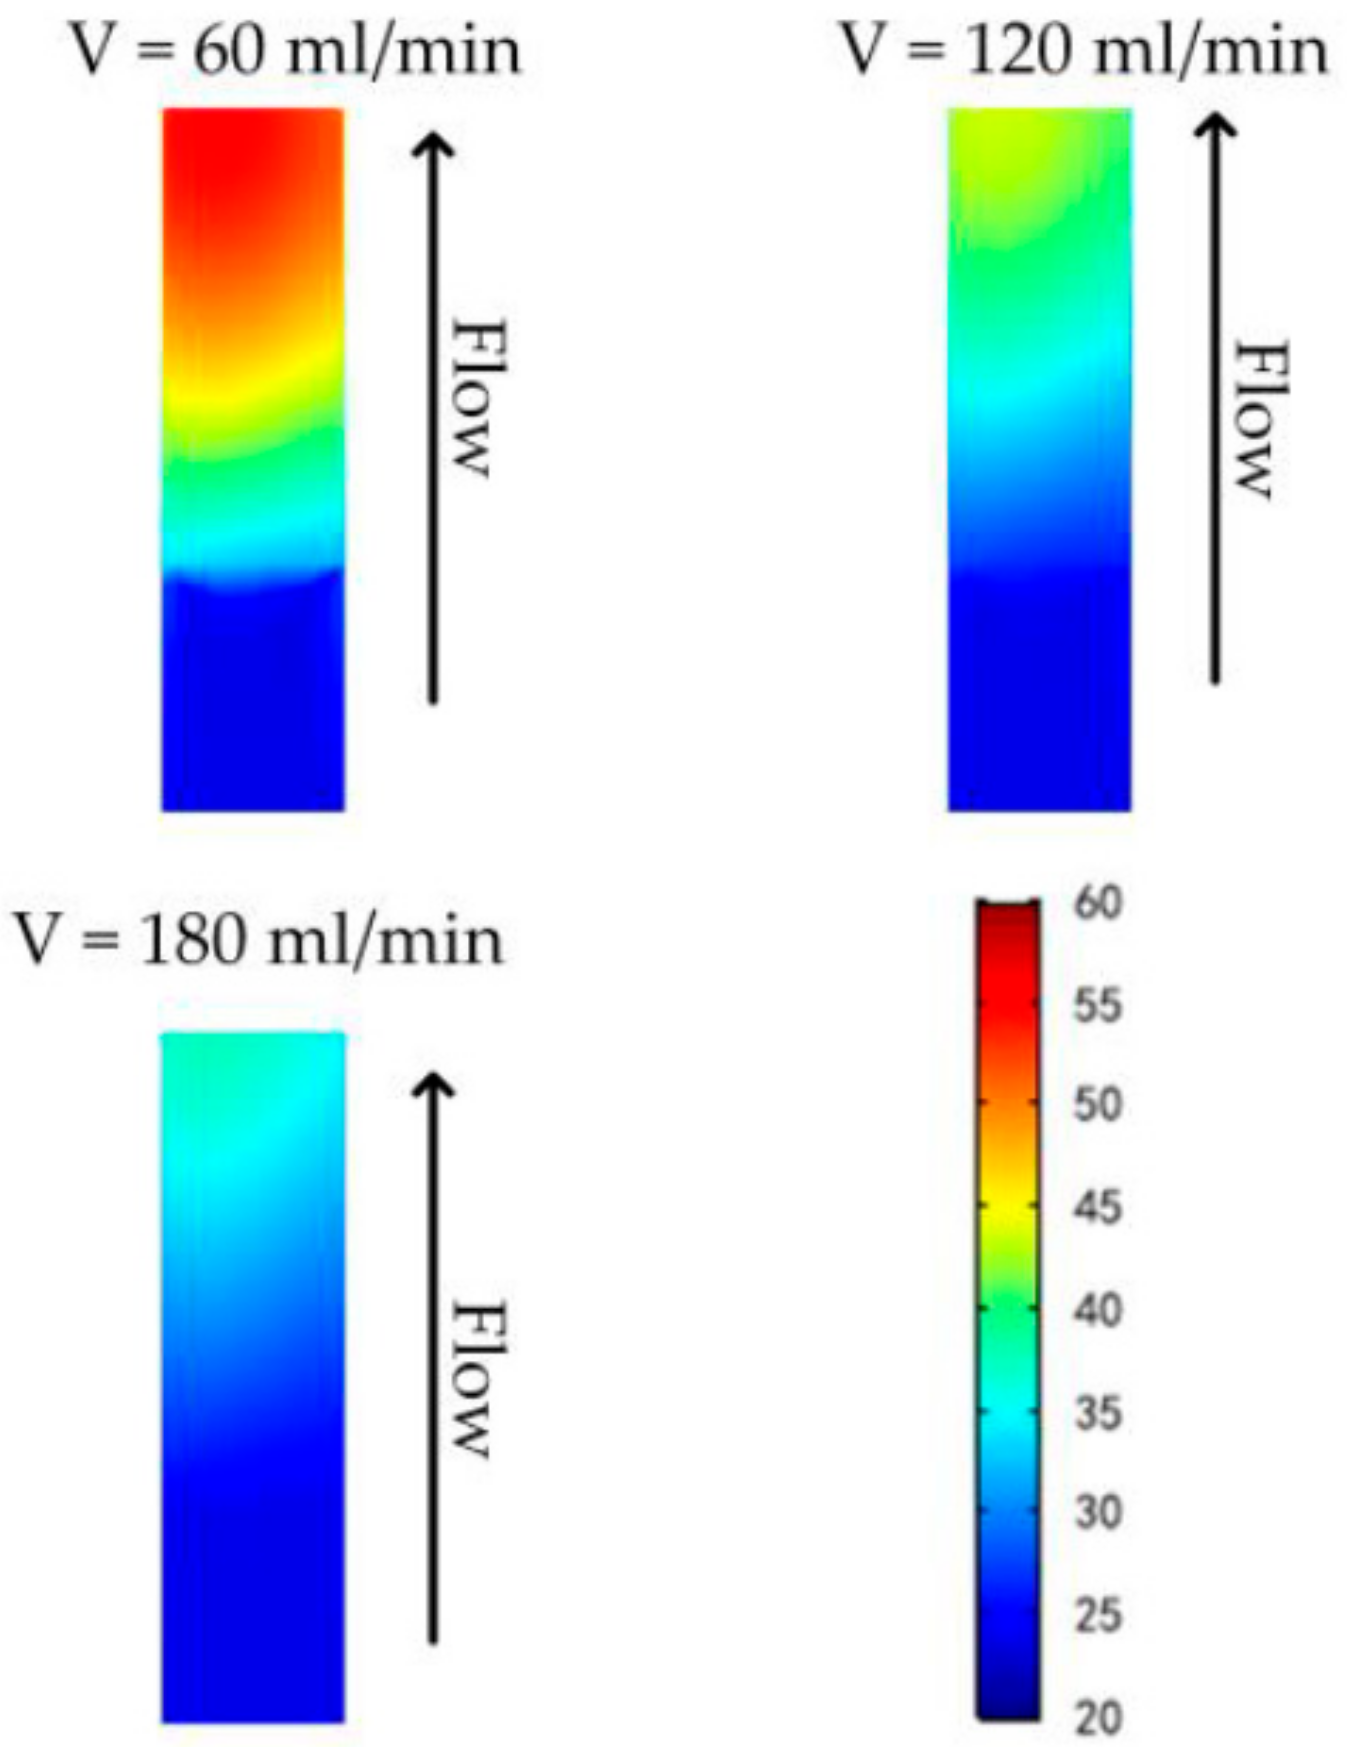
Figure 7.
Temperature profile (°C) over different cross sections along the z-axis at different velocities when the microwave power is 200 W.
Figure 7.
Temperature profile (°C) over different cross sections along the z-axis at different velocities when the microwave power is 200 W.

Figure 8.
(a) Height position calibration; (b) The temperature rise (°C) profile and electromagnetic power loss density profile. The cross line from site (45.6, 150, Z) to site (63.6, 150, Z) at 200 W under 60 mL/min velocity (Z = 20 mm, 25 mm, 30 mm).
Figure 8.
(a) Height position calibration; (b) The temperature rise (°C) profile and electromagnetic power loss density profile. The cross line from site (45.6, 150, Z) to site (63.6, 150, Z) at 200 W under 60 mL/min velocity (Z = 20 mm, 25 mm, 30 mm).
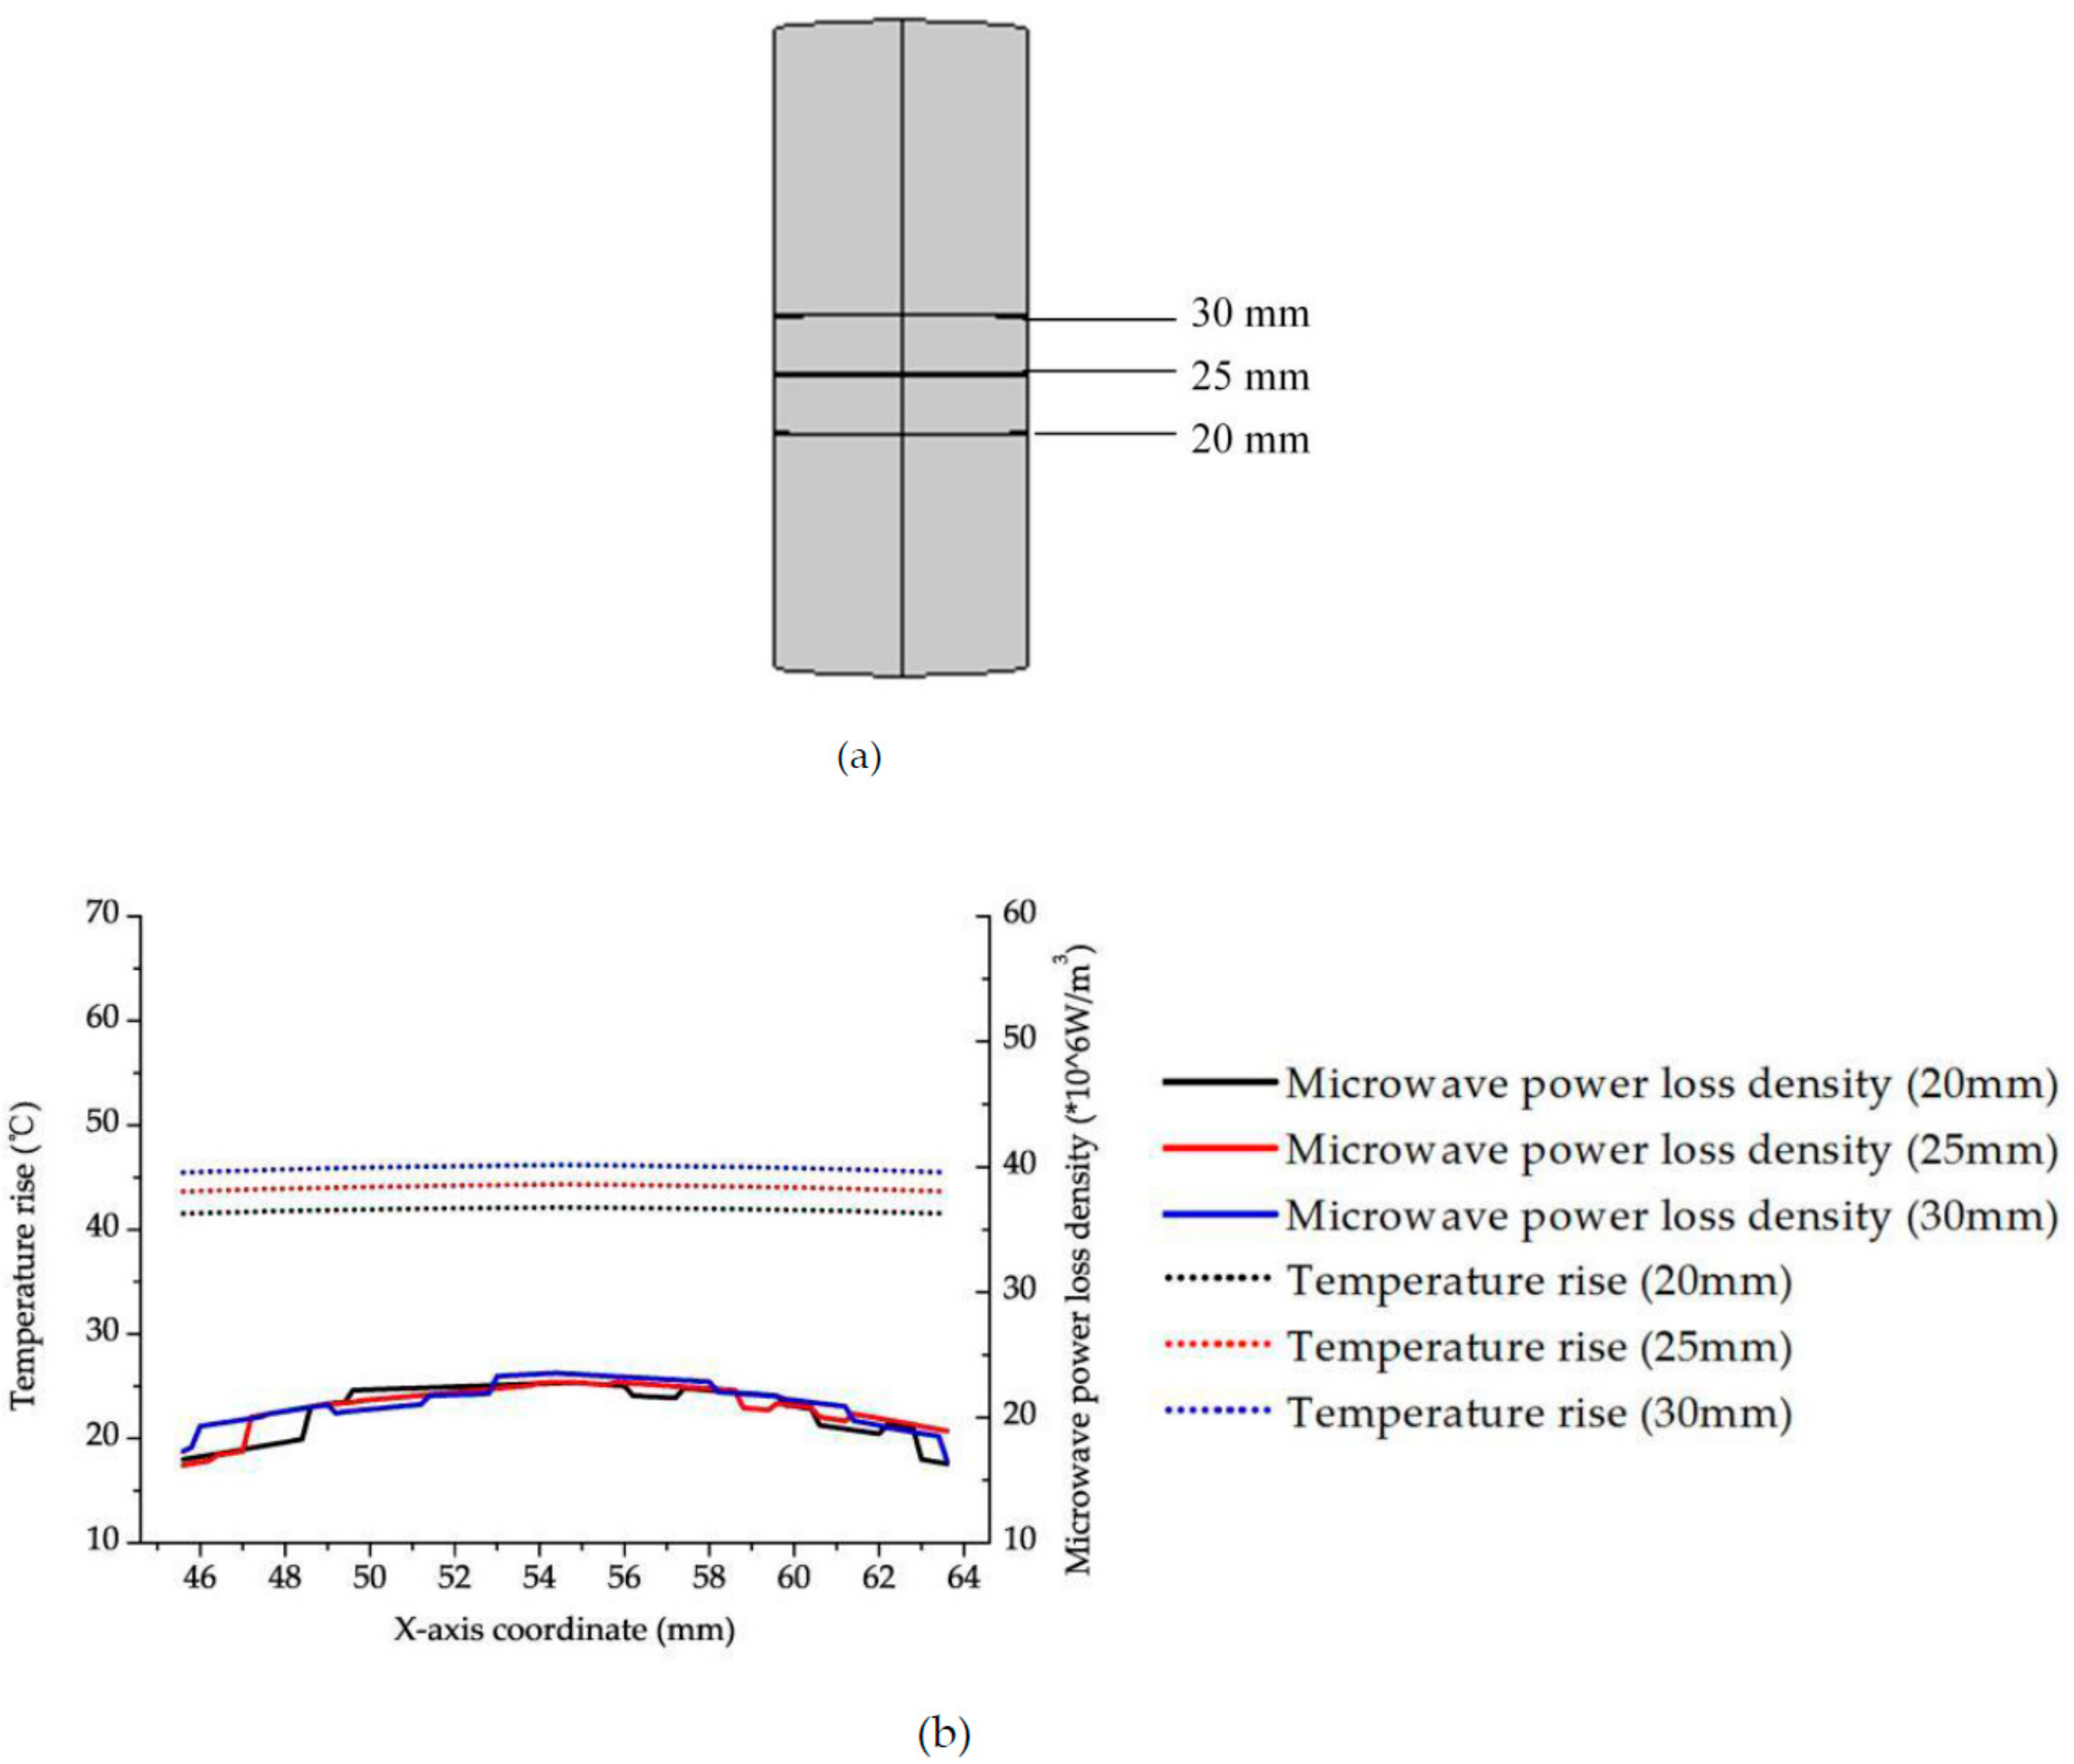
Figure 9.
Identification of different temperature measurement points.

Figure 10.
Temperature rise at point A (45.6, 150, 85), point B (54.6, 150, 85), and point C (63.6, 150, 85) when the microwave power was 200 W. (a) temperature rise at a velocity of 60 mL/min; (b) temperature rise at a velocity of 120 mL/min; and (c) temperature rise at a velocity of 180 mL/min.
Figure 10.
Temperature rise at point A (45.6, 150, 85), point B (54.6, 150, 85), and point C (63.6, 150, 85) when the microwave power was 200 W. (a) temperature rise at a velocity of 60 mL/min; (b) temperature rise at a velocity of 120 mL/min; and (c) temperature rise at a velocity of 180 mL/min.

Figure 11.
Temperature rise (°C) comparisons at different porosities in simulation. (a) temperature rise at porosity of 0.45; (b) temperature rise at porosity of 0.6; (c) temperature rise at porosity of 0.75; (d) temperature rise at porosity of 0.9.
Figure 11.
Temperature rise (°C) comparisons at different porosities in simulation. (a) temperature rise at porosity of 0.45; (b) temperature rise at porosity of 0.6; (c) temperature rise at porosity of 0.75; (d) temperature rise at porosity of 0.9.

Figure 12.
Temperature increase of oleic acid using silicon nitride under different conditions: (a) at different power and velocity; and (b) at different porosities.
Figure 12.
Temperature increase of oleic acid using silicon nitride under different conditions: (a) at different power and velocity; and (b) at different porosities.


Table 1.
Summary of material properties applied in the model.
| Property | Relative Permittivity | Dynamic Viscosities (Pa·s) | Conductivity (S/m) | Heat Conductivity Coefficient (W/m∙K) |
|---|---|---|---|---|
| Oleic acid | 2.563 − j × 0.0074 | 0.00249 + 1663.122 × exp (−T/26.876) [22] | 3 × 10⁻¹³ | 0.3292 − 0.000331 × T [23] |
| Silicon carbide | 20.08 − j × 1.5 (in this study) | - | 0.16 (in this study) | 1280 (in this study) |
| Silicon nitride | 7.8 − j × 0.05 [24] | - | 0.11 [25] | 18.42 [26] |
| Air | 1 | - | 0 | 2.524 |
| Quartz | 4.2 | - | 1 × 10⁻¹⁴ | 10 |
| Property | Heat Capacity at Constant Pressure (J/kg∙K) | Factor of Porosity | Density (kg/m3) | Heat Capacity at Constant Pressure (J/kg∙K) |
| Oleic acid | 2670.852 + 4.147 × T | - | 1100.15 − 0.698 × T [22] | 2670.852 + 4.147 × T |
| Silicon carbide | 1600 (in this study) | 0.9 (by measurement) | 580 (in this study) | 1600 (in this study) |
| Silicon nitride | 710 [26] | - | 3198 [27] | 710 [26] |
| Air | 1005 | - | 1.205 | 1005 |
| Quartz | 260 | - | 2600 | 260 |
Table 2.
The complex permittivity of oleic at different temperatures.
| Temperature | ||
|---|---|---|
| 27 °C | 2.563416 | 0.007422231 |
| 37 °C | 2.572715 | 0.008652959 |
| 43 °C | 2.577733 | 0.009912491 |
| 54 °C | 2.564682 | 0.005191663 |
| 70 °C | 2.566721 | 0.005631242 |
Table 3.
The S11 and stable temperature of different quartz tubes’ radii and silicon carbide’s radii.
Table 3.
The S11 and stable temperature of different quartz tubes’ radii and silicon carbide’s radii.
| Quartz Tube’s Radius (mm) | 13 | 12 | 14 | 15 | 16 | 17 | 18 | 19 | 20 |
| Silicon Carbide’s Radius (mm) | 11 | 11 | 12 | 13 | 14 | 15 | 16 | 17 | 18 |
| S11 (dB) | −6.03 | −6.48 | −6.61 | −6.96 | −7.12 | −6.95 | −6.85 | −6.62 | −6.36 |
| Stable Temperature (°C) | 51.97 | 38.07 | 50.54 | 50.78 | 49.34 | 47.76 | 47.76 | 45.78 | 48.74 |
Table 4.
The S11 and stable temperature of different quartz tube’s thicknesses.
| Quartz Tube’s Radius (mm) | 17 | 18 | 19 | 20 | 17 | 18 | 19 |
| Quartz Tube’s Inner Radius (mm) | 15 | 16 | 17 | 18 | 16 | 16 | 16 |
| Silicon Carbide’s Radius (mm) | 14 | 14 | 14 | 14 | 14 | 14 | 14 |
| S11 (dB) | −7.78 | −7.11 | −6.35 | −5.82 | −7.93 | −7.12 | −6.18 |
| Stable Temperature (°C) | 38.79 | 49.34 | 55.56 | 54.98 | 52.36 | 49.34 | 44.87 |
Table 5.
The S11 and temperature of different porosities of silicon carbide.
| Porosity | 0.45 | 0.6 | 0.75 | 0.9 |
| S11 (dB) | −2.8 | −3.54 | −5.76 | −7.24 |
| Stable temperature (°C) | 34.81 | 37.65 | 44.20 | 54.36 |
© 2018 by the authors. Licensee MDPI, Basel, Switzerland. This article is an open access article distributed under the terms and conditions of the Creative Commons Attribution (CC BY) license (http://creativecommons.org/licenses/by/4.0/).
Share and Cite
MDPI and ACS Style
Ma, W.; Hong, T.; Xie, T.; Wang, F.; Luo, B.; Zhou, J.; Yang, Y.; Zhu, H.; Huang, K. Simulation and Analysis of Oleic Acid Pretreatment for Microwave-Assisted Biodiesel Production. Processes 2018, 6, 142. https://doi.org/10.3390/pr6090142
AMA Style
Ma W, Hong T, Xie T, Wang F, Luo B, Zhou J, Yang Y, Zhu H, Huang K. Simulation and Analysis of Oleic Acid Pretreatment for Microwave-Assisted Biodiesel Production. Processes. 2018; 6(9):142. https://doi.org/10.3390/pr6090142
Chicago/Turabian StyleMa, Weiquan, Tao Hong, Tian Xie, Fengxia Wang, Bin Luo, Jie Zhou, Yang Yang, Huacheng Zhu, and Kama Huang. 2018. "Simulation and Analysis of Oleic Acid Pretreatment for Microwave-Assisted Biodiesel Production" Processes 6, no. 9: 142. https://doi.org/10.3390/pr6090142
Note that from the first issue of 2016, this journal uses article numbers instead of page numbers. See further details here.