Modelling and Simulation of Biochemical Processes Using Petri Nets


LRIT-CNRST URAC’29, Rabat IT Center, Faculty of Sciences, Mohammed V University, Rabat 1014, Morocco
*
Author to whom correspondence should be addressed.
Processes 2018, 6(8), 97; https://doi.org/10.3390/pr6080097
Submission received: 30 June 2018
/
Revised: 16 July 2018
/
Accepted: 19 July 2018
/
Published: 24 July 2018
(This article belongs to the Special Issue In silico metabolic modeling and engineering)
Abstract
:Systems composed of many components which interact with each other and lead to unpredictable global behaviour, are considered as complex systems. In a biological context, complex systems represent living systems composed of a large number of interacting elements. In order to study these systems, a precise mathematical modelling was typically used in this context. However, this modelling has limitations in the structural understanding and the behavioural study. In this sense, formal computational modelling is an approach that allows to model and to simulate dynamical properties of these particular systems. In this paper, we use Hybrid Functional Petri Net (HFPN), a Petri net extension dedicated to study and verify biopathways, to model and study the Methionine metabolic pathway. Methionine and its derivatives play significant roles in human bodies. We propose a set of simulations for the purpose of studying and analysing the Methionine pathway’s behaviour. Our simulation results have shown that several important abnormalities in this pathway are related to sever diseases such as Alzheimer’s disease, cardiovascular disease, cancers and others.
Keywords:
biochemical processes; metabolic pathway; Methionine cycle; Petri nets; HFPN; simulation; diseases1. Introduction
1.1. Context
Living organisms have complex structures and are composed of several interconnected components interacting with each other. Among them, biochemical networks represent a large complex connectivity between reactions occurring in living cells. They are formed by several complex metabolic pathways. Dynamic properties of these pathways determine not only the physiology of cells but also the development and behaviour of the organism. Being dynamic and complex, their behaviour may be hard to analyse and to predict. Biologists and biochemists are constantly in search for methods and strategies that can help them in the understanding of life complexity.
1.2. Problems & Issues
Dynamics of biochemical networks including metabolic pathways have often been described by mathematical equations. A representative review of these formalisms such as Boolean networks, differential equations and stochastic equations, is proposed in [1].
Mathematical modelling has the advantage to perform in silico studies over several execution scenarios. However, it has the difficulty of identifying and representing biological systems at a detailed level and has the difficulty of managing the complexity of such systems.
To address mathematical modelling limitations, several computational models, simulations and tools are proposed in [2]. Among them, a multi agent system platform has been proposed in [3] to simulate biological networks. Process Algebra is also used in the context of modelling and analysing biological systems and biochemical processes [4].
However, Petri nets remain the formal specification the most popular and widely used in systems biology [5]. In the context of modelling biological systems, Petri nets were used for the first time as a modelling formalism for metabolic pathways in systems biology in [6]. They are well suited for modelling such systems since they provide an intuitive graphical representation of biochemical systems which facilitates the understanding of the modelled systems. They help revealing the logic behind these complex systems, offer specific analysis, namely, static, qualitative and quantitative behavioural analysis. Furthermore, they are supported by a wide range of simulation and analysis tools and offer several extensions. In order to model biochemical networks, different extensions of Petri nets are proposed in [7,8,9,10,11,12,13,14]. Some application examples of studying and analysing such systems are also given in [7,8,15,16,17].
1.3. Contribution & Contents
In this paper, we present a complex biological system associated to metabolic causes of several disorders which is the Methionine metabolic pathway. We start first by giving a presentation of the studied metabolic pathway from a biological point of view, and we describe likewise its behaviour in normal case and the resulting consequences of deregulations in its functioning.
In regards to the modelling of Methionine cycle, a first mathematical representation was proposed in Martinov et al. (2000) [18]. Other mathematical models are proposed in [19,20,21,22,23,24].
A computational modelling approach is proposed in [25]. This approach consists of using hybrid functional Petri net (HFPN) to model chemical reactions constituting the metabolic pathway. We have based our proposition on using the same formalism, HFPN [26] which is the most suitable extension designed to model biological systems.
This work proposition aims to identify and study the system’s behaviour relatively to its normal and abnormal functioning. Therefore, we present a simulation of the established HFPN model in normal case (i.e., normal functioning of the metabolic pathway). We also propose several execution scenarios allowing to have a general idea about the system’s behaviour through its representative HFPN model.
This paper focuses on proposing a computational modelling of biochemical networks in order to combine the effectiveness of formal specification aspects with the simplicity of the intuitive graphical aspect offered by HFPN, the dedicated Petri net extension for biological systems.
The success of the proposed approach depends on the success of each phase, starting from selection of the appropriate modelling tools, going through the model construction including its adjustment, arriving to the proposed model validation and prediction of its dynamic behaviour through simulation and finally analysing the simulation results.
Actually, researchers have an agreement that a quantitative description of dynamic behaviour of biological systems with complex interacting components, is unavoidable in order to entirely understand them.
This paper is structured as follows: Section 2 introduces the studied metabolic pathway and its mechanism, and Section 3 introduces the Petri net and HFPN extension. Section 4 presents the HFPN model representing the studied metabolic pathway construction. In Section 5, the simulation results of the proposed model are shown and discussed. Finally, Section 6 concludes the paper and gives some directions for future works.
2. Methionine Metabolic Pathway: The Studied Biochemical System
Methionine is a sulfur amino acid that is essential for the growth and equilibrium of the organism. It is provided by diet since it can not be produced by the body [27]. Methionine pathway has the essential role to regulate the Methionine concentration in order to maintain the equilibrium of the organism. This amino acid with its derivatives construct a cyclic metabolic pathway playing significant roles in human bodies.
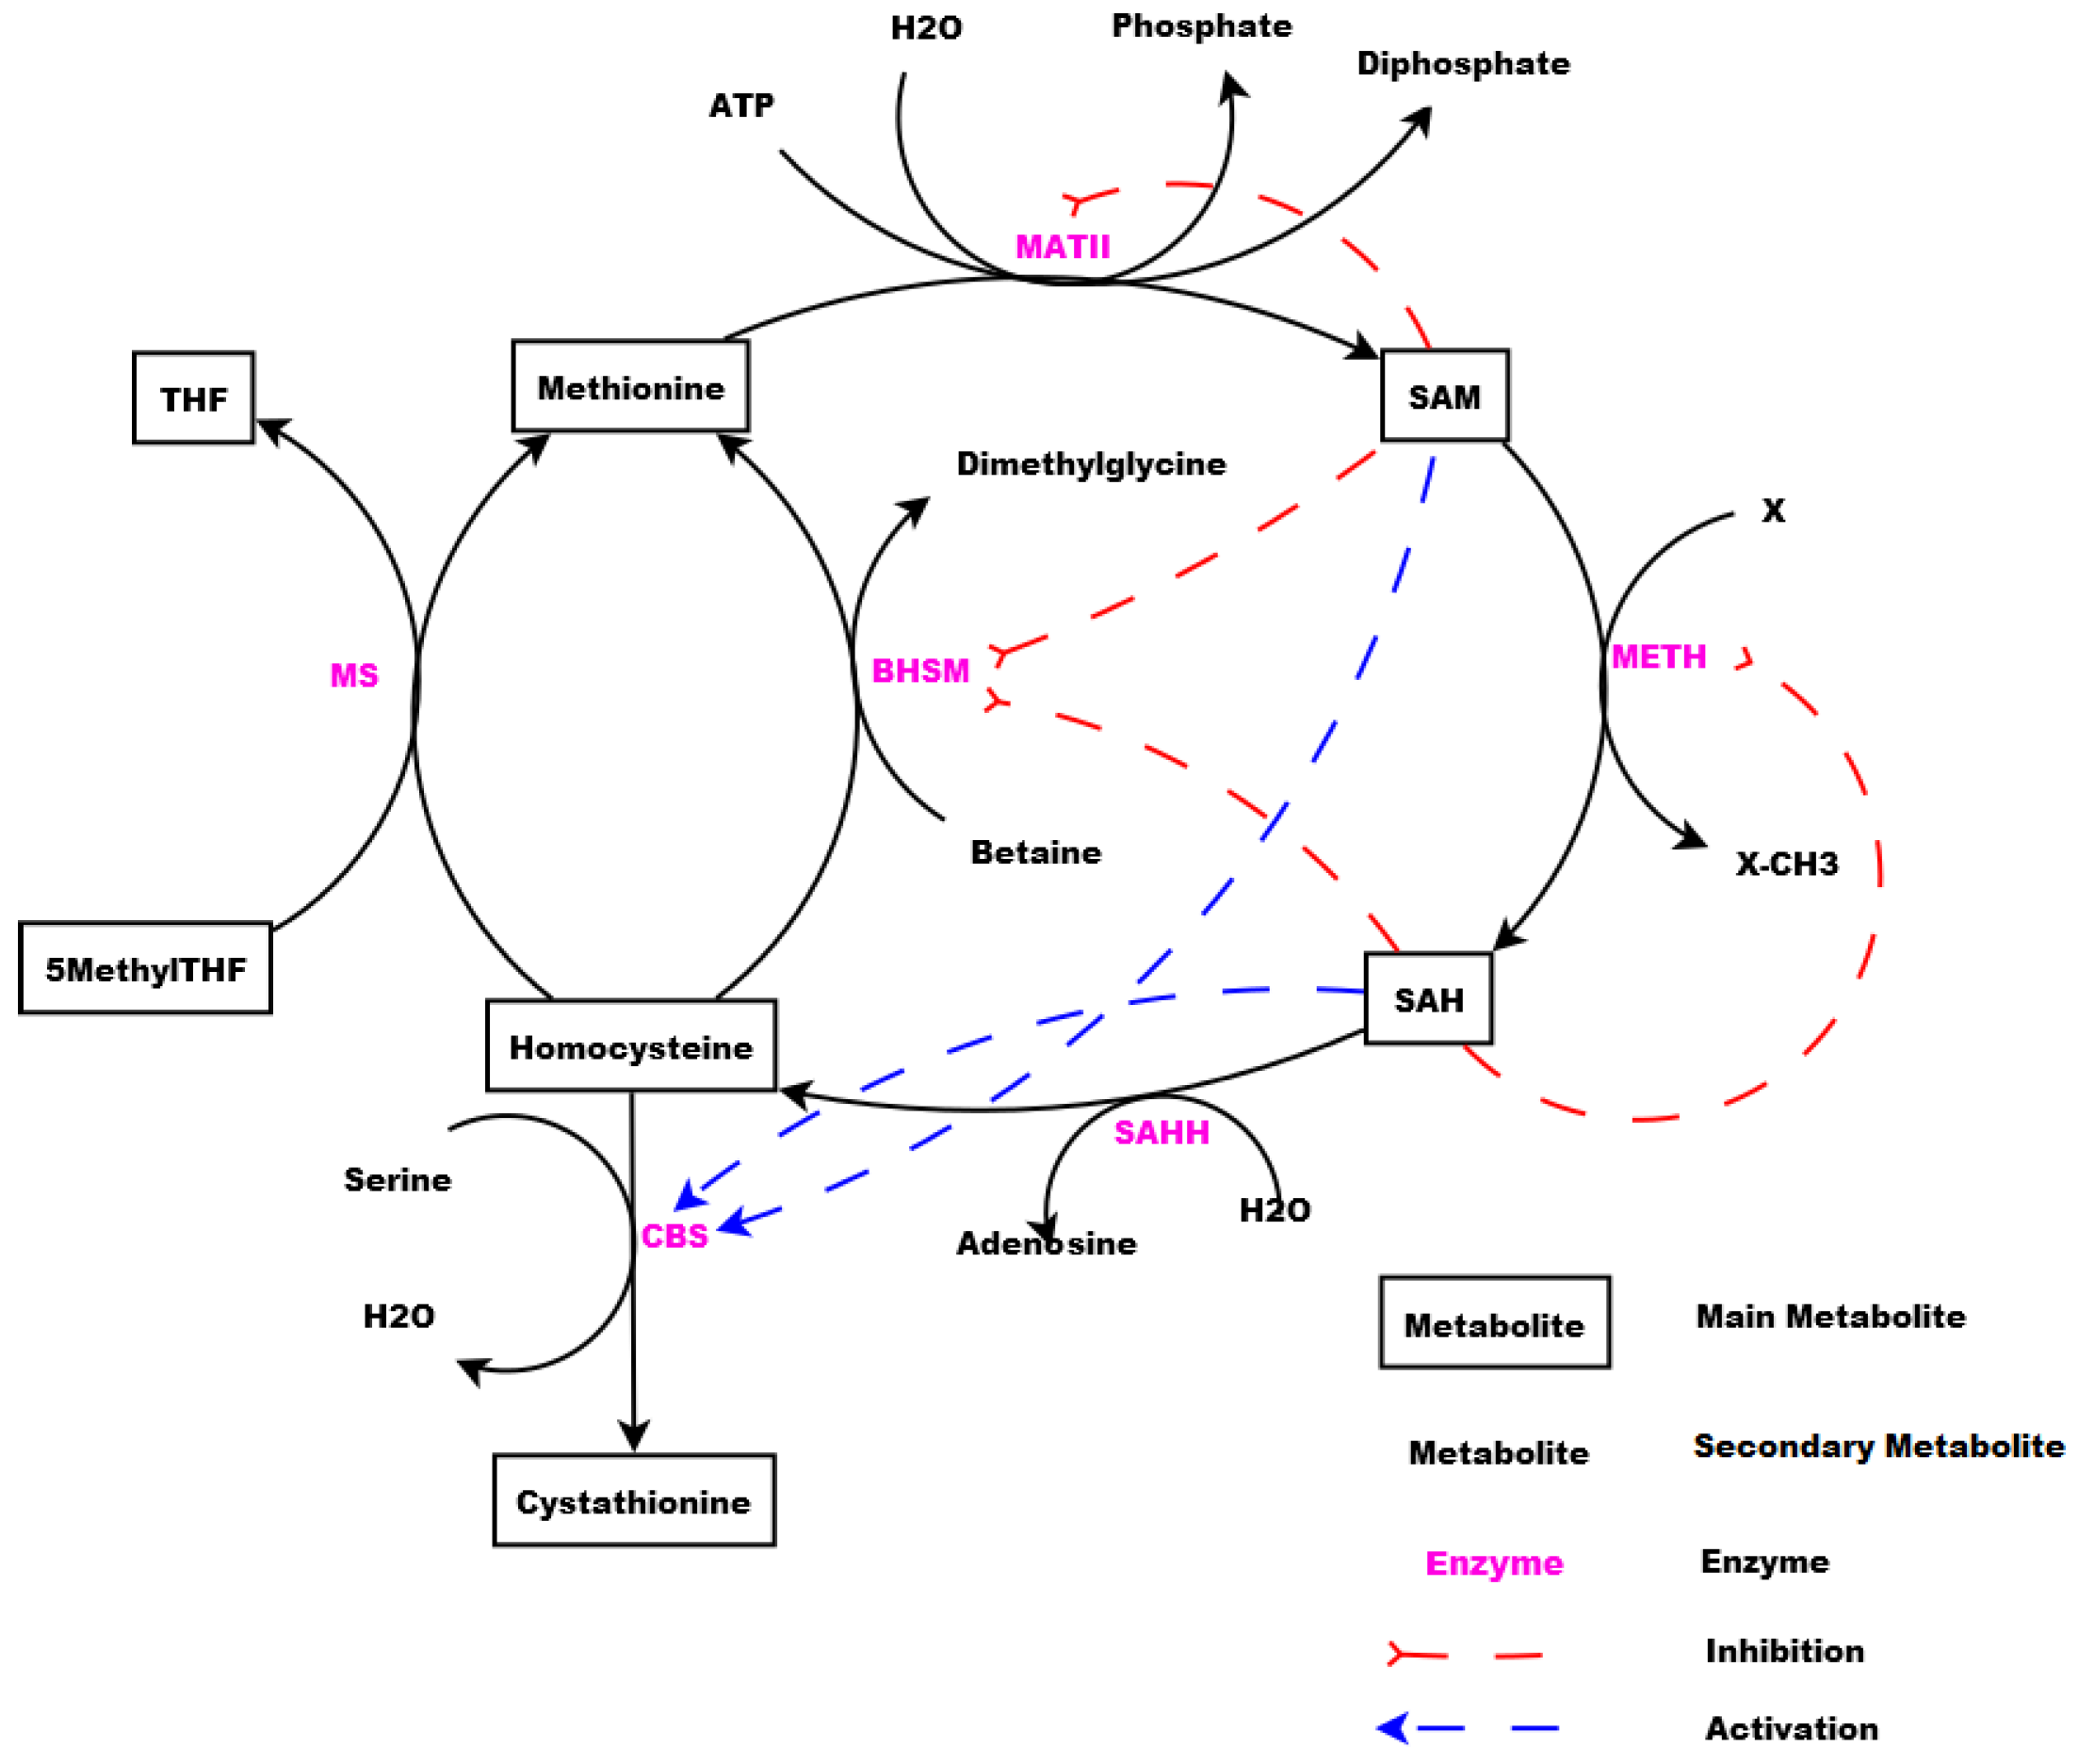
Figure 1 shows a schematic illustration of the Methionine and its derivatives in cyclic form. The cycle is consisting of Methionine, S-Adenosyl-Methionine (SAM), S-Adenosyl-Homocysteine (SAH), Homocysteine, Cystathionine, 5-Methyl Tetrahydrofolate (5MethylTHF), and Tetrahydrofolate (THF).
Methionine cycle is complex and critical since it is responsible of providing the sulfur and other elements to the body. Indeed, the growth and development of the body is directly related to a normal functioning of this metabolic pathway.
Consequently, a dysfunction in this cycle, may lead to a deregulation in the whole system, by producing high levels of some metabolites, such as homocysteine [28]. Such deregulations are related to several disorders [29,30] such as Alzheimer’s Disease [31,32,33,34], Parkinson [35], cardiovascular disease [36], cancers [37], Schizophrenia, neural tube defects, bipolar disorder, mental retardation and others [38,39,40].
These correlations make interesting to study this metabolic pathway and its behaviour in order to avoid causes of such disorders, which represents our fundamental motivation for choosing this system to model and analyse.
Based on the schematic illustration of the studied system shown in Figure 1, the mechanism of the Methionine metabolic pathway starts then from the Methionine provided by the diet. Methionine is transformed to SAM through a reaction catalysed by MATII. The methyl group is transferred by METH producing SAH. This last is converted to Homocysteine through a reaction catalysed by SAHH.
Homocysteine can be remethylated and transformed back to Methionine through a reaction catalysed by MS producing also THF and/or through a reaction catalysed by BHSM or be transformed to Cystathionine through a reaction catalysed by CBS. In order to maintain the system’s equilibrium imposed by the organism, some activation and inhibition of processes through metabolites are manifested in the system.
SAM and SAH play the role of activators acting on CBS, the enzyme catalysing the reaction transforming Homocysteine to Cysthationine. They also play the role of inhibitors repressing the remethylation (i.e., transformation of Homocysteine to Methionine) through the reaction catalysed by BHSM. SAM plays the role of inhibitor repressing its own production from Methionine, and SAH plays the role of inhibitor repressing its own production from SAM.
3. Petri Nets
Petri net, a place/transition concept introduced by Dr. Carl Adam Petri in 1962, is one of the most popular modelling languages suitable for modelling discrete dynamic systems.
A Petri net is a directed bipartite graph, in which the nodes represent transitions and places. Directed arcs describe which places are related to which transitions and inversely.
Petri net is expanded with stochasticity, time, hierarchy, colour, fuzzibility and other extensions in order to correspond to a wide variety of systems. Therefore, many Petri net extensions have been proposed, we cite among others, continuous Petri net which is introduced to model dynamic systems with continuously changing state parameters and hybrid Petri net which is developed especially to consider different data types by means of continuous and discrete values [41].
In the context of biology, modelling biological systems is modelling of interactions between different structured processes. The reaction rate of a biological process is expressed usually using real numbers. The presence and/or absence of biological phenomenon is expressed by a Boolean process. Other mechanisms such as counter-like mechanism is expressed by a discrete process.
Concentrations of products depend on concentrations of substrates and rates of reactions. Reaction rates are determined in harmony with functions assigned to biological processes.
Hybrid functional Petri net [26] is a Petri net extension which includes in one formalism, HPN (Hybrid Petri Nets) [41], HDN (Hybrid Dynamic Nets) [42], and FPN (Functional Petri Nets) [43].
HPN is a Petri net extension allowing the representation of continuous and discrete aspects of places and transitions. In HDN, the rate of continuous transition can be given as a function of values in the places. In addition to HDN and HPN, HFPN has a third feature for arcs introduced in FPN. This feature is a function of values of the places which can be assigned to any arc.
A formal definition of HFPN is given in [26]. HFPN contains different components namely, entity, process, connector and quantity. Entity, referring to place, represents many biological elements such as protein, gene and metabolite. Process, referring to transition, represents reaction, translation, transcription and other biological processes. Entities and Processes are either continuous or discrete. Connector, referring to arc, connects components between each other. Connector’ types are namely, normal connector, test connector, or inhibitory connector. Quantity, referring to tokens, represents entity’s value.
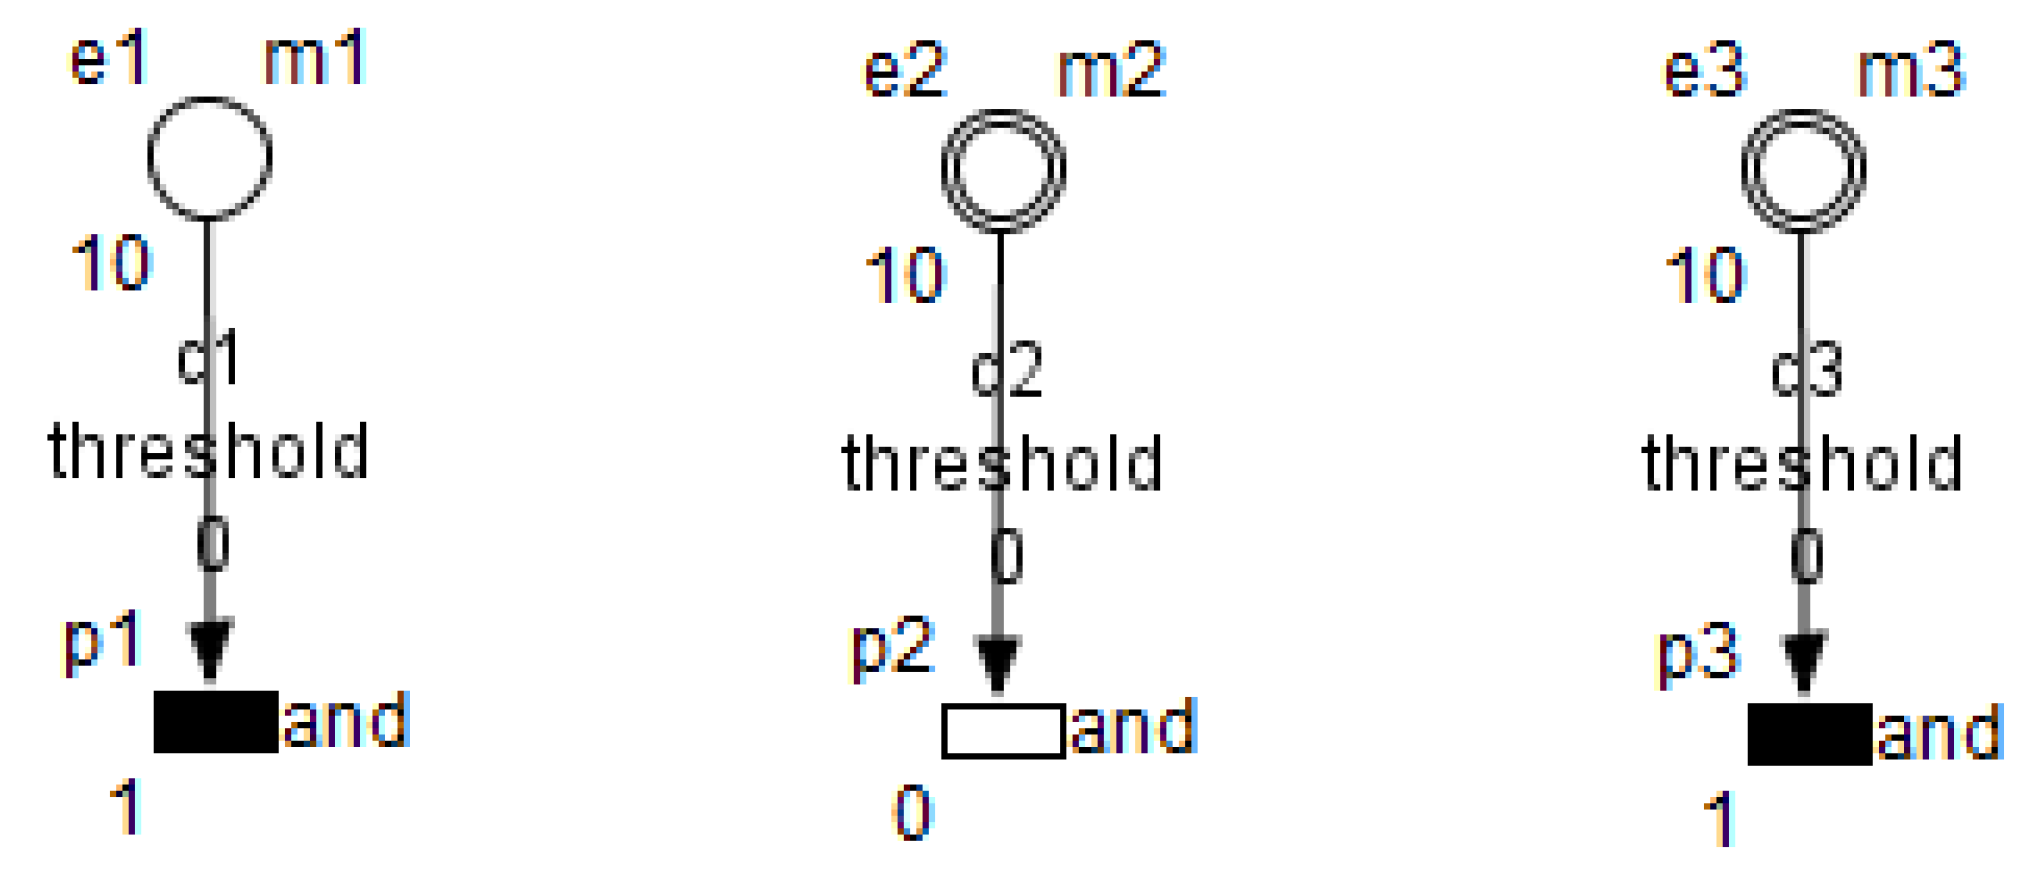
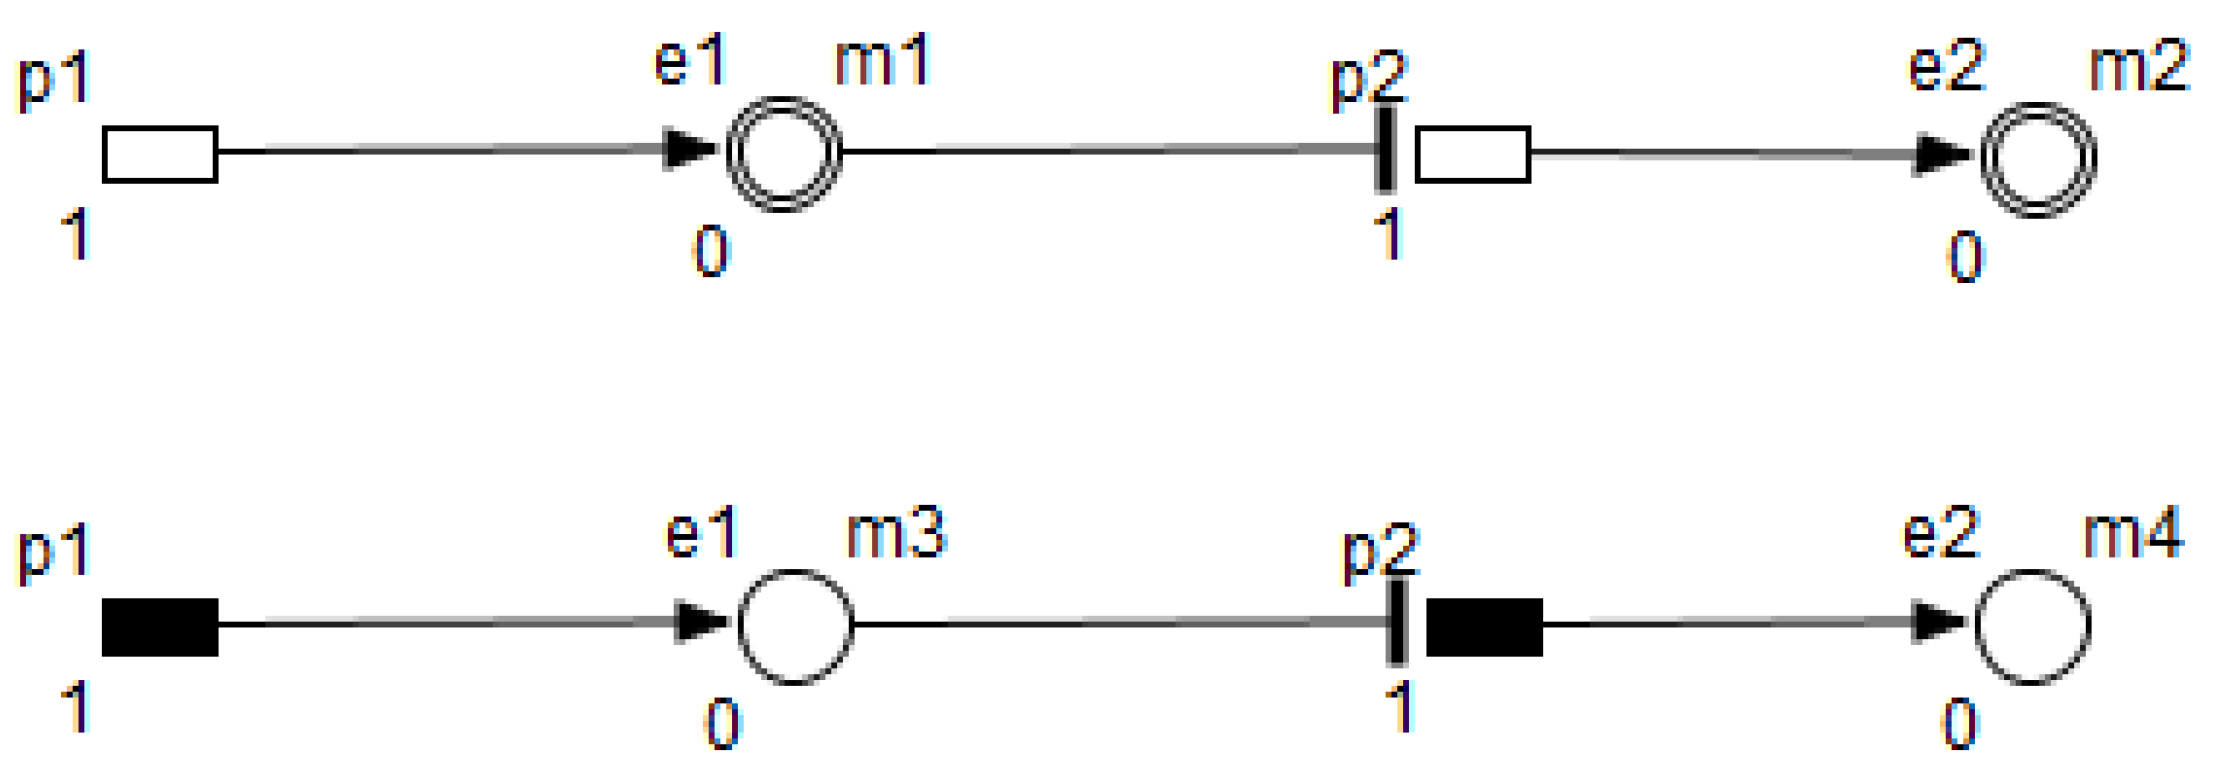
Figure 2, Figure 3, Figure 4, Figure 5 and Figure 6 show different kinds of components and reactions of HFPN.
In brief, HFPN allows to represent biological characteristics namely by means of discrete & continuous values in the same model. They permit to take into consideration mathematical parts like Michaelis-Menten equations (see Section 4). Furthermore, HFPN terminology is close to the biological vocabulary. HFPN has been successfully used for modelling and simulation of many biological processes [15,26,44,45,46,47,48]. Consequently, HFPN extension is considered as an appropriate extension for modelling & studying biological systems [46].
4. Model Construction
In the context of studying and analysing the studied biological system, we use HFPN (Hybrid Functional Petri Nets), the Petri net extension previously presented.
Table 1 shows the mapping from the studied biological system elements to HFPN elements. Note that the names of the entities and processes shown in the table, namely m1, m2, m3, m4, m5, m6, p1, p2, are randomly chosen in order to clarify the mapping between the metabolic pathway (cf. Figure 1) and the HFPN model (cf. Figure 7).
Using the HFPN terminology, we replace terms usually used for most of Petri net extensions elements, namely, place, transition, arc and token by entity, process, connector and quantity.
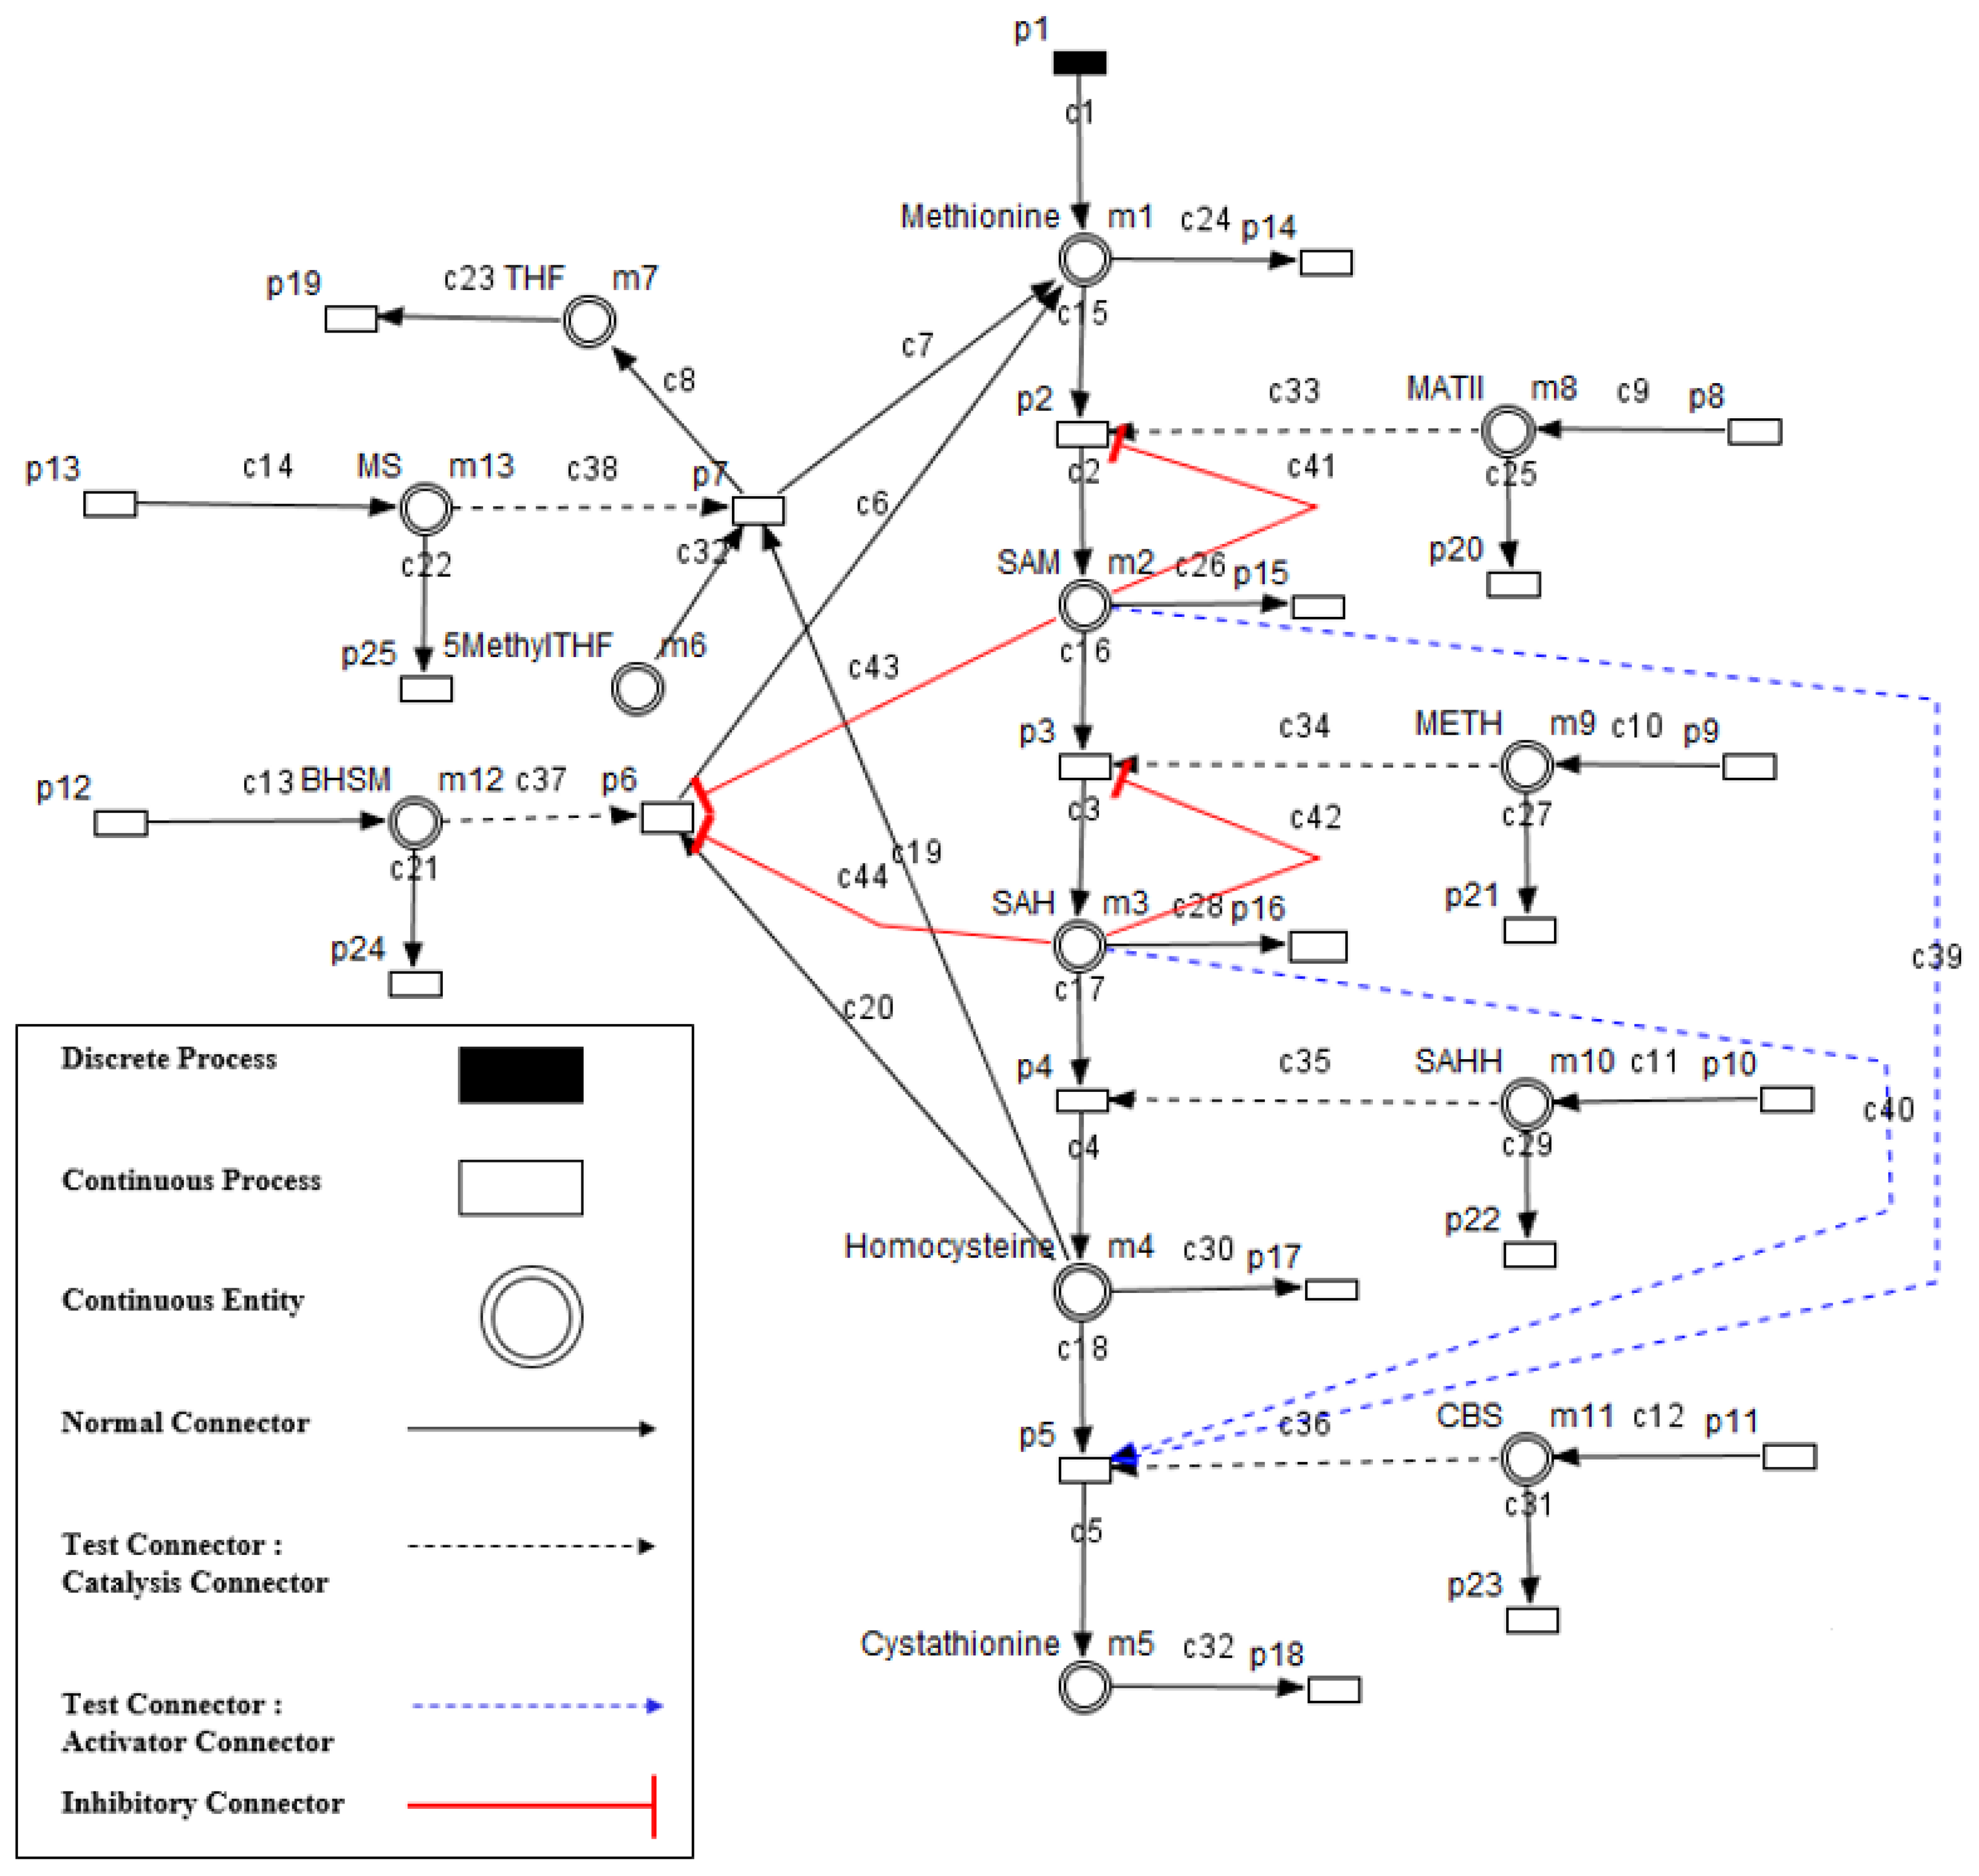
In this respect, we build an HFPN model (cf. Figure 7), based on the mapping shown in Table 1, using the Cell Illustrator tool.
Cell Illustrator (www.cellillustrator.com) [49] is a software tool that allows biologists to model and simulate complex biological processes and systems including metabolic pathways.
The tool is compared with other tools such as Copasi, virtual Cell, E-cell and others, however it remains the suited one to model and simulate this kind of models [26]. It has an editor and simulator of HFPN with a graphical user interface and was developed by employing the architecture of HFPN. Its user-interface allows users to directly change parameters of the modelled systems.
Besides, Cell Illustrator operates under operating systems that can run Java programs, consequently, it can operate under Windows, Mac, and Linux.
Our model shown in Figure 7, represents the biological system shown in Figure 1 and includes all the components listed in Section 2 such that:
- Enzymes and metabolites are represented by entities. These entities are continuous since they contain quantities representing concentrations.
- Processes represent all reactions taking place in these pathway. These processes are continuous since they are supposed to assure the execution permanency. One process is discrete, namely , in order to control Methionine input quantities since it is provided by diet intake.
- Metabolites and processes are linked via normal connectors which allow the representation of degradation or production of metabolites.
- Enzymes and processes are linked via test connectors which represent the catalysis of reactions while maintaining the quantity of the source entity.
- Test connectors are used also to play the role of reactions activation, in some cases, in the purpose of maintaining “the system equilibrium”. In this case they are in blue (see the blue arcs from to and from to in Figure 7).
- Red arcs linking some metabolites and some enzymes, are inhibitory connectors. They allow to stop and inhibit some reactions when the contents of the source place is more than its weight.
We note that in order to explain exhaustively the HFPN model shown in Figure 7, we give the correspondence between model processes namely p1, p2 ..., p25 and their types in Table 2. Also the correspondence between entities (m1, m2, ...., m13), their types, and their names is specified in Table 3. Finally, the correspondence between connectors (c1, c2, ...., c44), their types and their thresholds is given in Table 4.
Metabolic pathways have not each a close and independent structure. They are related through common amino acids and intermediates interacting with each others. Indeed, living organisms are composed of several interconnected components and have complex structures. Their behaviour depends not only on the way how they are built, but also on the complex interactions between their components. Therefore, two identical experiments lead rarely to identical observations, even more, the results may sometimes be contradictory.
In order to simplify the study of the Methionine metabolic pathway, in this paper, we consider it as isolated and ignore the other related elements.
For the purpose to study the Methionine metabolic pathway through its representative HFPN model, we need some parameters and metrics. Several metrics have been defined in entities and processes in biochemistry [18,19,20,50]. These metrics are used to measure the velocity of enzymatic reactions, therefore to identify and describe the mechanisms of biochemical reactions.
In order to represent reaction velocity in the main pathway, we adopt one of the most known and used metrics which is the Michaelis-Menten kinetics.
It is expressed by an equation describing the rate of enzymatic reactions, by relating reaction velocity V to , the concentration of a substrate S. Its formula introduced first in [51], is given in [52] by:
where:
- V is the velocity at any time (M/h);
- is the maximum rate achieved by the system at maximum substrate concentration (M/h);
- is the substrate concentration (M/L);
- is the Michaelis constant = Substrate concentration at which the reaction rate is half of (M).
Values of and corresponding to different processes are represented in our model, by variables named relatively to the enzymes catalysing those reactions. Therefore, they can be manipulated in an easy and clear way.
We can therefore calculate reaction velocities corresponding to processes of the studied system as shown in Table 2.
Table 3, Table 4 and Table 5 represent respectively the initial values of all the HFPN model elements. The connectors types and their thresholds, and the metabolites and enzymes degradation rates.
Note that all these elements represent the quantitative aspect of the HFPN model which will be simulated in the next section.
5. Simulation and Validation
In order to study and analyse the studied system’s behaviour, we propose five scenarios to be executed by simulation. We use the same tool i.e., Cell Illustrator to simulate the established HFPN model (cf. Figure 7), including the parameters and kinetics previously presented and explained in the previous section.
In the HFPN theory, time is measured in virtual time units called Petri time (pt). [pt] is functionally equivalent to a unit of time such as the second [49]. We achieved simulations at the same Petri time (3600 pt) sampling interval for the purpose to make simulation results comparable for all components and for each execution scenario. Note that the initial values of the HFPN model enzymes were adapted to each scenario among the following scenarios. Each deficiency among the deficiencies of the mentioned enzymes is equivalent to considering the value “zero” as initial value of this enzyme.
We present below the simulations conducted in accordance with the corresponding following scenarios:
- -
- Scenario 1: Normal Case
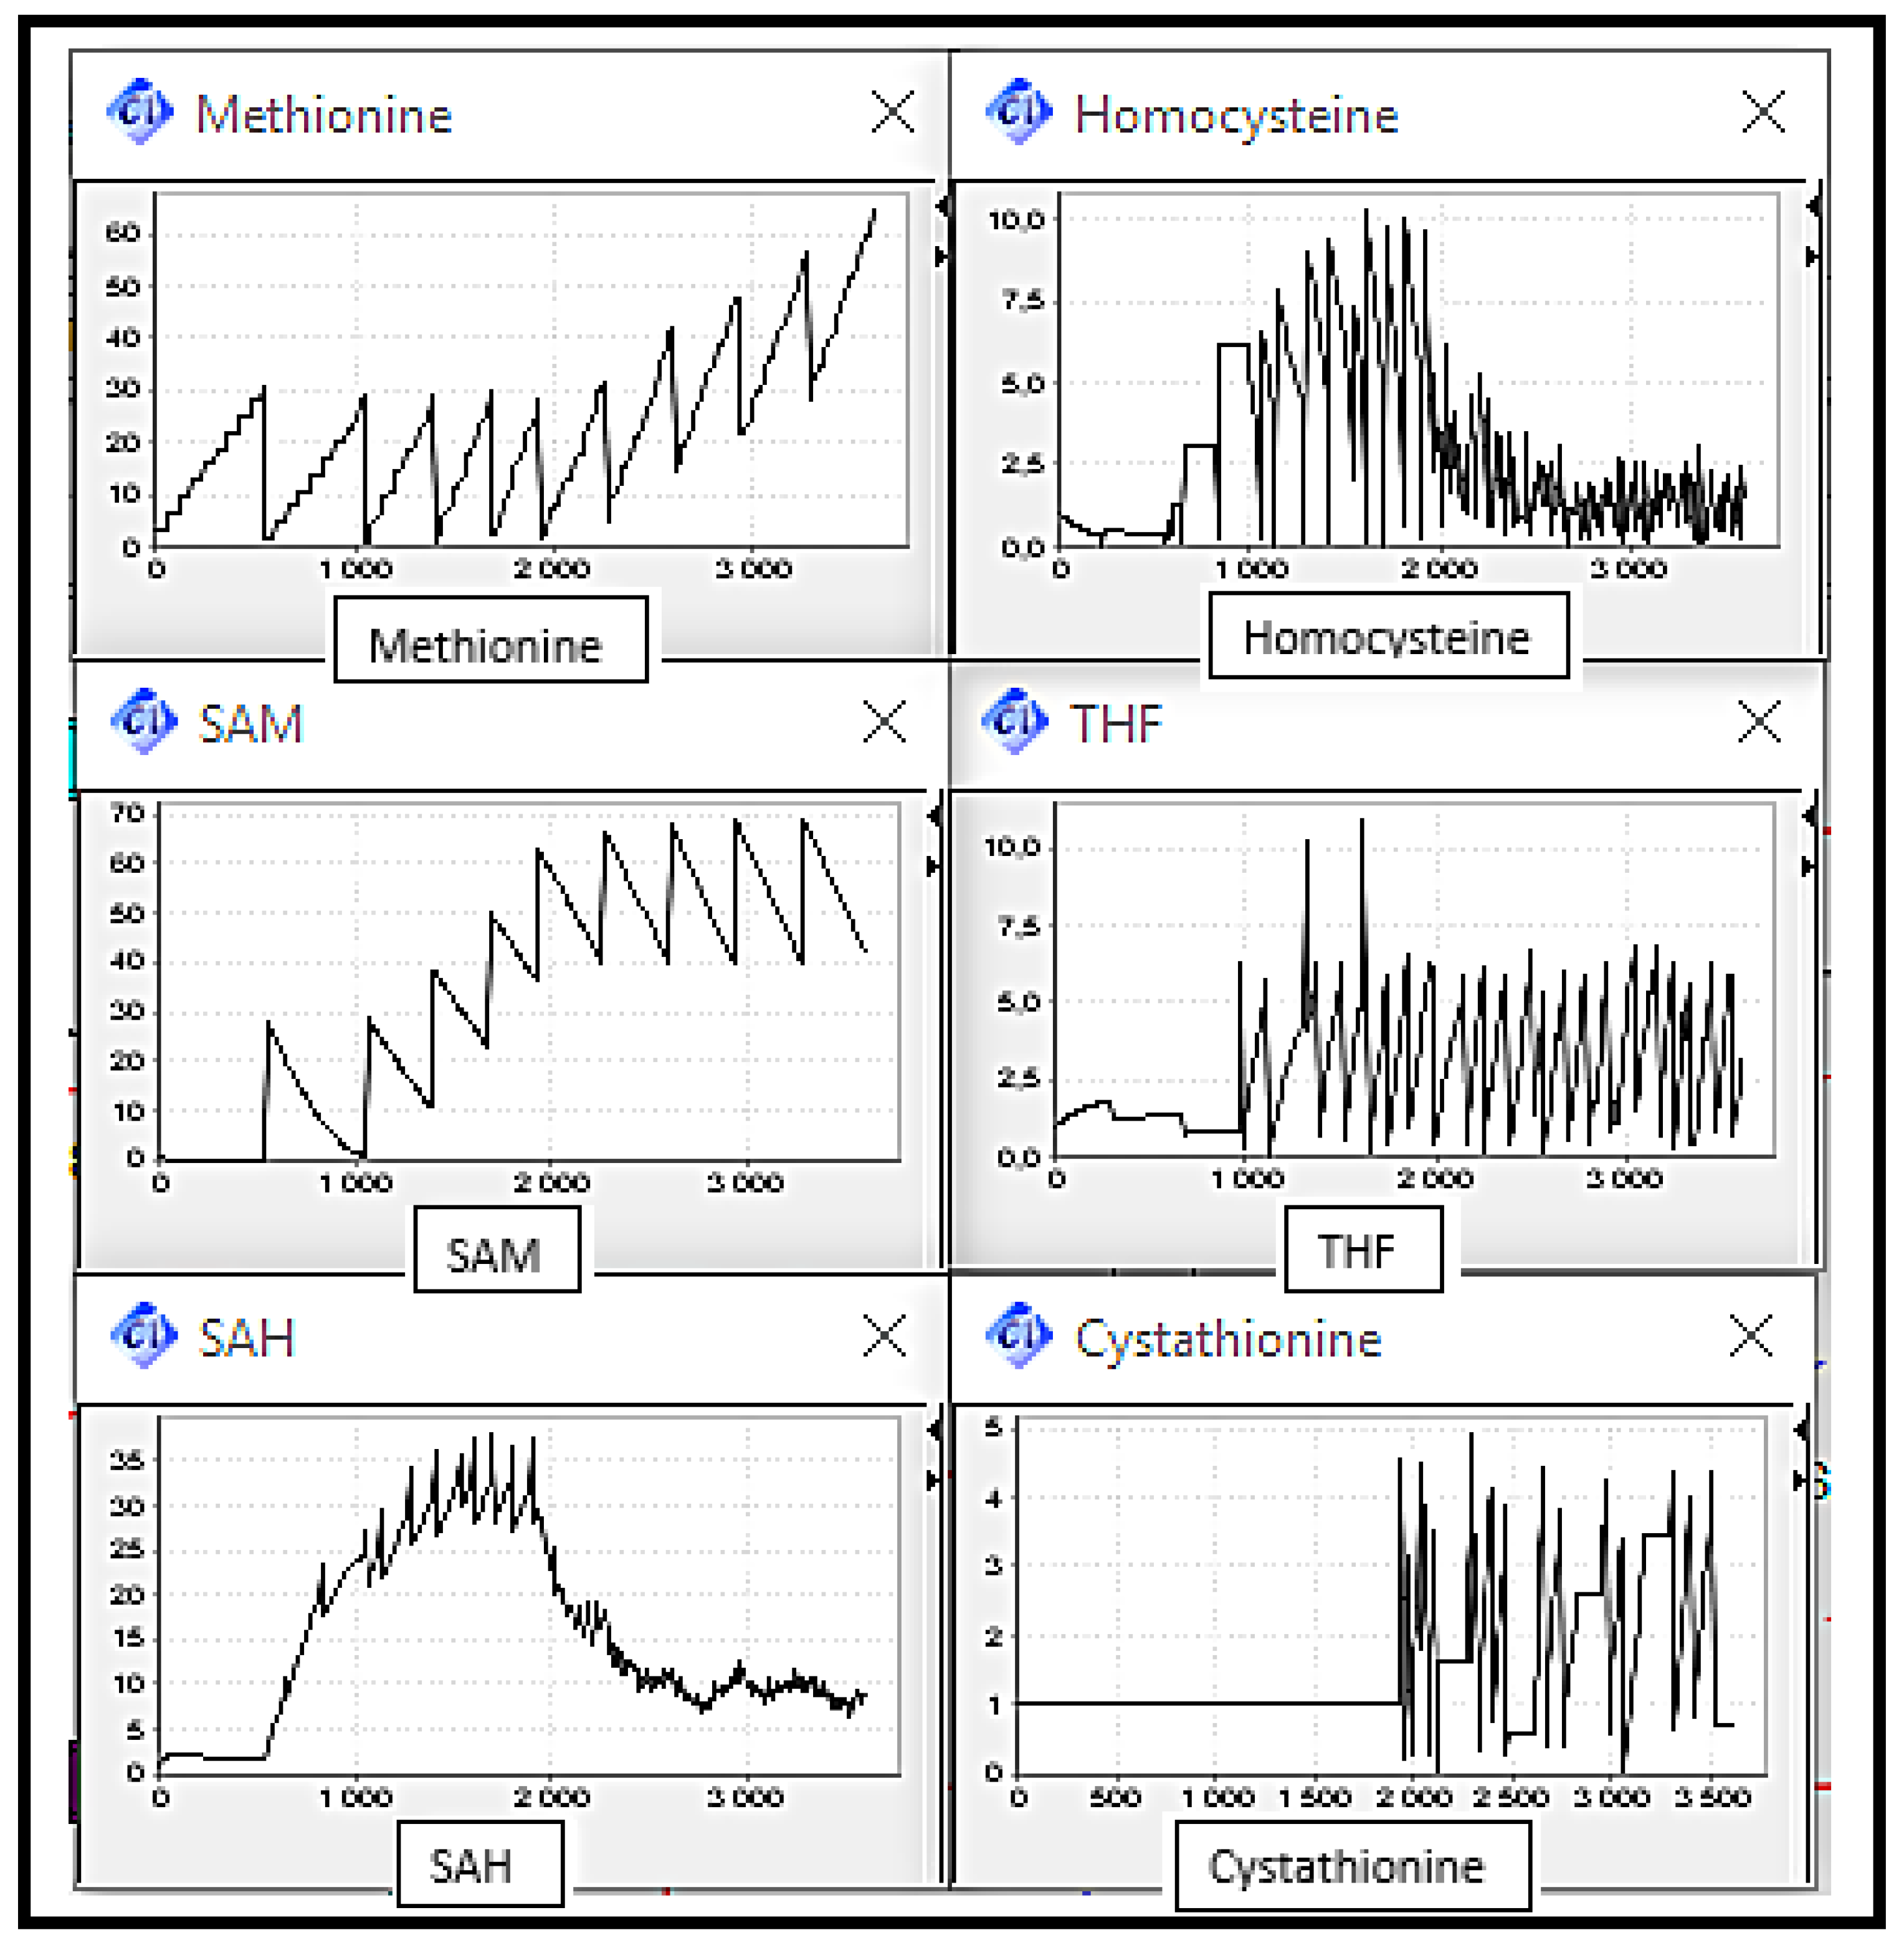
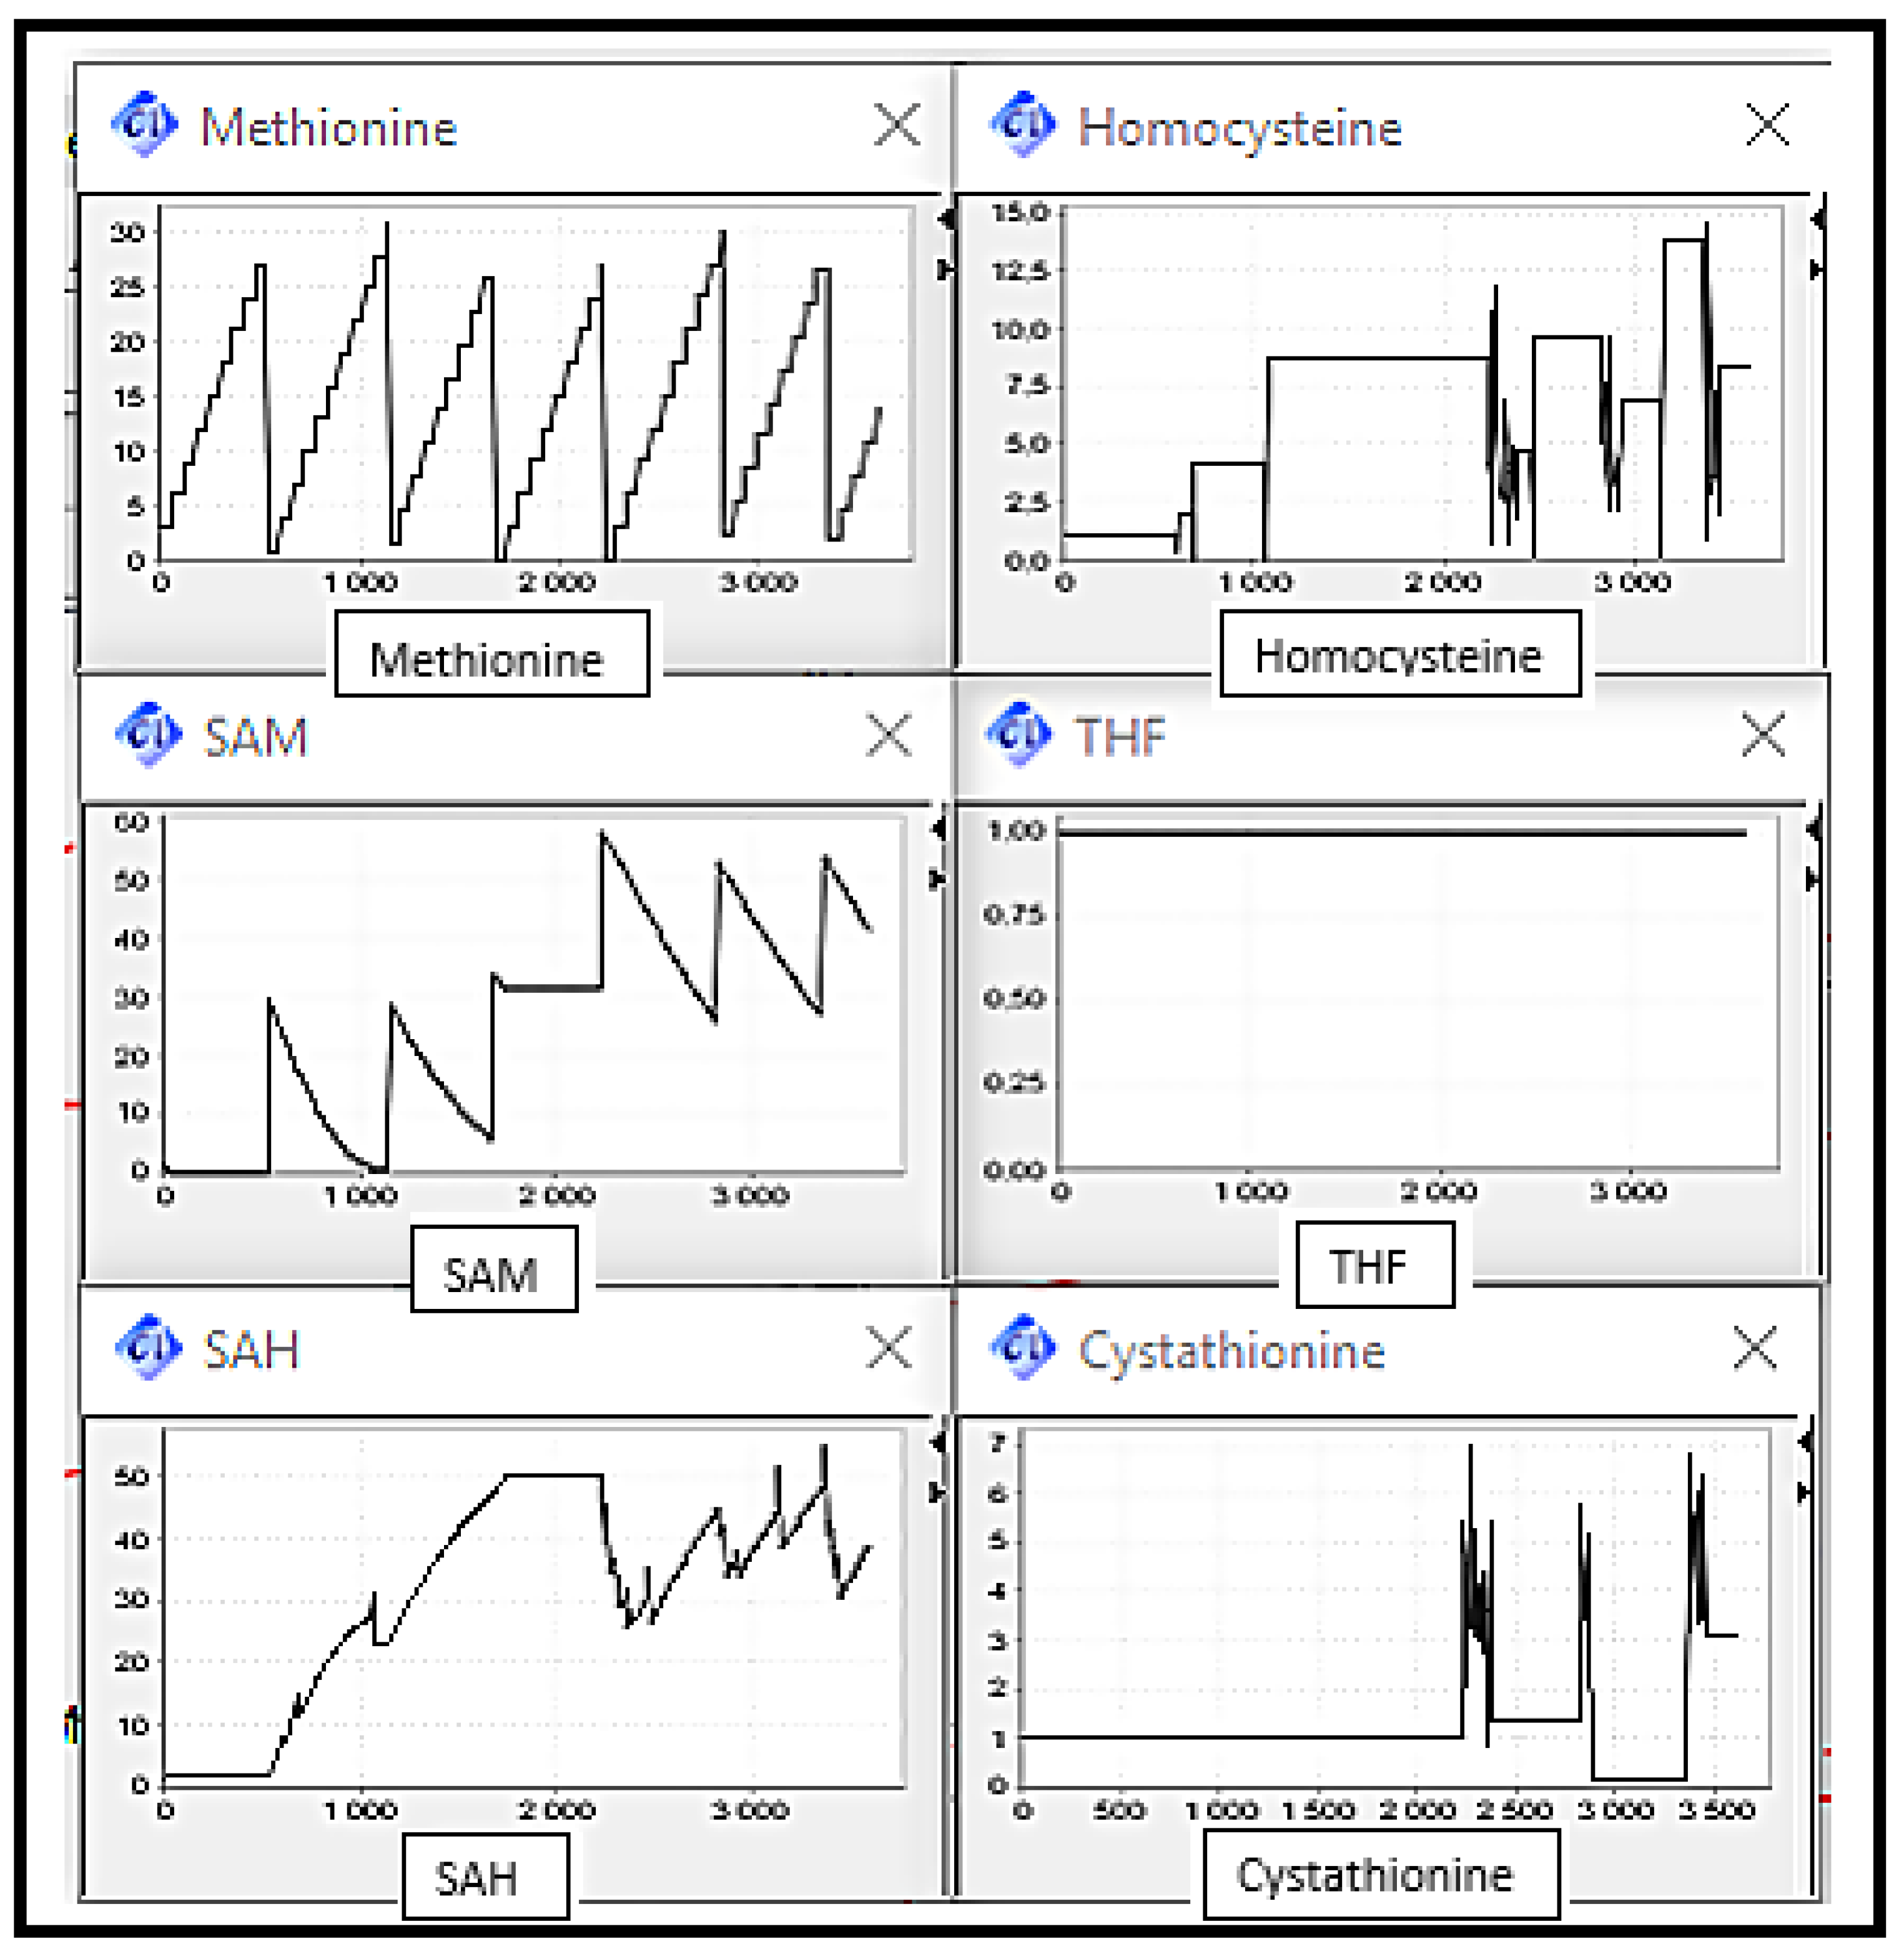
Figure 8 shows the substrates concentration evolution in a normal case, which means normal functioning of the Methionine cycle. We can note that metabolites rates are interdependent since in cyclic metabolic pathways, each reaction product is a substrate for the next reaction. It can be observed that metabolite concentrations vary over time, i.e., increase and decrease, this variation is due to the equilibrium imposed by the organism and manifested in the activation and inhibition of enzymes through metabolites. This normal case will play a role of reference on which the following scenarios’ discussions will be based.
Figure 9, Figure 10, Figure 11 and Figure 12 show the metabolites concentration evolution corresponding to scenarios from 2 to 5 respectively.
- -
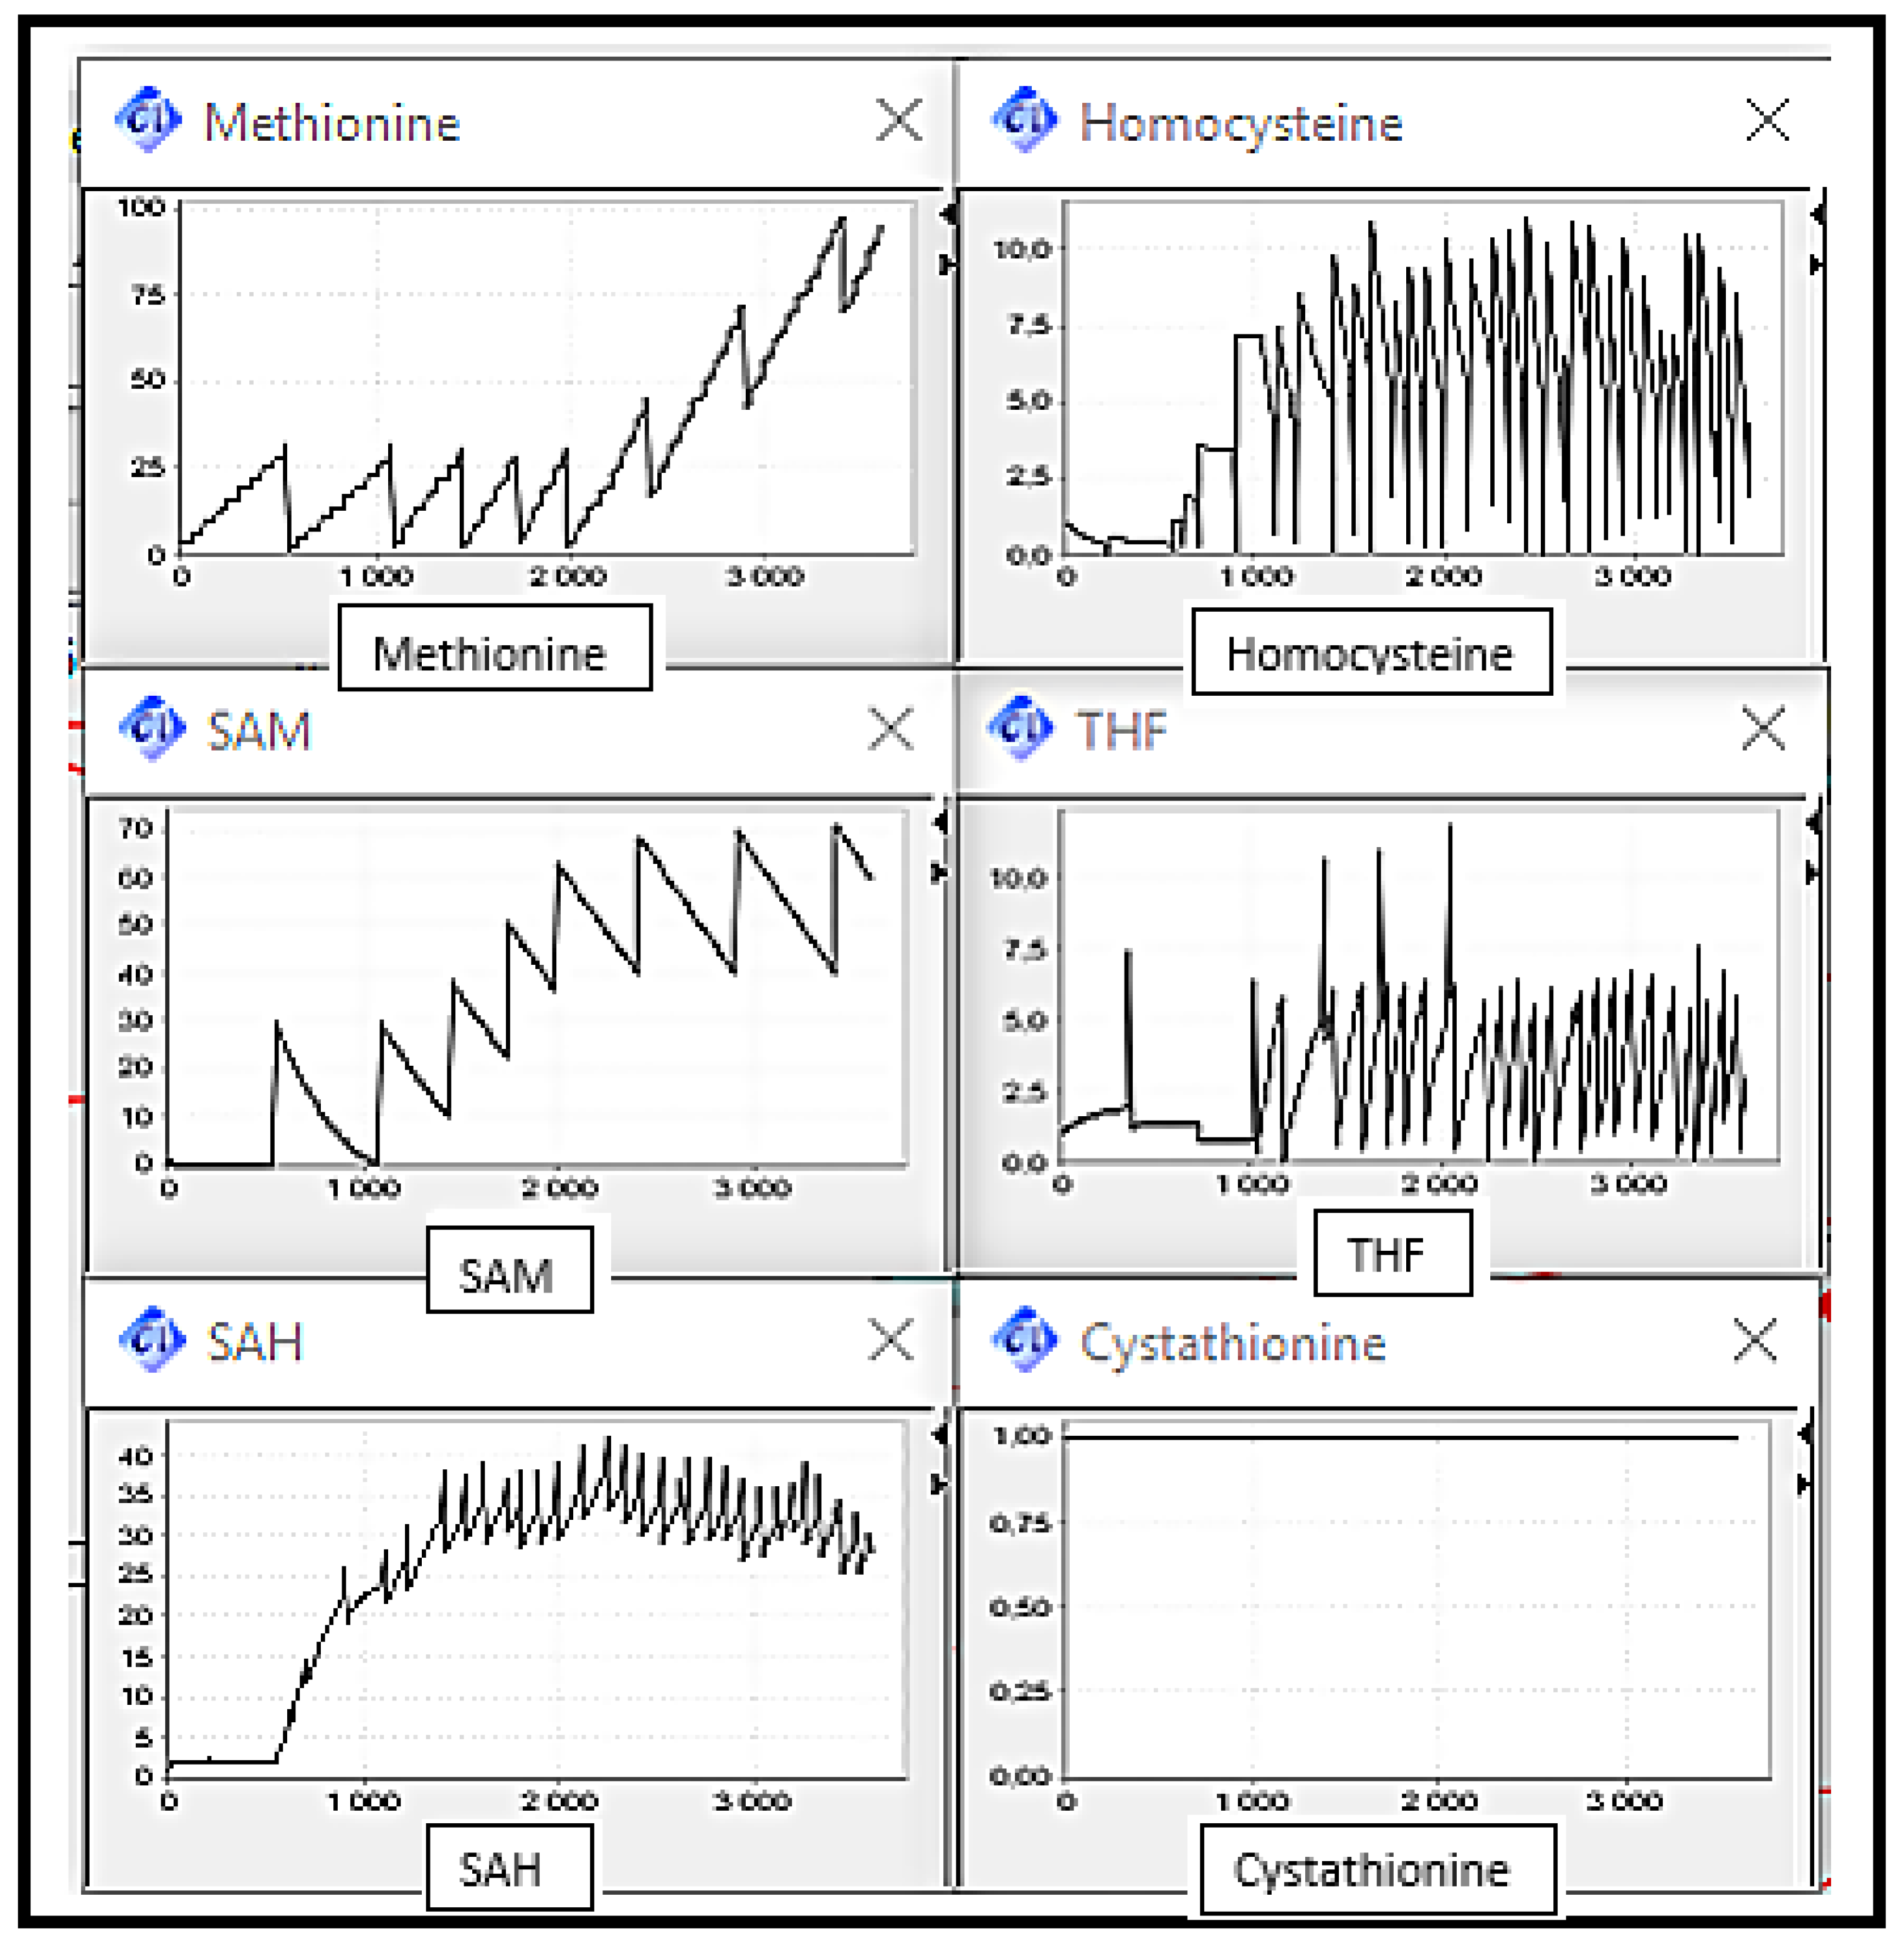
- Scenario 2: MS, BHSM and CBS Deficiencies, the enzymes catalysing reactions converting Homocysteine to Methionine and Cysthationine respectively.
It can be observed (cf. Figure 9) that the Homocysteine concentration level increased by against THF concentration level decreased, due to the deactivation of remethylation reactions. The Methionine concentration level increased discreetly since it is always provided by diet intake. Cystathionine concentration level remained in the same level corresponding to its initial value.
The elevation of Homocysteine level is very remarkable by comparing it with the level in the normal case. This abnormality can be related to sever disorders.
- -
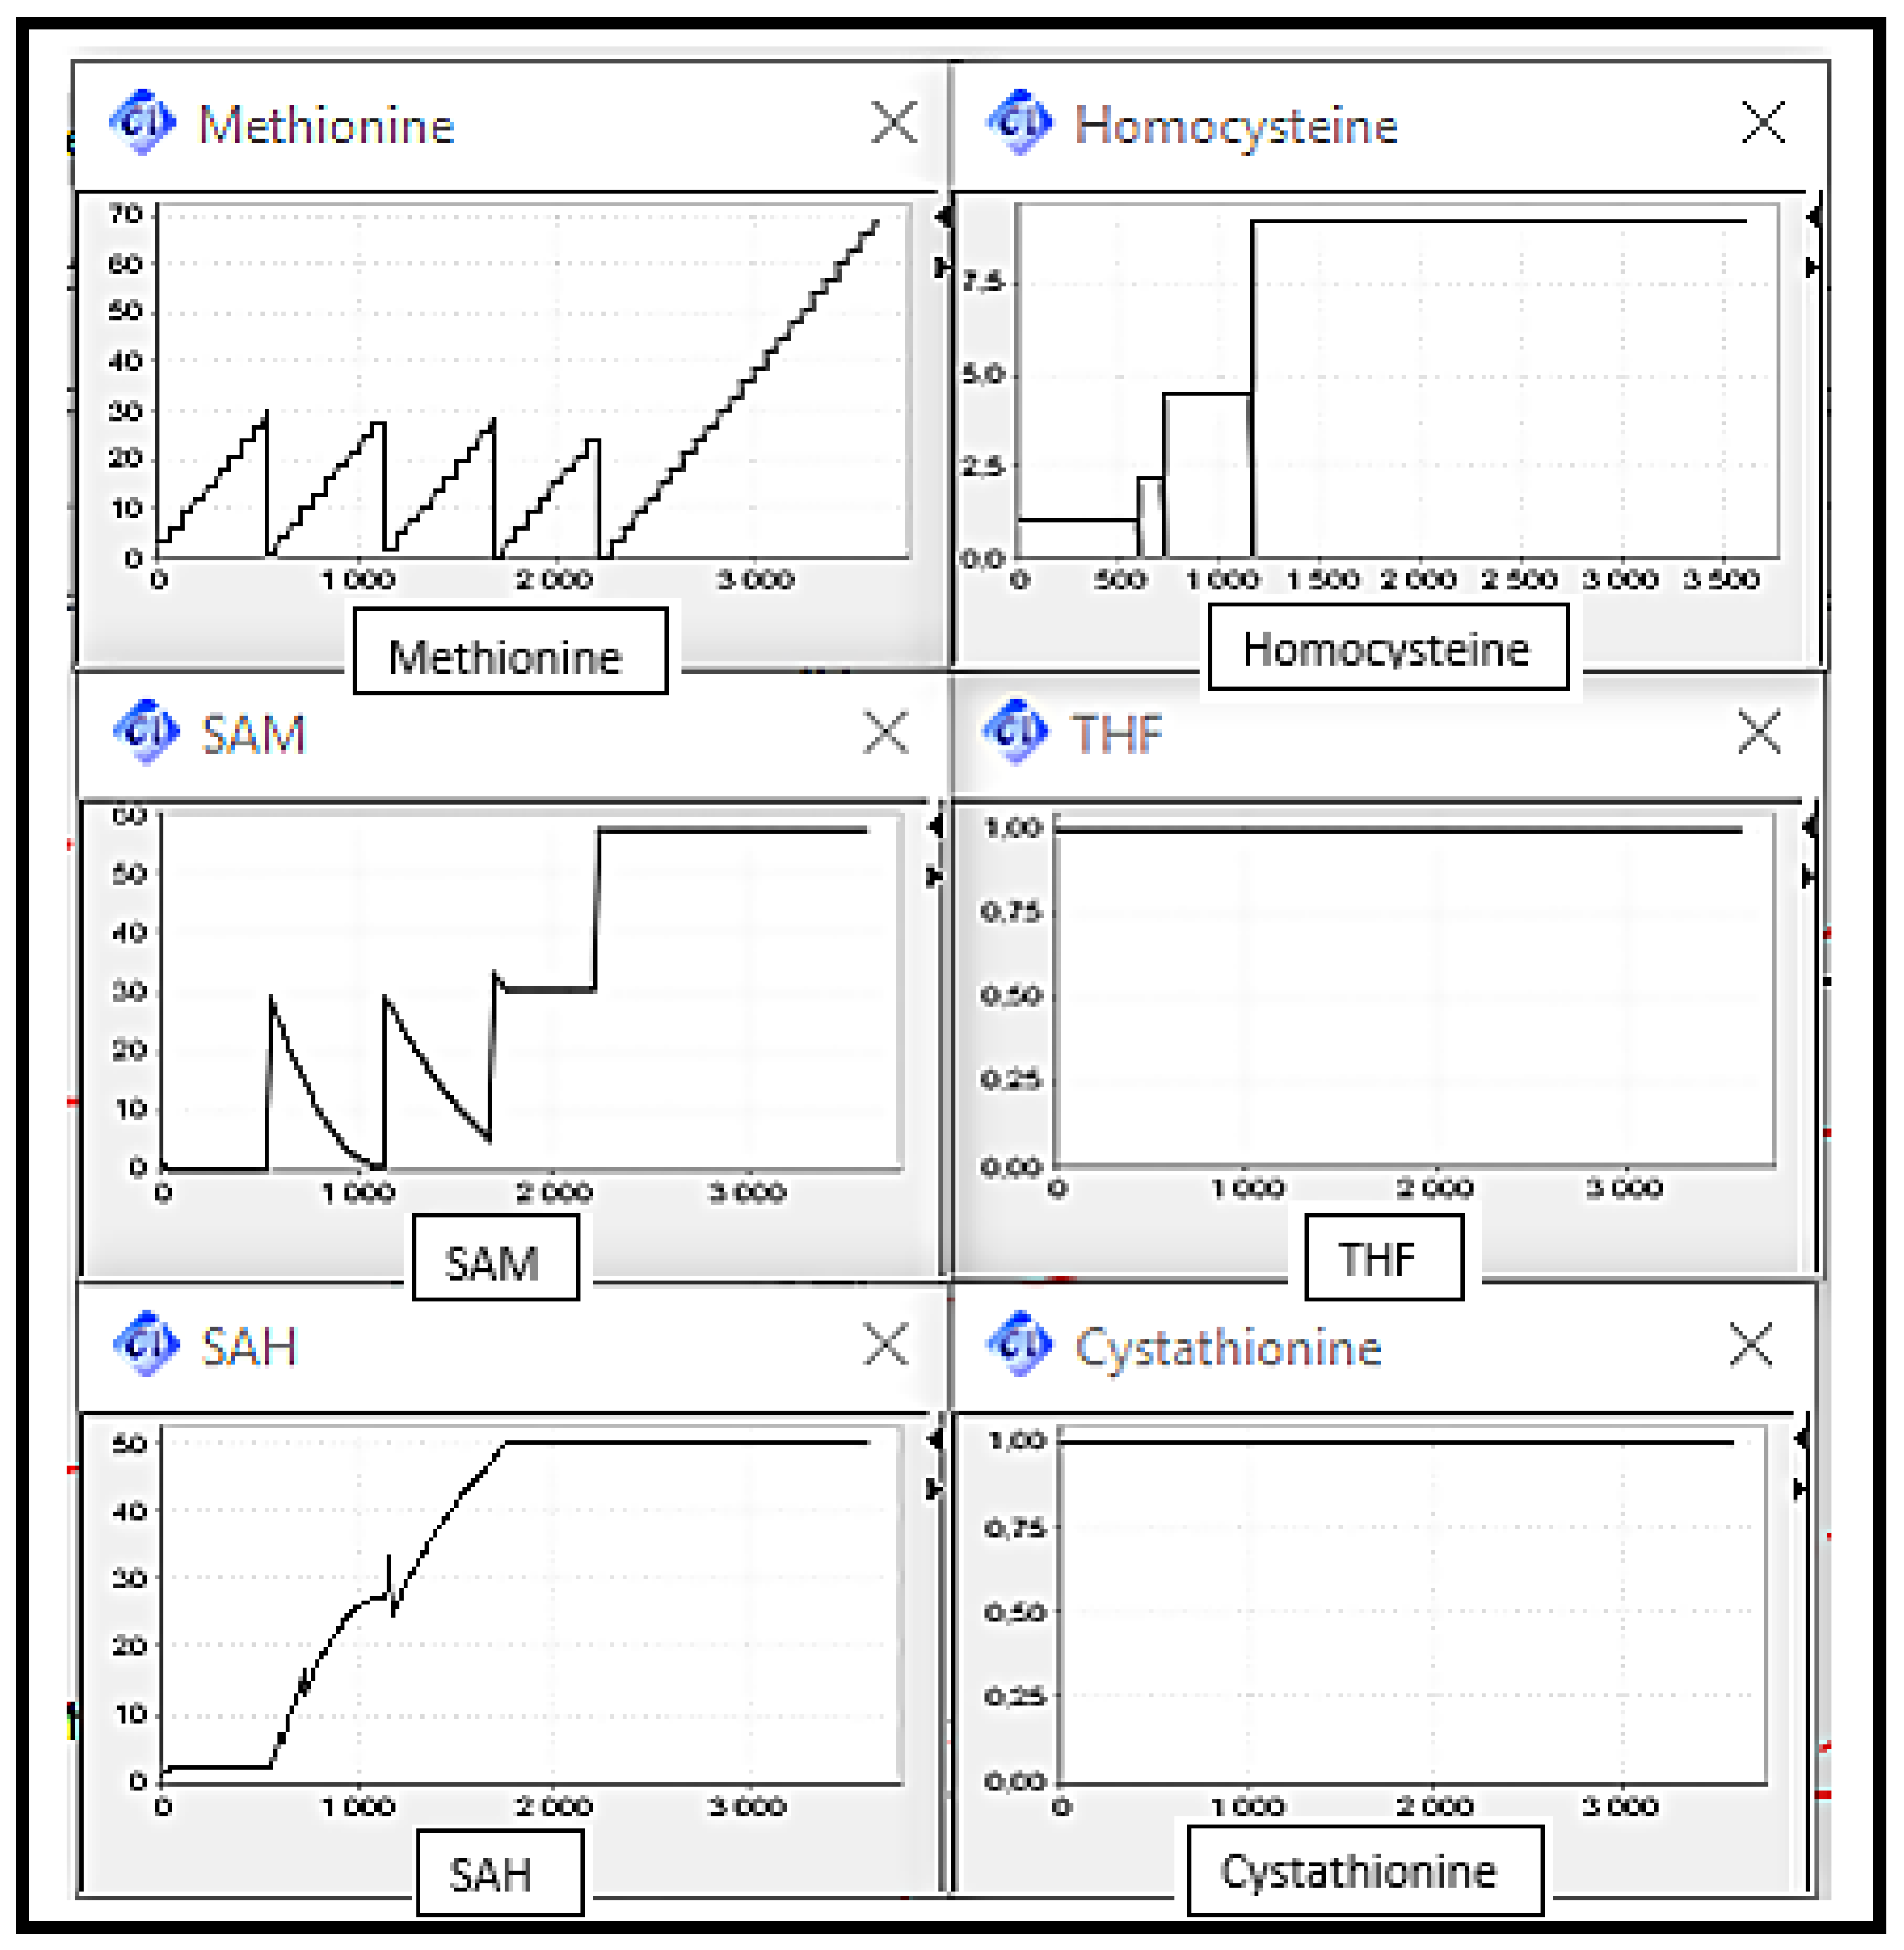
- Scenario 3: MS and BHSM Deficiencies, the enzymes catalysing reactions converting Homocysteine to Methionine.
It can be observed that the Homocysteine concentration level increased due to the deactivation of enzymes responsible of remethylation reactions catalysis and decreased slightly thanks to CBS activity. Cystathionine concentration level have also increased due to the CBS activity. The Methionine concentration level increased discreetly since it is always provided by diet intake and decreased due to the deactivation of both of remethylation reactions. THF concentration level remained in the same level corresponding to its initial value (cf. Figure 10).
- -
- Scenario 4: CBS and BHSM Deficiencies, the enzymes catalysing reactions converting Homosycteine to Methionine and Cysthationine respectively.
It can be observed that the Homocysteine concentration level increased and decreased since it is partially converted to other metabolites (i.e., Methionine, THF). Cystathionine concentration level remained in the same level corresponding to its initial value due to the deactivation of reaction catalysed by CBS. The Methionine concentration level increased discreetly since it is always provided by diet intake, also produced from Homocysteine through the reaction catalysed by MS and decreased due to the deactivation of the remethylation reaction catalysed by BHSM. THF concentration level increased and decreased since it is produced through remethylation reaction catalysed by MS and is also converted to its derivatives in folate cycle (cf. Figure 11).
- -
- Scenario 5: MS and CBS Deficiencies, the enzymes catalysing reactions converting Homosycteine to Methionine and Cysthationine respectively.
It can be observed that the Homocysteine concentration level increased since it is not converted to other metabolites (i.e., Methionine, THF and Cystathionine). Cystathionine concentration level remained in the same level corresponding to its initial value due to the deactivation of reaction catalysed by CBS. The Methionine concentration level increased discreetly since it is always provided by diet intake, also produced from Homocysteine through the reaction catalysed by BHSM. THF concentration level remained in the same level corresponding to its initial value (cf. Figure 12).
In the Methionine metabolic pathway (Figure 1), metabolites and enzymes interdependencies can affect its behaviour. Enzymes being proteins, in addition to provide biochemical reactions with a feasible reaction path, they also accelerate the rate of chemical reactions in the organism, therefore, they play a vital role in the body. Consequently, mutations in these enzymes can cause deregulation of the system.
In this sense, mutations in the system enzymes and/or metabolites, such as CBS, MS and/or BHSM (see Figure 8, Figure 9, Figure 10, Figure 11 and Figure 12), can cause hyperhomocysteinemia which occurs when homocysteine level exceeds mol/L [53].
Hyperhomocysteinemia is related to several mental disorders [29,30] such as Alzheimer [31,33], Parkinson [35], Schizophrenia, bipolar disorder, mental retardation and others [38]. These correlations make interesting to study this system and its behaviour in order to avoid causes of such disorders, which represents our fundamental motivation for choosing this system.
6. Conclusions & Future Works
6.1. Conclusions
In this paper, we have proposed a modelling approach and a simulation of a biological system.
We have first described the studied metabolic pathway and its components, namely, the Methionine metabolic pathway. We have given a brief overview of its biological behaviour in normal and abnormal cases.
The goal is to facilitate the behavioural studies of biological complex systems through simulations and formal verification. We have proposed to use a computational modelling of our studied biological system, chosen based on its important role in human bodies, using a formal specification language.
We have used Hybrid Functional Petri net (HFPN) since it is considered as the appropriate Petri net extension for modelling and studying biological systems.
A simulation of the modelled HFPN model in normal case and a set of execution scenarios results in abnormal situations, are presented, studied and discussed using Cell Illustrator. These simulations have shown the dependencies between several metabolites and enzymes of the modelled system. They allowed to have a general idea of the behaviour of the system, highlighting the irregularity resulting in the end of each execution scenario.
They also confirmed the fact that mutations in the system enzymes and/or metabolites, can be related to several mental disorders such as Alzheimer, Parkinson, Schizophrenia, and others which makes interesting to study this system and its behaviour in order to avoid causes of such disorders.
6.2. Future Works
We are currently studying all behaviour dependencies between the biological system components.
We are establishing sets of execution scenarios in order to gather a majority of possible behavioural situations.
The goal is to have an almost complete idea about the modelled system behaviour. Based on the simulation results, we aim eventually to verify the established model in a formal way allowing to study all possible execution scenarios in the future.
Author Contributions
S.C.: Main writing, studying and designing the total system, analysing and improving the proposed model. S.M.: Total supervision of the paperwork, review, and comments, etc. Both authors have read and approved the final manuscript.
Funding
This research received no external funding
Conflicts of Interest
The authors declare no conflict of interest.
Abbreviations
The following abbreviations are used in this manuscript:
| 5MethylTHF | 5-Methyl Tetrahydrofolate |
| BHSM | Betaine-Homocysteine S-Methyltransferase |
| CBS | Cystathionine Beta Synthase |
| MATII | Methionine Adenosyl Transferase |
| METH | Methyltransferase |
| MS | Methionine Synthase |
| SAH | S-Adenosyl-Homocysteine |
| SAHH | S-Adenosyl-Homocysteine Hydrolase |
| SAM | S-Adenosyl-Methionine |
| THF | Tetrahydrofolate |
References
- De Jong, H. Modeling and simulation of genetic regulatory systems: A literature review. J. Comput. Biol. 2002, 9, 67–103. [Google Scholar] [CrossRef] [PubMed]
- Kitano, H. Computational systems biology. Nature 2002, 420, 206–210. [Google Scholar] [CrossRef] [PubMed]
- Khan, S.; Makkena, R.; McGeary, F.; Decker, K.; Gillis, W.; Schmidt, C. A multi-agent system for the quantitative simulation of biological networks. In Proceedings of the Second International Joint Conference On Autonomous Agents and Multiagent Systems, Melbourne, Australia, 14–18 July 2003; pp. 385–392. [Google Scholar]
- Guerriero, M.L. Qualitative and quantitative analysis of a Bio-PEPA model of the gp130/JAK/STAT signalling pathway. In Transactions on Computational Systems Biology XI; Springer: Berlin/Heidelberg, Germany, 2009; pp. 90–115. [Google Scholar]
- Koch, I. Petri nets in systems biology. Softw. Syst. Model. 2015, 14, 703–710. [Google Scholar] [CrossRef]
- Reddy, V.N.; Mavrovouniotis, M.L.; Liebman, M.N. Petri net representations in metabolic pathways. In Proceedings of the 1st International Conference on Intelligent Systems for Molecular Biology, Bethesda, MD, USA, 6–9 July 1993; Volume 93, pp. 328–336. [Google Scholar]
- Liu, F.; Heiner, M. Petri nets for modeling and analyzing biochemical reaction networks. In Approaches in Integrative Bioinformatics; Springer: Berlin/Heidelberg, Germany, 2014; pp. 245–272. [Google Scholar]
- Heiner, M.; Koch, I.; Will, J. Model validation of biological pathways using Petri nets—Demonstrated for apoptosis. Biosystems 2004, 75, 15–28. [Google Scholar] [CrossRef] [PubMed]
- Herajy, M.; Liu, F.; Rohr, C.; Heiner, M. Coloured Hybrid Petri Nets: an Adaptable Modelling Approach for Multi-scale Biological Networks. Comput. Biol. Chem. 2018, 76, 87–100. [Google Scholar] [CrossRef] [PubMed]
- Herajy, M.; Liu, F.; Heiner, M. Efficient modelling of yeast cell cycles based on multisite phosphorylation using coloured hybrid Petri nets with marking-dependent arc weights. Nonlinear Anal. Hybrid Syst. 2018, 27, 191–212. [Google Scholar] [CrossRef]
- Cao, R.; Hao, L.; Wang, F.; Qiang, G. Modelling and analysis of hybrid stochastic timed Petri net. J. Control Decis. 2018, 1–21. [Google Scholar]
- Hardy, S.; Robillard, P.N. Modeling and simulation of molecular biology systems using Petri nets: Modeling goals of various approaches. J. Bioinform. Comput. Biol. 2004, 2, 619–637. [Google Scholar] [CrossRef]
- Peleg, M.; Rubin, D.; Altman, R.B. Using Petri net tools to study properties and dynamics of biological systems. J. Am. Med. Inform. Assoc. 2005, 12, 181–199. [Google Scholar] [CrossRef] [PubMed]
- Herajy, M.; Liu, F.; Rohr, C. Coloured hybrid Petri nets for systems biology. In Proceedings of the 5th International Workshop on Biological Processes & Petri Nets (BioPPN 2014), Satellite Event of Petri Nets 2014, Tunis, Tunisia, 23 June 2014; Volume 1159, p. 60. [Google Scholar]
- Cherdal, S.; Mouline, S. A petri net model for a composed biological system. Proceeding of the 5th International Conference on Information & Communication Technology and Accessibility (ICTA), Marrakesh, Morocco, 21–23 December 2016; pp. 1–6. [Google Scholar]
- Koch, I.; Reisig, W.; Schreiber, F. Modeling in Systems Biology: The Petri Net Approach; Springer Science & Business Media: Berlin, Germany, 2011; Volume 16. [Google Scholar]
- Formanowicz, D.; Kozak, A.; Głowacki, T.; Radom, M.; Formanowicz, P. Hemojuvelin–hepcidin axis modeled and analyzed using Petri nets. J. Biomed. Inform. 2013, 46, 1030–1043. [Google Scholar] [CrossRef] [PubMed]
- Martinov, M.; Vitvitsky, V.; Mosharov, E.; Banerjee, R.; Ataullakhanov, F. A substrate switch: A new mode of regulation in the methionine metabolic pathway. J. Theor. Biol. 2000, 204, 521–532. [Google Scholar] [CrossRef] [PubMed]
- Reed, M.C.; Nijhout, H.F.; Sparks, R.; Ulrich, C.M. A mathematical model of the methionine cycle. J. Theor. Biol. 2004, 226, 33–43. [Google Scholar] [CrossRef] [PubMed]
- Reed, M.C.; Nijhout, H.F.; Neuhouser, M.L.; Gregory, J.F.; Shane, B.; James, S.J.; Boynton, A.; Ulrich, C.M. A mathematical model gives insights into nutritional and genetic aspects of folate-mediated one-carbon metabolism. J. Nutr. 2006, 136, 2653–2661. [Google Scholar] [CrossRef] [PubMed]
- Han, H.; Sharpnack, J.; Tello, D.; Grajdeanu, P. Cell Metabolism, Methionine and Neurodiseases. 2007. Available online: https://www.researchgate.net/publication/266346273_Cell_Metabolism_Methionine_and_Neurodiseases (accessed on 20 July 2018).
- Duncan, T.M.; Reed, M.; Nijhout, H.F. The relationship between intracellular and plasma levels of folate and metabolites in the methionine cycle: A model. Mol. Nutr. Food Res. 2013, 57, 628–636. [Google Scholar] [CrossRef] [PubMed]
- Martinov, M.; Vitvitsky, V.; Banerjee, R.; Ataullakhanov, F. The logic of the hepatic methionine metabolic cycle. Biochim. Biophys. Acta (BBA) Proteins Proteom. 2010, 1804, 89–96. [Google Scholar] [CrossRef] [PubMed] [Green Version]
- Piazza, M.; Feng, X.J.; Rabinowitz, J.D.; Rabitz, H. Diverse metabolic model parameters generate similar methionine cycle dynamics. J. Theor. Biol. 2008, 251, 628–639. [Google Scholar] [CrossRef] [PubMed] [Green Version]
- Chen, Z.E.; Chen, A.H. Constructing the Methionine cycle and its related disease model with Hybrid Functional Petri Nets. In Proceedings of the Asia Pacific Association of Medical Informatics (APAMI), Taipei, Taiwan, 27–29 October 2006; pp. 24–30. [Google Scholar]
- Matsuno, H.; Tanaka, Y.; Aoshima, H.; Doi, A.; Matsui, M.; Miyano, S. Biopathways representation and simulation on hybrid functional Petri net. In Silico Biol. 2003, 3, 389–404. [Google Scholar] [PubMed]
- Brosnan, J.T.; Brosnan, M.E. The sulfur-containing amino acids: An overview. J. Nutr. 2006, 136, 1636S–1640S. [Google Scholar] [CrossRef] [PubMed]
- Miller, J.W.; Nadeau, M.R.; Smith, D.; Selhub, J. Vitamin B-6 deficiency vs folate deficiency: Comparison of responses to methionine loading in rats. Am. J. Clin. Nutr. 1994, 59, 1033–1039. [Google Scholar] [CrossRef] [PubMed]
- Carson, N.A.; Cusworth, D.; Dent, C.; Field, C.; Neill, D.; Westall, R. Homocystinuria: A new inborn error of metabolism associated with mental deficiency. Arch. Dis. Child. 1963, 38, 425–436. [Google Scholar] [CrossRef] [PubMed]
- Schimke, R.N.; McKusick, V.A.; Huang, T.; Pollack, A.D. Homocystinuria: Studies of 20 families with 38 affected members. JAMA 1965, 193, 711–719. [Google Scholar] [CrossRef] [PubMed]
- Kronenberg, G.; Harms, C.; Sobol, R.W.; Cardozo-Pelaez, F.; Linhart, H.; Winter, B.; Balkaya, M.; Gertz, K.; Gay, S.B.; Cox, D.; et al. Folate deficiency induces neurodegeneration and brain dysfunction in mice lacking uracil DNA glycosylase. J. Neurosci. 2008, 28, 7219–7230. [Google Scholar] [CrossRef] [PubMed]
- Cherdal, S.; Mouline, S. Petri nets for modelling and analysing a complex system related to alzheimer’s disease. In Proceedings of the 31st Annual ACM Symposium on Applied Computing (SAC), Pisa, Italy, 4–8 April 2016; pp. 309–312. [Google Scholar]
- Smith, A.D.; Smith, S.M.; De Jager, C.A.; Whitbread, P.; Johnston, C.; Agacinski, G.; Oulhaj, A.; Bradley, K.M.; Jacoby, R.; Refsum, H. Homocysteine-lowering by B vitamins slows the rate of accelerated brain atrophy in mild cognitive impairment: A randomized controlled trial. PLoS ONE 2010, 5, e12244. [Google Scholar] [CrossRef] [PubMed]
- Miller, A.L. The methionine-homocysteine cycle and its effects on cognitive diseases. Altern. Med. Rev. 2003, 8, 7–19. [Google Scholar] [PubMed]
- Tchantchou, F.; Shea, T.B. Folate deprivation, the methionine cycle, and Alzheimer’s disease. Vitam. Horm. 2008, 79, 83–97. [Google Scholar] [PubMed]
- Refsum, H.; Ueland, P.; Nygård, O.; Vollset, S. Homocysteine and cardiovascular disease. Annu. Rev. Med. 1998, 49, 31–62. [Google Scholar] [CrossRef] [PubMed]
- Potter, J.D. Colorectal cancer: Molecules and populations. J. Natl. Cancer Inst. 1999, 91, 916–932. [Google Scholar] [CrossRef] [PubMed]
- Mattson, M.P.; Shea, T.B. Folate and homocysteine metabolism in neural plasticity and neurodegenerative disorders. Trends Neurosci. 2003, 26, 137–146. [Google Scholar] [CrossRef]
- Eskes, T. Neural tube defects, vitamins and homocysteine. Eur. J. Pediatr. 1998, 157, S139–S141. [Google Scholar] [CrossRef] [PubMed]
- Cherdal, S.; Mouline, S. A Petri Net model to simulate and analyse cerebral folate deficiency and hyperhomocysteinemia effects in Autism Spectrum Disorder. In Proceedings of the 7th International Conference on Sciences of Electronics, Technologies of Information and Telecommunications (SETIT), Hammamet, Tunisia, 18–20 December 2016; pp. 279–284. [Google Scholar]
- Alla, H.; David, R. Continuous and hybrid Petri nets. J. Circuits Syst. Comput. 1998, 8, 159–188. [Google Scholar] [CrossRef]
- Drath, R. Hybrid object nets: An object oriented concept for modeling complex hybrid systems. In Proceedings of the 3rd International Conference on Automation of Mixed Processes (ADPM’98), Reims, France, 19–20 March 1998; pp. 436–442. [Google Scholar]
- Hofestädt, R.; Thelen, S. Quantitative modeling of biochemical networks. In Silico Biol. 1998, 1, 39–53. [Google Scholar] [PubMed]
- Miyano, S.; Matsuno, H. How to Model and Simulate Biological Pathways with Petri nets-A new challenge for systems Biology. In Proceedings of the 25th International Conference on Application and Theory of Petri Nets, Bologna, Italy, 23–25 June 2004. [Google Scholar]
- Li, C.; Nagasaki, M.; Ueno, K.; Miyano, S. Simulation-based model checking approach to cell fate specification during Caenorhabditis elegans vulval development by hybrid functional Petri net with extension. BMC Syst. Biol. 2009, 3, 42. [Google Scholar] [CrossRef] [PubMed]
- Doi, A.; Fujita, S.; Matsuno, H.; Nagasaki, M.; Miyano, S. Constructing biological pathway models with hybrid functional Petri nets. In Silico Biol. 2004, 4, 271–291. [Google Scholar] [PubMed]
- Doi, A.; Nagasaki, M.; Matsuno, H.; Miyano, S. Simulation-based validation of the p53 transcriptional activity with hybrid functional Petri net. In Silico Biol. 2006, 6, 1–13. [Google Scholar] [PubMed]
- Akçay, N.İ.; Bashirov, R.; Tüzmen, Ş. Validation of signalling pathways: Case study of the p16-mediated pathway. J. Bioinform. Comput. Biol. 2015, 13, 1550007. [Google Scholar] [CrossRef] [PubMed] [Green Version]
- Nagasaki, M.; Saito, A.; Doi, A.; Matsuno, H.; Miyano, S. Foundations of Systems Biology: Using Cell Illustrator and Pathway Databases; Springer Science & Business Media: Berlin, Germany, 2009; Volume 13. [Google Scholar]
- Nijhout, H.; Reed, M.; Budu, P.; Ulrich, C. A mathematical model of the folate cycle: New insights into folate homeostasis. J. Biol. Chem. 2004, 279, 55008–55016. [Google Scholar] [CrossRef] [PubMed]
- Michaelis, L.; Menten, M.L. Die kinetik der invertinwirkung. Biochem. Z. 1913, 49, 333–369. [Google Scholar]
- Reed, M.C.; Thomas, R.L.; Pavisic, J.; James, S.J.; Ulrich, C.M.; Nijhout, H.F. A mathematical model of glutathione metabolism. Theor. Biol. Med. Model. 2008, 5, 8. [Google Scholar] [CrossRef] [PubMed] [Green Version]
- Guo, H.; Chi, J.; Xing, Y.; Wang, P. Influence of folic acid on plasma homocysteine levels & arterial endothelial function in patients with unstable angina. Indian J. Med. Res. 2009, 129, 279–284. [Google Scholar] [PubMed]
Figure 1.
Schematic illustration of the Methionine metabolite cycle. 5MethylTHF: 5-Methyl Tetrahydrofolate; BHSM: Betaine-Homocysteine S-Methyltransferase; CBS: Cystathionine Beta Synthase; MATII: Methionine Adenosyl Transferase; METH: Methyltransferase; MS: Methionine Synthase;SAH: S-Adenosyl-Homocysteine; SAHH: S-Adenosyl-Homocysteine Hydrolase; SAM: S-Adenosyl-Methionine; THF: Tetrahydrofolate.

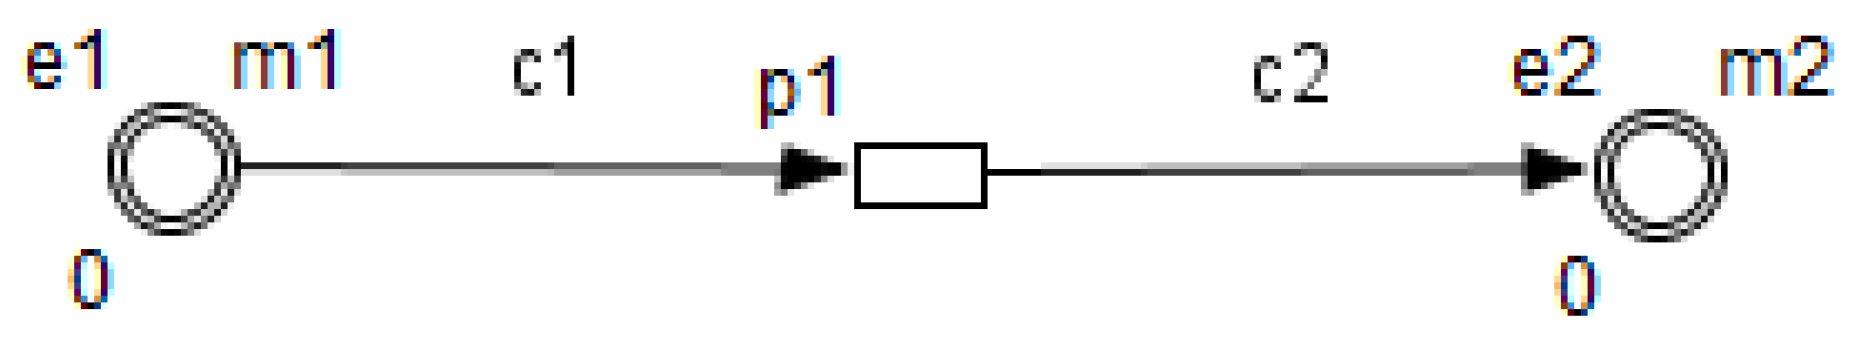
Figure 2.
Continuous entities, continuous process and normal connectors.

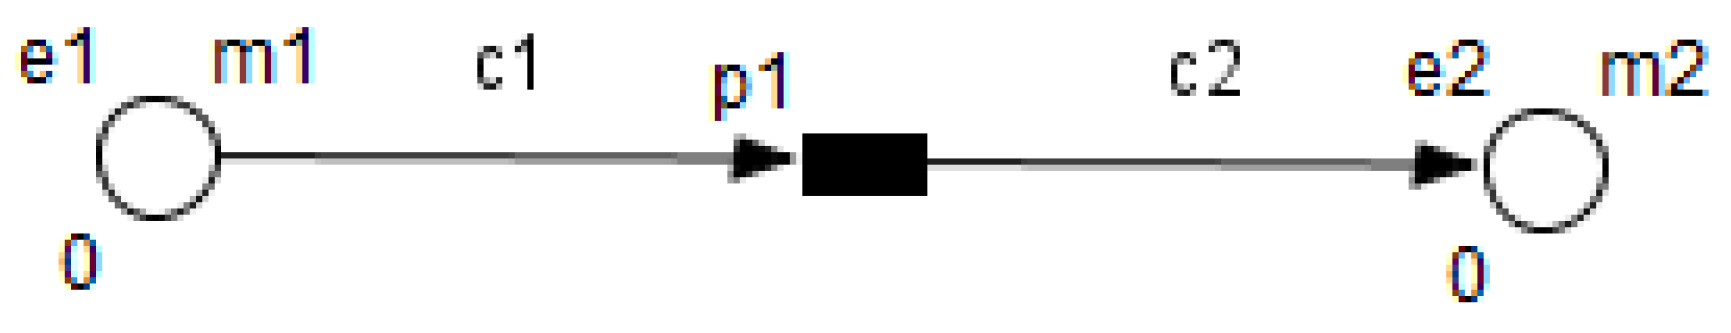
Figure 3.
Discrete entities, discrete process and normal connectors.

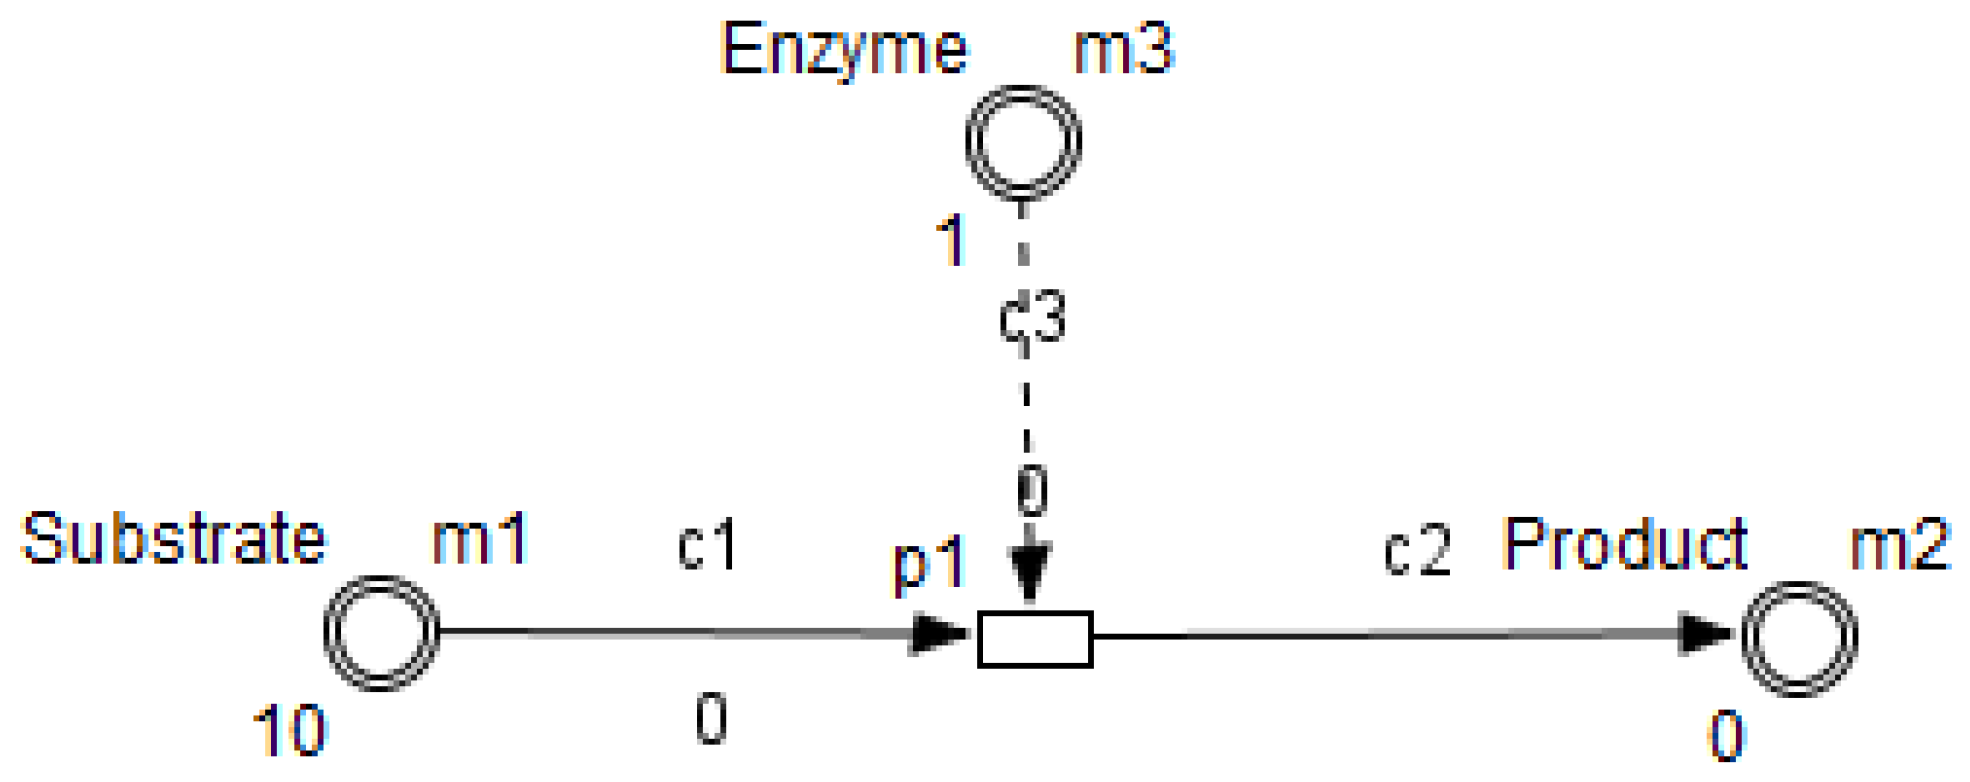
Figure 4.
Test connector standing for enzyme catalysis and normal connector for protein production.

Figure 5.
Different combination representing degradation in metabolic pathways. (discrete entity, discrete process), (continuous entity, continuous process), and (continuous entity, discrete process).
Figure 5.
Different combination representing degradation in metabolic pathways. (discrete entity, discrete process), (continuous entity, continuous process), and (continuous entity, discrete process).

Figure 6.
Inhibitory connector used to inhibit some reactions.

Figure 7.
HFPN representation of the studied metabolic pathway.

Figure 8.
Simulation of the HFPN model representing the studied metabolic pathway in a normal case (Scenario 1).
Figure 8.
Simulation of the HFPN model representing the studied metabolic pathway in a normal case (Scenario 1).

Figure 9.
Simulation of the HFPN model representing the studied metabolic pathway in case of MS, BHSM and CBS Deficiencies (Scenario 2).
Figure 9.
Simulation of the HFPN model representing the studied metabolic pathway in case of MS, BHSM and CBS Deficiencies (Scenario 2).

Figure 10.
Simulation of the HFPN model representing the studied metabolic pathway in case of MS and BHSM Deficiencies (Scenario 3).
Figure 10.
Simulation of the HFPN model representing the studied metabolic pathway in case of MS and BHSM Deficiencies (Scenario 3).

Figure 11.
Simulation of the HFPN model representing the studied metabolic pathway in case of BHSM and CBS Deficiencies (Scenario 4).
Figure 11.
Simulation of the HFPN model representing the studied metabolic pathway in case of BHSM and CBS Deficiencies (Scenario 4).

Figure 12.
Simulation of the HFPN model representing the studied metabolic pathway in case of MS and CBS Deficiencies (Scenario 5).
Figure 12.
Simulation of the HFPN model representing the studied metabolic pathway in case of MS and CBS Deficiencies (Scenario 5).


Table 1.
Biological System to HFPN General Mapping.
| Biological System | HFPN | ||
|---|---|---|---|
| Element | Symbol | Element | Symbol |
| Principal Metabolite |  | Continuous Entity |  |
| Enzyme |  | Continuous Entity |  |
| Reaction |  | Continuous Process |  |
| Normal Arc |  | Normal Connector |  |
| Catalysis |  | Test Connector: Catalysis |  |
| Activator Arc |  | Test Connector: Activator |  |
| Inhibitory Arc |  | Inhibitory Connector |  |
Table 2.
Correspondence between HFPN processes and reaction velocities.
| Process | Process Type | Process Rate |
|---|---|---|
| P1 | Discrete | 3 |
| P2 | Continuous | |
| P3 | Continuous | |
| P4 | Continuous | |
| P5 | Continuous | |
| P6 | Continuous | |
| P7 | Continuous | |
| P8 | Continuous | 1 |
| P9 | Continuous | 1 |
| P10 | Continuous | 1 |
| P11 | Continuous | 1 |
| P12 | Continuous | 1 |
| P13 | Continuous | 1 |
Table 3.
Correspondence between biological components and HFPN entities.
| Entity Name | Entity Type | Variable | Initial Value | Value Type |
|---|---|---|---|---|
| Methionine | Continuous | m1 | 3 | Double |
| SAM | Continuous | m2 | 1 | Double |
| SAH | Continous | m3 | 1 | Double |
| Homocysteine | Continuous | m4 | 1 | Double |
| Cystathionine | Continuous | m5 | 1 | Double |
| 5MethylTHF | Continuous | m6 | 1 | Double |
| THF | Continuous | m7 | 1 | Double |
| MATII | Continuous | m8 | 1 | Double |
| METH | Continuous | m9 | 1 | Double |
| SAHH | Continuous | m10 | 1 | Double |
| CBS | Continuous | m11 | 1 | Double |
| BHSM | Continuous | m12 | 1 | Double |
| MS | Continuous | m13 | 1 | Double |
Table 4.
Connectors in the HFPN model.
| Connector | Firing Style | Firing Script | Connector Type |
|---|---|---|---|
| c1-c14 | Threshold | 0 | Output Process |
| c15-c32 | Threshold | 0 | Input Process |
| c33-c39 | Threshold | 0 | Input Association |
| c40-c44 | Threshold | 50 | Input Inhibitor |
Table 5.
Natural degradation in the HFPN model.
| Biological Phenomenon | Process | Process Type | Process Rate |
|---|---|---|---|
| Metabolites’ Degradation | P14-P19 | Continuous | mi × 0.0001 |
| Proteins’ Degradation | P20-P25 | Continuous | mi × 0.1 |
© 2018 by the authors. Licensee MDPI, Basel, Switzerland. This article is an open access article distributed under the terms and conditions of the Creative Commons Attribution (CC BY) license (http://creativecommons.org/licenses/by/4.0/).
Share and Cite
MDPI and ACS Style
Cherdal, S.; Mouline, S. Modelling and Simulation of Biochemical Processes Using Petri Nets. Processes 2018, 6, 97. https://doi.org/10.3390/pr6080097
AMA Style
Cherdal S, Mouline S. Modelling and Simulation of Biochemical Processes Using Petri Nets. Processes. 2018; 6(8):97. https://doi.org/10.3390/pr6080097
Chicago/Turabian StyleCherdal, Safae, and Salma Mouline. 2018. "Modelling and Simulation of Biochemical Processes Using Petri Nets" Processes 6, no. 8: 97. https://doi.org/10.3390/pr6080097
Note that from the first issue of 2016, this journal uses article numbers instead of page numbers. See further details here.