Effect of Particle Size on Carbon Nanotube Aggregates Behavior in Dilute Phase of a Fluidized Bed


School of Chemical and Material Engineering, Korea National University of Transportation, Chungju-si, Chungbuk 27469, Korea
Processes 2018, 6(8), 121; https://doi.org/10.3390/pr6080121
Submission received: 30 June 2018
/
Revised: 31 July 2018
/
Accepted: 6 August 2018
/
Published: 8 August 2018
(This article belongs to the Special Issue Multiphase Reaction Engineering, Reactors and Processes )
Abstract
:Fluidized bed reactors have been increasingly applied for mass production of Carbon Nanotube (CNT) using catalytic chemical vapor deposition technology. Effect of particle size (dp = 131 μm and 220 μm) on fluidization characteristics and aggregation behavior of the CNT particles have been determined in a fluidized bed for its design and scale-up. The CNT aggregation properties such as size and shape were measured in the dilute phase of a fluidized bed (0.15 m-ID × 2.6 m high) by the laser sheet technique for the visualization. Two CNT particle beds showed different tendency in variations of the aggregates factors with gas velocity due to differences in factors contributing to the aggregate formation. The CNT particles with a larger mean size presented as relatively larger in the aggregate size than the smaller CNT particles at given gas velocities. The aggregates from the large CNT particles showed a sharp increase in the aspect ratio and rapid decrease in the roundness and the solidity with gas velocity. A possible mechanism of aggregates formation was proposed based on the variations of aggregates properties with gas velocity. The obtained Heywood diameters of aggregates have been firstly correlated with the experimental parameter.
1. Introduction
Carbon Nanotube (CNT) is a very promising material with a great potential for a wide range of applications, including electronic materials and energy fields [1]. In recent years, fluidized bed reactors have been increasingly applied for mass production in the CNT synthesis using catalytic chemical vapor deposition (CCVD) technology [2,3]. Since the fluidized bed reactor has a high heat and mass transfer efficiency, it is advantageous for the synthesis of CNTs with uniform quality, and it is evaluated as a method capable of continuous production and mass production of the CNTs [1,3]. The strong anisotropy of the nanotubes on particle can affect fluidization behavior of the particles in the fluidized bed reactor because the CNT particles fall under the Geldart C classification. It is difficult to handle the CNT particles in a gas-solid fluidized bed reactor because the cohesive force between the particles is stronger than the hydrodynamic force by fluid medium. The aggregation of primary particles in the fluidized bed is dependent on the inter-particle interactions, which are a function of the primary particle size [4,5]. Since the hydrodynamic behaviors of the CNT particles in fluidized beds are governed by the interaction of individual particles, an accurate understanding of these micro-scale interactions may assist in the hydrodynamic modeling, design and scale-up of the process. However, the aggregates by the interactions have the inherently dynamic and chaotic properties in meso-scale flow structure of gas-solid flow in the fluidized bed. The measurement and characterization of the aggregates are complicated due to the dynamic properties.
Intrusive and non-intrusive methods have been used to measure the aggregate properties in the gas-solid fluidized beds [6]. The intrusive methods such as capacitance probing, optical fiber probing and momentum probing is advantageous in simplicity of setup and cost. However, they disturb the local flow of particles. The non-intrusive methods such as laser sheet technique and tomography technique measure the whole image of the particles flow in a wide range with non-invasive and non-contact advantages [7]. The imaging based on laser sheet technique has been used to measure aggregation phenomena at different flow regime in fluidized beds with advantages of easy installation and in-situ measurement [6,8,9,10], which is originally popular method in the field of single-phase flow and gas-liquid flow analysis [11]. Recently, a few studies [6,8] have used the laser-based image analysis method to measure sizes of the multi-walled CNT aggregates. Jeong and Lee [6] measured the aggregate size just above the bed surface for inferring particles behavior in the dense bed, not in the dilute phase of fluidized bed. Kim [8] has focused predominantly on the visualization of the CNT particles behavior in the freeboard region within a narrow range of gas velocity with one kind of the CNT particles. However, the aggregation behavior of nanoparticles is strongly affected by the initial particle size of the bed [4,5,9]. The study on primary particle size dependence of the CNTs aggregation behavior is still lacking to the best of our knowledge, even though a few reports have been made on nano-powders [4,5]. Therefore, a further study on the fluidization characteristics of CNT aggregates in the dilute phase of the fluidized bed is required for obtaining the design factors of freeboard part in the CNT reactor such as the heat transfer modeling [12] and the cyclone design [13].
The objective of this study is to determine the effect of CNT particle size on fluidization characteristics and aggregates behavior of the CNT particles in a fluidized bed. The CNT aggregates properties were measured based on the imaging analysis using the laser sheet technique to analyze the dynamic behavior of the CNTs of different size in the dilute phase of the reactor.
2. Materials and Methods
2.1. Materials and Experimental Apparatus
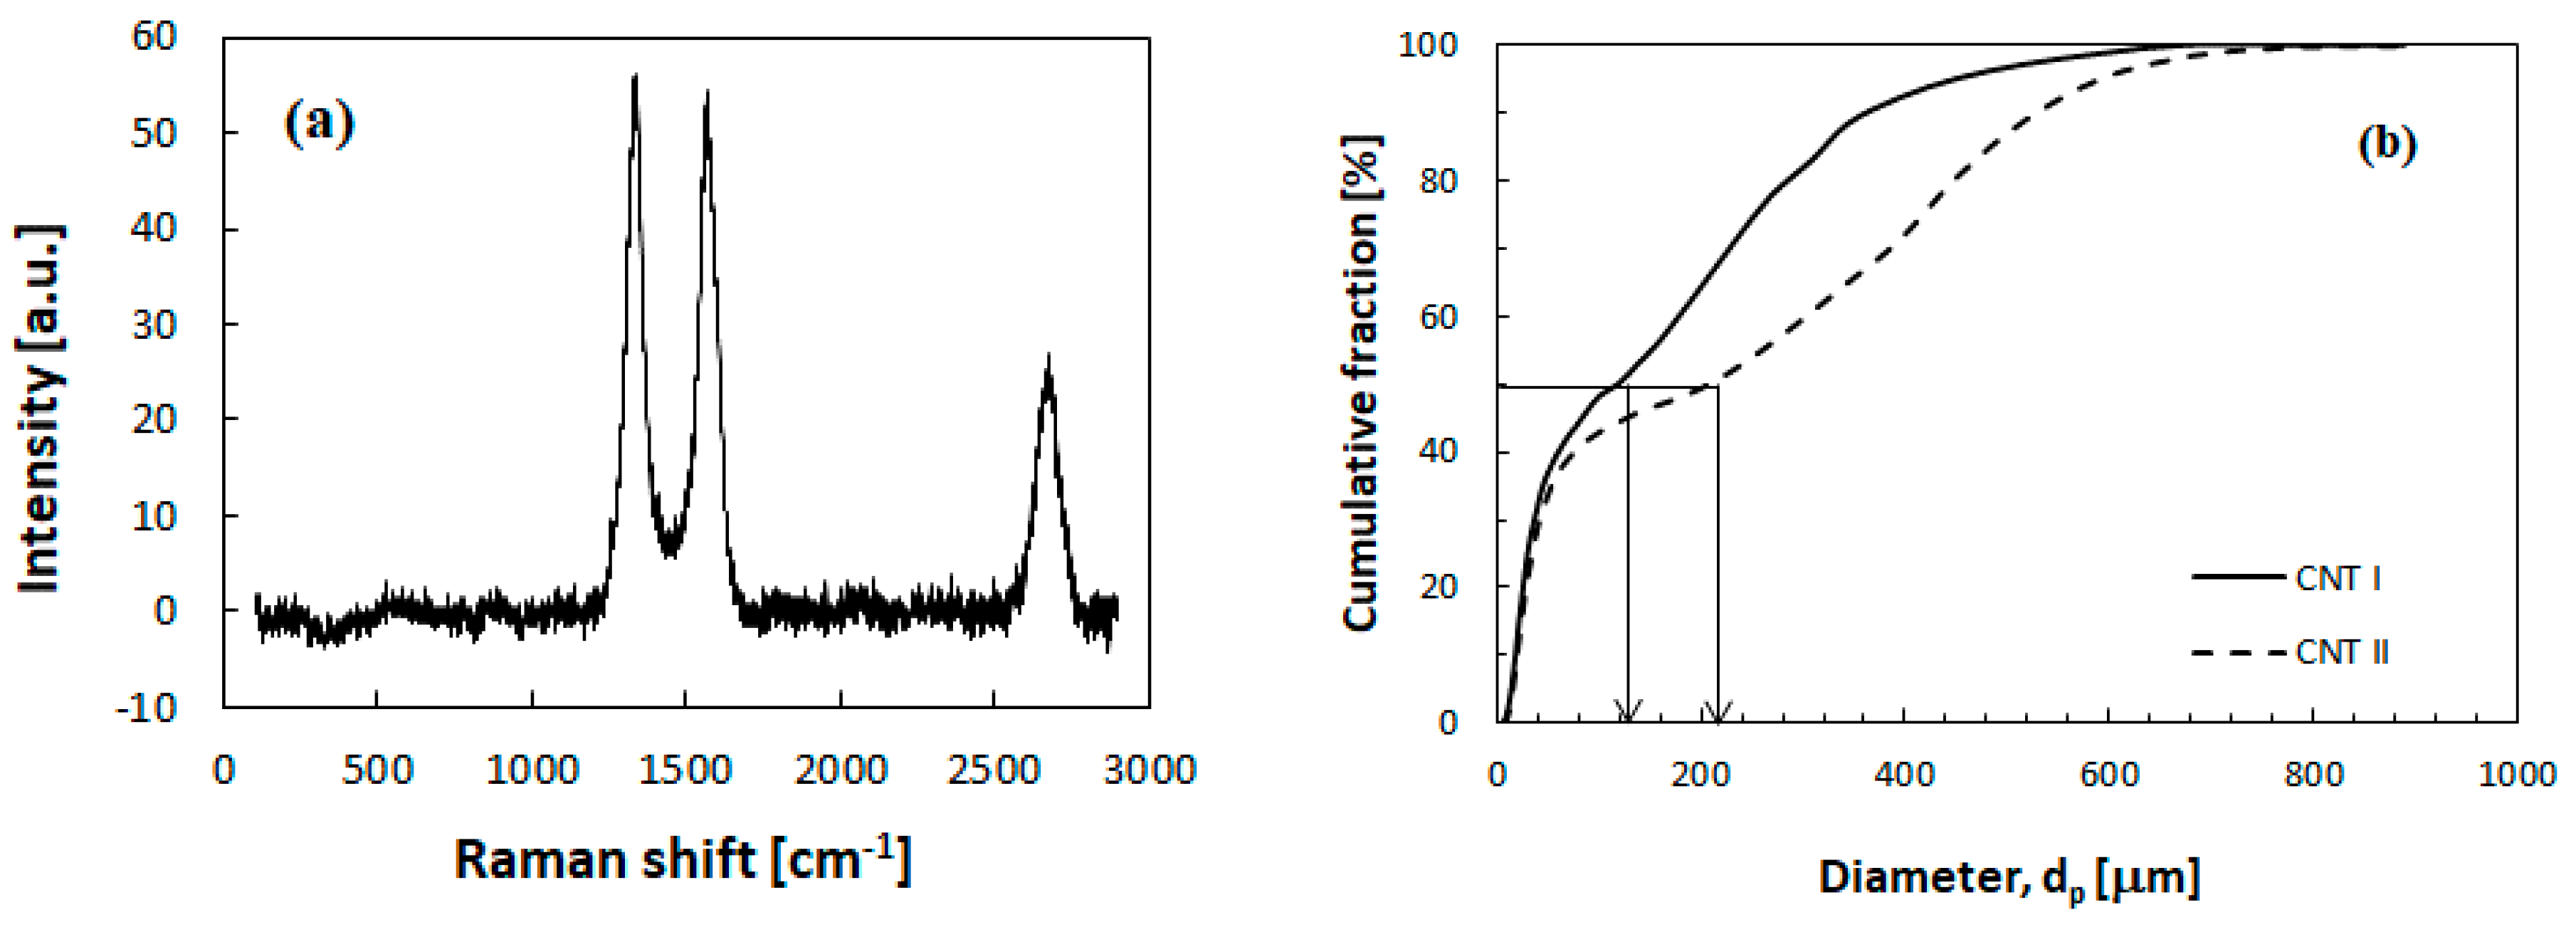
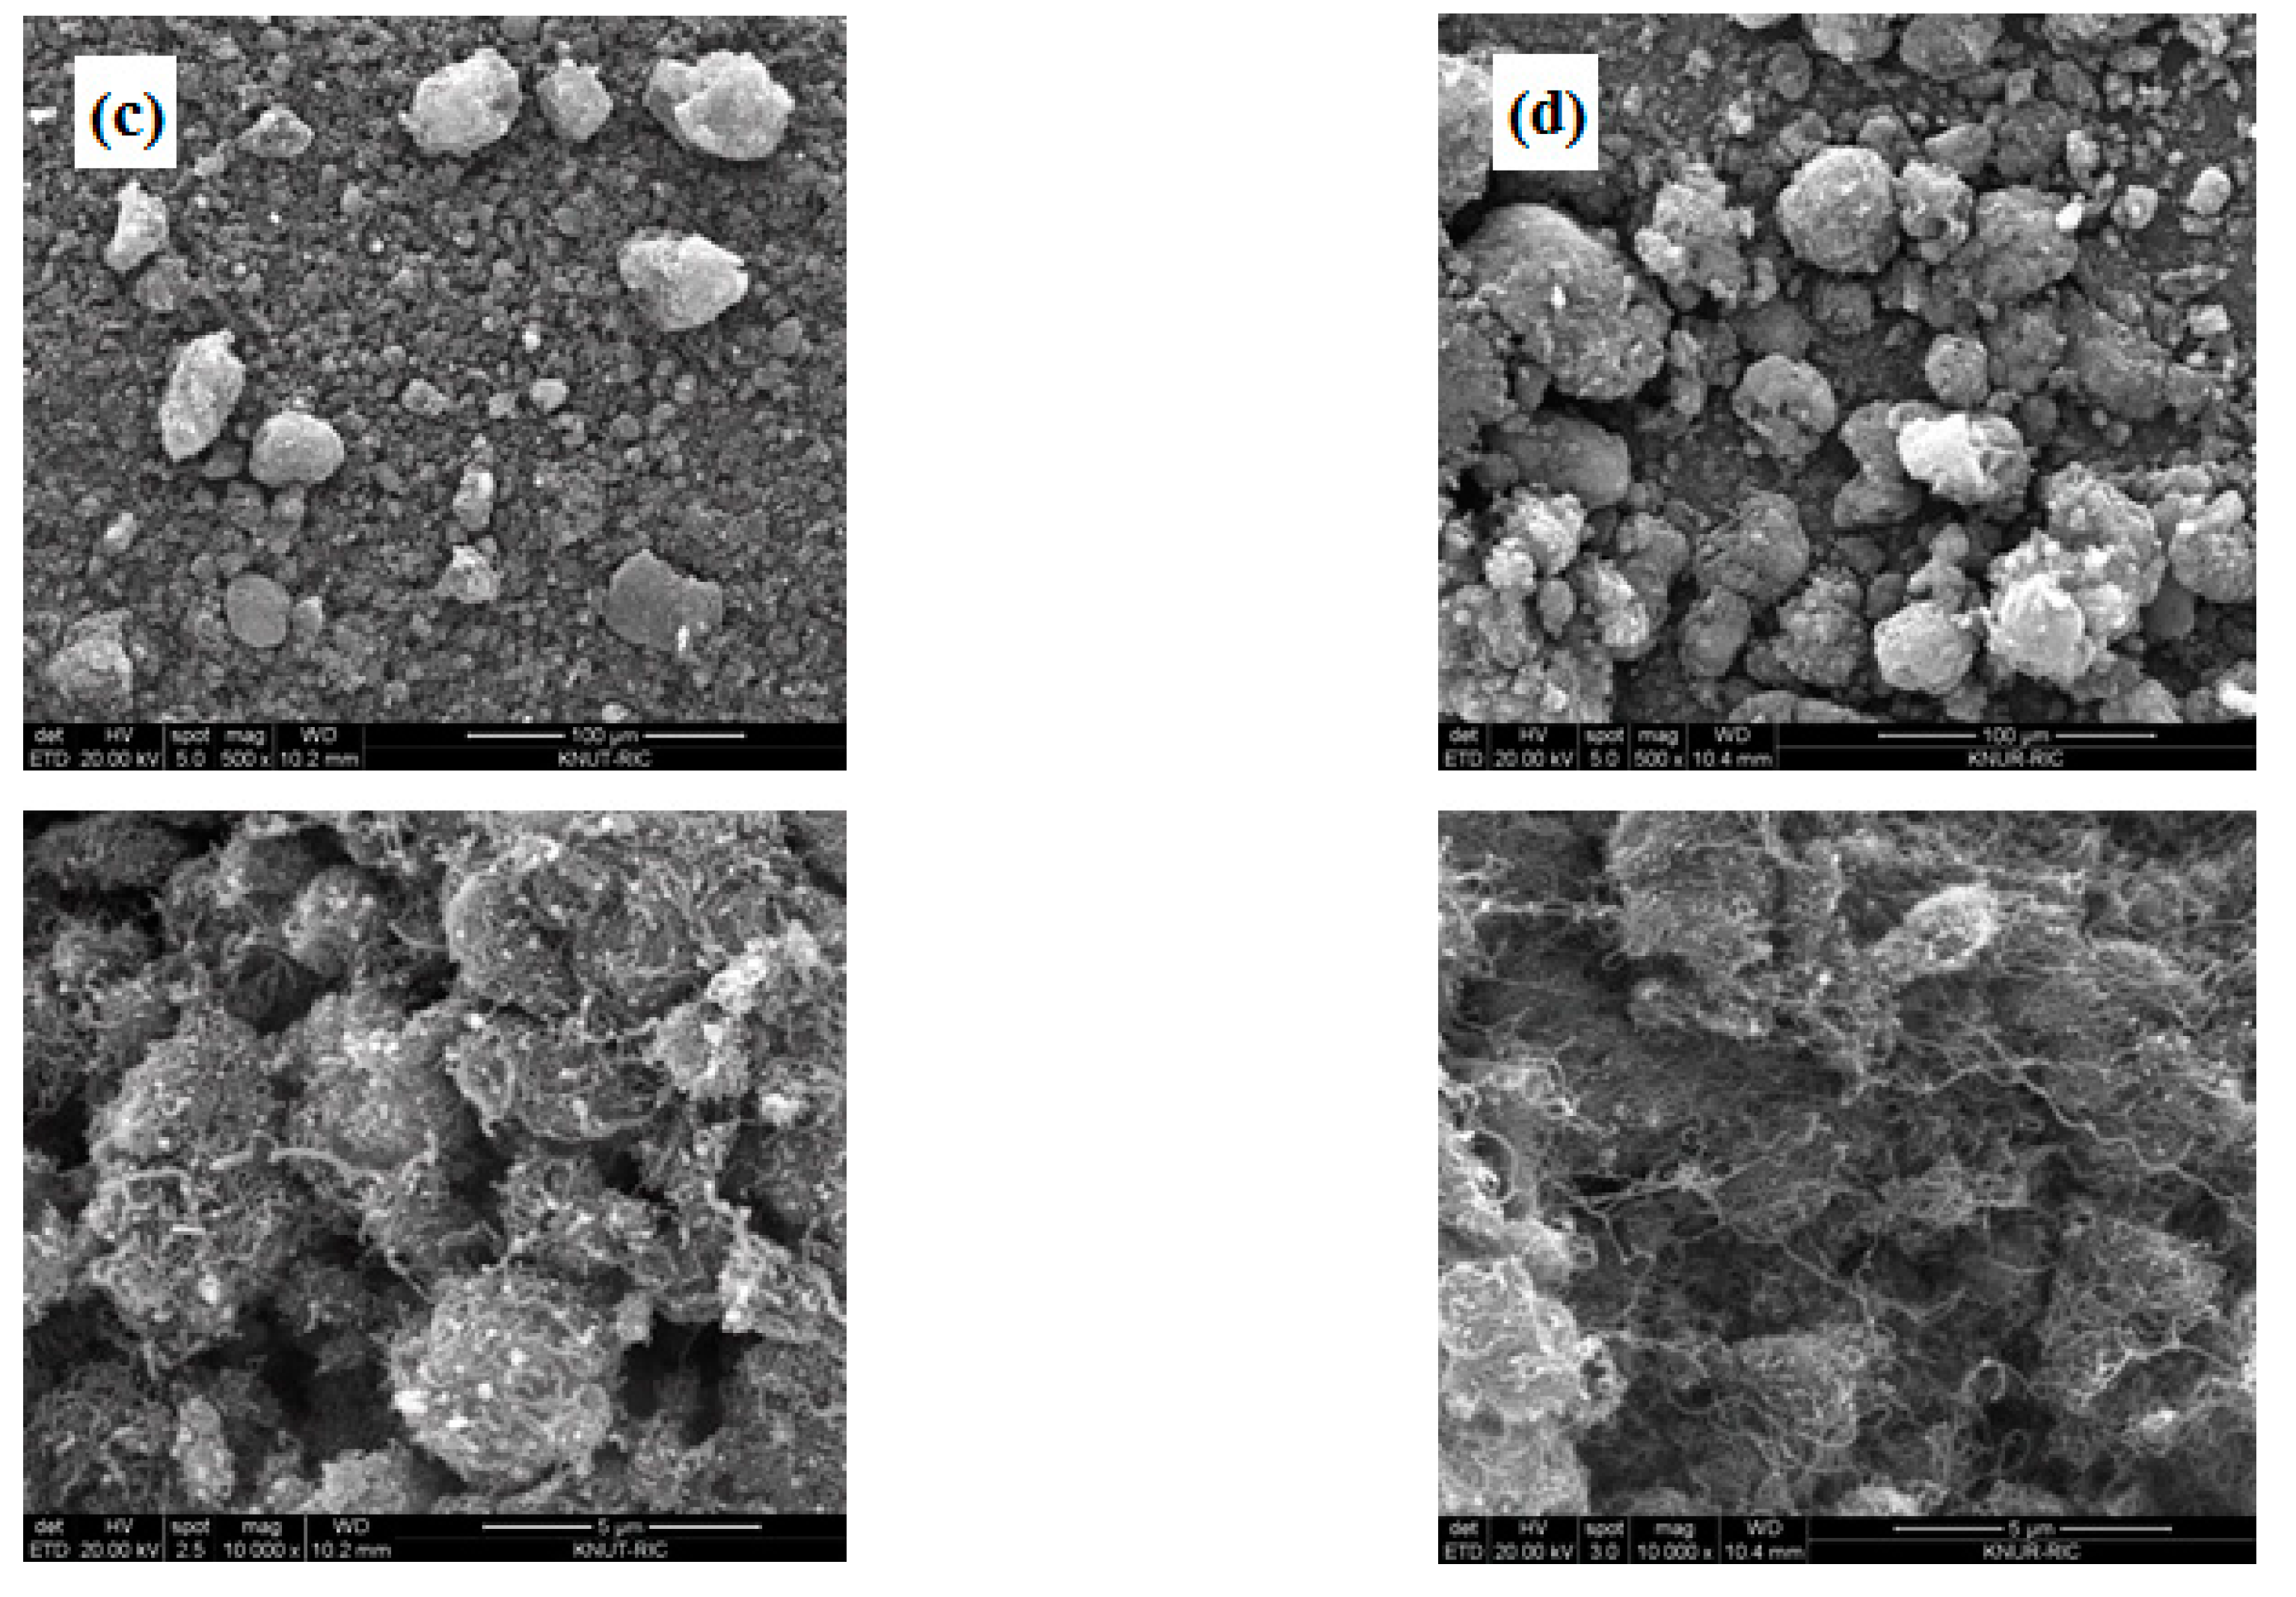
In order to investigate the fluidization behavior of CNTs, two kinds of CNT particles were used as the bed materials. They have the same particle density (ρp = 162 kg/m3) but different mean particle diameters (CNT I = 131 μm, CNT II = 220 μm). The minimum fluidization velocities of the CNT particles are 0.0026 m/s for CNT I and 0.0037 m/s for CNT II, respectively. The Raman spectrum of the CNT used in this study is shown in Figure 1a, featured in a weak radial breathing modes (RBMs) near 200 cm−1, the higher frequency D (disordered), G (graphite) in the range of 1200–1700 cm−1, and G’ modes around 2700 cm−1. The particle size distribution and SEM images of CNT I and CNT II particles are shown in Figure 1b–d. As shown in the figure, the CNT particles have various sizes. The nanotubes are entangled with each other on the surface of the particles.
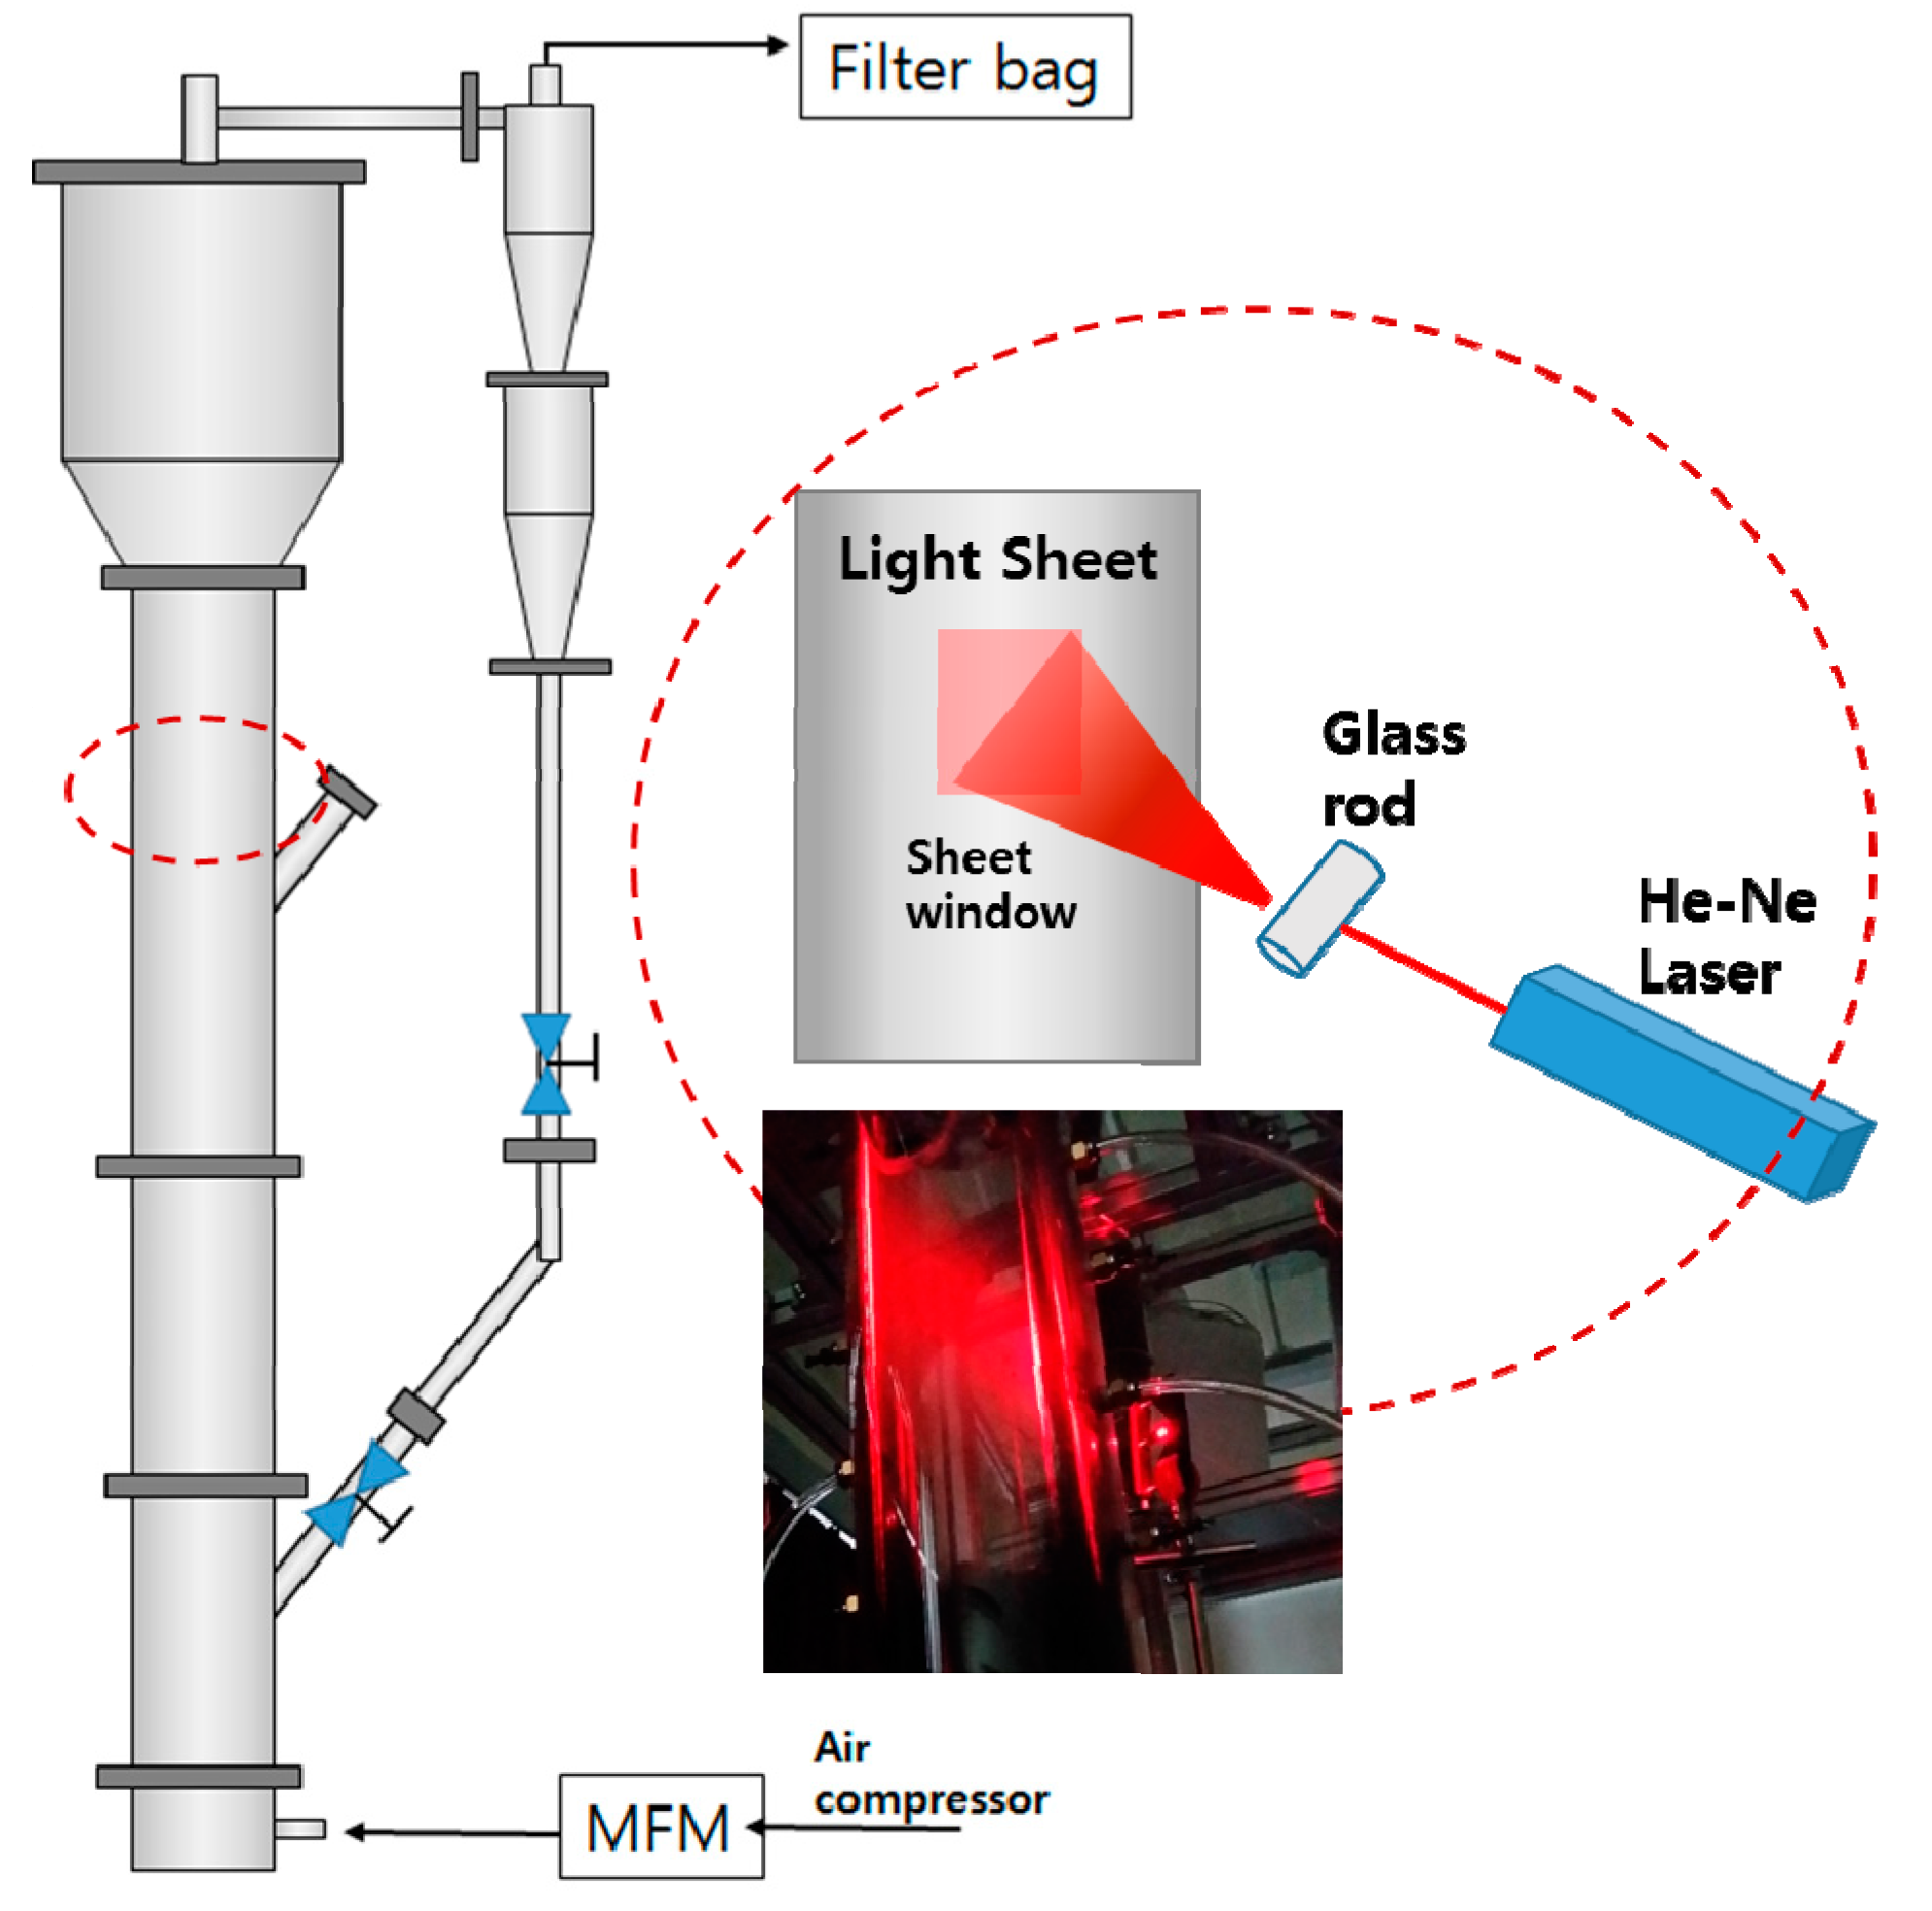
Experiments were carried out in a fluidized bed unit made of transparent Plexiglas column as shown in Figure 2. It consisted of a main column (0.15 m-ID × 2.0 m high) with a cyclone. The column was expanded to 0.30 m to reduce elutriation of particles. A tuyere type distributor was used to inject air for fluidization. Fluidizing air was introduced into the column using a mass flow meter. Pressure taps were located axially at the wall of the column to measure pressure drops for obtaining the information of solid holdup. Bed materials of 1.0 kg was loaded and the static bed height was 0.60 m. The gas velocity was varied 0.09–0.20 m/s.
A high-speed camera (RX100M4, Sony, Tokyo, Japan) was installed outside the column at the height of 1.5 m from the distributor location to visualize the CNT aggregates behavior inside the reactor and determine their properties such as size and shape. The light emitted from a He-Ne laser (Model 1145, Lumentum, Milpitas, CA, USA) passed through a grass rod lens and column wall, and illuminated the inside of the column. Resolution, sampling rate and exposure time of the camera were 350 dpi, 480 frames/s and 1000 μs, respectively.
2.2. Image Analysis Method
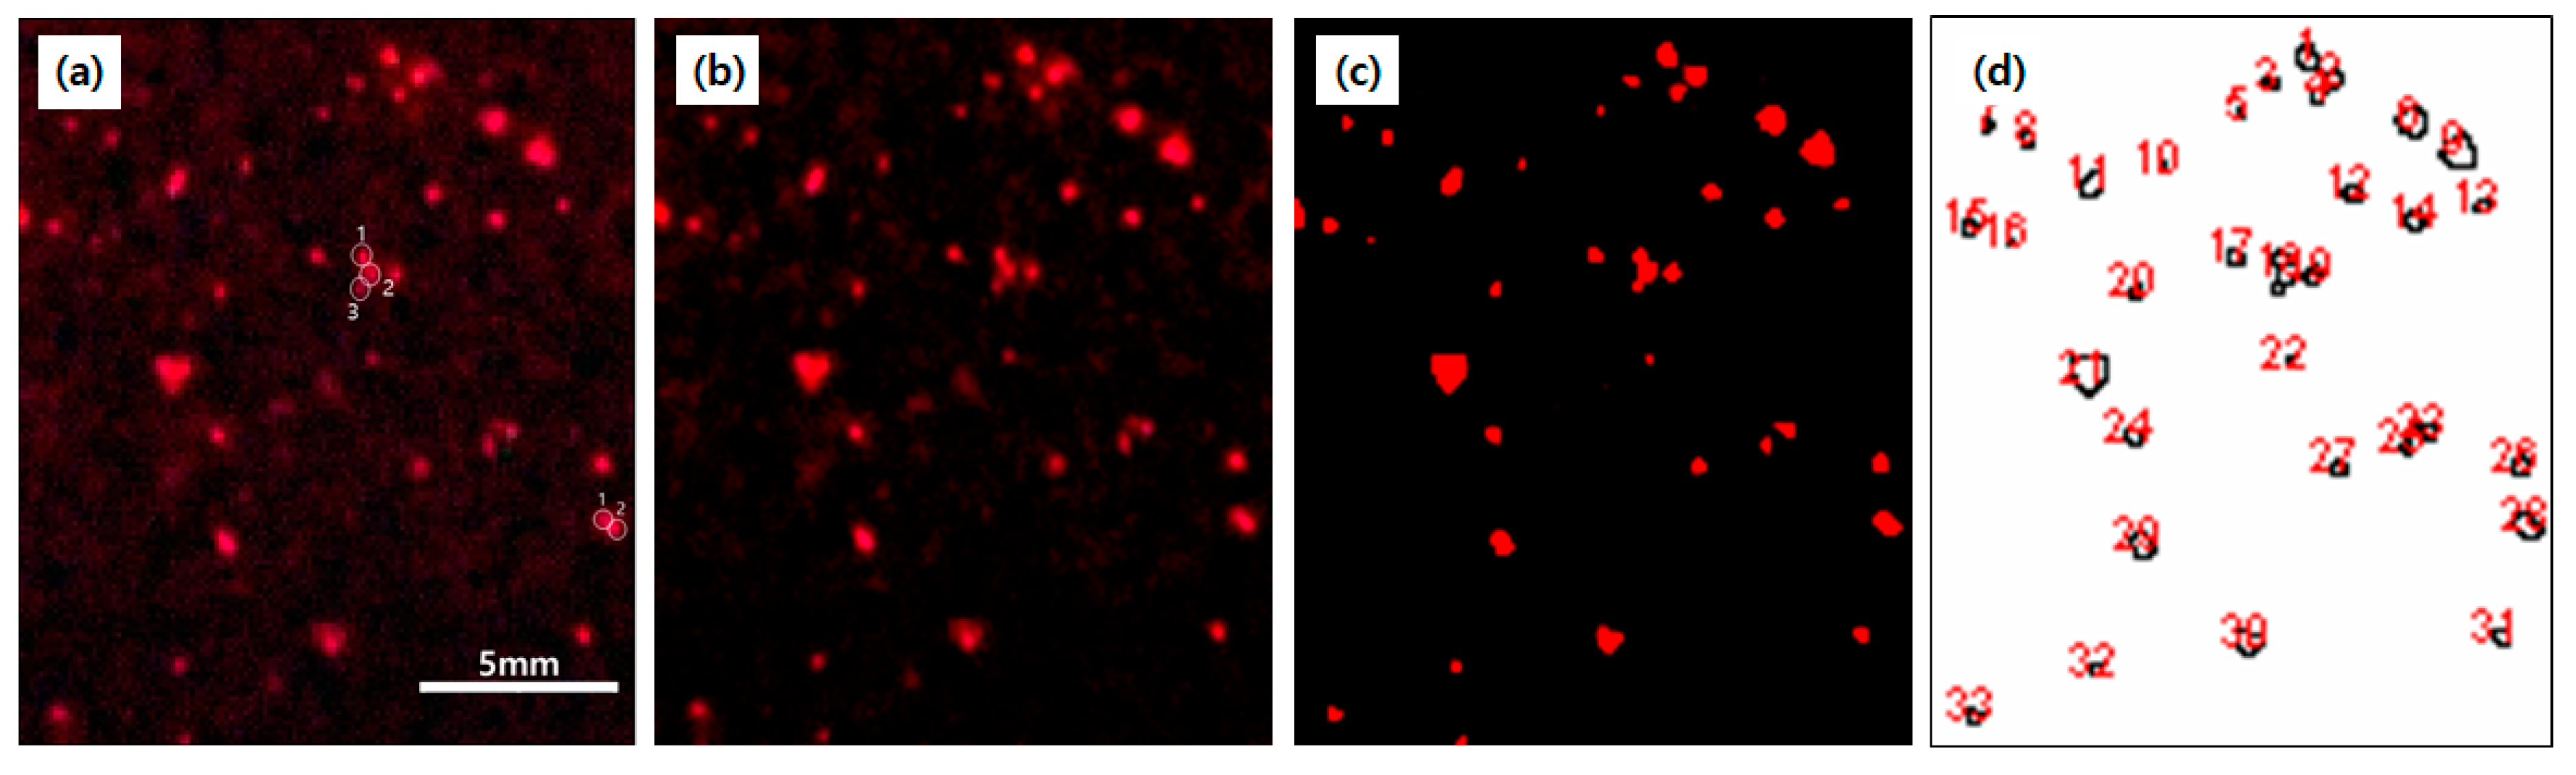
To minimize the uncertainties from dynamic flow state in the fluidized bed, about 30 images were obtained with a time interval of approximately 3 minutes after ensuring the steady state operation by visual observation and pressure measurement. The Image J [14], developed by National Institute of Standards and Technology US, was applied to process the image obtained as in Figure 3. The original image (Figure 3a) was first converted to Figure 3b by using the contrast function to enhance the directly reflected light from the CNT particles on the light sheet and to eliminate the interference of the ambient reflected light such as the reflection from the inner wall of the reactor and the reflection from the particles outside of the light sheet. The contrasted image of Figure 3b was converted to threshold ones, as seen in Figure 3c, to identify the aggregates after removing some background light noise, which is called thresholding [9]. After the thresholding, the function of ‘Analyze Particle’ in the Image J provides measured values of the aggregates properties such as shape factors, size and area for the identified particles as in Figure 3d.
In addition, particle number in the aggregated were counted from the original image (Figure 3a) based on light spots on the aggregate because the catalysts for the CNT synthesis is composed of metal components with high reflectivity.
Various definitions can be used to analyze the shape of the aggregates. In this study, factors for quantifying the CNT aggregates shape were obtained based on the studies of Wang et al. [1] and Hakim et al. [4], which incorporate various shape factors to visualize the aggregation phenomenon of nanoparticles. Heywood diameter and Feret diameter were used for the aggregate diameter, and aspect ratio, roundness and solidity were used to quantify the shape [15]. The Heywood diameter refers to the diameter calculated by converting the particle area measured in two dimensions to the area of the circle, and the Feret diameter, also called caliper diameter, means the distance between the two parallel planes restricting the object perpendicular to a specific direction. The roundness indicates the degree of roundness of the edge of the particle. The closer to 1, the closer to the circle, and the lower the value, the longer the ellipse. The solidity indicates the degree of absence of concave with respect to any shape, and the closer to 1, the convex surface only, which represents the roughness of the object [15].
3. Results
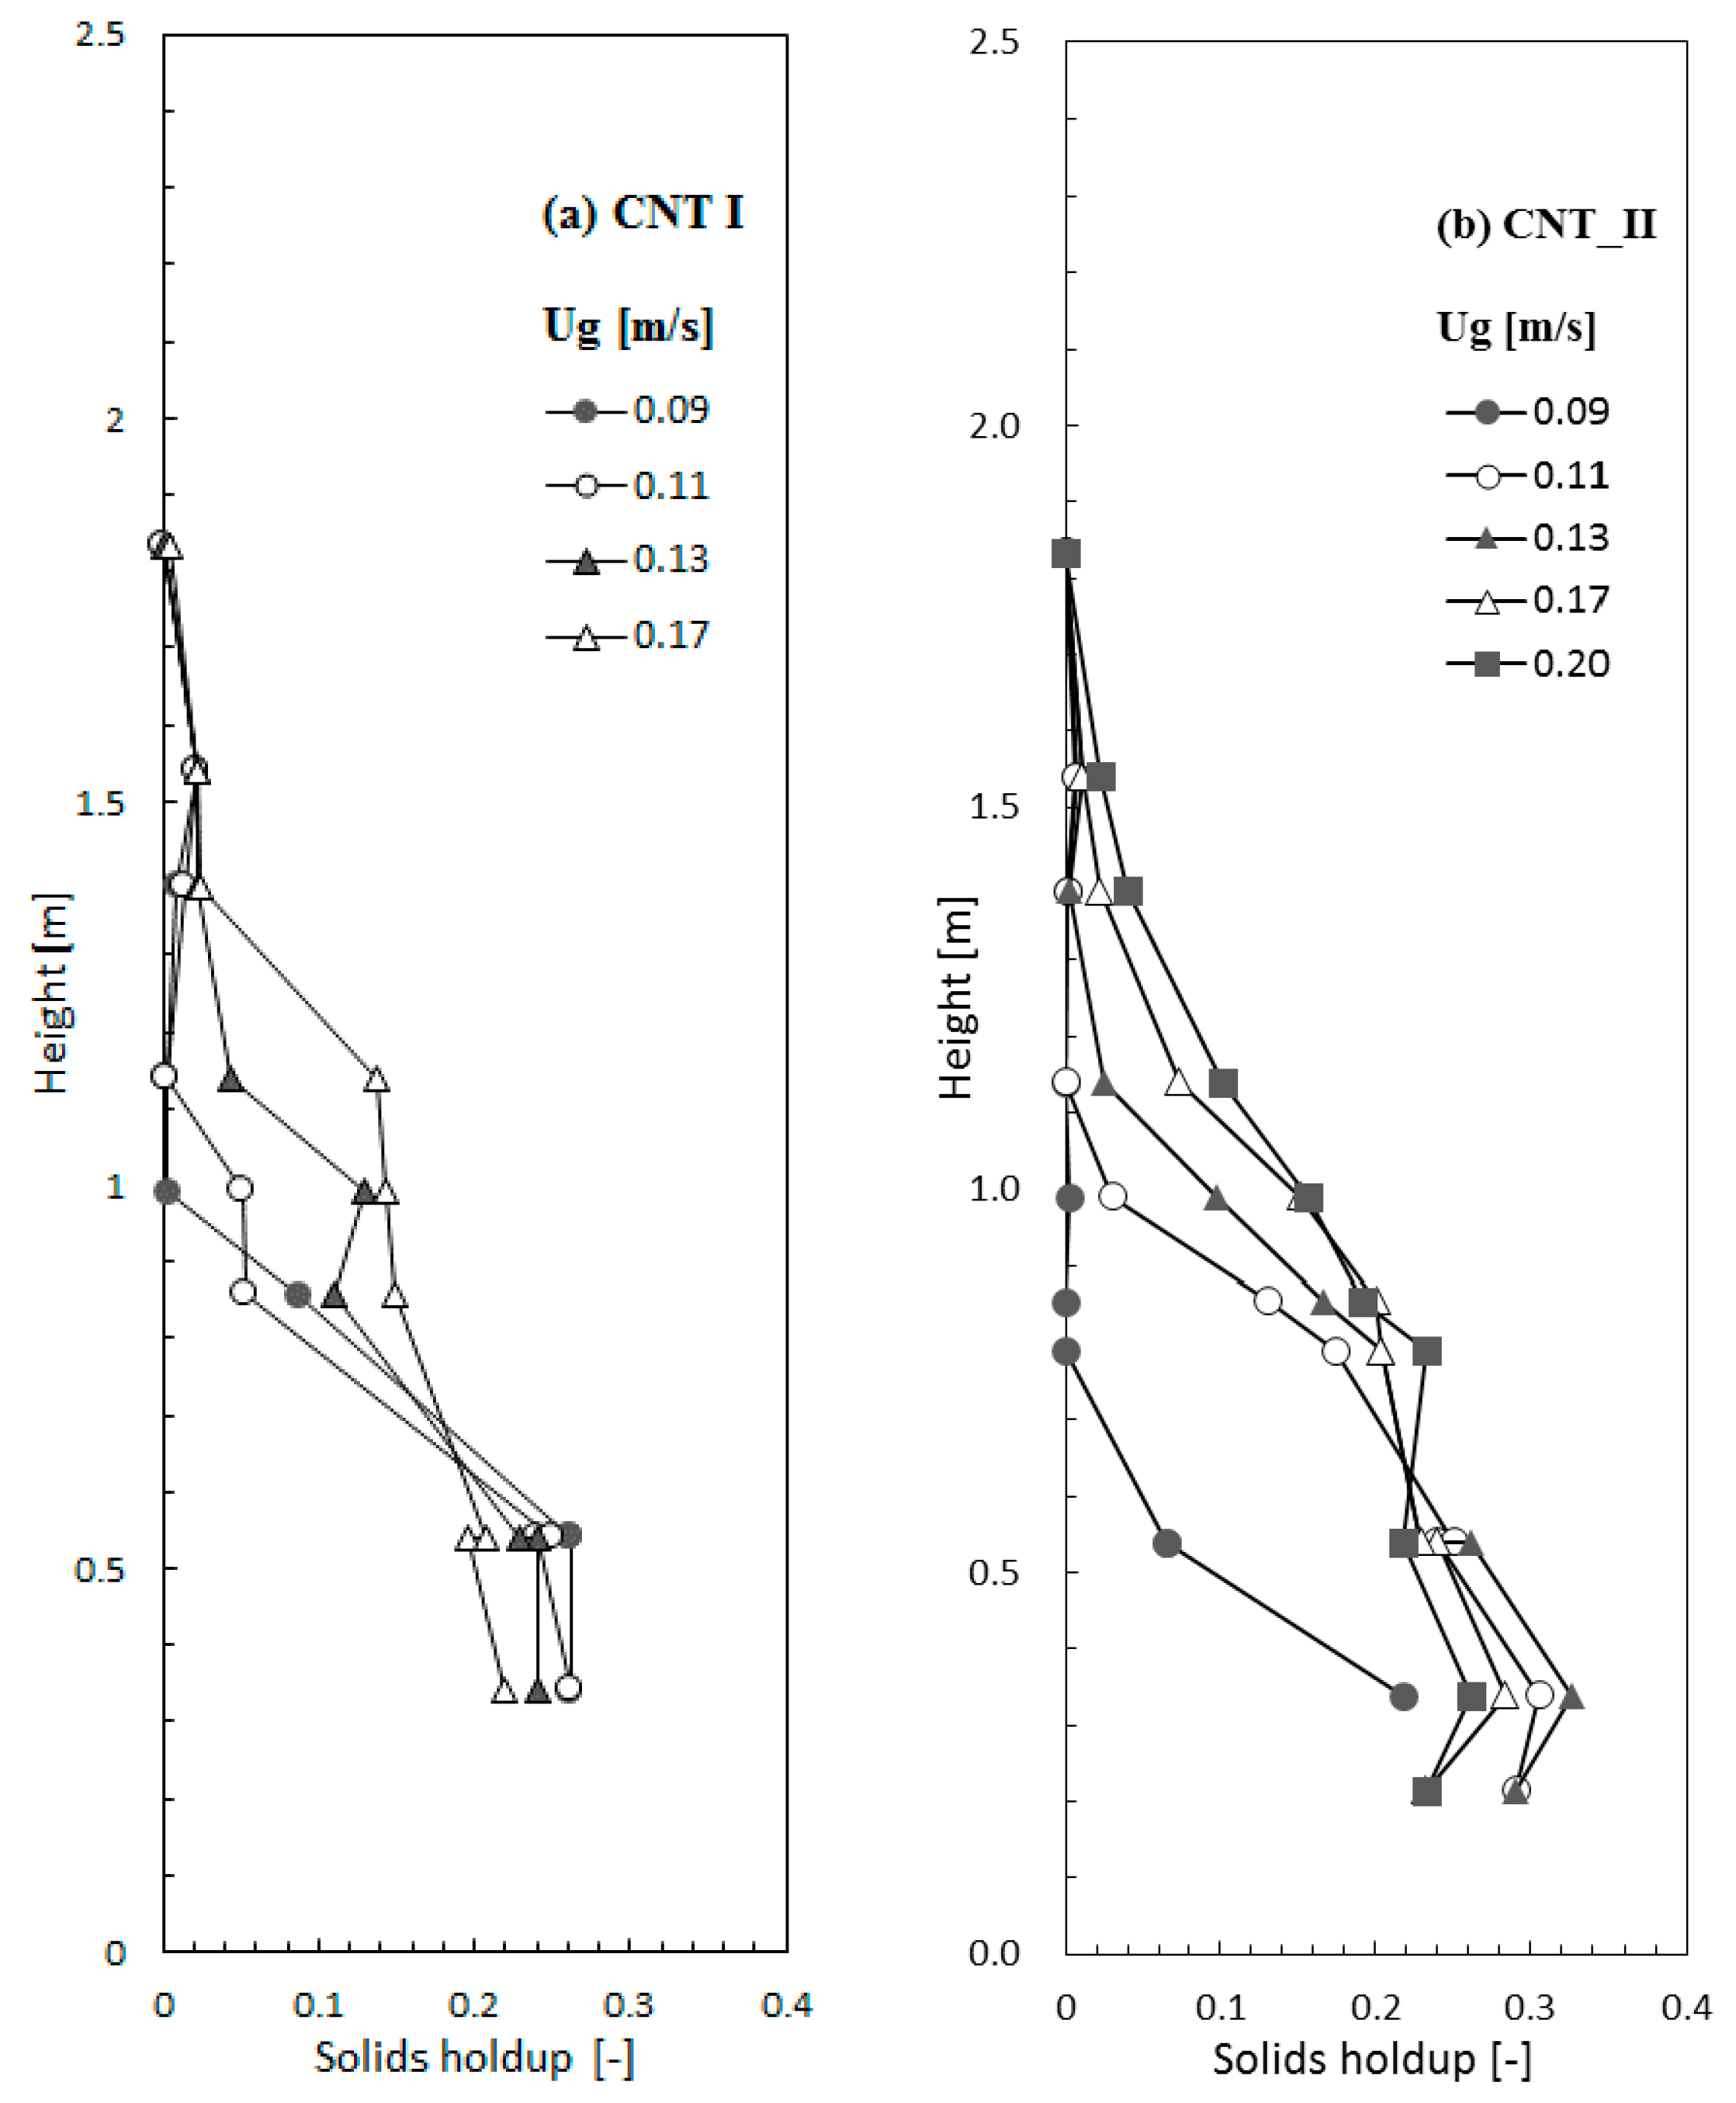
The distributions of axial solid holdup of CNT particles at different gas velocity for CNT I and CNT II are shown in Figure 4. The gas velocity was increased from 0.09 m/s to 0.20 m/s in the bubbling fluidization regime. The initial bed height was 0.6 m, but the height of the dense phase was expanded to about 0.8 m as increasing of the gas velocity up to 0.20 m/s. This expansion of the dense bed is due to the unique structure of the Multi-walled CNTs (MWCNTs). Because the nanotubes on the CNTs have a long length and a narrow diameter, they become entangled easily during the growth of nanotubes on the particle surface. Then primary entangled MWCNTs between particles were formed like a chain-like structure [2]. The arrangement of CNT particles extends to the entire bed through the contact points between the networks of particles in the dense bed [4]. A dense bed with the entangled particle bed expands toward the top of the reactor as the gas velocity increases. The bed expansion is clearly observed in the CNT II with large mean size as in Figure 4b, indicating that the greater the particle size, the greater the entanglement between particles.
The solid holdup (ϵs) is an indicator to show how many CNTs are distributed along the reactor height if the bed is in fluidization state by the Equation (1) [16].
where ∆L is distance between two taps for the pressure drop measurement. The shape of the solid holdup distribution of the CNT particles showed an S-shape with a lower-dense phase, middle-transition region and an upper-dilute phase observed in a typical bubbling fluidized bed reactor. As the gas phase velocity increased, the solid holdup of the dense phase decreased. Also, the solid holdup in the transition region between the dense and dilute phases showed a tendency to increase due to the increase of drag on the CNT particles. In the dilute phase in freeboard region of the reactor, the solid holdup was also increased due to the increase of the particles entrainment by the increased gas velocity. The shape of the solid holdup distributions did not differ between the CNT I and CNT II particles. In the case of CNT I with small mean size, the solid holdup in the dilute phase was relatively higher than that of CNT II because the CNT I particles were easily entrained at a lower gas velocity. Meanwhile, the CNT II particles do not easily rise at the same velocity but stay at the bottom of the reactor, so the solid holdup in the dense bed was higher than the CNT I. And, the particles ejected from the bed surface are easily descended by the gravity, so that the solid holdup is relatively higher than that of CNT I in the transition region where the rising and falling of the particles coexist. Specifically, more pronounced particle scattering and aggregated particles were observed near the bed surface (0.7–1.0 m) in the CNT II experiment.
ϵs = ∆P/[∆L(ρp − ρg)g]
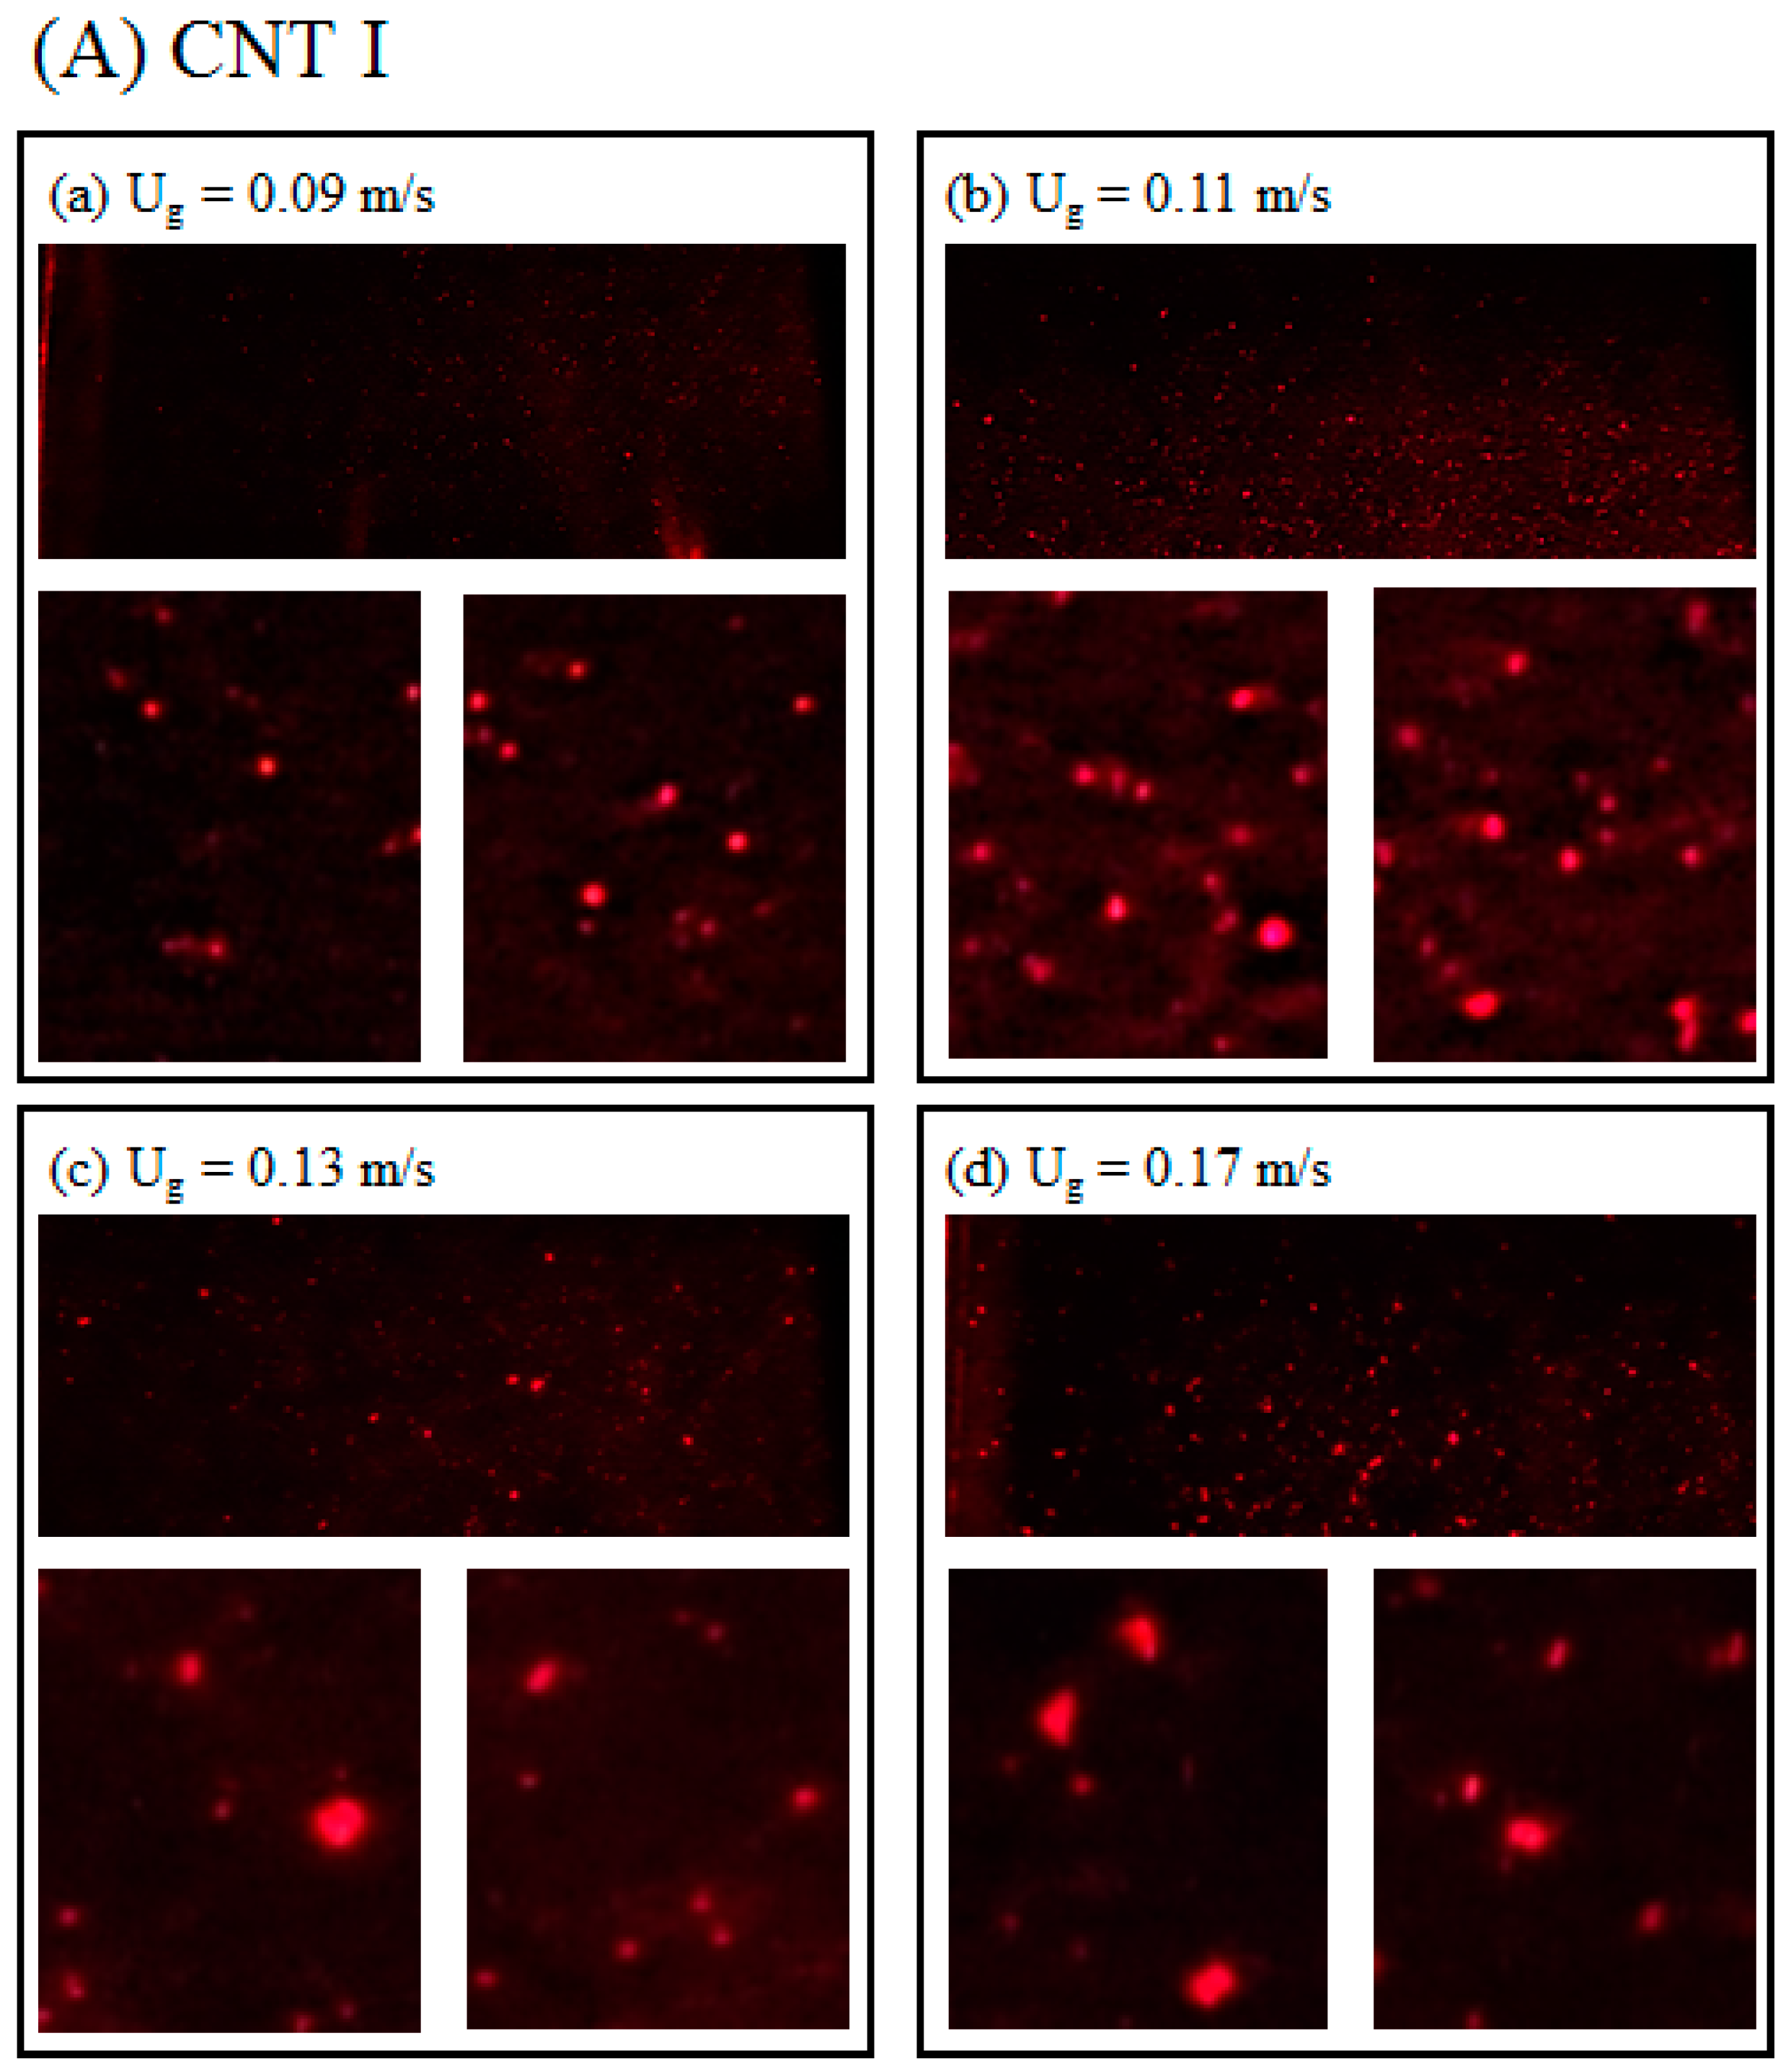
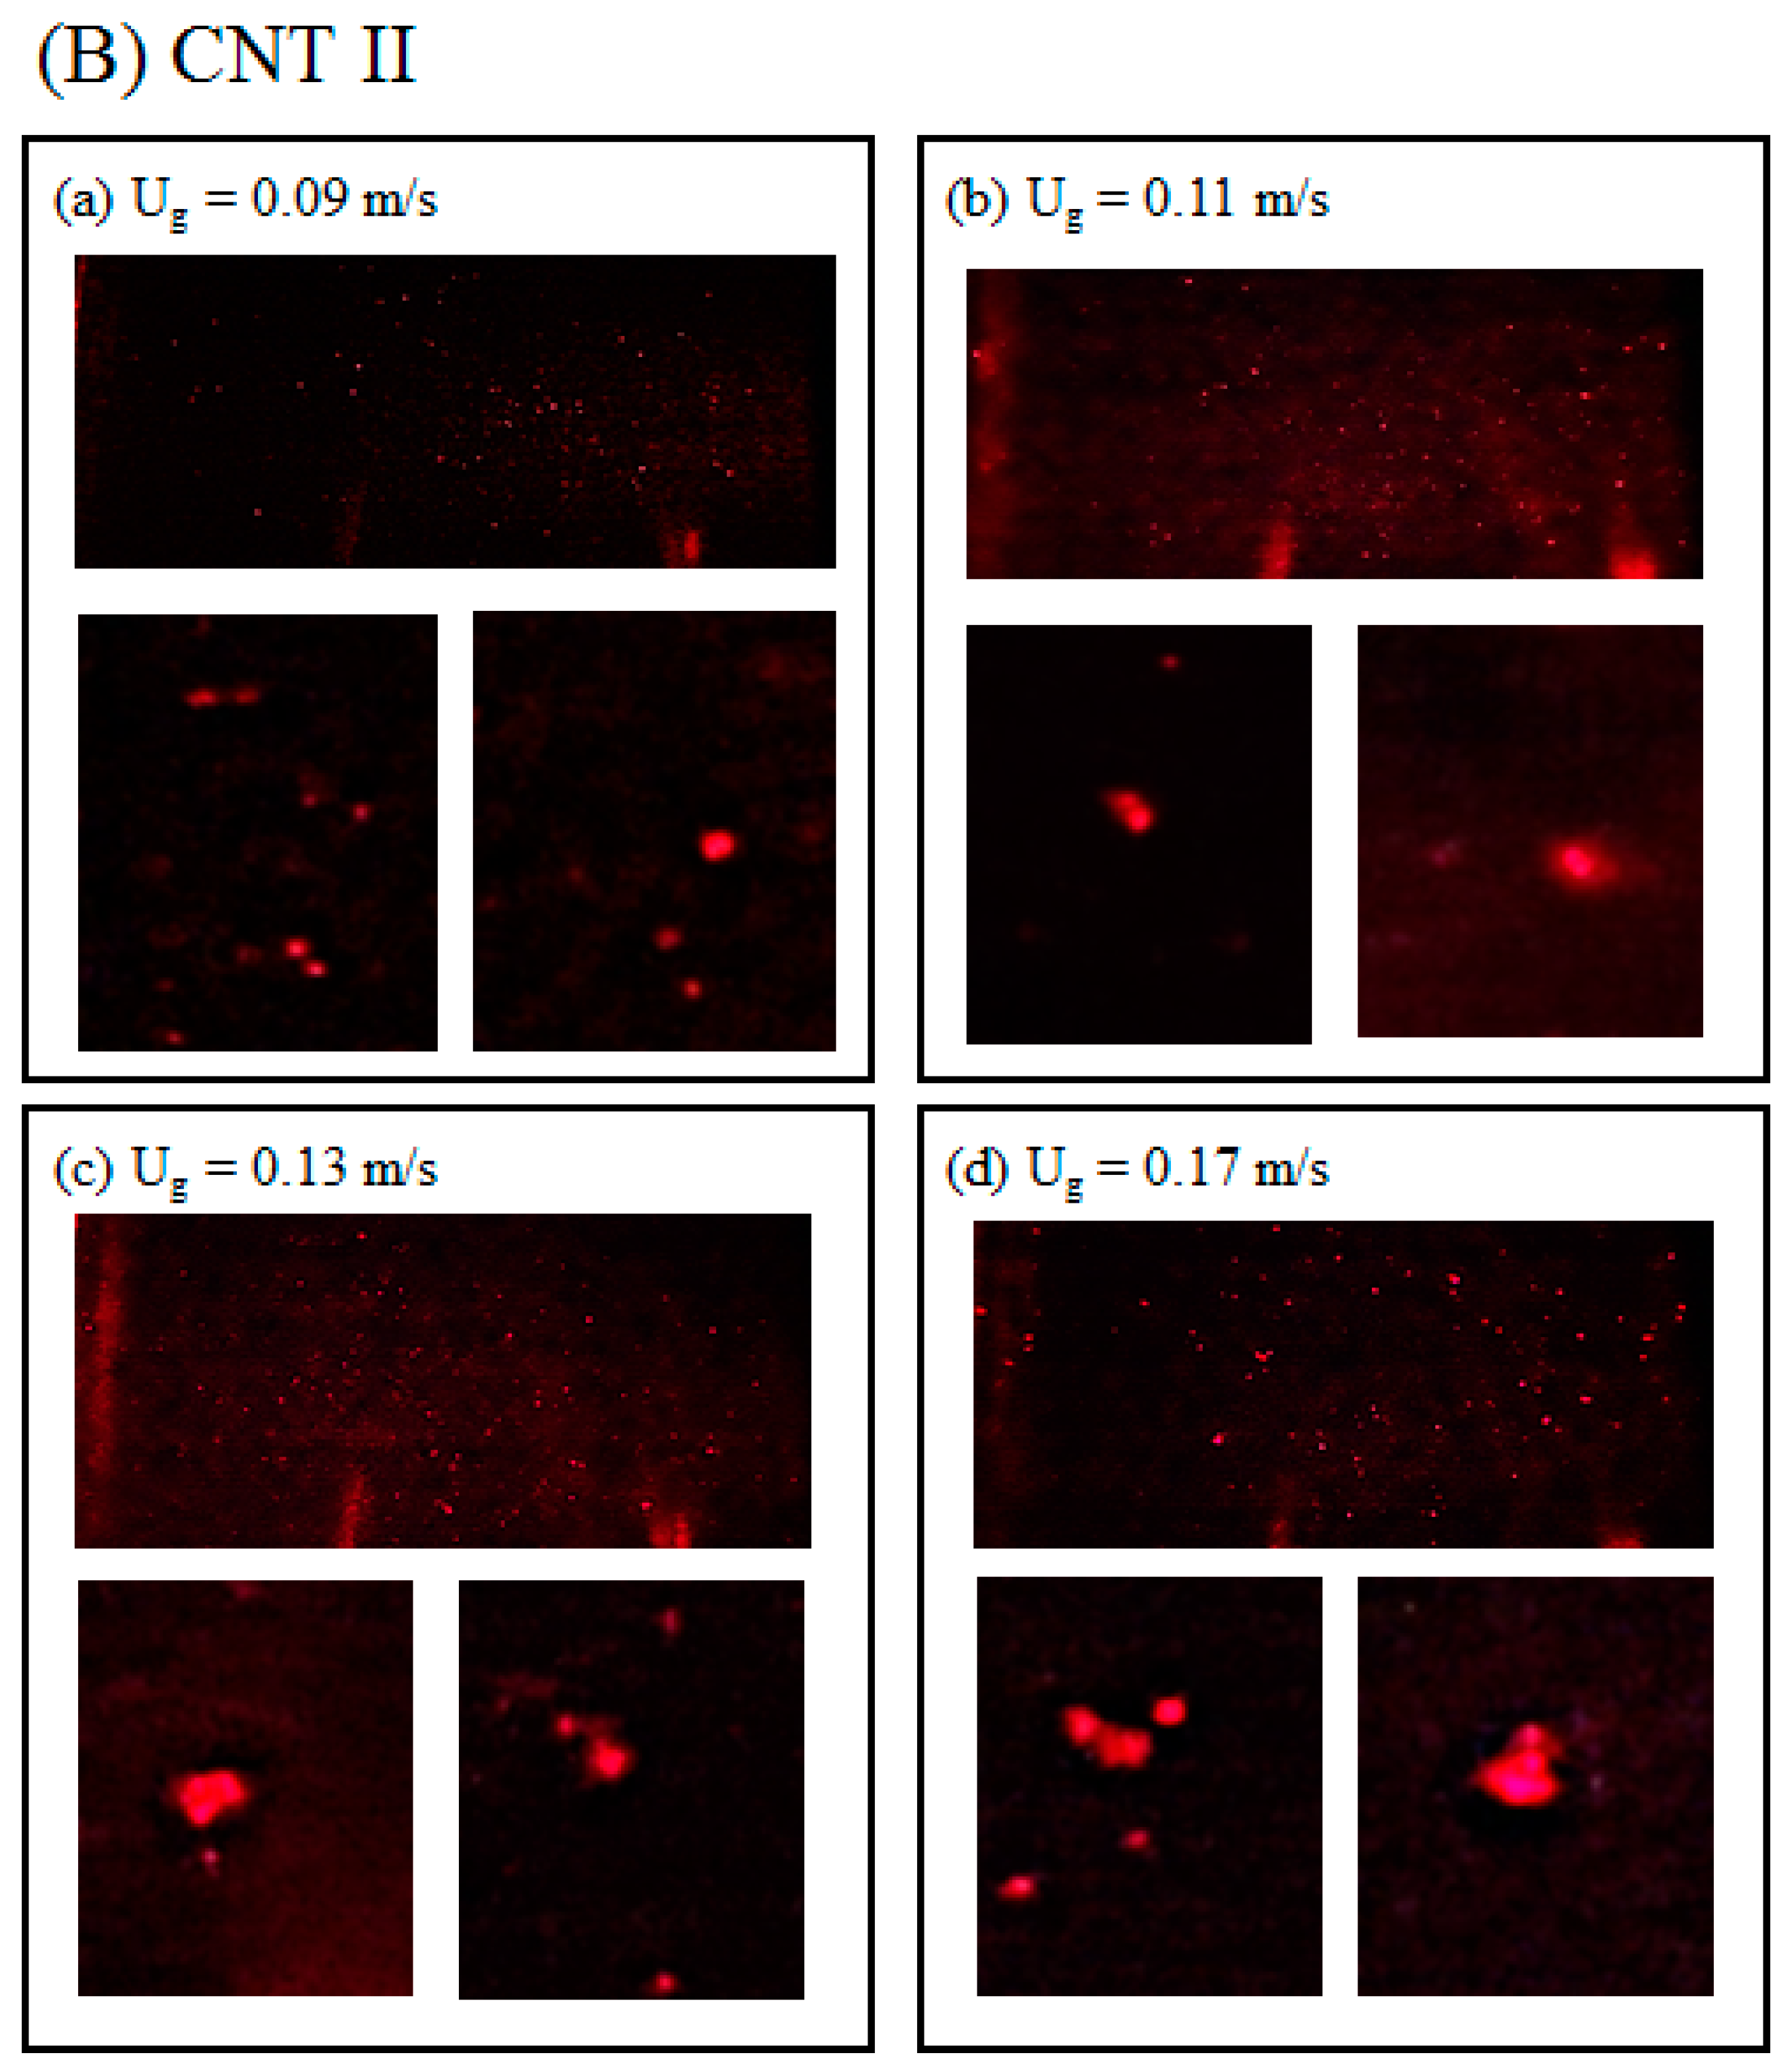
The sizes and shape properties of the CNT aggregates were visualized and measured in the freeboard of the fluidized bed. Figure 5 shows the images of the aggregates and typical aggregates shapes on the light sheet in the dilute phase at different gas velocity. The bright spots represent particle aggregates. The aggregates have different size and shape depending on the gas velocity and the CNT particle type. The volume fraction of the aggregates was increased with increasing of gas velocity. The observed number of the CNT I aggregates was higher than that of the CNT II at the same gas velocity due to the higher entrainment of the smaller particles. Both the CNT I and CNT II were found to increase in the aggregates size as the gas velocity increased. Interestingly, the changes in aggregate shape with gas velocity were different for the two particles. At low gas velocities, it is observed that the aggregates of both CNTs were close to the circle and had smooth surface. However, the CNT II particles had a relatively non-uniform shape and more aggregates with several particles attached to each other compared to the CNT I particles above 0.13 m/s of gas velocity.
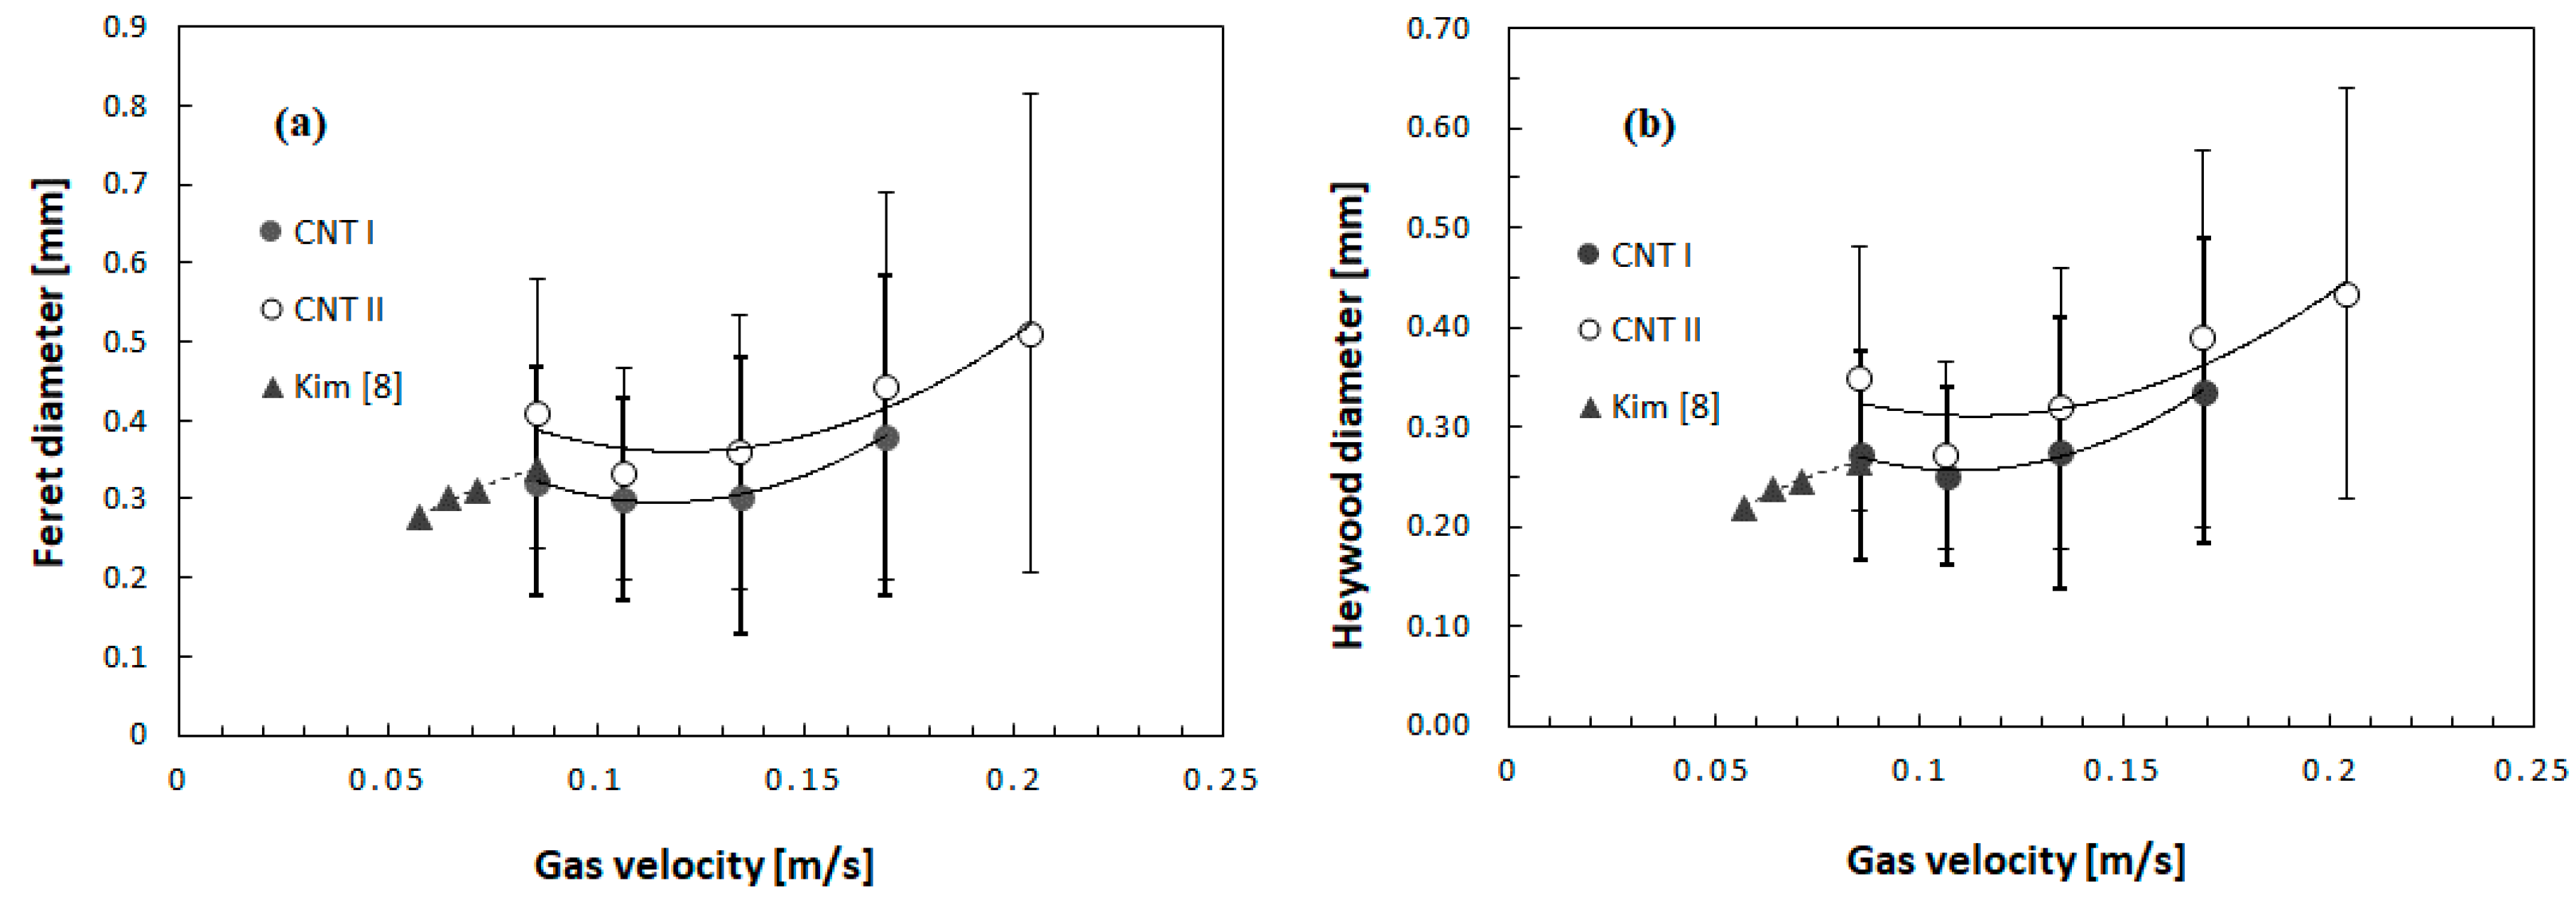
Figure 6 shows the Feret diameter and the Heywood diameter variations of the CNT aggregates in the dilute phase with the gas velocity. As shown in the figure, the mean diameter of the aggregates increased as the gas velocity increased. In comparison between the CNTs, the aggregate size of CNT II was larger than that of the CNT I, but both CNTs show a similar tendency in change of the aggregates size with gas velocity. This means that the gas velocity is an important factor in the change of aggregate size. These results are consistent with the results of Kim [8], which reported that the aggregate diameter of multi-walled CNT particles in the dilute phase increased with gas velocity as in the Figure 6.
The variation of the aggregates size in the dilute phase with gas velocity depends on the aggregation due to the contact between the CNT particles and the frequency of the rising and falling individual particles [6,8]. The increase in the aggregates size with increasing gas velocity is primarily due to the entrainment of large aggregates formed in the dense phase into the dilute phase. However, at the same time, the amount of entrained small CNT particles also increases, so that the average diameter shows a minimum value around 0.11 m/s. However, the mean diameters increase for further increases of gas velocity, even as the entrainment rate of the smaller particles increases, which is due to the formation of the larger aggregates by the strong van der Waals forces between the small CNT particles or between the small particles and the primary aggregates [17]. It is also believed that the entrained nanotubes, which are separated from the particles by inter-particle attrition in the dense bed, contribute to the increase of the aggregates size by attaching to other particles in the dilute phase [18]. This is better explained later in Figure 9 on the particle number in the aggregates.
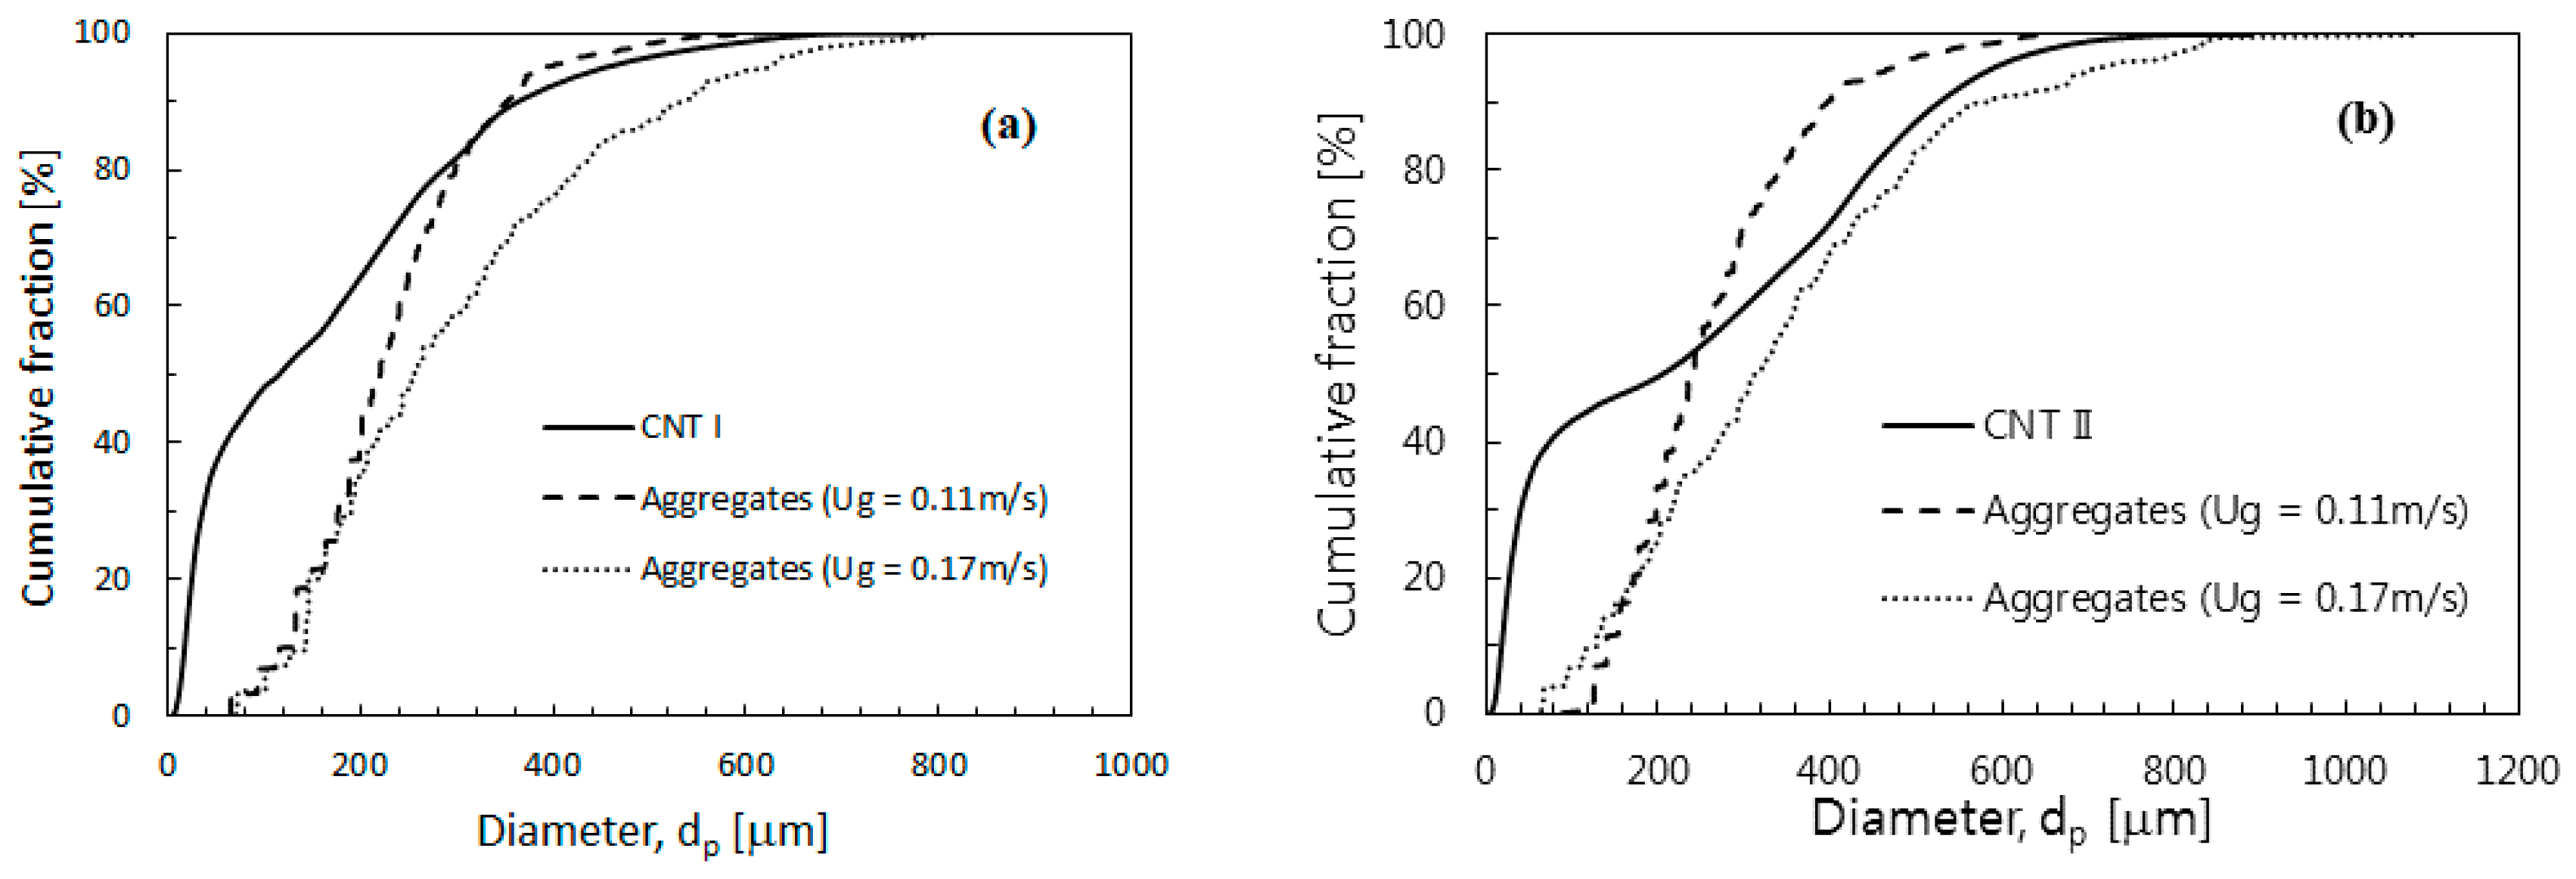
The difference in size change between the CNT I and CNT II can be clarified by comparing the initial size distributions of the both CNTs and the changes in aggregates size distribution at each gas velocity as shown in Figure 7. It is seen that the aggregates size changes not only in the average but also in the distribution with the gas velocity. Despite the increase in the number of fine particles rising into the dilute phase of the fluidized bed, the fraction of fine particles less than 200 μm was greatly reduced in both CNTs compared to the initial particle size distribution. This indicates that the fine particles formed aggregates of larger size by mutual adhesion by the cohesive force. This becomes clearer at a high gas velocity of 0.17 m/s, where particles larger than the initial mean size of each CNT are significantly increased. In comparison between the CNTs, the particle size distribution of the CNT I shows a larger change than CNT II, because the CNT I with smaller size and larger surface area has stronger cohesive force than the CNT II particles. In addition, the nanotubes separated from the particles would have been further aggregated into sufficiently cohesive CNT I, contributing to the larger change in the size distribution of the CNT I.
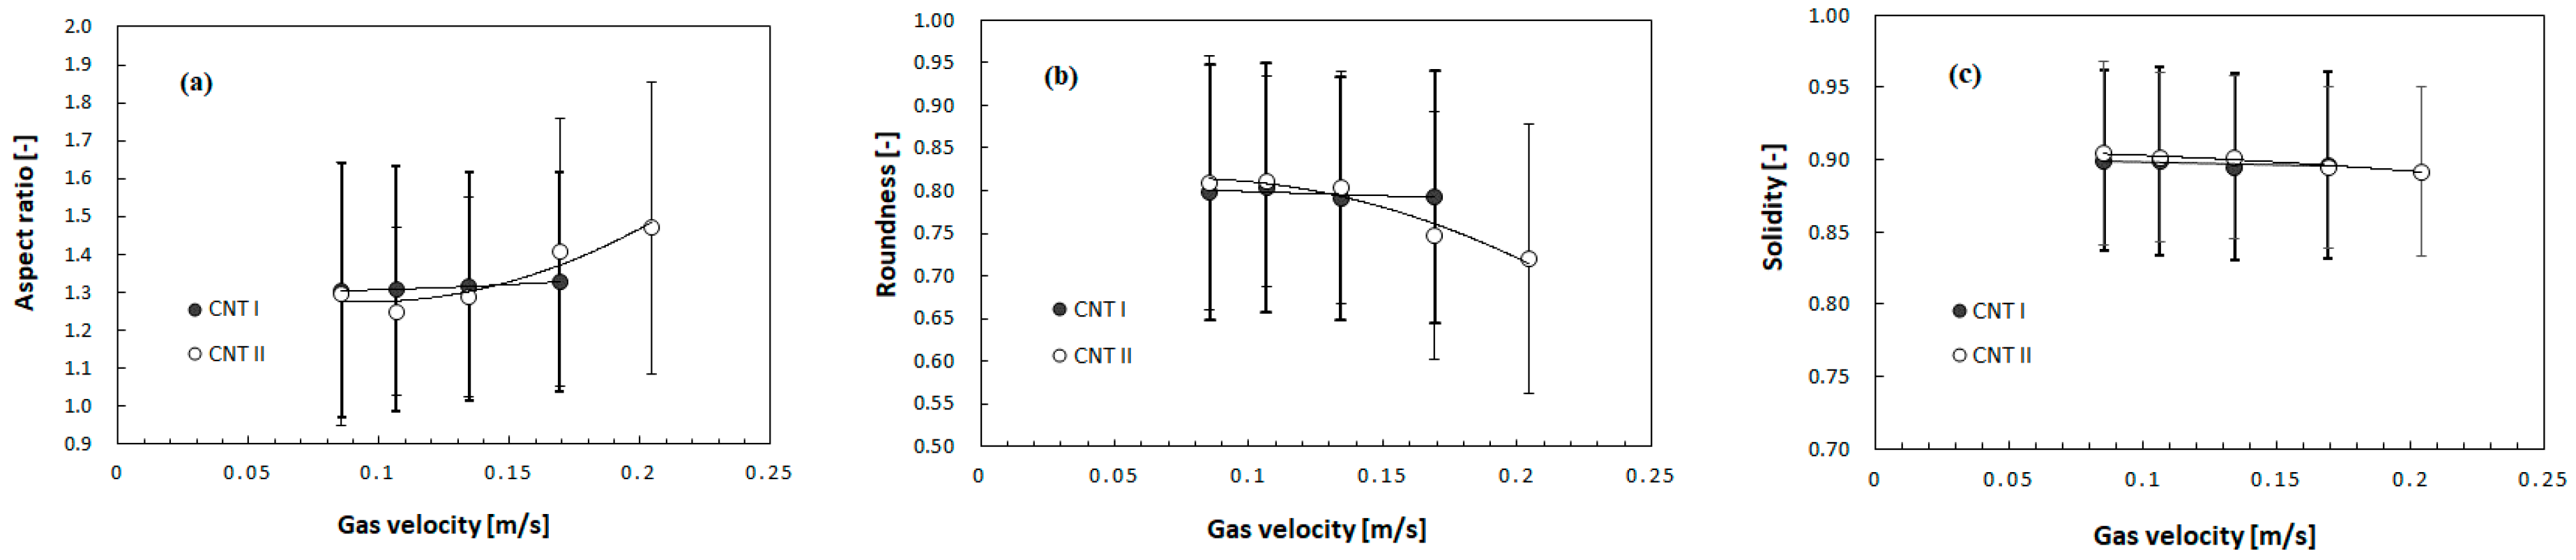
Effect of gas velocity on shape factors of the CNT aggregates in the dilute phase is shown in Figure 8. The aspect ratio increases with increasing of gas velocity due to the increase of aggregation between the particles as shown in Figure 8a. The aspect ratio of CNT I showed a moderate increase, but the CNT II showed a sharp increase after 0.13 m/s, indicating that the factors contributing mainly to the aggregation of CNT particles are different between the CNTs. As mentioned in Figure 7, the CNT I aggregates are formed and grown mainly due to the aggregation of inter-particles and particle- nanotubes as a secondary contributor [18]. The CNT II particles have the enhanced physical entanglement between large particles and aggregates with increasing the gas velocity, resulting in the rapid increase of the aspect ratio. These results coincide well with the study of Horio et al. [11], which reported the formation of FCC (Fluid Catalytic Cracking) catalyst aggregates with high aspect ratio in the dilute phase of the circulating fluidized bed. However, there is a difference compared to their study in that the increase of the aspect ratio in the CNT aggregates is due to physical factor such as the entanglement of the nanotubes on the particles in addition to the inter-particular cohesive force. Figure 8b,c show the variations in roundness and solidity of the aggregates with gas velocity. As the gas velocity increased, both roundness and solidity decreased, and the decrease was larger in the CNT II. The rapid decrease of the CNT II roundness is due to the physical entanglement of each CNT particles, thereby forming an aggregate with non-uniform shape as shown and discussed in Figure 5 and Figure 8a. On the other hand, a gradual decrease in the roundness of the CNT I particles is because the fine particles and the separated nanotubes are evenly adhered to the surface of the particles or aggregates during the inter-particle aggregation. This also results in a gradual reduction in the solidity by reducing the formation of concavities that can occur during the aggregate formation.
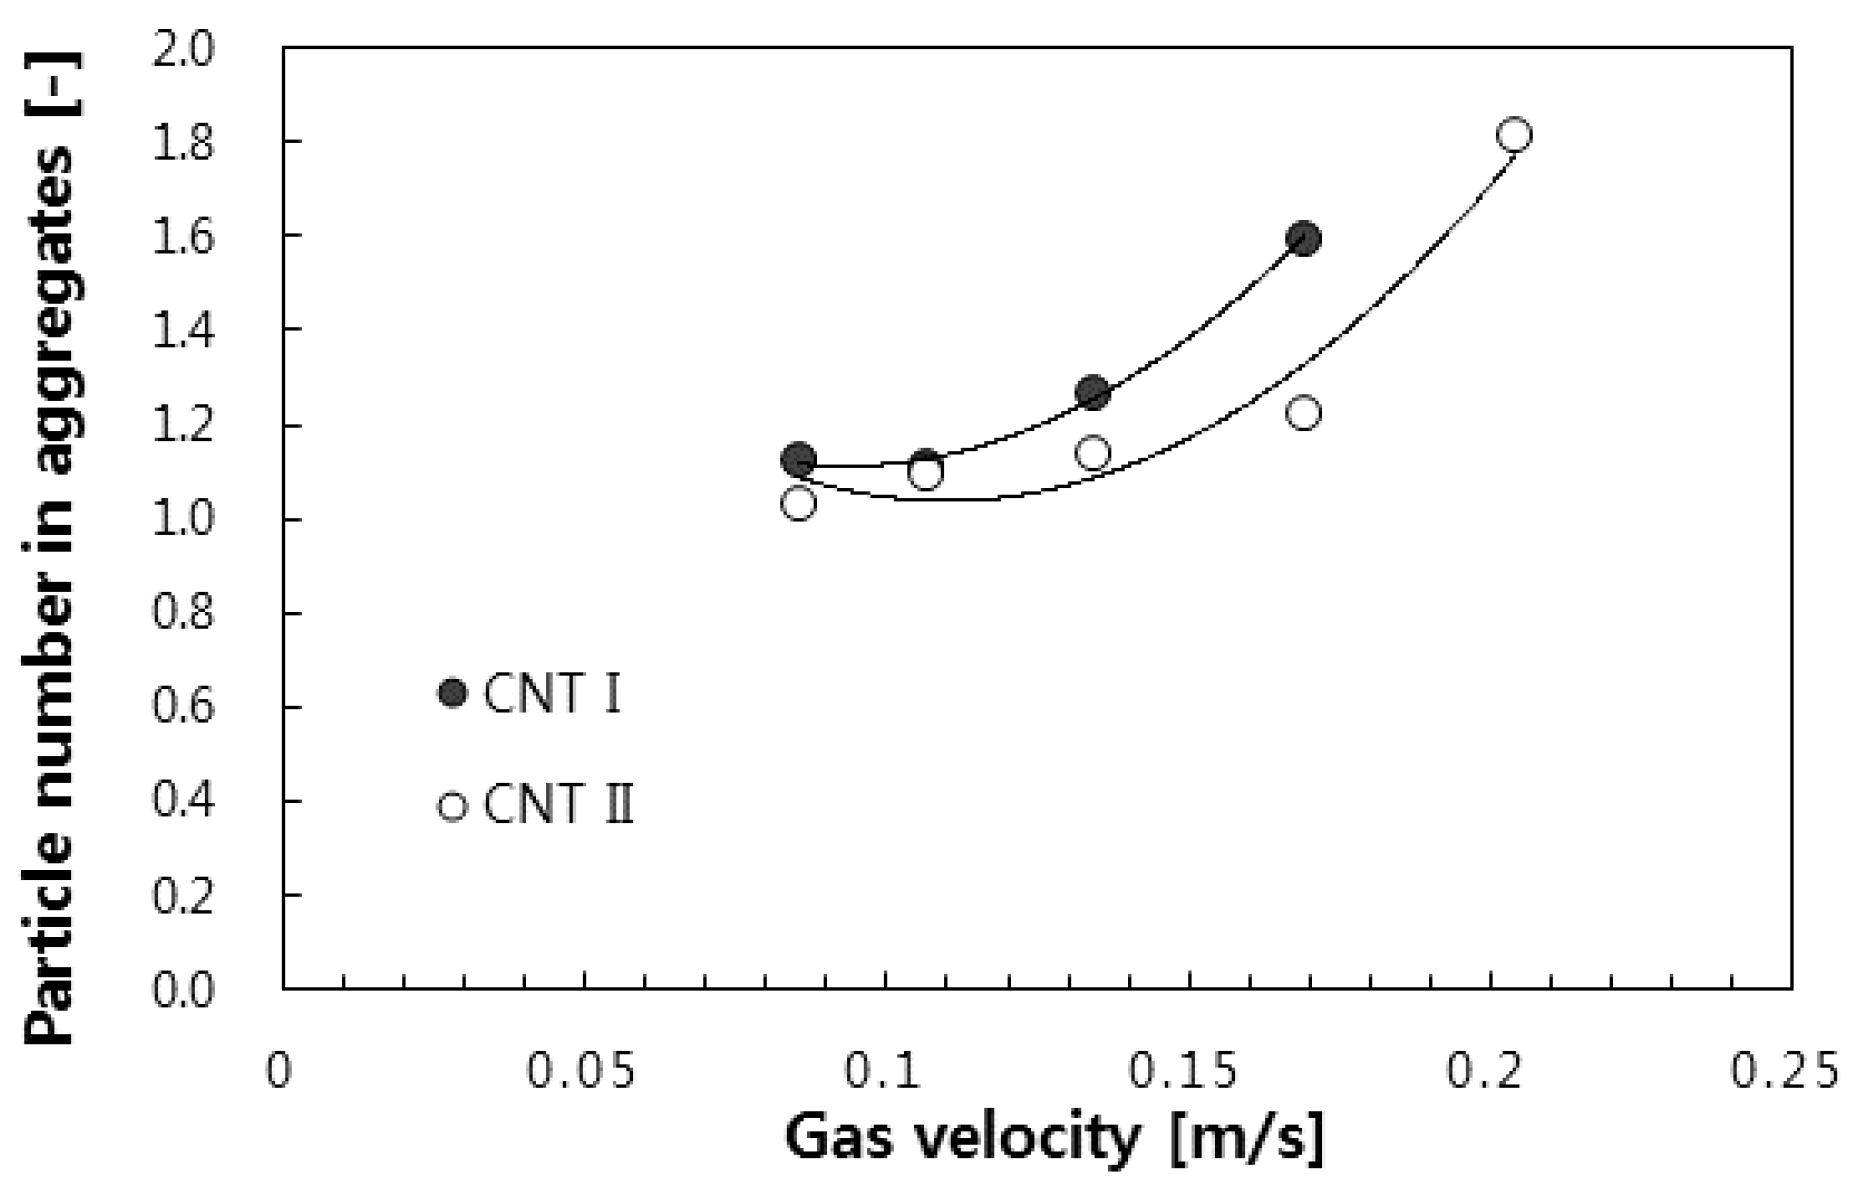
The effect of gas velocity on the number of the CNT particles in the aggregates is shown in Figure 9. Since the CNT particles used in this study are prepared by growing carbon nanotubes on the iron catalysts [19], the iron catalysts having high reflectivity show strong bright spots when the particles are irradiated with laser light. Therefore, the number of CNT particles contributing to the formation of aggregates can be determined by measuring the number of catalysts. In the experimental gas velocity range, the number of CNT particles found in the aggregates increased from 1.1 to 1.5–1.8 per aggregate, and the increasing rate of the number was relatively higher at the CNT I with large surface area due to the strong cohesion at the same gas velocity. However, the particle number in the aggregates is relatively small, and cannot be fully explained by inter-particle aggregation as an only cause of aggregate formation, considering the result in Figure 7 on the size change of aggregate.
It is once again proven that the separated nanotubes contribute significantly to the formation of the aggregates in small size CNTs [17,18]. For the confirmation of the above description, the fine particles in the filter connected to the cyclone exit were recovered after the completion of experiments, and it was found that most of the particles less than 10 μm were separated nanotubes.
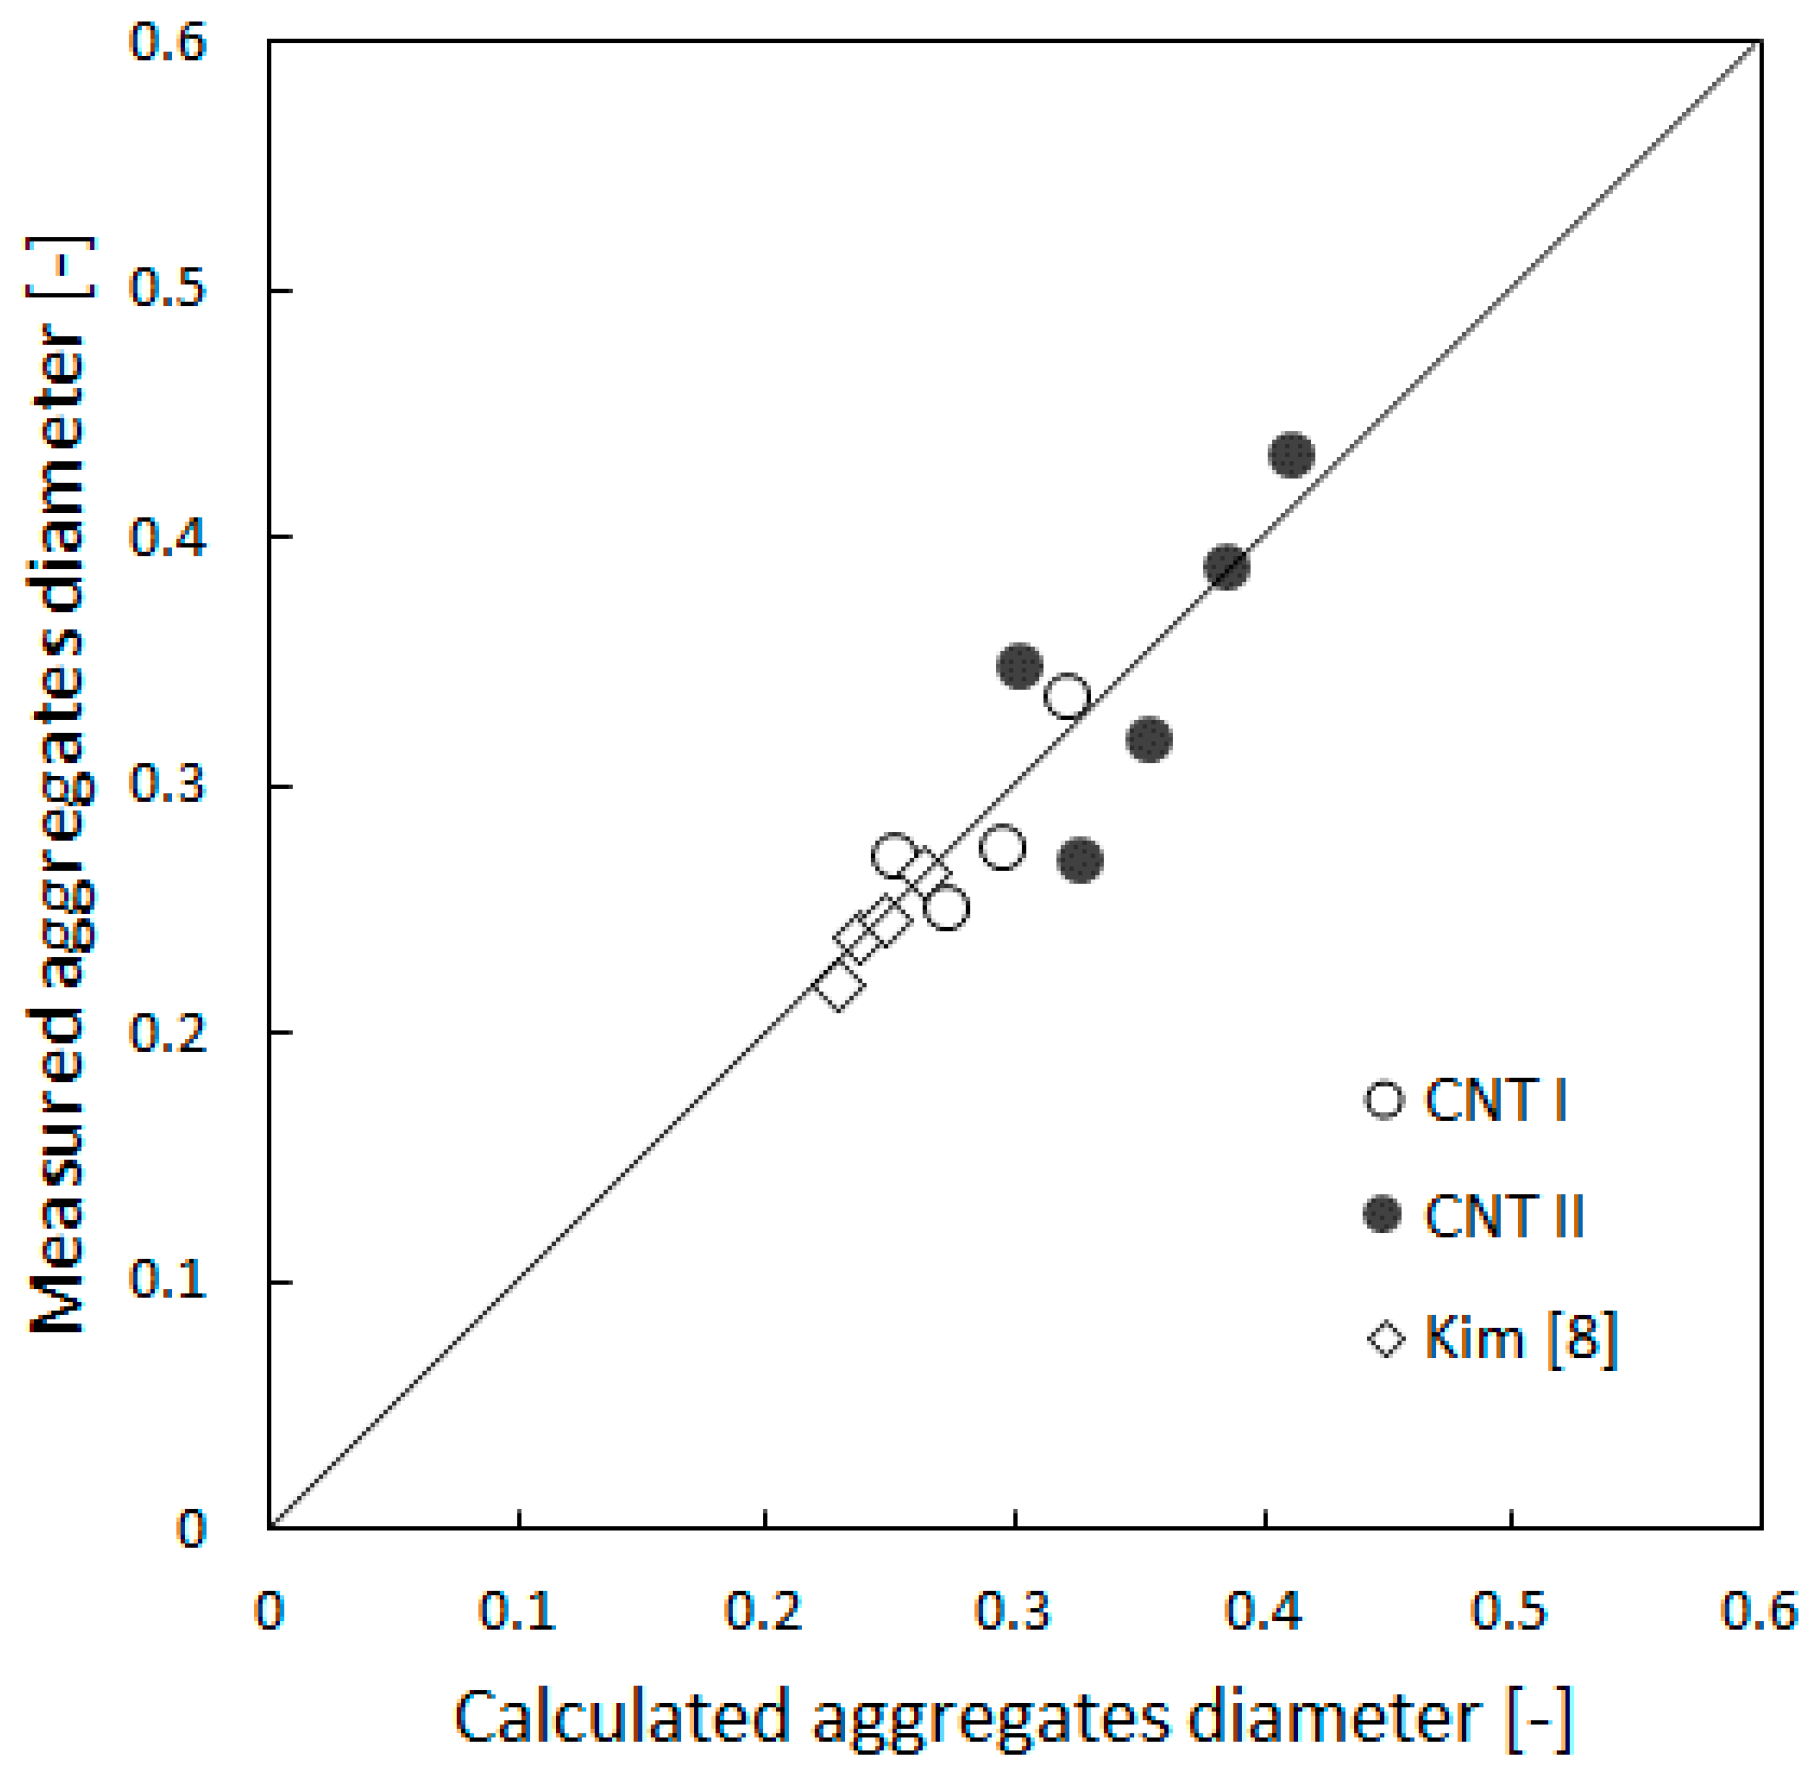
From the present results, it can be seen that the CNT particles and the primary aggregates entrained from the dense phase are aggregated into larger aggregates with various shapes, and the aggregates dominate the hydrodynamic behavior in the dilute phase of the fluidized bed. The physical properties of aggregates in the dilute phase are very important for gas-solid flow simulation, cyclone design and heat transfer modeling which require average particle size and shape factor of particles [12,13,20]. There were a few correlations predicting the aggregate size of the FCC particles in the dilute phase [11,21], but the correlation on the CNT particles has been rarely reported. In this study, firstly, a correlation for predicting the size of the CNT aggregates in the dilute phase of the fluidized bed has been proposed. The obtained Heywood diameters of the aggregates in dilute phase of the fluidized bed from this study and literature in Table 1 have been correlated with experimental parameters as following.
(dH/dp) = 4.43Ar−0.42Re1.56Frp−1.20
The correlation coefficient of Equation (2) is 0.98 and standard error is 0.100. A good agreement between the measured and calculated values from the Equation (2) was shown as in Figure 10.
4. Conclusions
The effect of the CNT particle size on the aggregates properties has been determined. The CNT aggregates size, particle number in the aggregates and aspect ratio increased but, the roundness and the solidity decreased with increasing gas velocity. Two CNT particles of different initial mean size showed different tendency in variations of the aggregates size and shape factors with gas velocity due to differences in factors contributing to the aggregate formation such as physical entanglement between large CNT particles and cohesive force between fine particles and separated nanotubes. The CNT particles with the larger mean size presented as relatively larger in the aggregate size than the smaller CNT particles at given gas velocities. The aggregates from the large CNT particles showed a sharp increase in the aspect ratio and rapid decrease in the roundness and the solidity with gas velocity. The obtained diameters of aggregates have been firstly correlated with the experimental parameter.
Funding
This research was funded by the National Research Foundation of Korea (NRF).
Acknowledgments
This research was supported by Basic Science Research Program through the National Research Foundation of Korea (NRF) funded by the Ministry of Education (NRF-2017R1D1A3B03029917).
Conflicts of Interest
The authors declare no conflict of interest.
Notifications
| Ar | Archimedes number (dp3ρg (ρp − ρg) g/μ2) (-) |
| D | reactor diameter (m) |
| dH | Heywood diameter (m) |
| dp | mean particle diameter (m) |
| Frp | particle Froude number (Ug/(g dp)0.5) (-) |
| g | gravitational constant (m/s2) |
| ∆L | distance between two taps (m) |
| Re | Reynolds number (ρg DUg/μ) (-) |
| ∆P | Pressure drop (pa) |
| Ug | gas velocity (m/s) |
| Greek | |
| εs | solid holdup (-) |
| μ | gas viscosity (kg/m s) |
| ρg | gas density (kg/m3) |
| ρp | apparent particle density (kg/m3) |
References
- Wang, Y.; Wei, F.; Luo, G.; Yu, H.; Gu, G. The large-scale production of carbon nanotubes in a Nano-Agglomerate Fluidized-Bed Reactor. Chem. Phys. Lett. 2002, 364, 568–572. [Google Scholar] [CrossRef]
- Jeong, S.W.; Lee, J.H.; Kim, J.; Lee, D.H. Fluidization behaviors of different types of multi-walled carbon nanotubes in gas-solid fluidized beds. J. Ind. Eng. Chem. 2016, 35, 217–223. [Google Scholar] [CrossRef]
- Yen, Y.; Huang, M.; Lin, F. Synthesis carbon nanotubes by a novel method using chemical vapor deposition-fluidized bed reactor from solid-stated polymers. Diam. Relat. Mater. 2008, 17, 567–570. [Google Scholar] [CrossRef]
- Hakim, L.F.; Portman, J.L.; Casper, M.D.; Weimer, A.W. Aggregation behavior of nanoparticles in fluidized beds. Powder Technol. 2005, 160, 149–160. [Google Scholar] [CrossRef]
- Peng, Z.; Doroodchi, E.; Evans, G.M. Influence of primary particle size distribution on nanoparticles aggregation and suspension yield stress: A theoretical study. Powder Technol. 2012, 223, 3–11. [Google Scholar] [CrossRef]
- Jeong, S.W.; Lee, D.H. Estimation of agglomerate size of multi-walled carbon nanotubes in fluidized beds. Adv. Powder Technol. 2017, 28, 2706–2712. [Google Scholar] [CrossRef]
- Horio, M.; Kobylecki, R.P.; Tsukada, M. Handbook of Fluidization and Fluid-Particle Systems, 1nd ed.; Marcel Deckker Inc.: New York, NY, USA, 2003; pp. 643–704. [Google Scholar]
- Kim, S.W. Measurement of carbon nanotube agglomerates size and shape in dilute phase of a fluidized bed. Korean Chem. Eng. Res. 2017, 55, 646–651. [Google Scholar]
- Wang, X.S.; Palero, V.; Soria, J.; Rhodes, M.J. Laser-based planar imaging of nano-particle fluidization: Part-I-determination of aggregate size and shape. Chem. Eng. Sci. 2006, 61, 5476–5486. [Google Scholar] [CrossRef]
- Velarde, I.C.; Gallucci, F.; Annaland, M.V. Development of an endoscopic-laser PIV/DIA technique for high-temperature gas-solid fluidized beds. Chem. Eng. Sci. 2016, 143, 351–363. [Google Scholar] [CrossRef]
- Horio, M.; Kuroki, H. Three-dimensional flow visualization of dilutely dispersed solids in bubbling and circulating fluidized beds. Chem. Eng. Sci. 1994, 49, 2413–2421. [Google Scholar] [CrossRef]
- Kim, S.W.; Ahn, J.Y.; Kim, S.D.; Lee, D.H. Heat transfer and bubble characteristics in a fluidized bed heat exchanger. Int. J. Heat Mass Transf. 2003, 46, 399–409. [Google Scholar] [CrossRef]
- Kim, S.W.; Lee, J.W.; Koh, J.S.; Kim, G.R.; Choi, S.; Yoo, I.K. Formation and characterization of deposits in cyclone dipleg of a commercial RFCC reactor. Ind. Eng. Chem. Res. 2012, 51, 14279–14288. [Google Scholar] [CrossRef]
- Rasband, W.W. ImageJ. US National Institutes of Health; Bethesda, Maryland, USA: 1997–2012. Available online: http://rsb.info.nih.gov/ij/ (accessed on 30 June 2018).
- Arai, Y. Chemistry of Powder Production; Chapman & Hall: New York, NY, USA, 1996; pp. 215–217. [Google Scholar]
- Kim, S.W.; Kim, S.D. Void properties in dense bed of cold-flow fluid catalytic cracking regenerator. Processes 2018, 6, 80. [Google Scholar] [CrossRef]
- Kim, S.; Park, S.; Kwon, J.; Ha, K. Preparation of electrically conductive composites filled with nickel powder and MWCNT fillers. Korean Chem. Eng. Res. 2016, 54, 410–418. [Google Scholar] [CrossRef]
- Bokobza, L. Multiwall carbon nanotube elastomeric composites: A review. Polymer 2007, 48, 4907–4920. [Google Scholar] [CrossRef]
- Son, S.Y.; Lee, D.H.; Kim, S.D.; Sung, S.W.; Park, Y.S.; Han, J.H. Synthesis of multi-walled carbon nanotube in a gas-solid fluidized bed. Korean J. Chem. Eng. 2006, 23, 838–841. [Google Scholar] [CrossRef]
- Kim, S.W.; Kim, S.D. Heat transfer characteristics in a pressurized fluidized bed of fine particles with immersed horizontal tube bundle. Int. J. Heat Mass Transf. 2013, 64, 269–277. [Google Scholar] [CrossRef]
- Kim, S.W.; Namkung, W.; Kim, S.D. Solids behavior in freeboard of FCC regenerator. J. Chem. Eng. Japan 2000, 33, 78–85. [Google Scholar] [CrossRef]
Figure 1.
Characteristics of multi-walled Carbon Nanotube (CNT) particles in this study: (a) Raman spectrum analysis; (b) comparison of particle size distribution of CNT I and CNT II; (c) SEM images of CNT I; (d) SEM images of CNT II.
Figure 1.
Characteristics of multi-walled Carbon Nanotube (CNT) particles in this study: (a) Raman spectrum analysis; (b) comparison of particle size distribution of CNT I and CNT II; (c) SEM images of CNT I; (d) SEM images of CNT II.


Figure 2.
Experimental apparatus and schematic diagram of laser light sheet method.

Figure 3.
Image processing of CNT aggregates (a) Original image; (b) Removal of noise; (c) Thresholding; (d) Analyzed particle image.
Figure 3.
Image processing of CNT aggregates (a) Original image; (b) Removal of noise; (c) Thresholding; (d) Analyzed particle image.

Figure 4.
Axial solid holdup distributions of CNT particles with gas velocity (a) CNT I; (b) CNT II.
Figure 4.
Axial solid holdup distributions of CNT particles with gas velocity (a) CNT I; (b) CNT II.

Figure 5.
Original images (180 mm wide × 80 mm high) and representative aggregates at given gas velocities. (A) CNT I, (B) CNT II.
Figure 5.
Original images (180 mm wide × 80 mm high) and representative aggregates at given gas velocities. (A) CNT I, (B) CNT II.


Figure 6.
Effect of gas velocity on aggregates diameter. (a) Feret diameter; (b) Heywood diameter.

Figure 7.
Variation of CNT particle/aggregates diameter distributions with gas velocity. (a) CNT I, (b) CNT II.
Figure 7.
Variation of CNT particle/aggregates diameter distributions with gas velocity. (a) CNT I, (b) CNT II.

Figure 8.
Effect of gas velocity on aggregates shape factor. (a) aspect ratio, (b) roundness, (c) solidity.
Figure 8.
Effect of gas velocity on aggregates shape factor. (a) aspect ratio, (b) roundness, (c) solidity.

Figure 9.
Effect of gas velocity on number of CNT particles in aggregates.

Figure 10.
Comparison of the calculated Heywood diameter of aggregates and the experimental data.


Table 1.
A summary of experimental conditions of the present and previous studies.
| Particles | dp (μm) | ρp (kg/m3) | Ar (-) | Re (-) | Frp (-) | |
|---|---|---|---|---|---|---|
| This study | CNT I | 131 | 229 | 17.77 | 2.48–4.92 | 1.84–4.40 |
| CNT II | 220 | 229 | 84.18 | 2.48–5.93 | 2.39–4.72 | |
| Kim [8] | CNT | 291 | 188 | 159.76 | 1.37–2.04 | 1.08–1.60 |
© 2018 by the author. Licensee MDPI, Basel, Switzerland. This article is an open access article distributed under the terms and conditions of the Creative Commons Attribution (CC BY) license (http://creativecommons.org/licenses/by/4.0/).
Share and Cite
MDPI and ACS Style
Kim, S.W. Effect of Particle Size on Carbon Nanotube Aggregates Behavior in Dilute Phase of a Fluidized Bed. Processes 2018, 6, 121. https://doi.org/10.3390/pr6080121
AMA Style
Kim SW. Effect of Particle Size on Carbon Nanotube Aggregates Behavior in Dilute Phase of a Fluidized Bed. Processes. 2018; 6(8):121. https://doi.org/10.3390/pr6080121
Chicago/Turabian StyleKim, Sung Won. 2018. "Effect of Particle Size on Carbon Nanotube Aggregates Behavior in Dilute Phase of a Fluidized Bed" Processes 6, no. 8: 121. https://doi.org/10.3390/pr6080121
Note that from the first issue of 2016, this journal uses article numbers instead of page numbers. See further details here.