Experimental Development Process of a New Fluid–Solid Coupling Similar-Material Based on the Orthogonal Test

1
School of Resources and Geosciences, China University of Mining and Technology, Xuzhou 221116, China
2
School of Mining and Safety Engineering, Shandong University of Science and Technology, Qingdao 266590, China
*
Authors to whom correspondence should be addressed.
Processes 2018, 6(11), 211; https://doi.org/10.3390/pr6110211
Submission received: 27 September 2018
/
Revised: 23 October 2018
/
Accepted: 24 October 2018
/
Published: 1 November 2018
(This article belongs to the Special Issue Fluid Flow in Fractured Porous Media)
Abstract
:Similar-material, composed of different raw materials with different properties, is similar to the physical and mechanical properties of geotechnical media, in which raw material proportioning is an important means to control the performance of similar-material in physical simulation. On this basis, a new fluid–solid coupling similar-material was developed through proportioning tests, in which similar-material is mixed with river sand, calcium carbonate, talc powder, white cement, vaseline, antiwear hydraulic oil. The optimum proportioning test development process was established. First, the proportioning test scheme was designed based on the orthogonal test. Subsequently, test specimens were produced to obtain parameters such as density, compressive strength, tensile strength, and permeability coefficient. Then, by increasing the ingredients of the proportioning, the evolution law of parameters was obtained by range and variance analysis. Finally, four multiple linear regression equations between the parameters and similar-material ingredients were obtained, and the optimum proportioning of ingredients was further determined for different requirements. The results indicate that the selected raw materials and their proportioning method are feasible, and the results were also verified in a coal mine floor water inrush by physical simulation test. The experimental development process of a fluid–solid coupling similar-material can provide a reference for similar-material under different demand conditions.
1. Introduction
Theoretical derivation, numerical simulation and similar simulation tests are three main research methods in complex geotechnical engineering [1,2]. Similar simulation test, a reproduction of the real physical entities, can reflect the basic physical and mechanical properties of rock and soil medium based on the similarity principle [3,4,5,6]. Similar simulation test is characterized by a short cycle, low cost, and results of visual image [7,8]. To carry out similar simulation tests, the similar-material must have properties similar to those of the physical and mechanical properties of the geotechnical medium. Similar-material is composed of different raw materials with different properties, the proportioning of which is an important means to control the performance of similar-material in physical simulation for different requirements. Therefore, selection of raw materials and their proportioning is of great significance for similar simulation experiments in geotechnical engineering.
At present, selection of raw materials and their proportioning has been widely studied, but the focus of the research has been concentrated on single-phase similar-material with general solid phase [9,10,11,12,13,14,15,16,17,18], which does not mention hydration characteristics of similar-material. In addition, the effect of temperature and humidity on similar-material and its control measures have been investigated, providing evidence for the reliability of simulation results [19,20]. For the investigation on fluid–solid coupling similar-material, some progress has been achieved [21,22,23,24,25,26,27]. For example, Wang et al. [28] adopted sand and gypsum as the aggregate, vaseline and silicone oil as the cementing agent, and selected the reasonable non-hydrophilic material proportioning, configuring the fluid–solid coupling similar-material for water-protection mining. Wang et al. [29] developed new types of similar-material of fault and surrounding rock, i.e., similar-material of fault consists of sand, talc powder, gypsum, bentonite and paraffin liquid, and similar-material of surrounding rock is composed of sand, barite powder, talc powder, white cement and latex, which were applied to simulate the water inrush occurring in the Yonglian tunnel of Jiangxi Province, China. Although the abovementioned fluid–solid coupling similar-materials were applied to the geotechnical engineering, there are still some problems. (1) Similar-material containing gypsum have water absorption, water softening and disintegration problems, and it is difficult to meet the requirements of similar-material deformation and permeability; (2) Similar-material with paraffin can solve the problem of similar-material disintegration in water, but it is characterized with complexity of the configuration process, strict requirements for temperature conditions, and long preparation period. (3) Most of the effects of material ingredients proportioning on similar-material properties have been qualitatively analyzed, but there is a lack of quantitative research and a definite set of methods for determining the proportioning of similar-material for different needs in similar simulation test.
On this basis, according to the characteristics of fluid–solid coupling similar-material, the raw materials of similar-material were first selected, i.e., river sand, calcium carbonate, talc powder, white cement, vaseline, and antiwear hydraulic oil. Second, specimen parameters, such as density, compressive strength, tensile strength, and permeability coefficient were tested. Third, the analysis of similar-material properties was quantitatively carried out by range analysis, variance analysis, and regression method. Eventually, the research results were applied to the physical simulation test of the water inrush from mining coal floor.
2. Materials and Method
2.1. Materials
The fluid–solid coupling similarity theory and the raw materials of similar-material are the foundation of the optimum proportioning of ingredients.
2.1.1. Fluid–Solid Coupling Similarity Theory
The fluid–solid coupling similarity theory is mainly used to determine the similarity between the solid and fluid in the same system. The fluid–solid coupling mathematical model of continuum is used to derive the similar equation between the model and the prototype parameters [30].
Seepage equation:
where Kx, Ky, Kz are the permeability coefficients in x, y, and z directions (cm/s), Kx = Ky = Kz; p is the water pressure (MPa); S is the storage coefficient; e is the volume strain; W is the source sink term.
Equilibrium equation:
where σij,i is the stress tensor; Xj is the volume force (N/m3); ρ is the density (g/cm3); ui is the displacement (cm).
Effective stress equation:
where σij is the total stress tensor; is the effective stress tensor; α is the effective stress coefficient of Biolt; δ is the Kronker mark; ρ is the density (g/cm3).
Based on Equations (1)–(3), the similar equations between the model and the prototype parameters are as follows [31].
where CG, Cu, Cl, Cλ, Cγ, Ce, Cρ, and Ct are the similarity ratios of the shear modulus, displacement, model size, Lame constant, bulk density, volumetric strain, density, and time, respectively.
where Cl, C λ, and Ck are the similarity ratios of the model size, Lame constant, and permeability coefficient, respectively.
2.1.2. Similar-Material Components
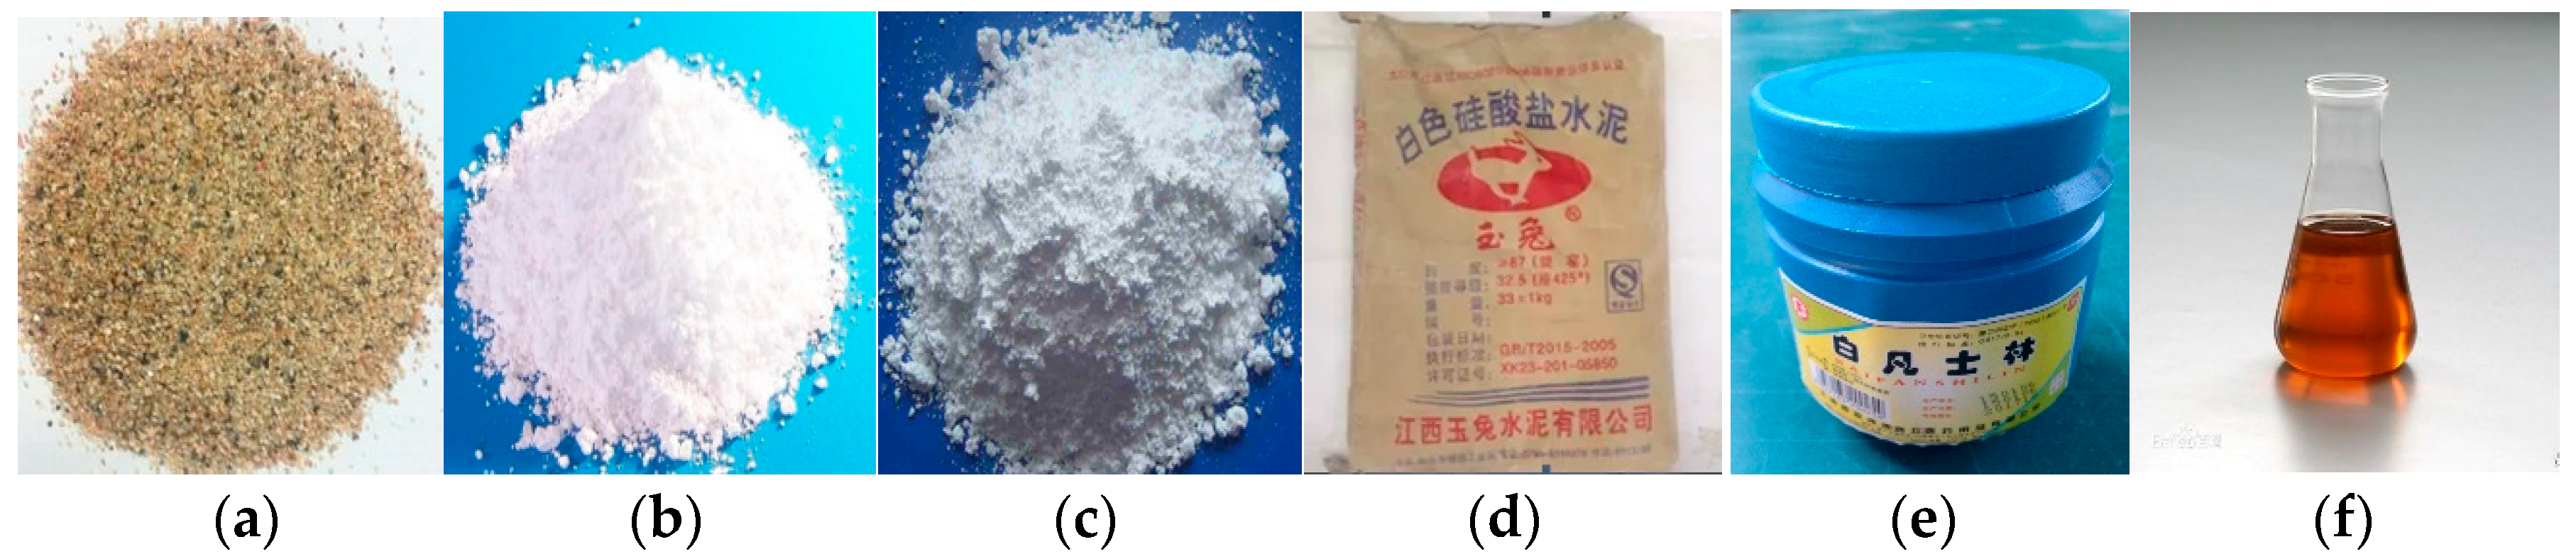
The fluid–solid coupling similar-material not only meets the requirements of solid deformation and permeability, but also conforms to the characteristics that the material is non-hydrophilic and has no obvious water softening. On this basis, river sand (Xishanlou Company, Qingdao, China), calcium carbonate (Xishanlou Company, Qingdao, China) and talc powder (Xishanlou Company, Qingdao, China)were selected as the aggregate, white cement (Xishanlou Company, Qingdao, China) and vaseline (Xishanlou Company, Qingdao, China)were selected as the cementing agent, and antiwear hydraulic oil (Xishanlou Company, Qingdao, China) was selected as the regulator based on the fluid–solid coupling theory. The raw materials of similar-material are shown in Figure 1.
(1) Aggregate: river sand, calcium carbonate, and talc powder
The grain diameter of river sand is less than 1 mm; calcium carbonate has an average particle size in the range 1–3 µm; and talc powder is 625 orders. Calcium carbonate and talc powder were cemented into larger aggregates with river sand, increasing the strength and cohesion of the material.
(2) Cementing agent: white cement and vaseline
The white cement with P.O32.5 quality has low price, and is a type of good water cementing material, which can control the whole process by improving the compressive strength, elasticity, and cohesion. Vaseline, light brown block ointment, is insoluble in water and has excellent plasticity and cementation capacity.
(3) Regulator: antiwear hydraulic oil
Antiwear hydraulic oil can reduce material dryness and increase the non-hydrophilic characteristics.
2.2. Methodology
The methodology consists mainly of three parts: the orthogonal test schemes of similar-material proportion, the fabrication of specimens, and the index parameters test of specimens.
2.2.1. Orthogonal Test Schemes of Similar-Material Proportion
The orthogonal experimental design method, the main method of partial factor design, was introduced to study the similar-material proportion. In the experiment, the result is called the index, and the parameters which may affect the test indexes are called factors. The specific conditions for each factor to be compared in the experiment are called levels [32,33].
The orthogonal test design method proposed in this study can be separated into three steps:
Step 1: Determine the factors. Four factors were set up, namely: A, the percentage of river sand in aggregate; B, the mass ratio of calcium carbonate and talc powder; C, the mass ratio of cement and vaseline; D, the percentage of hydraulic oil in the total mass of similar-material.
Step 2: Set levels for each factor. Five levels were set for each factor, as listed in Table 1.
Step 3: Design the orthogonal test design scheme by SPSS software (IBM SPSS Statistics 25.0-2017, IBM China Company Limited, Beijing, China, 2017) [34,35]. The orthogonal test design scheme was four factors and five levels, which can be expressed as L25 (54). The level values of each factor were set as input in the orthogonal experimental design module of SPSS software, leading to the schemes, as listed in Table 2.
2.2.2. Fabricating Specimens
The fabrication process of similar-material specimen is as follows (Figure 2).
- (1)
- Aggregate, cementing agent and regulator were weighed proportionately.
- (2)
- The aggregate and cement were mixed evenly, followed by adding water 0.5 times of cement.
- (3)
- Vaseline was heated to a liquid state and poured into the above mixture.
- (4)
- Antiwear hydraulic oil was added and stirred.
- (5)
- The well-mixed materials were loaded into a mold and compacted. The mold for testing specimen tensile strength is a PVC tube with a height of 25 mm and an inner diameter of 45 mm (Figure 2h).
- (6)
- Demolded and labeled, specimens were maintained for three days at room temperature.
2.2.3. Testing Index Parameters of Specimens
The fluid–solid coupling similar-material needs to meet the requirements of solid deformation, permeability, and hydration characteristics. Therefore, the index parameters of specimen such as hydrophilicity test, tensile strength, compressive strength, and permeability coefficient were tested.
(1) Hydrophilicity test
The water absorption rate can be used to indicate the hydrophilicity of similar-material [36,37]. The greater the water absorption rates of the specimens, the stronger the hydrophilicity. The water absorption rate can be represented by Equation (6).
where a is the water absorption rate (%); mwater is the specimen weight after immersion (g); mdry is the specimen weight before immersion (g).
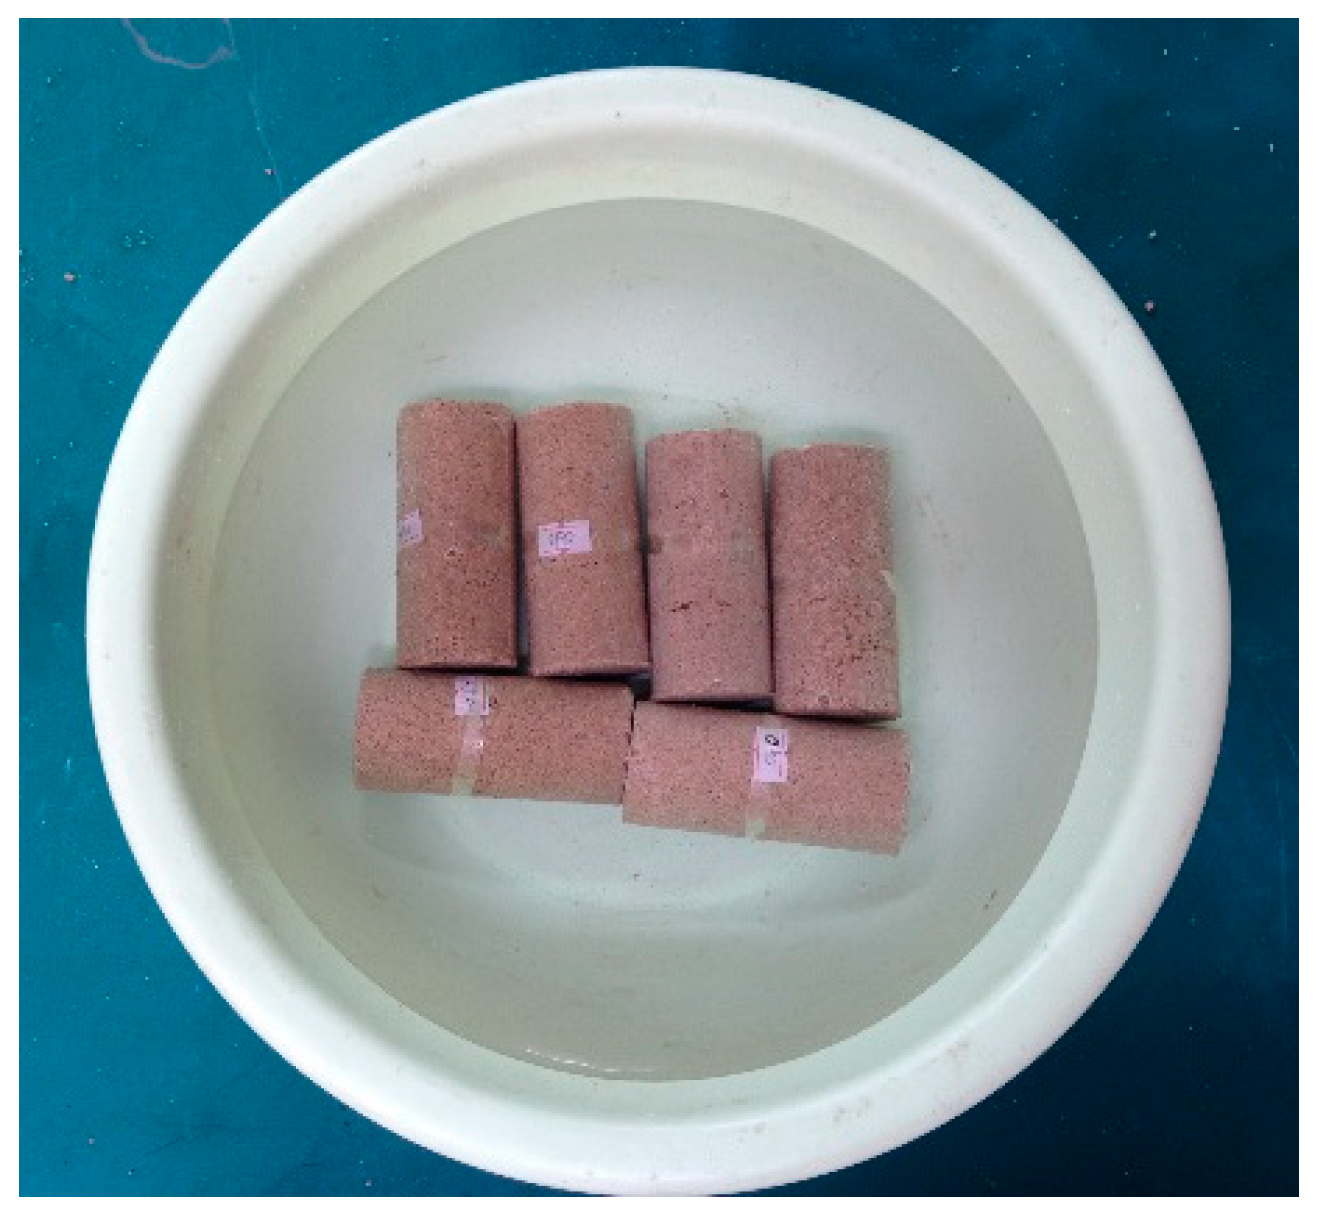
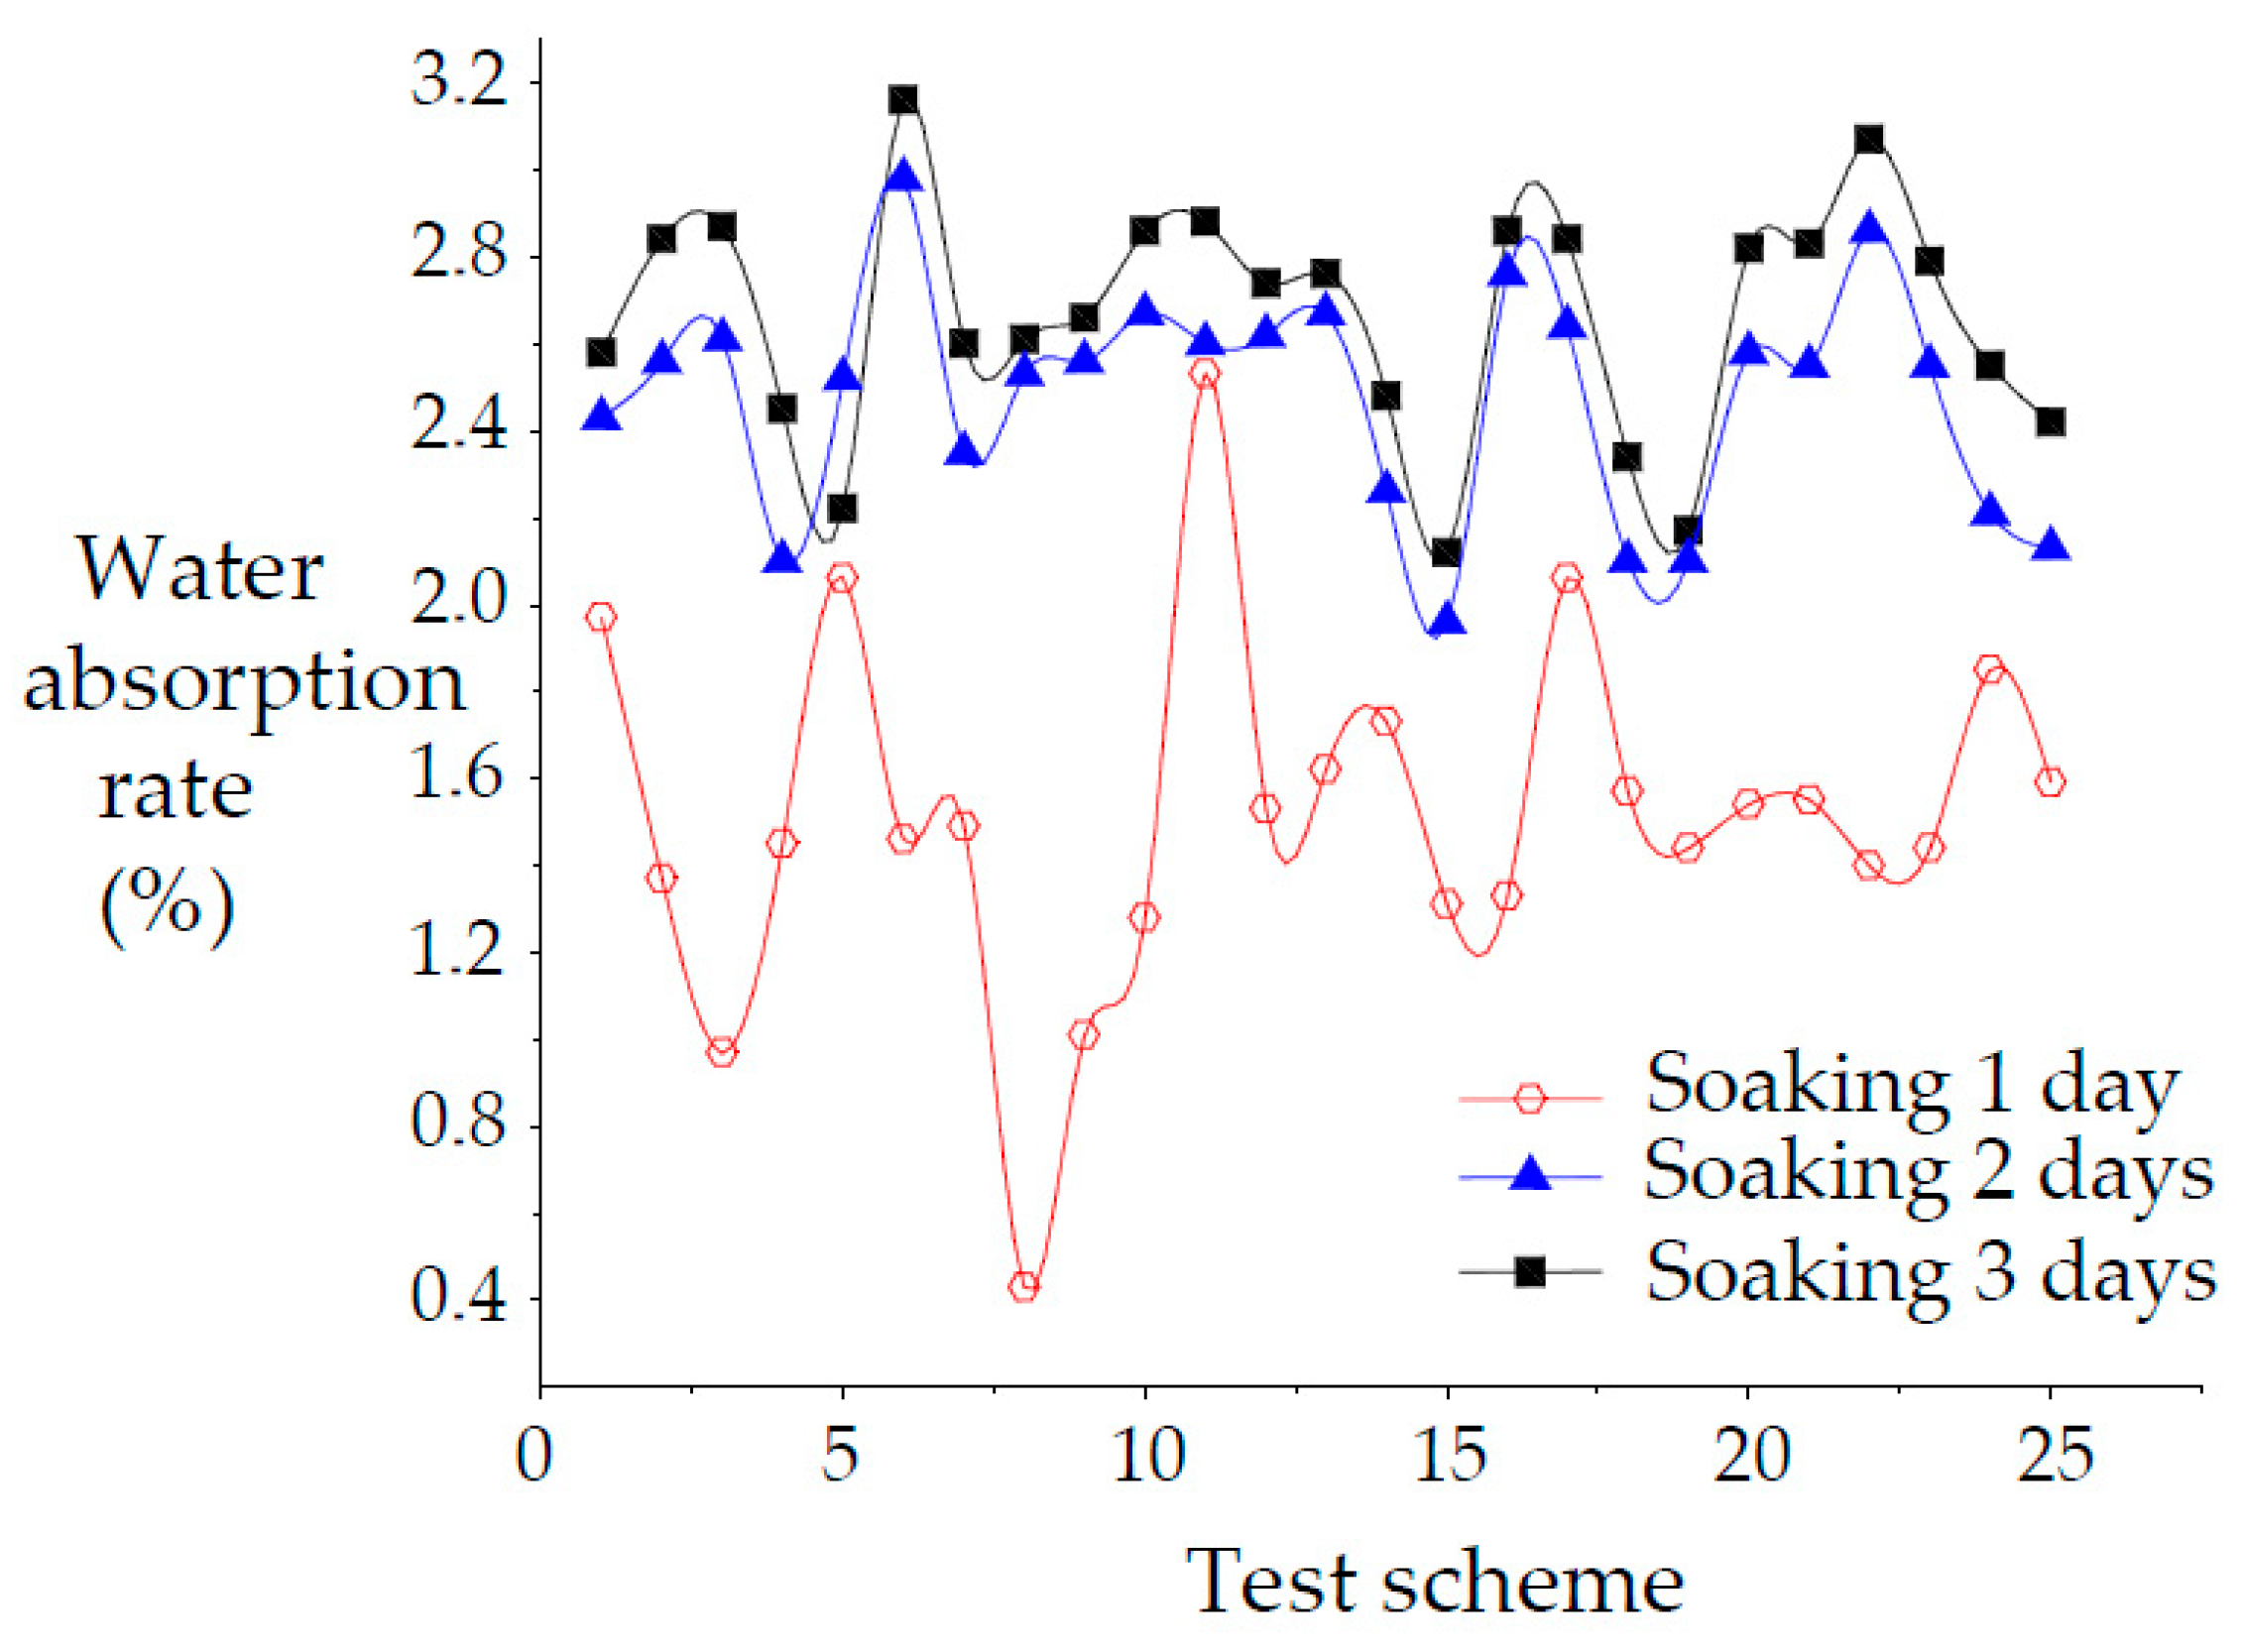
The weight, height, and diameter of the specimen before immersion were measured, and then density (ρ) was calculated, as listed in Table 3. In addition, the degree of disintegration of specimens in water was observed after the specimens were immersed for 1 day, 2 days, and 3 days respectively (Figure 3) [38,39]. With increased immersion time, the water absorption rate increased gradually, and no disintegration phenomenon was observed. The change trend of water absorption rate is shown in Figure 4, indicating that the water absorption rate increased significantly from 1 day to 2 days of immersion time, while water absorption increased slightly from 2 days to 3 days of immersion time, during which the specimen was saturated and the water absorption rate reached a plateau.
(2) Testing compressive strength σc and brittle behavior (BB)
The compressive strength was tested using a SHIMADZU electronic universal testing machine (AG-X250, SHIMADZU China Company Limited, Beijing, China). In order to simulate permeability evolution caused by the fluid–solid coupling material rupture and its effect on the mechanical properties, the BB of similar-material was considered, reflecting the ratio of the pre-peak elastic modulus (PrePEM) and post peak elastic modulus (PostPEM) in the uniaxial compressive strength test. When PrePEM/PostPEM < 3, the material belongs to brittle failure material [40]. The test results of compressive strength and brittle behavior of the specimens are shown in Table 3, indicating that the compressive strength variation was in the range 0.228–1.311 MPa, indicating that the test specimens met the requirements of brittle materials.
(3) Testing tensile strength σt
The tensile strength of the specimen was measured by the Brazil splitting method [41]. Similar-material tensile strength was obtained by Equation (7), as listed in Table 3.
where D is the diameter of the specimen (mm); Pv is the failure load value of the specimen (N); and Lh is the thickness of the specimen (mm).
In Table 3, the tensile strength variation was in the range 0.021–0.111 MPa. The ratio of uniaxial tensile strength and uniaxial compressive strength (RTC) of rock is nearly 0.1, which is one of the important differences between the rock material and other materials. In Table 3, RTC is in the range 1/11.8–1/9.1, which is close to the rock average RTC of 0.1 [42]. Therefore, the mechanical properties of similar-material and rock are similar.
(4) Testing permeability coefficient K
The permeability coefficient K is one of the indexes, reflecting the permeability of similar-material. In the similar simulation test, because the permeability of the material and the water flow are small, the water level is difficult to control; therefore, the variable head test is used in the laboratory [23], which is the main test principle, as expressed by Equation (8).
where K is the permeability coefficient (cm/s); b is the glass tube sectional area (cm2); A is the specimen sectional area (cm2); L is the specimen height (cm); , are initial water head difference and water head difference after t time (cm), respectively. In Table 3, the variation range of the permeability coefficient of similar material specimen is 8.79 × 10⁻⁸–2.95 × 10⁻⁴ cm/s.
3. Results and Discussion
Based on the measured values for specimen parameters, the qualitative and quantitative relationships between the specimen index parameters and similar-material proportioning ingredients were obtained. In order to obtain the optimum proportioning of ingredients, using a coal mine floor water inrush by similar simulation test as a case, four multiple linear regression equations were further calculated, providing the optimum proportioning of the ingredients.
3.1. Results
The relationship between the specimen index parameters, i.e., density, compressive strength, tensile strength, and permeability coefficient, and four factors in the orthogonal test schemes, was analyzed quantitatively and qualitatively by the range and variance analyses. The variance analysis is based on the Minitab software (Minitab 17, TechMax Information Technical Co., Ltd., Shanghai, China, 2014) [43].
3.1.1. Density Analysis
The specimen density was analyzed as follows: first, a qualitative analysis was studied by the range analysis; furthermore, a quantitative analysis was carried out to obtain the quantitative relationship between the specimen density and four factors by the variance analysis.
(1) Range analysis of density
Range analysis consists of two stages: calculation and judgment. Kjm is the sum of the experimental indexes corresponding to the j factor, m level is in the range analysis. Kjm-a is the average value of Kjm and Rj is the range of the j column factor, reflecting the variation range of the test index. The larger the Rj, the greater the effect of the factors on the test indicators, which can determine the primary and secondary factors.
① Calculation
Combining Table 2 and Table 3, the corresponding test index and the average value of the first level A1 of factor A are as follows: KA1 = 1.766 + 1.761 + 1.884 + 1.879 + 1.832 = 9.122, KA1-a = KA1/5 = 1.824. Similarly, KA2 = 9.346, KA2-a = KA2/5 = 1.869; KA3 = 9.013, KA3-a = KA3/5 = 1.803; KA4 = 9.058, KA4-a = KA4/5 = 1.812; KA5 =8.703, KA5-a = KA5/5 = 1.741.
Then, based on the range R definition, it was concluded that RA = KA2-a − KA5-a= 0.128, RB = 0.047, RC = 0.082, RD = 0.036, as shown in Table 4.
② Judgement
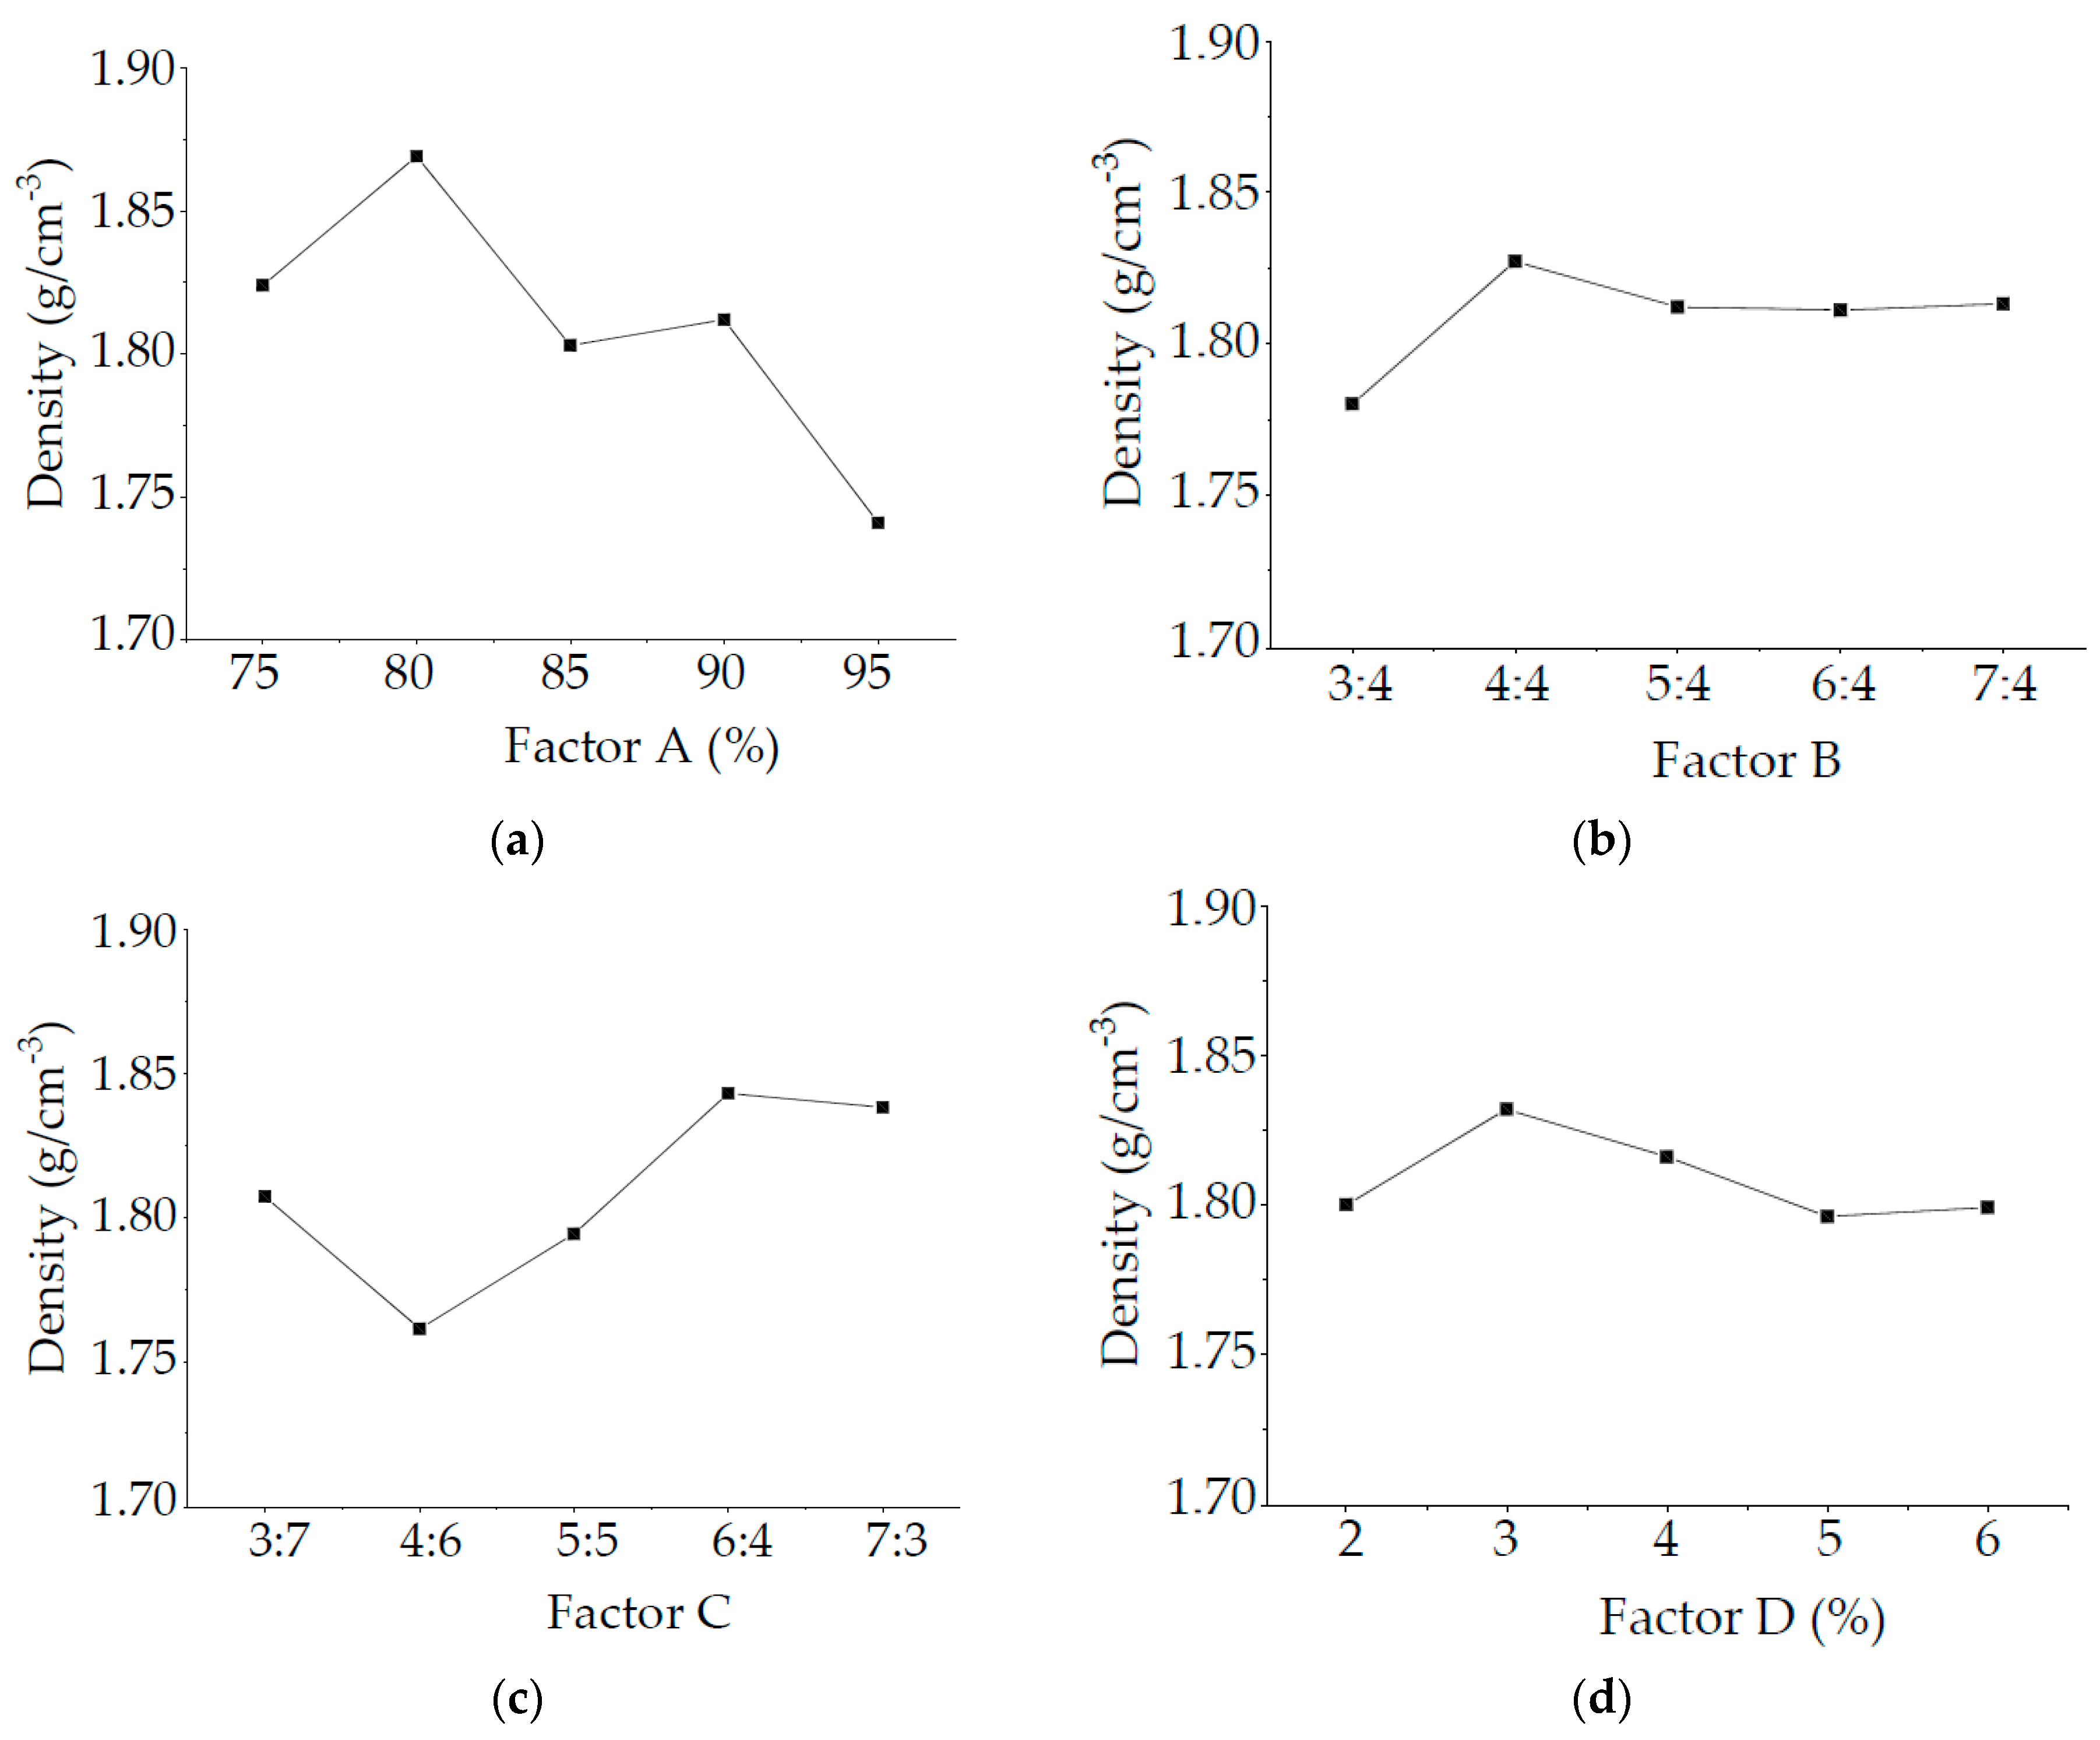
In Table 4, it was seen that RA > RC > RB > RD. Therefore, the order of the factors that affects the specimen density is A > C > B > D.
Figure 5 shows the intuitive analysis chart of effective factors on specimen density. Specimen density increases with increasing percentage of river sand in aggregate, because the density of the coarse aggregate (river sand) is smaller than that of fine aggregate (calcium carbonate and talc powder). In addition, density increases with increasing the mass ratio of cement and vaseline.
(2) Variance analysis of density
The abovementioned density values of different levels in four factors were used as the input in the Minitab software. Then, the variance analysis of density was carried out in the variance analysis module of the Minitab software, as shown in Table 5. Seq SS, Adj SS, and Adj MS are the sum of the squares of deviations, adjusted squares sum of deviations, and adjusted squares sum of mean-square error, respectively. F value is an index in variance analysis. p value is used to determine the significance of a factor. Generally, p < 0.05 is significant, and p < 0.01 is very significant. The larger the F value, the smaller the p value, indicating a more reliable result.
In Table 5, p values are ≥5%, illustrating that the affecting factors have no significant effect on the specimen density. The factors order affecting the specimen density is A > C > B > D based on p values, and this result is consistent with the range analysis of density.
In the Minitab regression analysis, the indexes of the regression model include the standard deviation of the regression model error (Se), the percentage of the regression model error in the total error (R-Sq) and the adjusted R-Sq. R-Sq is used to show that the model is in line with the data, and the larger the value, the better the regression model and the data. The larger the R-Sq value, the better the fit between the regression model and the data.
Based on the regression analysis module in the Minitab software, the multiple linear regression equation between the density and four factors were obtained [44], as shown by Equation (9).
where Se = 0.0632119, R-Sq = 80.46%, the adjusted R-Sq = 75.39%, verifying the reliability of the similar-material density regression model.
ρ = 1.80964 − 0.06904A − 0.00456B + 0.02976C + 0.00924D
3.1.2. Compressive Strength Analysis
The compressive strength analysis method was similar to that of the specimen density.
(1) Range analysis of compressive strength
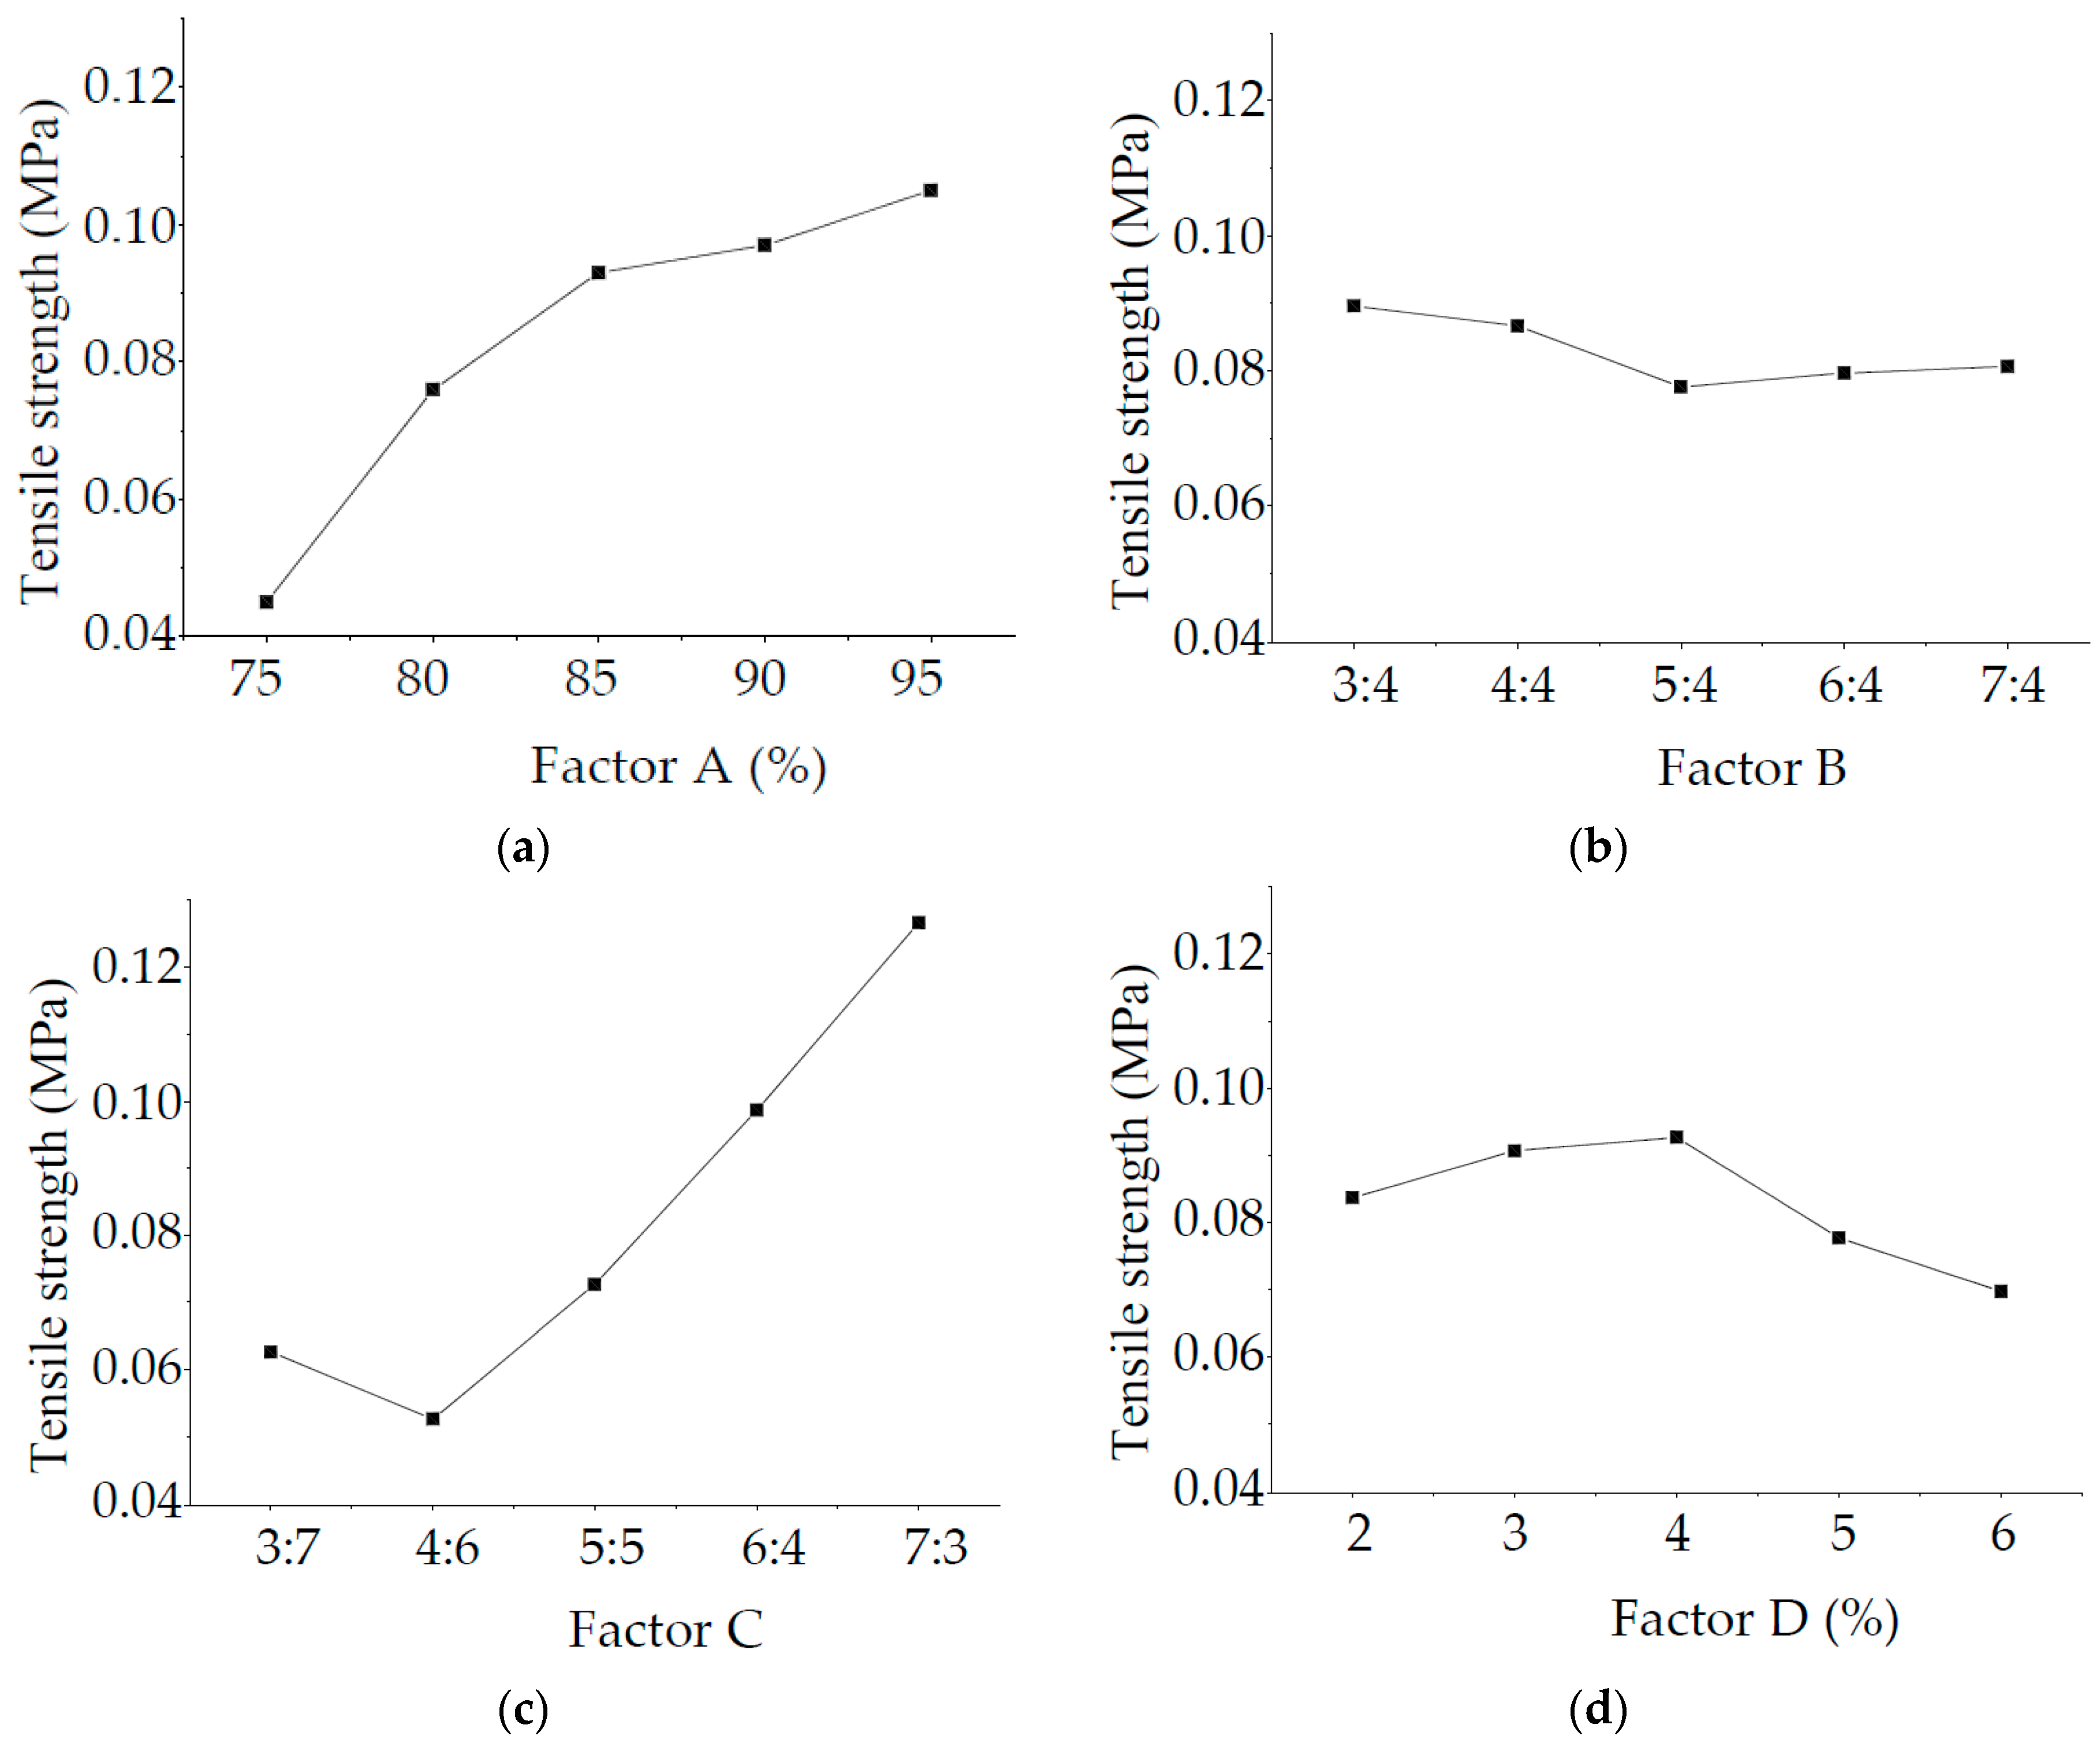
Similarly, RC > RA > RD > RB. Therefore, the order of the factors affecting the specimen density is C > A > D > B. Figure 6 shows the intuitive analysis chart of effective factors of specimen compressive strength. Specimen compressive strength increases when increasing the percentage of river sand in the aggregate and the mass ratio of cement and vaseline.
(2) Variance analysis of compressive strength
Equation (10) was obtained based on the Minitab regression analysis.
where Se = 0.173737, R-Sq =94.31%, the adjusted R-Sq =82.94%, indicating the reliability of the similar-material compressive strength regression model.
σc = −2.04562 + 3.2768A − 0.13096B + 0.469376C − 5.75D
3.1.3. Tensile Strength Analysis
The tensile strength analysis method was similar to that of the specimen density.
(1) Range analysis of tensile strength
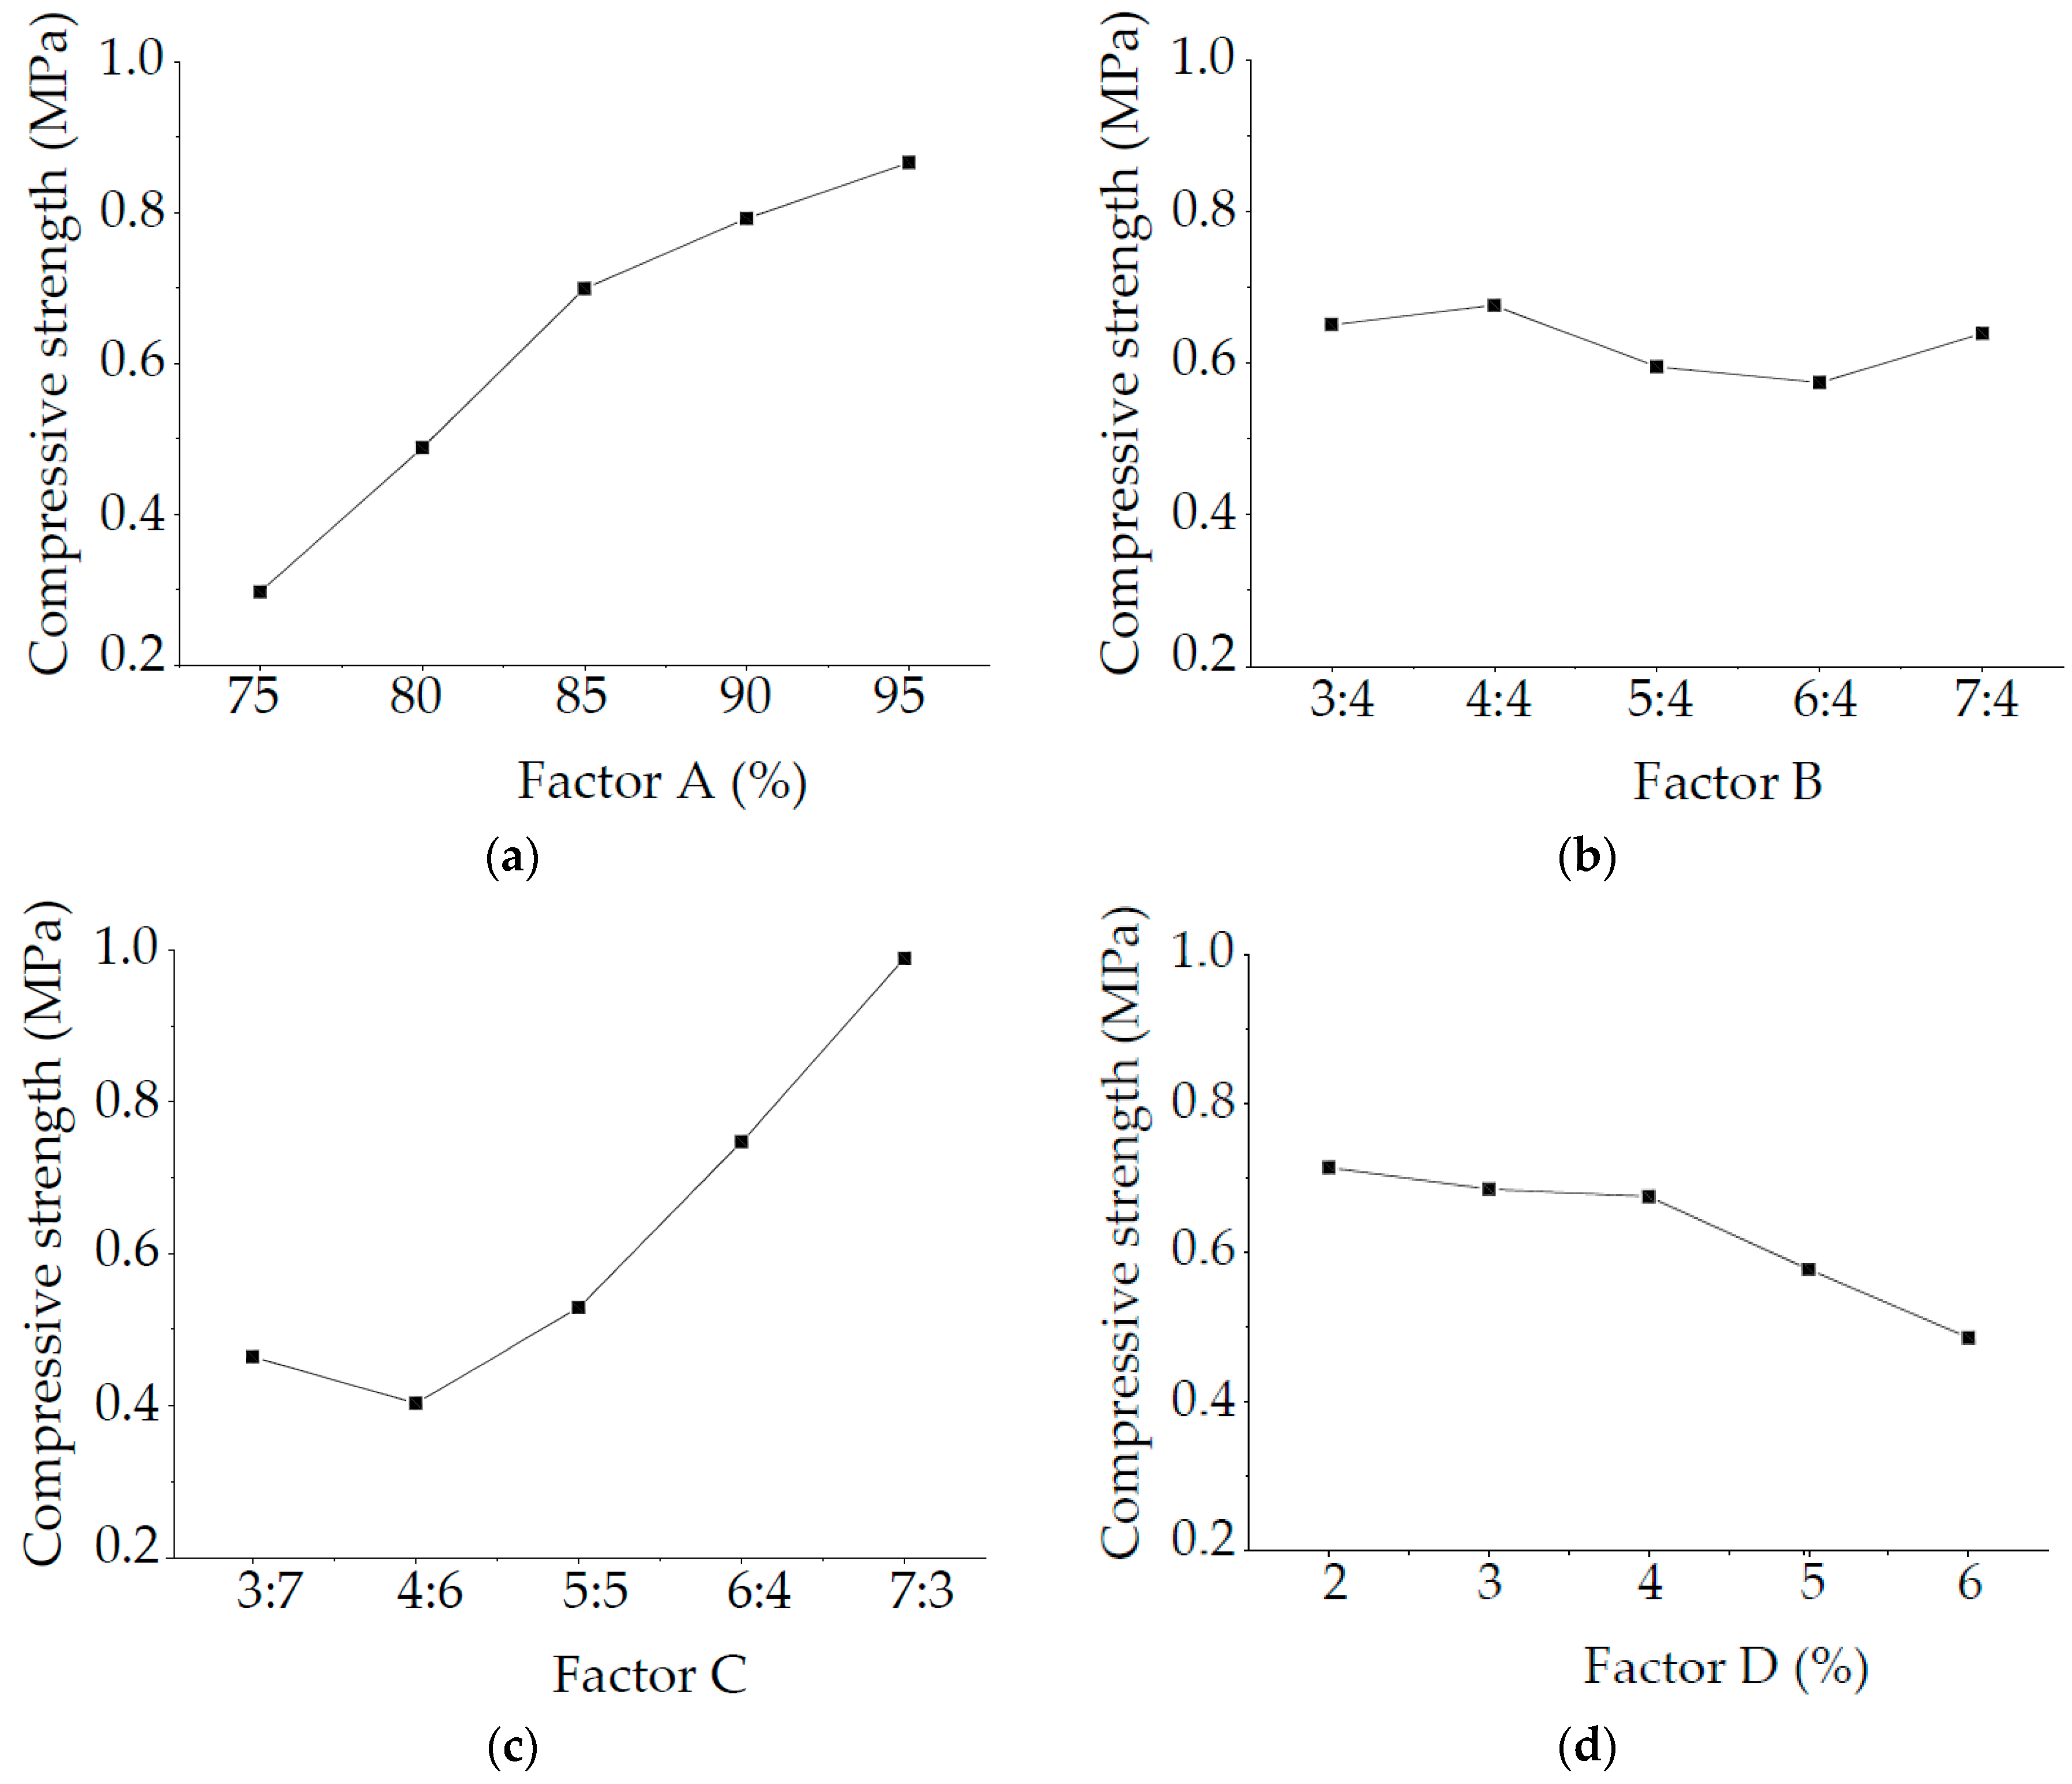
Similarly, RC > RA > RD > RB. Therefore, the order of the factors affecting the specimen density is C > A > D > B. Figure 7 shows the intuitive analysis chart of factors affecting the specimen tensile strength. Specimen tensile strength increases with increasing the percentage of river sand in aggregate and the mass ratio of cement and vaseline.
(2) Variance analysis of tensile strength
Equation (11) was obtained based on the Minitab regression analysis.
where Se = 0.0146990, R-Sq = 95.06%, the adjusted R-Sq = 85.17%, confirming the reliability of the similar-material tensile strength regression model.
σt = −0.19218 + 0.2916A − 0.00784B + 0.0439676C − 0.424D
3.1.4. Permeability Coefficient Analysis
The permeability coefficient analysis method was similar to that of the specimen density.
(1) Range analysis of permeability coefficient
The order of on permeability coefficients is as follows: RD > RC > RB > RA. Therefore, the order of the factors affecting the specimen density is D > C > B > A. Figure 8 shows the intuitive analysis chart of influence factors affecting the specimen permeability coefficient. With increasing the percentage of antiwear hydraulic oil in the total mass of similar materials, the mass ratio of cement and vaseline, and the mass ratio of calcium carbonate and talc powder, the permeability coefficient first increases and then decreases.
(2) Variance analysis of permeability coefficient
Equation (12) was obtained based on the Minitab regression analysis.
where Se = 0.0000412355, R-Sq = 86.20%, the adjusted R-Sq = 78.60%, indicating the reliability of similar-material permeability coefficient regression model.
K = 0.00031441 − 0.0002555A − 0.00002766B − 0.00003062C + 0.00027941D
3.2. Discussion
The optimum proportion of the fluid–solid coupling similar-material is the key to study geotechnical engineering problems in similar simulation test, obtained by Equations (9)–(12).
Water inrush from the coal floor is a typical fluid–solid coupling problem in geotechnical engineering. In order to explore the mechanism of water inrush from mining coal floor, the floor water inrush of the 15 coal seams in a colliery was taken as an application example. Based on the fluid–solid coupling similarity theory and original parameters of sandstone stratum and mudstone stratum in aquifuge, the test model parameters of aquifuge were calculated, as shown in Table 6. On this basis, the optimum ratio of similar-material in the aquifuge strata was also obtained by Equations (9)–(12), as listed in Table 7.
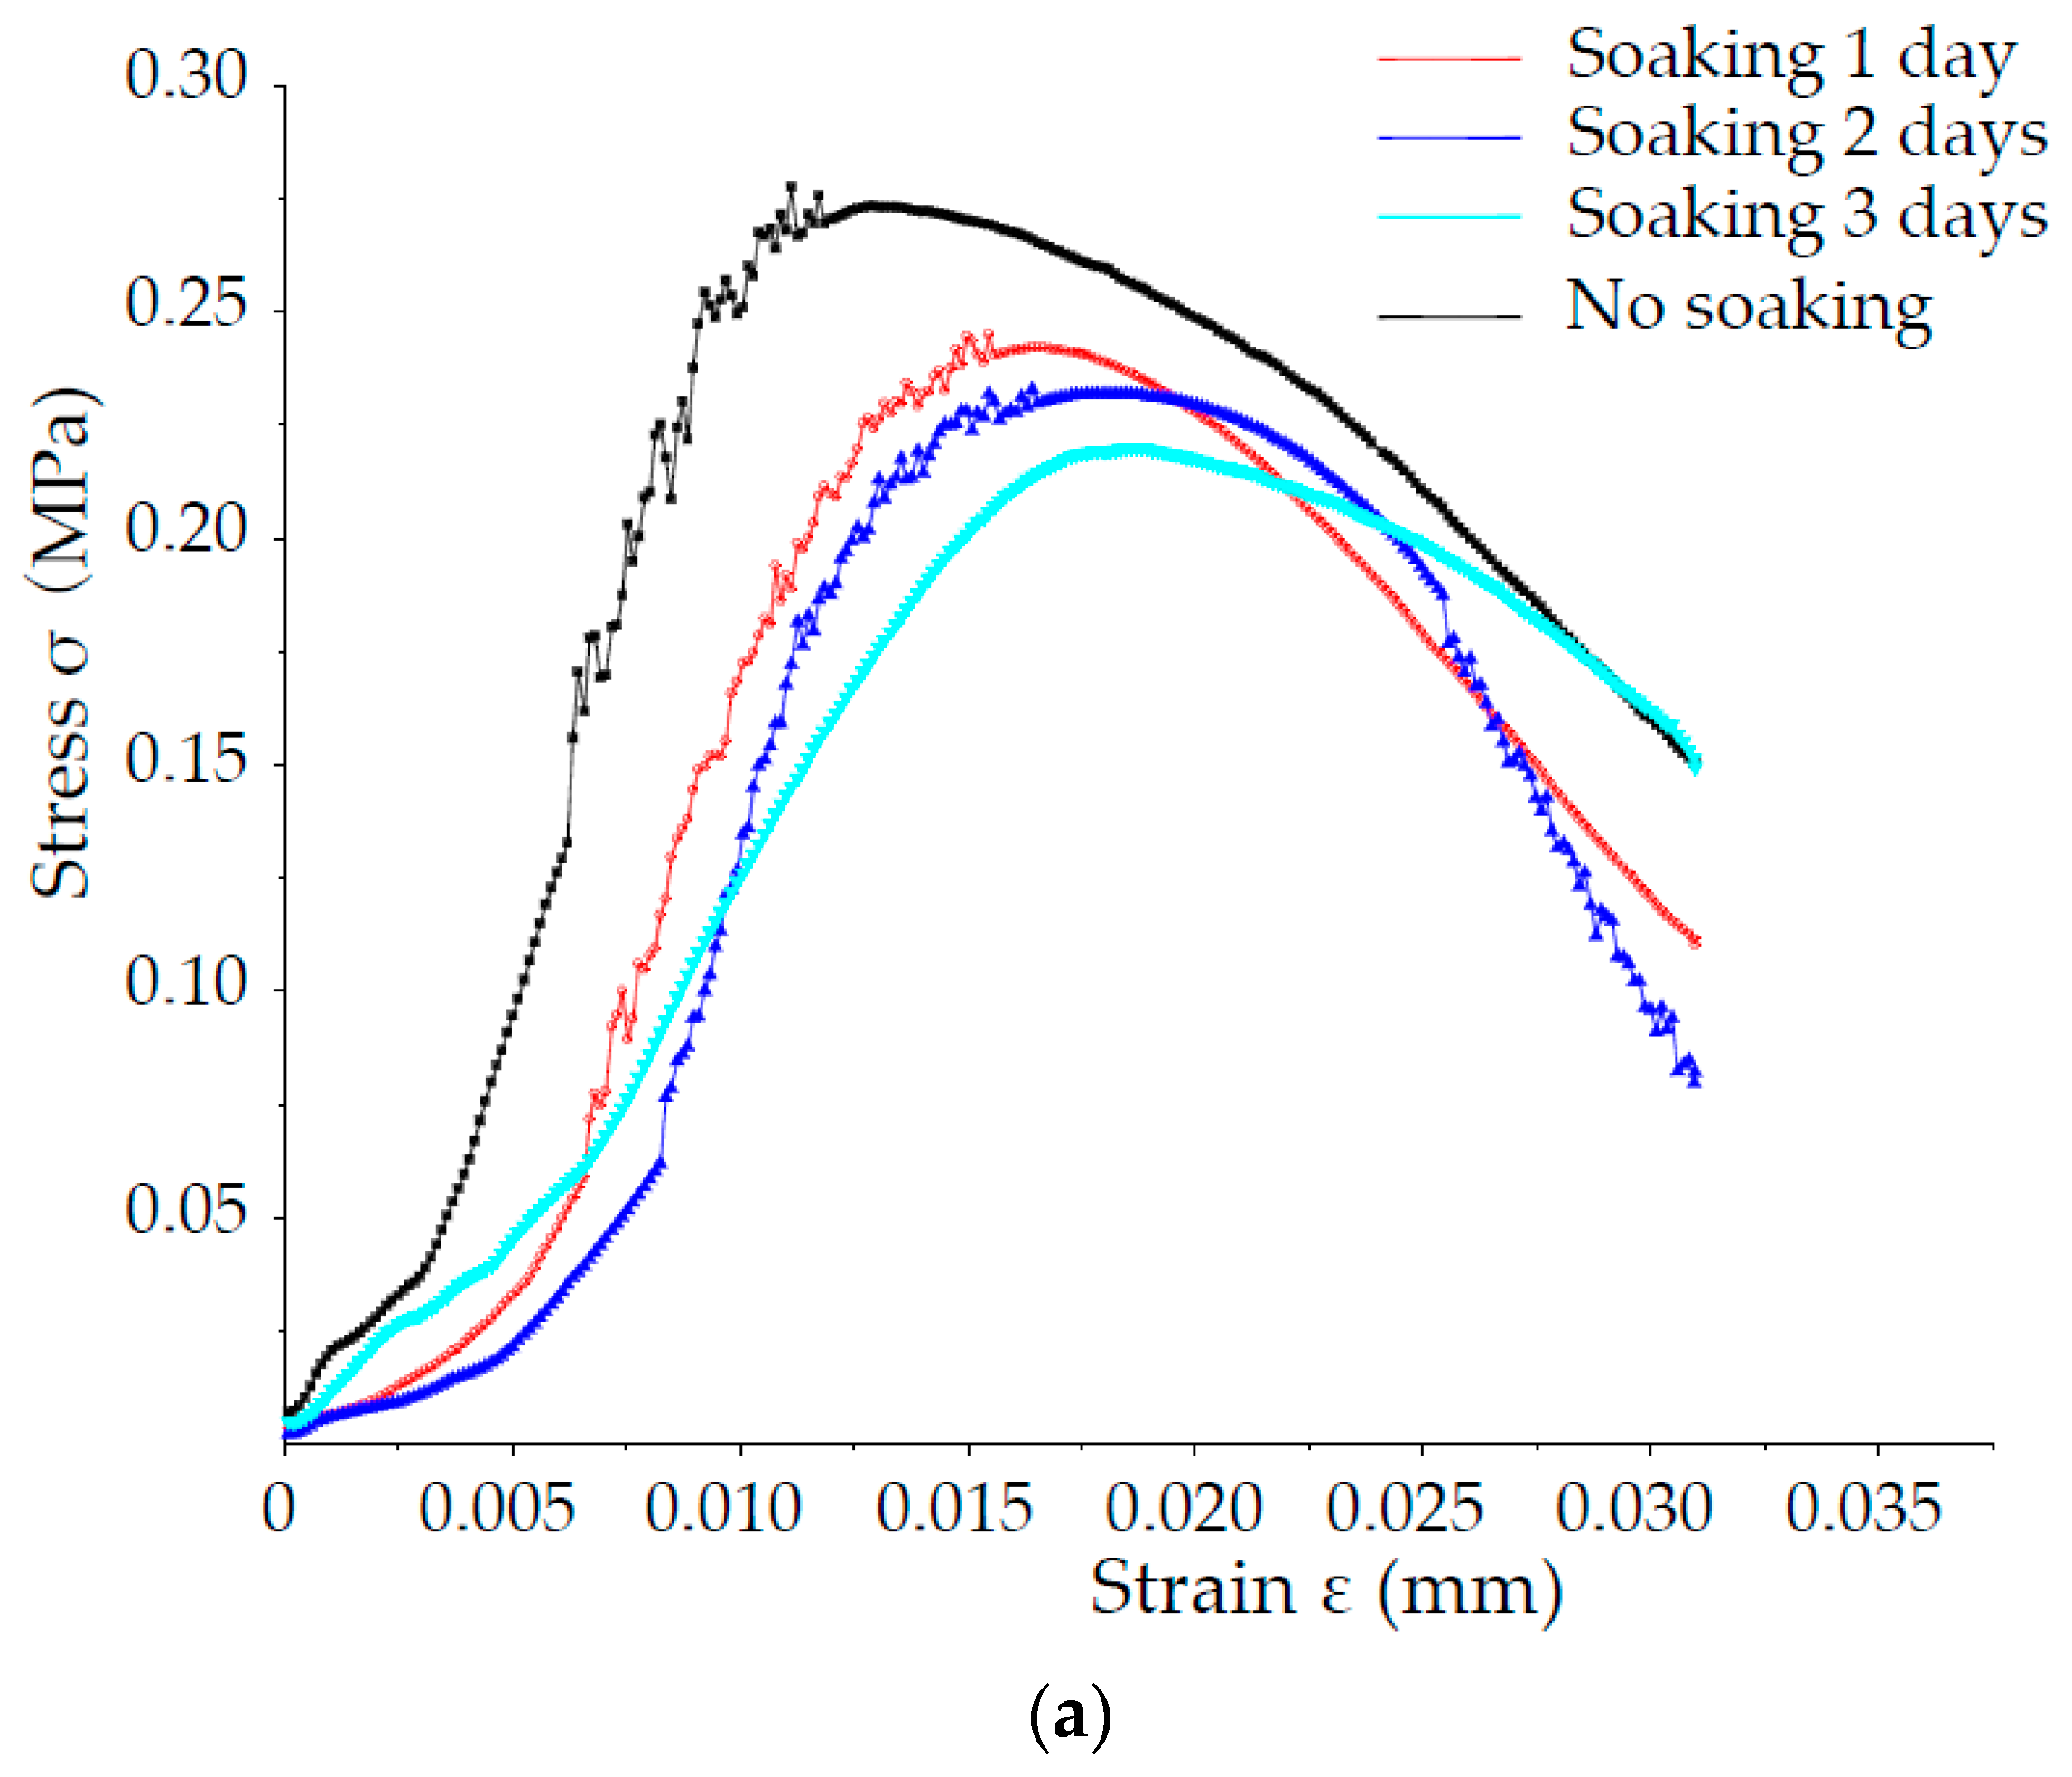
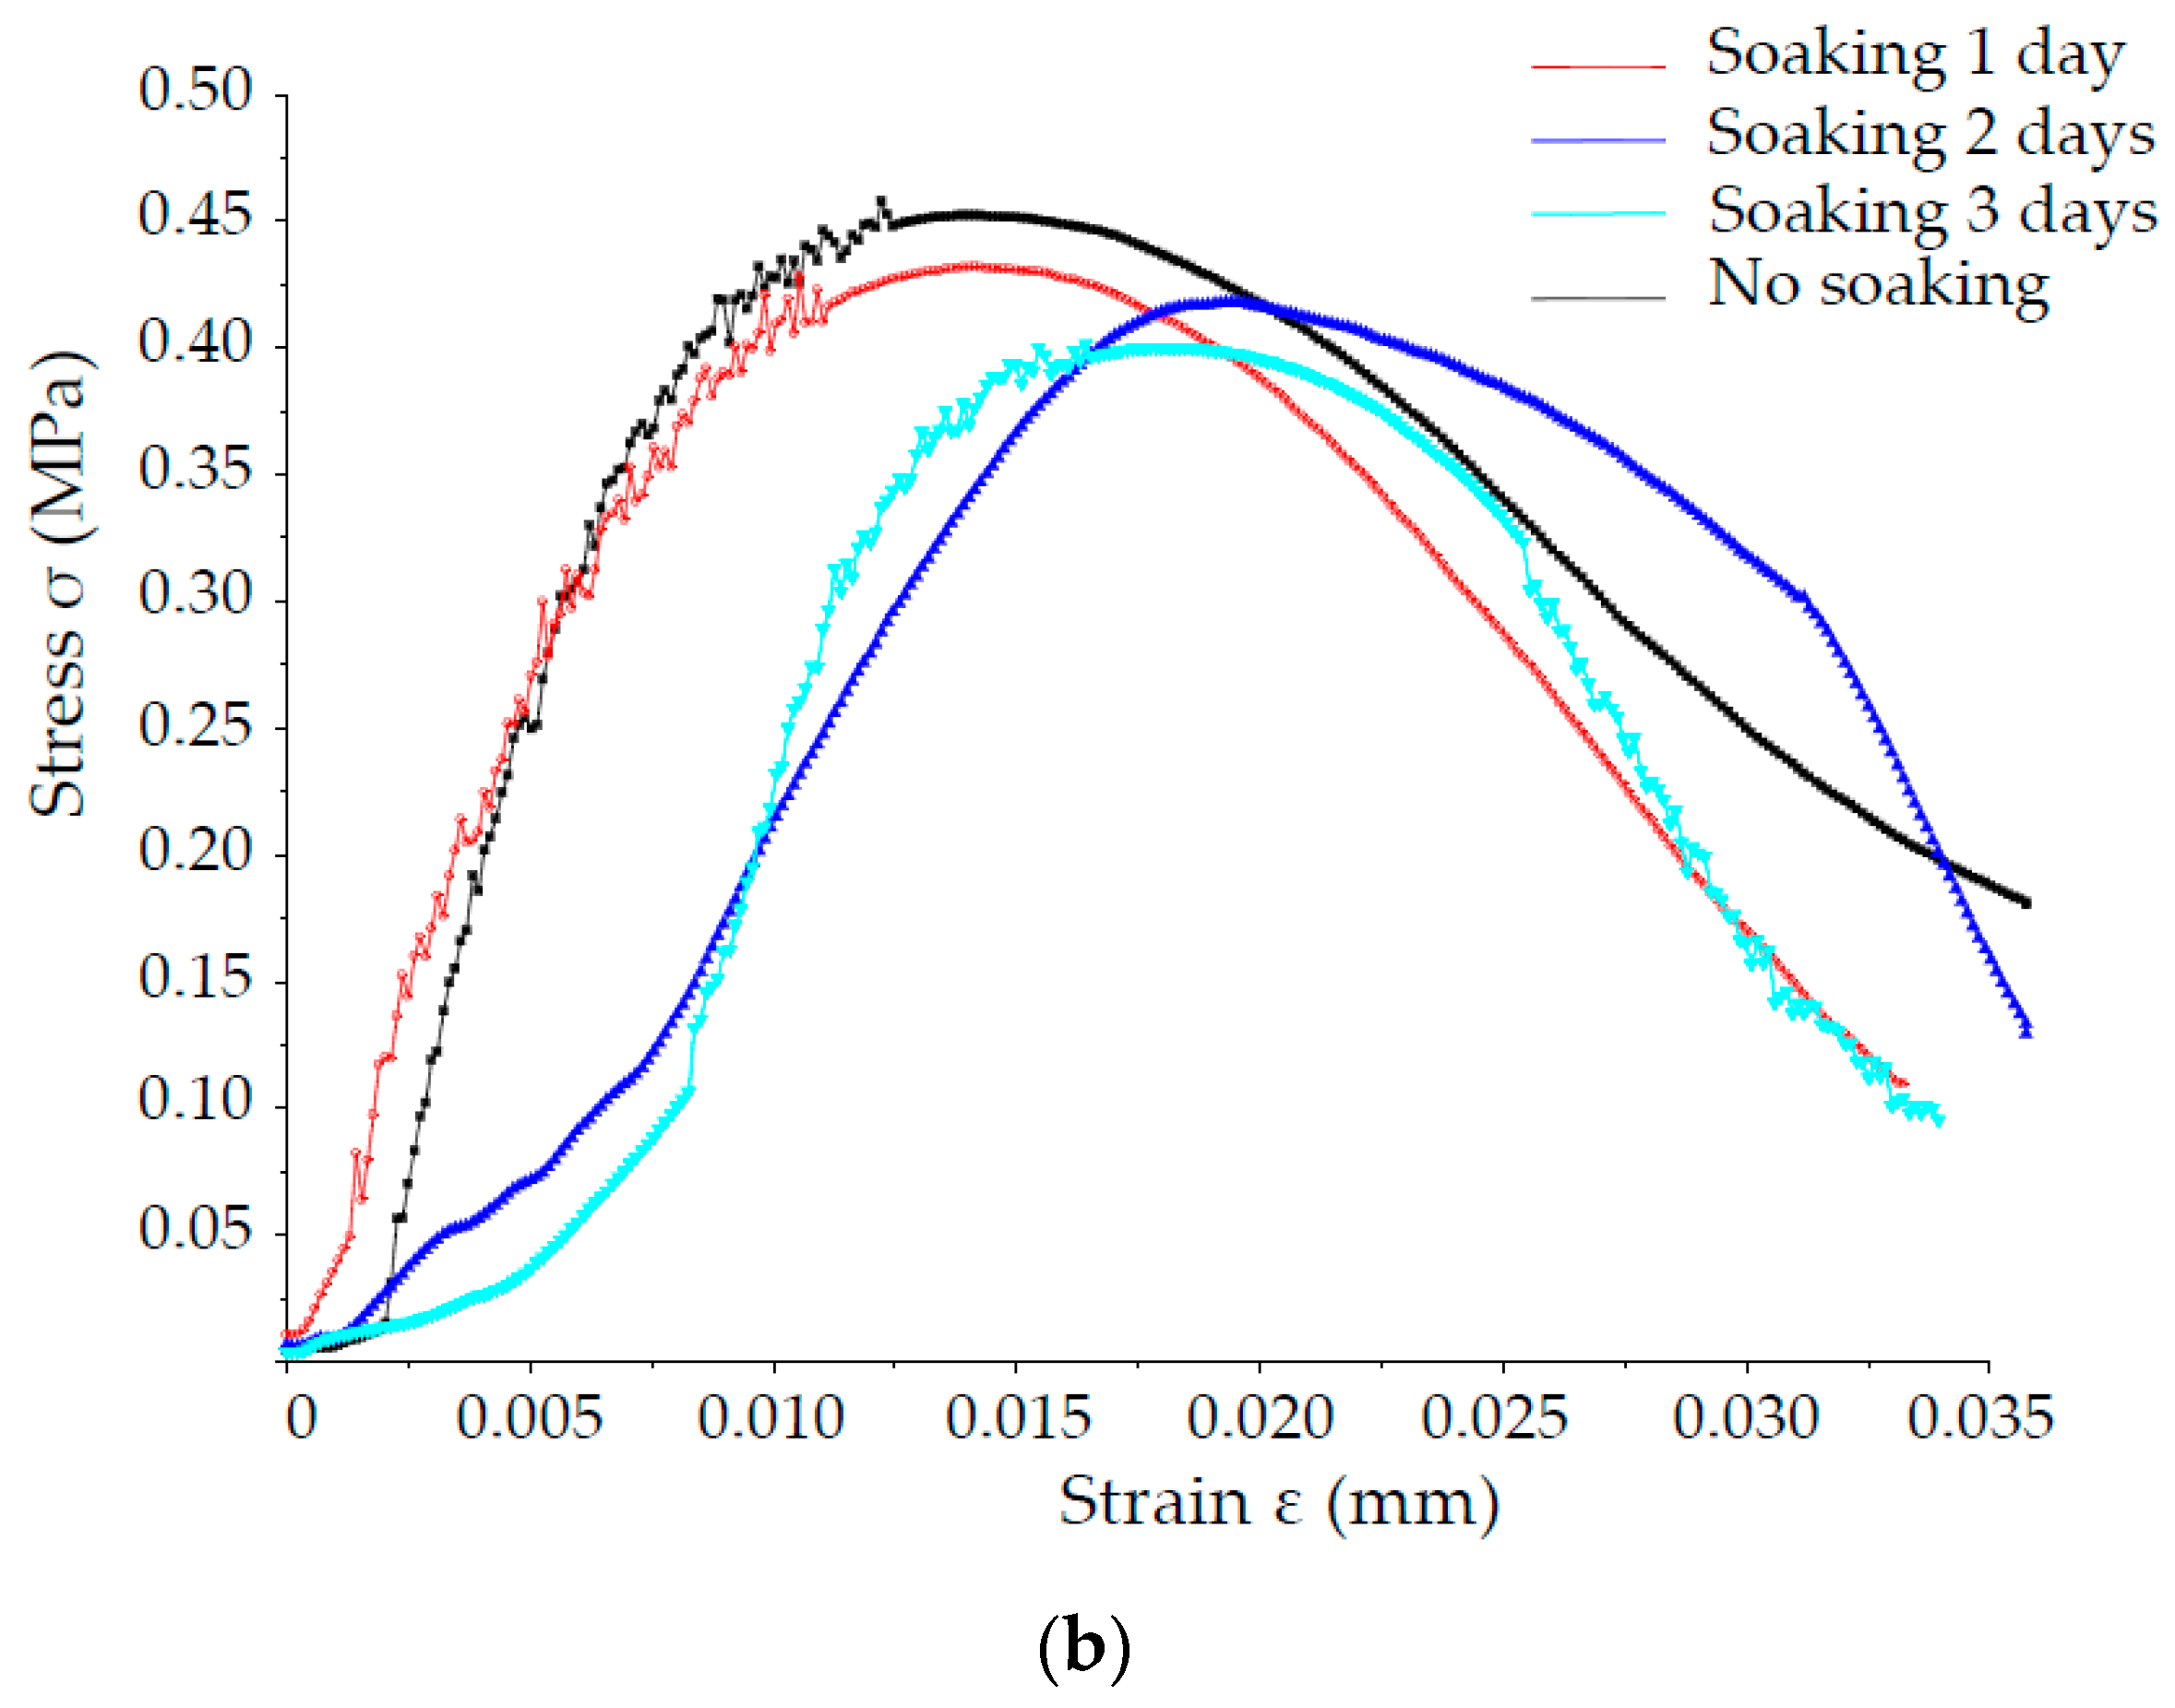
According to the optimum ratio of mudstone and sandstone in aquifuge, six specimens were prepared to verify the requirements of the hydrophilicity, compressive strength, tensile strength, brittleness and permeability coefficient. Figure 9 shows the stress and strain curves of mudstone and sandstone in aquifuge, indicating that the specimen strength immersed for three days was greater than 85% of the specimen without immersion; these results show that this similar-material can meet the practical requirements of aquifuge. Furthermore, similar-material model test was laid using the optimal ratio of in aquifuge, and the results are consistent with the mining practice, verifying that the new fluid–solid coupling similar-material is feasible and effective in solving the geotechnical engineering problem.
4. Conclusions
An experimental development process of a new fluid–solid coupling similar-material based on the orthogonal test was established. First, river sand, calcium carbonate and talc powder, white cement and vaseline, and antiwear hydraulic oil were used as the aggregate, cementing agent, and regulator, respectively, making up the raw materials of similar-material. Second, the proportioning test scheme was designed based on the orthogonal test. Test specimens were produced to obtain parameters, such as density, compressive strength, tensile strength, and permeability coefficient. Third, the qualitative and quantitative relationships between the specimen parameters and similar-material proportioning ingredients were obtained through range and variance analysis. That is to say, the density, compressive strength, and tensile strength increase when increasing the mass ratio of cement and vaseline. With increasing the percentage of hydraulic oil in aggregate, the mass ratio of cement and vaseline, and the mass ratio of calcium carbonate and talc powder, the permeability coefficient first increases and then decreases. Fourth, four multiple linear regression equations between the specimen parameters and similar-material ingredients were obtained, and the optimum proportioning of ingredients was further determined for different requirements. Finally, taking a coal mine floor water inrush by similar simulation test as a case, based on the four multiple linear regression equations, the optimum proportioning of the sand, calcium carbonate, talc powder, white cement, vaseline, and antiwear hydraulic oil of the mudstone and sandstone in the aquifuge was determined as 12.46:1.00:0.79:0.69:0.89:0.79, 5.19:1.00:0.70:0.51:0.29:0.29, respectively, which were successfully applied. The newly developed fluid–solid coupling similar-material can provide a reference for similar-material under different demand conditions.
Author Contributions
All the authors contributed to this paper. S.L. conceived and designed the experiments schemes and wrote the paper. General supervision was provided by W.L. All authors have read and approved the final manuscript.
Funding
The study has been financially supported by the National Natural Science Foundation of China under Grant Nos. 51274135, 51428401, and 51034003, the National High Technology Research and Development Program (863 Program) of China under Grant No. 2015AA016404-4, and the State Key Research and Development Program of China under Grant No. 2017YFC0804108.
Conflicts of Interest
The authors declare no conflict of interest.
References
- Li, Z.K.; Lu, D.R.; Nakayama, H.; Xi, J.H.; Sun, J.S. Developement and applicaiton of new technology for 3D geomechanical model test of large underground houses. Chin. J. Rock Mech. Eng. 2003, 22, 1430–1436. [Google Scholar]
- Cui, X.M.; Miu, X.X.; Su, D.G.; Ma, W.M. Error analysis in similar material simulation test of the movement of rock strata and surface. Chin. J. Rock Mech. Eng. 2002, 21, 1827–1830. [Google Scholar]
- Chapman, D.N.; Ahn, S.K.; Hunt, D.V.L.; Chan, A.H.C. The Use of Model Tests to Investigate the Ground Displacements Associated with Multiple Tunnel Construction in Soil. Tunn. Undergr. Space Technol. 2006, 21, 413. [Google Scholar] [CrossRef]
- Jeon, S.; Kim, J.; Seo, Y.; Hong, C. Effect of a Fault and Weak Plane on the Stability of a Tunnel in Rock—A Scaled Model Test and Numerical Analysis. Int. J. Rock Mech. Min. 2004, 41, 658–663. [Google Scholar] [CrossRef]
- Fumagalli, E. Statical and Geomechanical Model; Springer: New York, NY, USA, 1973; pp. 25–36. [Google Scholar]
- Kim, S.H.; Burd, H.J. Model testing of closely spaced tunnels in clay. Geotechnique 1998, 48, 375–388. [Google Scholar] [CrossRef]
- Gu, D.Z. Similar Materials and Similar Models; China University of Mining and Technology Press: Xuzhou, China, 1995. [Google Scholar]
- Fu, X.M.; Deng, R.G. Indoor Rock Mechanics Test; Southwest Jiao Tong University Press: Chengdu, China, 2012; pp. 56–58. [Google Scholar]
- Chen, S.J.; Wang, H.L.; Zhang, J.W.; Xing, H.L.; Wang, H.L. Experimental study on low-strength similar-material proportioning and properties for coal mining. Adv. Mater. Sci. Eng. 2015, 2015, 1–6. [Google Scholar] [CrossRef]
- Chen, S.J.; Wang, H.L.; Zhang, J.W.; Xing, H.L.; Wang, H.L. Low-Strength Similar Materials for Backfill Mining: Insight from Experiments on Components and Influence Mechanism. Geotech. Test. J. 2015, 38, 929–935. [Google Scholar] [CrossRef]
- Chen, L.W.; Bai, S.W. Proportioning test study on similar of rock burst tendency of brittle rock mass. Rock Soil Mech. 2006, 27, 1050–1054. [Google Scholar]
- Meguid, M.A.; Saada, O.; Nunes, M.A.; Mattar, J. Physical modeling of tunnels in soft ground: A review. Tunn. Undergr. Space Technol. 2008, 23, 185–198. [Google Scholar] [CrossRef]
- Wu, B.T.; Zhu, H.H.; Xu, W.Q.; Ming, T. Research study of similar material for weak surrounding rock mass of class IV. Rock Soil Mech. 2013, 34, 109–116. [Google Scholar]
- Zhang, Q.Y.; Li, S.C.; Guo, X.H.; Li, Y.; Wang, H.P. Research and development of new typed cementitious geotechnical similar material for iron crystal sand and its application. Rock Soil Mech. 2008, 29, 2126–2130. [Google Scholar]
- Zhang, Q.Y.; Liu, D.J.; Jia, C.; Shen, X.; Liu, J.; Duan, K. Development of geomechanical model similitude material for salt rock oil-gas storage medium. Rock Soil Mech. 2009, 30, 3581–3586. [Google Scholar]
- Zhang, S.T.; Dai, L.C.; Wang, B.; Cao, Y. Experiment study on mixture ratio of similar material for simulation of coal and gas outburst. Coal Sci. Technol. 2015, 43, 76–81. [Google Scholar]
- Liu, J.H.; Li, W.X.; Liu, Y.S.; Liu, B.G. A method for determining the ratio of similar material to simulate porous water-bearing stratum. Rock Soil Mech. 2018, 39, 657–664. [Google Scholar] [CrossRef]
- Zhang, F.; Ma, G.; Tao, Y.Q.; Liu, X.; Feng, D.; Li, R. Proportioning experiment of similar material for coal and rock model test. Coal Geol. Explor. 2018, 46, 119–124. [Google Scholar]
- Zha, J.F.; Li, H.Z.; Guo, G.L.; Wang, J.T. Influence of temperature and humidity on similar material and its control measures. Environ. Earth Sci. 2017, 76, 740. [Google Scholar] [CrossRef]
- Li, H.Z.; Guo, G.L.; Zha, J.F. Study on time-varying characteristics of similar material model strength and the regulation measures. Environ. Earth Sci. 2017, 76, 518. [Google Scholar] [CrossRef]
- Li, L.J.; Qian, M.G.; Yin, Y.Q. Simulation of similar materials for water inrush from coal floor. Coal Geol. Explor. 1996, 25, 33–36. [Google Scholar]
- Sun, W.B.; Zhang, S.C.; Li, Y.Y.; Lu, C. Development application of solid-fluid coupling similar material for floor strata and simulation test of water-inrush in deep mining. Chin. J. Rock Mech. Eng. 2015, 31, 2665–2670. [Google Scholar]
- Sun, W.B.; Zhang, S.C.; Guo, W.J.; Liu, W.T. Physical simulation of high-pressure water inrush through the floor of a deep mine. Mine Water Environ. 2017, 36, 542–549. [Google Scholar] [CrossRef]
- Chen, J.T.; Yin, L.M.; Sun, W.B.; Lu, C.; Zhang, S.C.; Sun, X.Z. Development and application for new solid-fluid coupling similar material of deep floor aquifuge. Chin. J. Rock Mech. Eng. 2015, 34, 3956–3964. [Google Scholar]
- Li, S.C.; Feng, X.D.; Li, S.C.; Li, L.P.; Li, G.Y. Research and development of a new similar material for solid-fluid coupling and its application. Chin. J. Rock Mech. Eng. 2010, 29, 281–288. [Google Scholar]
- Li, S.C.; Zhou, Y.; Li, L.P.; Zhang, J.; Song, S.G. Development and application of a new similar material for underground engineering fluid-solid coupling model test. Chin. J. Rock Mech. Eng. 2012, 31, 1128–1137. [Google Scholar]
- Yu, L.Y.; Jing, H.W.; Xu, B.S.; Wang, Y.C. Solid-fluid coupling analogous material test for subsea tunnel. J. Cent. South Univ. (Sci. Technol.) 2015, 46, 983–990. [Google Scholar] [CrossRef]
- Wang, H. The Development and Application of Solid-Liquid Coupling Similar Stimulation Non-Hydrophilic Material for Water-Protection Mining. Master’s Thesis, China University of Mining and Technology, Xuzhou, China, 2015. [Google Scholar]
- Wang, K.; Li, S.C.; Zhang, Q.S.; Zhang, X.; Li, L.P. Development and application of new similar materials of surrounding rock for a fluid-solid coupling model test. Rock Soil Mech. 2016, 37, 2521–2533. [Google Scholar] [CrossRef]
- Zhao, B.; Wen, G.C.; Sun, H.T.; Sun, D.L.; Yang, H.M.; Cao, J.; Dai, L.C.; Wang, B. Similarity criteria and coal-like material in coal and gas outburst physical simulation. Int. J. Coal Sci. Technol. 2018, 5, 167–178. [Google Scholar] [CrossRef]
- Hu, Y.Q.; Zhao, Y.S.; Yang, D. Simulation theory & method of 3D solid-liquid coupling. J. Liaoning Tech. Univ. 2007, 26, 204–206. [Google Scholar]
- Wang, W.Z. Design and Analysis of Experiments; Higher Education Press: Beijing, China, 2004; pp. 23–25. [Google Scholar]
- Gao, R.; Yan, H.; Ju, F.; Mei, X.C.; Wang, X.L. Influential factors and control of water inrush in a coal seam as the main aquifer. Int. J. Min. Sci. Technol. 2018, 28, 187–193. [Google Scholar] [CrossRef]
- Guo, Z.G. Methods of Social Statistics: Application of SPSS Software; Renmin University of China Press: Beijing, China, 1999. [Google Scholar]
- Li, K.; Li, H.F. Response characteristics analysis of mine water filled structure with ground-tunnel transient electromagnetic method. J. China Univ. Sci. Technol. 2018, 47, 1113–1122. [Google Scholar]
- Wu, R.A.; Wei, Y.J.; Ji, C.L. Analysis of deformation mechanism of slope with soft and hard rock inter-bedded structure in Three Gorges reservoir area: A case study of Xiangcheng elementary school in Yunyang. J. Catastrophol. 2018, 33, 212–217. [Google Scholar] [CrossRef]
- Cao, P.; Wang, H.; Jin, J.; Hao, R.Q.; Fan, W.C. Experimental study of the fracture failure of sandstone containing hole and fissure under seepage water pressure. J. China Univ. Sci. Technol. 2018, 47, 240–246. [Google Scholar]
- Esposito, L.; Esposito, A.W.; Pasculli, A.; Sciarra, N. Particular features of the physical and mechanical characteristics of certain Phlegraean pyroclastic soils. Catena 2013, 104, 186–194. [Google Scholar] [CrossRef]
- Pasculli, A.; Sciarra, N.; Esposito, L.; Esposito, A.W. Effects of wetting and drying cycles on mechanical proprerties of pyroclastic soils. Catena 2017, 156, 113–123. [Google Scholar] [CrossRef]
- Cao, R.H.; Lin, H.; Cao, P. Strength and failure characteristics of brittle jointed rock-like specimens under uniaxial compression: Digital speckle technology and a particle mechanics approach. Int. J. Min. Sci. Technol. 2018, 28, 669–677. [Google Scholar] [CrossRef]
- Peng, S.J.; Chen, C.C.; Xu, J.; Zhang, H.L.; Tang, Y.; Nie, W.; Zhao, K. Loading rate dependency of rock stress-strain curve based on Brazil splitting test. Chin. J. Rock Mech. Eng. 2018, 37, 3247–3252. [Google Scholar] [CrossRef]
- Zhou, H.; Meng, F.Z.; Zhang, C.Q.; Xu, R.C.; Lu, J.J. Quantitative evaluation of rock brittleness based on stress-strain curve. Chin. J. Rock Mech. Eng. 2014, 33, 1114–1122. [Google Scholar]
- Wu, L.Y. Introduction to MINITAB Software: The Most Practical Statistical Analysis Tutorial; Higher Education Press: Beijing, China, 2012; pp. 78–81. [Google Scholar]
- Feng, H.Y. The influence of pressure and temperature on dispensing quantity in dispensing technology based on MINITAB regression analysis method. Commod. Qual. 2017, 9, 229–230. [Google Scholar]
Figure 1.
The raw materials of similar-material: (a) River sand; (b) Calcium carbonate; (c) Talc powder; (d) White cement; (e) Vaseline; (f) Antiwear hydraulic oil.
Figure 1.
The raw materials of similar-material: (a) River sand; (b) Calcium carbonate; (c) Talc powder; (d) White cement; (e) Vaseline; (f) Antiwear hydraulic oil.

Figure 2.
The fabrication process of similar-material specimen: (a) Weighing; (b) Stirring; (c) Heating vaseline; (d) Adding hydraulic oil; (e) Compacting; (f) Demolding; (g) Partial specimen; (h) PVC tube.
Figure 2.
The fabrication process of similar-material specimen: (a) Weighing; (b) Stirring; (c) Heating vaseline; (d) Adding hydraulic oil; (e) Compacting; (f) Demolding; (g) Partial specimen; (h) PVC tube.

Figure 3.
Testing water absorption rate.

Figure 4.
The trend of water absorption rate.

Figure 5.
Intuitive analysis chart of density influencing factor: (a) Factor A; (b) Factor B; (c) Factor C; (d) Factor D.
Figure 5.
Intuitive analysis chart of density influencing factor: (a) Factor A; (b) Factor B; (c) Factor C; (d) Factor D.

Figure 6.
Intuitive analysis chart of compressive strength influencing factor: (a) Factor A; (b) Factor B; (c) Factor C; (d) Factor D.
Figure 6.
Intuitive analysis chart of compressive strength influencing factor: (a) Factor A; (b) Factor B; (c) Factor C; (d) Factor D.

Figure 7.
Intuitive analysis chart of tensile strength influencing factor: (a) Factor A; (b) Factor B; (c) Factor C; (d) Factor D.
Figure 7.
Intuitive analysis chart of tensile strength influencing factor: (a) Factor A; (b) Factor B; (c) Factor C; (d) Factor D.

Figure 8.
Intuitive analysis chart of permeability coefficient influencing factor: (a) Factor A; (b) Factor B; (c) Factor C; (d) Factor D.
Figure 8.
Intuitive analysis chart of permeability coefficient influencing factor: (a) Factor A; (b) Factor B; (c) Factor C; (d) Factor D.

Figure 9.
The stress and strain curves of similar-material: (a) Mudstone; (b) Sandstone.


Table 1.
Orthogonal test design level.
| Level | Factors | |||
|---|---|---|---|---|
| A (%) | B | C | D (%) | |
| 1 | 75 | 3:4 | 3:7 | 2 |
| 2 | 80 | 4:4 | 4:6 | 3 |
| 3 | 85 | 5:4 | 5:5 | 4 |
| 4 | 90 | 6:4 | 6:4 | 5 |
| 5 | 95 | 7:4 | 7:3 | 6 |
Table 2.
The orthogonal test schemes of similar-material.
| Schemes | A (%) | B | C | D (%) |
|---|---|---|---|---|
| S1 | 1 (75) | 1 (3:4) | 1 (3:7) | 1 (2) |
| S2 | 1 | 2 (4:4) | 2 (4:6) | 2 (3) |
| S3 | 1 | 3 (5:4) | 3 (5:5) | 3 (4) |
| S4 | 1 | 4 (6:4) | 4 (6:4) | 4 (5) |
| S5 | 1 | 5 (7:4) | 5 (7:3) | 5 (6) |
| S6 | 2 (80) | 1 | 2 | 3 |
| S7 | 2 | 2 | 3 | 4 |
| S8 | 2 | 3 | 4 | 5 |
| S9 | 2 | 4 | 5 | 1 |
| S10 | 2 | 5 | 1 | 2 |
| S11 | 3 (85) | 1 | 3 | 5 |
| S12 | 3 | 2 | 4 | 1 |
| S13 | 3 | 3 | 5 | 2 |
| S14 | 3 | 4 | 1 | 3 |
| S15 | 3 | 5 | 2 | 4 |
| S16 | 4 (90) | 1 | 4 | 2 |
| S17 | 4 | 2 | 5 | 3 |
| S18 | 4 | 3 | 1 | 4 |
| S19 | 4 | 4 | 2 | 5 |
| S20 | 4 | 5 | 3 | 1 |
| S21 | 5 (95) | 1 | 5 | 4 |
| S22 | 5 | 2 | 1 | 5 |
| S23 | 5 | 3 | 2 | 1 |
| S24 | 5 | 4 | 3 | 2 |
| S25 | 5 | 5 | 4 | 3 |
Note: The total mass of the similar-material in each scheme is 2000 g.
Table 3.
The index parameters of specimens (PrePEM: pre-peak elastic modulus; PostPEM: post peak elastic modulus; BB: brittle behavior; RTC: the ratio of uniaxial tensile strength and uniaxial compressive strength).
Table 3.
The index parameters of specimens (PrePEM: pre-peak elastic modulus; PostPEM: post peak elastic modulus; BB: brittle behavior; RTC: the ratio of uniaxial tensile strength and uniaxial compressive strength).
| Schemes | σc (MPa) | PrePEM (MPa) | PostPEM (MPa) | BB | σt (MPa) | RTC | ρ (g/cm3) | K (cm/s) |
|---|---|---|---|---|---|---|---|---|
| S1 | 0.268 | 24.15 | 9.05 | 2.67 | 0.028 | 1/9.6 | 1.766 | 3.15 × 10⁻⁵ |
| S2 | 0.228 | 22.39 | 10.38 | 2.16 | 0.021 | 1/10.9 | 1.761 | 2.08 × 10⁻⁵ |
| S3 | 0.250 | 23.06 | 9.00 | 2.56 | 0.025 | 1/10.0 | 1.884 | 2.95 × 10⁻⁴ |
| S4 | 0.278 | 24.55 | 9.15 | 2.68 | 0.026 | 1/10.7 | 1.879 | 2.85 × 10⁻⁶ |
| S5 | 0.461 | 40.31 | 14.21 | 2.84 | 0.048 | 1/9.6 | 1.832 | 1.23 × 10⁻⁶ |
| S6 | 0.272 | 24.38 | 9.33 | 2.61 | 0.024 | 1/11.3 | 1.778 | 1.09 × 10⁻⁴ |
| S7 | 0.400 | 43.92 | 15.17 | 2.90 | 0.033 | 1/12.1 | 1.851 | 2.58 × 10⁻⁶ |
| S8 | 0.435 | 51.20 | 19.89 | 2.57 | 0.042 | 1/10.4 | 1.886 | 8.79 × 10⁻⁵ |
| S9 | 0.859 | 103.13 | 43.00 | 2.40 | 0.095 | 1/9.1 | 1.892 | 3.25 × 10⁻⁶ |
| S10 | 0.472 | 45.18 | 16.09 | 2.81 | 0.050 | 1/9.4 | 1.939 | 2.06 × 10⁻⁶ |
| S11 | 0.500 | 55.23 | 18.79 | 2.94 | 0.045 | 1/11.1 | 1.731 | 8.13 × 10⁻⁵ |
| S12 | 1.005 | 98.76 | 34.58 | 2.86 | 0.101 | 1/10.0 | 1.837 | 8.45 × 10⁻⁶ |
| S13 | 1.103 | 112.40 | 42.00 | 2.68 | 0.099 | 1/11.1 | 1.843 | 1.25 × 10⁻⁷ |
| S14 | 0.521 | 39.87 | 15.05 | 2.65 | 0.046 | 1/11.3 | 1.809 | 5.17 × 10⁻⁵ |
| S15 | 0.365 | 40.26 | 16.35 | 2.46 | 0.040 | 1/9.1 | 1.792 | 3.09 × 10⁻⁵ |
| S16 | 0.910 | 106.90 | 40.61 | 2.63 | 0.080 | 1/11.4 | 1.895 | 2.00 × 10⁻⁷ |
| S17 | 1.223 | 121.20 | 49.88 | 2.43 | 0.102 | 1/12.0 | 1.894 | 1.56 × 10⁻⁷ |
| S18 | 0.538 | 40.26 | 16.35 | 2.46 | 0.053 | 1/10.2 | 1.728 | 4.25 × 10⁻⁵ |
| S19 | 0.502 | 42.29 | 17.23 | 2.45 | 0.053 | 1/9.5 | 1.755 | 8.09 × 10⁻⁶ |
| S20 | 0.786 | 55.23 | 18.79 | 2.94 | 0.070 | 1/11.2 | 1.786 | 1.02 × 10⁻⁶ |
| S21 | 1.311 | 135.60 | 52.40 | 2.59 | 0.111 | 1/11.8 | 1.736 | 8.79 × 10⁻⁸ |
| S22 | 0.531 | 39.83 | 15.05 | 2.65 | 0.057 | 1/9.3 | 1.798 | 7.59 × 10⁻⁶ |
| S23 | 0.656 | 45.92 | 17.17 | 2.67 | 0.058 | 1/11.3 | 1.722 | 9.93 × 10⁻⁵ |
| S24 | 0.715 | 66.20 | 29.20 | 2.23 | 0.079 | 1/9.1 | 1.725 | 1.21 × 10⁻⁶ |
| S25 | 1.116 | 108.69 | 43.60 | 2.49 | 0.101 | 1/11.1 | 1.722 | 2.29 × 10⁻⁷ |
Table 4.
The range analysis of the parameters of similar-materials in the orthogonal test.
| Factors | A | B | C | D | Sum of Test Results | |
|---|---|---|---|---|---|---|
| ρ | K1 | 9.122 | 8.906 | 9.040 | 9.003 | ∑ = 45.241 |
| K2 | 9.346 | 9.141 | 8.808 | 9.163 | ||
| K3 | 9.013 | 9.063 | 8.977 | 9.087 | ||
| K4 | 9.058 | 9.060 | 9.219 | 8.986 | ||
| K5 | 8.703 | 9.071 | 9.197 | 9.002 | ||
| K1-a | 1.824 | 1.781 | 1.808 | 1.801 | ||
| K2-a | 1.869 | 1.828 | 1.762 | 1.833 | ||
| K3-a | 1.803 | 1.813 | 1.795 | 1.817 | ||
| K4-a | 1.812 | 1.812 | 1.844 | 1.797 | ||
| K5-a | 1.741 | 1.814 | 1.839 | 1.800 | ||
| R | 0.128 | 0.047 | 0.082 | 0.036 | ||
| σc | K1 | 1.485 | 3.261 | 2.330 | 3.574 | ∑ = 20.705 |
| K2 | 2.438 | 3.387 | 2.023 | 3.428 | ||
| K3 | 3.494 | 2.982 | 2.651 | 3.382 | ||
| K4 | 3.959 | 2.875 | 3.744 | 2.892 | ||
| K5 | 4.329 | 3.200 | 4.957 | 2.429 | ||
| K1-a | 0.297 | 0.652 | 0.466 | 0.715 | ||
| K2-a | 0.488 | 0.677 | 0.405 | 0.686 | ||
| K3-a | 0.699 | 0.596 | 0.530 | 0.676 | ||
| K4-a | 0.792 | 0.575 | 0.749 | 0.578 | ||
| K5-a | 0.866 | 0.640 | 1.191 | 0.686 | ||
| R | 0.378 | 0.102 | 0.586 | 0.229 | ||
| σt | K1 | 0.148 | 0.288 | 0.234 | 0.352 | ∑ = 1.487 |
| K2 | 0.244 | 0.314 | 0.196 | 0.329 | ||
| K3 | 0.331 | 0.277 | 0.252 | 0.298 | ||
| K4 | 0.358 | 0.299 | 0.350 | 0.263 | ||
| K5 | 0.406 | 0.309 | 0.455 | 0.245 | ||
| K1-a | 0.0296 | 0.0576 | 0.0468 | 0.0704 | ||
| K2-a | 0.0488 | 0.0628 | 0.0392 | 0.0658 | ||
| K3-a | 0.0662 | 0.0554 | 0.0504 | 0.0596 | ||
| K4-a | 0.0716 | 0.0598 | 0.07 | 0.0526 | ||
| K5-a | 0.0812 | 0.0618 | 0.091 | 0.049 | ||
| R | 0.0516 | 0.0074 | 0.0518 | 0.0214 | ||
| K | K1 | 3.51 × 10⁻⁴ | 2.22 × 10⁻⁴ | 1.35 × 10⁻⁴ | 1.44 × 10⁻⁴ | ∑ = 1.19 × 10⁻³ |
| K2 | 2.05 × 10⁻⁴ | 3.96 × 10⁻⁵ | 2.68 × 10⁻⁴ | 2.44 × 10⁻⁵ | ||
| K3 | 1.72 × 10⁻⁴ | 5.25 × 10⁻⁴ | 6.81 × 10⁻⁴ | 7.56 × 10⁻⁴ | ||
| K4 | 5.20 × 10⁻⁵ | 6.71 × 10⁻⁵ | 9.96 × 10⁻⁵ | 7.89 × 10⁻⁵ | ||
| K5 | 1.08 × 10⁻⁵ | 3.54 × 10⁻⁵ | 4.85 × 10⁻⁶ | 1.86 × 10⁻⁴ | ||
| K1-a | 7.02 × 10⁻⁵ | 4.44 × 10⁻⁵ | 2.70 × 10⁻⁵ | 2.88 × 10⁻⁵ | ||
| K2-a | 4.10 × 10⁻⁵ | 7.92 × 10⁻⁶ | 5.36 × 10⁻⁵ | 4.88 × 10⁻⁶ | ||
| K3-a | 3.44 × 10⁻⁵ | 1.05 × 10⁻⁴ | 1.36 × 10⁻⁴ | 1.51 × 10⁻⁴ | ||
| K4-a | 1.04 × 10⁻⁵ | 1.34 × 10⁻⁵ | 1.99 × 10⁻⁵ | 1.58 × 10⁻⁵ | ||
| K5-a | 2.16 × 10⁻⁶ | 7.08 × 10⁻⁶ | 9.70 × 10⁻⁷ | 3.72 × 10⁻⁵ | ||
| R | 7.00 × 10⁻⁵ | 9.79 × 10⁻⁵ | 1.35 × 10⁻⁴ | 1.46 × 10⁻⁴ | ||
Table 5.
The variance analysis of similar-material density (Seq SS: the sum of the squares of deviations; Adj SS: adjusted squares sum of deviations; Adj MS: adjusted squares sum of mean-square error).
Table 5.
The variance analysis of similar-material density (Seq SS: the sum of the squares of deviations; Adj SS: adjusted squares sum of deviations; Adj MS: adjusted squares sum of mean-square error).
| Variance Sources | Free Degree | SeqSS | Adj SS | Adj MS | F | p |
|---|---|---|---|---|---|---|
| A | 4 | 0.042940 | 0.042940 | 0.010735 | 2.69 | 0.109 |
| B | 4 | 0.005942 | 0.005942 | 0.001486 | 0.37 | 0.823 |
| C | 4 | 0.022829 | 0.022829 | 0.005707 | 1.43 | 0.309 |
| D | 4 | 0.004546 | 0.004546 | 0.001137 | 0.28 | 0.880 |
| Error | 8 | 0.031966 | 0.031966 | 0.003996 |
Table 6.
The original rock and model parameter of aquifuge.
| Stratum | ρ (g/cm3) | σc (MPa) | σt (MPa) | K (cm/s) | |
|---|---|---|---|---|---|
| Mudstone | Protolith | 1.815 | 54.25 | 9.65 | 3.55 × 10⁻⁶ |
| Model | 1.801 | 0.261 | 0.048 | 2.52 × 10⁻⁷ | |
| Sandstone | Protolith | 1.903 | 92.30 | 16.25 | 1.69 × 10⁻⁵ |
| Model | 1.893 | 0.458 | 0.081 | 1.20 × 10⁻⁶ | |
Table 7.
The optimal ratio of similar-material in aquifuge
| Stratum | A (%) | B | C | D (%) | Sand: Calcium Carbonate: Talc Powder: White Cement: Vaseline: Antiwear Hydraulic Oil |
|---|---|---|---|---|---|
| Mudstone | 87.45 | 1.27 | 1.19 | 4.78 | 12.46:1.00:0.79:0.69:0.89:0.79 |
| Sandstone | 75.32 | 1.43 | 1.74 | 3.65 | 5.19:1.00:0.70:0.51:0.29:0.29 |
© 2018 by the authors. Licensee MDPI, Basel, Switzerland. This article is an open access article distributed under the terms and conditions of the Creative Commons Attribution (CC BY) license (http://creativecommons.org/licenses/by/4.0/).
Share and Cite
MDPI and ACS Style
Liu, S.; Liu, W. Experimental Development Process of a New Fluid–Solid Coupling Similar-Material Based on the Orthogonal Test. Processes 2018, 6, 211. https://doi.org/10.3390/pr6110211
AMA Style
Liu S, Liu W. Experimental Development Process of a New Fluid–Solid Coupling Similar-Material Based on the Orthogonal Test. Processes. 2018; 6(11):211. https://doi.org/10.3390/pr6110211
Chicago/Turabian StyleLiu, Shiliang, and Weitao Liu. 2018. "Experimental Development Process of a New Fluid–Solid Coupling Similar-Material Based on the Orthogonal Test" Processes 6, no. 11: 211. https://doi.org/10.3390/pr6110211
Note that from the first issue of 2016, this journal uses article numbers instead of page numbers. See further details here.