Resolving Early Signaling Events in T-Cell Activation Leading to IL-2 and FOXP3 Transcription

Abstract
:1. Introduction
2. Materials and Methods
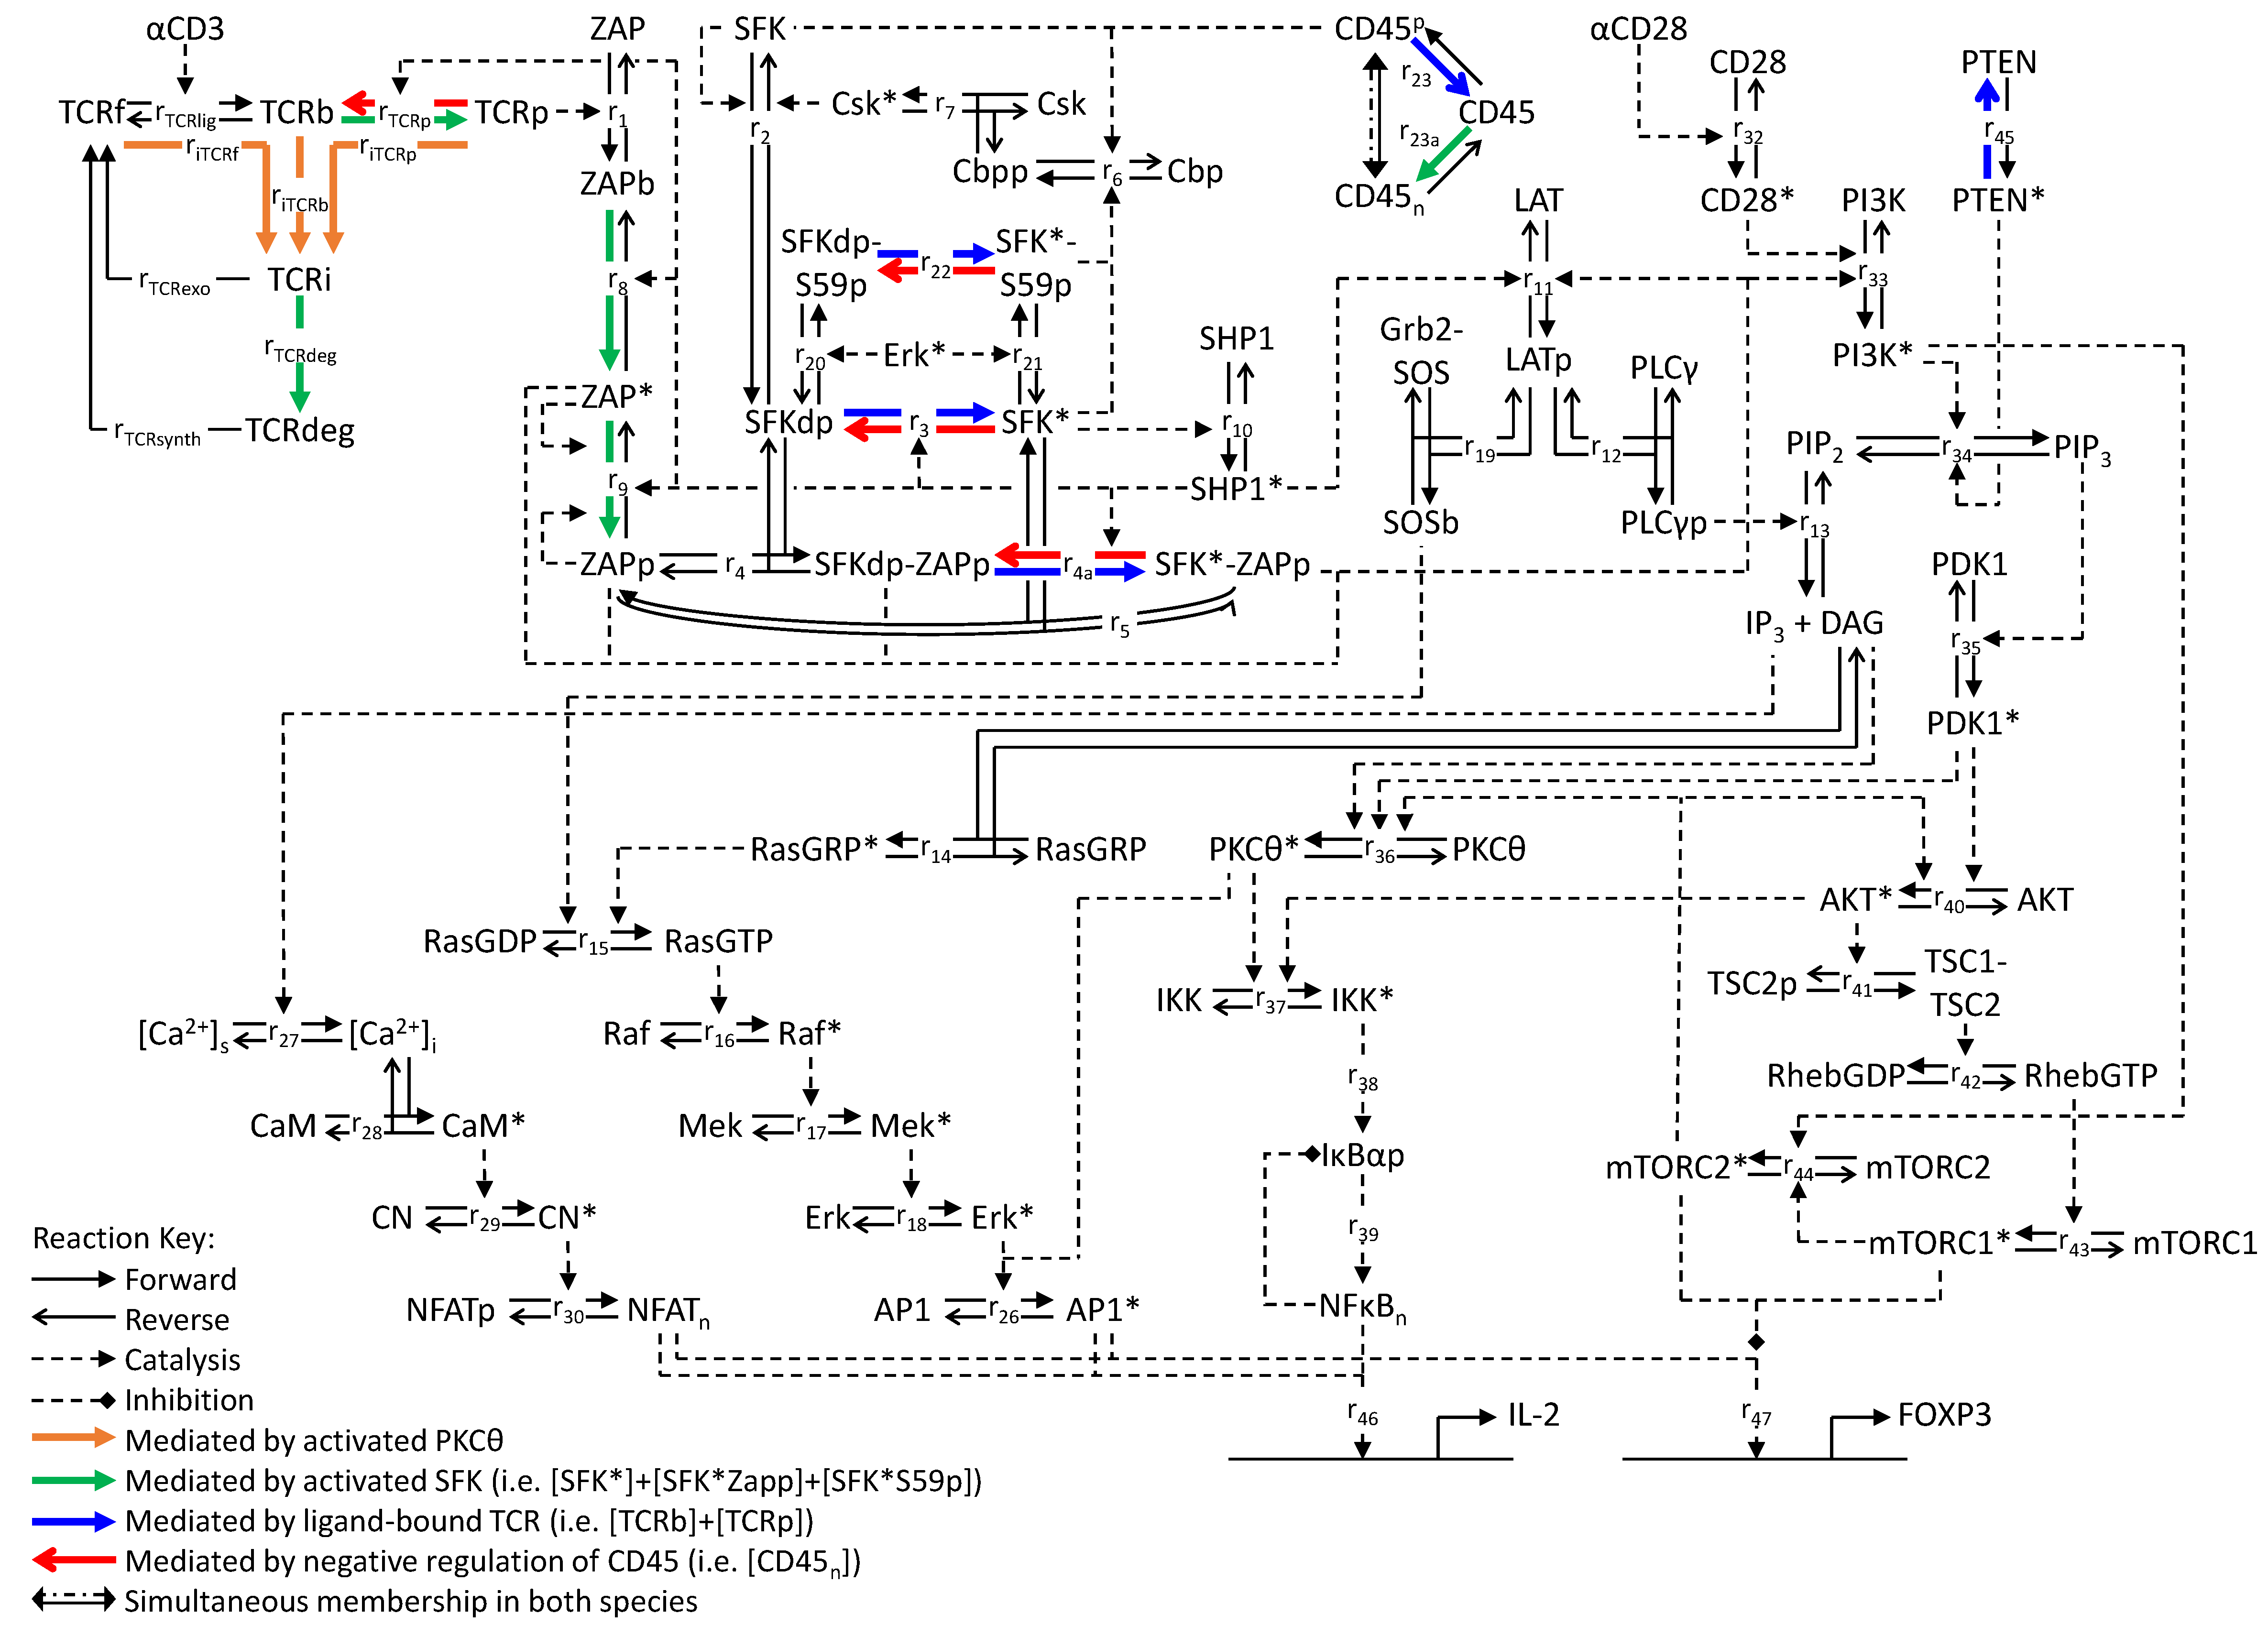
2.1. The Mathematical Model: Overview and Scope

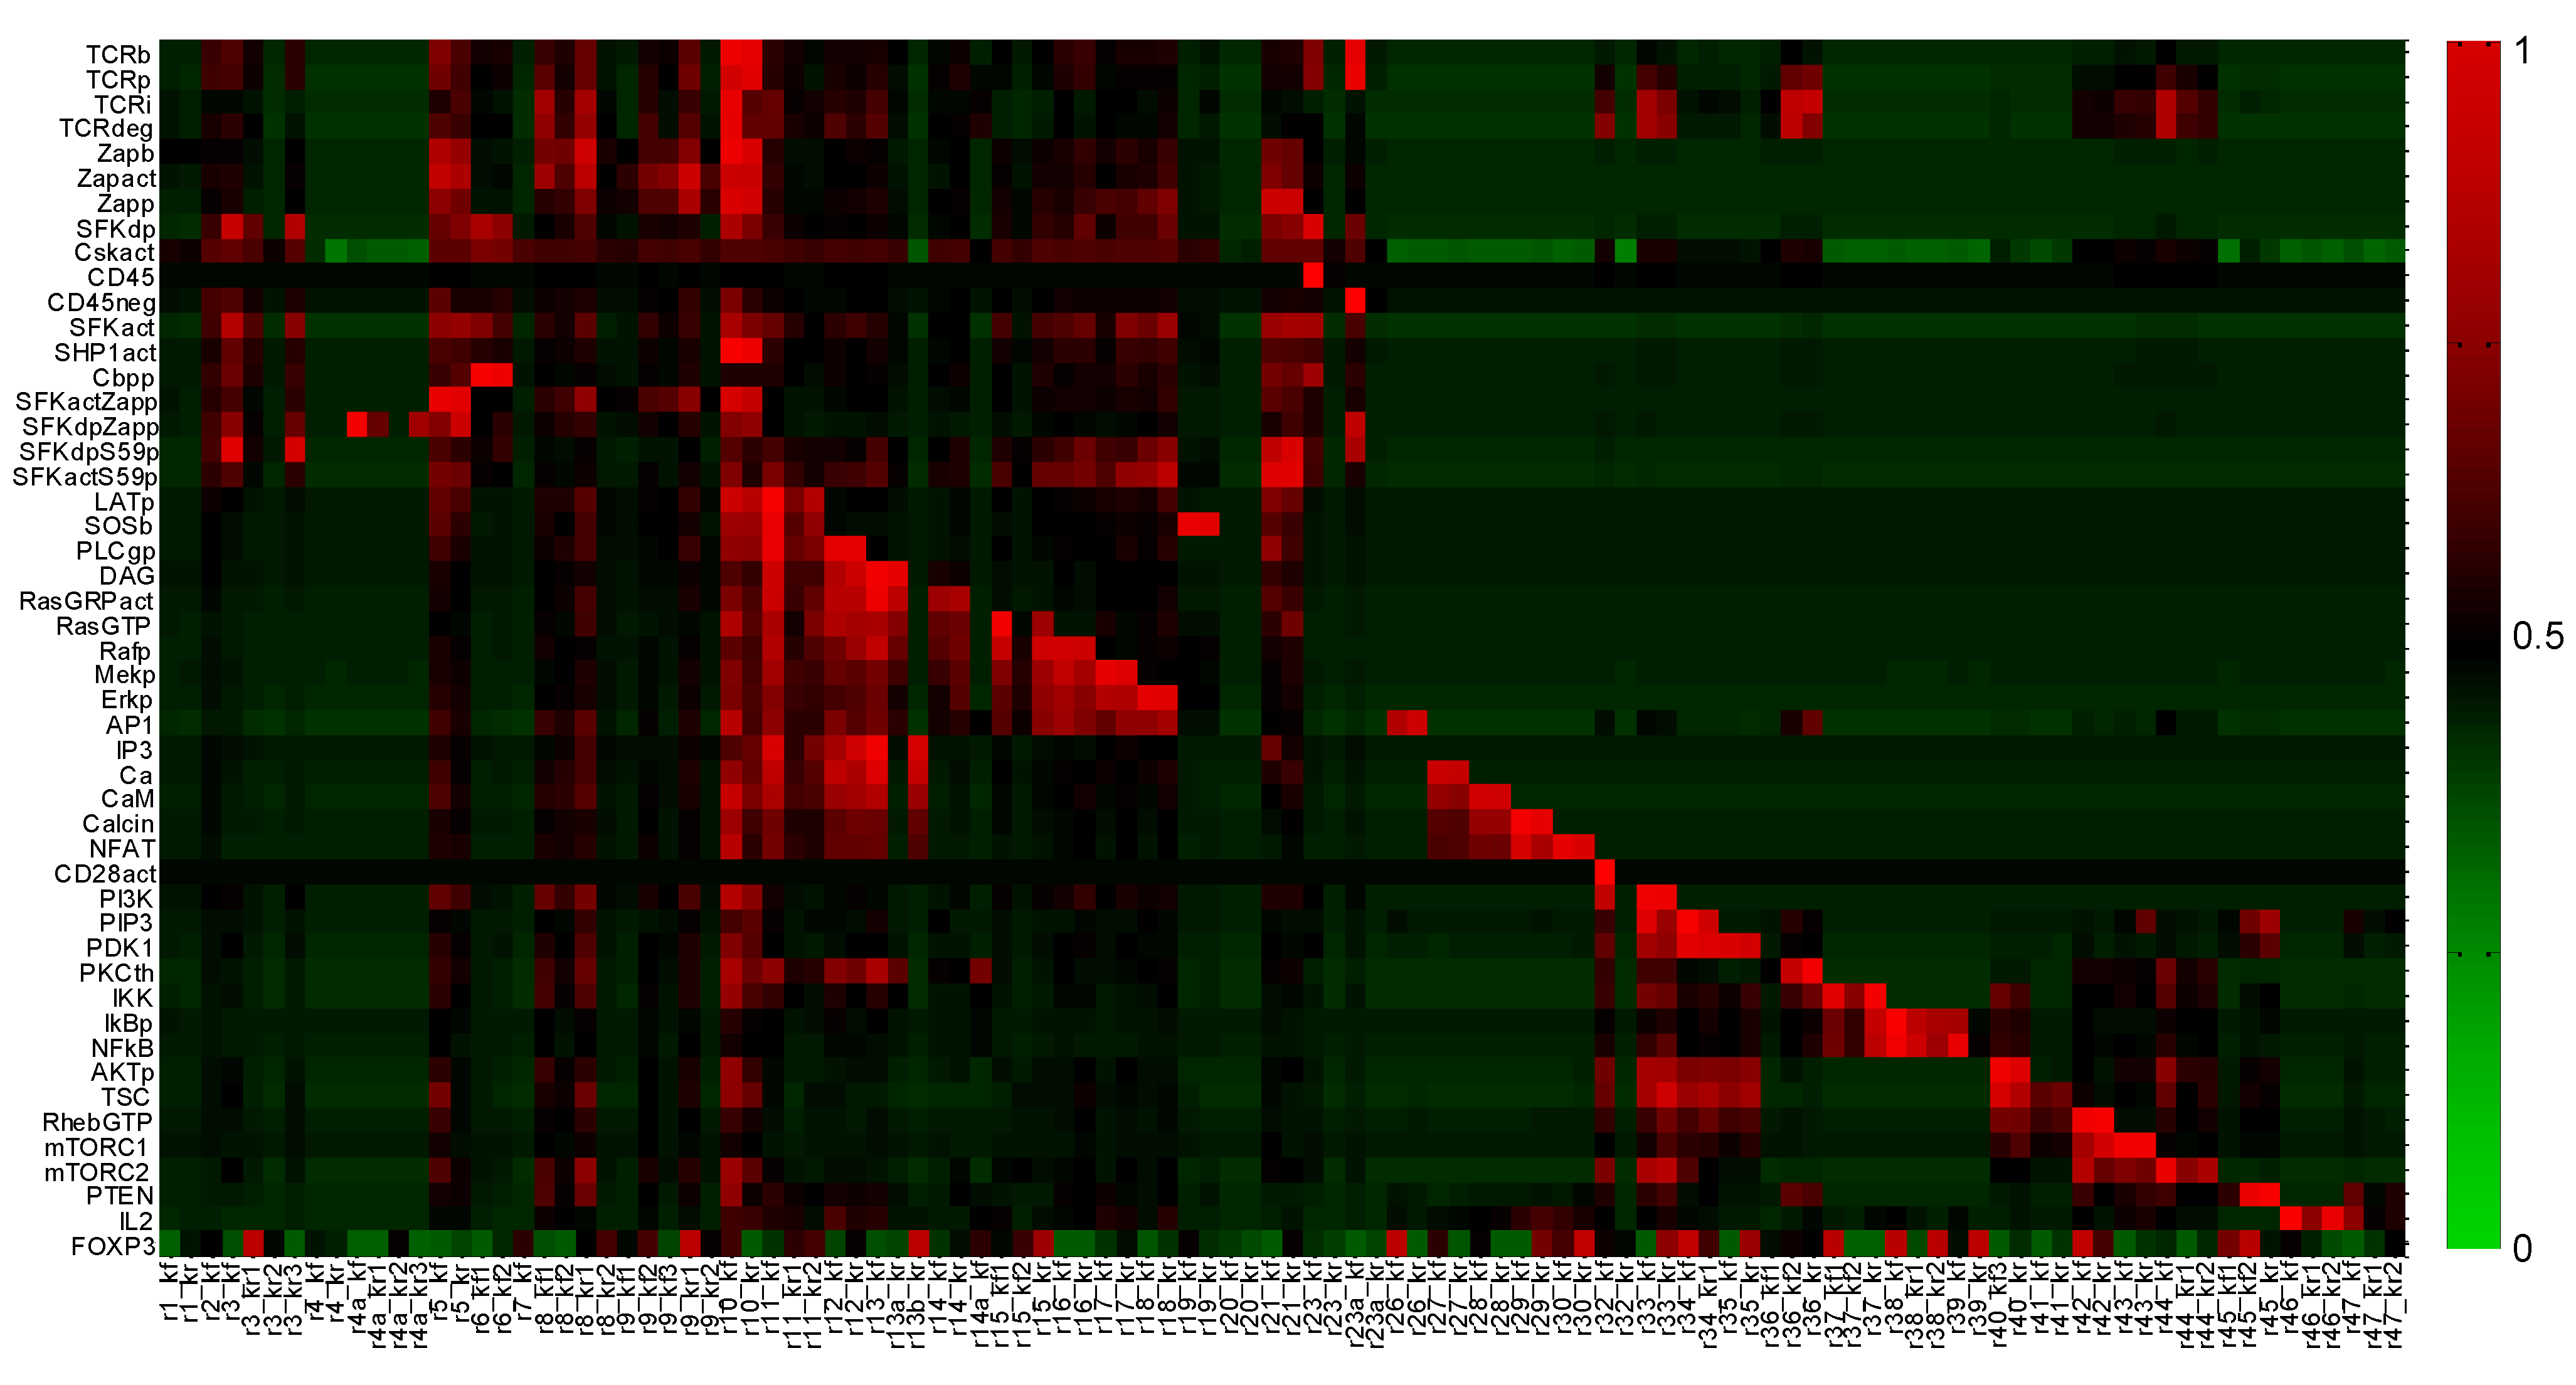
2.2. Global Sensitivity Analysis
2.3. Parameter Identification
2.4. Experimental Datasets for Model Development

| Species | Variable(s) | Experiment Type | Cell Type | Figure | Source(s) |
|---|---|---|---|---|---|
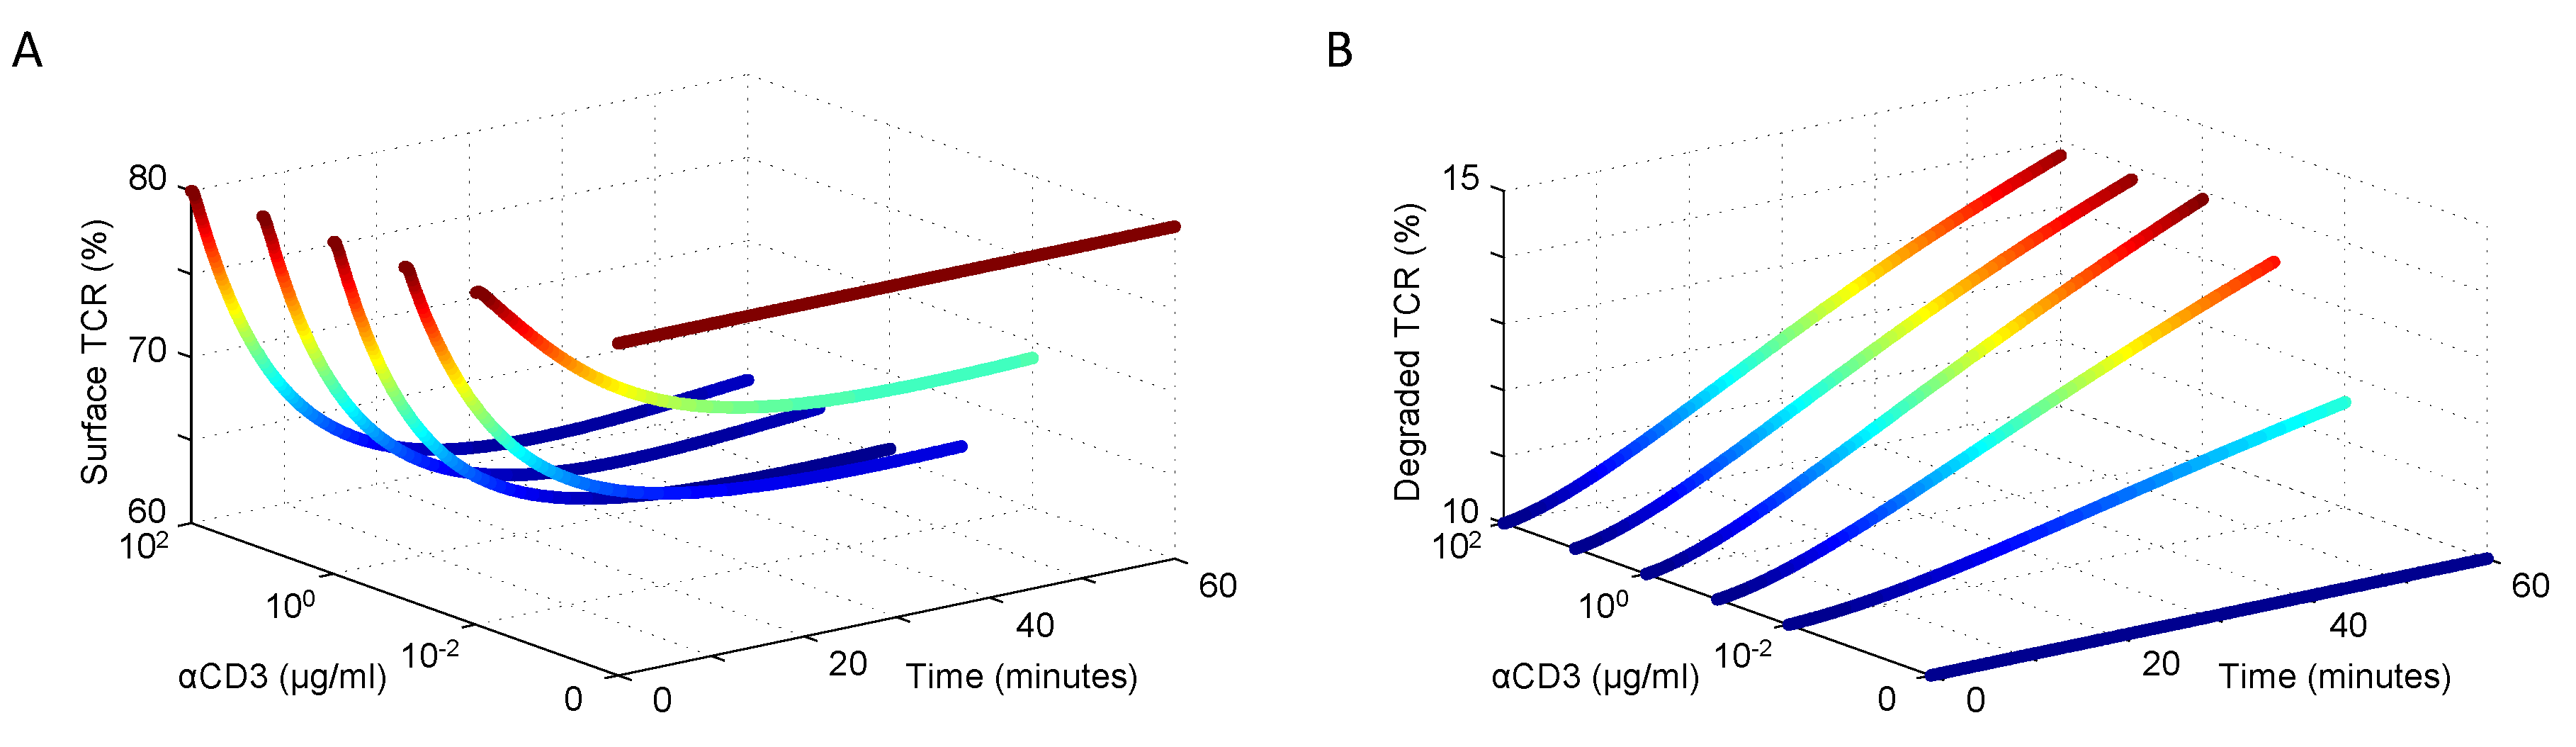
| TCR | αCD3 | Dynamic dose response | Jurkat | 2 | [45,46] |
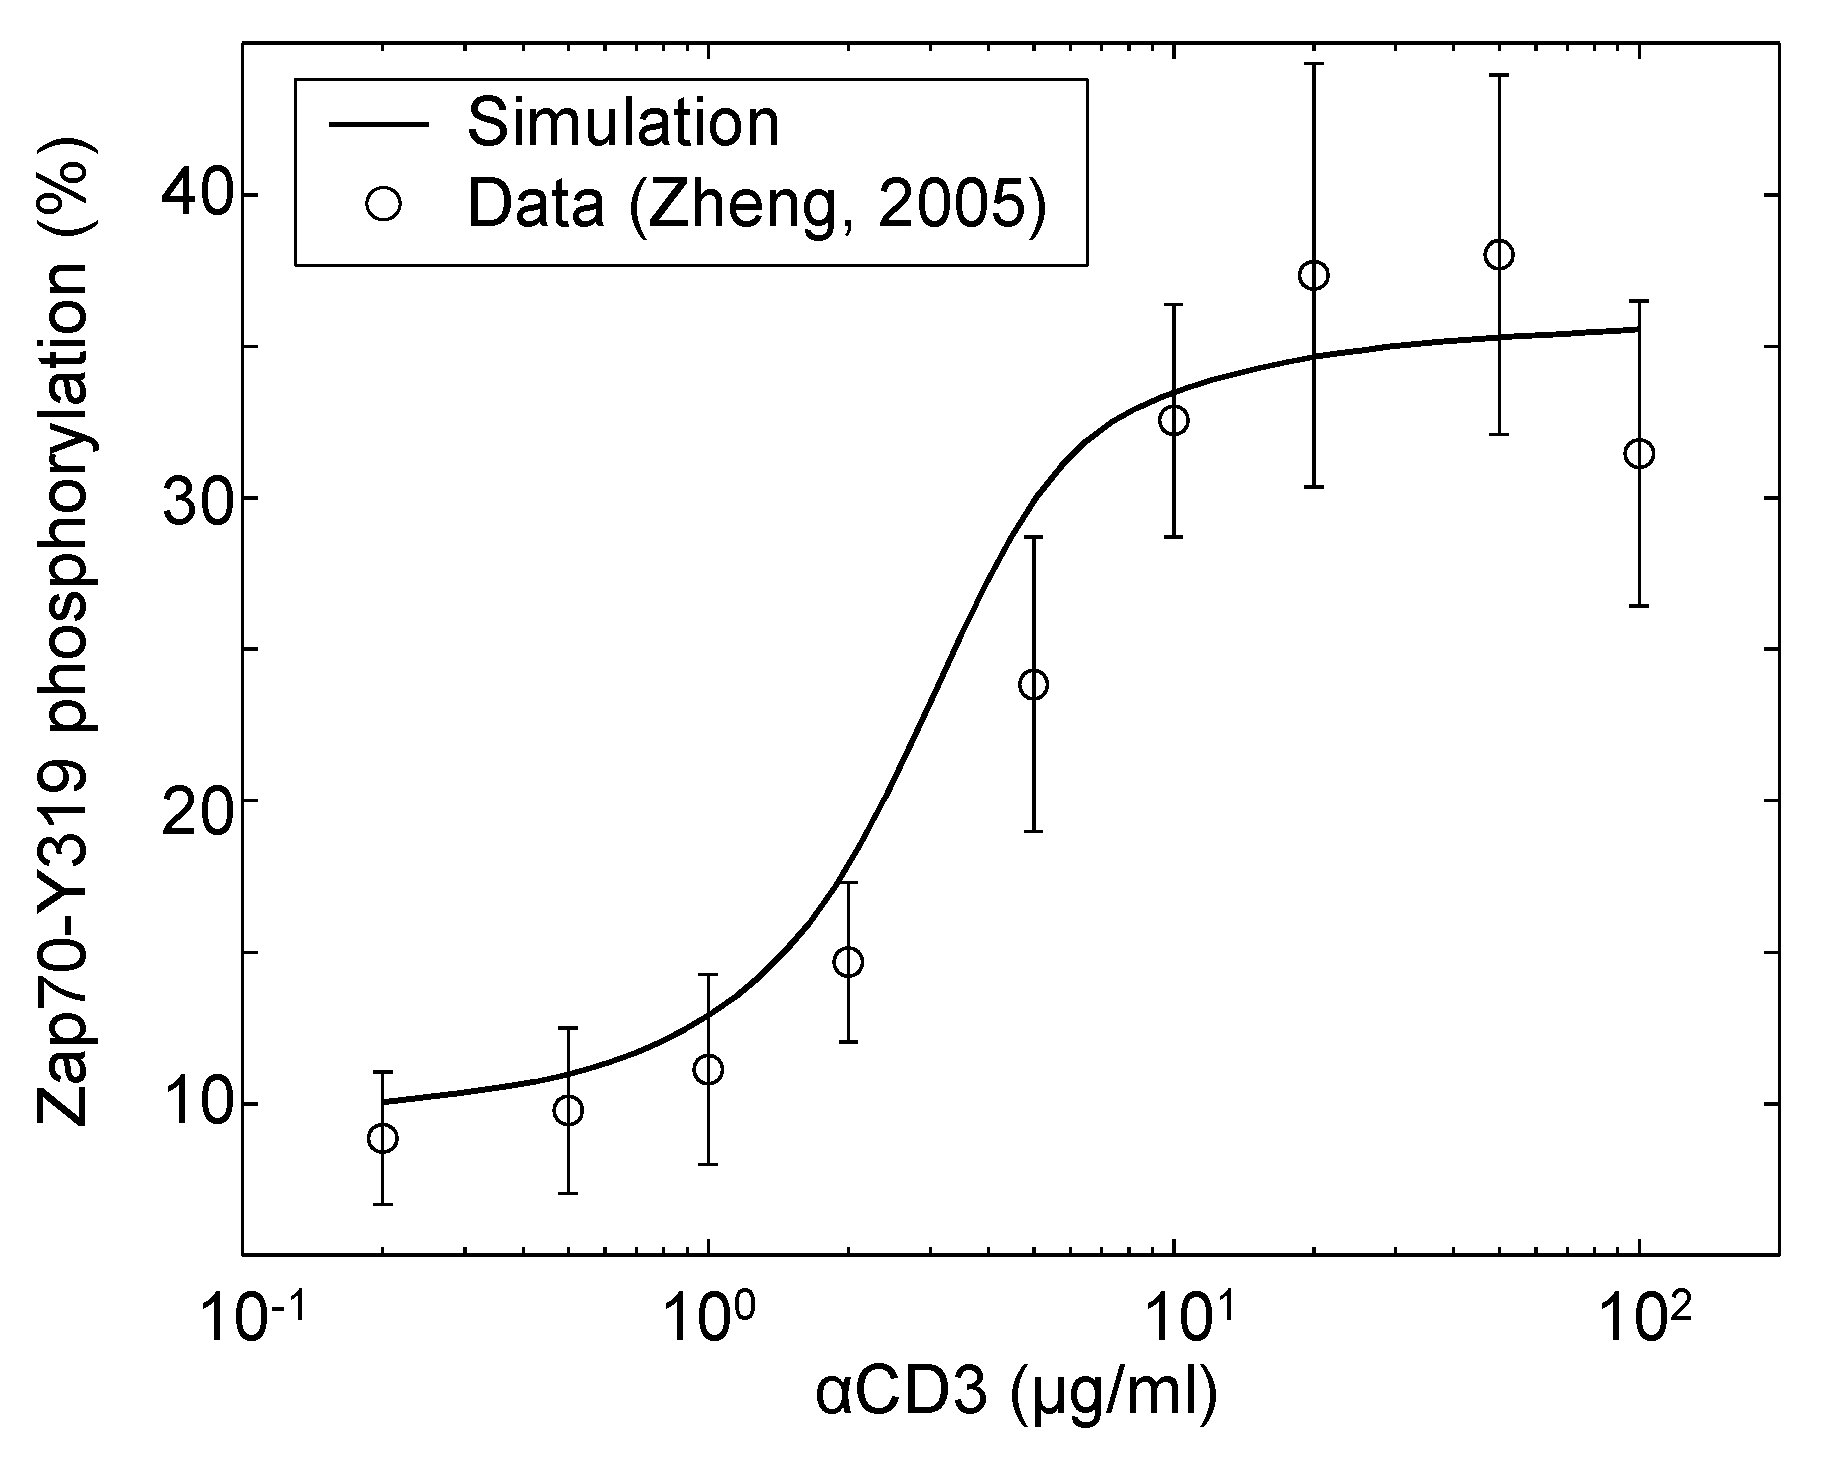
| Zap70 | αCD3 | Dose response | Jurkat | 4 | [40] |
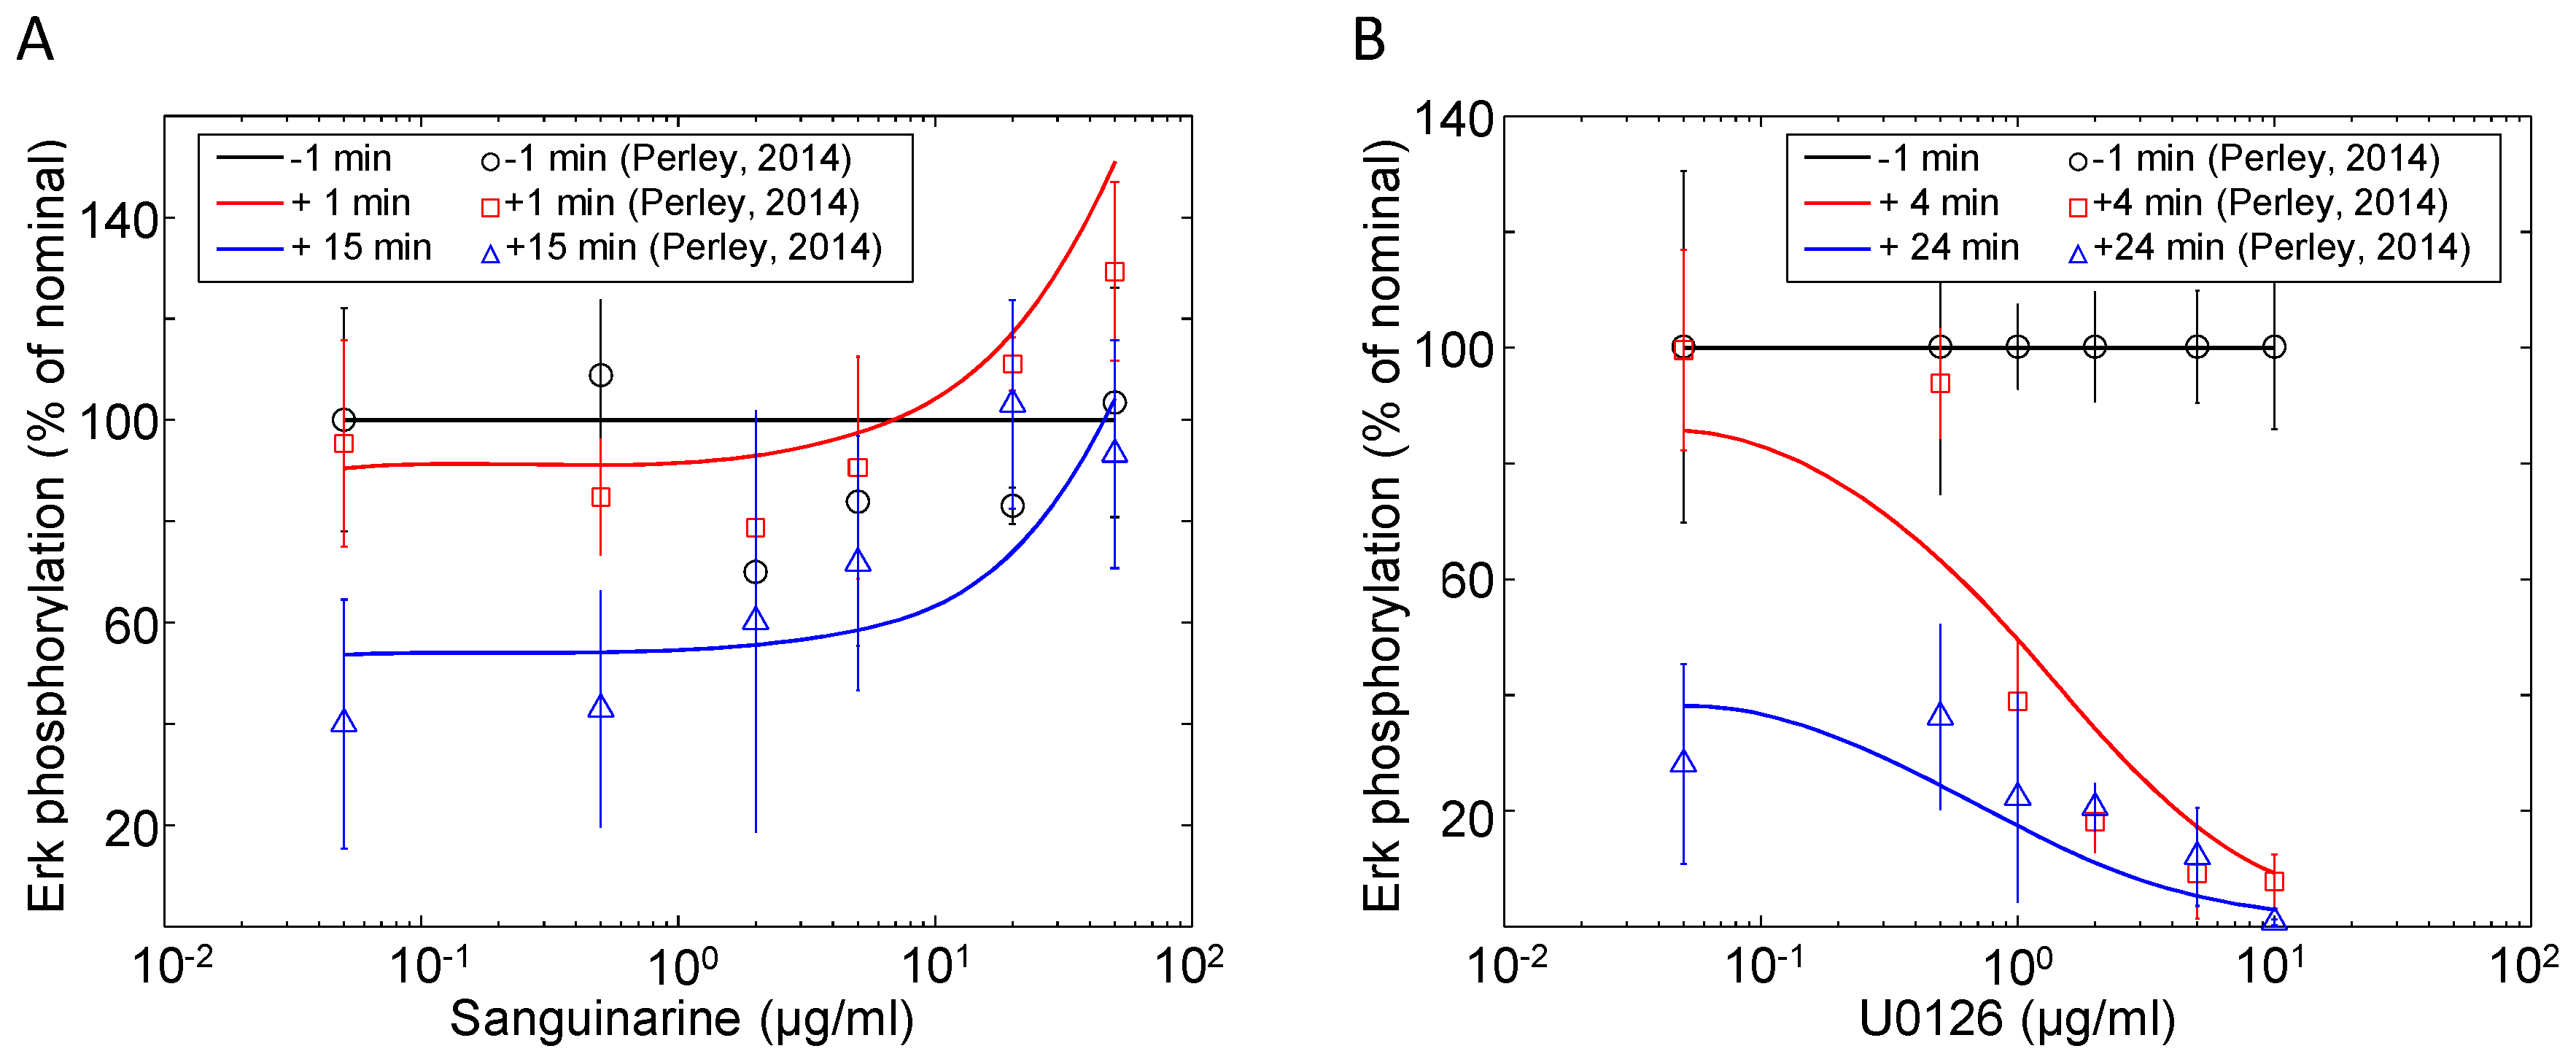
| Erk | Sanguinarine, U0126 | Dynamic dose response | Jurkat | 5 | [41] |
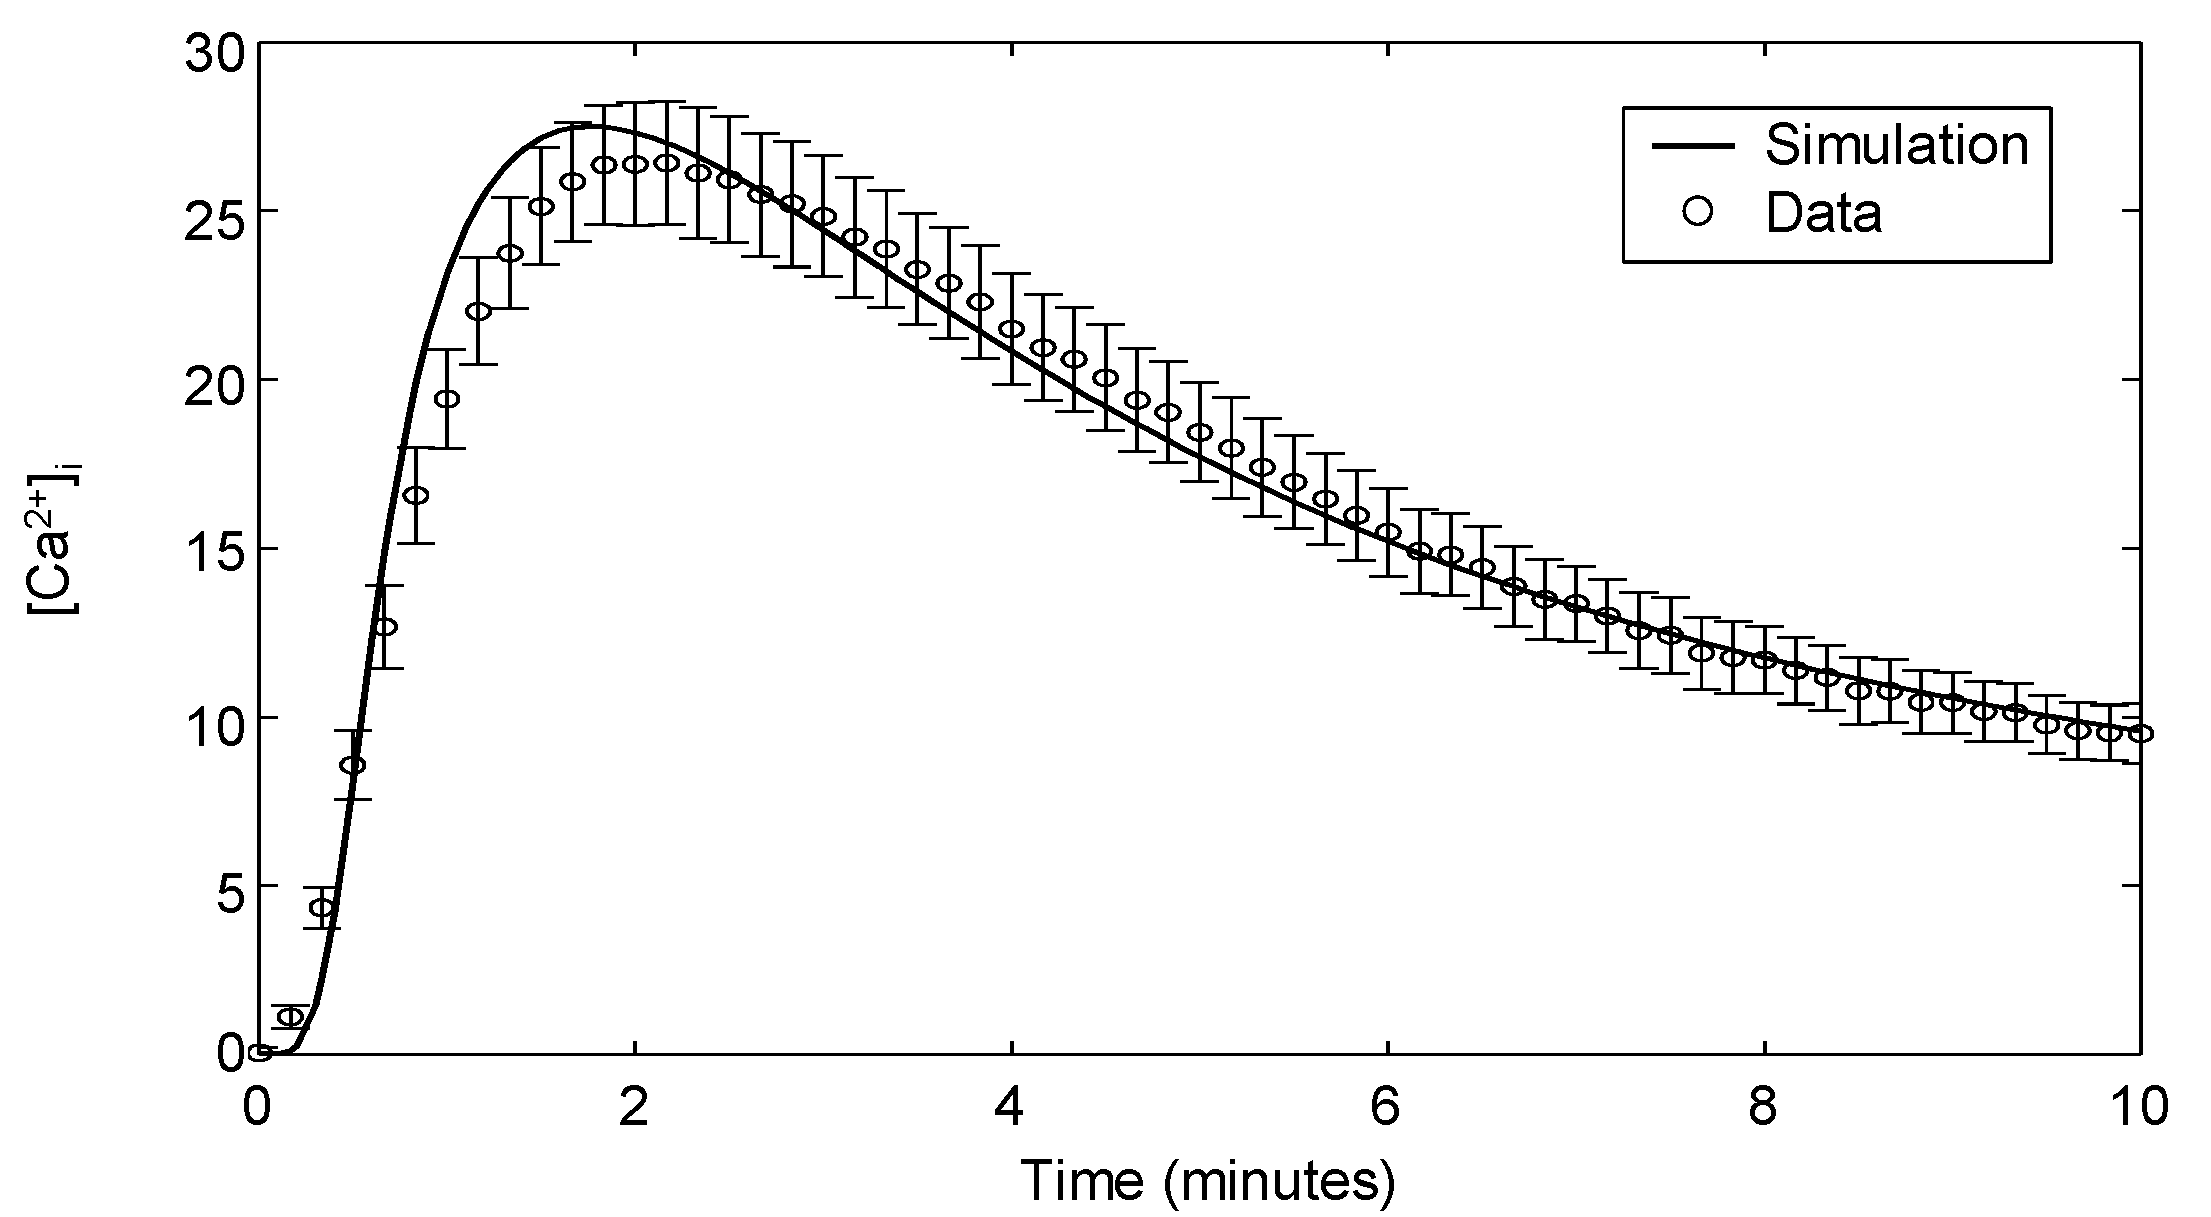
| Ca | αCD3 | Dynamics | Jurkat | 6 | Appendix 3 |
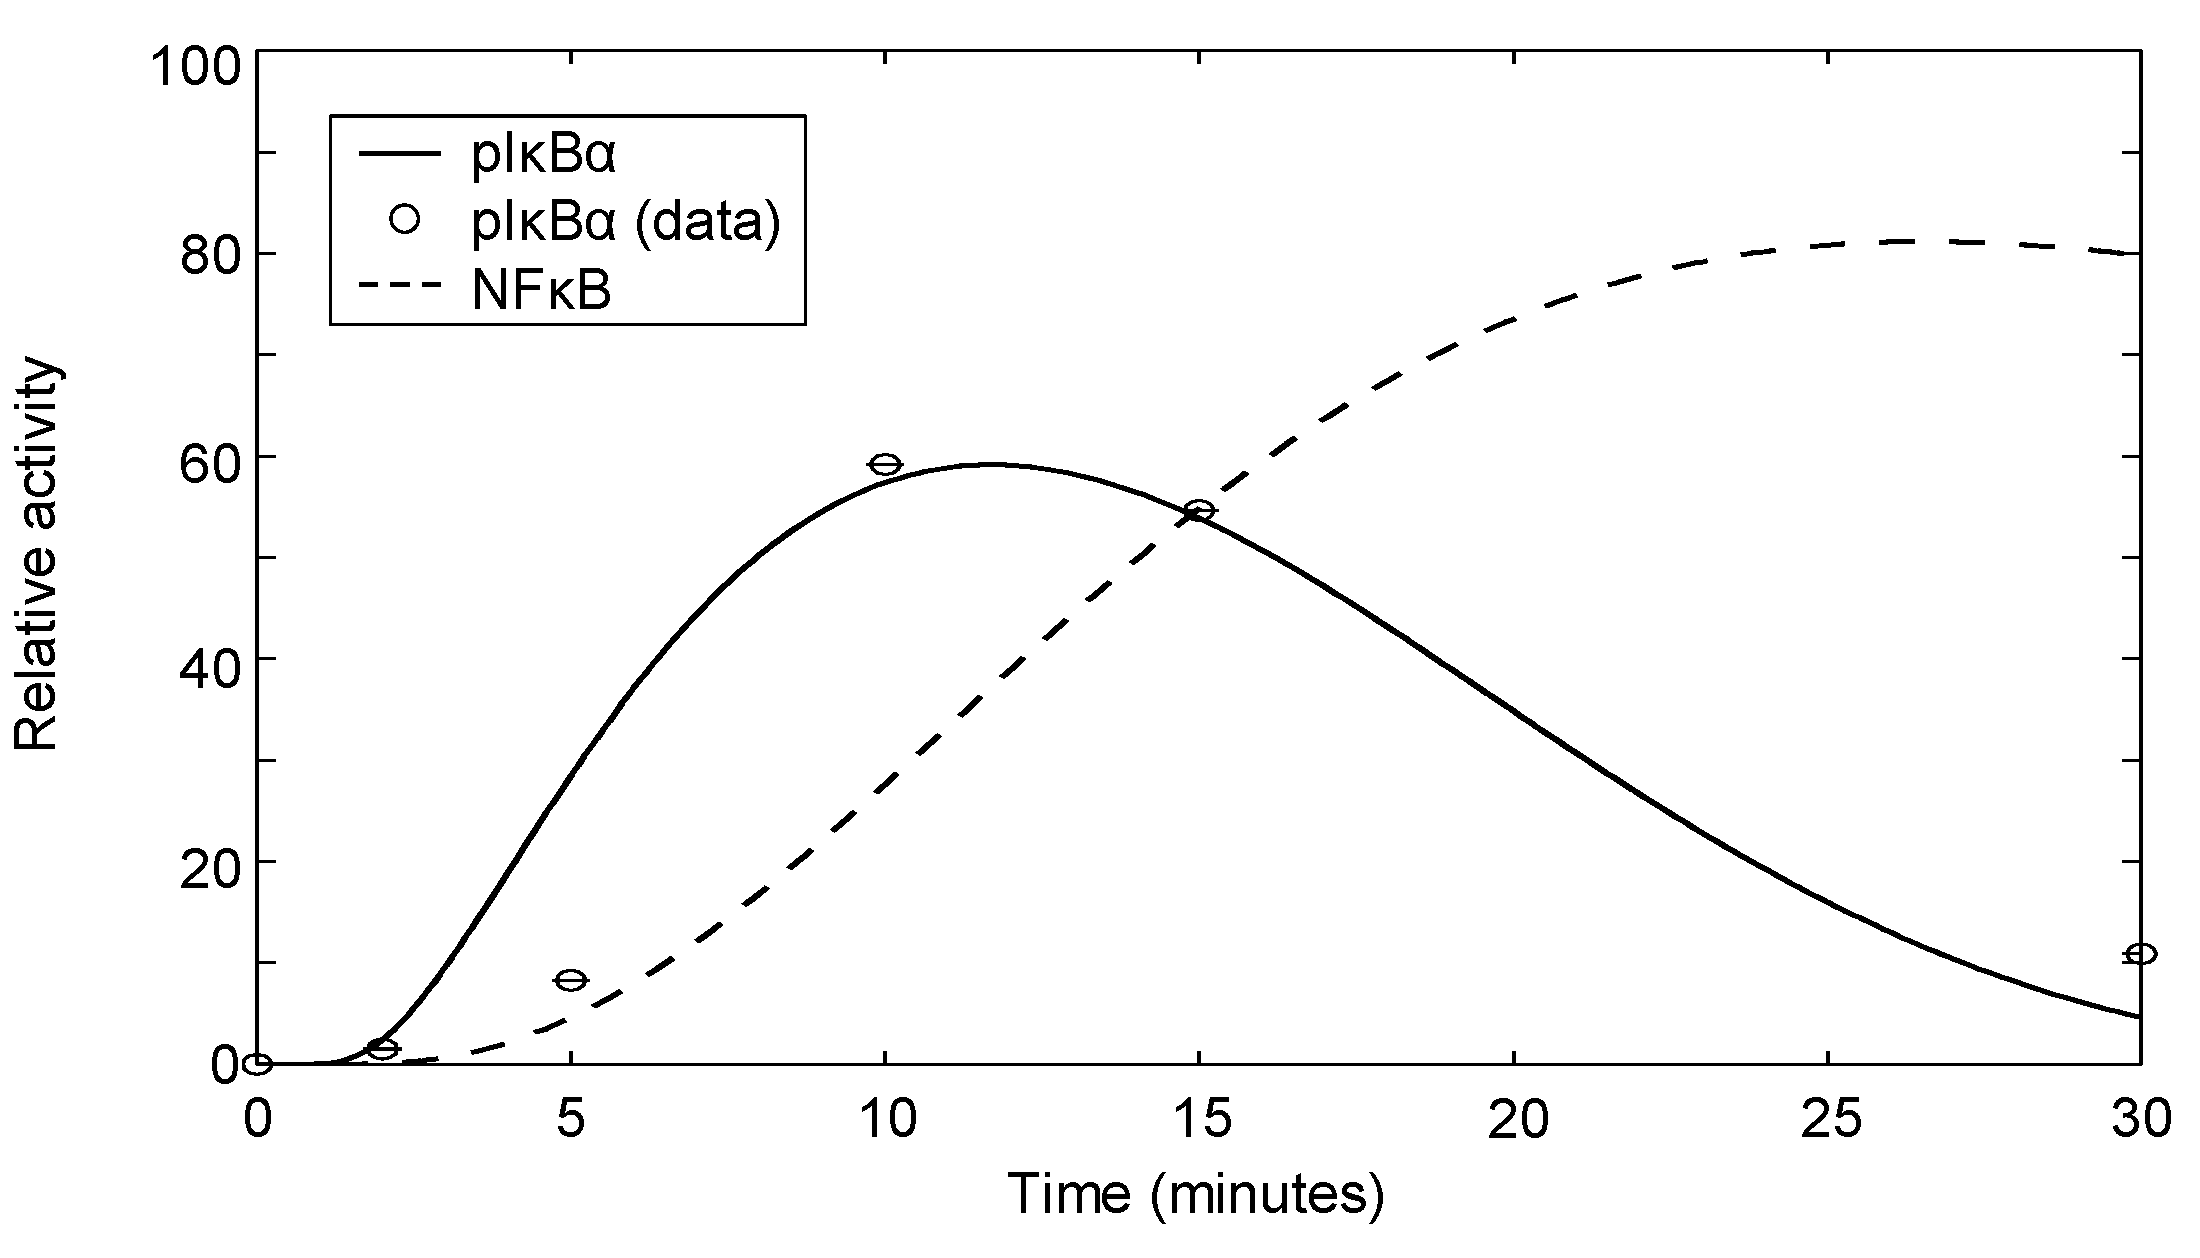
| IκBα | αCD3+αCD28 | Dynamics | Jurkat | 7 | Appendix 4 |
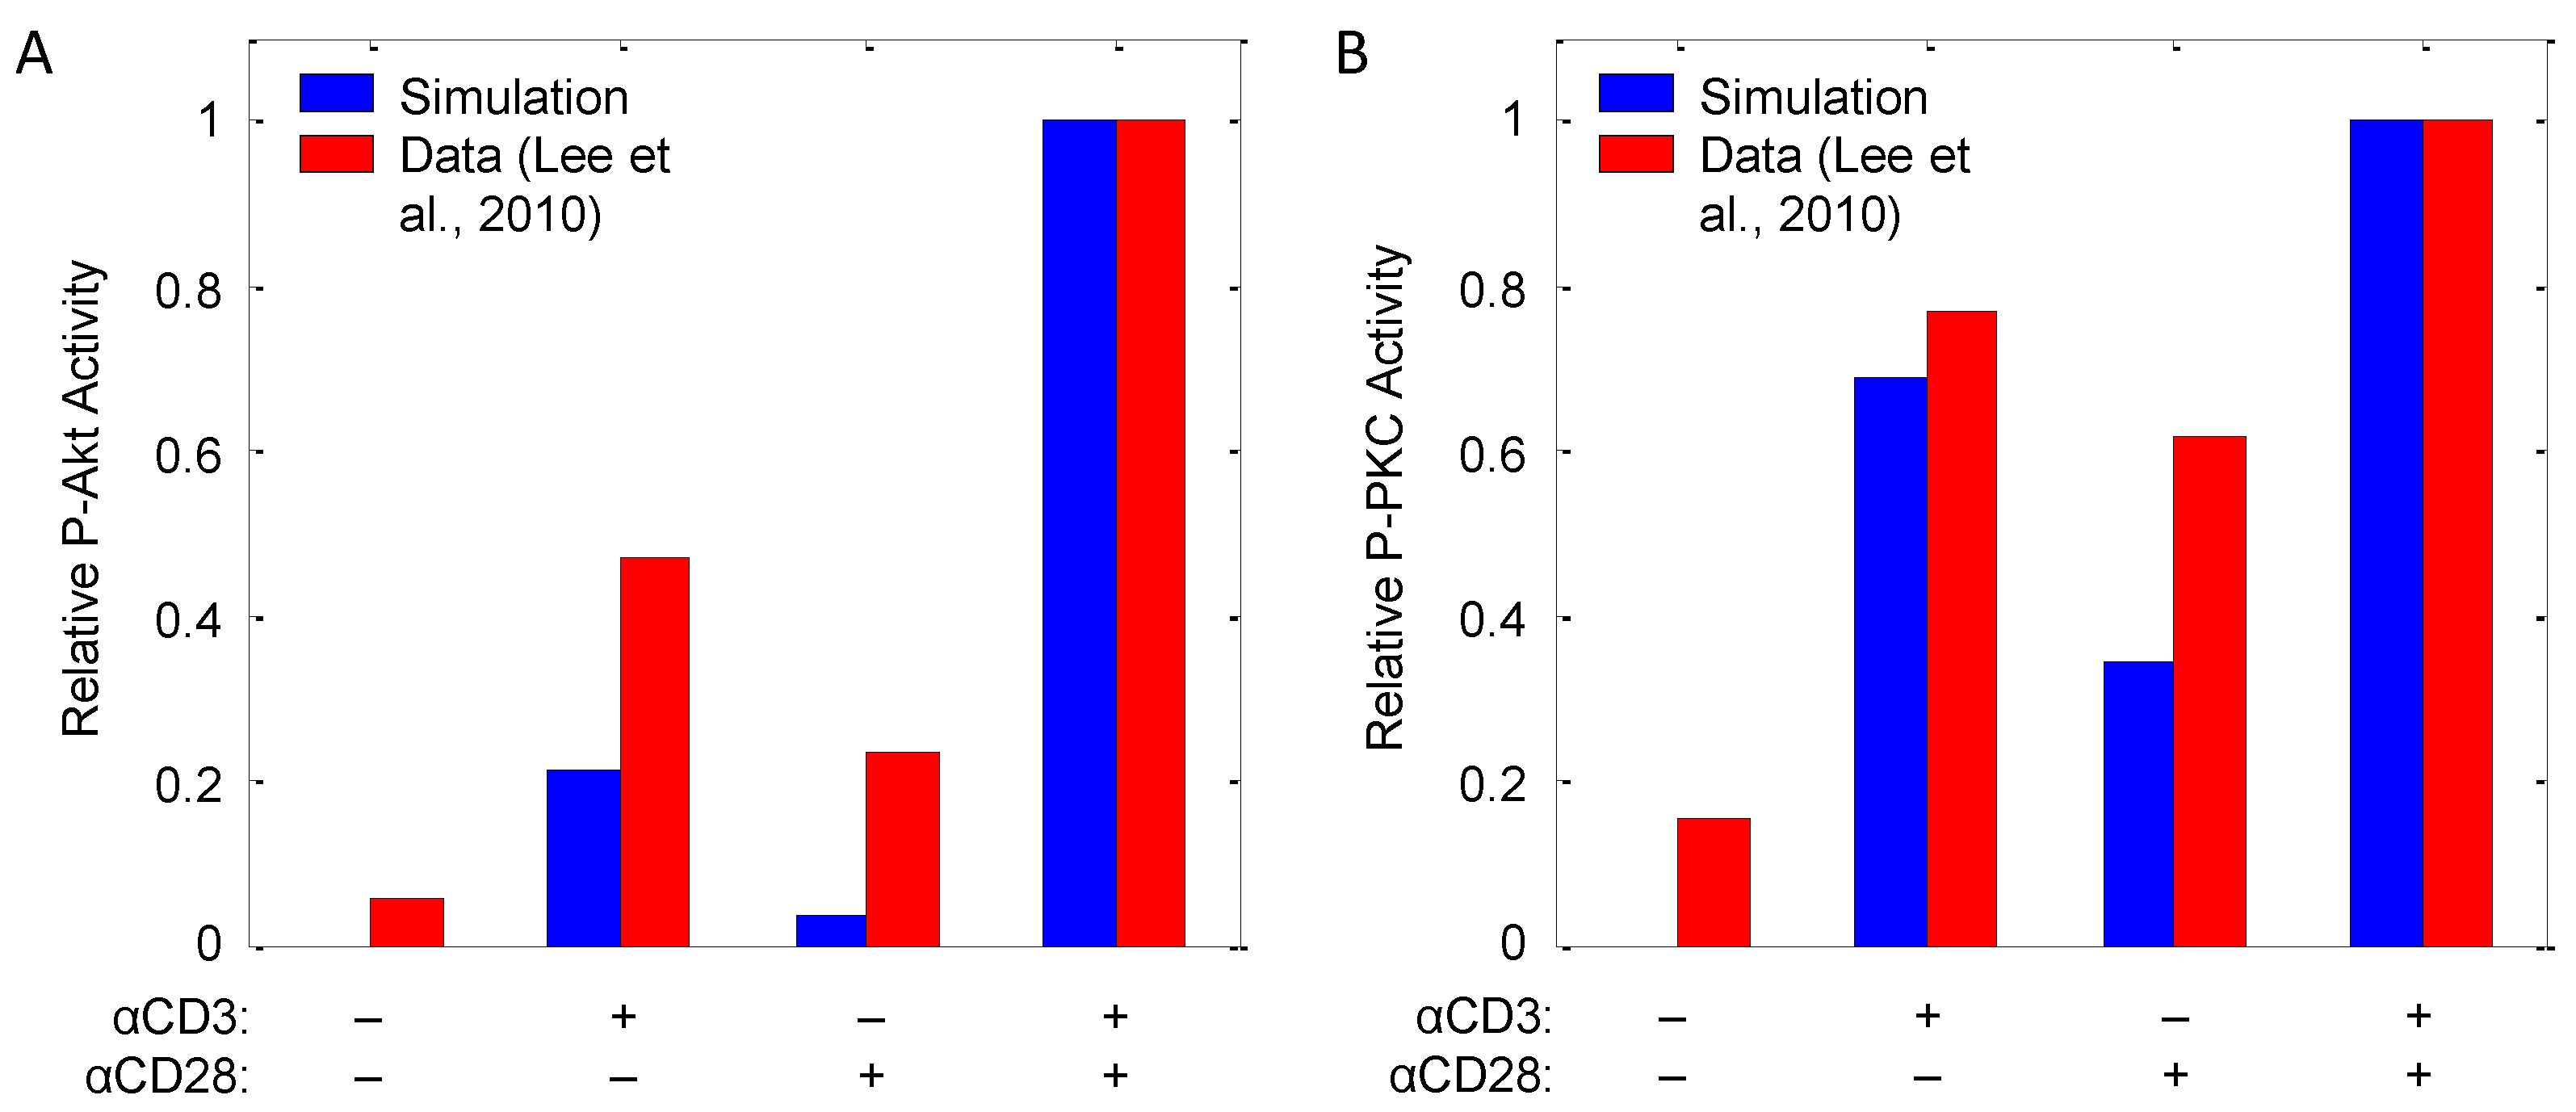
| Akt, PKCθ | αCD3, αCD28 | Input response | CD4+ T-cells (murine) | 8 | [32] |
3. Model Development
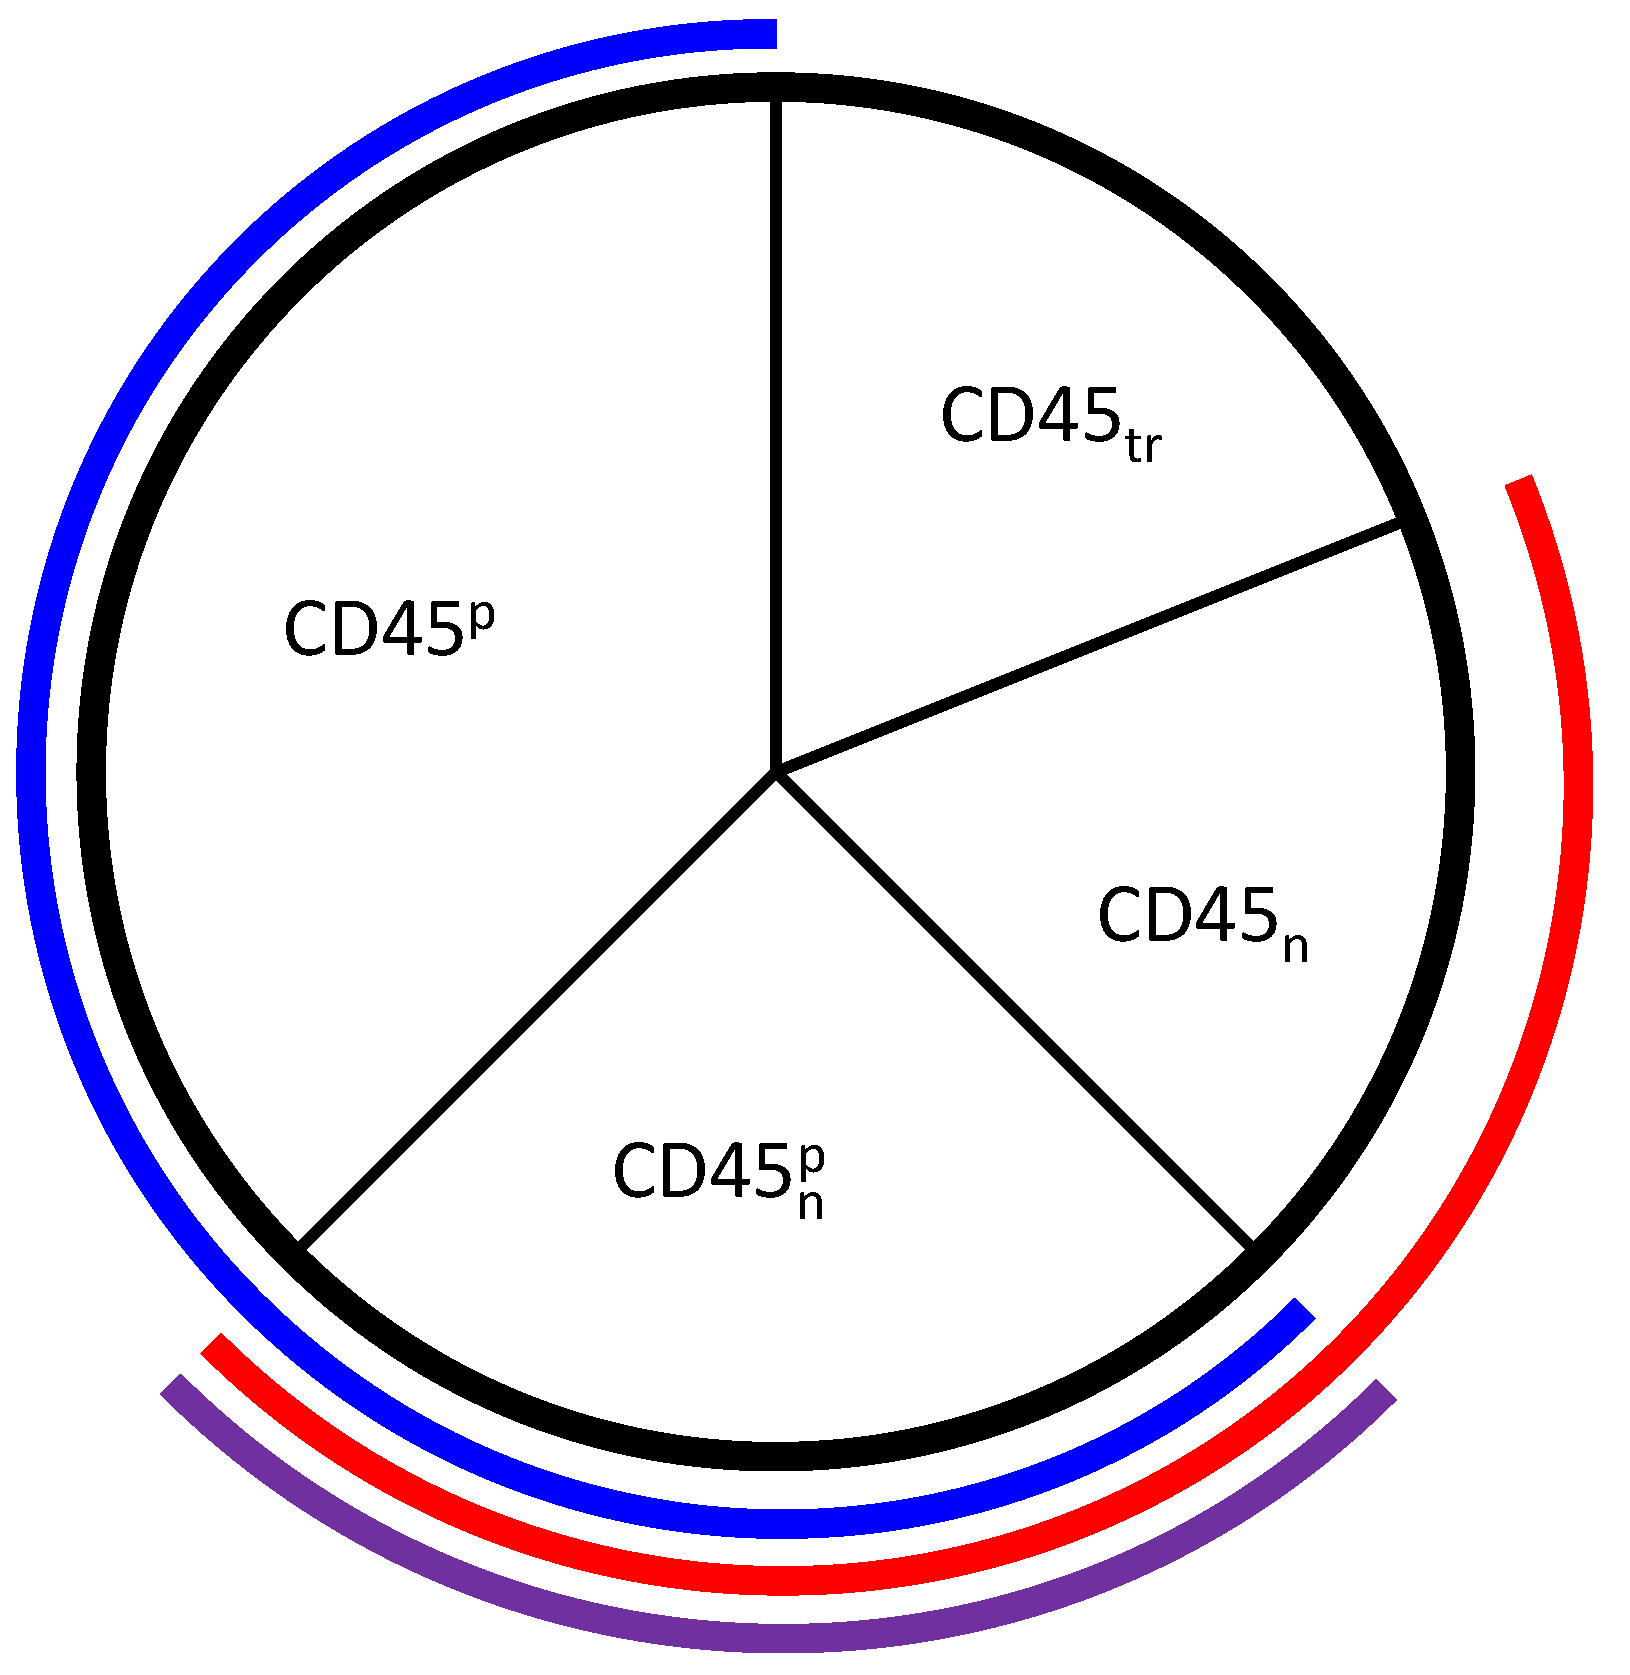
3.1. Modeling TCR Trafficking

3.2. Tuning the Roles of CD45 and SHP1

3.3. Tuning Erk Signaling

3.4. Modeling Calcium Signaling
3.5. Modeling CD28 Costimulation
3.6. Modeling NFκB Signaling
3.7. Modeling mTOR Signaling

4. Results and Discussion
4.1. Model Corroboration
4.1.1. Experimental Datasets for Model Corroboration
| Species | Variable(s) | Experiment Type | Cell Type | Figure | Source |
|---|---|---|---|---|---|
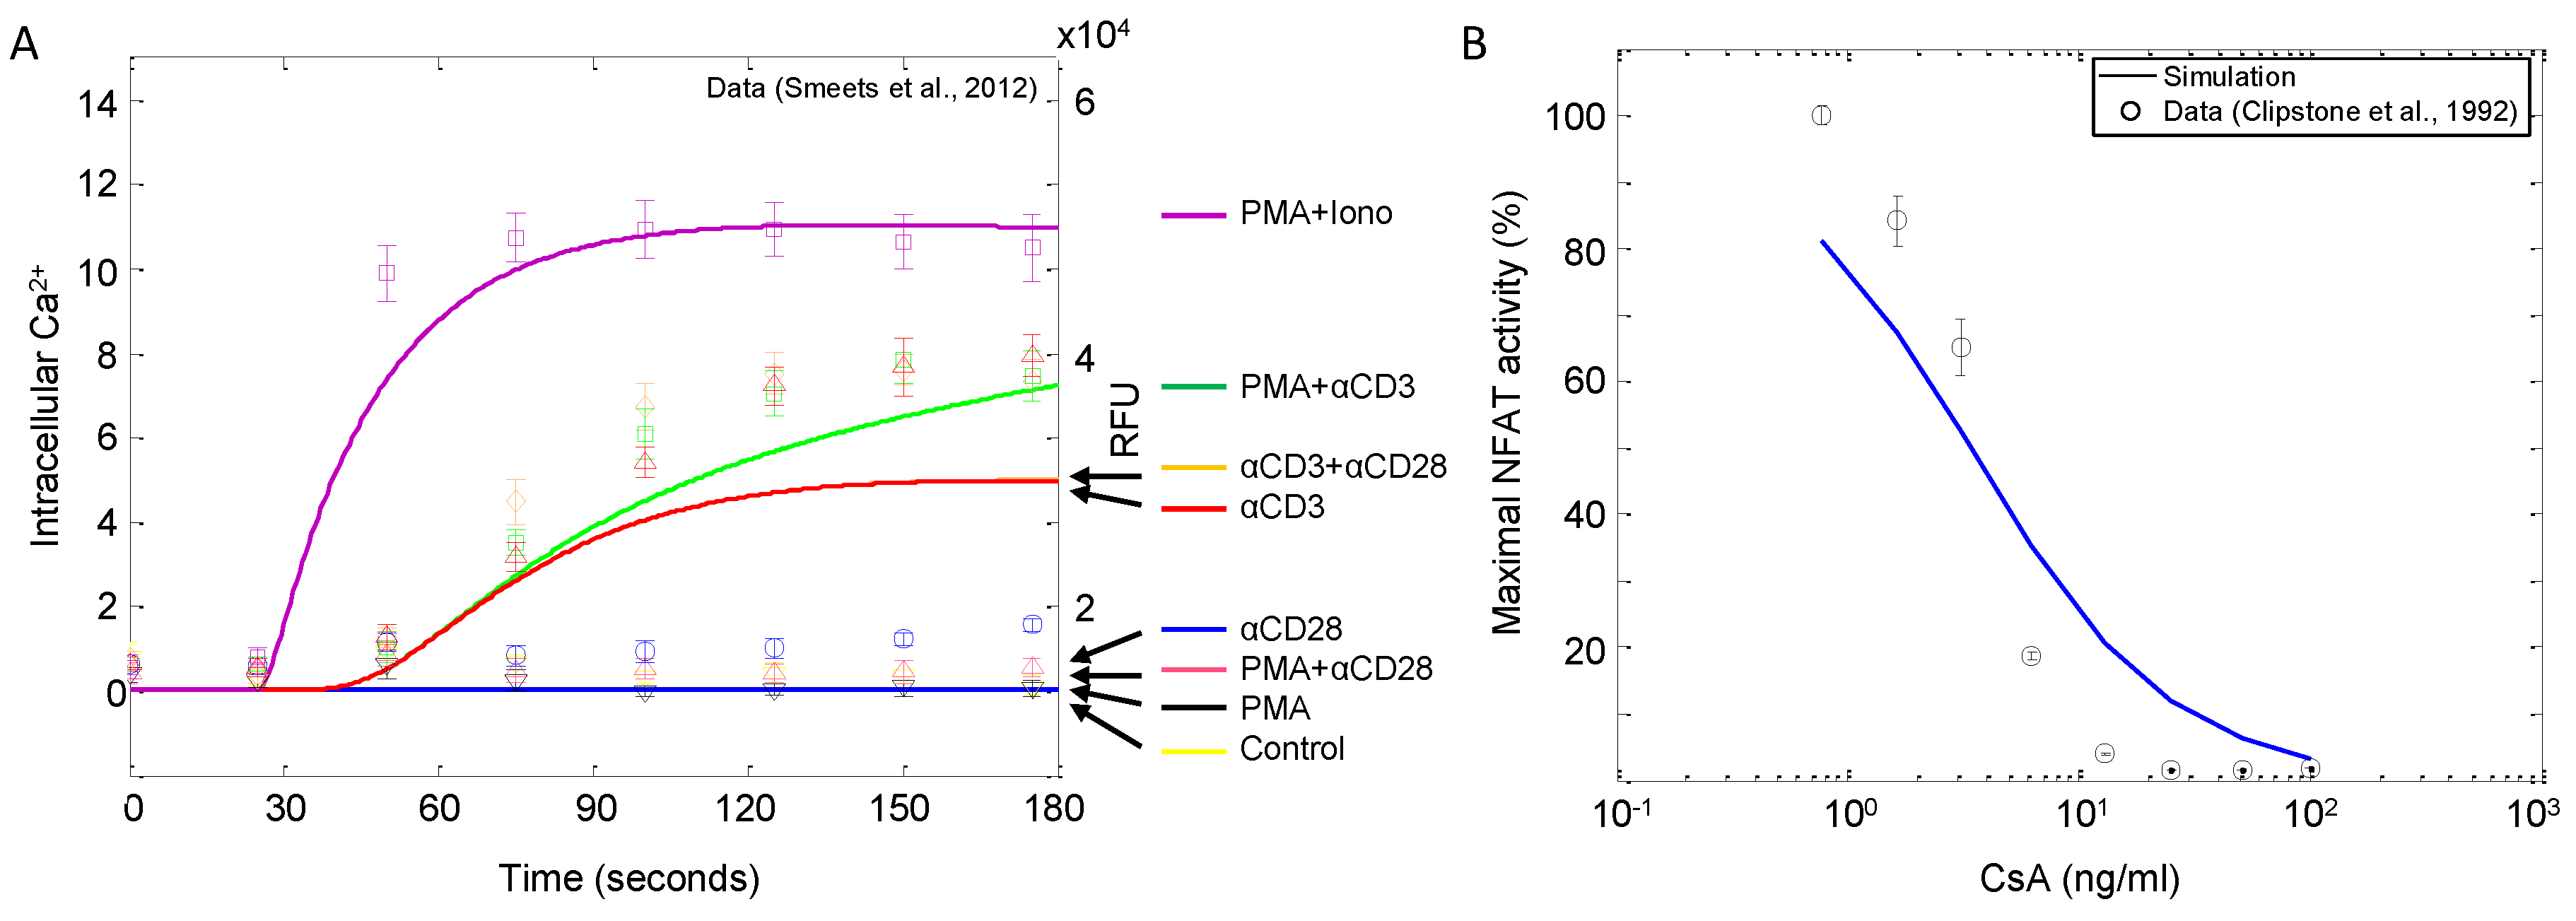
| Ca | αCD3, αCD28, PMA, ionomycin | Dynamic input response | Jurkat | 9 | [27] |
| NFAT | Cyclosporin A | Dose response | Jurkat | 9 | [53] |
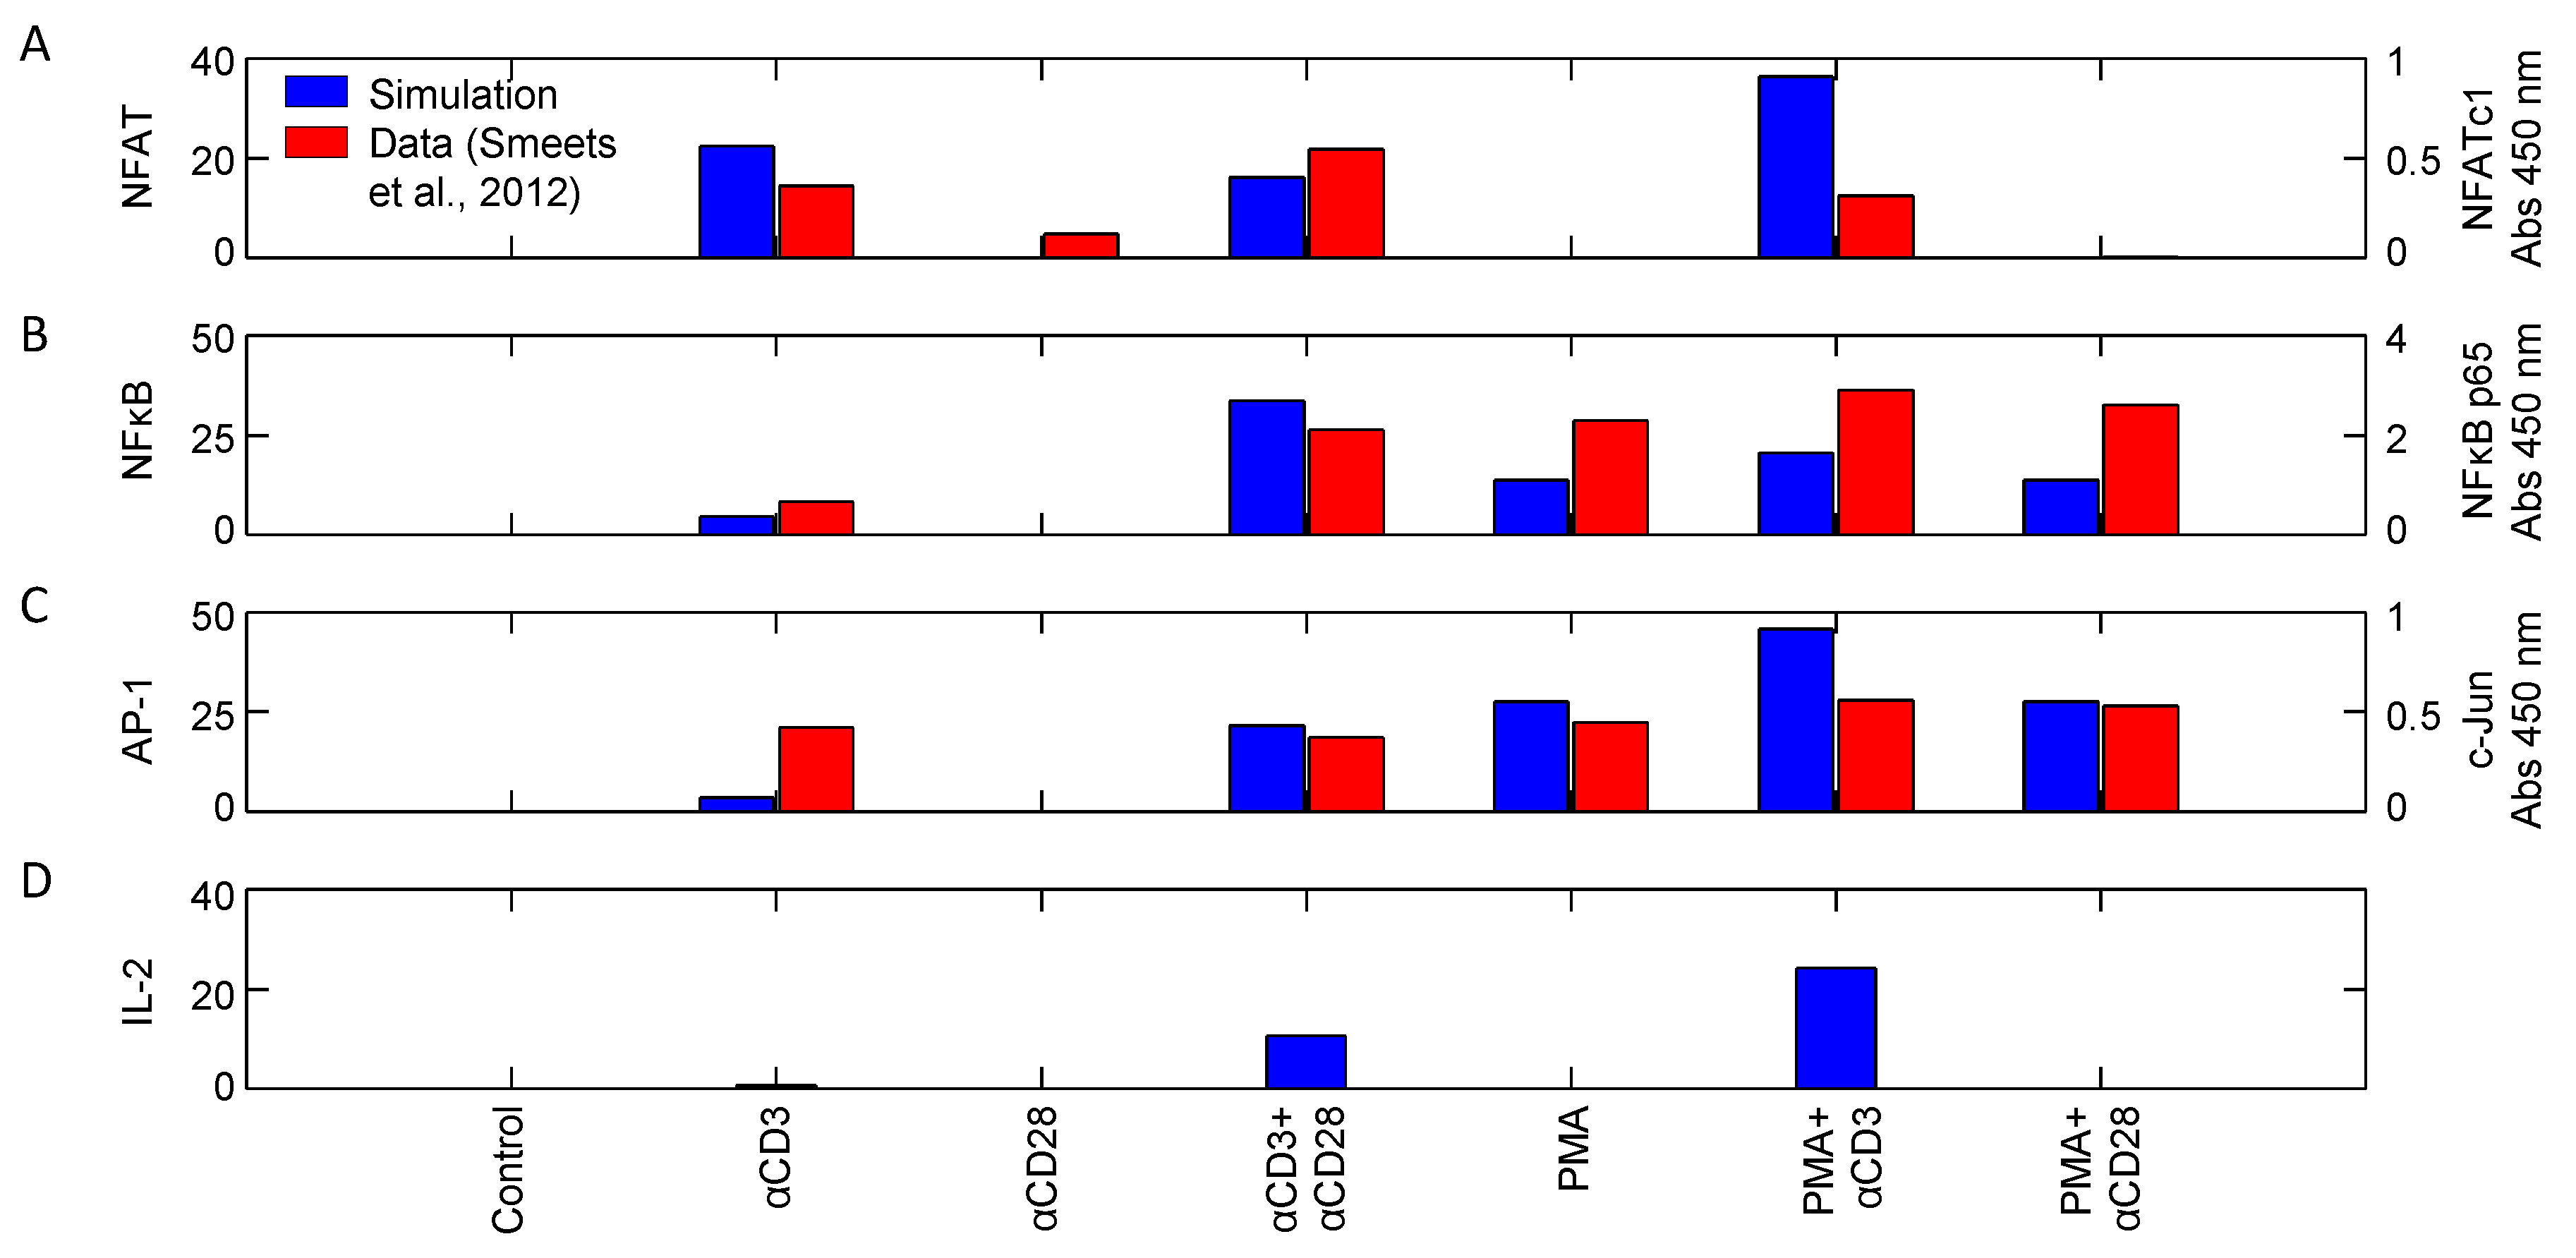
| NFAT, AP1, NFκB | αCD3, αCD28, PMA | Input response | Jurkat | 10 | [27] |
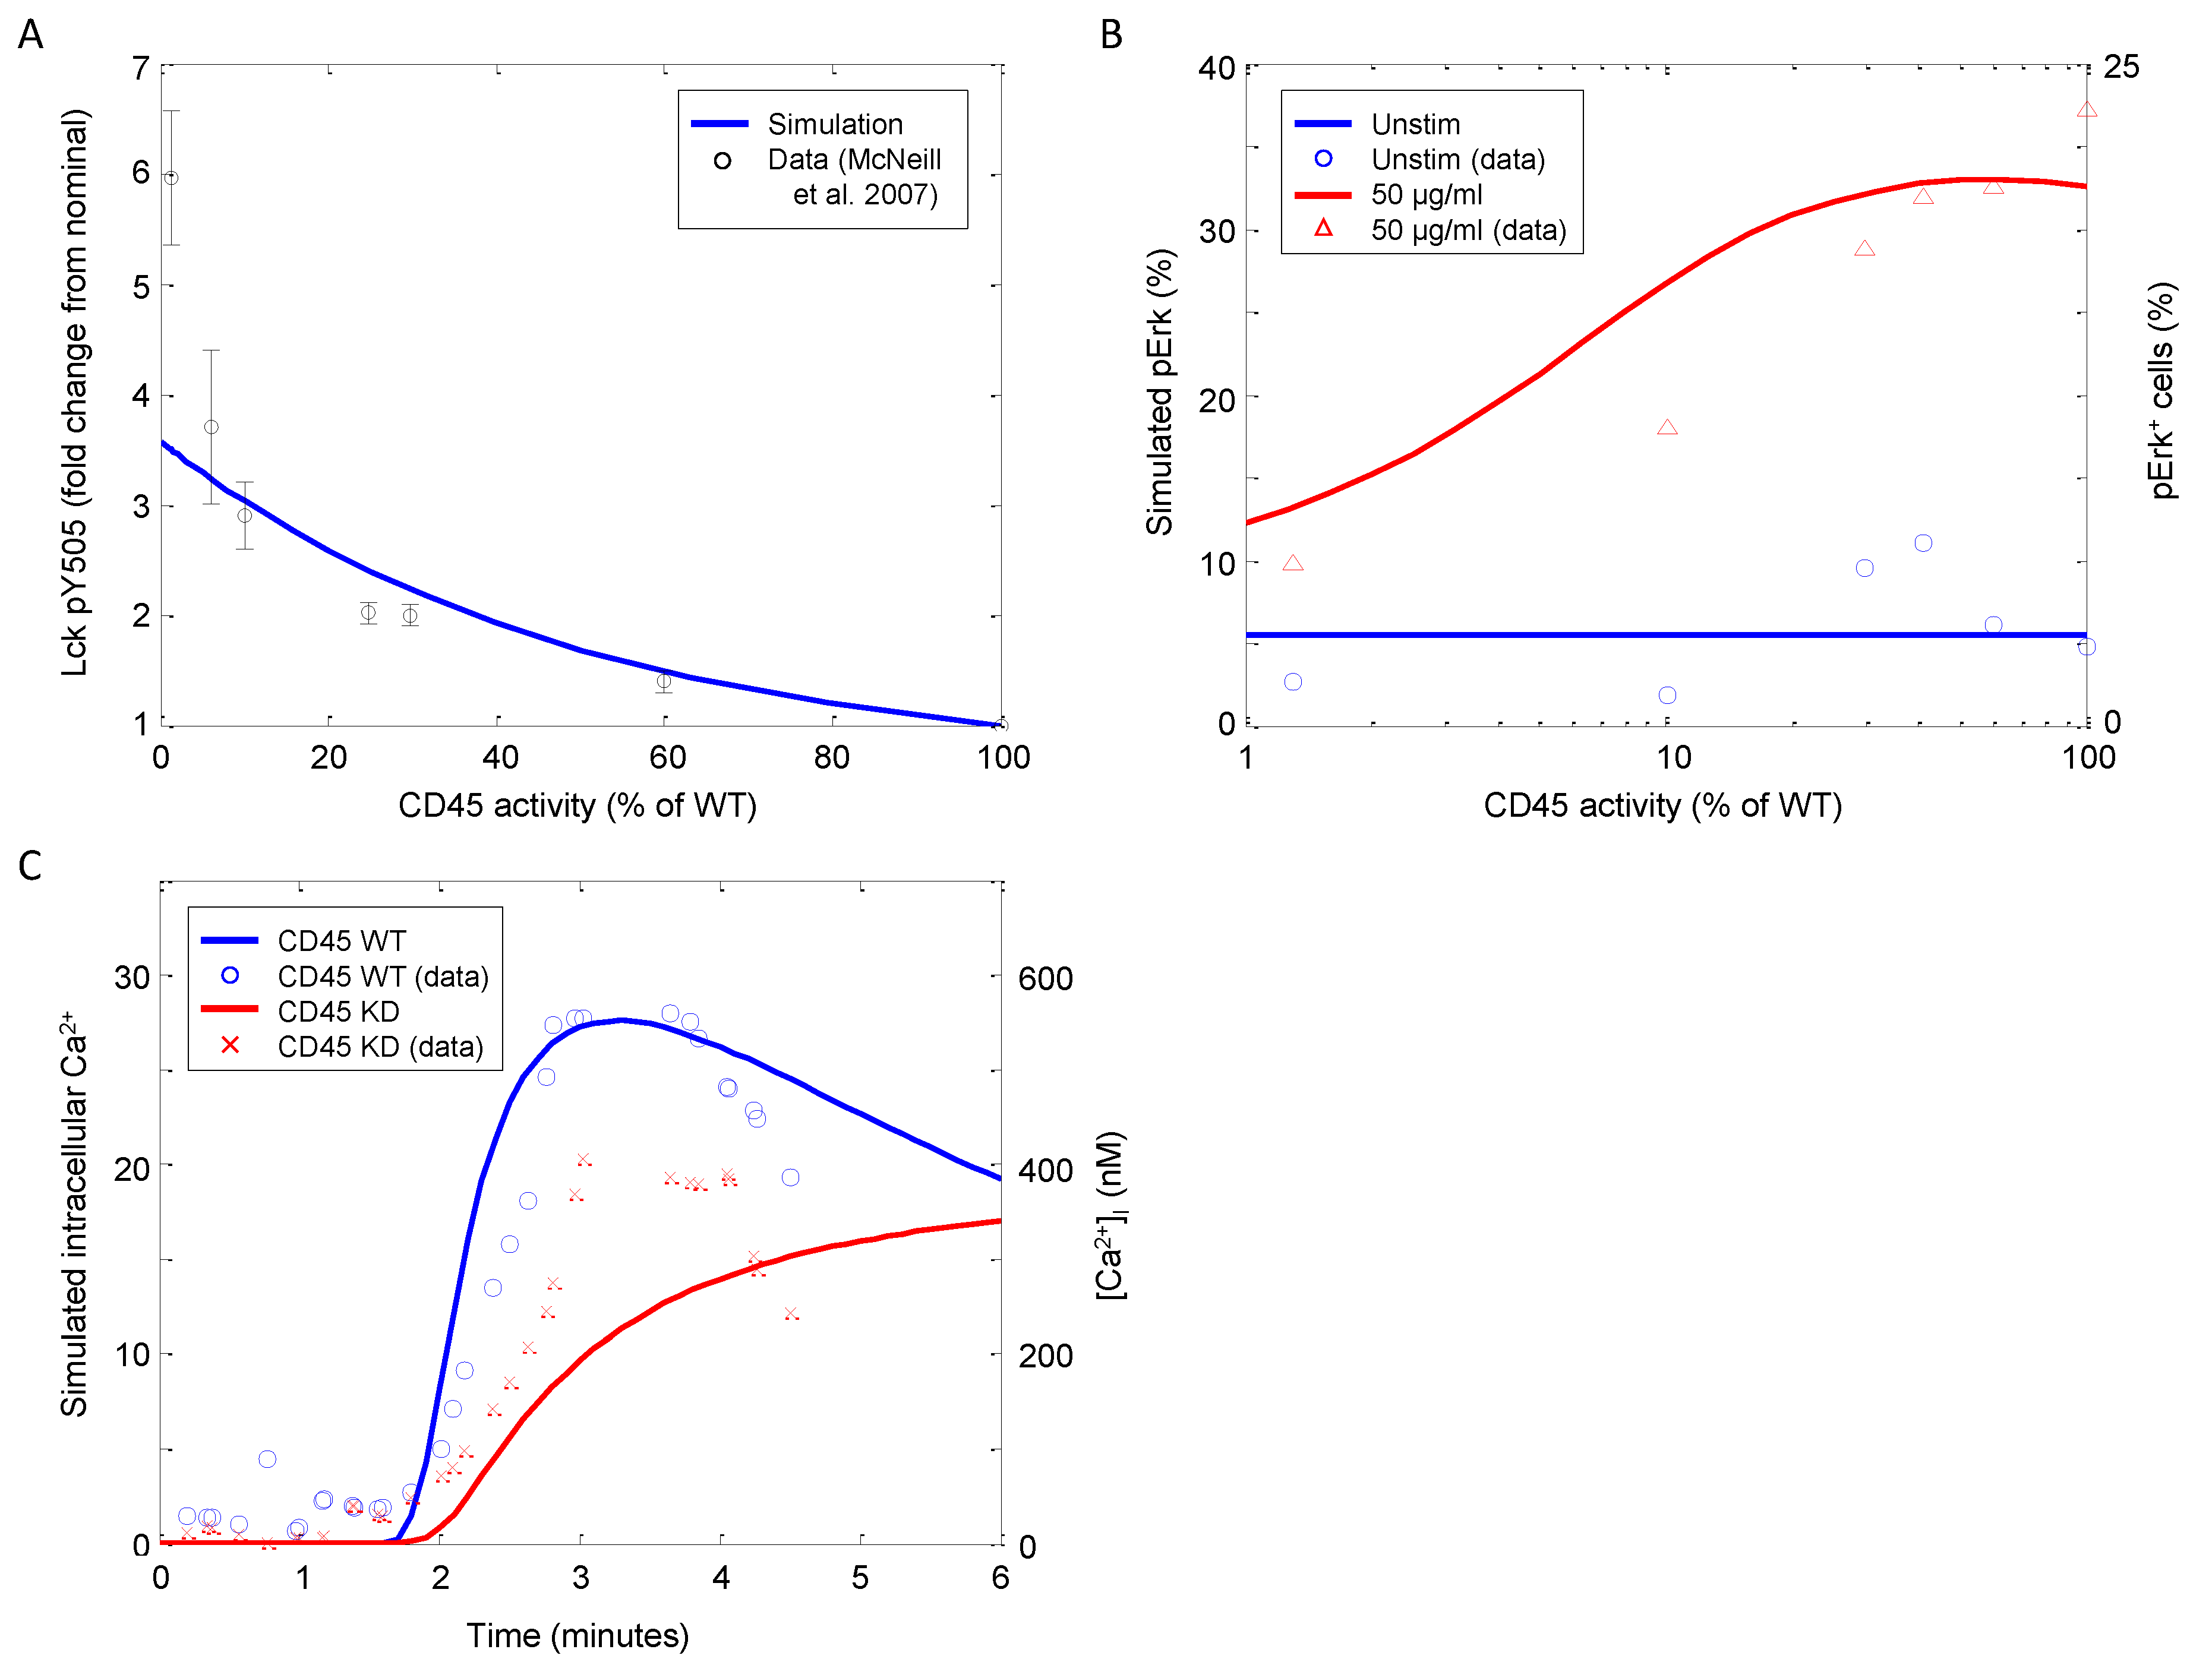
| Lck, Erk | CD45 | Knockdown | Murine DPthymocytes | 11 | [55] |
| Ca | CD45 | Knockout | Murine DP thymocytes | 11 | [56] |
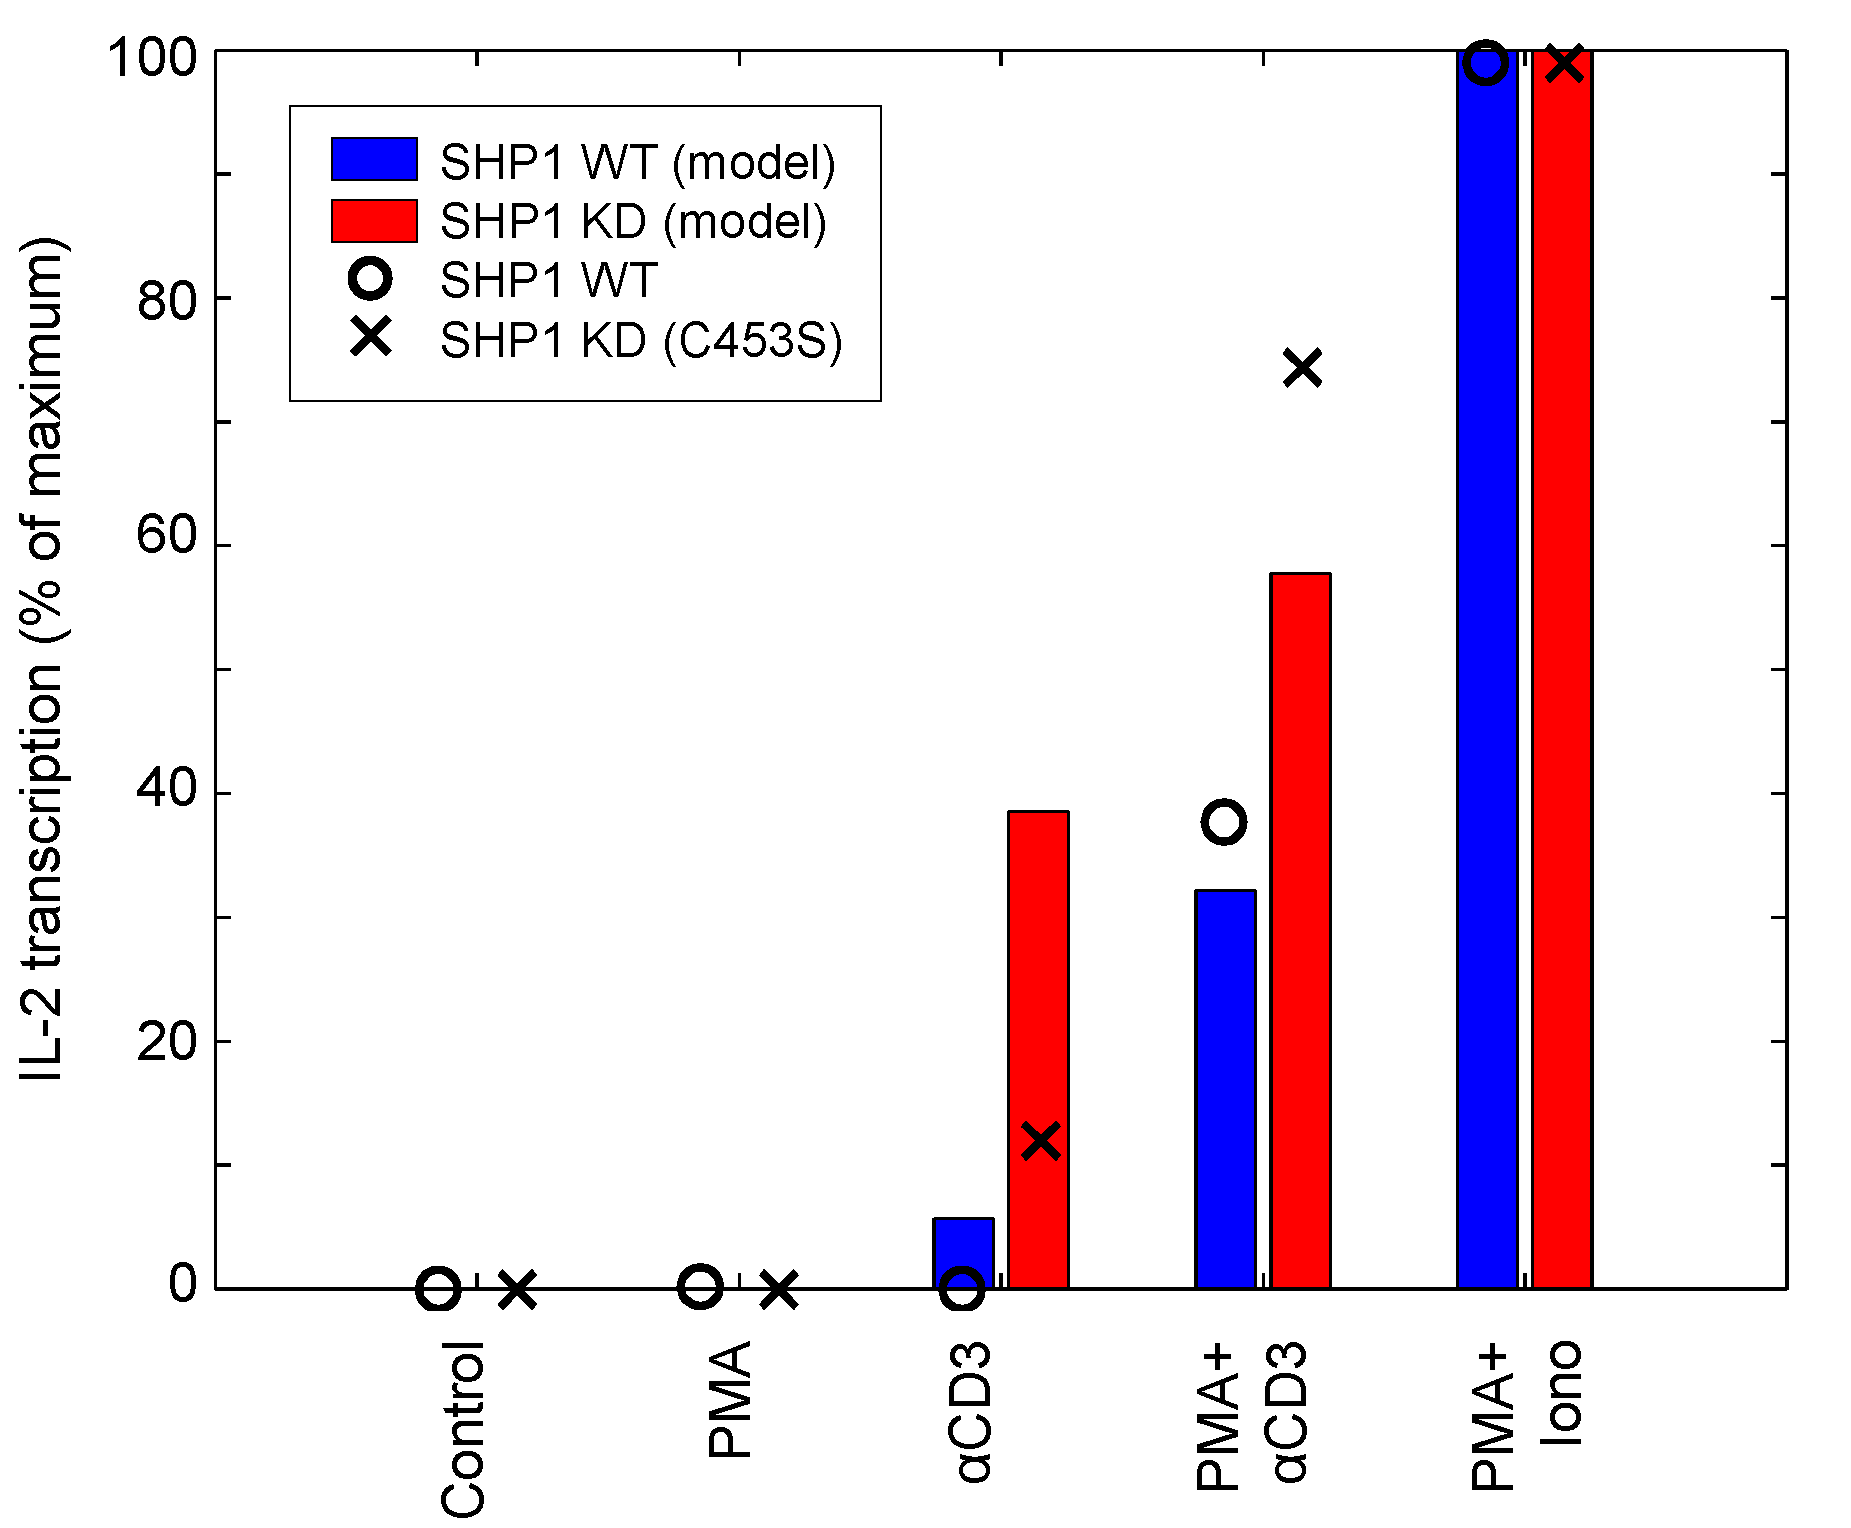
| IL-2 | SHP1, PMA, aTCR, ionomycin | Input response, Knockdown | Jurkat | 12 | [49] |
4.1.2. Corroboration of Signaling Events and Transcription Factor Activation


4.1.3. Corroboration of CD45 Activity

4.1.4. Corroboration of SHP1 Activity
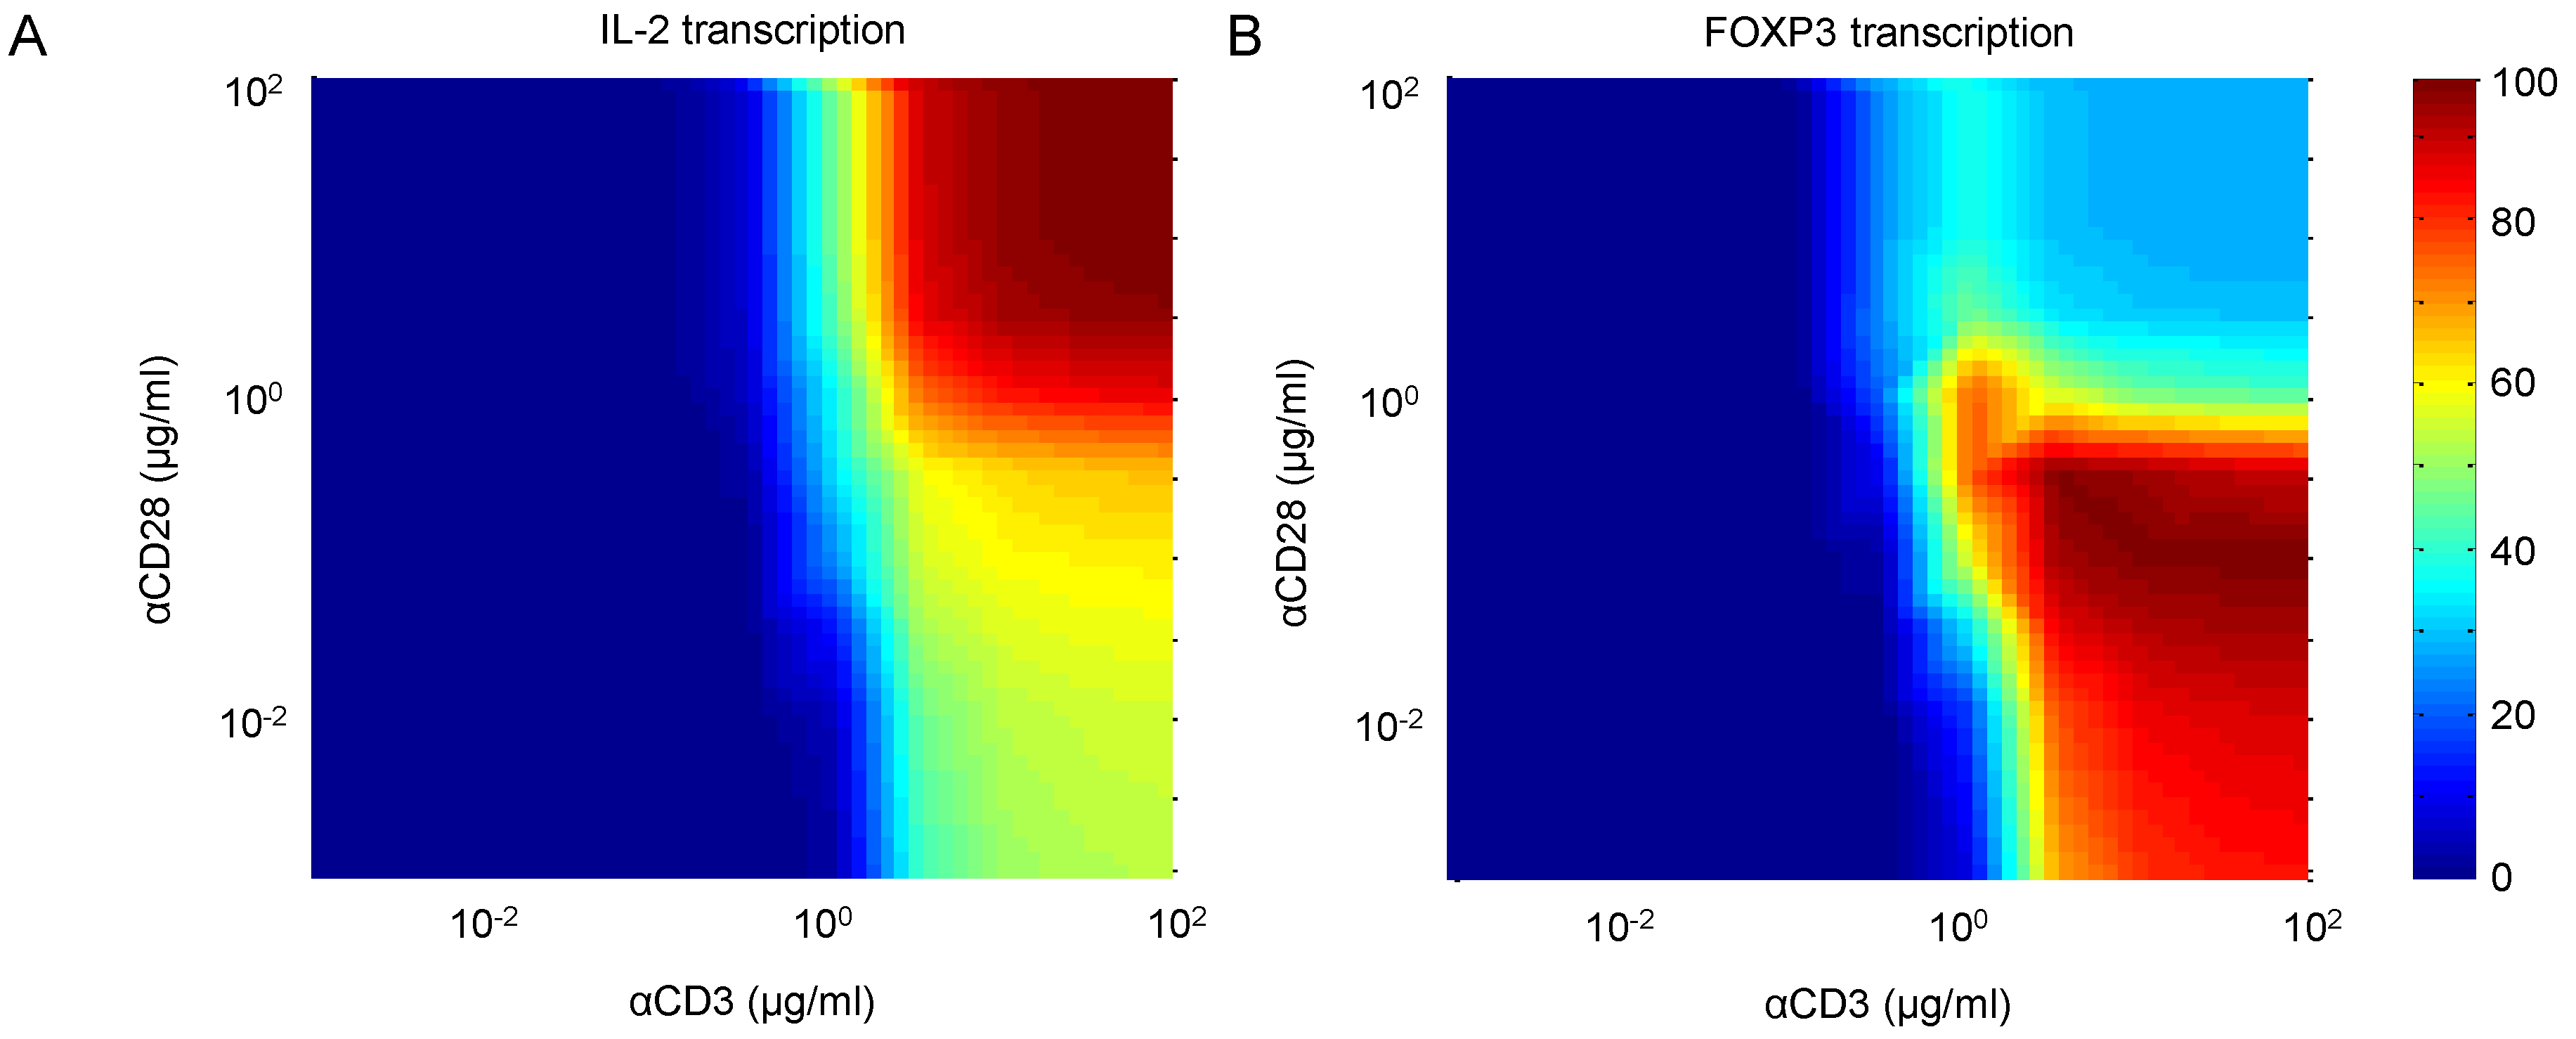
4.2. Weak CD28 Costimulation Predicted to Elevate FOXP3 Transcription

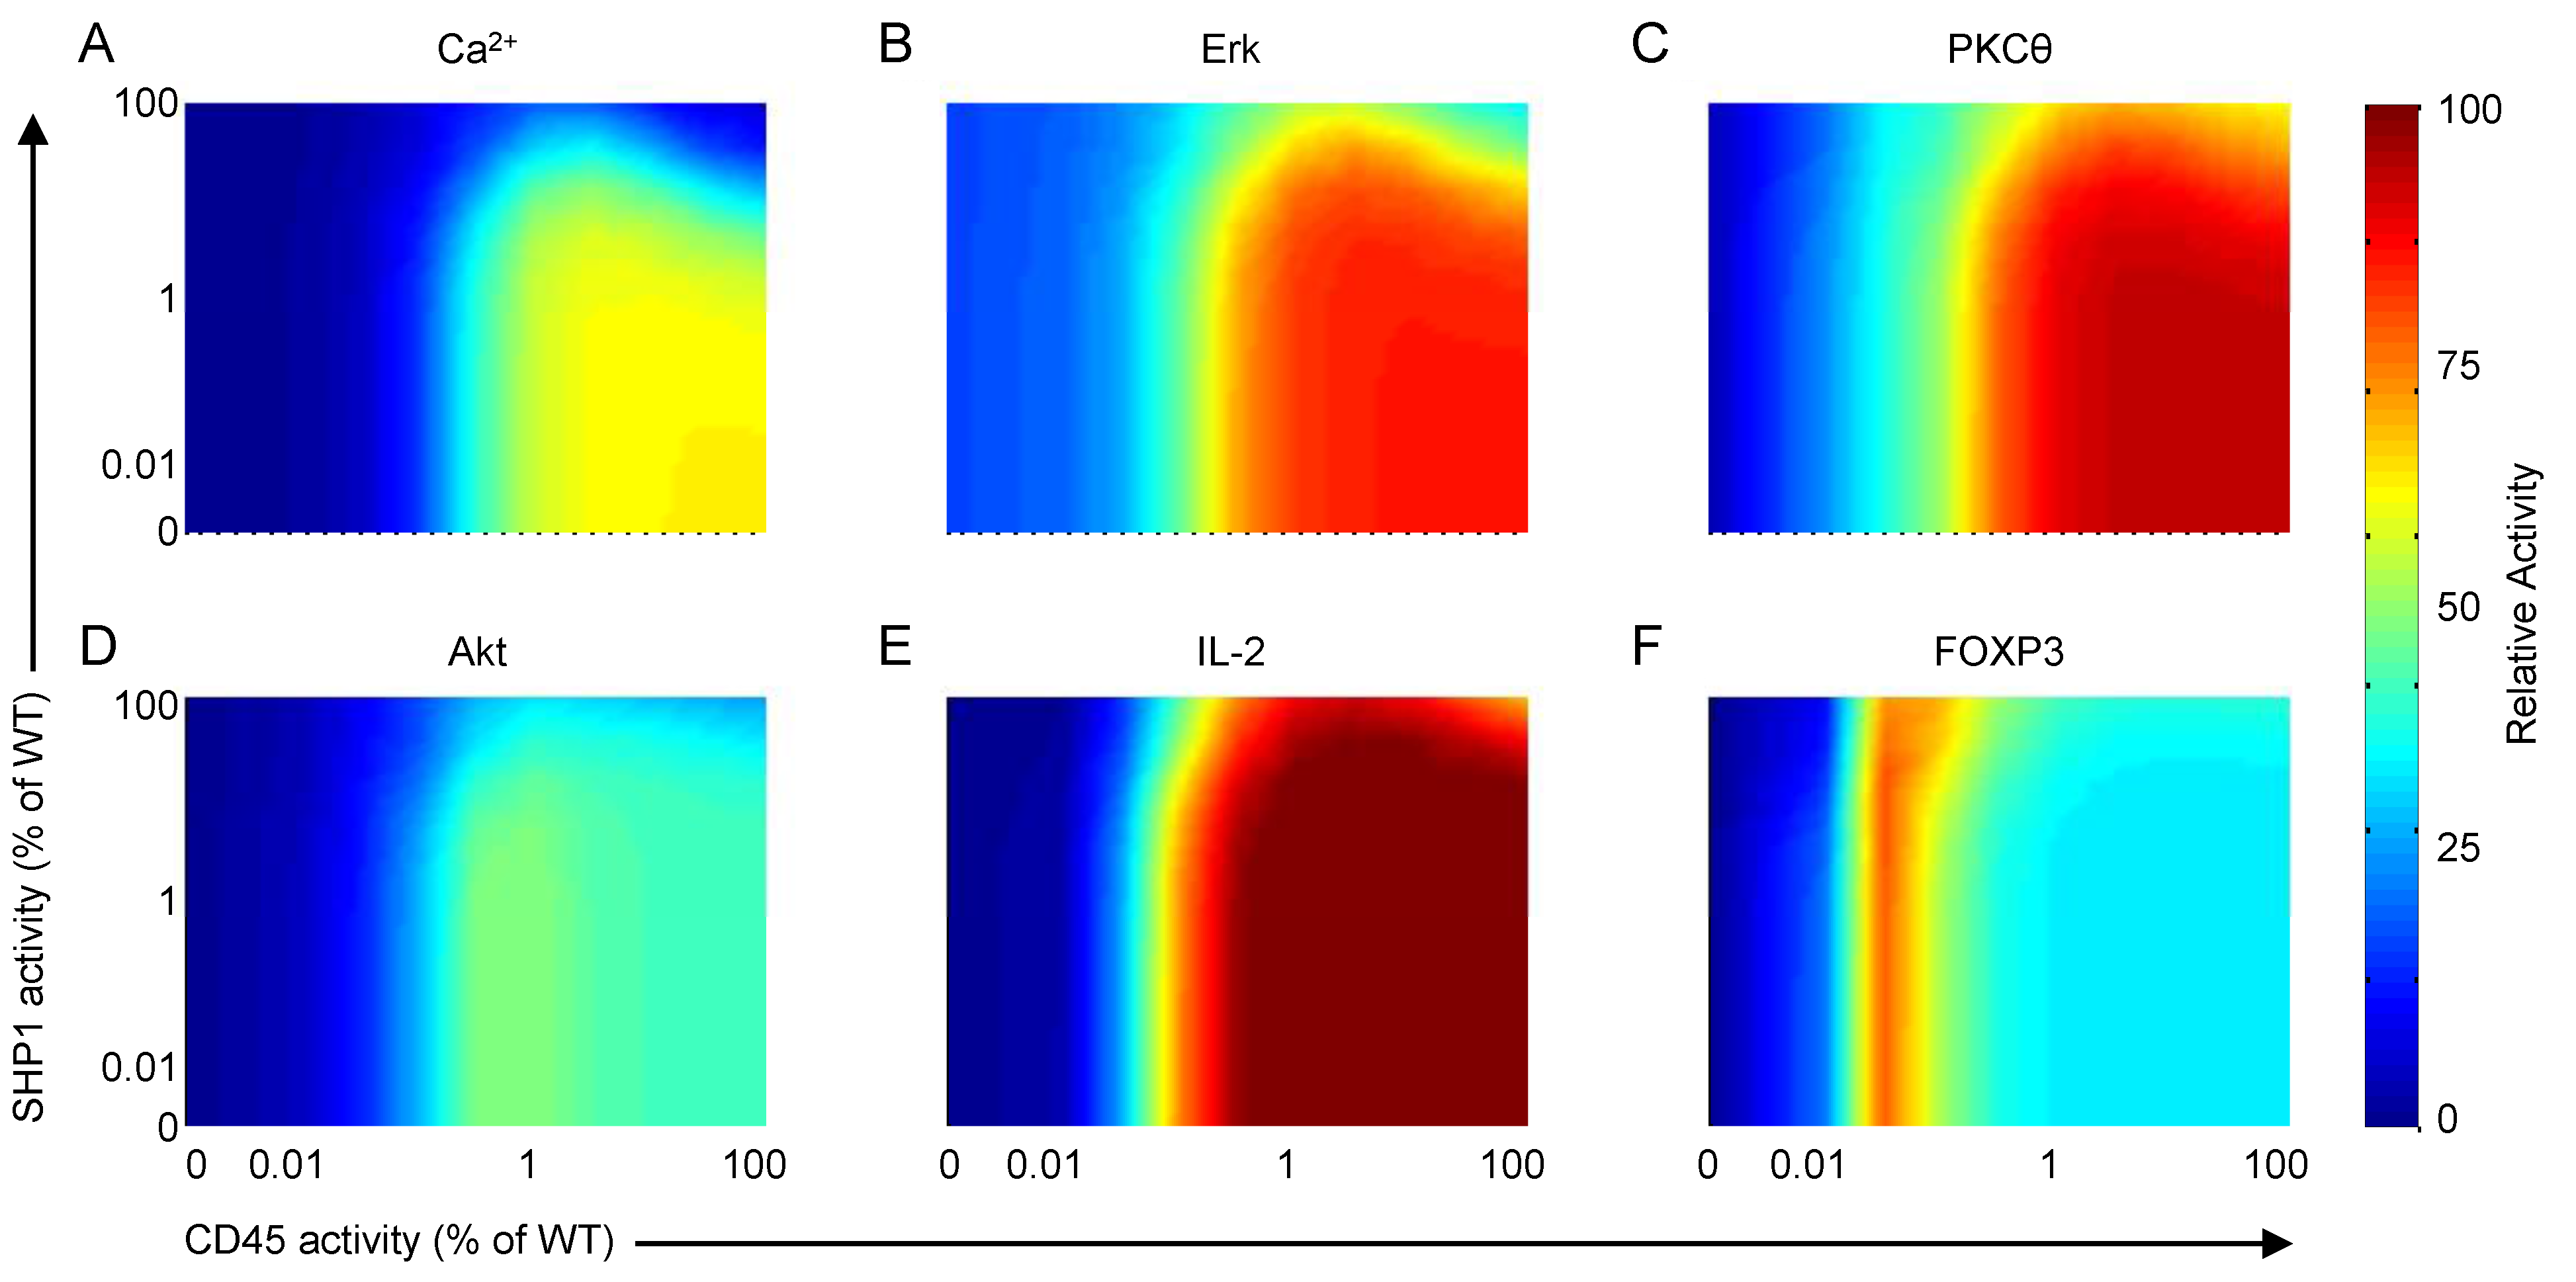
4.3. Reduced CD45 Activity Predicted to Elevate FOXP3 Transcription

5. Conclusions
Acknowledgments
Author Contributions
Conflicts of Interest
Appendix 1: Model Equations
| State | Rate Equation | Biological Meaning | Initial | Total | Source(s) |
|---|---|---|---|---|---|
| TCR | Ligand-bound TCR | 0 | [40] | ||
| TCR | Phosphorylated TCR-ζ chain | 0 | [40] | ||
| TCR | Internalized TCR | [40,46] | |||
| TCR | Degraded TCR | [40,46] | |||
| Zapb | Protein tyrosine kinase Zap70 bound to the phosphorylated TCR-ζ chain | 0 | [40] | ||
| Zap* | Activated Zap70 (phosphorylated at Y493 in the activation loop) | 0 | [40] | ||
| Zapp | Doubly phosphorylated Zap70 (at Y493 and Y319) | [40] | |||
| SFKdp | Src family kinases (including Lck and Fyn) with dephosphorylated inhibitory site (Y505 on Lck) | 100 | [40] | ||
| SFKdp-Zapp | Dephosphorylated SFK bound to pY319 of Zap70 | 0 | [40] | ||
| SFKdpS59p | Dephosphorylated SFK phosphorylated at serine-59 by activated Erk | 0 | [40] | ||
| SFK* | Free fully activated SFK | 0 | [40] | ||
| SFK*-Zapp | Fully activated SFK bound to pY319 of Zap70 | 0 | [40] | ||
| SFK*S59p | Fully activated SFK phosphorylated at serine-59 by activated Erk | 0 | [40] | ||
| CD45 | Positive regulatory role of transmembrane tyrosine phosphatase CD45 | [40] | |||
| CD45 * | Negative regulatory role of CD45 | 0 | [40] | ||
| Cbpp | Phosphorylated transmembrane scaffold protein Cbp (also known as PAG) | 50 | [40] | ||
| Csk* | Membrane-localized protein tyrosine kinase Csk recruited by Cbpp | [40] | |||
| SHP1* | Tyrosine phosphatase SHP1 recruited to the membrane and activated | 0 | [40] | ||
| LATp | Phosphorylated transmembrane protein LAT at tyrosine residues | 0 | [40] | ||
| SOSb | LATp-bound scaffold protein Grb2 and guanine nucleotide exchange factor SOS | 0 | [40] | ||
| PLCγp | Activated phospholipase Cγ and bound to LATp | 0 | [40] | ||
| DAG | Diacylglycerol | 0 | [40] | ||
| IP | Inositol 1,4,5-triphosphate | 0 | [40] | ||
| RasGRP* | Activated Ras guanine nucleotide releasing protein (RasGRP) | 0 | [40] | ||
| RasGTP | Guanine triphosphate (GTP)-bound Ras protein | 0 | [40] | ||
| Raf* | Phosphorylated and activated mitogen-activated protein (MAP) kinase kinase kinase Raf | 0 | [40] | ||
| Mek* | Phosphorylated and activated MAP kinase kinase Mek | 0 | [40] | ||
| Erk* | Phosphorylated and activated MAP kinase (MAPK) Erk | [40] | |||
| AP1* | Activated transcription factor activator protein 1 | 0 | Derived | ||
| Ca | Cytoplasmic calcium ions released from intracellular stores (endoplasmic reticulum) | [58] | |||
| CaM* | Calcium-binding protein calmodulin bound to calcium | 0 | Derived | ||
| CN* | Activated calcium-dependent serine-threonine phosphatase calcineurin | 0 | Derived | ||
| NFATn | Dephosphorylated NFAT with unobstructed nuclear localization signal | 0 | Derived | ||
| CD28* | Ligand-bound and activated CD28 coreceptor | 0 | Derived | ||
| PI3K* | Activated phosphoinositide 3-kinase related kinase (PI3K) | 0 | Derived | ||
| PIP | Phosphatidylinositol 3,4,5-trisphosphate | 0 | Derived | ||
| PDK1* | Activated 3-phosphoinositide-dependent kinase-1 (PDK1) | 0 | Derived | ||
| PKCθ* | Active protein kinase C-θ | 0 | Derived | ||
| IKK* | Activated IκB kinase | 0 | Derived | ||
| IκBαp | Phosphorylated IκB marked for proteasomal degradation | 0 | Derived | ||
| NFκBn | Nuclear NFκB | 0 | Derived | ||
| AKT* | Activated serine-threonine kinase Akt, also known as protein kinase B (PKB) | 0 | Derived | ||
| TSC1-TSC2 | GTPase-activating protein (GAP) consisting of tuberous sclerosis complex 1 (TSC1) and TSC2 | Derived | |||
| RhebGTP | GTP-bound Ras homolog enriched in brain (Rheb) GTPase | Derived | |||
| mTORC1* | Activated mammalian target of rapamycin (mTOR) complex 1 | 0 | Derived | ||
| mTORC2* | Activated mTORC2 | 0 | Derived | ||
| PTEN* | Activated phosphatase and tensin homolog (PTEN) | Derived | |||
| IL2 | Interleukin-2, a cytokine marking T-cell activation | 0 | Derived | ||
| FOXP3 | Forkhead box P3, regulator of regulatory T-cell development and function | 0 | Derived |
| Reaction | Equation | Biological Meaning | |
|---|---|---|---|
| R | = | Association/dissociation of ligand and TCR complex | |
| = | SFK-mediated phosphorylation and SHP1/CD45-mediated dephosphorylation of ligand-bound TCR complex | ||
| = | Internalization of free TCR | ||
| = | Internalization of ligand-bound TCR | ||
| = | Internalization of phosphorylated TCR | ||
| = | Exocytosis of internalized TCR | ||
| = | Degradation of internalized TCR | ||
| = | Synthesis of new TCR | ||
| = | Association/dissociation of phosphorylated TCR complex and Zap70 | ||
| = | SFK dephosphorylation by CD45 and re-phosphorylation by Csk* at the inhibitory site (Y505 in Lck, Y528 in Fyn) | ||
| = | SFK phosphorylation at the activation loop (Y394 in Lck, Y417 in Fyn) by autophosphorylation (or by another kinase) and dephosphorylation by SHP1 | ||
| = | Association/dissociation of Zapp and SFKdp | ||
| = | TCR-mediated phosphorylation of Zapp-bound SFKdp | ||
| = | Dissociation/association of activated SFK and Zapp | ||
| = | Cbp phosphorylation by activated SFK (or other kinases) and dephosphorylation by CD45 | ||
| = | Cbpp-mediated activation of Csk | ||
| = | Zap70 phosphorylation at the activation loop (Y493) by activated SFK (SFK* and SFK*-Zapp) and dephosphorylation by PTPs including SHP1 | ||
| = | Additional Zap70 phosphorylation at Y319 by activated SFK and Zap70 and dephosphorylation by PTPs including SHP1 | ||
| = | SHP1 activation (by SFK*) and deactivation | ||
| = | LAT phosphorylation by activated Zap70 and dephosphorylation SHP1 | ||
| = | PLCγ phosphorylation by LATp | ||
| = | PLCγ-mediated hydrolysis of PIP to IP and DAG | ||
| = | Degradation of DAG | ||
| = | Degradation of IP | ||
| = | DAG-mediated activation of RasGRP | ||
| = | DAG-mediated activation of PKCθ | ||
| = | RasGRP- and Grb2SOS-mediated activation of Ras | ||
| = | Ras-mediated activation of Raf | ||
| = | Rafp-mediated activation of Mek | ||
| = | Mekp-mediated activation of Erk | ||
| = | LATp-mediated association and activation of the Grb2-SOS complex | ||
| = | Erkp-mediated phosphorylation of SFKdp at serine-59 | ||
| = | Erkp-mediated phosphorylation of SFKact at serine-59 | ||
| = | TCR-mediated activation and SHP1-mediated deactivation of SFK-s59p | ||
| = | Positive regulatory role of CD45 and translocation caused by receptor cluster formation | ||
| = | Negative regulatory role of CD45 and recruitment to receptor cluster | ||
| = | Erkp- and PKCθ-mediated activation of AP1 | ||
| = | IP -induced calcium release into the cytoplasm | ||
| = | Association/dissociation of calcium and calmodulin | ||
| = | Calmodulin-mediated activation of calcineurin | ||
| = | Calcineurin-mediated dephosphorylation and nuclear translocation of NFAT | ||
| = | Association/dissociation of ligand and CD28 | ||
| = | PI3K activation by CD28 and Zap70 and deactivation | ||
| = | PI3K-mediated phosphorylation of PIP and PTEN-mediated dephosphorylation of PIP | ||
| = | PIP -mediated activation of PDK1 | ||
| = | Activation of PKCθ mediated by PDK1, DAG, and mTORC2 | ||
| = | PKCθ- and AKT-mediated activation of IKK | ||
| = | IKK-mediated phosphorylation and 26S proteasome-mediated degradation of IκBα; NFκB-induced synthesis of new IκBα | ||
| = | Activation and nuclear translocation of NFκB | ||
| = | PDK1- and mTORC2-mediated phosphorylation of AKT | ||
| = | AKT-mediated phosphorylation, dissociation, and deactivation of TSC | ||
| = | GAP activity of TSC on Rheb | ||
| = | RhebGTP-mediated activation of mTORC1 | ||
| = | PI3K-mediated activation and mTORC1-mediated inhibition of mTORC2 | ||
| = | TCR-mediated inhibition and FOXP3-mediated activation of PTEN | ||
| = | AP1, NFAT, and NFkB regulate transcription of IL-2; FOXP3-mediated inhibition of IL-2 | ||
| = | AP1 and NFAT regulate transcription of FOXP3; mTOR-mediated inhibition of FOXP3 |
| Parameter | Biological Meaning | Value | 95% CI | Units | Source |
|---|---|---|---|---|---|
| Association rate of ligand and TCR complex | 0.0900 | [0.0558, 0.1231] | (mol·min) | Fitted | |
| Dissociation rate of ligand and TCR complex | [, ] | min | Fitted | ||
| Phosphorylation rate of ligand-bound TCR mediated by SFK* and SFK*-S59p | 0.3000 | [0.0475, 3.8961] | (mol·min) | [40] | |
| Phosphorylation rate of ligand-bound TCR mediated by SFK*-Zapp | 1.13 | (mol·min) | [40] | ||
| Dephosphorylation rate of ligand-bound TCR mediated by activated SHP1 | 0.0022 | [0.0015, 0.0221] | (mol·min) | [40] | |
| Constitutive dephosphorylation rate of ligand-bound TCR | 16.1100 | [1.0731, 61.7493] | min | [40] | |
| Dephosphorylation rate of ligand-bound TCR mediated by activated CD45 | 0.0300 | [, 0.1574] | (mol·min) | Fitted | |
| Resting TCR internalization rate | 0.0100 | min | [46] | ||
| Maximum induced TCR internalization rate | 0.0380 | min | [46] | ||
| TCR internalization Hill coefficient | 2 | unitless | Derived | ||
| Enzyme quantity producing half-maximum TCR internalization rate | 0.05·[PKCθ] | mol | Derived | ||
| Constitutive TCR exocytosis rate | 0.0789 | min | Derived | ||
| Resting TCR degradation rate | 0.0011 | min | [45] | ||
| Maximum induced TCR degradation rate | 0.0033 | min | [45] | ||
| TCR degradation Hill coefficient | 2 | unitless | Derived | ||
| Enzyme quantity producing half-maximum TCR internalization rate | 0.05·[SFK] | mol | Derived | ||
| TCR synthesis rate | min | Derived | |||
| Association rate of Zap70 to phosphorylated TCRζ-chain | [, ] | (mol·min) | Fitted | ||
| Dissociation rate of Zap70 to phosphorylated TCRζ-chain | 1.2600 | [0.4913, 41.7225] | min | Fitted | |
| Dephosphorylation rate of SFK at the inhibitory site by CD45 | [, ] | (mol·min) | Fitted | ||
| Phosphorylation rate of SFK at the inhibitory site by Csk | 0.1199 | (mol·min) | Derived | ||
| Phosphorylation rate of SFKdp at the activation site mediated by TCRb and TCRp | 13.7700 | [1.3177, 75.4525] | (mol·min) | Fitted | |
| Dephosphorylation rate of SFK* at the activation site by activated SHP1 | (mol·min) | [40] | |||
| Constitutive dephosphorylation rate of SFK* at the activation site | min | [40] | |||
| Dephosphorylation rate of SFK* at the activation site by activated CD45 | (mol·min) | Derived | |||
| Association rate of SFKdp to Zapp | 0.0217 | [, 2.1690] | (mol·min) | Fitted | |
| Dissociation rate of SFKdp to Zapp | 0.0025 | [, 0.0151] | min | Fitted | |
| Phosphorylation rate of Zapp-bound SFKdp at the activation site mediated by TCRb and TCRp | (mol·min) | [40] | |||
| Dephosphorylation rate of Zapp-bound SFK* at the activation site by activated SHP1 | 0.0068 | [0.0012, 0.0641] | (mol·min) | Fitted | |
| Constitutive dephosphorylation rate of Zapp-bound SFK* at the activation site | 13.4040 | [1.3409, 84.0744] | min | Fitted | |
| Dephosphorylation rate of Zapp-bound SFK* at the activation site by activated CD45 | 0.0300 | [0.0019, 0.3542] | (mol·min) | Fitted | |
| Dissociation rate of SFK* to Zapp | 70.7880 | [68.7880, 102.3198] | min | Fitted | |
| Association rate of SFK* to Zapp | (mol·min) | [40] | |||
| Phosphorylation rate of Cbp by SFK* | [, ] | (mol·min) | Fitted | ||
| Constitutive phosphorylation rate of Cbp | 0.0207 | [0.0127, 0.1200] | min | Fitted | |
| Dephosphorylation rate of Cbpp by CD45 | (mol·min) | Derived | |||
| Association rate of Csk to Cbpp | [, 0.0070] | (mol·min) | Fitted | ||
| Dissociation rate of Csk to Cbpp | 0.6635 | min | Derived | ||
| Phosphorylation rate of bound Zap by SFK* and SFK*S59p | 0.0021 | [0.0015, 0.0022] | (mol·min) | Fitted | |
| Phosphorylation rate of bound Zap by SFK*-Zapp | 1.13 | (mol·min) | [40] | ||
| Dephosphorylation rate of Zap* by activated SHP1 | (mol·min) | [40] | |||
| Constitutive dephosphorylation rate of Zap* | min | [40] | |||
| Phosphorylation rate of Zap* by free and bound Zapp | [, ] | (mol·min) | Fitted | ||
| Phosphorylation rate of Zap* by SFK* and SFK*S59p | (mol·min) | [40] | |||
| Phosphorylation rate of Zap* by SFK*-Zapp | 1.13 | (mol·min) | [40] | ||
| Dephosphorylation rate of Zapp by activated SHP1 | (mol·min) | [40] | |||
| Constitutive dephosphorylation rate of Zapp | min | [40] | |||
| Activation rate of SHP1 by SFK* | [, ] | (mol·min) | Fitted | ||
| Deactivation rate of SHP1 | 0.3660 | [0.3450, 0.3861] | min | Fitted | |
| Phosphorylation rate of LAT by activated Zap | [, ] | (mol·min) | Fitted | ||
| Dephosphorylation rate of LAT by activated SHP1 | 0.0020 | [0.0017, 0.0025] | (mol·min) | Fitted | |
| Constitutive dephosphorylation rate of SHP1 | 90 | [87.9332, 130.0896] | min | Fitted | |
| Association rate of PLCγ and LATp (PLCγ is immediately phosphorylated) | 0.0030 | [0.0021, 0.0033] | (mol·min) | Fitted | |
| Lumped rate of dephosphorylation of PLCγ and its dissociation from LATp | 300 | [295.1992, 302.0020] | min | Fitted | |
| PIP hydrolysis rate catalyzed by PLCγp | [, ] | (mol·min) | Fitted | ||
| DAG degradation rate | 2.4311 | [1.3990, 2.9228] | min | Fitted | |
| IP degradation rate | min | Derived | |||
| Activation rate of RasGRP by DAG | 0.0030 | [0.0025, 0.0052] | (mol·min) | Fitted | |
| Inactivation rate of RasGRP | 30 | [17.2632, 36.0679] | min | Fitted | |
| Activation rate of PKCθ by DAG | [, ] | (mol·min) | Fitted | ||
| Rate of Ras guanine nucleotide exchange catalyzed by activated RasGRP | [, ] | (mol·min) | Fitted | ||
| Rate of Ras guanine nucleotide exchange catalyzed by recruited SOS | [, ] | (mol·min) | Fitted | ||
| Constitutive rate of RasGTP hydrolysis to RasGDP | 30 | [24.9529, 43.3632] | min | Derived | |
| Activation rate of Raf by RasGTP | [, ] | (mol·min) | Fitted | ||
| Constitutive rate of Raf inactivation by phosphatase | 30 | [24.9529, 43.3632] | min | Derived | |
| Activation rate of Mek by activated Raf | 0.0030 | [0.0025, 0.0036] | (mol·min) | Fitted | |
| Constitutive rate of Mek inactivation by phosphatase | 30 | [24.9529, 36.0679] | min | Derived | |
| Activation rate of Erk by activated Mek | [, ] | (mol·min) | Fitted | ||
| Constitutive rate of Erk inactivation by phosphatase | 30 | [24.9529, 36.0679] | min | Derived | |
| Association rate of Grb-SOS complex to LATp | [, ] | (mol·min) | Fitted | ||
| Dissociation rate of Grb-SOS complex from LATp | 30 | [3.3632, 100] | min | Derived | |
| Phosphorylation rate of SFKdp at S59 by activated Erk | [, 0.0011] | (mol·min) | Fitted | ||
| Constitutive dephosphorylation rate of SFKdp at S59 | 30 | [4.5543, 80.0101] | min | Fitted | |
| Phosphorylation rate of SFK* at S59 by activated Erk | (mol·min) | [40] | |||
| Constitutive dephosphorylation rate of SFK* at S59 | min | [40] | |||
| Phosphorylation rate of SFKdpS59p at the activation site mediated by TCRb and TCRp | (mol·min) | Derived | |||
| Dephosphorylation rate of SFK*S59p at the activation site by activated SHP1 | (mol·min) | [40] | |||
| Constitutive dephosphorylation rate of SFK*S59p at the activation site | min | [40] | |||
| Dephosphorylation rate of SFK*S59p at the activation site by activated CD45 | (mol·min) | Derived | |||
| Translocation rate of CD45 mediated by receptor complex | [, ] | (mol·min) | Fitted | ||
| Constitutive return rate of CD45 | 0.0030 | [, 0.1009] | min | Fitted | |
| Activation rate of CD45 negative regulator by SFK* | [, ] | (mol·min) | Fitted | ||
| Constitutive deactivation rate of CD45 negative regulator | 0.0030 | [, 0.0961] | min | Fitted | |
| Activation rate of AP1 by Erk* and PKCθ* | [, ] | (molmin) | Fitted | ||
| Constitutive deactivation rate of AP1* | 30 | [23.1193, 43.8583] | min | Fitted | |
| Release rate of calcium stored in the endoplasmic reticulum by IP | 0.0300 | [0.0212, 0.0380] | (mol·min) | Fitted | |
| Constitutive calcium uptake rate | 30 | [19.0031, 54.1565] | min | Fitted | |
| Association rate of calmodulin to calcium | [, ] | (mol·min) | Fitted | ||
| Dissociation rate of calmodulin from calcium | 0.3000 | [0.0182, 3.2856] | min | Fitted | |
| Activation rate of calcineurin by calmodulin* | [, ] | (mol·min) | Fitted | ||
| Constitutive deactivation rate of calcineurin* | 0.3000 | [0.0943, 19.1092] | min | Fitted | |
| Activation rate of NFAT (NFAT immediately translocates to nucleus) | [, ] | (mol·min) | Fitted | ||
| Constitutive deactivation rate of NFAT | 0.3000 | [0.0210, 0.3433] | min | Fitted | |
| Association rate of ligand to CD28 coreceptor | 0.0300 | [0.0199, 0.0360] | (mol·min) | Fitted | |
| Dissociation rate of ligand from CD28 coreceptor | [, ] | min | Fitted | ||
| Activation rate of PI3K by ligand-bound CD28 and activated Zap | [, ] | (molmin) | Fitted | ||
| Constitutive deactivation rate of PI3K | 30 | [15.3560, 37.5731] | min | Fitted | |
| Phosphorylation rate of PIP by PI3K* | 3 | [0.3923, 5.7161] | (mol·min) | Fitted | |
| Dephosphorylation rate of PIP by PTEN* | 30 | [17.4422, 65.3412] | (mol·min) | Fitted | |
| Constitutive dephosphorylation rate of PIP | [, ] | min | Fitted | ||
| Activation rate of PDK1 by PIP | [, ] | (mol·min) | Fitted | ||
| Constitutive deactivation rate of PDK1* | 30 | [5.4422, 40.4623] | min | Fitted | |
| Activation rate of PKCθ by PDK1* | [, ] | (mol·min) | Fitted | ||
| Activation rate of PKCθ by mTORC2* | [, ] | (mol·min) | Fitted | ||
| Constitutive deactivation rate of PKCθ* | 0.3000 | [0.1754, 1.3217] | min | Fitted | |
| Activation rate of IKK by PKCθ* | 0.0015 | [, 0.0065] | (mol·min) | Fitted | |
| Activation rate of IKK by Aktp | 0.0030 | [0.0019, 0.0046] | (mol·min) | Fitted | |
| Constitutive deactivation rate of IKK* | 15 | [5.3394, 48.7211] | min | Fitted | |
| Phosphorylation rate of IκBα by IKK* | 0.4500 | [0.4109, 0.5512] | min | Fitted | |
| Proteasomal degradation rate of pIκBα | 0.1500 | [0.1093, 0.1978] | min | Fitted | |
| Deactivation rate of IκBα by NFκB | 0.1500 | [0.0936, 0.2380] | min | Fitted | |
| Activation rate of NFκB by IκBα deactivation | 0.1500 | [0.0994, 0.2121] | min | Fitted | |
| Constitutive deactivation rate of NFκB | 0.0150 | [0.0124, 0.0272] | min | Fitted | |
| Phosphorylation rate of Akt by PDK1* | [, ] | (mol·min) | Fitted | ||
| Phosphorylation rate of Akt by mTORC2* | [, ] | (mol·min) | Fitted | ||
| Phosphorylation rate of Akt by PDK1* and mTORC2* | [, ] | (molmin) | Fitted | ||
| Dephosphorylation rate of Aktp by phosphatases | 1 | [0.5422, 7.0427] | min | Derived | |
| Phosphorylation rate of the TSC2 subunit of the TSC1-TSC2 complex (complex immediately dissociates) | 10 | [6.8726, 30.3895] | min | Fitted | |
| Dephosphorylation rate of TSC2p and its association with TSC1 | 1 | [0.3783, 8.2627] | min | Derived | |
| TSC2 phosphorylation Hill coefficient | 5 | unitless | Derived | ||
| Enzyme quantity producing half-maximum TSC2 phosphorylation rate | 0.15·[Akt] | mol | Fitted | ||
| Rate of Rheb guanine nucleotide exchange catalyzed by TSC1-TSC2 complex | [, ] | (mol·min) | Derived | ||
| Rate of RhebGDP to RhebGTP exchange | 1 | [0.3020, 10.5309] | min | Derived | |
| Activation rate of mTORC1 by RhebGTP | [, 0.0047] | (mol·min) | Fitted | ||
| Constitutive deactivation rate of mTORC1* | 1 | [0.2653, 4.7164] | min | Derived | |
| Activation rate of mTORC2 by PI3K* | 0.0030 | [2.7360e-4, 0.0993] | (mol·min) | Fitted | |
| Deactivation rate of mTORC2* by mTORC1 | 0.0030 | [0.0023, 0.0102] | (mol·min) | Fitted | |
| Constitutive deactivation rate of mTORC2* | 3 | [1.3631, 3.8319] | min | Fitted | |
| Activation rate of PTEN by FOXP3* | [, 0.0010] | (mol·min) | Derived | ||
| Constitutive activation of PTEN | 1 | [0.1925, 18.9529] | min | Derived | |
| Deactivation of PTEN* by TCR complex | 20 | [11.4372, 106.1915] | min | Fitted | |
| PTEN* deactivation Hill coefficient | 10 | unitless | Derived | ||
| Ligand-bound TCR quantity producing half-maximum PTEN* deactivation | 0.75·[TCR] | mol | Derived | ||
| Activation rate of IL-2 activity | [574.7247, ] | mol·min | Fitted | ||
| Hill coefficient for AP1-induced IL-2 activity | 2 | unitless | Derived | ||
| Hill coefficient for NFAT-induced IL-2 activity | 2 | unitless | Derived | ||
| Hill coefficient for NFκB-induced IL-2 activity | 2 | unitless | Derived | ||
| AP1 quantity producing half-maximum IL-2 activity | 0.1·[AP1] | mol | Derived | ||
| NFAT quantity producing half-maximum IL-2 activity | 0.3·[NFAT] | mol | Derived | ||
| NFκB quantity producing half-maximum IL-2 activity | 0.1·[NFκB] | mol | Derived | ||
| Deactivation rate of IL-2 activity by FOXP3 | [, 0.0093] | (mol·min) | Fitted | ||
| Constitutive deactivation rate of IL-2 | 1 | [0.1832, 8.9847] | min | Derived | |
| Activation rate of FOXP3 activity | [748.5767, ] | mol·min | Fitted | ||
| Hill coefficient for AP1-induced FOXP3 activity | 2 | unitless | Derived | ||
| Hill coefficient for NFAT-induced FOXP3 activity | 2 | unitless | Derived | ||
| AP1 quantity producing half-maximum FOXP3 activity | 0.1·[AP1] | mol | Derived | ||
| NFAT quantity producing half-maximum FOXP3 activity | 0.1·[NFAT] | mol | Derived | ||
| Deactivation rate of FOXP3 activity by mTOR | [, ] | (molmin) | Fitted | ||
| Constitutive deactivation rate of FOXP3 activity | 1 | [0.3685, 4.7328] | min | Derived |
Appendix 2: Parameter Sensitivity Analysis
Appendix 3: Calcium Flux Measurements
Appendix 4: Phospho-IκBα Measurements
References
- Yamane, H.; Paul, W.E. Cytokines of the gamma(c) family control CD4(+) T-cell differentiation and function. Nat. Immunol. 2012, 13, 1037–1044. [Google Scholar] [CrossRef] [PubMed]
- Zhu, J.F.; Paul, W.E. Heterogeneity and plasticity of T helper cells. Cell Res. 2010, 20, 4–12. [Google Scholar] [CrossRef] [PubMed]
- Doherty, P.C.; Zinkernagel, R.M. Biological role for major histocompatibility antigens. Lancet 1975, 1, 1406–1409. [Google Scholar] [CrossRef]
- Marrack, P.; Hannum, C.; Harris, M.; Haskins, K.; Kubo, R.; Pigeon, M.; Shimonkevitz, R.; White, J.; Kappler, J. Antigen-specific, major histocompatibility complex-restricted T-cell receptors. Immunol. Rev. 1983, 76, 131–145. [Google Scholar] [CrossRef] [PubMed]
- Weiss, A.; Imboden, J.; Hardy, K.; Manger, B.; Terhorst, C.; Stobo, J. The role of the T3-antigen receptor complex in T-cell activation. Annu. Rev. Immunol. 1986, 4, 593–619. [Google Scholar] [CrossRef] [PubMed]
- Veillette, A.; Bookman, M.A.; Horak, E.M.; Bolen, J.B. The CD4 and CD8 T-cell surface-antigens are associated with the internal membrane tyrosine-protein kinase p56Lck. Cell 1988, 55, 301–308. [Google Scholar] [CrossRef]
- Palacios, E.H.; Weiss, A. Function of the Src-family kinases, Lck and Fyn, in T-cell development and activation. Oncogene 2004, 23, 7990–8000. [Google Scholar] [CrossRef] [PubMed]
- Hermiston, M.L.; Xu, Z.; Weiss, A. CD45: A critical regulator of signaling thresholds in immune cells. Annu. Rev. Immunol. 2003, 21, 107–137. [Google Scholar] [CrossRef] [PubMed]
- Saunders, A.E.; Johnson, P. Modulation of immune cell signalling by the leukocyte common tyrosine phosphatase, CD45. Cell. Signal. 2010, 22, 339–348. [Google Scholar] [CrossRef] [PubMed]
- Chan, A.C.; Iwashima, M.; Turck, C.W.; Weiss, A. ZAP-70—A 70kd protein-tyrosine kinase that associates with the TCR zeta-chain. Cell 1992, 71, 649–662. [Google Scholar] [CrossRef]
- Iwashima, M.; Irving, B.A.; Vanoers, N.S.C.; Chan, A.C.; Weiss, A. Sequential interactions of the TCR with 2 distinct cytoplasmic tyrosine kinases. Science 1994, 263, 1136–1139. [Google Scholar] [CrossRef] [PubMed]
- Szabo, M.; Czompoly, T.; Kvell, K.; Talaber, G.; Bartis, D.; Nemeth, P.; Berki, T.; Boldizsar, F. Fine-tuning of proximal TCR signaling by ZAP-70 tyrosine residues in JurkaT-cells. Int. Immunol. 2012, 24, 79–87. [Google Scholar] [CrossRef] [PubMed]
- Berridge, M.J.; Irvine, R.F. Inositol trisphosphate, a novel 2nd messenger in cellular signal transduction. Nature 1984, 312, 315–321. [Google Scholar] [CrossRef] [PubMed]
- Nishibe, S.; Wahl, M.I.; Hernandez-Sotomayor, S.M.T.; Tonks, N.K.; Rhee, S.G.; Carpenter, G. Increase of the catalytic activity of phospholipase C-gamma-1 by tyrosine phosphorylation. Science 1990, 250, 1253–1256. [Google Scholar] [CrossRef] [PubMed]
- Zhang, W.G.; Sloan-Lancaster, J.; Kitchen, J.; Trible, R.P.; Samelson, L.E. LAT: The ZAP-70 tyrosine kinase substrate that links T-cell receptor to cellular activation. Cell 1998, 92, 83–92. [Google Scholar] [CrossRef]
- Imboden, J.B.; Stobo, J.D. Transmembrane signaling by the T-cell antigen receptor - Perturbation of the T3-antigen receptor complex generates inositol phosphates and releases calcium-ions from intracellular stores. J. Exp. Med. 1985, 161, 446–456. [Google Scholar] [CrossRef] [PubMed]
- Imboden, J.B.; Weiss, A.; Stobo, J.D. The antigen receptor on a human T-cell line initiates activation by increasing cytoplasmic free calcium. J. Immunol. 1985, 134, 663–665. [Google Scholar] [PubMed]
- Macian, F. NFAT proteins: Key regulators of T-cell development and function. Nat. Rev. Immunol. 2005, 5, 472–484. [Google Scholar] [CrossRef] [PubMed]
- Roose, J.P.; Mollenauer, M.; Gupta, V.A.; Stone, J.; Weiss, A. A diacylglycerol-protein kinase C-RasGRP1 pathway directs Ras activation upon antigen receptor stimulation of T-cells. Mol. Cell. Biol. 2005, 25, 4426–4441. [Google Scholar] [CrossRef] [PubMed]
- Genot, E.; Cantrell, D.A. Ras regulation and function in lymphocytes. Curr. Opin. Immunol. 2000, 12, 289–294. [Google Scholar] [CrossRef]
- Isakov, N.; Altman, A. Protein kinase C theta in T-cell activation. Annu. Rev. Immunol. 2002, 20, 761–794. [Google Scholar] [CrossRef] [PubMed]
- Baeuerle, P.A.; Baltimore, D. I-kappa-B—A specific inhibitor of the NF-kappa-B transcription factor. Science 1988, 242, 540–546. [Google Scholar] [CrossRef] [PubMed]
- Ghosh, S.; May, M.J.; Kopp, E.B. NF-kappa B and rel proteins: Evolutionarily conserved mediators of immune responses. Annu. Rev. Immunol. 1998, 16, 225–260. [Google Scholar] [CrossRef] [PubMed]
- Hacker, H.; Karin, M. Regulation and function of IKK and IKK-related kinases. Science’s STKE 2006, 2006, re13. [Google Scholar] [CrossRef] [PubMed]
- Jain, J.N.; McCaffrey, P.G.; Miner, Z.; Kerppola, T.K.; Lambert, J.N.; Verdine, G.L.; Curran, T.; Rao, A. The T-cell transcription factor NFAT(p) is a substrate for calcineurin and interacts with Fos and Jun. Nature 1993, 365, 352–355. [Google Scholar] [CrossRef] [PubMed]
- Jain, J.; Loh, C.; Rao, A. Transcriptional regulation of the IL-2 gene. Curr. Opin. Immunol. 1995, 7, 333–342. [Google Scholar] [CrossRef]
- Smeets, R.L.; Fleuren, W.W.M.; He, X.; Vink, P.M.; Wijnands, F.; Gorecka, M.; Klop, H.; Bauerschmidt, S.; Garritsen, A.; Koenen, H.J.P.M.; et al. Molecular pathway profiling of T lymphocyte signal transduction pathways; Th1 and Th2 genomic fingerprints are defined by TCR and CD28-mediated signaling. BMC Immunol. 2012, 13. [Google Scholar] [CrossRef] [PubMed]
- Powell, J.D.; Ragheb, J.A.; Kitagawa-Sakakida, S.; Schwartz, R.H. Molecular regulation of interleukin-2 expression by CD28 co-stimulation and anergy. Immunol. Rev. 1998, 165, 287–300. [Google Scholar] [CrossRef] [PubMed]
- Kane, L.P.; Lin, J.; Weiss, A. It’s all Rel-ative: NF-kappa B and CD28 costimulation of T-cell activation. Trends Immunol. 2002, 23, 413–420. [Google Scholar] [CrossRef]
- Powell, J.D.; Pollizzi, K.N.; Heikamp, E.B.; Horton, M.R. Regulation of Immune Responses by mTOR. Annu. Rev. Immunol. 2012, 30, 39–68. [Google Scholar] [CrossRef] [PubMed]
- Huehn, J.; Polansky, J.K.; Hamann, A. Epigenetic control of FOXP3 expression: The key to a stable regulatory T-cell lineage? Nat. Rev. Immunol. 2009, 9, 83–89. [Google Scholar] [CrossRef] [PubMed]
- Lee, K.; Gudapati, P.; Dragovic, S.; Spencer, C.; Joyce, S.; Killeen, N.; Magnuson, M.A.; Boothby, M. Mammalian Target of Rapamycin Protein Complex 2 Regulates Differentiation of Th1 and Th2 Cell Subsets via Distinct Signaling Pathways. Immunity 2010, 32, 743–753. [Google Scholar] [CrossRef] [PubMed]
- Saez-Rodriguez, J.; Simeoni, L.; Lindquist, J.A.; Hemenway, R.; Bommhardt, U.; Arndt, B.; Haus, U.U.; Weismantel, R.; Gilles, E.D.; Klamt, S.; et al. A logical model provides insights into T-cell receptor signaling. PLoS Comput. Biol. 2007, 3, 1580–1590. [Google Scholar] [CrossRef] [PubMed]
- Miskov-Zivanov, N.; Turner, M.S.; Kane, L.P.; Morel, P.A.; Faeder, J.R. The Duration of T-cell Stimulation Is a Critical Determinant of Cell Fate and Plasticity. Sci. Signal. 2013, 6, ra97. [Google Scholar] [CrossRef] [PubMed]
- Levchenko, A.; Bruck, J.; Sternberg, P.W. Scaffold proteins may biphasically affect the levels of mitogen-activated protein kinase signaling and reduce its threshold properties. Proc. Natl. Acad. Sci. USA 2000, 97, 5818–5823. [Google Scholar] [CrossRef] [PubMed]
- Hoffmann, A.; Levchenko, A.; Scott, M.L.; Baltimore, D. The I kappa B-NF-kappa B signaling module: Temporal control and selective gene activation. Science 2002, 298, 1241–1245. [Google Scholar] [CrossRef] [PubMed]
- O’Dea, E.L.; Barken, D.; Peralta, R.Q.; Tran, K.T.; Werner, S.L.; Kearns, J.D.; Levchenko, A.; Hoffmann, A. A homeostatic model of I kappa B metabolism to control constitutive NF-kappa B activity. Mol. Syst. Biol. 2007, 3. [Google Scholar] [CrossRef]
- Coombs, D.; Kalergis, A.M.; Nathenson, S.G.; Wofsy, C.; Goldstein, B. Activated TCRs remain marked for internalization after dissociation from pMHC. Nat. Immunol. 2002, 3, 926–931. [Google Scholar] [CrossRef] [PubMed]
- Wylie, D.C.; Hori, Y.; Dinner, A.R.; Chakraborty, A.K. A hybrid deterministic-stochastic algorithm for modeling cell signaling dynamics in spatially inhomogeneous environments and under the influence of external fields. J. Phys. Chem. B 2006, 110, 12749–12765. [Google Scholar] [CrossRef] [PubMed]
- Zheng, Y. A Systems Biology Study to Delineate the T-cell Receptor-Activated Erk-MAPK Signaling Pathway. Ph.D. Thesis, Purdue University, West Lafayette, IN, USA, 2005. [Google Scholar]
- Perley, J.P.; Mikolajczak, J.; Harrison, M.L.; Buzzard, G.T.; Rundell, A.E. Multiple Model-Informed Open-Loop Control of Uncertain Intracellular Signaling Dynamics. PLoS Comput. Biol. 2014, 10, e1003546. [Google Scholar] [CrossRef] [PubMed]
- Buzzard, G.T.; Xiu, D.B. Variance-Based Global Sensitivity Analysis via Sparse-Grid Interpolation and Cubature. Commun. Comput. Phys. 2011, 9, 542–567. [Google Scholar] [CrossRef]
- Buzzard, G.T. Global sensitivity analysis using sparse grid interpolation and polynomial chaos. Reliab. Eng. Syst. Saf. 2012, 107, 82–89. [Google Scholar] [CrossRef]
- Donahue, M.M.; Buzzard, G.T.; Rundell, A.E. Robust Parameter Identification with Adaptive Sparse Grid-based Optimization for Nonlinear Systems Biology Models. In Proceedings of the IEEE 2009 American Control Conference, St. Louis, MO, USA, 10–12 June 2009; IEEE: New York, NY, USA, 2009; Volumes 1–9, pp. 5055–5060. [Google Scholar]
- Von Essen, M.; Bonefeld, C.M.; Siersma, V.; Rasmussen, A.B.; Lauritsen, J.P.H.; Nielsen, B.L.; Geisler, C. Constitutive and ligand-induced TCR degradation. J. Immunol. 2004, 173, 384–393. [Google Scholar] [CrossRef] [PubMed]
- Geisler, C. TCR trafficking in resting and stimulated T-cells. Crit. Rev. Immunol. 2004, 24, 67–85. [Google Scholar] [CrossRef] [PubMed]
- Menne, C.; Sorensen, T.M.; Siersma, V.; von Essen, M.; Odum, N.; Geisler, C. Endo- and exocytic rate constants for spontaneous and protein kinase C-activated T-cell receptor cycling. Eur. J. Immunol. 2002, 32, 616–626. [Google Scholar] [CrossRef]
- Okada, M.; Nada, S.; Yamanashi, Y.; Yamamoto, T.; Nakagawa, H. Csk - A protein-tyrosine kinase involved in regulation of src family kinases. J. Biol. Chem. 1991, 266, 24249–24252. [Google Scholar] [PubMed]
- Plas, D.R.; Johnson, R.; Pingel, J.T.; Matthews, R.J.; Dalton, M.; Roy, G.; Chan, A.C.; Thomas, M.L. Direct regulation of ZAP-70 by SHP-1 in T-cell antigen receptor signaling. Science 1996, 272, 1173–1176. [Google Scholar] [CrossRef] [PubMed]
- Stefanova, I.; Hemmer, B.; Vergelli, M.; Martin, R.; Biddison, W.E.; Germain, R.N. TCR ligand discrimination is enforced by competing ERK positive and SHP-1 negative feedback pathways. Nat. Immunol. 2003, 4, 248–254. [Google Scholar] [CrossRef] [PubMed]
- Lipniacki, T.; Hat, B.; Faeder, J.R.; Hlavacek, W.S. Stochastic effects and bistability in T-cell receptor signaling. J. Theor. Biol. 2008, 254, 110–122. [Google Scholar] [CrossRef] [PubMed]
- Buday, L.; Egan, S.E.; Viciana, P.R.; Cantrell, D.A.; Downward, J. A complex of Grb2 adapter protein, SOS exchange factor, and a 36-kDa membrane-bound tyrosine phosphoprotein is implicated in Ras activation in T-cells. J. Biol. Chem. 1994, 269, 9019–9023. [Google Scholar] [PubMed]
- Clipstone, N.A.; Crabtree, G.R. Identification of calcineurin as a key signaling enzyme in lyphocyte-T activation. Nature 1992, 357, 695–697. [Google Scholar] [CrossRef] [PubMed]
- Rudd, C.E.; Taylor, A.; Schneider, H. CD28 and CTLA-4 coreceptor expression and signal transduction. Immunol. Rev. 2009, 229, 12–26. [Google Scholar] [CrossRef] [PubMed]
- McNeill, L.; Salmond, R.J.; Cooper, J.C.; Carret, C.K.; Cassady-Cain, R.L.; Roche-Molina, M.; Tandon, P.; Holmes, N.; Alexander, D.R. The differential regulation of lck kinase phosphorylation sites by CD45 is critical for T-cell receptor signaling responses. Immunity 2007, 27, 425–437. [Google Scholar] [CrossRef] [PubMed]
- Stone, J.D.; Conroy, L.A.; Byth, K.F.; Hederer, R.A.; Howlett, S.; Takemoto, Y.; Holmes, N.; Alexander, D.R. Aberrant TCR-Mediated signaling in CD45-null thymocytes involves dysfunctional regulation of Lck, Fyn, TCR-zeta and ZAP-70. J. Immunol. 1997, 158, 5773–5782. [Google Scholar] [PubMed]
- Kretschmer, K.; Apostolou, I.; Hawiger, D.; Khazaie, K.; Nussenzweig, M.C.; von Boehmer, H. Inducing and expanding regulatory T-cell populations by foreign antigen. Nat. Immunol. 2005, 6, 1219–1227. [Google Scholar] [CrossRef] [PubMed]
- Lewis, R.S. Calcium signaling mechanisms in T lymphocytes. Annu. Rev. Immunol. 2001, 19, 497–521. [Google Scholar] [CrossRef] [PubMed]
- Dogan, G. Confidence Interval Estimation in System Dynamics Models: Bootstrapping vs. Likelihood Ratio Method. In Proceedings of the 22nd International Conference of the System Dynamics Society, Oxford, UK, 2004.
© 2014 by the authors; licensee MDPI, Basel, Switzerland. This article is an open access article distributed under the terms and conditions of the Creative Commons Attribution license (http://creativecommons.org/licenses/by/4.0/).
Share and Cite
Perley, J.P.; Mikolajczak, J.; Buzzard, G.T.; Harrison, M.L.; Rundell, A.E. Resolving Early Signaling Events in T-Cell Activation Leading to IL-2 and FOXP3 Transcription. Processes 2014, 2, 867-900. https://doi.org/10.3390/pr2040867
Perley JP, Mikolajczak J, Buzzard GT, Harrison ML, Rundell AE. Resolving Early Signaling Events in T-Cell Activation Leading to IL-2 and FOXP3 Transcription. Processes. 2014; 2(4):867-900. https://doi.org/10.3390/pr2040867
Chicago/Turabian StylePerley, Jeffrey P., Judith Mikolajczak, Gregery T. Buzzard, Marietta L. Harrison, and Ann E. Rundell. 2014. "Resolving Early Signaling Events in T-Cell Activation Leading to IL-2 and FOXP3 Transcription" Processes 2, no. 4: 867-900. https://doi.org/10.3390/pr2040867