Review

Design Criteria for Generating Physiologically Relevant In Vitro Models in Bioreactors

Research Center "E. Piaggio", University of Pisa, largo Lucio Lazzarino 1, 56122 Pisa, Italy
*
Author to whom correspondence should be addressed.
These authors contributed equally to this work.
Processes 2014, 2(3), 548-569; https://doi.org/10.3390/pr2030548
Submission received: 21 May 2014 / Revised: 17 June 2014 / Accepted: 2 July 2014 / Published: 25 July 2014
(This article belongs to the Special Issue Design of Bioreactor Systems for Tissue Engineering)

Abstract

:
In this paper, we discuss the basic design requirements for the development of physiologically meaningful in vitro systems comprising cells, scaffolds and bioreactors, through a bottom up approach. Very simple micro- and milli-fluidic geometries are first used to illustrate the concepts, followed by a real device case-study. At each step, the fluidic and mass transport parameters in biological tissue design are considered, starting from basic questions such as the minimum number of cells and cell density required to represent a physiological system and the conditions necessary to ensure an adequate nutrient supply to tissues. At the next level, we consider the use of three-dimensional scaffolds, which are employed both for regenerative medicine applications and for the study of cells in environments which better recapitulate the physiological milieu. Here, the driving need is the rate of oxygen supply which must be maintained at an appropriate level to ensure cell viability throughout the thickness of a scaffold. Scaffold and bioreactor design are both critical in defining the oxygen profile in a cell construct and are considered together. We also discuss the oxygen-shear stress trade-off by considering the levels of mechanical stress required for hepatocytes, which are the limiting cell type in a multi-organ model. Similar considerations are also made for glucose consumption in cell constructs. Finally, the allometric approach for generating multi-tissue systemic models using bioreactors is described.

Graphical Abstract

1. Introduction

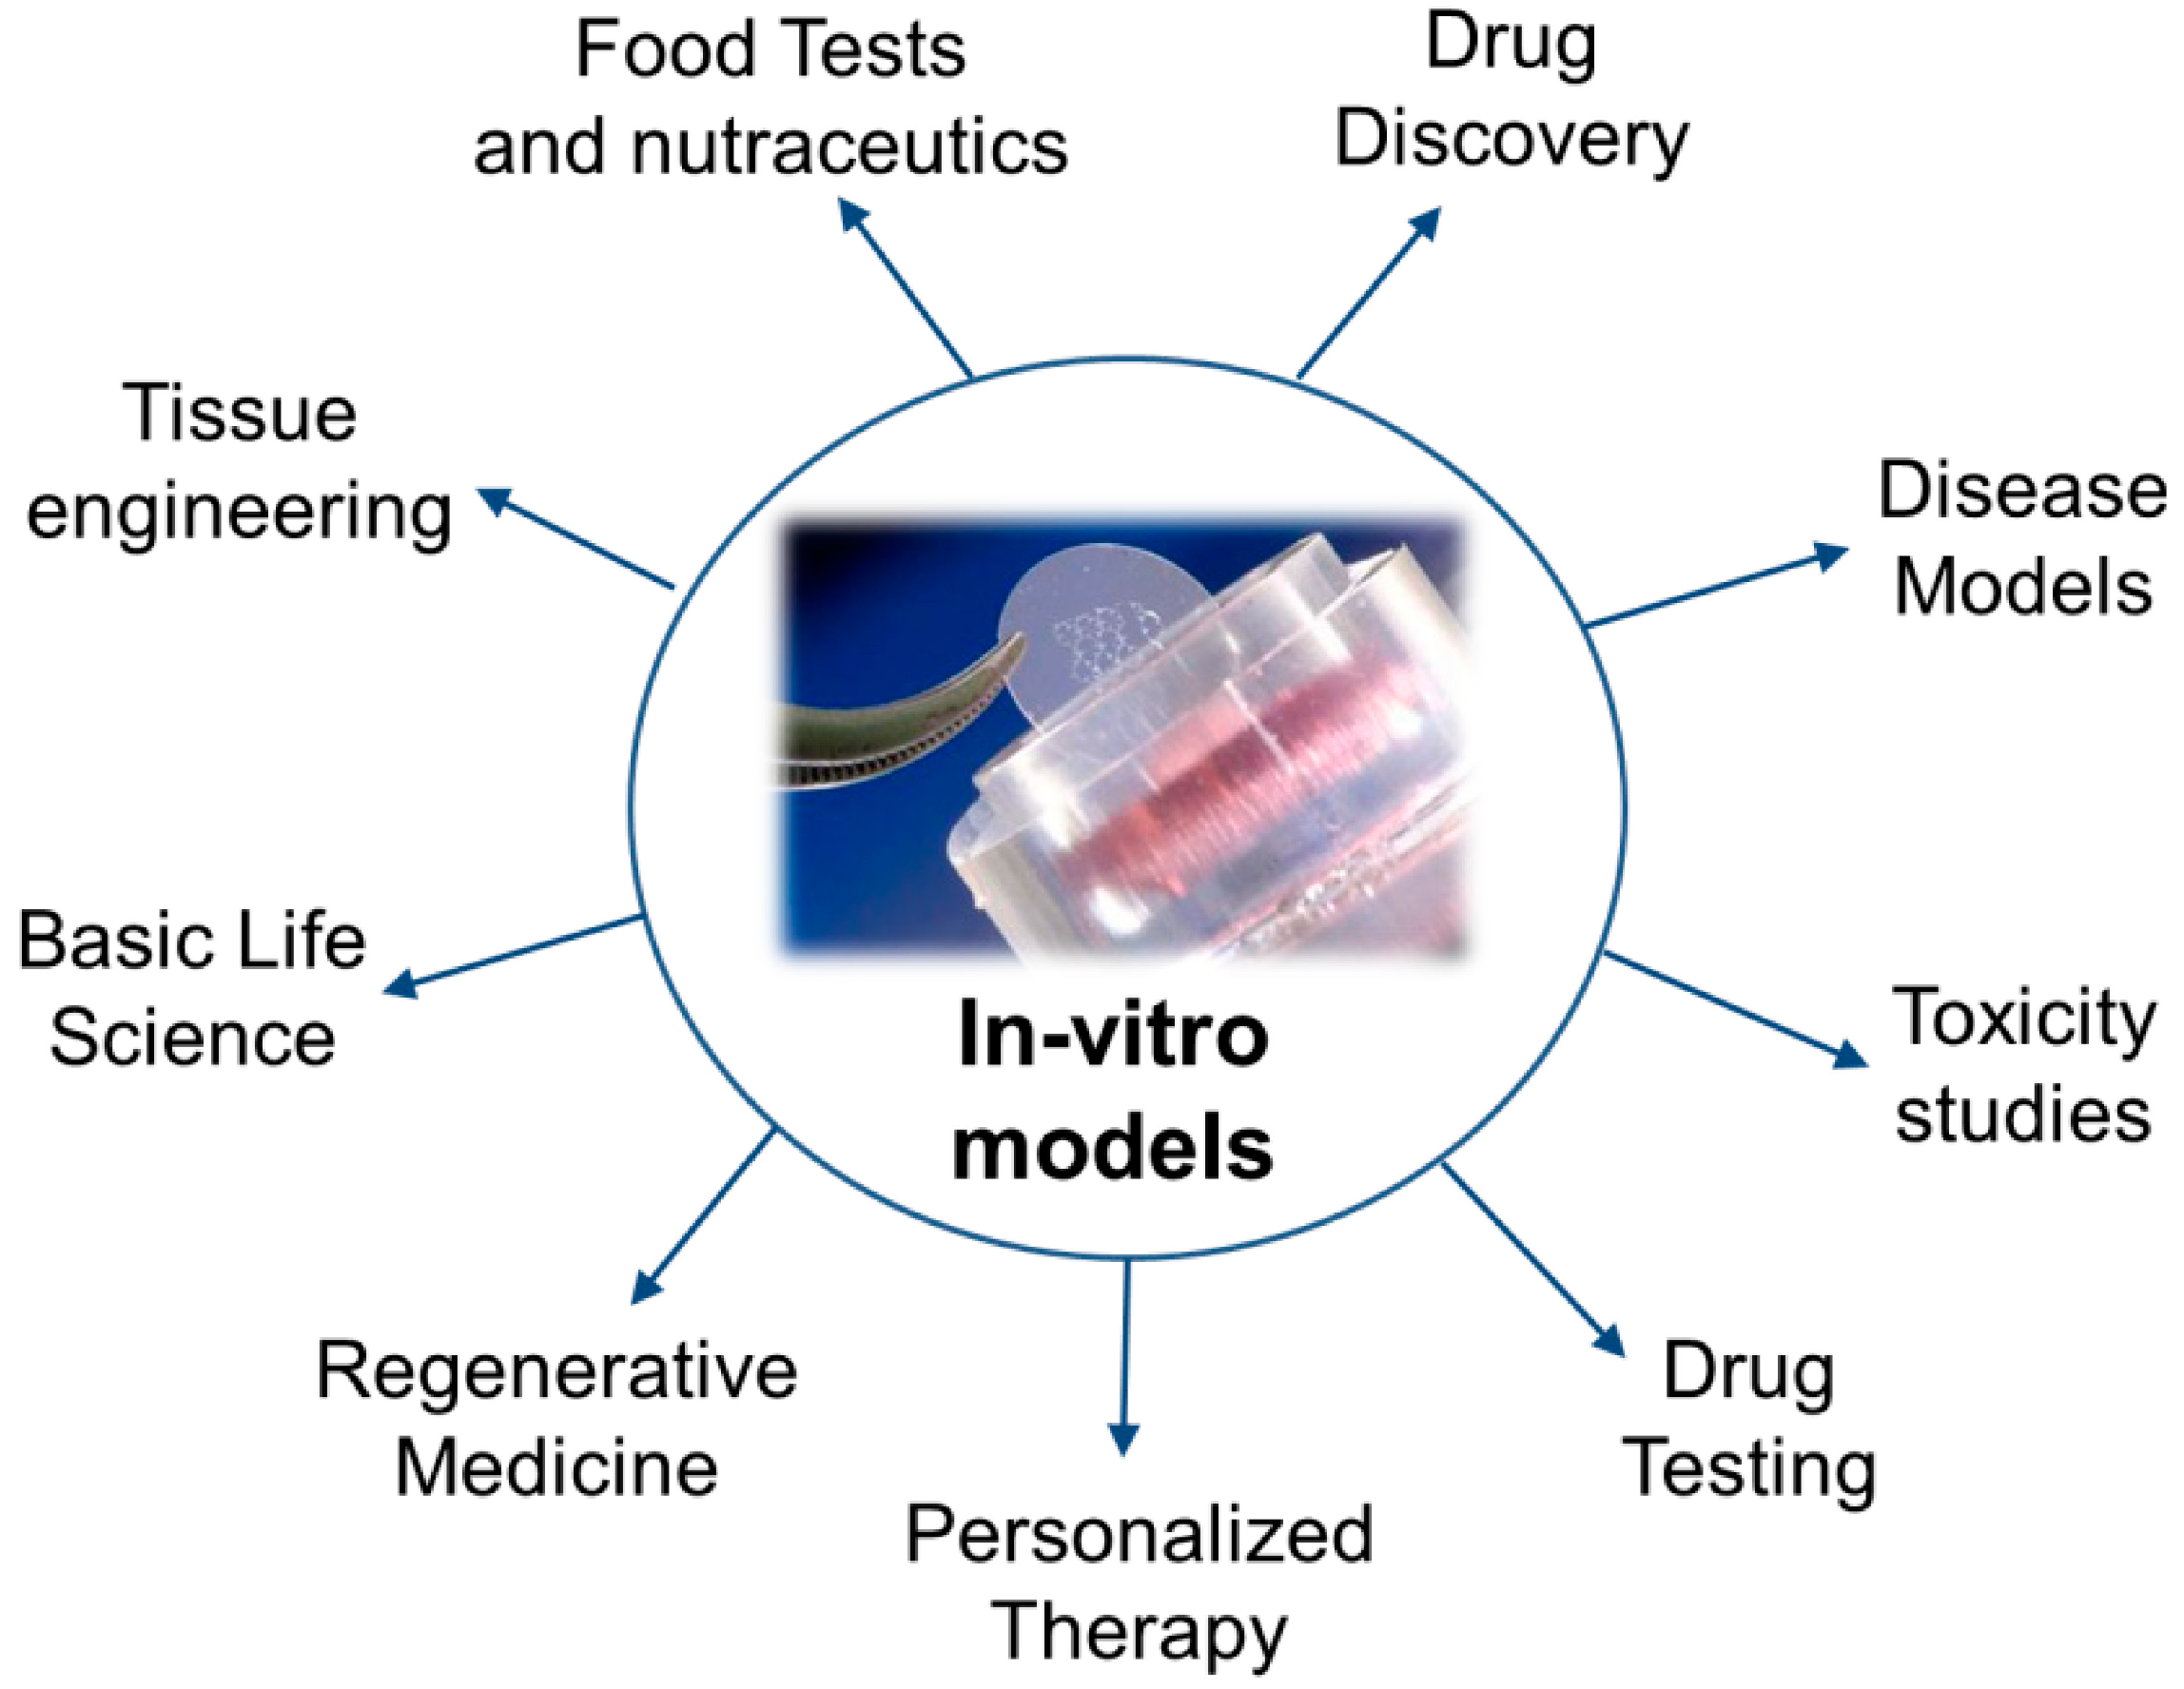
1.1. In Vivo and In Vitro

In vitro research is the study of animal and human tissues outside the living organism system. Organs, tissues, cells or their components are isolated from the organism, generally post-mortem, and cultured using appropriate supporting aqueous media. In vitro models have been widely used to simplify the study of complex phenomena of the in vivo environment, creating well-controlled and easily accessible conditions for the quantitative and repeatable evaluation of cell response—moreover, they are quick and require modest amounts of material [1]. In vitro experiments are necessarily a simplification of the more complex living organism and are usually designed to answer specific questions. A good scientist should be aware of the limitations and boundary conditions of such tests, being careful not to over interpret experimental results. In fact, how accurately the experiments recapitulate in vivo conditions depends on the study design as well as the desired outcomes [2,3,4].
As shown in Figure 1, in vitro models have a wide range of applications in many different fields, from toxicology [4] and drug testing [3] to tissue engineering [5] and nutraceutics [6].
Figure 1. Applications of in vitro models.
Processes 02 00548 g001
In vivo research on the other hand is the analysis of biological systems in living, intact organisms. In vivo experimentation became widespread with the use of micro-organisms and animal models in genetic manipulation experiments. Huge advances in medicine and in our understanding in cell and tissue biology have been made possible by in vivo tests, even though they do incite horror and revulsion. Over the past 30 years, in vivo tests have been carried out on animal models to assess the safety and toxicity of drugs and chemicals. In particular, both EU and FDA legislation require drugs to be tested on animals before reaching the market. However, given that most physiological and pathological processes are significantly different in humans and animals, and that drugs are given to sick, often old humans but tested on healthy and young animals, the utility of this type of regulatory testing, and the use of animals as human-surrogates in general, has recently been questioned [7,8].

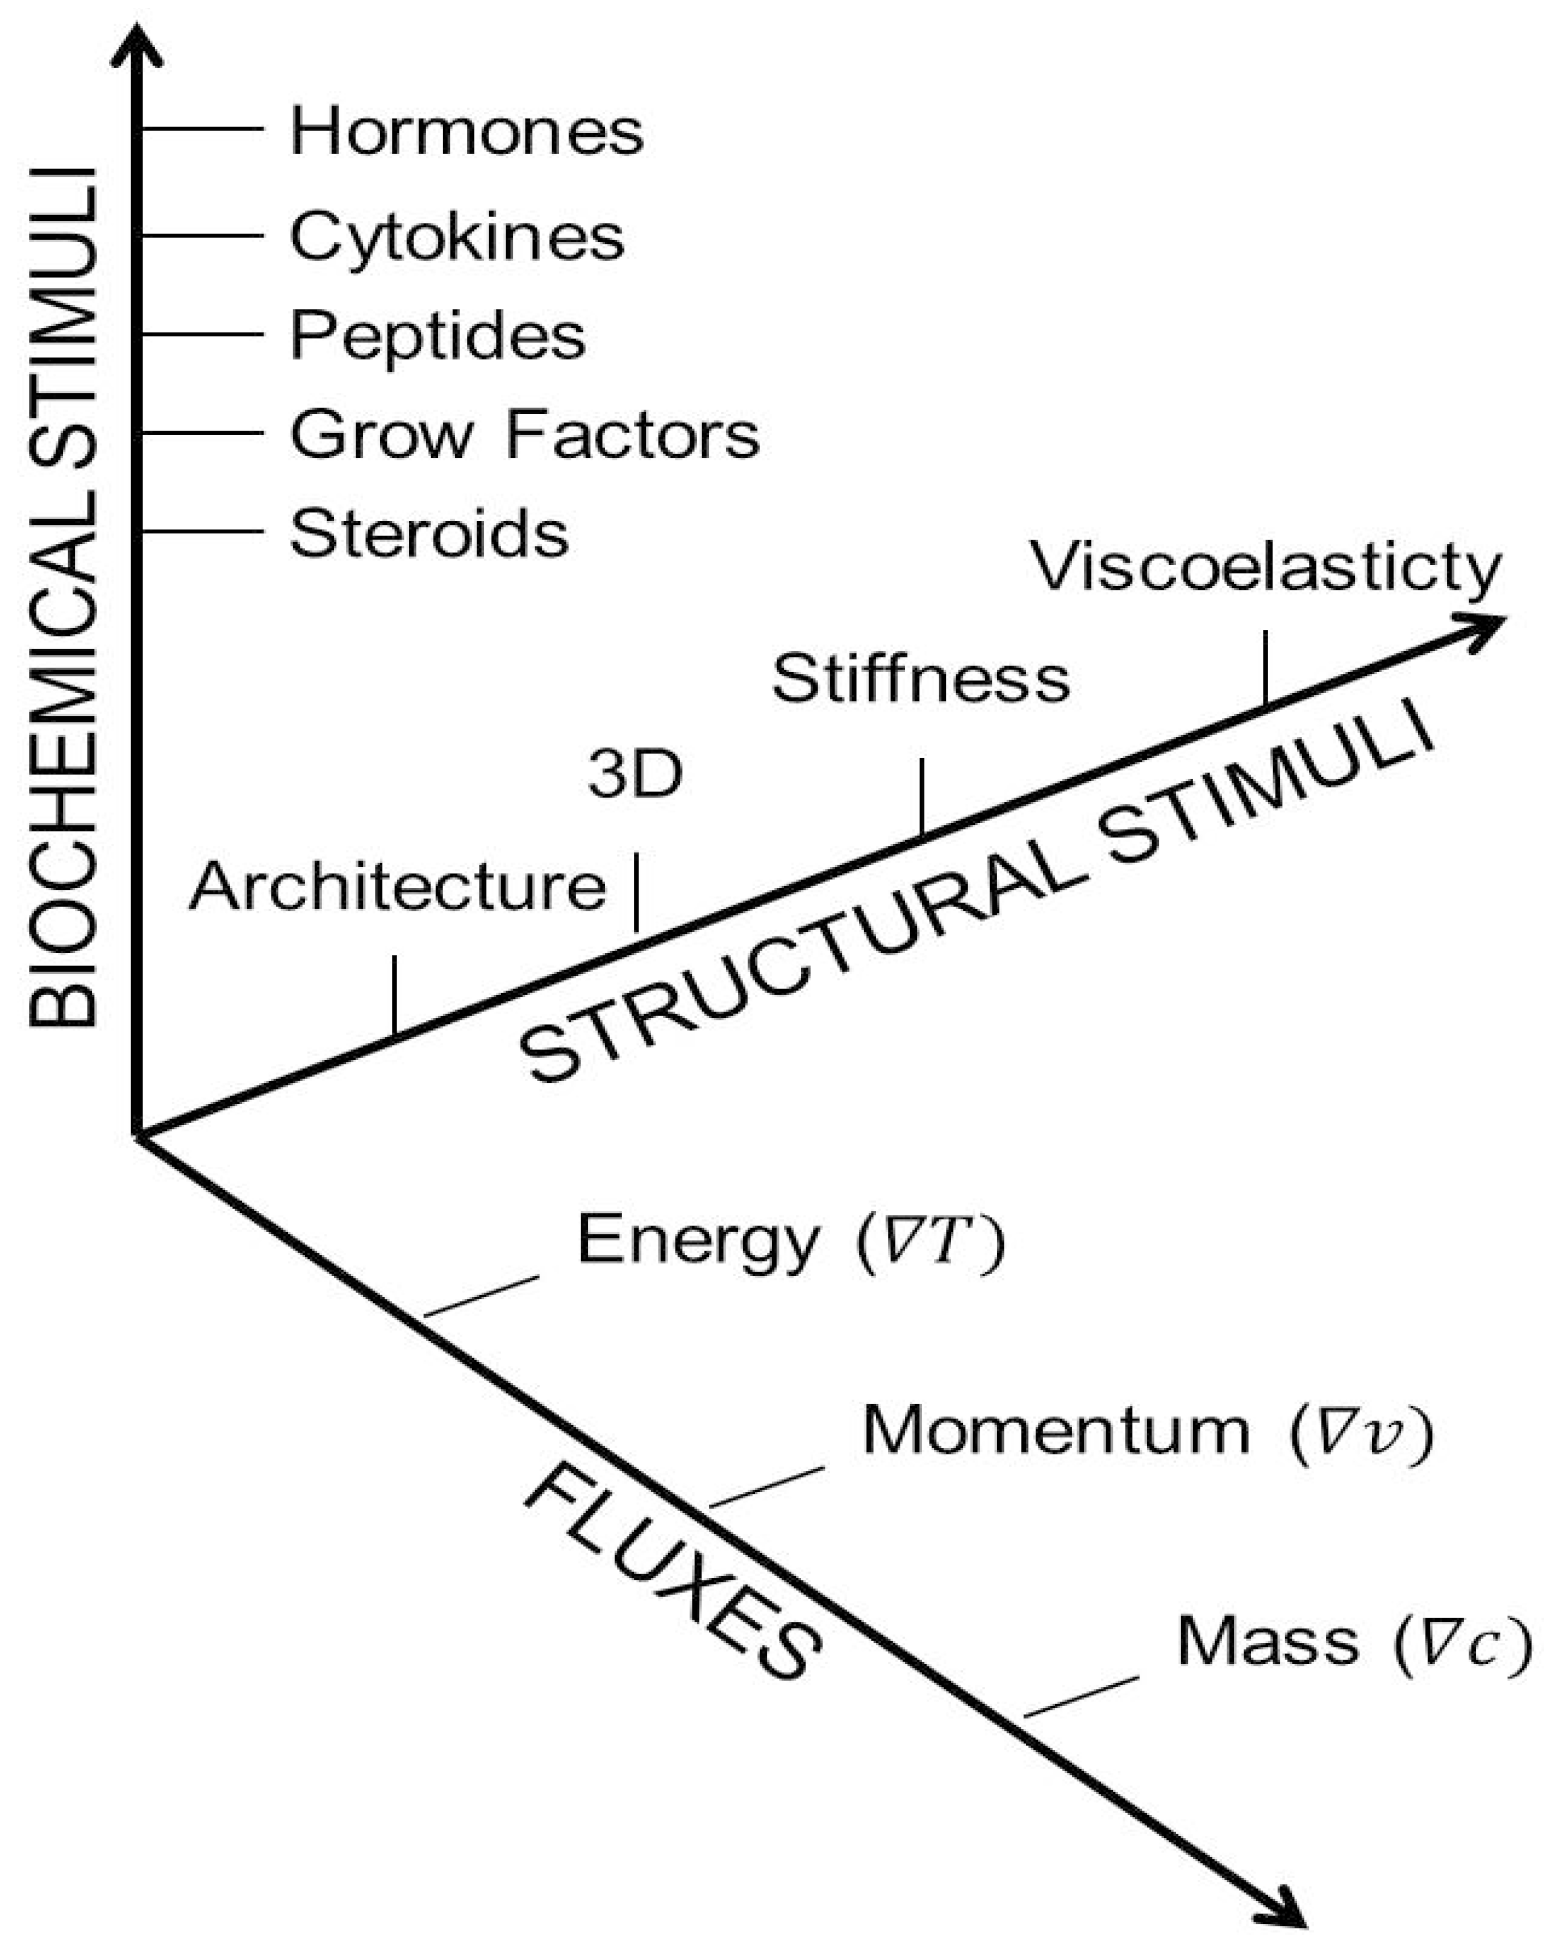
1.2. Classifying the Microenvironment

Cell culture in vitro was born at the turn of the last century, and since then the basic techniques have remained largely unchanged [9]. Indeed, although the term in vitro includes many different models, the most widely used in biological research today is still the monolayer, monoculture system whereby cells are isolated, selected and then plated on culture dishes and placed in cell culture incubators. The advantages and disadvantages of the traditional, simple methods are listed in Table 1.
Table 1. The simplest in vitro models.
MethodDescriptionAdvantagesDisadvantages
Monolayer monoculturesOnly one cell type plated in flat dishesCheap, standardLoss of phenotype, absence of 3D architecture changes cell shape
Tissue slice cultureTissue slices are cultured in plates or on supportsIn vivo environment is better preservedRequire hyperoxic conditions, viability limited in time
Co-culturesMonolayer cultures containing more than one cell typeCell function is improvedDifficult to analyse the contribution of each cell type to co-culture function
The extreme reductionist approach of the monolayer monoculture became apparent in the 1980s, with the birth of tissue engineering, which seeks to replicate the tissue microenvironment so driving cells towards growth and regeneration. During this period, it was increasingly evident that more relevant and predictive in vitro models should seek to better replicate the stimuli which act on the cells in the human body. The stimuli can be classified in three major groups as represented in Figure 2: the biochemical signals from other cells and the extracellular matrix, the physical and structural stimuli from the 3D (three-dimensional) microenvironment, and the physico-chemical fluxes which originate from temperature, concentration or momentum gradients [10].
Figure 2. The three axes of stimuli which act on cells in the body (adapted from [10]). The stimuli act on cells, tissues, organs and organisms, as time moves inexorably forwards.
Processes 02 00548 g002
The complex array of biochemical signals is modulated by the cells themselves as they secrete and absorb molecules to and from the extracellular environment. Not only are they difficult to analyse, but given our current level of understanding of cell epigenetics they are also almost impossible to predict and control. The structural stimuli represent the physical nature of the microenvironment at multiple scales: these include nano-topography, micro-porosity, milli- and micro-architecture and mill-scaled stiffness. Surface and material features also belong to this group and constitute a crucial subset of cues in the three-dimensional realm of living organisms. Material aspects will not however be considered here, as there is ample literature on this subject. Finally, the third group of stimuli is the space- and time-dependent transport of molecules, momentum, energy or flux. Flux is present in all living systems and is easy to monitor and modulate, but its omnipresence is not often considered in experimental models.

2. Mimicking Physiological Systems: The Rule of Ten

That the 3D nature of the tissue environment is crucial to cell form and function is now a well-accepted fact. For instance, the oxygen consumption of cells in 3D is much lower than in 2D, indicating important differences in cell metabolism [11]. Furthermore, when cultured in 3D, hepatocytes maintain metabolic competence, chondrocytes do not differentiate and all adherent cells adopt a more rounded shape [12].
How can we define 3D in a physiological context? There is no general consensus on what a 3D structure is or on what constitutes a physiologically relevant system. Scientists usually use the so called “rule of ten” or an order of magnitude to approximate and compare different numerical parameters and length scales. In this review, we adapt the concept to define the minimum size of a 3D cell construct starting from the characteristic dimensions of its basic constituents (i.e., cells). In particular, for cells to be in a 3D context, the construct should have sides of at least 10 cell diameters (~20 µm), or around 200 µm.
The human body contains about 50 trillion cells and over 100 different cell types. Beginning with cells, tissues, organs and systems are organised in a hierarchy whereby each level increases in complexity, function and size. In engineering terms, we can define the so-called functional unit as a group of cells which can recapitulate organ function at the micro-scale. It represents the smallest autonomous organ voxel which can survive in the absence of blood vessels, a cube of around 200 µm per side or 8 × 10⁻⁶ cm3. Using the rule of ten as a guide, in order to design a physiologically relevant in vitro system we require at least 10 functional units. The average cell density in the body is 7 × 10⁸ cells/cm3; some organs, such as the liver, are more densely populated while others like cartilage and bone contain a large percentage of extracellular matrix. Ergo, the minimum number of cells which can be meaningfully cultured in vitro to represent physiological organ function is about 56,000 (i.e., the number of cells in 10 functional units) and the minimum cell density is of the order of 7 × 10⁷ cells/cm3 (i.e., 10% of the native cell density). In fact, several reports attest to the fact that 60–70 million cells/mL are required for producing functional vivo-like tissues in vitro [13,14]. On the basis of these considerations, the minimum construct volume for physiologically relevant in vitro models is 0.8 µL. Hence, the simplest construct geometry is a parallelepiped of 0.2 × 20 × 0.2 mm3.

3. Scaling: Nano, Micro and Milli

The study of micro- and nano-scaled systems is becoming quite fashionable, although purists do argue that both prefixes are oversold and overhyped [15]. The official definition of nano is 1–100 nm, that of micro is 1–100 µm, milli systems scale between 1 mm and 100 mm. Between 0.1–1 micron and 0.1–1 mm lie a sort of no man’s land, tread by all. Not quite analogously, micro-fluidics is defined as the flow of small volumes in micro-scaled channels, even though the actual volumes flowing through the channels may be quite large. Milli-fluidic systems have flow channels of millimetric height, and volumes range from 1 mL to 100 mL.
Although micro-fabricated micro-fluidic bioreactors and micro cell culture systems (e.g., the cell-on-a-chip developed by Lee et al. [16] or the body-on-a-chip proposed by the Shuler’s group [17]) are highly cited and several reports demonstrate that they are capable of mimicking physiological interactions between cells [18,19], these devices remain a niche research tool. The cell culture surface in a micro-bioreactor is generally around 0.5–0.8 mm2 [20] and is seeded with a few thousand cells. Consequently, most micro-scaled devices contain little more than a few functional units. Thus, they are not representative of a tissue/organ and cannot meaningfully predict in vivo physiology or pathophysiology [21]. Another problem of micro-fluidic devices is represented by their extremely high surface to volume ratio, which gives rise to high wall shear stresses (having detrimental effects on many cell types, such as hepatocytes [22,23]) and the so-called edge-effect, with a large portion of cells lying at the periphery of the system rather than being surrounded by other cells. The edge-effect has been shown to affect cell organisation and function, with peripheral cells exhibiting increased cytoskeletal tension [24] and different viability or activity [25]. Moreover, it can direct changes in cell phenotype [26]. Consequently, this effect influences results obtained culturing cells in micro-devices, as highlighted by Lundholt et al. [27]. Another critical issue in micro-fluidic systems is that the media flow in each channel is very slow, to avoid the application of high shear stresses on cells. These conditions directly affect the oxygen and nutrient concentrations, in particular if used in combination with cells with high metabolic demands like hepatocytes or cardiomyocytes. Fortunately, the majority of micro-scaled devices are made with polydimethylsiloxane (PDMS) using soft lithography techniques to obtain specific micro-channels and micro-chambers for cell cultures. An oxygen permeable material such as PDMS is essential for the functioning of these devices, as highlighted in Section 4. However, since these polymers generally adsorb small hydrophobic molecules [28], they may have negative effects on micro-scaled cell cultures characterised by high surface to volume ratios, such as nutrient or ligand depletion. Moreover, some studies report that residual un-crosslinked oligomers may leach from the polymers during the manufacturing of micro-devices, and interact with cells or culture media [29]. These effects, in turn, may give rise to experimental artefacts, such as increased metabolic consumption rates.
Another problem originating from the high surface to volume ratio is the presence of air bubbles within micro-fluidic systems, where surface forces play a major role over bulk or volume forces. Air bubbles, formed due to differences in surface energies between dissolved gases and the liquid medium, stick to the walls of the device and tend to retain their position independent of the magnitude of flow rates or external forces (such as tilting or shaking) used, thus altering the fluid flow pattern and having detrimental effects on the cultured cells. In fact, driving media through micro-fluidic channels requires the use of high pressure gradients, which may also influence cell function. Finally, micro-scaled devices and micro-bioreactors are generally difficult to assemble and use, with quite complex seeding and filling procedures, likely contributing to increased experimental failure (never reported in publications) and decreased reliability. In fact, micro-fluidic systems present some difficulties during cell seeding, which is usually performed introducing a cell suspension through the micro-channels. During this procedure, cells withstand very high pressures in order to allow the cell culture media to overcome the surface tension forces. Moreover, in this way it is very difficult to control the cell concentration and distribution in the channel or chambers [30]. Micro-fluidic systems also require the translation of conventional experimental methods and protocols established at the milli-scale using standard cell culture supports like the 24-well plate to the micro-scale, which is often difficult and frowned upon by biologists and technicians. As a result, in most academic and industrial research laboratories, the standard cell culture is still represented by cell monolayers cultured on Petri dishes or multi-well plates. Table 2 summarises the advantages and disadvantages of micro- and milli-fluidic systems [31].
Table 2. Comparison between the milli- and micro-fluidic systems.
Micro-FluidicsMilli-Fluidics
Low shear by reduction of flow rateLow shear, high flow rates
Low nutrient turnoverHigh nutrient turnover
High surface to volume ratioLow surface to volume ratio
Fiddly to assembleEasy to assemble
Presence of air bubblesNo air bubbles
Low fluid volumes, saving on reagentsHigher volumes of media and reagents
Easy quantification of cell productsCell products may be harder to quantify

4. Modelling 3D In Vitro Cell Cultures: Hepatocyte-Laden Hydrogels as a Reference

Computational fluid dynamic (CFD) models are useful to investigate whether the culture parameters (e.g., medium inflow) and configuration (e.g., fluid and construct volume and geometries) can be appropriate for a given cell type (e.g., adequate nutrient supply and waste removal, acceptable flow-induced shear stress). In particular, oxygen, critical in all aerobic metabolic cycles, is often the limiting factor when culturing 3D cellular constructs in vitro, especially in the case of non-porous systems which rely on gradient-driven passive diffusion. The reason for this arises from the difficulty in bringing sufficient amounts of oxygen to the cells because of its poor solubility in culture media (typically around 0.2 mM or 0.2 mol∙m−3 when atmospheric oxygen is used). In fact, even if oxygen is typically consumed at a similar molar rate per cell as glucose and has about a four-fold higher diffusion coefficient in aqueous media, this is more than offset by the differences in the concentrations available under physiological conditions. The solubility of oxygen in culture media or in tissue is much lower than that of glucose, hence in physiologically relevant conditions O2 availability is about 0.05–0.2 mM vs. 3–15 mM of glucose [32]. Moreover, increasing the oxygen concentration in the culture medium by using pure oxygen instead of air or increasing gas pressure without an appropriate carrier such as hemoglobin, induces the presence of free radicals, which are cytotoxic [33]. For this reason, the culture medium must be continually circulated and re-oxygenated by passing through an in-line gas exchanger.
To demonstrate these concepts we use primary hepatocytes as a reference cell type, since they are considered difficult cells to culture [34,35] and rapidly lose their phenotypic expression in vitro likely due to the absence of an appropriate environment [36]. Therefore, hepatocytes represent the limiting cell type in an in vitro multi-organ model and are appropriate benchmarks for assessing bioreactor design. Typical oxygen concentrations in the liver range from 0.04 mM to 0.10 mM [36], while hepatocyte function is compromised at 0.02 mM [37]. Moreover, hepatocytes (as well as most adherent mammalian cells, except endothelial cells) cannot support direct tangential fluid flow. They are instead constantly stimulated by a concentration and pressure gradient driven flow, which is moderated by the ECM network, resulting in very low shear stresses on the cell membrane. Several reports show that hepatocytes are extremely sensitive to shear stress [38,39], with high shear resulting in decreased cell viability [23]. In fact, the endothelial cells of hepatic sinusoids protect hepatocytes from direct shear stress and the latter receive nutrients through interstitial flow [40,41]. However, a unique consensus of the maximum shear stress supported by hepatocytes is still lacking. According to Tilles et al., the function of hepatocytes co-cultured with fibroblasts is compromised at wall shear stresses higher than 0.033 Pa [22]. This value is now considered as an overestimation. In fact, we more recently report that a shear stress of about 2 × 10⁻⁵ Pa exerts deleterious effects on the viability and function of sandwich cultured primary rat hepatocytes [31].
In a fluidic bioreactor system, shear stress and oxygen delivery are closely related: reducing the flow rate will reduce the shear stress on cells and, as a consequence, shear induced damage, but it will also reduce the oxygen delivery to hepatocytes. Therefore, CFD models can be very useful in establishing the best culture parameters and configuration to maximise cell viability and function for a given application.

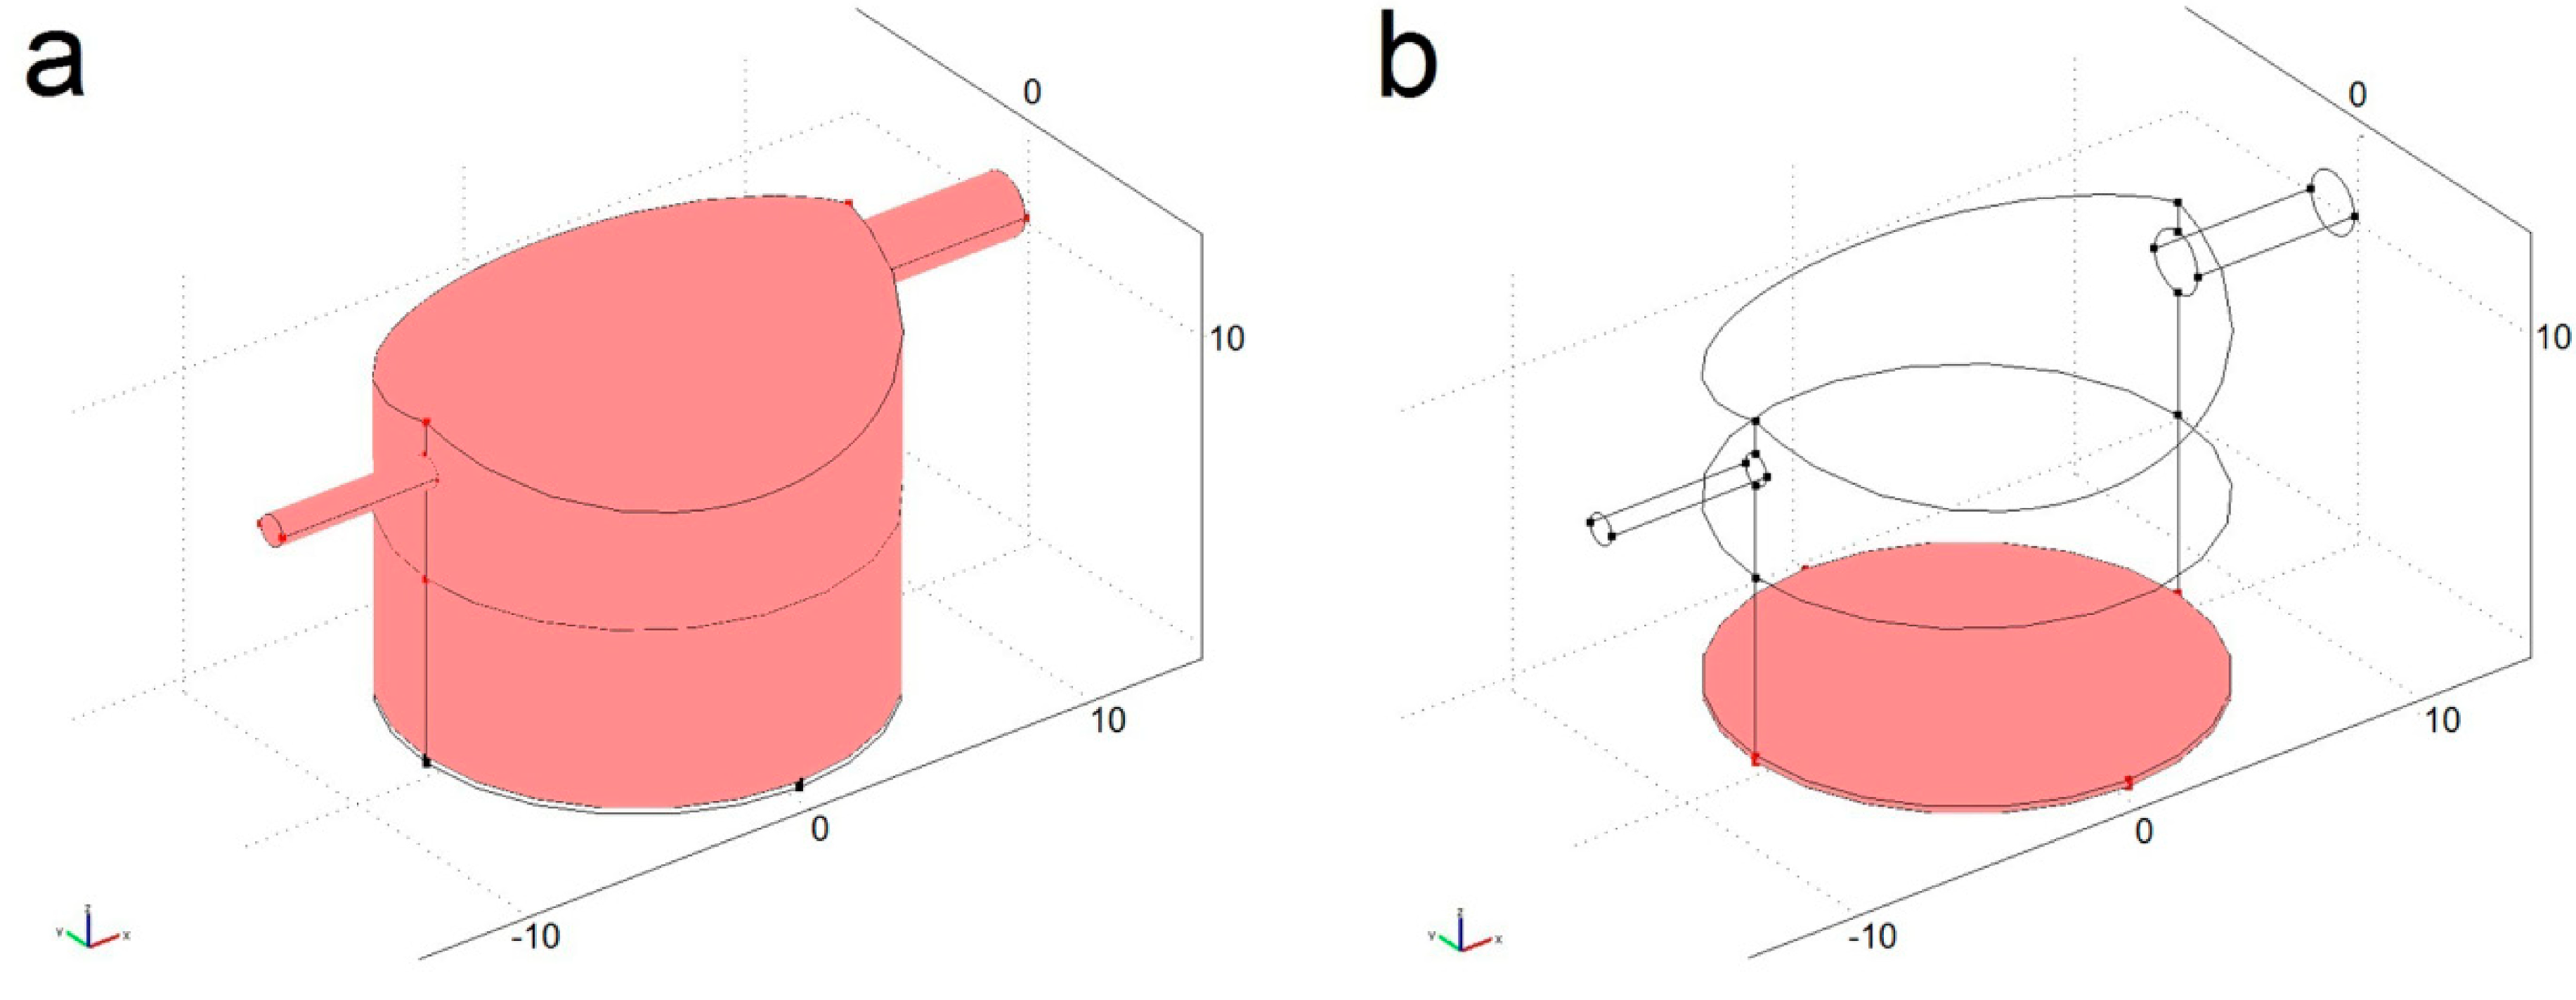
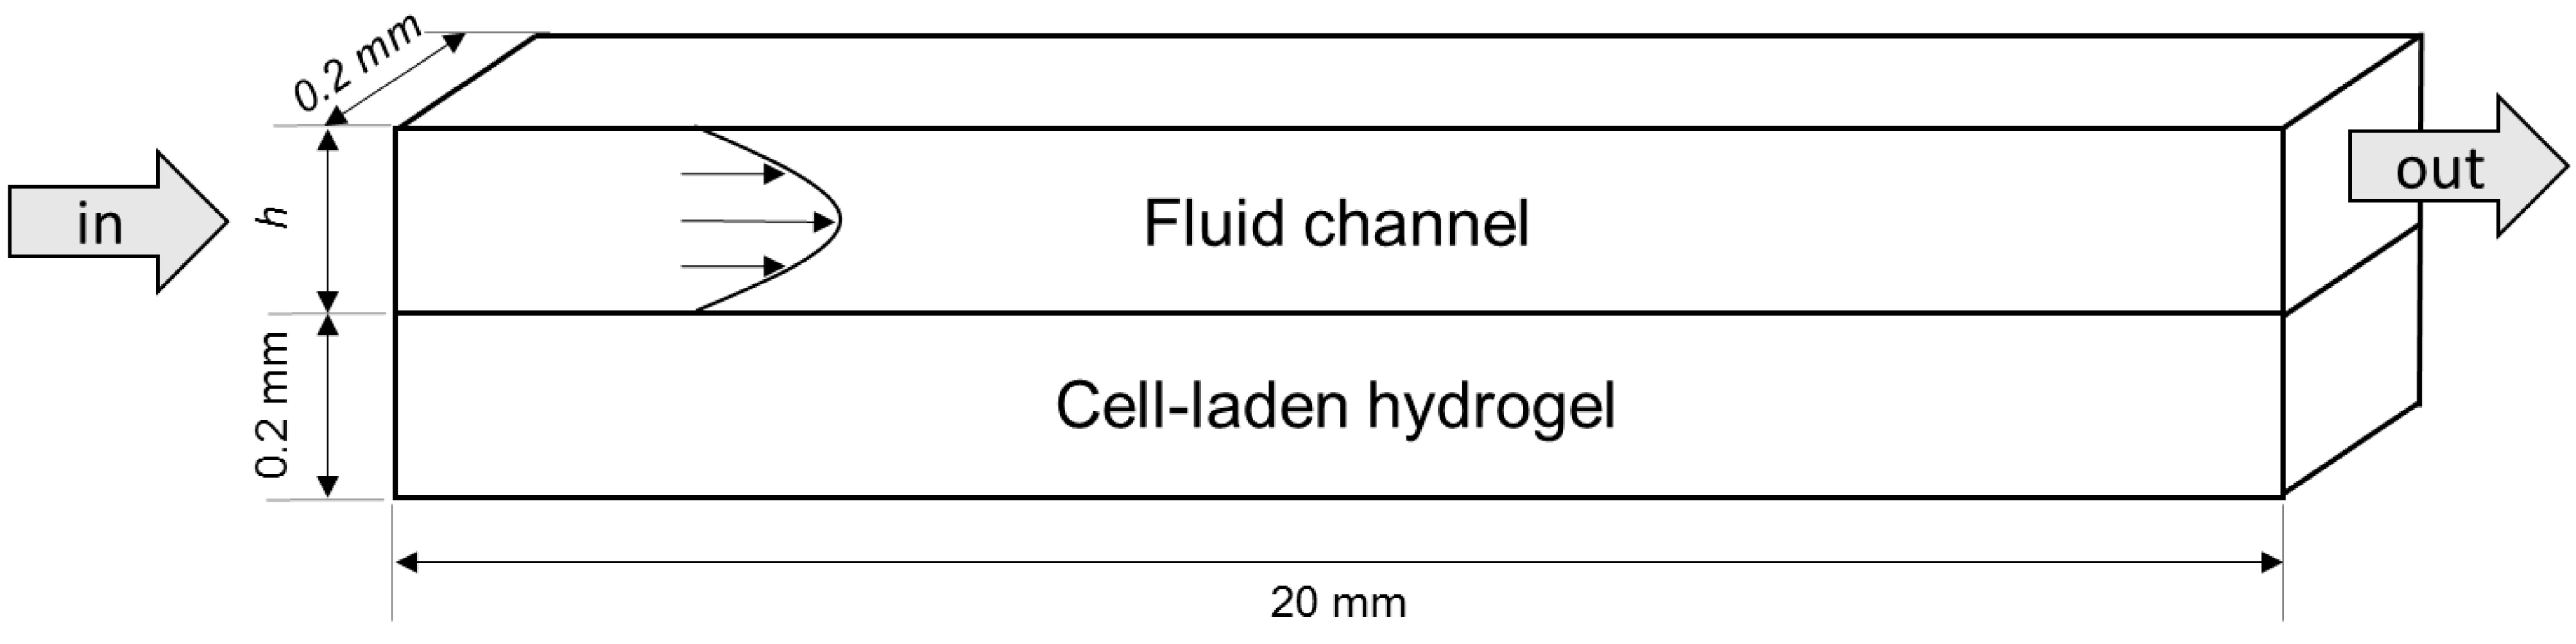
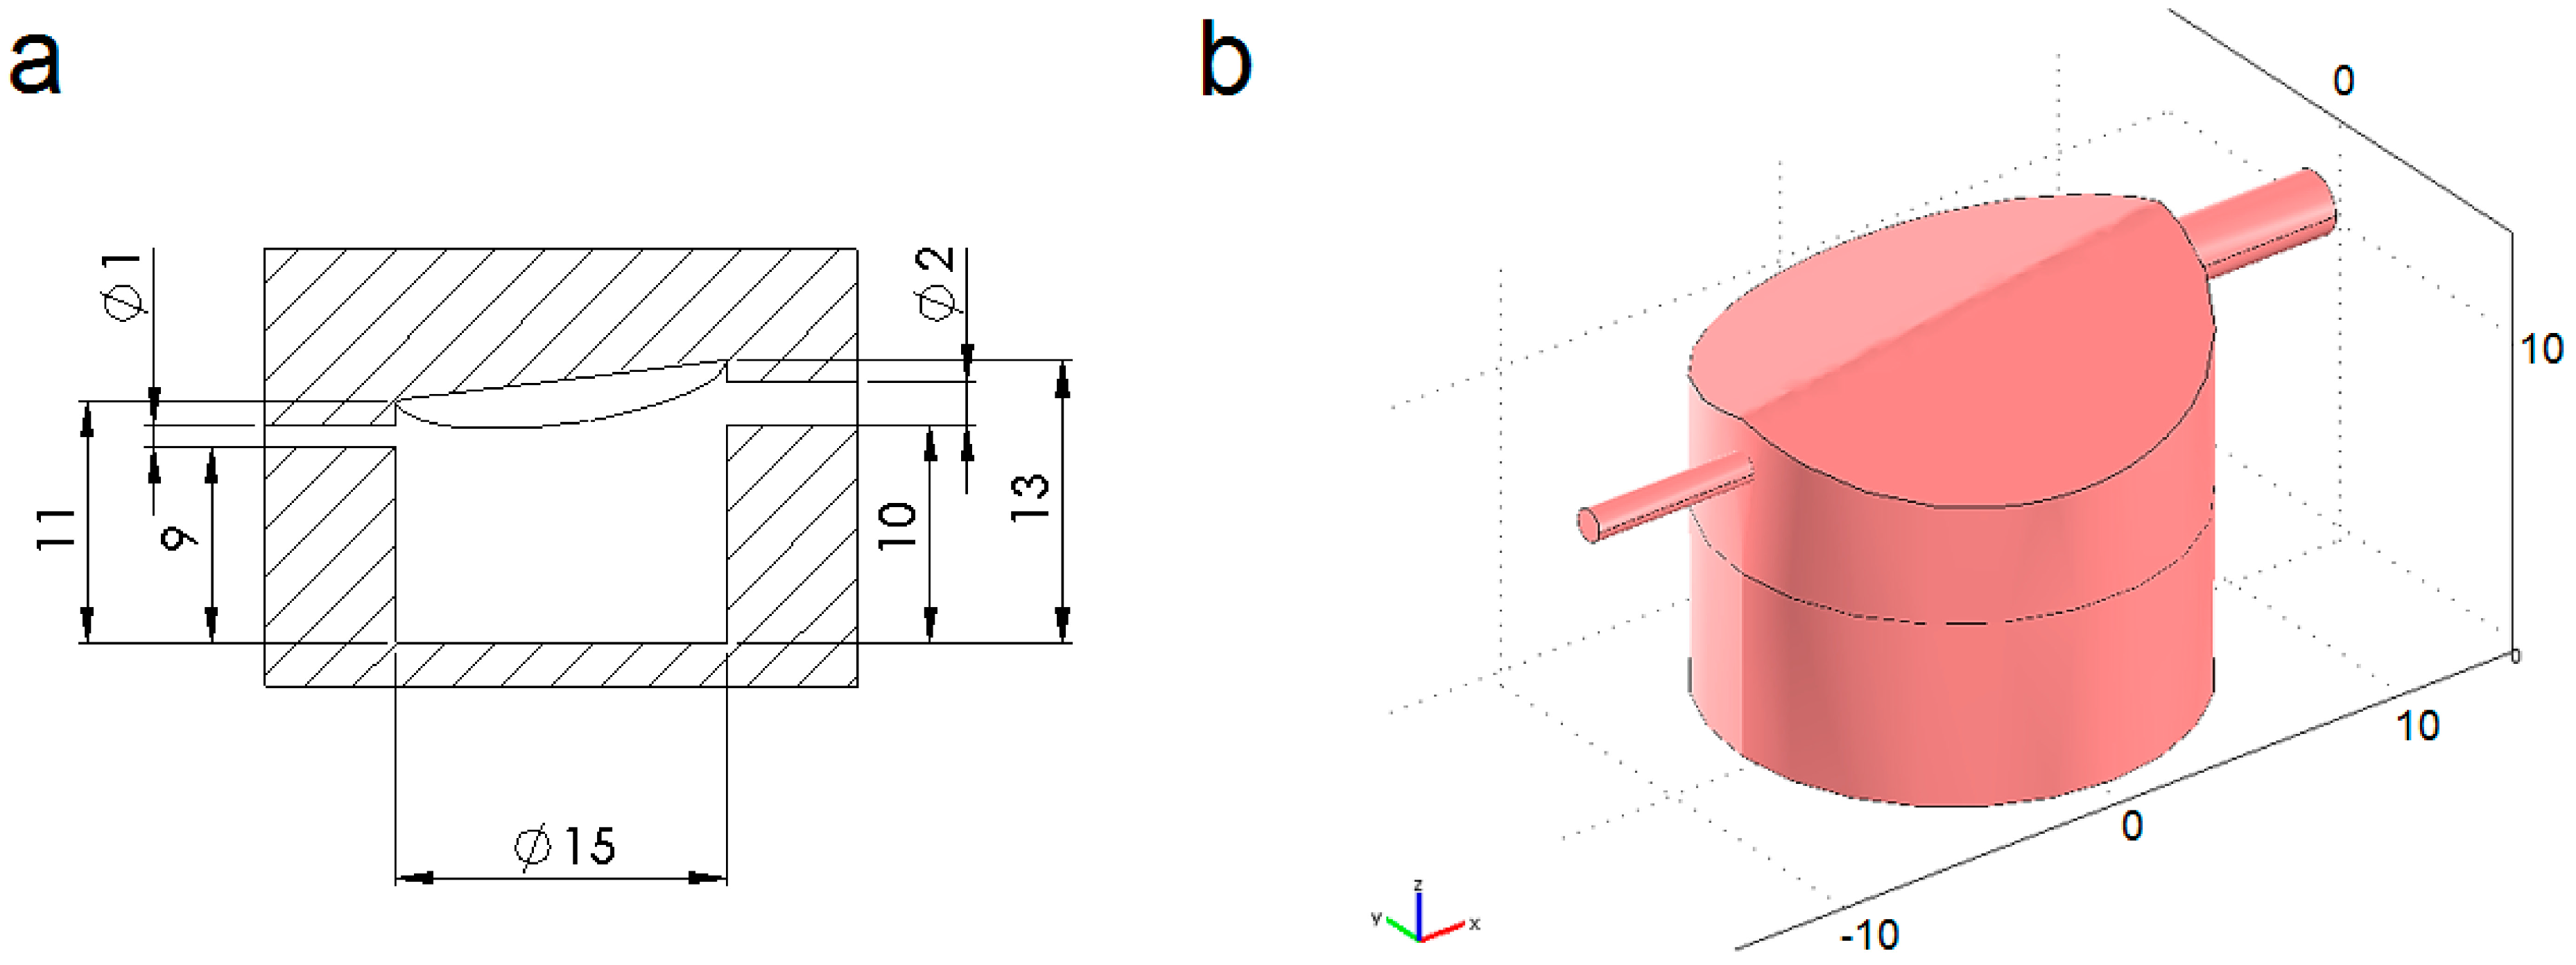
4.1. Modelled Configurations

In this review, a hepatocyte-laden hydrogel was modelled in order to investigate the effect of the characteristic dimensions of the channel and scaffold on resultant oxygen delivery and flow-induced shear stress. Three different cases were analysed: first to compare the performance of micro- and milli-fluidic systems, a parallelepiped fluidic channel above a physiologically relevant construct was designed at both scales using CFD. According to previous considerations (Section 2), the smallest physiologically relevant in vitro model is a 0.2 × 20 × 0.2 mm3 parallelepiped containing 7 × 10⁷ cells/mL (i.e., 10 functional units in terms of cell number and 1/10 of native cell density). Thus, in both systems the bottom area of the fluid channel was considered equal to the cell construct surface (i.e., 0.2 × 20 mm2), while its thickness (h) was taken as 0.2 mm or 2 mm, respectively for the micro- and milli-scaled fluidic channels (Figure 3) [30,42,43].
Second, as a case study we considered a real bioreactor, the Multi-Compartmental modular Bioreactor (MCmB, Figure 4). This milli-scaled system maintains the same protocols used in traditional static multiwells as it has shape and dimensions similar to those of a 24-multiwell plate (i.e., 15 mm diameter, 2 mL volume). The MCmB draws on the winning features of micro-fluidic devices which are the use of PDMS for its self-sealing properties and molding-based fabrication (milli-molding). It was specifically designed to minimise the fluid shear stress on the cell culture surface while maintaining high flow rates, in order to maximise the mass transport between cells and culture media. A patented sloping roof [44] ensures the absence of air bubbles, which are collected and conveyed to the outlet.
Figure 3. Schematic of the modelled systems. The channel height (h) is 0.2 mm or 2 mm, respectively, for the micro- or the milli-fluidic system.
Processes 02 00548 g003
Figure 4. (a) Cross-section and (b) 3D view of the MCmB culture chamber. All dimensions are in mm.
Processes 02 00548 g004
It is worth noting that several modular chambers can be combined in different configurations for recreating physiologically relevant multi-organ in vitro models. In this way, metabolites are exchanged between different compartments through the flow of medium, much as occurs in the bloodstream. A 0.2 mm thick hepatocyte-laden gel located at base of the MCmB culture chamber was modelled to assess whether the oxygen delivery and the flow-induced shear stress within this milli-scaled system are acceptable for culturing hepatocytes encapsulated in a truly milli-scaled construct.

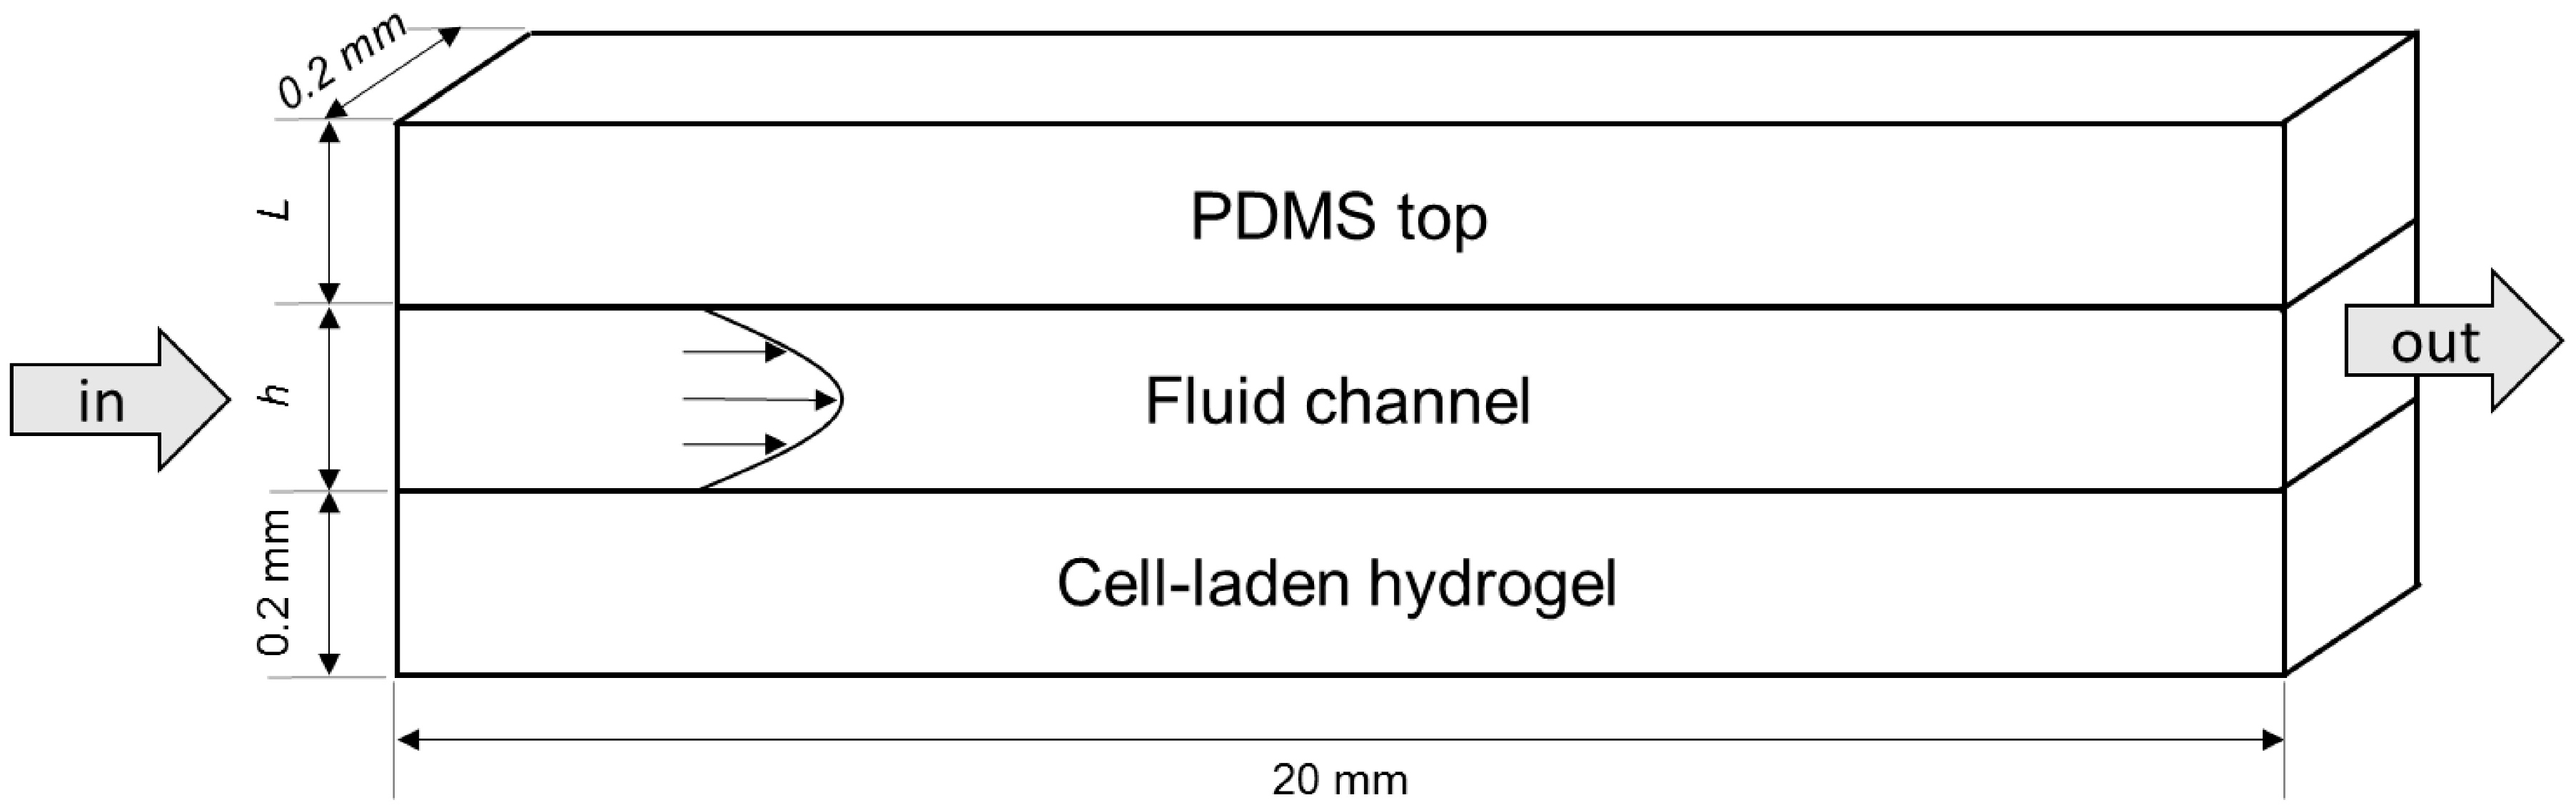
4.2. Computational Mass Transport and Flow Model

A steady-state multi-physics model which couples oxygen mass transport and consumption to fluid dynamics was developed and numerically solved using COMSOL Multiphysics (version 3.5a COMSOL AB, Stockholm, Sweden, 2009) to obtain the oxygen concentration and flow profile in the three systems investigated. In particular, the volume of each system was divided in two sub-domains: (I) a fluid domain, in which no oxygen consumption occurs and where fluid dynamics as well as oxygen convective transport (i.e., diffusion + advection) were solved; and (II) a hydrogel construct domain which was treated as a solid region where only oxygen diffusion and consumption was solved, in agreement with [45,46]. Figure 5 shows the two sub-domains for the MCmB bioreactor.
Figure 5. MCmB culture chamber: (a) the fluid domain and (b) hydrogel construct domain are shaded. All dimensions are in mm.
Processes 02 00548 g005

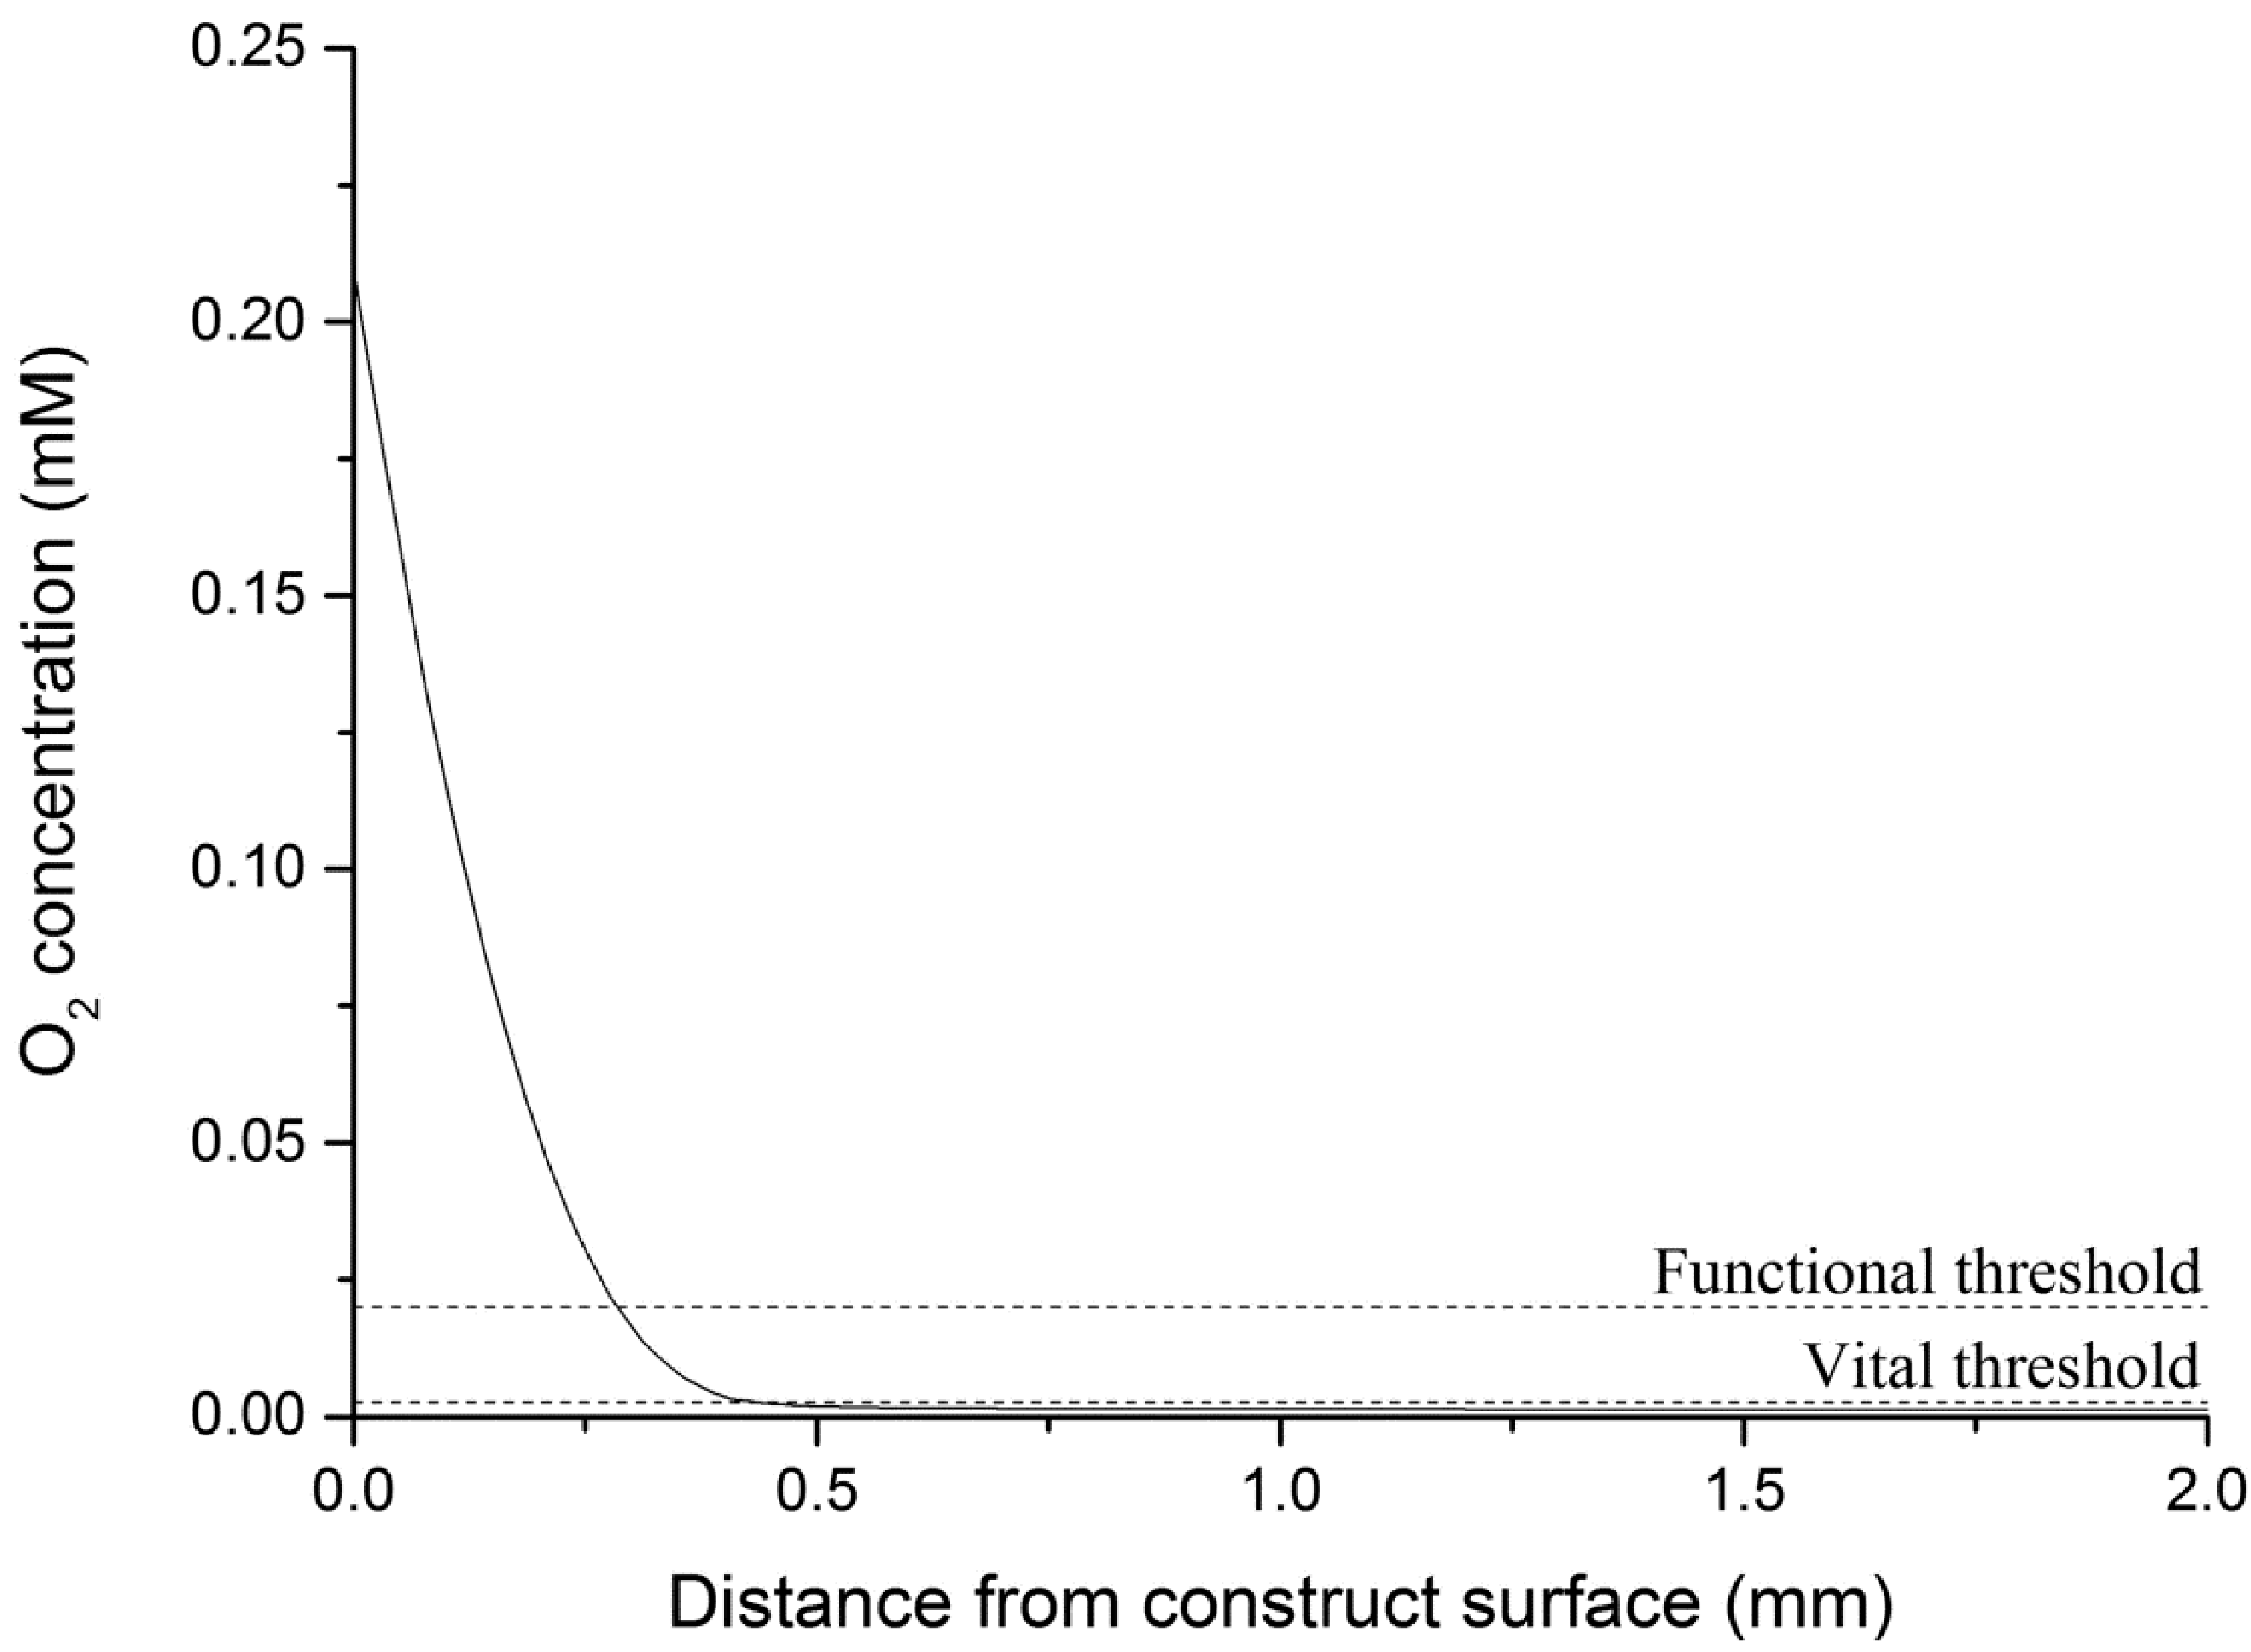
4.2.1. Oxygen Transport and Consumption

Steady-state oxygen transport was assumed to be governed by the generic advection and diffusion equation in its non-conservative formulation (i.e., that for an incompressible fluid) [47]:
· ( D c ) = R u · c
where c represents the concentration (mol∙m−3) and D the diffusion coefficient (m2∙s−1) of the species of interest (here, oxygen), R is the reaction rate (mol∙m−3∙s−1), µ the velocity field (m∙s−1) and the standard del (or nabla) operator, defined as i x + j y + k z . Oxygen consumption within the cell construct was modelled using a Michaelis-Menten type kinetics (R < 0), according to the following expression:
R = V m a x · c K m + c · δ ( c > c c r )
where Vmax is the maximum volumetric oxygen consumption rate (mol∙m−3∙s−1), Km is the Michaelis-Menten constant corresponding to the oxygen concentration at which consumption drops to half of its maximum, ccr is the critical oxygen concentration below which necrosis is assumed to occur and δ is a step-down function to account for the zero oxygen consumption where the oxygen concentration falls below the critical value (i.e., c < ccr). The COMSOL smoothed Heaviside function with a continuous first derivative and without overshoot (i.e., flc1hs, [47]) was used as step-down function, obtaining δ(c) = flc1hs(cccr/2). Oxygen concentration in aqueous media can be calculated through Henry’s law as c O 2 = p O 2 / K H , O 2 , where p O 2 represents the oxygen partial pressure and K H , O 2 is the Henry’s constant for oxygen [48]. Assuming that culture medium entering the system is equilibrated with atmospheric oxygen, the oxygen concentration at the fluid domain inlet ( c O 2 , i n ) can be calculated considering the Henry’s constant at 37 °C (Table 3). No unique value for the maximum oxygen consumption rate per hepatocyte (Ω) is reported in the literature, however the consensus is that hepatocyte Ω measured for monolayer (or 2D) cultures is an order of magnitude greater than that measured for 3D cultures [11]. A second observation is that the maximum oxygen consumption rate for hepatocytes appears to be related to cell density, with Ω decreasing with increasing cell density: denser and 3D cell cultures better approximate the physiological density found in the liver, so cells are less metabolically stressed [11]. In view of these considerations, the value of maximum oxygen consumption rate per cell reported by Nyberg et al. [49] for primary rat hepatocytes encapsulated in 3D gels at 107 cells/mL was used in the model, setting Vmax = Ω × cell density in Equation (2). The oxygen diffusion coefficient in the hydrogel construct was conservatively approximated from values reported in the literature for gels commonly used for cell-encapsulation. Model parameters for oxygen transport and consumption are summarised in Table 3.
Table 3. Model parameters for oxygen transport and consumption at 37 °C.
ParameterSymbolValueUnitsReferences
Henry’s constant for oxygen K H , O 2 1.32 × 10⁻³mol∙m−3∙mmHg−1[50]
Oxygen partial pressure in atmosphere p O 2 159mmHg[51]
Oxygen concentration in culture medium entering the system c O 2 , i n 0.21mol/m3[31,32,52,53]
Oxygen diffusion in aqueous media D O 2 , a q 3 × 10⁻⁹m2/s[31,52,54]
Oxygen diffusion in the hydrogel construct D O 2 , g e l 1 × 10⁻⁹m2/s[52,54,55,56,57,58]
Hepatocyte maximum oxygen consumption rateΩ4.8 × 10⁻¹⁷mol∙cell−1∙s−1[49]
Michaelis-Menten constant for oxygen consumptionKm7.39 × 10−3mol/m3[45,59,60]
Critical oxygen concentration to account for cell necrosisccr2.64 × 10−3mol/m3[61]

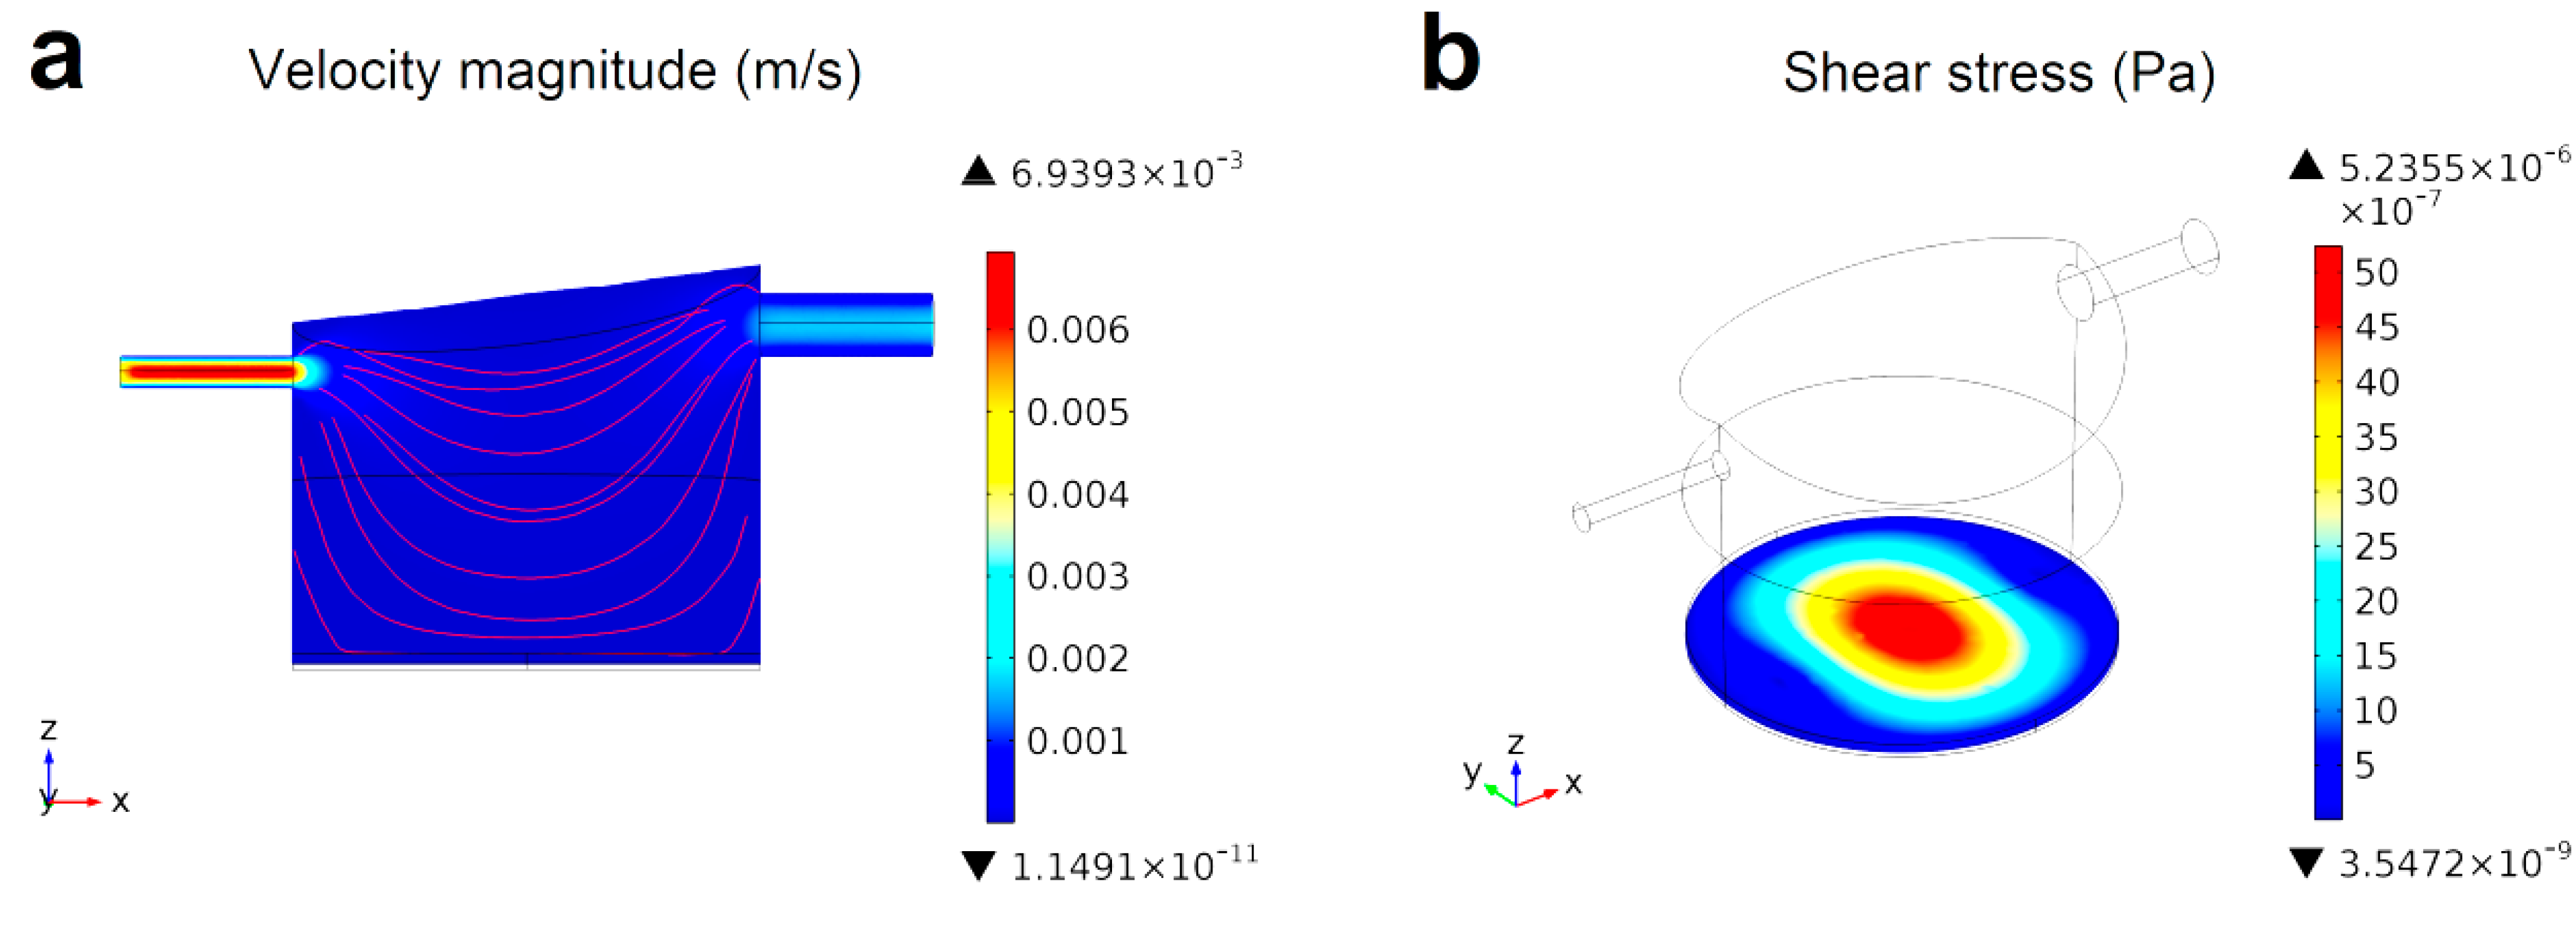
4.2.2. Fluid Dynamics

The velocity field (µ) resulting from convection was solved using the incompressible Navier-Stokes equations for a Newtonian fluid:
η 2 u + ρ ( u · ) u + p   = F
· u = 0
where ρ denotes density (kg∙m−3), η dynamic viscosity (kg∙m−1∙s−1 = Pa∙s), p pressure (Pa) and F a volume force field such as gravity (N∙m−3). Equation (3) represents the momentum balance, while Equation (4) is the continuity equation for incompressible fluids. The shear stress on the surface of the hydrogel construct depends linearly on the density and the viscosity of the culture medium used. Here, the culture medium was considered an essentially aqueous media at body temperature characterised by the following constants: T = 310.15 K, ρ = 993 kg/m3, η = 0.7 × 10⁻³ Pa∙s [31,45,52].

4.2.3. Model Implementation

The model was solved using the UMFPACK direct solver. The computational grid (or mesh) was generated using the COMSOL predefined “Fine” mesh size for meshing the 3D geometries. The boundary conditions used for the oxygen convection and diffusion (i.e., oxygen transport and reaction) and for the Navier-Stokes (i.e., fluid dynamics) models are summarised in Table 4. In particular, the initial oxygen concentration in both fluid and hydrogel construct sub-domains was equal to c O 2 , i n (i.e., 0.21 mol/m3).
First, an ideal case where the construct surface is in equilibrium with the maximum available oxygen concentration (i.e., c O 2 , i n ) was modelled considering a 0.2 × 20 × 2 mm3 parallelepiped hepatocyte-laden gel containing 7 × 10⁷ cell/mL, to investigate the theoretical maximum thickness for obtaining functional constructs in terms of oxygen supply. It is worth noting that this case is not implementable in real fluidic systems, since it requires very high medium flow rates to guarantee Peclet (Pe) numbers much greater than 1, with subsequent detrimental effects on cell viability and function due to high flow-induced shear stresses.
For the two simple parallelepiped configurations, the medium inflow velocity (vin) was calculated using the following expression:
v i n = τ w · h 6 η
where h is the fluid channel height (i.e., 0.2 or 2 mm) and η is the medium dynamic viscosity. Equation (5) is valid for laminar, steady, uniform flow between two fixed infinite horizontal parallel plates. Considering a hepatocyte-compatible wall shear stress of τw = 15 μPa on the surface of the hydrogel construct, the vin was fixed at 7.1 × 10⁻⁷ m/s and 7.1 × 10⁻⁶ m/s, respectively, for the micro- and the milli-fluidic systems. These velocities are consistent with those typically reported for micro-fluidic cell culture devices [42].
For the MCmB model, the vin was set to 3.82 × 10⁻³ m/s (corresponding to 180 μL/min inflow), on the basis of previous experiments with this bioreactor [31,62,63,64,65,66].
Table 4. Boundary conditions used for the oxygen convection and diffusion and for the Navier-Stokes models.
ModelSurfaceBoundary Condition
Oxygen convection and diffusionSystem side wallsInsulation/symmetry (n · (−Dc + cu) = 0)
Interface between the hydrogel construct and the fluid sub-domainContinuity
Fluid domain inletConstant oxygen concentration (c = 0.21 mol/m3)
Fluid domain outletConvective flux (n · (−Dc) = 0)
Navier-StokesSolid-liquid interfacesNo slip (µ = 0)
Fluid domain inletNormal inflow velocity (vin)
Fluid domain outletPressure, no viscous stress (p0 = 0)

4.3. CFD Model Refinement: Oxygen Diffusion through PDMS Walls

Most microfluidic devices reported in literature are made of PDMS, a gas permeable elastomer [30,67,68,69]. Therefore, the computational model presented in Section 4.2 can be refined by considering the inward oxygen flux through PDMS, which is given by the following expression [67,70]:
N O 2 , P D M S = K O 2 ( p O 2 c O 2 K H , O 2 )
Here, p O 2 is the ambient oxygen partial pressure, K H , O 2 is Henry’s constant for oxygen at 37 °C, c O 2 is the oxygen concentration in the bioreactor culture chamber at the liquid-PDMS interface, K O 2 is the global mass transfer coefficient, defined as K O 2 = P m / L , where Pm is the oxygen permeability in PDMS (Pm = 3.786 × 10⁻¹¹ mol∙m∙m−2∙s−1∙mmHg, [67,70,71]) and L is the PDMS thickness. For the two simple parallelepiped systems, a 5 mm thick gas permeable PDMS top was considered in the model (Figure 6), a typical value for several devices reported in the literature [43,67], whereas L = 6 m was used for the MCmB culture chamber, representing the overall radial thickness of its PDMS elements [31]. The same value was used to represent the axial thickness of the sloped PDMS MCmB top.
Figure 6. Schematic of the modelled micro- and milli-fluidic systems with a PDMS top.
Processes 02 00548 g006
To incorporate the inward oxygen flux through PDMS side walls, the insulation/symmetry boundary condition previously adopted in the oxygen transport and consumption model (Section 4.2) was substituted with the flux boundary condition for all culture chamber side walls in contact with PDMS, imposing the oxygen flux of Equation (6). Other parameters remained the same as described in Section 4.2.

4.4. Results and Discussion

4.4.1. Theoretical Maximum Thickness for Functional Physiologically Relevant Hepatocyte Constructs

The oxygen concentration profile in the ideal case of a construct surface in equilibrium with c O 2 , i n and with Pe >> 1 varies only along the vertical axis, as expected. The Michaelis-Menten consumption rate ensures that at very low oxygen concentrations, where cells barely survive, the oxygen consumption decreases with the available oxygen concentration ( c O 2 ) . Moreover, the step-down function δ incorporated in the model accounts for hepatic cell necrosis in chronically hypoxic regions and eliminates the oxygen consumption when c O 2 fells below the critical oxygen concentration (ccr= 2.64 × 10⁻³ mol/m3). The oxygen concentration profile along a vertical line section of the hepatocyte-laden construct is shown in Figure 7. Assuming that hepatocytes are vital if steady-state oxygen concentration ( c O 2 ) is above 2.64 × 10⁻³ mol/m3 [61] and functional only if c O 2 > 2 × 10⁻² mol/m3 [37], the theoretical maximum thickness for functional physiologically relevant hepatocyte constructs was found to be about 290 μm. The threshold for vitality is about 450 μm.
Figure 7. Oxygen concentration profile along a vertical section of a thick construct with a constant oxygen concentration of 0.21 mM at the surface.
Processes 02 00548 g007

4.4.2. Fluid Dynamics in Micro- and Milli-Fluidic Systems

As expected, both micro- and milli-fluidic parallelepiped systems exhibit the typical laminar flow profile for Newtonian fluids in rectangular ducts [72]. Consequently, flow-induced shear stress on the hydrogel surface is constant along the axis of flow. However, due to the finite width of the channel, the shear stress is not constant on the hydrogel surface, but changes perpendicularly to the axis of flow with a maximum at the centre and a minimum at the lateral walls. The average shear stress on the hydrogel surface was 15.5 and 67.6 μPa, respectively, for the micro- and the milli-fluidic parallelepiped systems. Notably, results are consistent with theoretical calculations of medium inflow velocity (Section 4.2.3) only for the micro-fluidic system, where the channel width is equal to the channel height. The shear stress on the hydrogel surface for milli-fluidic system was found to be slightly higher than the expected value, due to the presence of the fluid channel lateral walls (channel width = 1/10 of channel height), which are not considered in the simple model of Equation (5). However, since wall shear stress is directly related to the flow velocity, vin was rescaled to obtain an acceptable wall shear stress for hepatocytes (15 μPa) as shown in Equation (7).
v i n = 15 67.6 × 7.1 × 10 6 = 1.6 × 10 6   m / s
The computational model was solved again with the new value of vin. Figure 8 shows the velocity field and resulting shear stress on the hydrogel surface in the MCmB at 180 μL/min inflow. Thanks to the peculiar geometry of the chamber, with inlet and outlet tubes positioned slightly above the cultured construct, the velocity field at the hydrogel surface is lower and has a more uniform profile than that at the top of the chamber. Moreover, streamlines are parallel to the hydrogel surface, indicating that flow has a low impact angle, resulting in low levels of direct stress.
Shear stress on the hydrogel surface increases along the axis of flow, reaching its maximum value near the centre of the culture chamber, then decreases again near the outlet region. The shear stress was found to be 5.2 μPa, an acceptable value for hepatocytes.
Figure 8. Fluid dynamics in the MCmB culture chamber at 180 μL/min inflow considering a 0.2 mm thick hydrogel construct located at its bottom: (a) Velocity field at the central vertical section of the culture chamber passing through the middle of the inlet and outlet tubes. Flow streamlines (in red) are parallel to the hydrogel surface; (b) Flow-induced shear stress on the hydrogel surface.
Processes 02 00548 g008

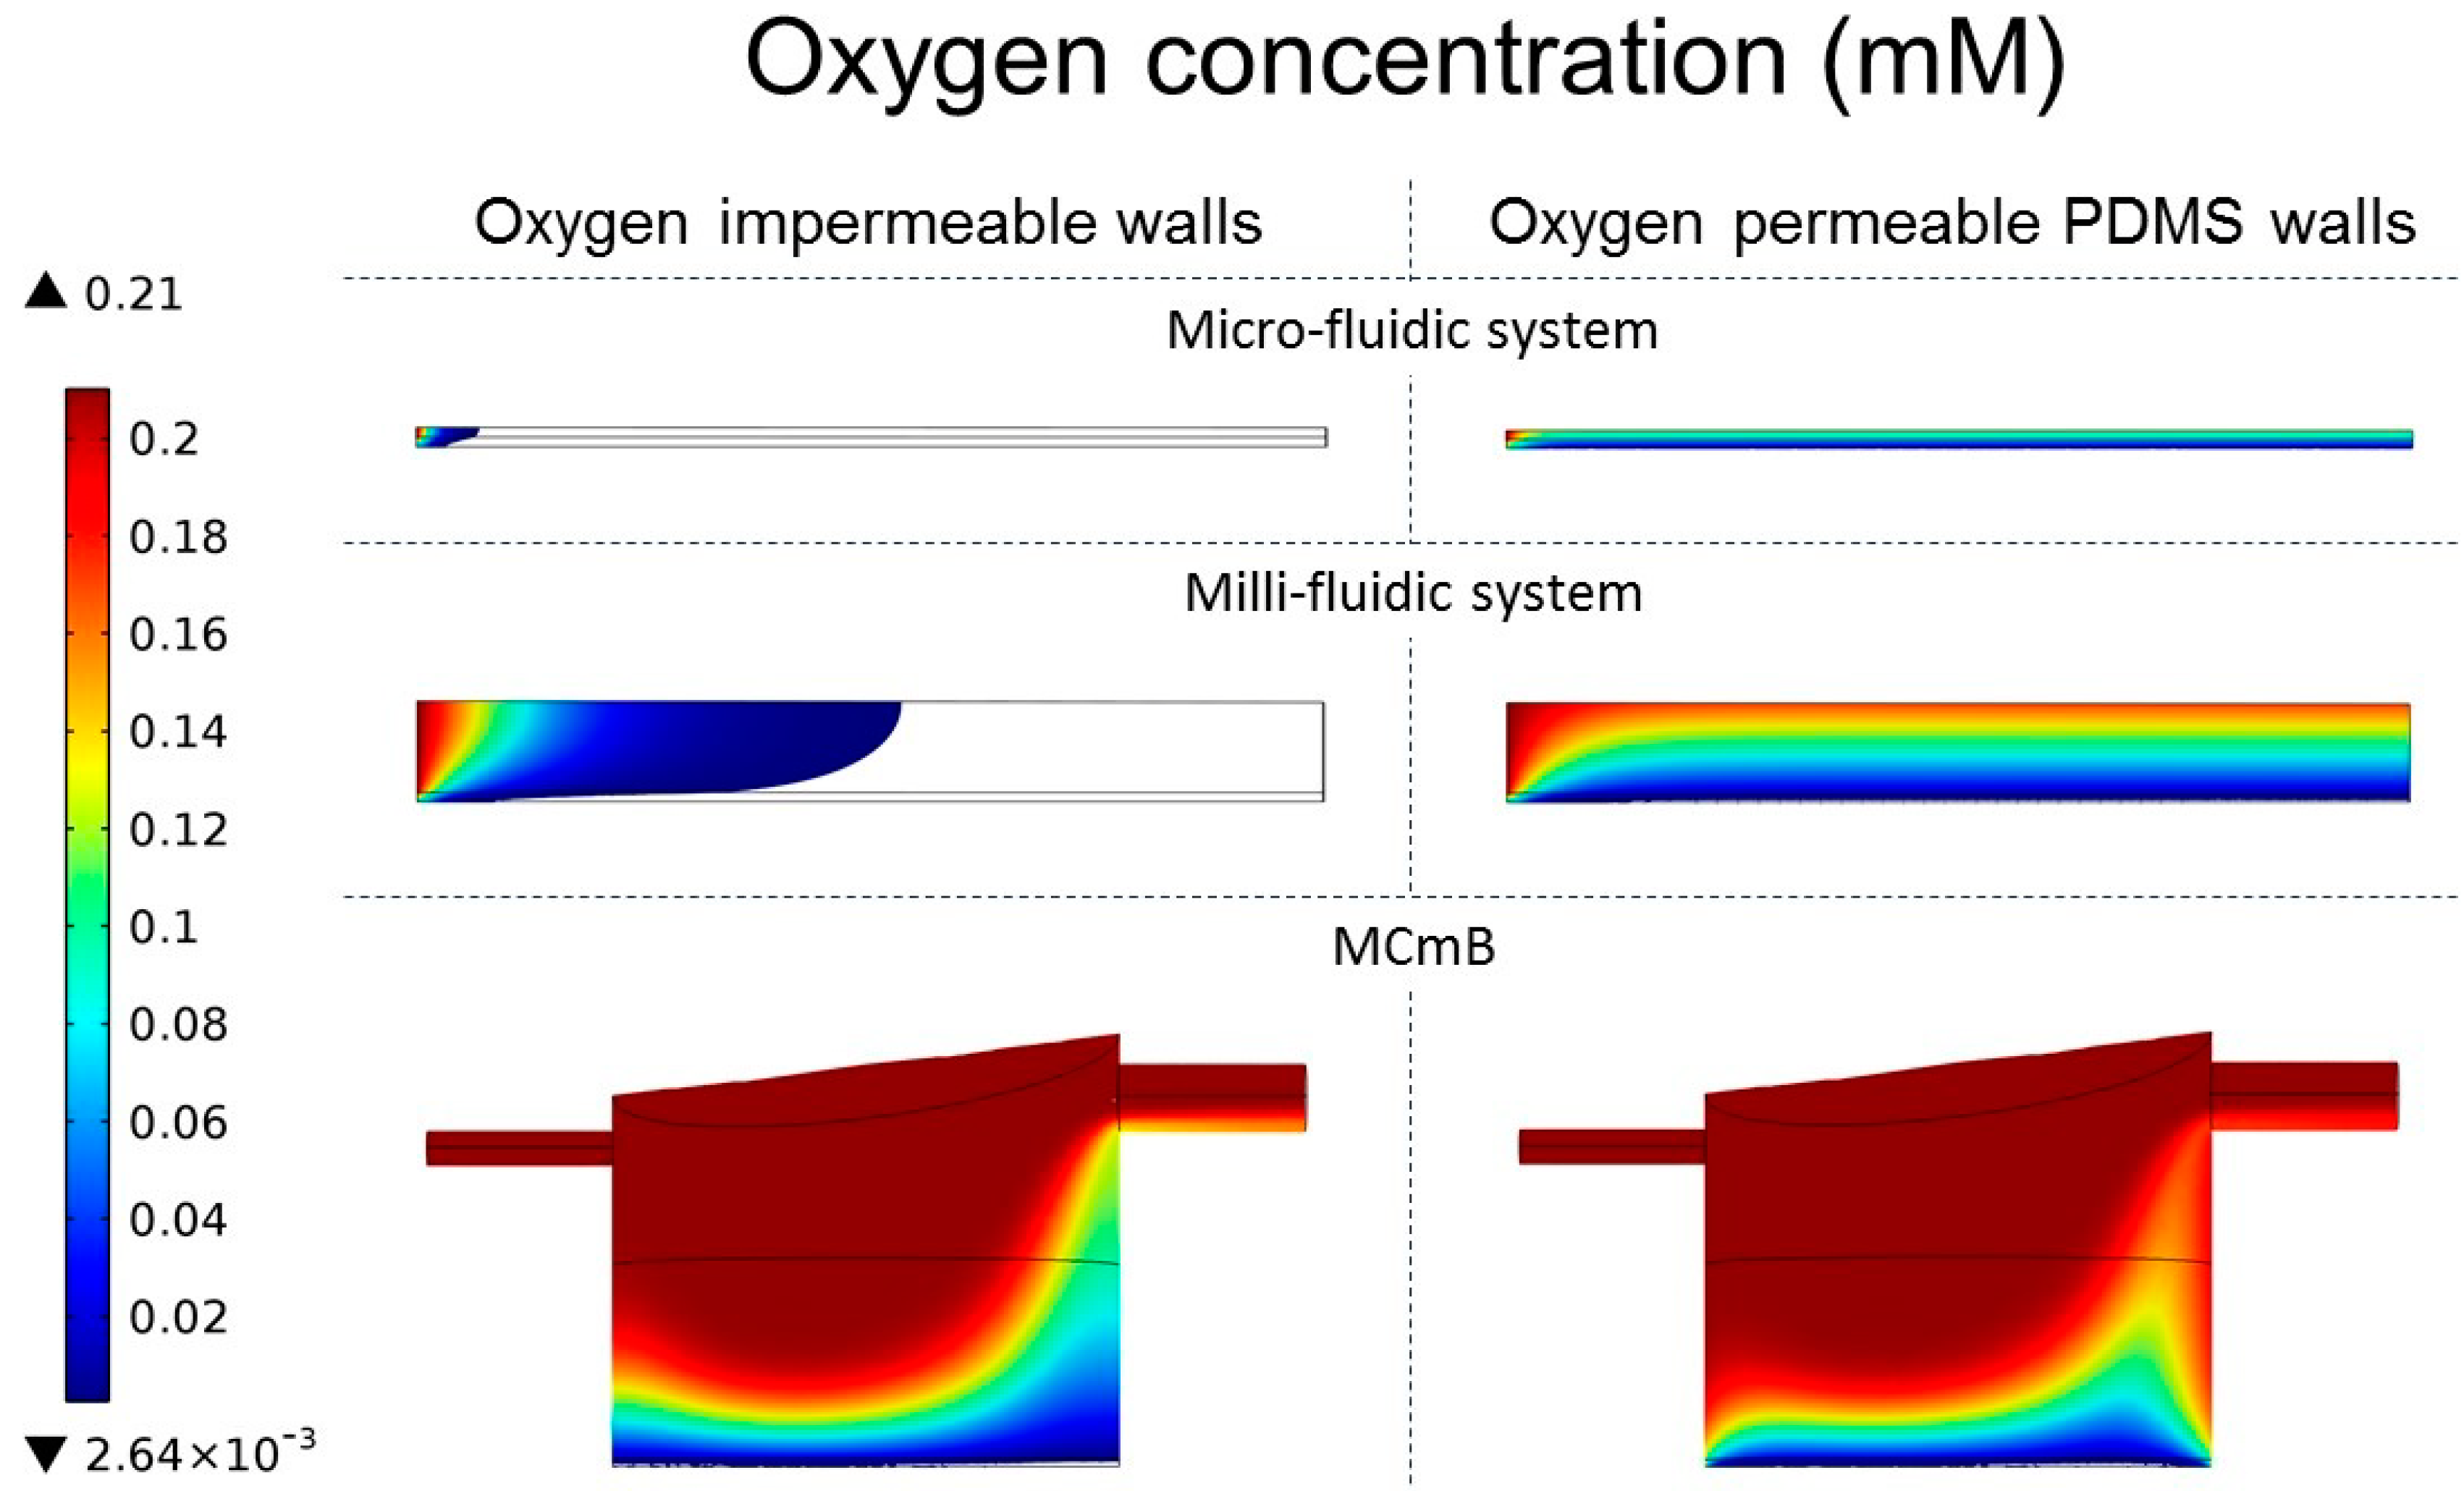
4.4.3. Oxygen Concentration Profiles in Micro- and Milli-Fluidic Systems

Oxygen concentration profiles obtained for the three systems modelled considering either oxygen impermeable or oxygen permeable PDMS walls are presented in Figure 9. Constructs in micro- and milli-fluidic parallelepiped systems with oxygen impermeable walls exhibit large necrotic areas (represented in white in Figure 9). This is because the very low medium flow rates adopted to obtain acceptable shear stress for hepatocytes result in an insufficient convective oxygen supply. However, in the MCmB (i.e., milli-scaled construct in a milli-fluidic system) the necrotic areas were significantly lower than in the other modelled systems. The smart bioreactor design allows for sufficient oxygen delivery with an acceptable level of flow-induced shear stresses on the construct surface independent of the material used to manufacture the device.
The percentage of viable encapsulated cells can be estimated by quantifying the portion of hydrogel volume where oxygen concentration is above the critical threshold of 2.64 × 10⁻³ mol/m3. The results are reported in Table 5 as percentages with respect to the total volume of the construct.
Table 5. Estimated percentage of viable encapsulated hepatocytes for each investigated configuration considering either oxygen impermeable walls (OIW) or oxygen permeable walls (OPW).
Modelled SystemMicro-FluidicMilli-FluidicMCmB
OIWOPWOIWOPWOIWOPW
Viable cells (%)2.610017.87860.585.4
Figure 9. Oxygen concentration profiles in the three modelled systems. Hypoxic regions where c O 2 < ccr are represented in white.
Processes 02 00548 g009
Oxygen diffusion through PDMS walls significantly enhances the viability of encapsulated hepatocytes, especially in the micro-fluidic system, where the percentage of viable cells increased from 2.6% to 100%. Micro-fluidic cell culture devices rely entirely on oxygen diffusion through the walls of the device, and cannot be manufactured from materials which are impermeable to oxygen, such as tissue culture plastic or glass.
Very simple calculations for glucose consumption can also be made by comparing the maximum glucose consumption rate of the hepatocyte laden construct, (Rcons = glucose consumption rate × cell number) and the rate of glucose supplied to the cells by the fluid (Rin = glucose concentration × medium flow rate). If the ratio Rin/Rcons < 1 then the cells may experience hypoglycaemia.
Considering an inflow of 5 mM glucose, typical of cell culture media, and a consumption rate of 8 × 10⁻¹⁸ mol/cell/s as reported by Nyberg et al. [49], the ratio of glucose supplied with respect to that consumed varies significantly in micro- and milli-fluidic systems as reported in Table 6. These calculations suggest that micro-fluidic systems may suffer from depletion of nutrients other than oxygen if cell densities are increased to better approximate physiological values. On the other hand, milli-fluidic systems have a sufficient mass flow rate to ensure an acceptable Rin/Rcons ratio.
Table 6. Glucose supply and consumption for the three configurations investigated.
ConfigurationFlow Rate (m3/s)Rin (mol/s)Cell NumberRcons (mol/s)Rin/Rcons
Micro-fluidic2.84 × 10−141.42 × 10−135.60 × 1044.48 × 10−130.3
Milli-fluidic6.40 × 10−133.20 × 10−125.60 × 1044.48 × 10−137.1
MCmB3.00 × 10−91.50 × 10−82.47 × 1061.98 × 10−11758.3

5. The Allometric Approach

There is clearly a network of signalling between different tissues, which contributes to maintaining homeostasis in the human body. Recapitulating systemic pathophysiology or toxicity in vitro is a challenging task and requires a methodical engineering approach. First, the body is broken down into compartments connected by the vascular circuitry and then the most important features of the network are reconstructed in vitro by connecting together different physiologically relevant tissue or organ domains. In the previous sections, we showed how physiologically relevant cell numbers and cell densities in 3D frameworks in milli-fluidic devices can offer the structural and flux stimuli shown in Figure 2. This last section is devoted to the design of higher order in vitro models using allometric scaling and an “integrative physiology” approach, which enables the incorporation of biochemical stimuli originating from distant cells and tissues. In this manner, the third set of stimuli can be supplied to an in vitro system in much the same way as in the human body.
Allometry deals with changes in body size and relationships amongst different parameters and processes in all organisms as a function of body mass M [73]. The basic allometric equation (Equation (8)) can be used to correlate physiological variables between organisms of different sizes.
Y = a Mb
In Equation (8), Y is a physiological parameter such as basal metabolic rate (BMR), heart rate, life span etc., a is a proportionality factor, whereas b is the allometric exponent. The exponent b varies in magnitude and sign and has a specific value for each parameter according to how it scales with mass. Typically, b = 1 for volumes and cell numbers and lies between 0 and 1 for rates (metabolic rates, flow rates, etc.) while it is negative for frequencies (cardiac frequencies, respiratory frequencies, etc.). In this paper, we have focused on the use of physiologically meaningful cell functional units and densities; similarly, a simple allometric model based on cell numbers can be used to design higher order in vitro models. For example, a liver/adipocyte system for the study of lipid metabolism could be constructed by scaling the number of liver cells and adipocytes cells in the body. Since b1, the scaling is proportional, so the same ratios are maintained when downsizing to an in vitro device [74,75].
Liver mass is approximately 2% of the human body mass, while fat is about 12%. Thus, the ratio of hepatic tissue to adipose tissue is 1:6. In order to maintain this relationship in an in vitro experiment, the number of adipocytes has to be about six times that of hepatocytes (the latter represent a significant proportion of liver mass) [76]. In practice, this requires the use of at least 56,000 hepatocytes in a 3D configuration [63] and about 336,000 adipocytes. This ratio can be used as a guideline in order to set up an in vitro experiment using one bioreactor as a hepatic module and one (or more) as an adipose tissue module, both characterised by suitable cell numbers. The MCmB’s modular design is particularly suited for the implementation of multi-organ in vitro models. Other allometric rules may be used according to the study design and parameters of interest as described in several of our publications [62,66,77,78,79].

6. Conclusions

A common request in experimental cell biology and tissue engineering concerns the methods and strategies for implementing physiologically relevant in vitro models in order to better mimic tissue or organ responses. The questions are mainly related to the cell numbers and culture method to be used, the conditions that should be applied on 3D constructs for maintaining high cell viability and functionality, and the tools that are available for creating such in vitro models. In this paper, we provide a series of systematic rules in order to properly scale a living system, on the basis of our experience and following an engineering approach. The reader is guided through the steps of in vitro design, first by deconstructing the physiological environment and then reconstructing its more engineerable features such as the 3D architecture, flow and shear stress. We also show how fluidic bioreactors can be used to design meaningful in vitro organ models using allometric scaling.
Starting from the definition of the minimum conditions required for creating a physiologically relevant micro-scaled tissue, in terms of cell number, density and size, we defined the minimum cell construct volume and density (a volume of 0.8 µL with at least 56,000 cells and a cell density of 7.1 × 10⁷ cells/mL). Then, we selected the simplest construct geometry to be used in computational models and evaluated the culture conditions required for maintaining high cell viability in the 3D constructs. Here, the trade-off is between the shear stress imposed in the fluidic system, which must be below 15–20 µP so as to not damage shear-sensitive hepatocytes and the oxygen concentration inside the constructs. In particular, we compared three different fluidic conditions applied to a 3D hepatocyte laden gel: two simple configurations with either micro- or milli-scaled parallelepiped fluidic channels and as a real case study, our MCmB bioreactor.
The computations show that cell viability in micro-fluidic systems is assured only in the presence of oxygen permeable walls. Moreover, in both the micro- and milli-channels, oxygen diffusion and turnover is limited by fluid velocity. On the other hand, the MCmB allows the application of higher flow rates with high oxygen delivery while maintaining acceptable values of shear stress on the upper cell surface. Simple considerations on mass conservation of glucose in the three systems show that micro-fluidic devices may risk nutrient depletion due to their low volumes and flow rates. After critically assessing fluidic devices, we show a simple example of how allometric scaling can be used to design systemic models combining two or more tissues in bioreactor modules.

Acknowledgments

The work leading to these results has received funding from the European Union Seventh Framework Programme (FP7/2007–2013) under grant agreement 304961 (ReLiver).

Author Contributions

Giorgio Mattei implemented the FEM models and wrote the text; Serena Giusti wrote the text, performed the numerical calculations and designed the figures; Arti Ahluwalia wrote and conceived the text.

Conflicts of Interest

The authors declare no conflict of interest.

References

  1. Elliott, N.T.; Yuan, F. A review of three-dimensional in vitro tissue models for drug discovery and transport studies. J. Pharmcol. Sci. 2011, 100, 59–74. [Google Scholar] [CrossRef]
  2. Cimetta, E.; Godier-Furnémont, A.; Vunjak-Novakovic, G. Bioengineering heart tissue for in vitro testing. Curr. Opin. Biotechnol. 2013, 24, 926–932. [Google Scholar] [CrossRef] [PubMed]
  3. Rouwkema, J.; Gibbs, S.; Lutolf, M.P.; Martin, I.; Vunjak-Novakovic, G.; Malda, J. In vitro platforms for tissue engineering: Implications for basic research and clinical translation. J. Tissue Eng. Regen. Med. 2011, 5, e164–e167. [Google Scholar] [CrossRef] [PubMed]
  4. Astashkina, A.; Mann, B.; Grainger, D.W. A critical evaluation of in vitro cell culture models for high-throughput drug screening and toxicity. Pharmacol. Ther. 2012, 134, 82–106. [Google Scholar] [CrossRef] [PubMed]
  5. Nerem, R.M. Tissue engineering: The hope, the hype, and the future. Tissue Eng. 2006, 12, 1143–1150. [Google Scholar] [CrossRef] [PubMed]
  6. Shoji, Y.; Nakashima, H. Nutraceutics and delivery systems. J. Drug Target. 2004, 12, 385–391. [Google Scholar] [CrossRef] [PubMed]
  7. Seok, J.; Warren, H.S.; Cuenca, A.G.; Mindrinos, M.N.; Baker, H.V.; Xu, W.; Richards, D.R.; Gao, H.; Hennessy, L.; Finnerty, C.C.; et al. Genomic responses in mouse models poorly mimic human inflammatory diseases. Proc. Natl. Acad. Sci. USA 2013, 110, 3507–3512. [Google Scholar] [CrossRef] [PubMed]
  8. Bracken, M.B. Why animal studies are often poor predictors of human reactions to exposure. J. R. Soc. Med. 2009, 102, 120–122. [Google Scholar] [CrossRef] [PubMed]
  9. Alberts, B.; Johnson, A.; Lewis, J.; Raff, M.; Roberts, K.; Walte, P. Molecular Biology of the Cell, 4th ed.; Garland Science: New York, NY, USA, 2002. [Google Scholar]
  10. Di Nardo, P.; Minieri, M.; Ahluwalia, A. Engineering the Stem Cell Niche and the Differentiative Micro- and Macroenvironment: Technologies and Tools for Applying Biochemical, Physical and Structural Stimuli and Their Effects on Stem Cells. In Stem Cell Engineering; Springer: Heidelberg, Germany, 2011; pp. 41–59. [Google Scholar]
  11. Patzer, J.F. Oxygen consumption in a hollow fiber bioartificial liver. Artif. Organs 2004, 28, 83–98. [Google Scholar] [CrossRef] [PubMed]
  12. Schyschka, L.; Sánchez, J.J.M.; Wang, Z.; Burkhardt, B.; Müller-Vieira, U.; Zeilinger, K.; Bachmann, A.; Nadalin, S.; Damm, G.; Nussler, A.K.; et al. Hepatic 3D cultures but not 2D cultures preserve specific transporter activity for acetaminophen-induced hepatotoxicity. Arch. Toxicol. 2013, 87, 1581–1593. [Google Scholar] [CrossRef] [PubMed]
  13. Francioli, S.E.; Candrian, C.; Martin, K.; Heberer, M.; Martin, I.; Barbero, A. Effect of three-dimensional expansion and cell seeding density on the cartilage-forming capacity of human articular chondrocytes in type II collagen sponges. J. Biomed. Mater. Res. A 2010, 95, 924–931. [Google Scholar] [CrossRef] [PubMed]
  14. Iwasa, J.; Ochi, M.; Uchio, Y.; Katsube, K.; Adachi, N.; Kawasaki, K. Effects of cell density on proliferation and matrix synthesis of chondrocytes embedded in atelocollagen gel. Artif. Organs 2003, 27, 249–255. [Google Scholar] [CrossRef] [PubMed]
  15. Loeve, S. About a Definition of Nano: How to Articulate Nano and Technology? Int. J. Philos. Chem. 2010, 6, 3–18. [Google Scholar]
  16. Lee, M.Y.; Kumar, R.A.; Sukumaran, S.M.; Hogg, M.G.; Clark, D.S.; Dordick, J.S. Three-dimensional cellular microarray for high-throughput toxicology assays. Proc. Natl. Acad. Sci. USA 2008, 105, 59–63. [Google Scholar] [CrossRef] [PubMed]
  17. Sung, J.H.; Shuler, M.L. In vitro microscale systems for systematic drug toxicity study. Bioprocess Biosyst. Eng. 2010, 33, 5–19. [Google Scholar] [CrossRef] [PubMed]
  18. Sung, J.H.; Esch, M.B.; Shuler, M.L. Integration of in silico and in vitro platforms for pharmacokinetic-pharmacodynamic modeling. Expert Opin. Drug Metab. Toxicol. 2010, 6, 1063–1081. [Google Scholar] [CrossRef] [PubMed]
  19. Wei, C.W.; Cheng, J.Y.; Young, T.H. Elucidating in vitro cell-cell interaction using a microfluidic coculture system. Biomed. Microdevices 2006, 8, 65–71. [Google Scholar] [CrossRef] [PubMed]
  20. Baudoin, R.; Corlu, A.; Griscom, L.; Legallais, C.; Leclerc, E. Trends in the development of microfluidic cell biochips for in vitro hepatotoxicity. Toxicol. In Vitro 2007, 21, 535–544. [Google Scholar] [CrossRef] [PubMed]
  21. Tingley, S. High-throughput cell culture: A real-world evaluation. Innov. Pharm. Technol. 2006, 54, 54–58. [Google Scholar]
  22. Tilles, A.W.; Baskaran, H.; Roy, P.; Yarmush, M.L.; Toner, M. Effects of oxygenation and flow on the viability and function of rat hepatocytes cocultured in a microchannel flat-plate bioreactor. Biotechnol. Bioeng. 2001, 73, 379–389. [Google Scholar] [CrossRef] [PubMed]
  23. Park, J.; Li, Y.; Berthiaume, F.; Toner, M.; Yarmush, M.L.; Tilles, A.W. Radial flow hepatocyte bioreactor using stacked microfabricated grooved substrates. Biotechnol. Bioeng. 2008, 99, 455–467. [Google Scholar] [CrossRef] [PubMed]
  24. McBeath, R.; Pirone, D.M.; Nelson, C.M.; Bhadriraju, K.; Chen, C.S. Cell shape, cytoskeletal tension, and RhoA regulate stem cell lineage commitment. Dev. Cell 2004, 6, 483–495. [Google Scholar] [CrossRef] [PubMed]
  25. Francis, K.; Palsson, B.O. Effective intercellular communication distances are determined by the relative time constants for cyto/chemokine secretion and diffusion. Proc. Natl. Acad. Sci. USA 1997, 94, 12258–12262. [Google Scholar] [CrossRef] [PubMed]
  26. Kilian, K.A.; Bugarija, B.; Lahn, B.T.; Mrksich, M. Geometric cues for directing the differentiation of mesenchymal stem cells. Proc. Natl. Acad. Sci. USA 2010, 107, 4872–4877. [Google Scholar] [CrossRef] [PubMed]
  27. Lundholt, B.K.; Scudder, K.M.; Pagliaro, L. A simple technique for reducing edge effect in cell-based assays. J. Biomol. Screening 2003, 8, 566–570. [Google Scholar] [CrossRef]
  28. Toepke, M.W.; Beebe, D.J. PDMS absorption of small molecules and consequences in microfluidic applications. Lab Chip 2006, 6, 1484–1486. [Google Scholar] [CrossRef] [PubMed]
  29. Regehr, K.J.; Domenech, M.; Koepsel, J.T.; Carver, K.C.; Ellison-Zelski, S.J.; Murphy, W.L.; Schuler, L.A.; Alarid, E.T.; Beebe, D.J. Biological implications of polydimethylsiloxane-based microfluidic cell culture. Lab Chip 2009, 9, 2132–2139. [Google Scholar] [CrossRef] [PubMed]
  30. Mehta, K.; Mehta, G.; Takayama, S.; Linderman, J. Quantitative Inference of Cellular Parameters From Microfluidic Cell Culture Systems. Biotechnol. Bioeng. 2009, 103, 966–974. [Google Scholar] [CrossRef] [PubMed]
  31. Mazzei, D.; Guzzardi, M.A.; Giusti, S.; Ahluwalia, A. A low shear stress modular bioreactor for connected cell culture under high flow rates. Biotechnol. Bioeng. 2010, 106, 127–137. [Google Scholar] [PubMed]
  32. Martin, Y.; Vermette, A. Bioreactors for tissue mass culture: Design, characterization, and recent advances. Biomaterials 2005, 26, 7481–7503. [Google Scholar] [CrossRef] [PubMed]
  33. Freshney, I.R. Culture of Animal Cells: A Manual of Basic Technique and Specialized Applications, 6th ed.; Wiley-Blackwell: Hoboken, NJ, USA, 2010. [Google Scholar]
  34. Coleman, W.B.; Presnell, S.C. Plasticity of the hepatocyte phenotype in vitro: Complex phenotypic transitions in proliferating hepatocyte cultures suggest bipotent differentiation capacity of mature hepatocytes. Hepatology 1996, 24, 1542–1546. [Google Scholar] [PubMed]
  35. Guillouzo, A. Liver cell models in in vitro toxicology. Environ. Health Perspect. 1998, 106, 511–532. [Google Scholar] [CrossRef] [PubMed]
  36. Nahmias, Y.; Berthiaume, F.; Yarmush, M.L. Integration of technologies for hepatic tissue engineering. Adv. Biochem. Eng. Biotechnol. 2007, 103, 309–329. [Google Scholar] [PubMed]
  37. Smith, M.K.; Mooney, D.J. Hypoxia leads to necrotic hepatocyte death. J. Biomed. Mater. Res. A 2007, 80, 520–529. [Google Scholar] [CrossRef] [PubMed]
  38. Tanaka, Y.; Yamato, M.; Okano, T.; Kitamori, T.; Sato, K. Evaluation of effects of shear stress on hepatocytes by a microchip-based system. Meas. Sci. Technol. 2006, 17, 3167–3170. [Google Scholar] [CrossRef]
  39. Nakatsuka, H.; Sokabe, T.; Yamamoto, K.; Sato, Y.; Hatakeyama, K.; Kamiya, A.; Ando, J. Shear stress induces hepatocyte PAI-1 gene expression through cooperative Sp1/Ets-1 activation of transcription. Am. J. Physiol. Gastrointest. Liver Physiol. 2006, 291, G26–G34. [Google Scholar] [CrossRef] [PubMed]
  40. Rutkowski, J.M.; Swartz, M.A. A driving force for change: Interstitial flow as a morphoregulator. Trends Cell Biol. 2007, 17, 44–50. [Google Scholar] [CrossRef] [PubMed]
  41. Swartz, M.A.; Fleury, M.E. Interstitial flow and its effects in soft tissues. Annu. Rev. Biomed. Eng. 2007, 9, 229–256. [Google Scholar] [CrossRef] [PubMed]
  42. Zahorodny-Burke, M.; Nearingburg, B.; Elias, A.L. Finite element analysis of oxygen transport in microfluidic cell culture devices with varying channel architectures, perfusion rates, and materials. Chem. Eng. Sci. 2011, 66, 6244–6253. [Google Scholar] [CrossRef]
  43. Kim, M.C.; Lam, R.H.W.; Thorsen, T.; Asada, H.H. Mathematical analysis of oxygen transfer through polydimethylsiloxane membrane between double layers of cell culture channel and gas chamber in microfluidic oxygenator. Microfluid. Nanofluidics 2013, 15, 285–296. [Google Scholar] [CrossRef]
  44. Ahluwalia, A.; Mazzei, D.; Vinci, B.; Vozzi, G. Improved Bioreactor Chamber. EP 2318510 A2, 11 May 2011. [Google Scholar]
  45. Tan, G.D.S.; Toh, G.W.; Birgersson, E.; Robens, J.; van Noort, D.; Leo, H.L. A thin-walled polydimethylsiloxane bioreactor for high-density hepatocyte sandwich culture. Biotechnol. Bioeng. 2013, 110, 1663–1673. [Google Scholar] [CrossRef] [PubMed]
  46. Buchwald, P. FEM-based oxygen consumption and cell viability models for avascular pancreatic islets. Theor. Biol. Med. Model. 2009, 6, 5. [Google Scholar] [CrossRef] [PubMed]
  47. Comsol, A. COMSOL Multiphysics Modeling Guide; Version 3.5a; COMSOL AB: Stockholm, Sweden, 2009. [Google Scholar]
  48. Silbey, R.J.; Alberty, R.A.; Bawendi, M.G. Physical Chemistry; John Wiley & Sons: Hoboken, NJ, USA, 2005. [Google Scholar]
  49. Nyberg, S.L.; Remmel, R.P.; Mann, H.J.; Peshwa, M.V.; Hu, W.S.; Cerra, F.B. Primary hepatocytes outperform Hep G2 cells as the source of biotransformation functions in a bioartificial liver. Ann. Surg. 1994, 220, 59–67. [Google Scholar] [PubMed]
  50. Kutty, M.N. Site Selection for Aquaculture: Chemical Features of Water; African Regional Aquaculture Centre: Port Harcourt, Nigeria, 1987. [Google Scholar]
  51. Frisancho, A.R. Functional adaptation to high altitude hypoxia. Science 1975, 187, 313–319. [Google Scholar] [CrossRef] [PubMed]
  52. Buchwald, P. A local glucose-and oxygen concentration-based insulin secretion model for pancreatic islets. Theor. Biol. Med. Model. 2011, 8, 20. [Google Scholar] [CrossRef] [PubMed]
  53. Oller, A.R.; Buser, C.W.; Tyo, M.A.; Thilly, W.G. Growth of mammalian cells at high oxygen concentrations. J. Cell Sci. 1989, 94, 43–49. [Google Scholar] [PubMed]
  54. Haselgrove, J.C.; Shapiro, I.M.; Silverton, S.F. Computer modeling of the oxygen supply and demand of cells of the avian growth cartilage. Am. J. Physiol. 1993, 265, C497–C506. [Google Scholar] [PubMed]
  55. Mehmetoglu, U.; Ates, S.; Berber, R. Oxygen diffusivity in calcium alginate gel beads containing Gluconobacter suboxydans. Artif. Cells Blood Substit. Immobil. Biotechnol. 1996, 24, 91–106. [Google Scholar] [CrossRef] [PubMed]
  56. Hulst, A.C.; Hens, H.J.H.; Buitelaar, R.M.; Tramper, J. Determination of the effective diffusion coefficient of oxygen in gel materials in relation to gel concentration. Biotechnol. Tech. 1989, 3, 199–204. [Google Scholar] [CrossRef]
  57. Ehsan, S.M.; George, S.C. Nonsteady state oxygen transport in engineered tissue: Implications for design. Tissue Eng. A 2013, 19, 1433–1442. [Google Scholar] [CrossRef]
  58. Van Stroe-Biezen, S.A.M.; Everaerts, F.M.; Janssen, L.J.J.; Tacken, R.A. Diffusion coefficients of oxygen, hydrogen peroxide and glucose in a hydrogel. Anal. Chim. Acta 1993, 273, 553–560. [Google Scholar] [CrossRef]
  59. Foy, B.D.; Rotem, A.; Toner, M.; Tompkins, R.G.; Yarmush, M.L. A device to measure the oxygen uptake rate of attached cells: Importance in bioartificial organ design. Cell Transplant. 1994, 3, 515–527. [Google Scholar] [PubMed]
  60. Allen, J.W.; Bhatia, S.N. Formation of steady-state oxygen gradients in vitro: Application to liver zonation. Biotechnol. Bioeng. 2003, 82, 253–262. [Google Scholar] [CrossRef] [PubMed]
  61. De Groot, H.; Littauer, A.; Noll, T. Metabolic and pathological aspects of hypoxia in liver cells. In Oxygen Sensors Tissues; Springer: Heidelberg, Germany, 1988; pp. 49–64. [Google Scholar]
  62. Vinci, B.; Murphy, E.; Iori, E.; Marescotti, M.C.; Avogaro, A.; Ahluwalia, A. Flow-regulated glucose and lipid metabolism in adipose tissue, endothelial cell and hepatocyte cultures in a modular bioreactor. Biotechnol. J. 2010, 5, 618–626. [Google Scholar] [CrossRef] [PubMed]
  63. Vinci, B.; Duret, C.; Klieber, S.; Gerbal-Chaloin, S.; Sa-Cunha, A.; Laporte, S.; Suc, B.; Maurel, P.; Ahluwalia, A.; Daujat-Chavanieu, M.; et al. Modular bioreactor for primary human hepatocyte culture: Medium flow stimulates expression and activity of detoxification genes. Biotechnol. J. 2011, 6, 554–564. [Google Scholar] [CrossRef] [PubMed]
  64. Vinci, B.; Murphy, E.; Iori, E.; Meduri, F.; Fattori, S.; Marescotti, M.C.; Castagna, M.; Avogaro, A.; Ahluwalia, A. An in vitro model of glucose and lipid metabolism in a multicompartmental bioreactor. Biotechnol. J. 2012, 7, 117–126. [Google Scholar] [CrossRef] [PubMed]
  65. Vinci, B.; Cavallone, D.; Vozzi, G.; Mazzei, D.; Domenici, C.; Brunetto, M.; Ahluwalia, A. In vitro liver model using microfabricated scaffolds in a modular bioreactor. Biotechnol. J. 2010, 5, 232–241. [Google Scholar] [CrossRef] [PubMed]
  66. Guzzardi, M.A.; Domenici, C.; Ahluwalia, A. Metabolic control through hepatocyte and adipose tissue cross-talk in a multicompartmental modular bioreactor. Tissue Eng. A 2011, 17, 1635–1642. [Google Scholar] [CrossRef]
  67. Giulitti, S.; Magrofuoco, E.; Elvassore, N. Optimal periodic perfusion strategy for robust long-term microfluidic cell culture. Lab Chip 2013, 13, 4430–4441. [Google Scholar] [CrossRef] [PubMed]
  68. Nishikawa, M.; Kojima, N.; Komori, K.; Yamamoto, T.; Fujii, T.; Sakai, Y. Enhanced maintenance and functions of rat hepatocytes induced by combination of on-site oxygenation and coculture with fibroblasts. J. Biotechnol. 2008, 133, 253–260. [Google Scholar] [CrossRef] [PubMed]
  69. Skolimowski, M.; Nielsen, M.W.; Emnéus, J.; Molin, S.; Taboryski, R.; Sternberg, C.; Dufva, M.; Geschke, O. Microfluidic dissolved oxygen gradient generator biochip as a useful tool in bacterial biofilm studies. Lab Chip 2010, 10, 2162–2169. [Google Scholar] [CrossRef] [PubMed]
  70. Cimetta, E.; Flaibani, M.; Mella, M.; Serena, E.; Boldrin, L.; de Coppi, P.; Elvassore, N. Enhancement of viability of muscle precursor cells on 3D scaffold in a perfusion bioreactor. Int. J. Artif. Organs 2007, 30, 415–428. [Google Scholar] [PubMed]
  71. Brandrup, J.; Immergut, E.H.; Grulke, E.A.; Akihiro, A.; Bloch, D.R. Polymer Handbook; Interscience Publishers: New York, NY, USA, 2004. [Google Scholar]
  72. Sayed-Ahmed, M.E.; Saif-Elyazal, A.; Iskander, L. Laminar Flow and Heat Transfer of Herschel-Bulkley Fluids in a Rectangular Duct; Finite-Element Analysis. Tikrit J. Sci. Eng. 2009, 12, 99–107. [Google Scholar]
  73. Weibel, E.R.; Bacigalupe, L.D.; Schmitt, B.; Hoppeler, H. Allometric scaling of maximal metabolic rate in mammals: Muscle aerobic capacity as determinant factor. Respir. Physiol. Neurobiol. 2004, 140, 115–132. [Google Scholar] [CrossRef] [PubMed]
  74. Elert, G. The Physics Factbook. Available online: http://hypertextbook.com/facts (accessed on 11 May 2014).
  75. NASA-STD-3000, Man-Systems Integration Standards. Available online: http://msis.jsc.nasa.gov (accessed on 11 May 2014).
  76. Sohlenius-Sternbeck, A.K. Determination of the hepatocellularity number for human, dog, rabbit, rat and mouse livers from protein concentration measurements. Toxicol. In Vitro 2006, 20, 1582–1586. [Google Scholar] [CrossRef] [PubMed]
  77. Sbrana, T.; Ahluwalia, A. Engineering Quasi-Vivo in vitro organ models. Adv. Exp. Med. Biol. 2012, 745, 138–153. [Google Scholar] [PubMed]
  78. Vozzi, F.; Mazzei, D.; Vinci, B.; Vozzi, G.; Sbrana, T.; Ricotti, L.; Forgione, N.; Ahluwalia, A. A flexible bioreactor system for constructing in vitro tissue and organ models. Biotechnol. Bioeng. 2011, 108, 2129–2140. [Google Scholar] [CrossRef] [PubMed]
  79. Haycock, J.; Ahluwalia, A.; Wilkinson, M.J. Cellular In Vitro Testing: Methods and Protocols; Pan Stanford Publishing Pte. Ltd.: Singapore, Singapore, 2014. [Google Scholar]

