Article

Predicting Bulk Density for Agglomerated Raspberry Ketone via Integrating Morphological and Size Metrics Using Artificial Neural Networks

1
School of Chemical Engineering and Technology, Tianjin University, Tianjin 300072, China
2
School of Chemical Engineering and Technology, National Engineering Research Center of Industrial Crystallization Technology, Tianjin University, Tianjin 300072, China
*
Author to whom correspondence should be addressed.
Processes 2024, 12(5), 902; https://doi.org/10.3390/pr12050902
Submission received: 20 March 2024 / Revised: 25 April 2024 / Accepted: 26 April 2024 / Published: 29 April 2024
(This article belongs to the Special Issue State-of-the-Art Research and Development in Particle Technology)

Abstract

:
The bulk density of the particles, which is directly related to transportation and storage costs, is an important basic characteristic of products as well as an important parameter in many processing systems. This work quantified the relationship between the tapped bulk density of raspberry ketone with different degrees of agglomeration and morphological metrics (particle shape descriptors and roughness descriptors) and size metrics (size descriptors) and developed an artificial neural network (ANN) prediction model for the tapped bulk density of raspberry ketone. Samples prepared under different conditions were sieved and remixed, the tapped bulk density of the particles was then measured, and the descriptor features of the particles were obtained by combining them with image processing. The dimensions of the variables were decreased by principal component analysis and variance processing. To overcome the hyperparameter estimation of the heuristic-based artificial neural networks, the network model architectures were optimized by a neural architecture search strategy combining two-objective optimization. The results demonstrated that the tapped bulk density of raspberry ketone products is not only related to the descriptors of particle size and shape but also has a non-negligible relationship with particle roughness descriptors. The performance of the optimal ANN model demonstrated that the model can well predict the tapped bulk density of raspberry ketone with different degrees of agglomeration. The ANN model obtained by extracting morphology and size metrics through online image analysis can be used to measure the tapped bulk density in real-time and has the potential to be used for developing model-based online process monitoring.

Graphical Abstract

1. Introduction

The bulk density of particles is a fundamental physical property as well as an important parameter describing the flowability of particles, and many processes require a priori knowledge of its value [1,2,3]. Bulk density is important for products in industry because it affects the storage and transportation of products, all of which influence the profit of product processing [4]. For example, high bulk density can reduce the cost of shipping and packaging materials when transporting products over long distances. Furthermore, “it is also essential for pharmaceutical particles, as it determines the complexity of handling and processing these powders” [5].
The bulk density of crystal particles is determined by many factors. For example, the relative humidity and drying can affect the particles’ bulk density [2,6,7]. It is also determined by the void fraction, the density and the size of particles [8,9]. Additionally, Abdullah and Bhandari pointed out that particle shape and agglomeration process also affect the bulk density of particles, respectively [7,10]. Furthermore, Pisecky indicated that particle shape and interstitial air are the main factors in determining the bulk density of agglomerated particles, whereas the bulk density of non-agglomerated particles is controlled by the particle size distribution [11]. At present, particle shape analysis in some papers has gradually shifted from qualitative analysis using microscopy to quantitative analysis using image processing [8,12]. However, “in these studies, shape characteristics have not often been the key focus but rather have merely been supporting information”. The feature descriptors obtained through image analysis are rarely correlated with the packing characteristics of particles. In addition, agglomeration during crystallization not only affects particle shape and size but also has a great impact on the particle surface, for example, the surface of heavy agglomerates tends to be rough which affects the void fraction to a certain extent. Therefore, it is necessary to investigate the quantitative relationship between the morphological metrics (particle shape and roughness) and size metrics and the bulk density of particles with different degrees of agglomeration. It is significant to investigate the relationship above for achieving bulk density prediction, as well as for controlling and optimizing the bulk density of the product during the crystallization process.
Machine learning is able to give reasonable predictions based on the available data, which has shown great potential to reduce the investigative efforts of experiments and simulations [13,14,15]. It is generally observed that ANNs are more advantageous than other methods such as Support Vector Machines (SVMs) [16] and Response Surface Methodologies (RSMs) [17], regarding their ability to capture complex nonlinearities in the data [18,19,20]. Therefore, ANNs have been widely used in control, optimization, prediction and many other practical application fields [21]. However, in developing ANN models, difficulty is encountered in selecting hyper-parameters that determine the accuracy of ANNs, such as the number of layers, the number of nodes in each hidden layer, and the activation function [22]. These drawbacks sometimes limit the applicability of artificial neural networks. Hence, in recent years, several algorithms that have been developed within the Neural Architecture Search (NAS) framework to determine the optimal configuration of ANNs without the need for heuristic algorithms have emerged, for example, by utilizing techniques such as Bayesian Optimization and Reinforcement Learning to determine the optimal network architecture [23,24,25]. The NAS strategy was used in this work to find the optimal ANN prediction model.
Raspberry ketone, also known as 4-(4-hydroxyphenyl)-2-butanone, is widely used in the food industry, cosmetic industry, agriculture, pharmaceutical manufacturing, etc. It has a great economic value and has been widely attention in recent years, the demand is also increasing year by year. Since oiling-out occurs during the crystallization of raspberry ketone, resulting in product agglomeration, raspberry ketone was used as a model material in this work.
This research explored the quantitative connection between the shape, roughness, and size descriptors of raspberry ketone with different degrees of agglomeration versus the bulk density, with the ultimate goal of achieving prediction over the bulk density. Different samples prepared under different conditions were sieved into three particle size groups and then recombined by a simple lattice design. The quantitative information on different shapes, sizes, and roughness descriptors of the samples was gathered by light microscopy and image processing, and the tapped bulk density of each sample was measured by tap testing. Twelve characteristic descriptors with relatively high variability were determined using principal component analysis, followed by reducing the dimensions of the variables by analysis of variance. Finally, regression analysis using the optimal ANN model found by the NAS strategy was used to evaluate the effectiveness of predicting bulk density using the selected feature descriptors.

2. Experimental Section

2.1. Materials and Design

Raspberry ketone (99% purity) was purchased from Meryer (Shanghai, China). The 1-propanol solvent (analytical reagent grade) was purchased from Tianjin Jiangtian Chemical Co. (Tianjin, China), and the ultrapure water was purchased from Wahaha Group Co., Ltd. (Hangzhou, China). All the chemicals were used without further purification. A stereo microscope (VIYEE) was used to record crystal images.

2.2. Sample Preparation and Sieving

Crystallization experiments were conducted in a 250 mL jacket crystallizer at 15 °C (controlled by a thermostat water bath, Huber, Ministat 230, Germany); 9.75 g of raspberry ketone was dissolved in 30 g of 1-propanol at 15 °C in the crystallizer with an agitation speed of 300 rpm. The antisolvent (ultrapure water) was added continuously at a rate of 1 mL/min for 150 min by a peristaltic pump (model 77200-50, Cole-Parmer Masterflex L/S, USA), and the slurry was maintained at 15 °C for 15 min after the complete addition of antisolvent.
Seeding crystallization (control of product agglomeration) was optimized by varying seed addition time (i.e., before or after liquid-liquid phase separation (LLPS)) and seed sizes. Four sets of experiments under different conditions were performed. The particle size and agglomeration degree of the products obtained in these sets varied. The degree of agglomeration used in this work was defined based on the number of primary particles in the agglomerates. The agglomerates in products were classified into three types: heavy agglomerates (i ≥ 10, where i represents the number of primary particles in each agglomerate), medium agglomerates (i = [6, 9]), and light agglomerates (i = [2, 5]). These types were defined according to our rules for evaluating the degree of agglomeration of raspberry ketone crystals, which represent an increasing complexity (number of primary particles) of the agglomerated particles. The detailed experimental conditions are shown in Table S1. At the end of each experiment, the samples were collected by vacuum suction filtration and then dried in an oven at 50 °C for 24 h. Different particle size groups have different diameter ranges and the prediction performance of the model may be affected by the range of diameters. Therefore, each sample after drying was sieved through a standard sieve into three particle size range groups: coarse particles (>400 μm), medium particles (300–400 μm) and fine particles (<300 μm). Particles in three size ranges were subsequently recombined according to a simplex-lattice design (see Section 2.3).

2.3. Simplex-Lattice Design
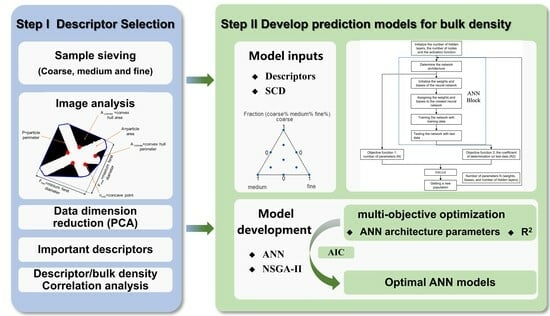
The simplex-lattice design is an effective tool for designing experiments of mixtures that can analyze variable-response relationships, with component proportions ranging from 0 to 1, totaling 1 [26]. In this study, a simplex-lattice design was used to reallocate the particle size fractions (coarse, medium, and fine) of the recombined samples. Figure 1 shows the particle size fractions of the raspberry ketone samples, the number of test points designed in this research was ten (Table S2). Finally, the tapped bulk densities of the samples were obtained by the average value of the three repeated experiments using tap testing, which was conducted with a Quantachrome Autotap device. The mean value and standard deviation of the tapped bulk densities of different particle size fraction ratios are listed in Table 1.

3. Methodology

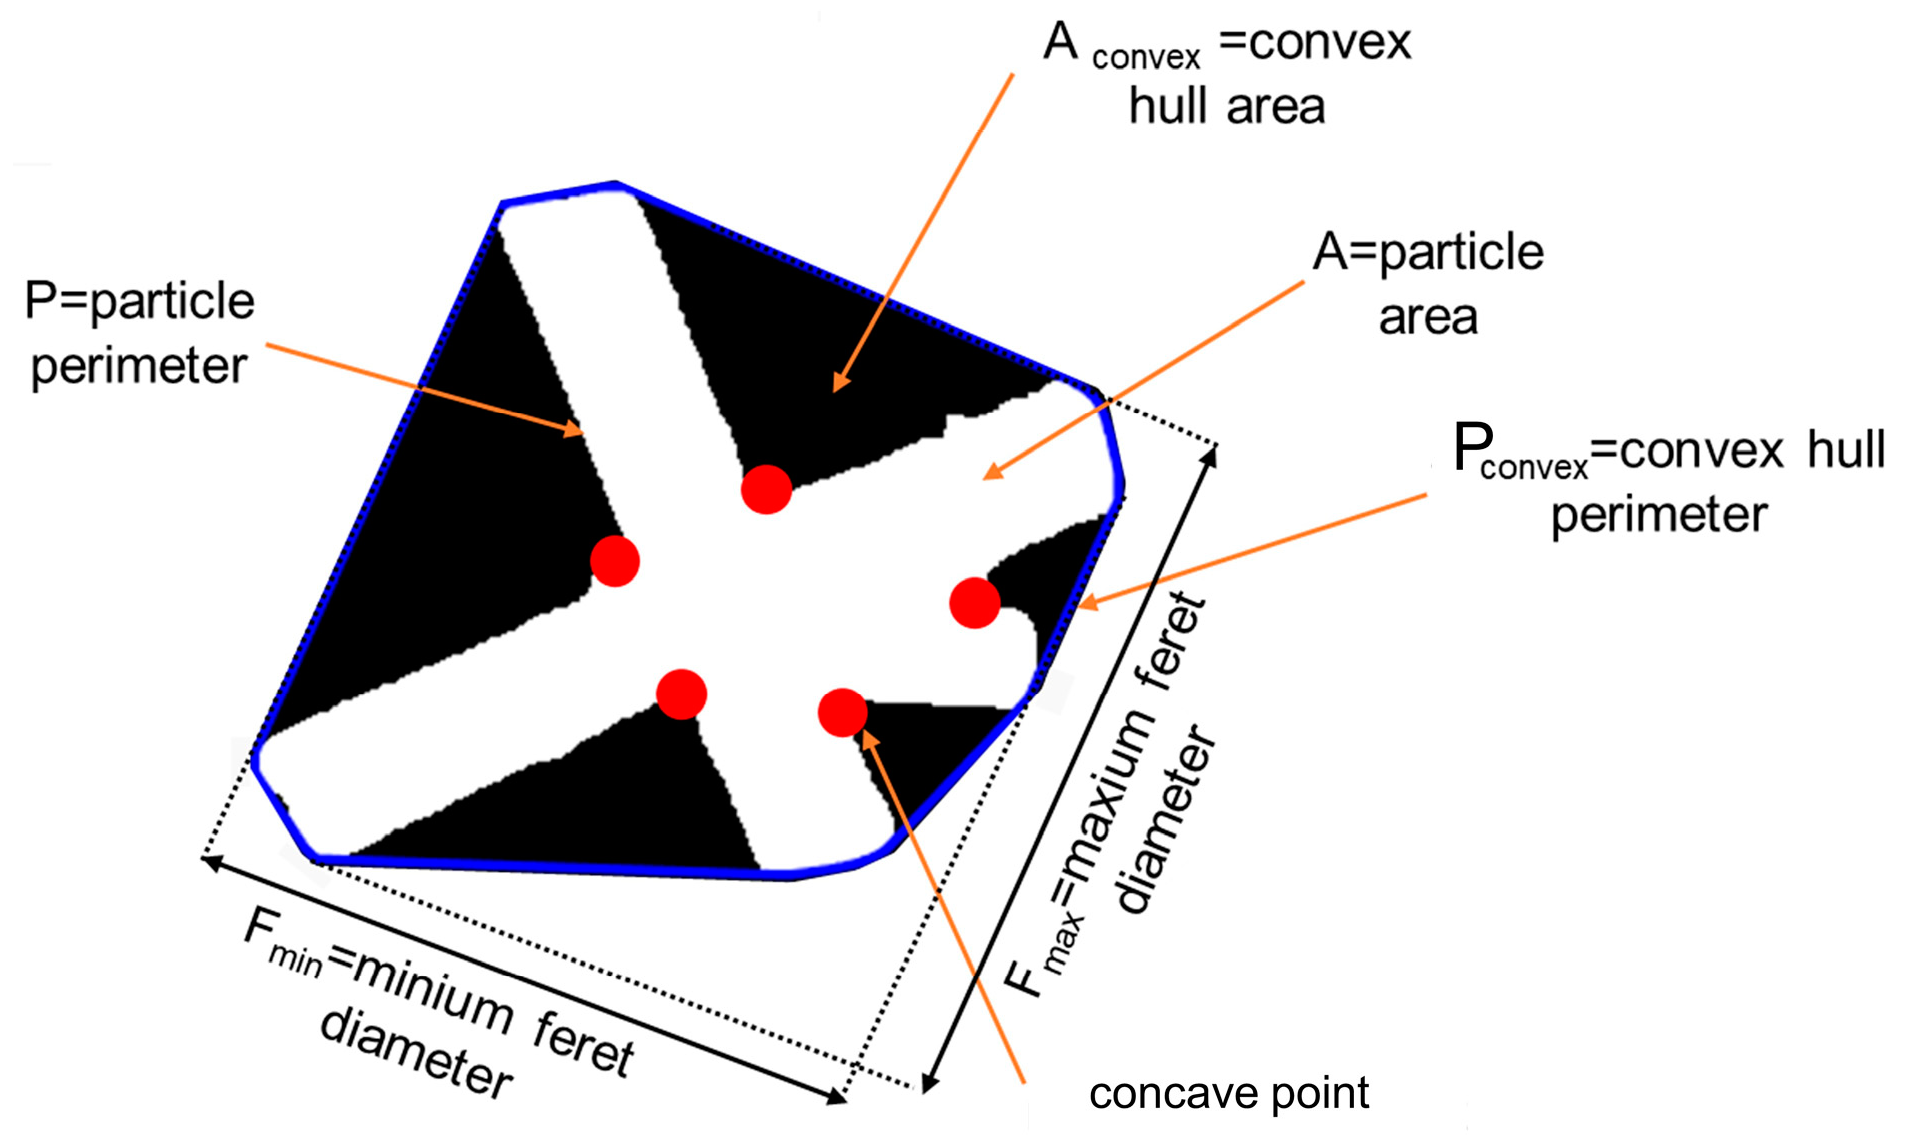
3.1. Image Processing and Analysis

Image descriptors of particles obtained by light microscopy and image processing. A small number of product particles from each particle size fraction were placed in a Petri dish (by tapping the dish to maximize dispersion of the particles), and images were collected using a stereo microscope. Approximately 3000 particles for each sample were investigated in this research. Figure S2a shows microscope images of different degrees of agglomeration. Next, image processing is performed on the images captured. Threshold segmentation was performed using the maximum interclass variance method (OTSU algorithm) [27] to produce a binary image after processing (thresholding). Subsequently, a morphological region-filling strategy was used to fill up the area confined by the boundaries of the objects (hole filling). Simultaneously, the morphological opening operation was used to smooth the object boundaries while eliminating objects that have contact with the image border (border kill). Finally, dust and blurred particles were effectively removed by setting the minimal projected area threshold of 0.0032 mm2 which corresponds to an equivalent diameter of 65 µm. The processed images are shown in Figure S2b. Eighteen image descriptors were extracted by further analyzing the processed images (The three types of image descriptors describing particle size, shape, and roughness). Figure 2 shows a schematic diagram of some image descriptors and a complete list of all image descriptors including definitions and formulas refer to Table S3.

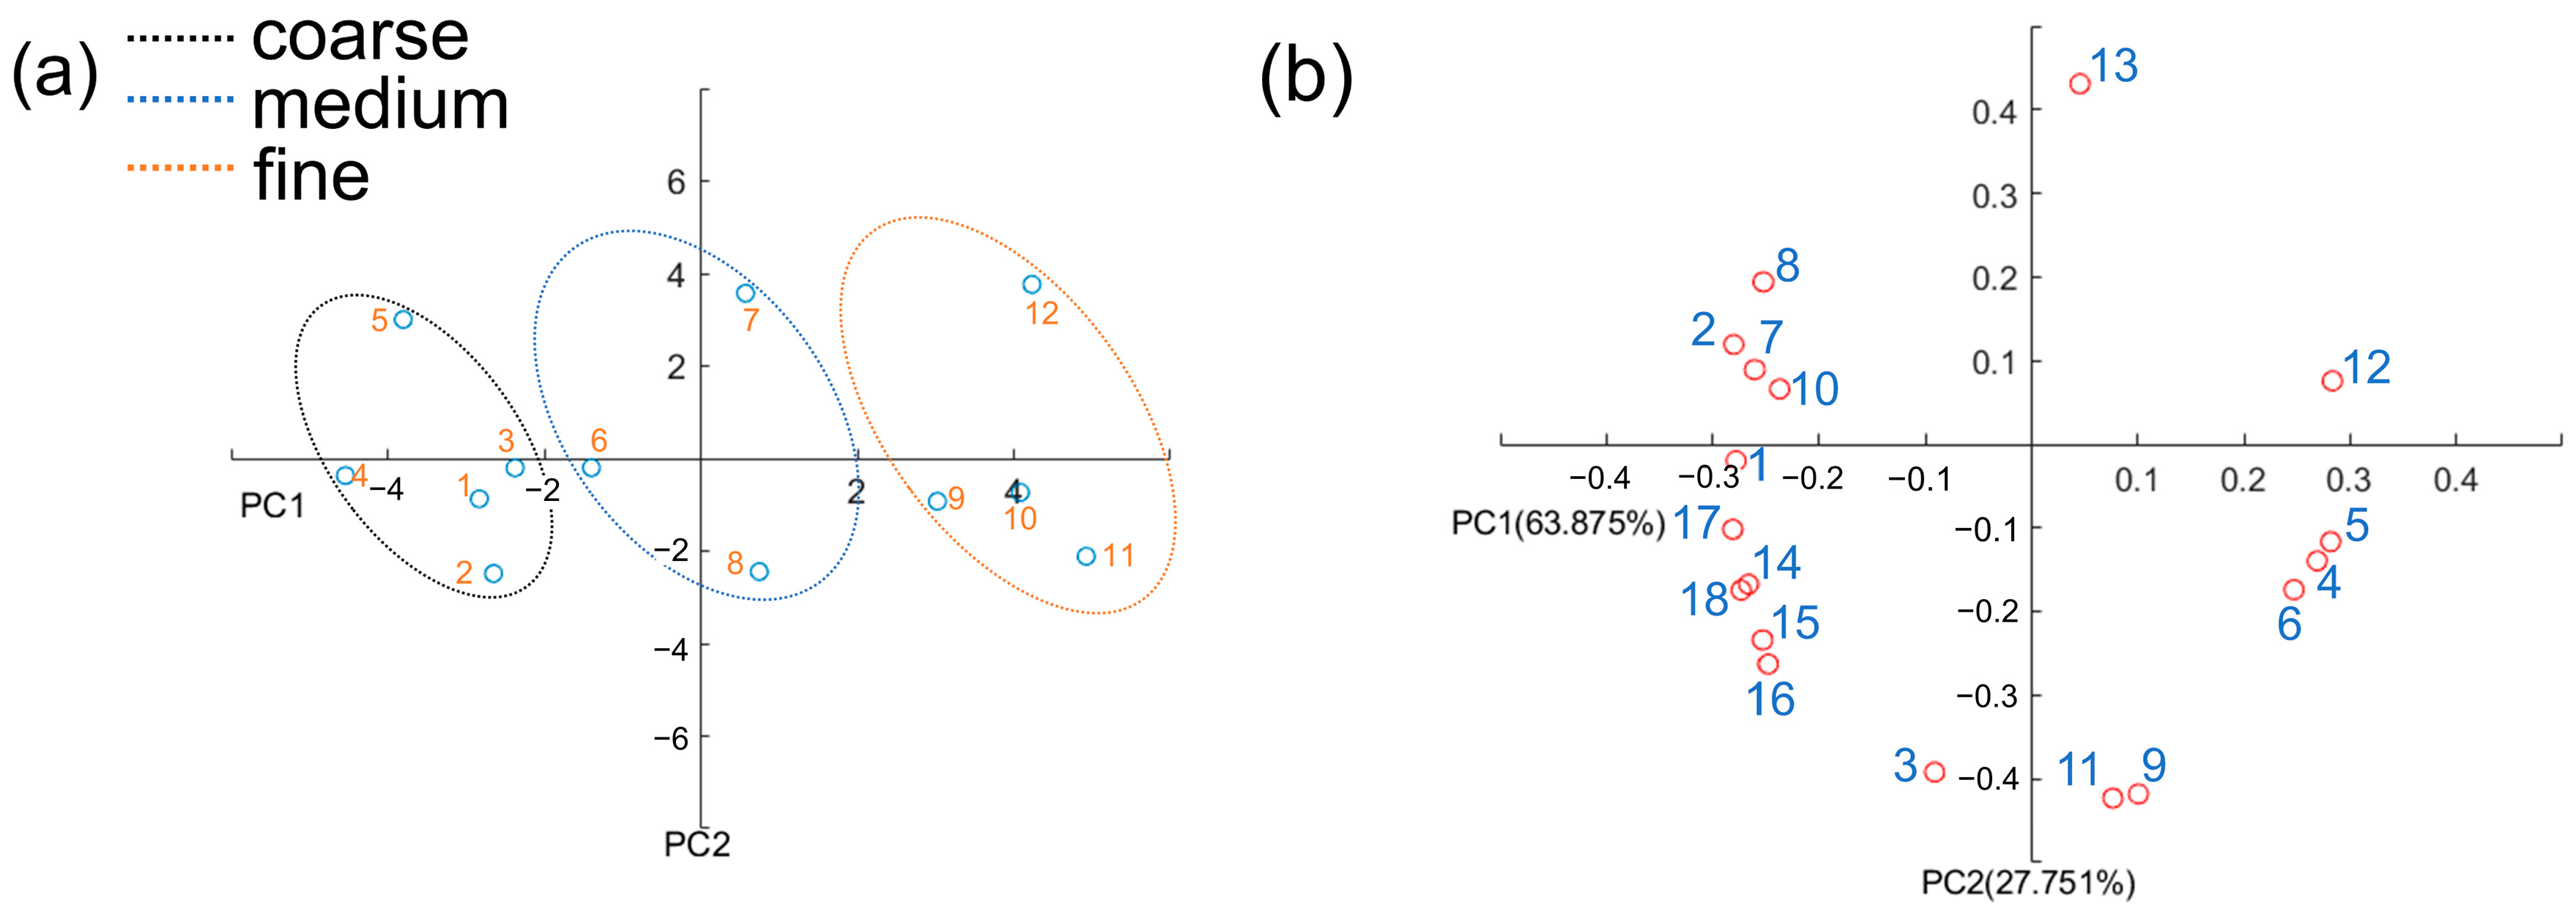
3.2. Principal Component Analysis (PCA)

Principal component analysis is a widely used dimensionality reduction technique for data analysis [28]. “It can transform a high-dimensional dataset into a low-dimensional space while retaining the maximum amount of information. A large number of correlated variables can be transformed into a smaller dataset containing uncorrelated components” [29]. Thus, “PCA can elucidate and simplify complex relationships between initial variables”. It has been widely used in various scientific fields [30]. In this study, PCA was used to determine which image descriptors have greater variability.

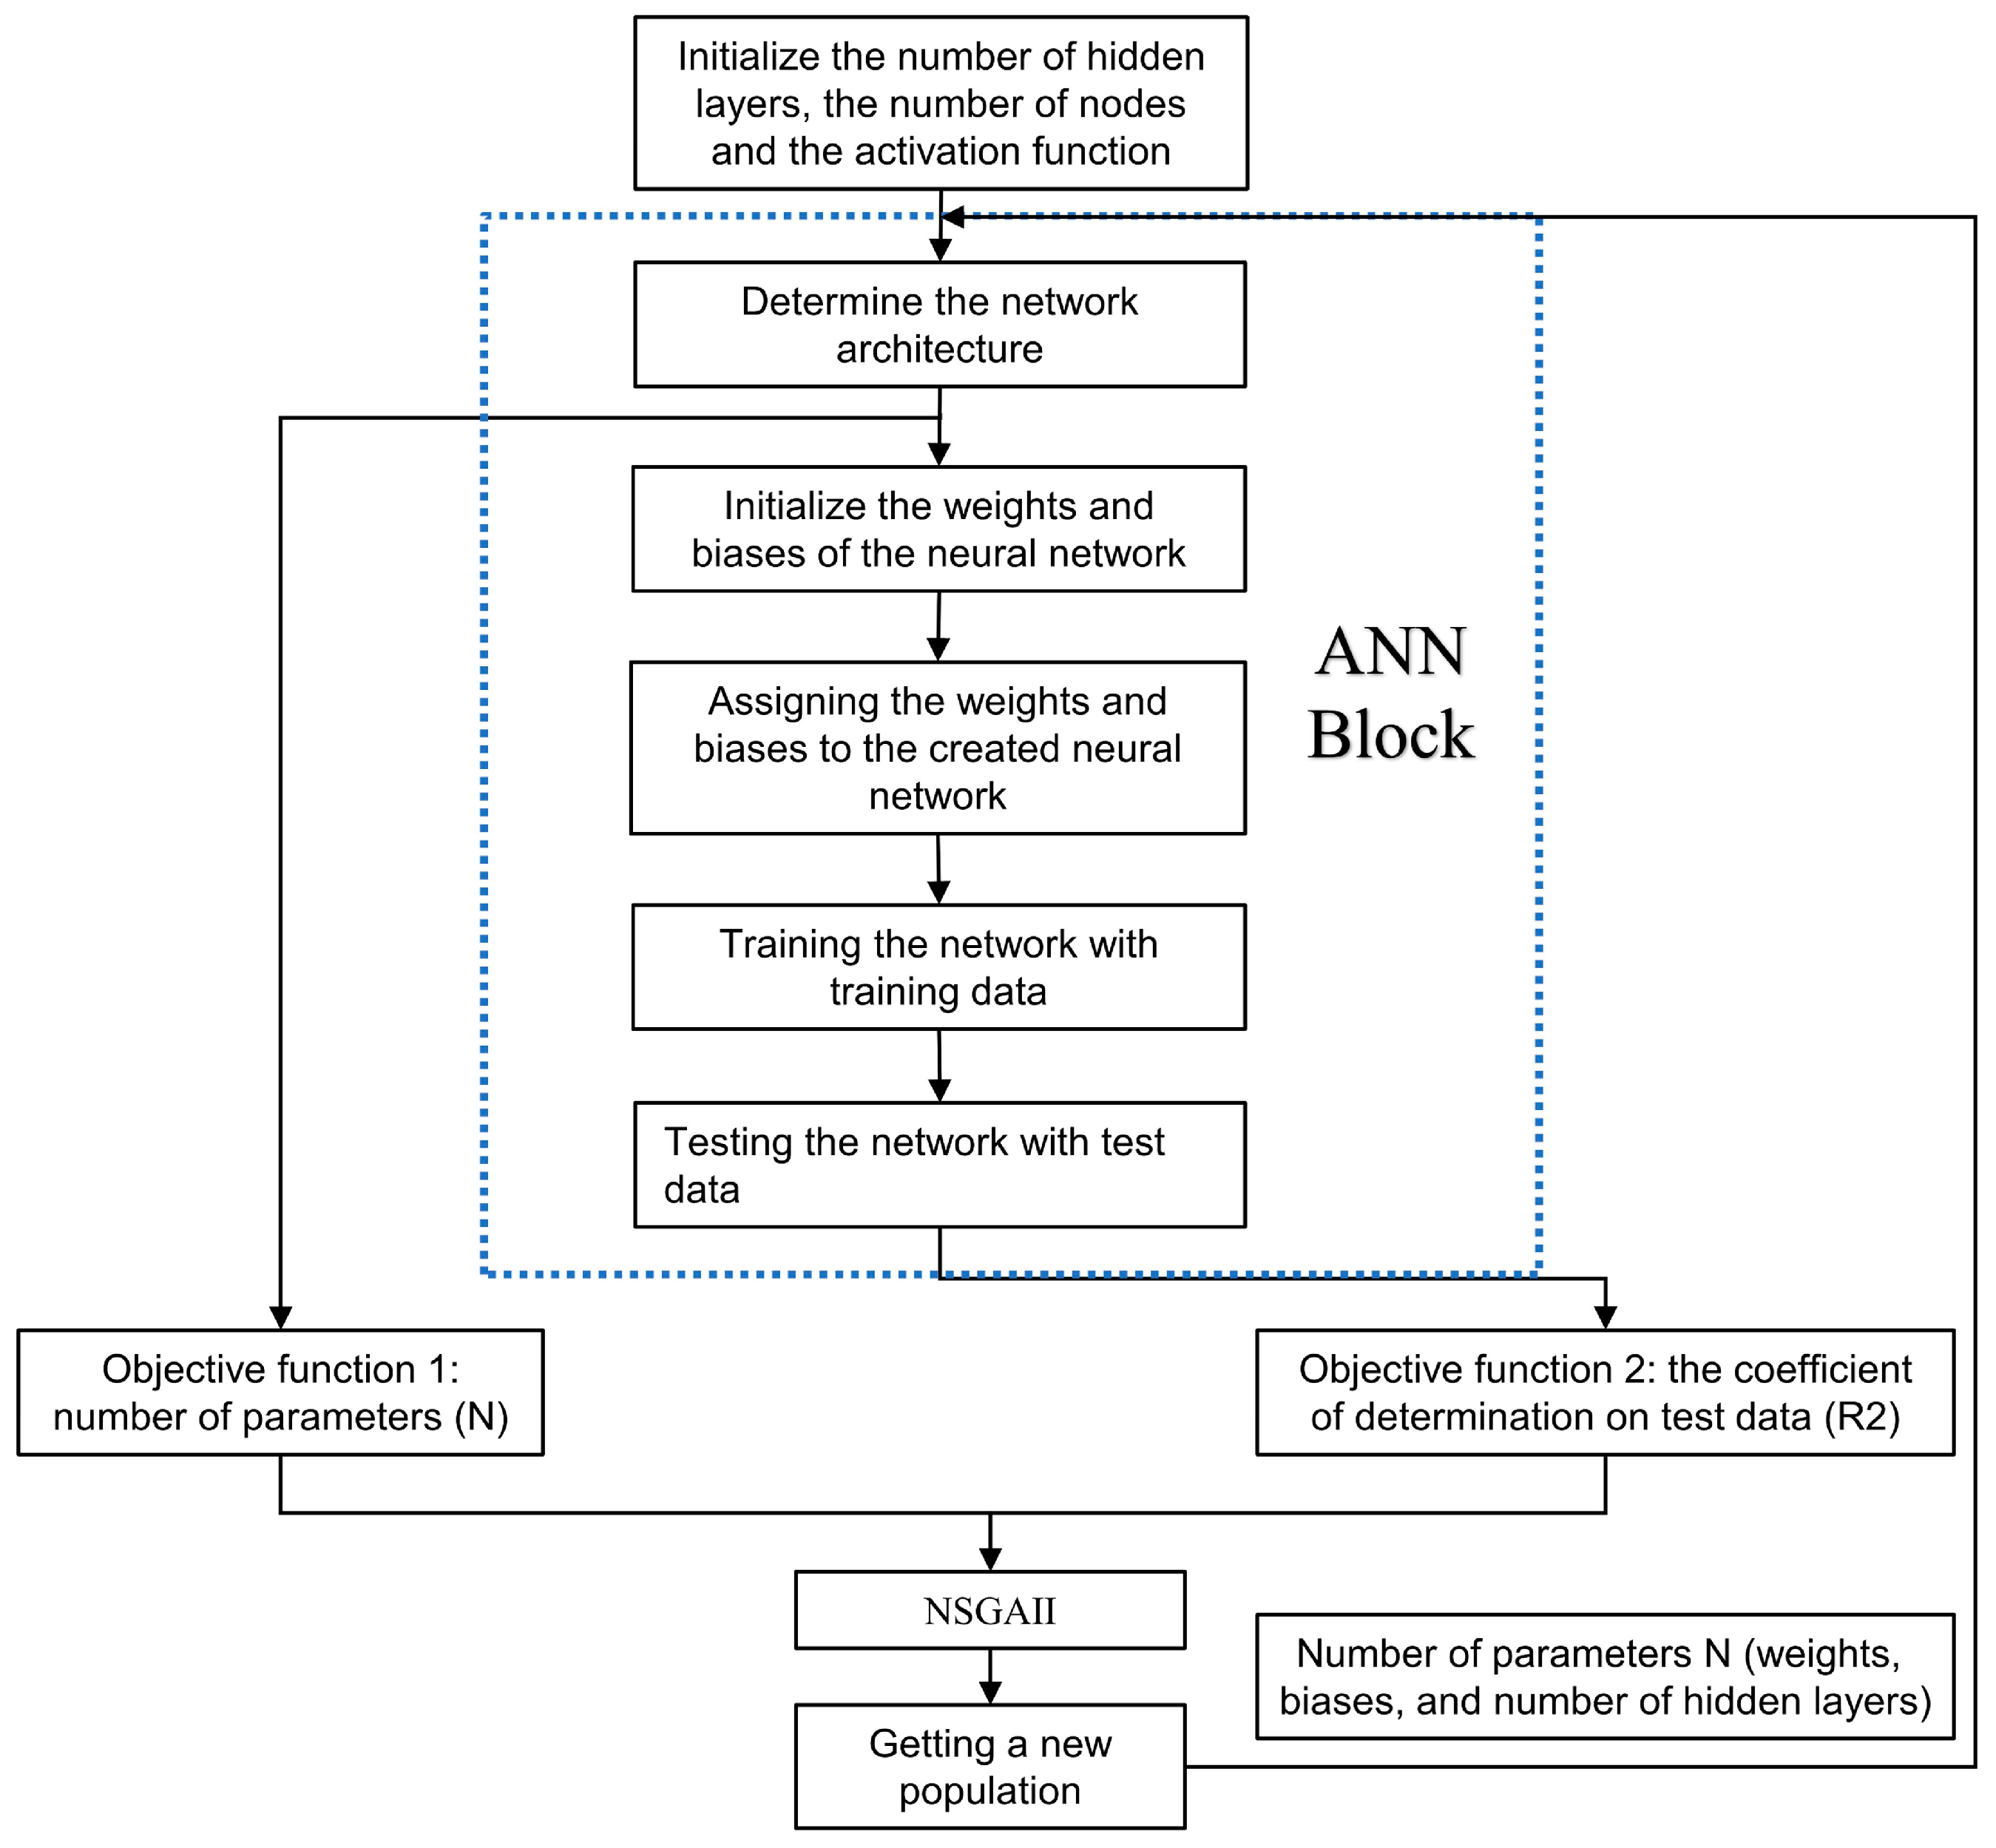
3.3. Artificial Neural Networks

“ANN is a computer algorithm for processing, predicting and categorizing data, and its invention is inspired by the biological nervous system” [22]. In the last decade, ANN has been widely used in many fields, including hydrodynamics, chemical solubility, reactor performance, and mechanical wear rate [31,32,33,34,35,36,37,38]. The computation of ANN is divided into three main stages: input layer, hidden layer and output layer. The input layer receives the input data and the output layer produces the final output results. The hidden layer is used to process the input data and gradually extract the feature information. The samples in this research were divided into three subsets: training, validation and testing. The training subset occupied 70%, the validation subset 15%, and the rest of the data was used for testing (We used a fully random division of the dataset and cannot ensure that each sample type a-d was included in each subset.). However, due to the randomness of initialization and data division, the ANN obtained after each training process is normally different. Generally, the basic principle for selecting the best ANN is to choose the ANN with the minimum mean square error (MSE) or the maximum coefficient of determination (R2) [39]. “Since the nature of the data can be nonlinear, a multilayer ANN is required in this work to explore the architecture of the neural network with more than one hidden layer. A gradient-based unconstrained method called the Levenberg–Marquardt algorithm was chosen to train the model” [22]. The training ended automatically when the mean square error (MSE) of the validation samples stopped decreasing. The flowsheet of the ANN is shown in Figure 3.

3.4. Neural Architecture Search Optimization Network Architecture (NSGA-II-ANN)

It is a time-consuming and challenging task to pre-determine parameters such as the number of hidden layers, the number of nodes per layer, and the activation function before training the model. Multiple hidden layers are required for some nonlinear data to improve the accuracy of the model, but the increase in the number of nodes and hidden layers can cause overfitting. Therefore, a trade-off between maximizing the prediction accuracy and minimizing the number of parameters (weights and biases) is necessary. A multi-objective optimization framework for neural architecture search [22] was used for the above problem to find the ANN model with maximum prediction accuracy and minimum number of parameters. In this research, the number of hidden layers, the number of nodes in each hidden layer and the activation function were used as decision variables. The non-dominated sorting genetic algorithm II (NSGA-II) was used to solve the two-objective optimization problem. The optimization objective function is firstly the number of the model parameters (N, represented by the function f1) and secondly the coefficient of determination (R2, represented by the function f2) on the test set. The architecture and activation function obtained from the optimizer was used for training using the backpropagation algorithm. The flowsheet of the neural architecture search algorithm used is shown in Figure 4. The detailed algorithm is shown in Table S4.

3.5. Non-Dominated Sorting Genetic Algorithm II

“Compared with the traditional genetic algorithm, The NSGA-II algorithm has obvious advantages in the optimization process” [40]. It is an improvement over traditional genetic algorithms by introducing non-dominated sorting, the proposal of crowding distance and crowding degree comparison operator, and the introduction of elite strategy, which reduces the computational complexity, greatly reduces the computation time and improves the optimization speed and results of optimization to a great extent. Based on its simplicity and efficiency, the NSGA-II algorithm has been widely used in multi-objective optimization problems [41,42,43]. The execution flowchart of NSGA-II is shown in Figure 5. The NSGA-II algorithm steps are as follows:
  • Step 1: Create the initial parent population of size N.
  • Step 2: Generate an offspring population through crossover and mutation.
  • Step 3: Merge the parent and child populations to create a new population of size 2N.
  • Step 4: All individuals in the population are ranked by non-dominated sorting, and the crowding distance is computed if the individuals have the same rank, then the suitable individuals are selected to create the next population of size N.
  • Step 5: Determine the termination conditions and perform the above steps until the termination conditions are satisfied.

4. Results and Discussion

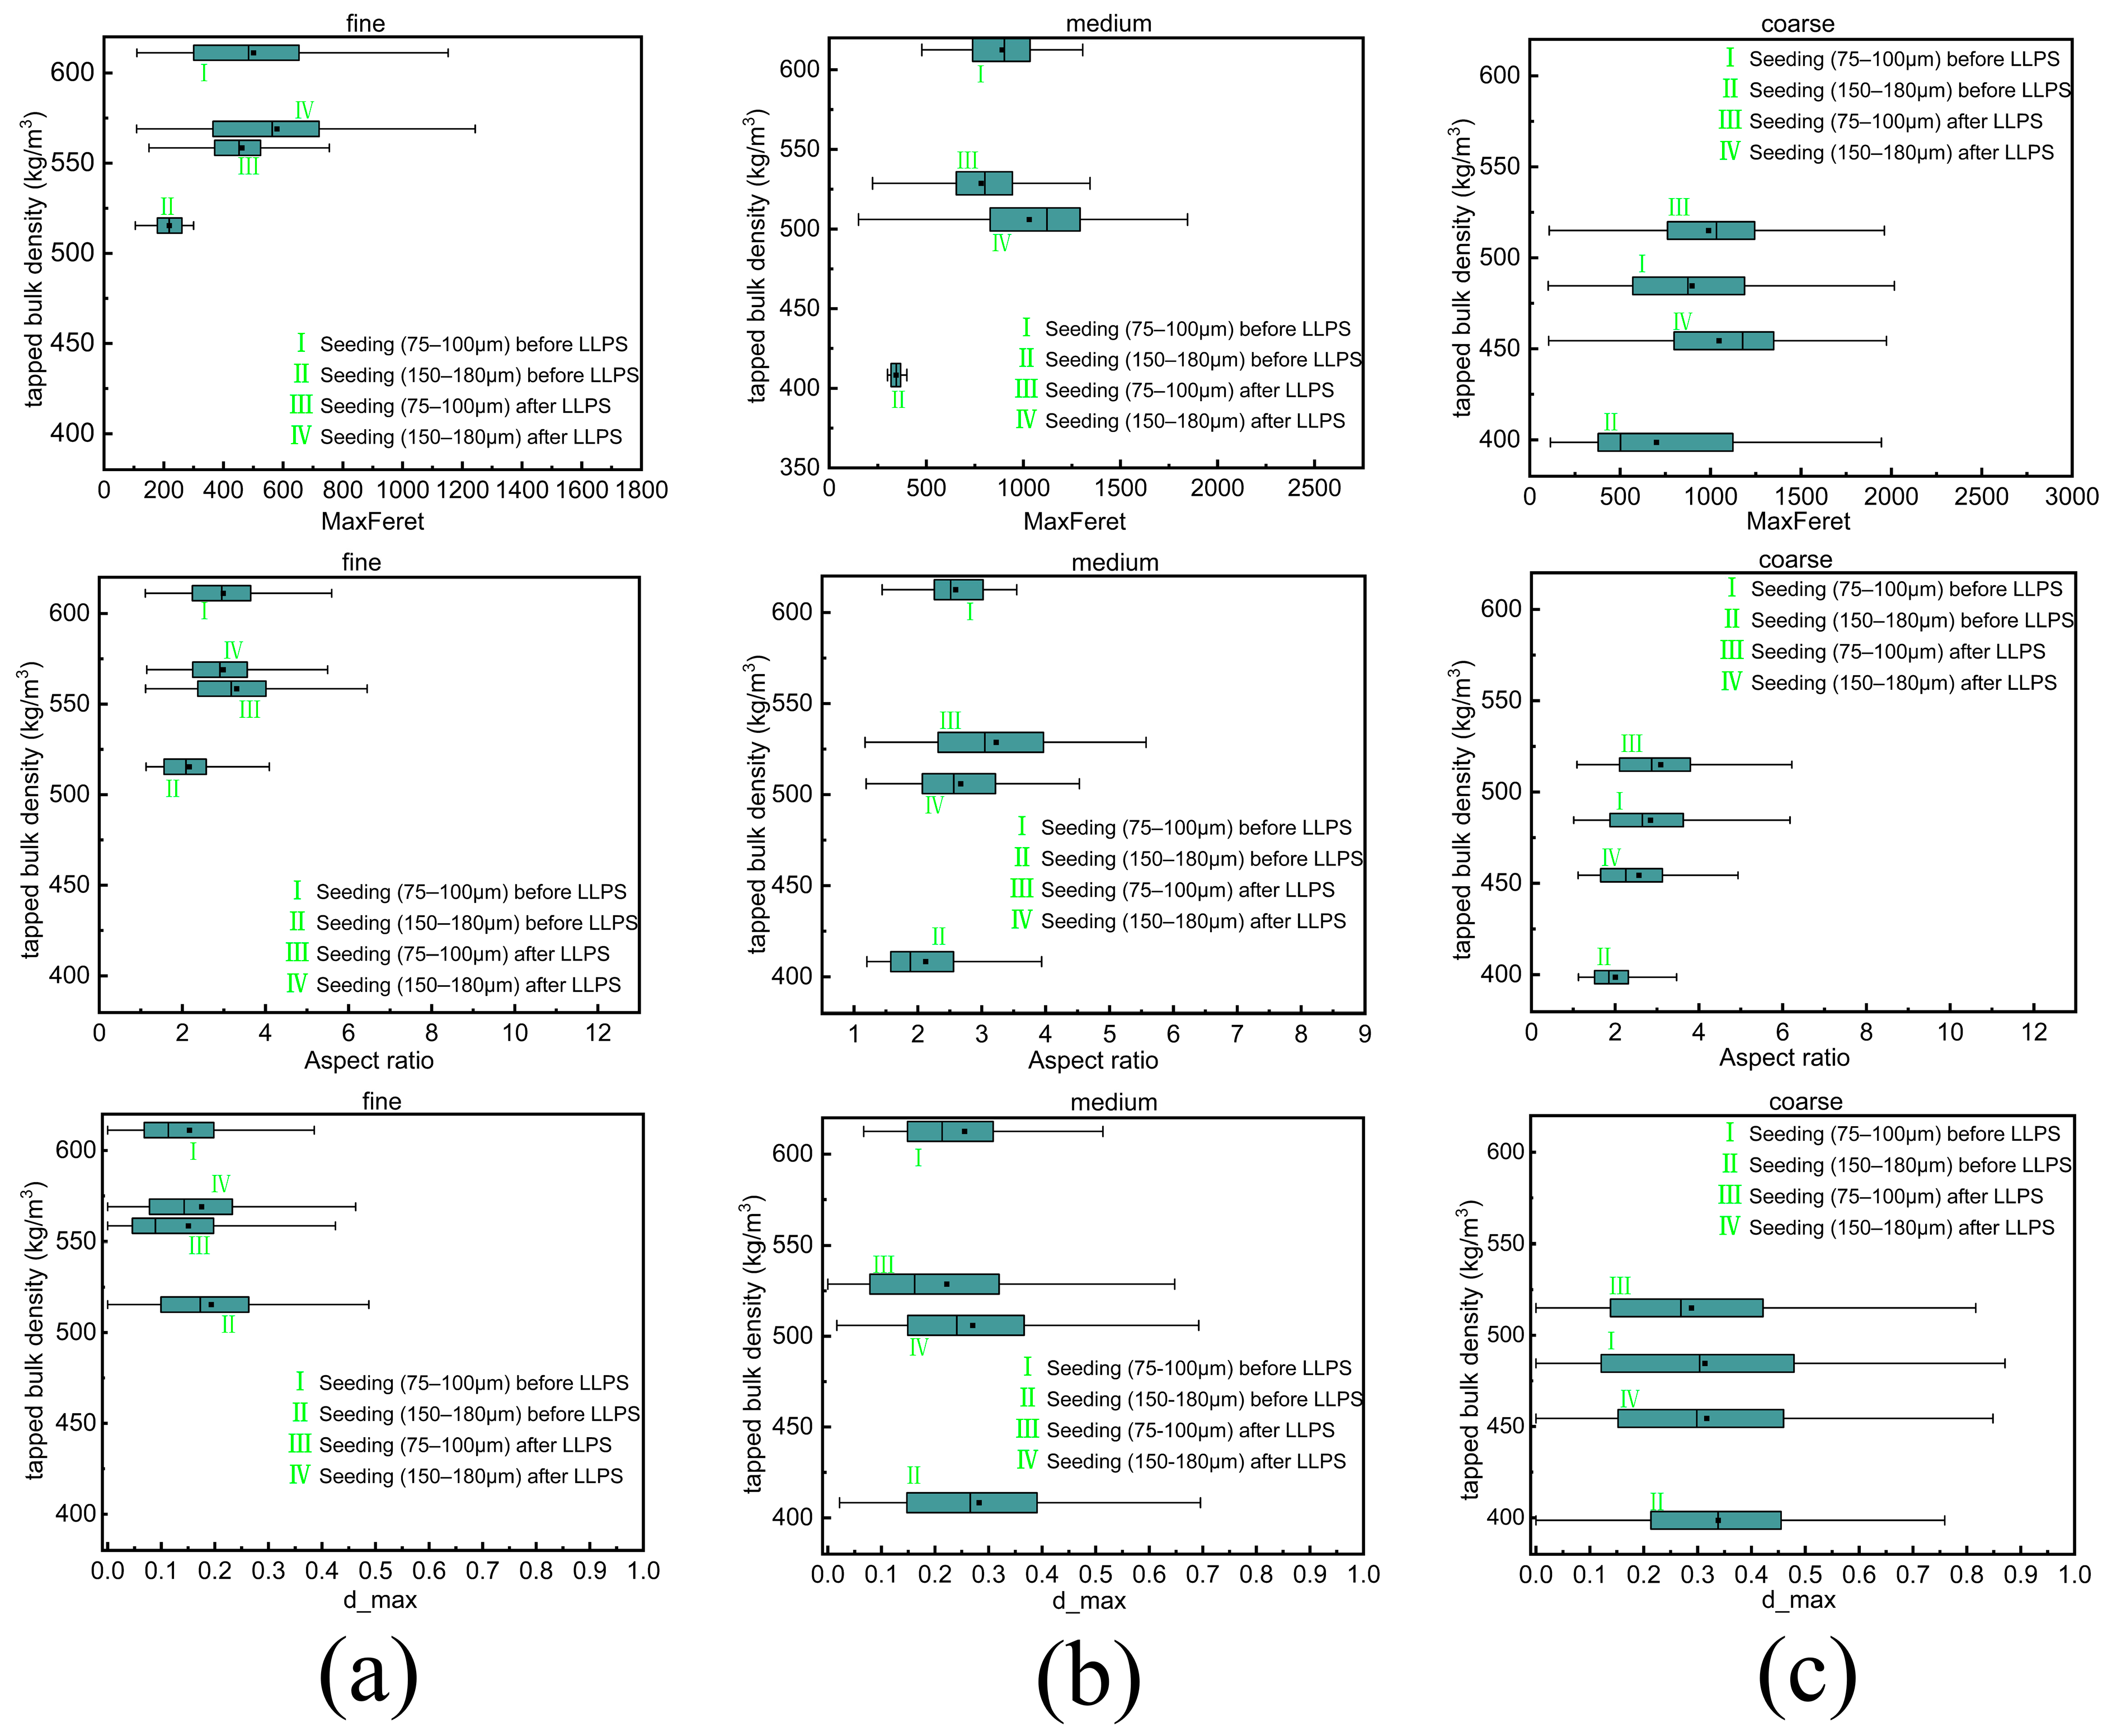
4.1. Image Descriptor Analysis

As shown in Figure S2, the differences in shape and surface of particles with different degrees of agglomeration are obvious. Therefore, three types of image descriptors describing particle size, shape and surface roughness, respectively, were introduced to describe the relationship between agglomerated particles and tapped bulk density. Since using the image descriptor values for all individual particles results in numerical complexity for PCA calculations, the mean values of all 18 image descriptors were used for PCA to determine which descriptors had higher variability, and the effects of size, shape and surface roughness could be assessed in this way. Figure 6a shows the PCA score plot, where the numbers 1 to 12 represent, respectively, coarse, medium, and fine particles from four different samples. As shown in the Figure 6a, all but the sample 5 are well classified along the axes. The loading plot of PCA is shown in Figure 6b, combined with the third principal component (as shown in Figure S5), among the 18 extracted descriptors, 12 image descriptors with relatively high loadings were chosen to train the ANN model to predict the tapped bulk density of raspberry ketone. These descriptors are the number of concave points (1), number of primary particles (3), maximal scaled depth of concavity (2), elongation (9), aspect ratio (11), circularity (12), roundness (13), maximum/minimum Feret diameter (16/17), particle perimeter/area (18/14), and equivalent diameter (15). For detailed methods of the descriptors selected, refer to the Supplementary File.
Furthermore, the empirical cumulative distribution function values of 12 image descriptors determined by PCA were used to represent each descriptor variable in order to quantitatively describe the morphology, size and surface roughness characteristics of the raspberry ketone products with different agglomeration degrees. However, each point on the empirical cumulative distribution curve will generate a large amount of input data. When the dimension of the input data is much larger than the number of samples, the data sparsity increases, and the training ANN model will become more difficult and prone to overfitting problems. Therefore, based on the distance measurement (variance) between the empirical cumulative distribution curves, i.e., the variance was computed separately for each y = {0.1, 0.2, …, 1}, the first three variables with high variance in each descriptor were selected for decreasing variable dimensions, as shown in Figure 7. The variance can be calculated from Equation (1). Finally, the ANN input consisted of 36 values, that is, 3 points from the cumulative distribution function of each of the 12 selected feature descriptors.
S = 1 N 1 i = 1 N x i x ¯ 2
where,
x ¯ = 1 N i = 1 N x i , N = 4

4.2. Quantitative Analysis between Typical Descriptors and Tapped Bulk Density

Since particle size and morphology have an effect on the tapped bulk density of raspberry ketone products with different agglomeration degrees, each sample was divided into three particle size groups: coarse, medium and fine. The cumulative distribution curves of three typical descriptors (maximum Ferret diameter, aspect ratio, and maximum scaled concavity depth) among the 12 image descriptors are compared within the same particle size fraction (Figure 8). The cumulative distribution functions of the image descriptors for different samples within the same particle size fraction are significantly different. As shown in Figure 9, the differences among the samples can be observed to be relatively large under the same descriptor. Figure S3 shows the relationship between the descriptor mean values of samples with different particle size fractions and their tapped bulk densities, indicating that different samples within the same particle size fraction have different tapped bulk densities, which generally decrease with the decrease in the maximum Feret diameter and aspect ratio and the increase in the maximum scaled concavity depth. It may be because the particles with a more regular shape and less roughness will result in a low void fraction, which will lead to a high tapped bulk density.

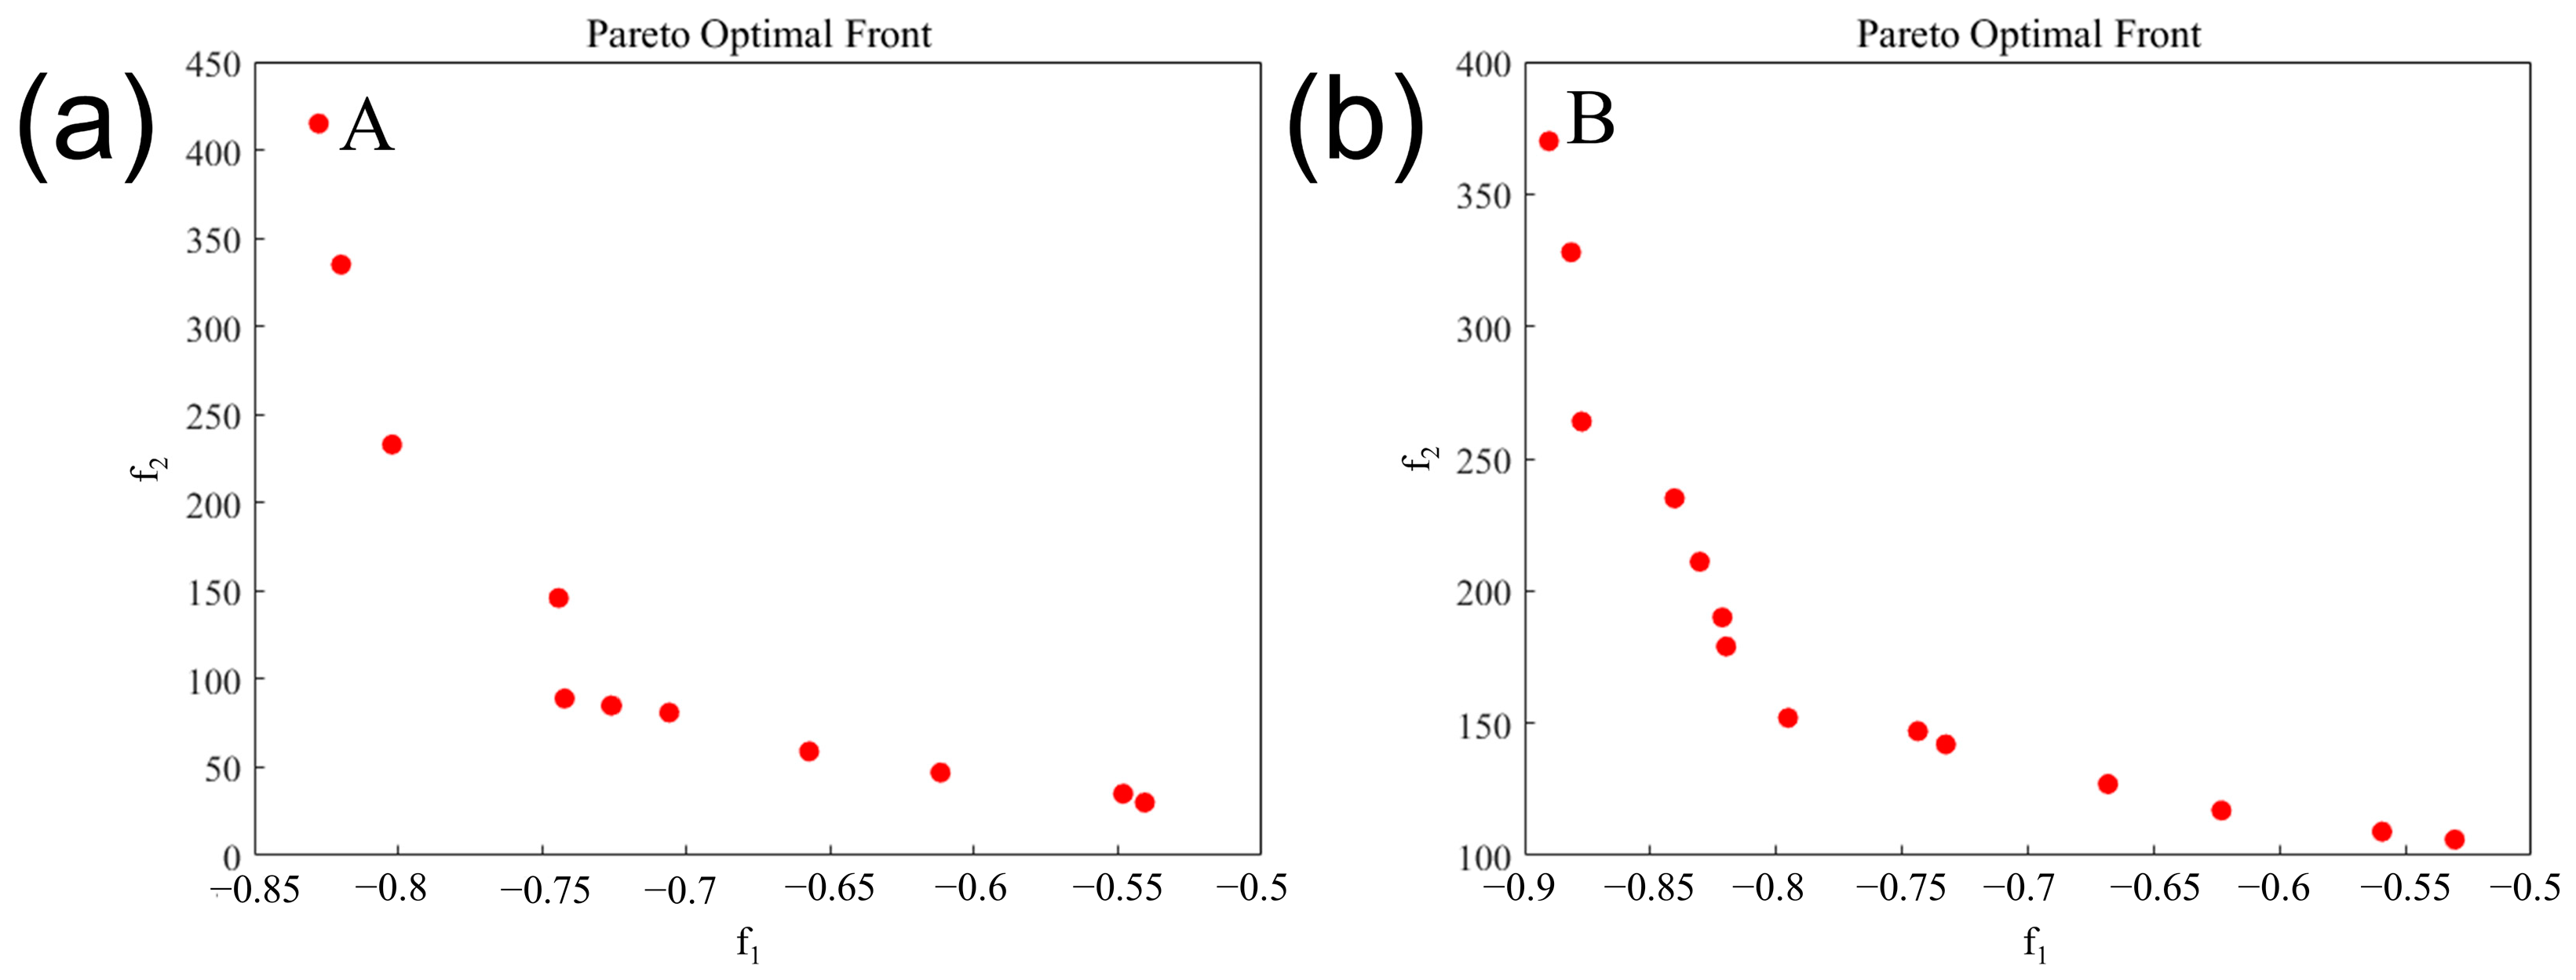
4.3. Multi-Objective Optimization Results Based on NSGA-II

The bounds of the decision variables for multi-objective optimization and the parameters of NSGA-II are listed in Table 2. Setting such a number of generations and probabilities is to ensure convergence while setting such a number of neurons in one layer is to improve the network search space. In this work, to improve the convergence speed of the NSGA-II and ensure accurate ANN architecture, the genetic algorithm was programmed such that the third hidden layer could have nonzero items only if the second layer existed. The evolution of the Pareto front during the iterative process is shown in Figure S4. The gradually increasing accuracy demonstrates the importance of exploring multiple hidden layers and nodes. By tracking the evolution of the Pareto front in each generation, it is found that the Pareto front gradually converges as the iteration proceeds.
Given that samples vary in their degree of agglomeration and that agglomeration has an impact on the smoothness of particle surfaces, this work also examined the impact of roughness descriptors (concave points, number of primary particles, maximal scaled depth of concavity) on the accuracy of the prediction model. Figure 10 shows the final Pareto front obtained by training with nine image descriptors (a) and 12 image descriptors (b), respectively. If the prediction accuracy is the single objective, point A (R2 = 0.8336, RMSE = 33.79 kg/m3) is considered the best solution in the Pareto front obtained in Figure 10a, while point B (R2 = 0.8903, RMSE = 15.02 kg/m3) is considered as the best solution in Figure 10b, which indicates that the importation of the roughness descriptors significantly improves the accuracy of the model after training. Therefore, there is a certain influence of the particle surface roughness on the product tapped bulk density for products with different agglomeration degrees.

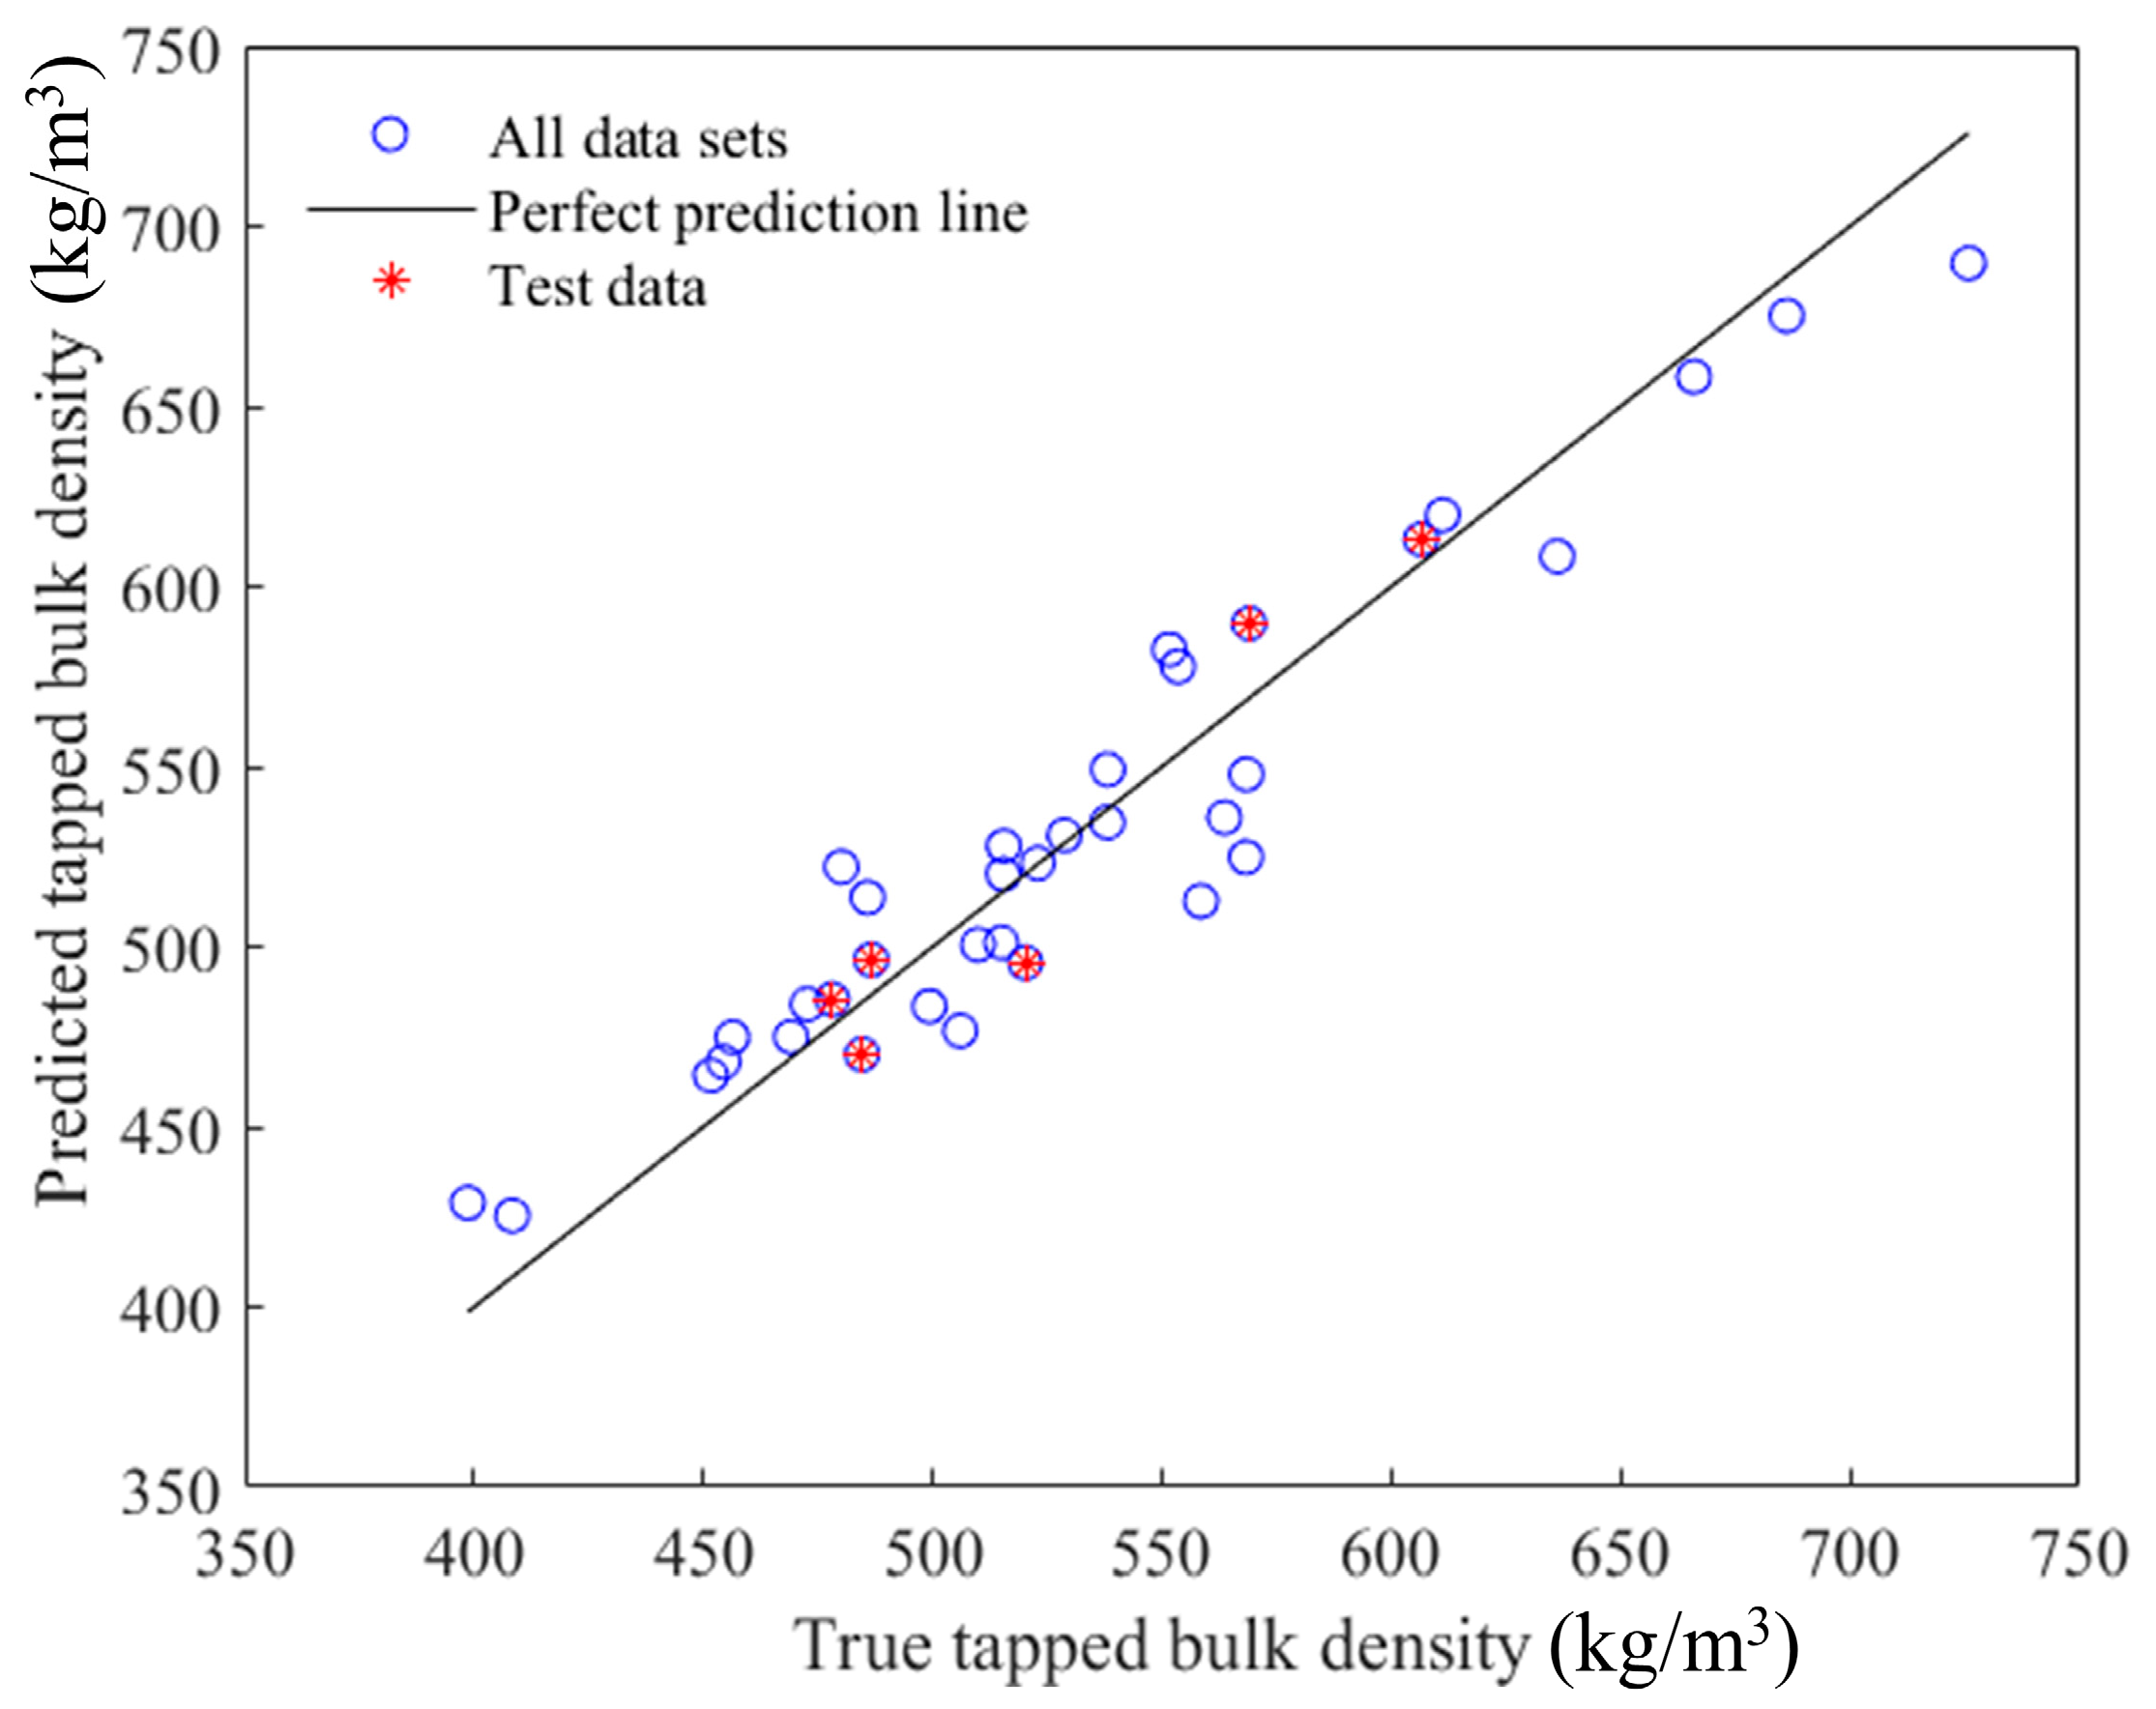
4.4. Selection of Optimal ANN Model Based on AIC

In this work Akaike Information Criterion (AIC) [44] was used to obtain the optimal ANN model from the list of Pareto solutions. A trade-off between prediction accuracy and the number of model parameters was made in this method. The list of Pareto solutions obtained after training and optimization using the selected 12 image descriptors is shown in Table S6. The optimal ANN model selected based on AIC has 264 parameters with five, eight and three nodes in the hidden layer, tansigmoid activation function in the hidden layer, and linear activation function for the neuron in the output layer. The performance of the model is shown in Figure 11, the coefficient of determination (R2) and root mean square error (RMSE) on the test set are 0.8773 and 17.15 kg/m3, respectively. In addition, the k-fold cross-validation method (k is 10) was used to train and evaluate the model according to the selected model architecture, with the coefficient of determination (R2) and root mean square error (RMSE) on the test set at this point being 0.8697 and 25.78 kg/m3, respectively. The R2 and RMSE on all data sets were 0.9016 and 8.32 kg/m3, respectively. Furthermore, the cross-validation error is evaluated as the mean value of validation error obtained in K runs. Therefore, the ANN model developed can be considered potentially useful for on-line prediction on this basis. More information about AIC is included in the Supporting Information.
In summary, the tapped bulk densities of raspberry ketones mainly depend on the shape of the particles and the particle size, which is also related to the roughness of the particles. Furthermore, since the obtained ANN model is independent of the preparation conditions of raspberry ketone with different degrees of agglomeration, this model is suitable for predicting the tapped bulk density of raspberry ketone. The ANN model developed in this work may be useful for developing model-based online process monitoring, compared to traditional time-consuming and labor-intensive offline bulk density tests. Image processing techniques that can obtain more accurate 3D information about particles may be applied to online process monitoring in the future.

5. Conclusions

By investigating the relationship between particle shape, roughness, size descriptors and the tapped bulk density, this work aims to develop an ANN model for online prediction of the tapped bulk density, which has the potential to be used for model-based online process monitoring. As an alternative to the conventional bulk density test, the developed model can improve plant efficiency and reduce operating costs. It was found that the image descriptors of raspberry ketone samples prepared under different conditions are different. The trends of the tapped bulk density versus the changes of the three typical descriptors (maximum Ferriter diameter, aspect ratio, and maximum scaled depression depth) are similar for the different particle size fractions. Subsequently, it was revealed that the surface roughness of the particles has a certain effect on the tapped bulk density by model training and optimization of the selected nine and 12 descriptors, respectively. Finally, the test results of the optimal ANN model selected by model evaluation indicated that the use of the shape, roughness, and size descriptors of raspberry ketone can be used to predict the tapped bulk density well.

Supplementary Materials

The following supporting information can be downloaded at: https://www.mdpi.com/article/10.3390/pr12050902/s1. Table S1: Detailed Experimental Conditions for Seeding Crystallization; Figure S1: (a) LLPS was observed by stopping the stirring and then standing for a period of time. (b) Oil droplets were observed under the microscope; Figure S2: (a) Microscope images of crystals with different degrees of agglomeration. (b) The images after image processing; Table S2: Ratios of different particle size fractions based on simplex-lattice design; Table S3: The 18 image descriptors extracted and their definitions; Table S4: Algorithm for Auto-tuning of parameters in ANNs; Table S5: The image descriptors represented by numbers 1 to 18; Figure S3: The mean values of the image descriptors for fine (a), medium (b), and coarse (c) particles of the four samples versus their tapped bulk densities; Figure S4: The evolution of pareto front with iterative process; Table S6. ANN model architecture on Pareto front ( training with 12 descriptors); Akaike Information Criterion(AIC); The detailed method for selecting the descriptors.

Author Contributions

Conceptualization, Methodology, Writing—Original draft, Visualization, X.Z.; Methodology, Resources, S.X.; Data curation, Investigation, Y.Y.; Formal analysis, Y.S.; Data curation, H.D.; Investigation, L.Q.; Formal analysis, C.L.; Writing—Review and Editing, Supervision, C.X. All authors participated in discussions and contributed to the review and editing of the manuscript. All authors have read and agreed to the published version of the manuscript.

Funding

This research received no external funding.

Data Availability Statement

The data presented in this study are available on request from the corresponding author.

Conflicts of Interest

The authors declare no conflicts of interest.

References

  1. Kalman, H.; Portnikov, D. Analyzing Bulk Density and Void Fraction: B. Effect of Moisture Content and Compression Pressure. Powder Technol. 2021, 381, 285–297. [Google Scholar] [CrossRef]
  2. Kalman, H.; Portnikov, D. Analyzing Bulk Density and Void Fraction: A. the Effect of Archimedes Number. Powder Technol. 2021, 381, 477–487. [Google Scholar] [CrossRef]
  3. Juliano, P.; Muhunthan, B.; Barbosa-Cánovas, G.V. Flow and Shear Descriptors of Preconsolidated Food Powders. J. Food Eng. 2006, 72, 157–166. [Google Scholar] [CrossRef]
  4. Sharma, A.; Jana, A.H.; Chavan, R.S. Functionality of Milk Powders and Milk-Based Powders for End Use Applications—A Review. Compr. Rev. Food Sci. Food Saf. 2012, 11, 518–528. [Google Scholar] [CrossRef]
  5. Jallo, L.J.; Ghoroi, C.; Gurumurthy, L.; Patel, U.; Davé, R.N. Improvement of Flow and Bulk Density of Pharmaceutical Powders Using Surface Modification. Int. J. Pharm. 2012, 423, 213–225. [Google Scholar] [CrossRef] [PubMed]
  6. Nijdam, J.J.; Langrish, T.A.G. An Investigation of Milk Powders Produced by a Laboratory-Scale Spray Dryer. Dry. Technol. 2005, 23, 1043–1056. [Google Scholar] [CrossRef]
  7. Abdullah, E.C.; Geldart, D. The Use of Bulk Density Measurements as Flowability Indicators. Powder Technol. 1999, 102, 151–165. [Google Scholar] [CrossRef]
  8. Kalman, H. Effect of Particle Shape on Void Fraction. Powder Technol. 2022, 407, 117665. [Google Scholar] [CrossRef]
  9. Kalman, H. Bulk Densities and Flowability of Non-Spherical Particles with Mono-Sized and Particle Size Distributions. Powder Technol. 2022, 401, 117305. [Google Scholar] [CrossRef]
  10. Bhandari, B. Spray drying and powder properties. In Food Drying Science and Technology: Microbiology, Chemistry, Applications; DEStech Publications, Inc.: Lancaster, PA, USA, 2008; pp. 215–249. [Google Scholar]
  11. Pisecky, J. Handbook of Milk Powder Manufacture; Niro: Søborg, Denmark, 1997; ISBN 978-87-986606-0-6. [Google Scholar]
  12. Gaiani, C.; Ehrhardt, J.J.; Scher, J.; Hardy, J.; Desobry, S.; Banon, S. Surface Composition of Dairy Powders Observed by X-Ray Photoelectron Spectroscopy and Effects on Their Rehydration Properties. Colloids Surf. B Biointerfaces 2006, 49, 71–78. [Google Scholar] [CrossRef]
  13. Elmaz, F.; Büyükçakır, B.; Yücel, Ö.; Mutlu, A.Y. Classification of Solid Fuels with Machine Learning. Fuel 2020, 266, 117066. [Google Scholar] [CrossRef]
  14. Zhong, H.; Xiong, Q.; Yin, L.; Zhang, J.; Zhu, Y.; Liang, S.; Niu, B.; Zhang, X. CFD-Based Reduced-Order Modeling of Fluidized-Bed Biomass Fast Pyrolysis Using Artificial Neural Network. Renew. Energy 2020, 152, 613–626. [Google Scholar] [CrossRef]
  15. Hu, L.; Zhang, J.; Xiang, Y.; Wang, W. Neural Networks-Based Aerodynamic Data Modeling: A Comprehensive Review. IEEE Access 2020, 8, 90805–90823. [Google Scholar] [CrossRef]
  16. Jin, Y. A Comprehensive Survey of Fitness Approximation in Evolutionary Computation. Soft Comput. 2005, 9, 3–12. [Google Scholar] [CrossRef]
  17. Yahya, H.S.M.; Abbas, T.; Amin, N.A.S. Optimization of Hydrogen Production via Toluene Steam Reforming over Ni–Co Supported Modified-Activated Carbon Using ANN Coupled GA and RSM. Int. J. Hydrog. Energy 2021, 46, 24632–24651. [Google Scholar] [CrossRef]
  18. Randolph, A.D.; Larson, M.A. Chapter 3—The Population Balance. In Theory of Particulate Processes, 2nd ed.; Randolph, A.D., Larson, M.A., Eds.; Academic Press: Cambridge, MA, USA, 1988; pp. 50–79. ISBN 978-0-12-579652-1. [Google Scholar]
  19. Singh, M.; Singh, R.; Singh, S.; Walker, G.; Matsoukas, T. Discrete Finite Volume Approach for Multidimensional Agglomeration Population Balance Equation on Unstructured Grid. Powder Technol. 2020, 376, 229–240. [Google Scholar] [CrossRef]
  20. Szilágyi, B.; Agachi, P.Ş.; Lakatos, B.G. Numerical Analysis of Crystallization of High Aspect Ratio Crystals with Breakage. Powder Technol. 2015, 283, 152–162. [Google Scholar] [CrossRef]
  21. Guo, Z.; Zhao, W.; Lu, H.; Wang, J. Multi-Step Forecasting for Wind Speed Using a Modified EMD-Based Artificial Neural Network Model. Renew. Energy 2012, 37, 241–249. [Google Scholar] [CrossRef]
  22. Miriyala, S.S.; Pujari, K.N.; Naik, S.; Mitra, K. Evolutionary Neural Architecture Search for Surrogate Models to Enable Optimization of Industrial Continuous Crystallization Process. Powder Technol. 2022, 405, 117527. [Google Scholar] [CrossRef]
  23. Miriyala, S.S.; Mitra, K. Deep Learning Based System Identification of Industrial Integrated Grinding Circuits. Powder Technol. 2020, 360, 921–936. [Google Scholar] [CrossRef]
  24. Wu, J.; Chen, X.-Y.; Zhang, H.; Xiong, L.-D.; Lei, H.; Deng, S.-H. Hyperparameter Optimization for Machine Learning Models Based on Bayesian Optimizationb. J. Electron. Sci. Technol. 2019, 17, 26–40. [Google Scholar] [CrossRef]
  25. Wu, J.; Chen, S.; Liu, X. Efficient Hyperparameter Optimization through Model-Based Reinforcement Learning. Neurocomputing 2020, 409, 381–393. [Google Scholar] [CrossRef]
  26. Jiao, D.; Shi, C.; Yuan, Q.; An, X.; Liu, Y. Mixture Design of Concrete Using Simplex Centroid Design Method. Cem. Concr. Compos. 2018, 89, 76–88. [Google Scholar] [CrossRef]
  27. Otsu, N. A Threshold Selection Method from Gray-Level Histograms. IEEE Trans. Syst. Man Cybern. 1979, 9, 62–66. [Google Scholar] [CrossRef]
  28. Hasan, B.M.S.; Abdulazeez, A.M. A Review of Principal Component Analysis Algorithm for Dimensionality Reduction. J. Soft Comput. Data Min. 2021, 2, 20–30. [Google Scholar]
  29. Pan, A.; Bosch, D.; Ma, H. Assessing Water Poverty in China Using Holistic and Dynamic Principal Component Analysis. Soc. Indic. Res. 2017, 130, 537–561. [Google Scholar] [CrossRef]
  30. Wold, S.; Esbensen, K.; Geladi, P. Principal Component Analysis. Chemom. Intell. Lab. Syst. 1987, 2, 37–52. [Google Scholar] [CrossRef]
  31. Mathew, R.K.; Begum, K.M.M.S.; Anantharaman, N. Hydrodynamic Studies on Fluidized Beds with Internals: Experimental and ANN Approach. Powder Technol. 2014, 264, 423–429. [Google Scholar] [CrossRef]
  32. Krishna, M.S.V.; Begum, K.M.M.S.; Anantharaman, N. Hydrodynamic Studies in Fluidized Bed with Internals and Modeling Using ANN and ANFIS. Powder Technol. 2017, 307, 37–45. [Google Scholar] [CrossRef]
  33. Serrano, D.; Golpour, I.; Sánchez-Delgado, S. Predicting the Effect of Bed Materials in Bubbling Fluidized Bed Gasification Using Artificial Neural Networks (ANNs) Modeling Approach. Fuel 2020, 266, 117021. [Google Scholar] [CrossRef]
  34. Chew, J.W.; Cocco, R.A. Application of Machine Learning Methods to Understand and Predict Circulating Fluidized Bed Riser Flow Characteristics. Chem. Eng. Sci. 2020, 217, 115503. [Google Scholar] [CrossRef]
  35. Argatov, I.I.; Chai, Y.S. An Artificial Neural Network Supported Regression Model for Wear Rate. Tribol. Int. 2019, 138, 211–214. [Google Scholar] [CrossRef]
  36. Nguyen, H.; Bui, X.-N. Predicting Blast-Induced Air Overpressure: A Robust Artificial Intelligence System Based on Artificial Neural Networks and Random Forest. Nat. Resour. Res. 2019, 28, 893–907. [Google Scholar] [CrossRef]
  37. Taherei Ghazvinei, P.; Hassanpour Darvishi, H.; Mosavi, A.; Yusof, K. bin W.; Alizamir, M.; Shamshirband, S.; Chau, K. Sugarcane Growth Prediction Based on Meteorological Parameters Using Extreme Learning Machine and Artificial Neural Network. Eng. Appl. Comput. Fluid Mech. 2018, 12, 738–749. [Google Scholar] [CrossRef]
  38. Kemppinen, J.; Niittynen, P.; Riihimäki, H.; Luoto, M. Modelling Soil Moisture in a High-Latitude Landscape Using LiDAR and Soil Data. Earth Surf. Process. Landf. 2018, 43, 1019–1031. [Google Scholar] [CrossRef]
  39. Zhong, H.; Sun, Z.; Zhu, J.; Zhang, C. Prediction of Solid Holdup in a Gas–Solid Circulating Fluidized Bed Riser by Artificial Neural Networks. Ind. Eng. Chem. Res. 2021, 60, 3452–3462. [Google Scholar] [CrossRef]
  40. Deb, K.; Pratap, A.; Agarwal, S.; Meyarivan, T. A Fast and Elitist Multiobjective Genetic Algorithm: NSGA-II. IEEE Trans. Evol. Comput. 2002, 6, 182–197. [Google Scholar] [CrossRef]
  41. Li, S.; Deng, Z.; Liu, J.; Liu, D. Multi-Objective Optimization of Plate-Fin Heat Exchangers via Non-Dominated Sequencing Genetic Algorithm (NSGA-II). Appl. Sci. 2022, 12, 11792. [Google Scholar] [CrossRef]
  42. Gao, C.; Lan, X.; He, Z.; Xin, G.; Wang, X.; Xin, Q. Temperature Uniformity Analysis and Multi-Objective Optimization of a Small-Scale Variable Density Alternating Obliquely Truncated Microchannel. Therm. Sci. Eng. Prog. 2023, 38, 101652. [Google Scholar] [CrossRef]
  43. Abolpour, B.; Hekmatkhah, R.; Shamsoddini, R. Multi-Objective Optimum Design for Double Baffle Heat Exchangers. Therm. Sci. Eng. Prog. 2021, 26, 101132. [Google Scholar] [CrossRef]
  44. Akaike, H. Factor Analysis and AIC. Psychometrika 1987, 52, 317–332. [Google Scholar] [CrossRef]
Figure 1. Particle size fraction choice.
Processes 12 00902 g001
Figure 2. Schematic illustration of image descriptors.
Processes 12 00902 g002
Figure 3. Pictorial representation of an artificial neural network.
Processes 12 00902 g003
Figure 4. Flowsheet of the neural architecture search strategy.
Processes 12 00902 g004
Figure 5. Flow chart of NSGA-II usage.
Processes 12 00902 g005
Figure 6. (a) PCA score plots for the first two principal components of 12 samples. (b) PCA loading plot of the first two principal components distinguishing the relationship between the different image descriptors. The image descriptors represented by numbers 1 to 18 in the figure are shown in Table S5.
Processes 12 00902 g006
Figure 7. Schematic illustration for selecting variables with large variance in the selected image descriptors. y represents the value of the cumulative distribution function, and x represents the number of concave points. The a–d in the figure represent the corresponding points on the curve.
Processes 12 00902 g007
Figure 8. The empirical cumulative distribution curves of the image descriptors for fine (a), medium (b) and coarse (c) particles.
Processes 12 00902 g008
Figure 9. The values of the image descriptors for fine (a), medium (b), and coarse (c) particles of the four samples versus their tapped bulk densities.
Processes 12 00902 g009
Figure 10. (a) Final Pareto front obtained by training using nine descriptors. (b) Final Pareto front obtained by training using 12 descriptors (including roughness descriptors). The functions f1 and f2 represent the prediction accuracy and the number of model parameters, respectively. A and B are considered to be the best solution points in the Pareto front in the figure (with the prediction accuracy as a single objective).
Processes 12 00902 g010
Figure 11. ANN model performance.
Processes 12 00902 g011
Table 1. The mean value and standard deviation of the tapped bulk densities of samples with different particle size fraction ratios.
Mixture RatioTapped Bulk Density (kg/m3)
FineMediumCoarseSample 1 aSample 2 bSample 3 cSample 4 d
100611.2 ± 1.5515.4 ± 0.3558.5 ± 1.3569.0 ± 1.1
010612.5 ± 1.7408.3 ± 1.1528.7 ± 2.2506.0 ± 2.4
001484.6 ± 2.6398.6 ± 1.8515.0 ± 3.3454.4 ± 3.2
01/21/25155 ± 3.2578.1 ± 1.7486.6 ± 1.8485.8 ± 1.3
1/201/2538.1 ± 1.5499.3 ± 1.1606.5 ± 3.1459.6 ± 2.1
1/21/20725.9 ± 1.0508.7 ± 0.6551.6 ± 0.8522.9 ± 1.1
1/61/62/3472.7 ± 2.3452.6 ± 1.2509.9 ± 1.1568.3 ± 3.7
1/62/31/6538.2 ± 1.7445.2 ± 1.3480.1 ± 2.6478.1 ± 2.1
2/31/61/6545.8 ± 0.3571.5 ± 0.6686.2 ± 1.5636.2 ± 1.8
1/31/31/3730.1 ± 1.0499.6 ± 1.5666.0 ± 1.7563.6 ± 2.0
a Note: Sample 1 was obtained during the conditions of adding large-sized seeds (75–100 μm) before LLPS (liquid-liquid phase separation). b Note: Sample 2 was obtained during the conditions of adding small-sized seeds (150–180 μm) before LLPS (liquid-liquid phase separation). c Note: Sample 3 was obtained during the conditions of adding large-sized seeds (75–100 μm) after LLPS (liquid-liquid phase separation). d Note: Sample 4 was obtained during the conditions of adding small-sized seeds (150–180 μm) after LLPS (liquid–liquid phase separation).
Table 2. List of parameters used in the neural architecture search algorithm for optimal ANN.
ParameterValue
Number of decision variables in NSGA-II4
Number of population and generations in NSGA-II100 and 100
Mutation and Crossover Probability in NSGA-II0.01 and 0.9
Choice of activation functionnonlinear activation function (tansigmoid, logsigmoid)
Lower and upper bound on number of hidden layers1 and 3
Lower and upper bound on nodes in each hidden layer{1, 0, 0} and {15, 15, 15}
Disclaimer/Publisher’s Note: The statements, opinions and data contained in all publications are solely those of the individual author(s) and contributor(s) and not of MDPI and/or the editor(s). MDPI and/or the editor(s) disclaim responsibility for any injury to people or property resulting from any ideas, methods, instructions or products referred to in the content.

