Article

Numerical Simulation and Environmental Impact Assessment of VOCs Diffusion Based on Multi-Emission Sources in the Natural Gas Purification Plant

1
Jiangsu Provincial Key Laboratory of Oil and Gas Storage and Transportation Technology, Engineering Technology Research Center for Oil Vapor Recovery, Changzhou University, Changzhou 213164, China
2
Institute of Oil and Gas Technology, PetroChina Changqing Oilfield Co., Xi’an 710016, China
*
Author to whom correspondence should be addressed.
Processes 2024, 12(2), 364; https://doi.org/10.3390/pr12020364
Submission received: 13 January 2024 / Revised: 4 February 2024 / Accepted: 7 February 2024 / Published: 9 February 2024

Abstract

:
The rising number of natural gas purification plants has raised concerns about safety and environmental issues related to VOC (Volatile Organic Compounds) leakage. Therefore, it is crucial to conduct in-depth research on oil vapor emission patterns in these plants. Taking a typical natural gas purification plant as an example, a 1:1 scale model was established. Using methanol as the simulated medium, a study was conducted to investigate the impact of multiple leaks on the dispersion process of VOCs at the plant, combining field sampling with numerical simulation. The results indicate that wind speed influences the concentration of oil vapor, particularly on the leeward side, where vortex and reflux phenomena occur. The area of high concentration of oil vapor at v = 4 m·s−1 is eight times that at v = 8 m·s−1. Gravity and eddy currents contribute to the accumulation of oil vapor, especially closer to the central area of the plant where surrounding buildings obstruct dispersion. Smaller distances between leakage sources result in higher concentrations of oil vapor in the central region, leading to a larger affected area in the event of an accident. The study holds significant practical significance for the research, prevention, and management of leakage and dispersion incidents.

1. Introduction

As the pillar industry of a country, natural gas purification plants are a valuable indicator of its industrialization level [1,2,3,4,5]. As an upstream enterprise in this industry, the development of natural gas purification plants is particularly significant. The primary processes of natural gas purification plants include gas gathering, desulfurization, dehydration, gas distribution, etc. During these processes, a considerable amount of flammable, explosive, corrosive, and toxic substances are involved [6]. A small and rare incident could lead to serious consequences [7]. Not only does it pollute the environment, but it also poses a serious threat to the health, safety, and environment (HSE) of businesses and society [8,9,10]. According to accident statistics from the International Association of Oil and Gas Producers (OGP), natural gas purification plants are considered high-risk areas for accidents, resulting in significant losses [11]. During the routine operational processes of natural gas purification plants, various components such as dome roof tank vent valves and dehydrating tanks contribute to the emission of volatile organic compounds (VOCs). Some scholars used CFD numerical simulation that conducted predictive modeling analysis on various aspects, including methanol leakage, and also analyzed the occupational risks (such as personnel poisoning) associated with methanol tank leaks. This is aimed at exploring corresponding control measures to reduce the occurrence of occupational hazards [12,13]. China has put forward the goal of accelerating the comprehensive control of VOC emissions. By the year 2025, there is a targeted reduction of over 10% in the total VOC emissions [14,15,16,17]. This article takes a natural gas purification plant in the Changqing Oilfield as an example, conducting on-site investigations and data collection. Previous studies by scholars have analyzed and detected VOCs at the Oilfield station, revealing that the main sources of VOCs at the oilfield station are emissions from open liquid surfaces and tank leaks [18]. After conducting research, it was found that various stages of the natural gas purification plant are associated with VOC emissions, such as product methanol tanks, raw material methanol wastewater tanks, methanol wastewater receiving tanks, dehydration tanks, and sewage tanks. Since 2010, China has gradually enacted policies and standards that specify the VOC emission limits for oil and gas processing units and wastewater, as well as organic waste gas collection and treatment units, at 25 g m−3 and 120 mg m−3, respectively (calculated as non-methane total hydrocarbons, NMHC. Therefore, conducting on-site investigations into the sources of VOCs from storage tanks, sewage tanks, and dehydration tanks within natural gas purification plants and studying the dispersion patterns of their VOC emissions holds significant practical and theoretical value.
Currently, methods for studying the dispersion patterns of oil vapor volatilization primarily include on-site testing, laboratory simulation experiments, and numerical simulations [19,20,21,22,23,24]. Numerical simulation using Computational Fluid Dynamics (CFD) and ANSYS 2020R2 is highly practical, with broad applications in aerospace, automotive, energy, chemical engineering, materials, biomedicine, and other fields [25]. Lapuerta et al. proposed logarithmic equations to estimate the diffusion coefficients of each alcohol through simulation. Finally, four-parameter equations for the studied five alcohols were presented, demonstrating good consistency [26]. Kountouriotis et al. utilized CFD to examine the dispersion patterns of gasoline vapors with varying compositions under different influencing factors. The study reveals that in the vicinity of the oil vapor dispersion source, the concentration of oil vapors surpasses the explosive limits significantly [27]. Tominaga et al. elucidated the recent advancements in the study of pollutant dispersion around obstacles such as streets using CFD methods. They underscored the significance of model selection and compared the distinctions among different dispersion models [28].
In recent years, there has been extensive research conducted globally on the diffusion of combustible gases. Concerning the dispersion of oil vapor, the focus has primarily centered on the evaporation and diffusion of oil vapors within the interior of oil tanks [29]. Despite that, there has been relatively limited research on the dispersion patterns of oil vapors outside the tanks and even within large tank areas. Some research findings primarily focus on the simulation of dispersion from a single emission source in oilfield stations. However, there is a lack of information on related studies regarding the dispersion patterns of oil vapor from multiple emission sources within natural gas field stations. This study focuses on multiple emission sources in a large-scale natural gas purification plant. Combining CFD numerical simulation with on-site research data aims to provide a clearer and more accurate depiction of the entire leakage dispersion process, thereby understanding the mechanisms of oil vapor dispersion under normal operating conditions. Methanol was used as the simulation medium. By mastering technical parameters such as the range, rate, and concentration distribution of oil vapor dispersion, accurate identification of explosive hazard zones, acute toxicity zones, and safe zones becomes possible. This enables the provision of effective emergency response measures on-site, reducing environmental harm and minimizing accident losses to the greatest extent. This research not only holds reference value for the operational management and control of oil vapor emissions in the petroleum and petrochemical industry but also bears significant practical importance in the study, prevention, and handling of leakage dispersion incidents.

2. Materials and Methods

The research methodology of this study involves on-site sampling and numerical simulation. Taking a large-scale natural gas purification plant as an example, methanol is used as a simulation medium. On-site sampling and numerical simulation are combined to verify the accuracy of the CFD model. Subsequently, based on the validated numerical model, the study investigates the cumulative effects of multi-source VOC emissions from the entire natural gas purification plant and their impact on surrounding buildings.

2.1. Governing Equations and Turbulence Models

2.1.1. Fundamental governing equation

The fundamental governing equations for the flow of oil vapor dispersion include the mass conservation equation, momentum conservation equation, energy conservation equation, and component transport equation. The general forms of these governing equations are expressed as Equations (1) and (2). [30]. The specific parameters of the general conservation equation are shown in Table 1.
ρ Φ t + d i v ρ u Φ = d i v Γ g r a d Φ + S
ρ Φ t + ρ u Φ x + ρ v Φ x + ρ w Φ x = x Γ Φ x + y Γ Φ y + z Γ Φ z + S
where ρ is gas mixture density, u is the velocity vector, Φ is the universal vector, Γ is the generalized diffusion coefficient, and S is the generalized source term.

2.1.2. Turbulence Equation

Under the influence of wind speed, the fluid flow of oil vapor within the natural gas purification plant is in a turbulent state. The Realizable k-ε model, which is capable of representing turbulent conditions, can effectively describe the airflow disturbances and oil vapor dispersion within the plant [31]. Therefore, this study adopts this model with the equations given by Equations (3) and (4), where the calculation for Cl is provided in Equation (5).
t ( ρ ε ) + x j ( ρ ε u j ) = x j μ + μ t σ ε ε x j + ρ C 1 S ε ρ C 2 ε 2 k + ν ε + C 1 ε ε k C 3 ε G b + S ε
C 1 = m a x 0.43 , η η + 5 ,   S = 2 S i j S i j
where ρ is gas mixture density (kg·m−3); u is velocity vector; Sk, Sε is user-defined source entry; Pk is turbulent kinetic energy generated by laminar velocity gradient (m2·s−2); Gk is turbulent kinetic energy caused by mean velocity gradient (m2·s−2); μ is the dynamic viscosity of oil vapor (Pa·s); K is turbulent kinetic energy (m2·s−2); Gb is turbulent kinetic energy generated by buoyancy (m2·s−2); ε is dissipation rate (m2·s−3); η is effective factor; YM is fluctuations resulting from transition diffusion in compressible turbulence (m2·s−2); C, C, C is empirical constant; σk and σ are the prande numbers corresponding to the k equation and the ε equation; the subscripts i and j in xi and μi indicate the scores in the x, y and z directions respectively (m·s−1).

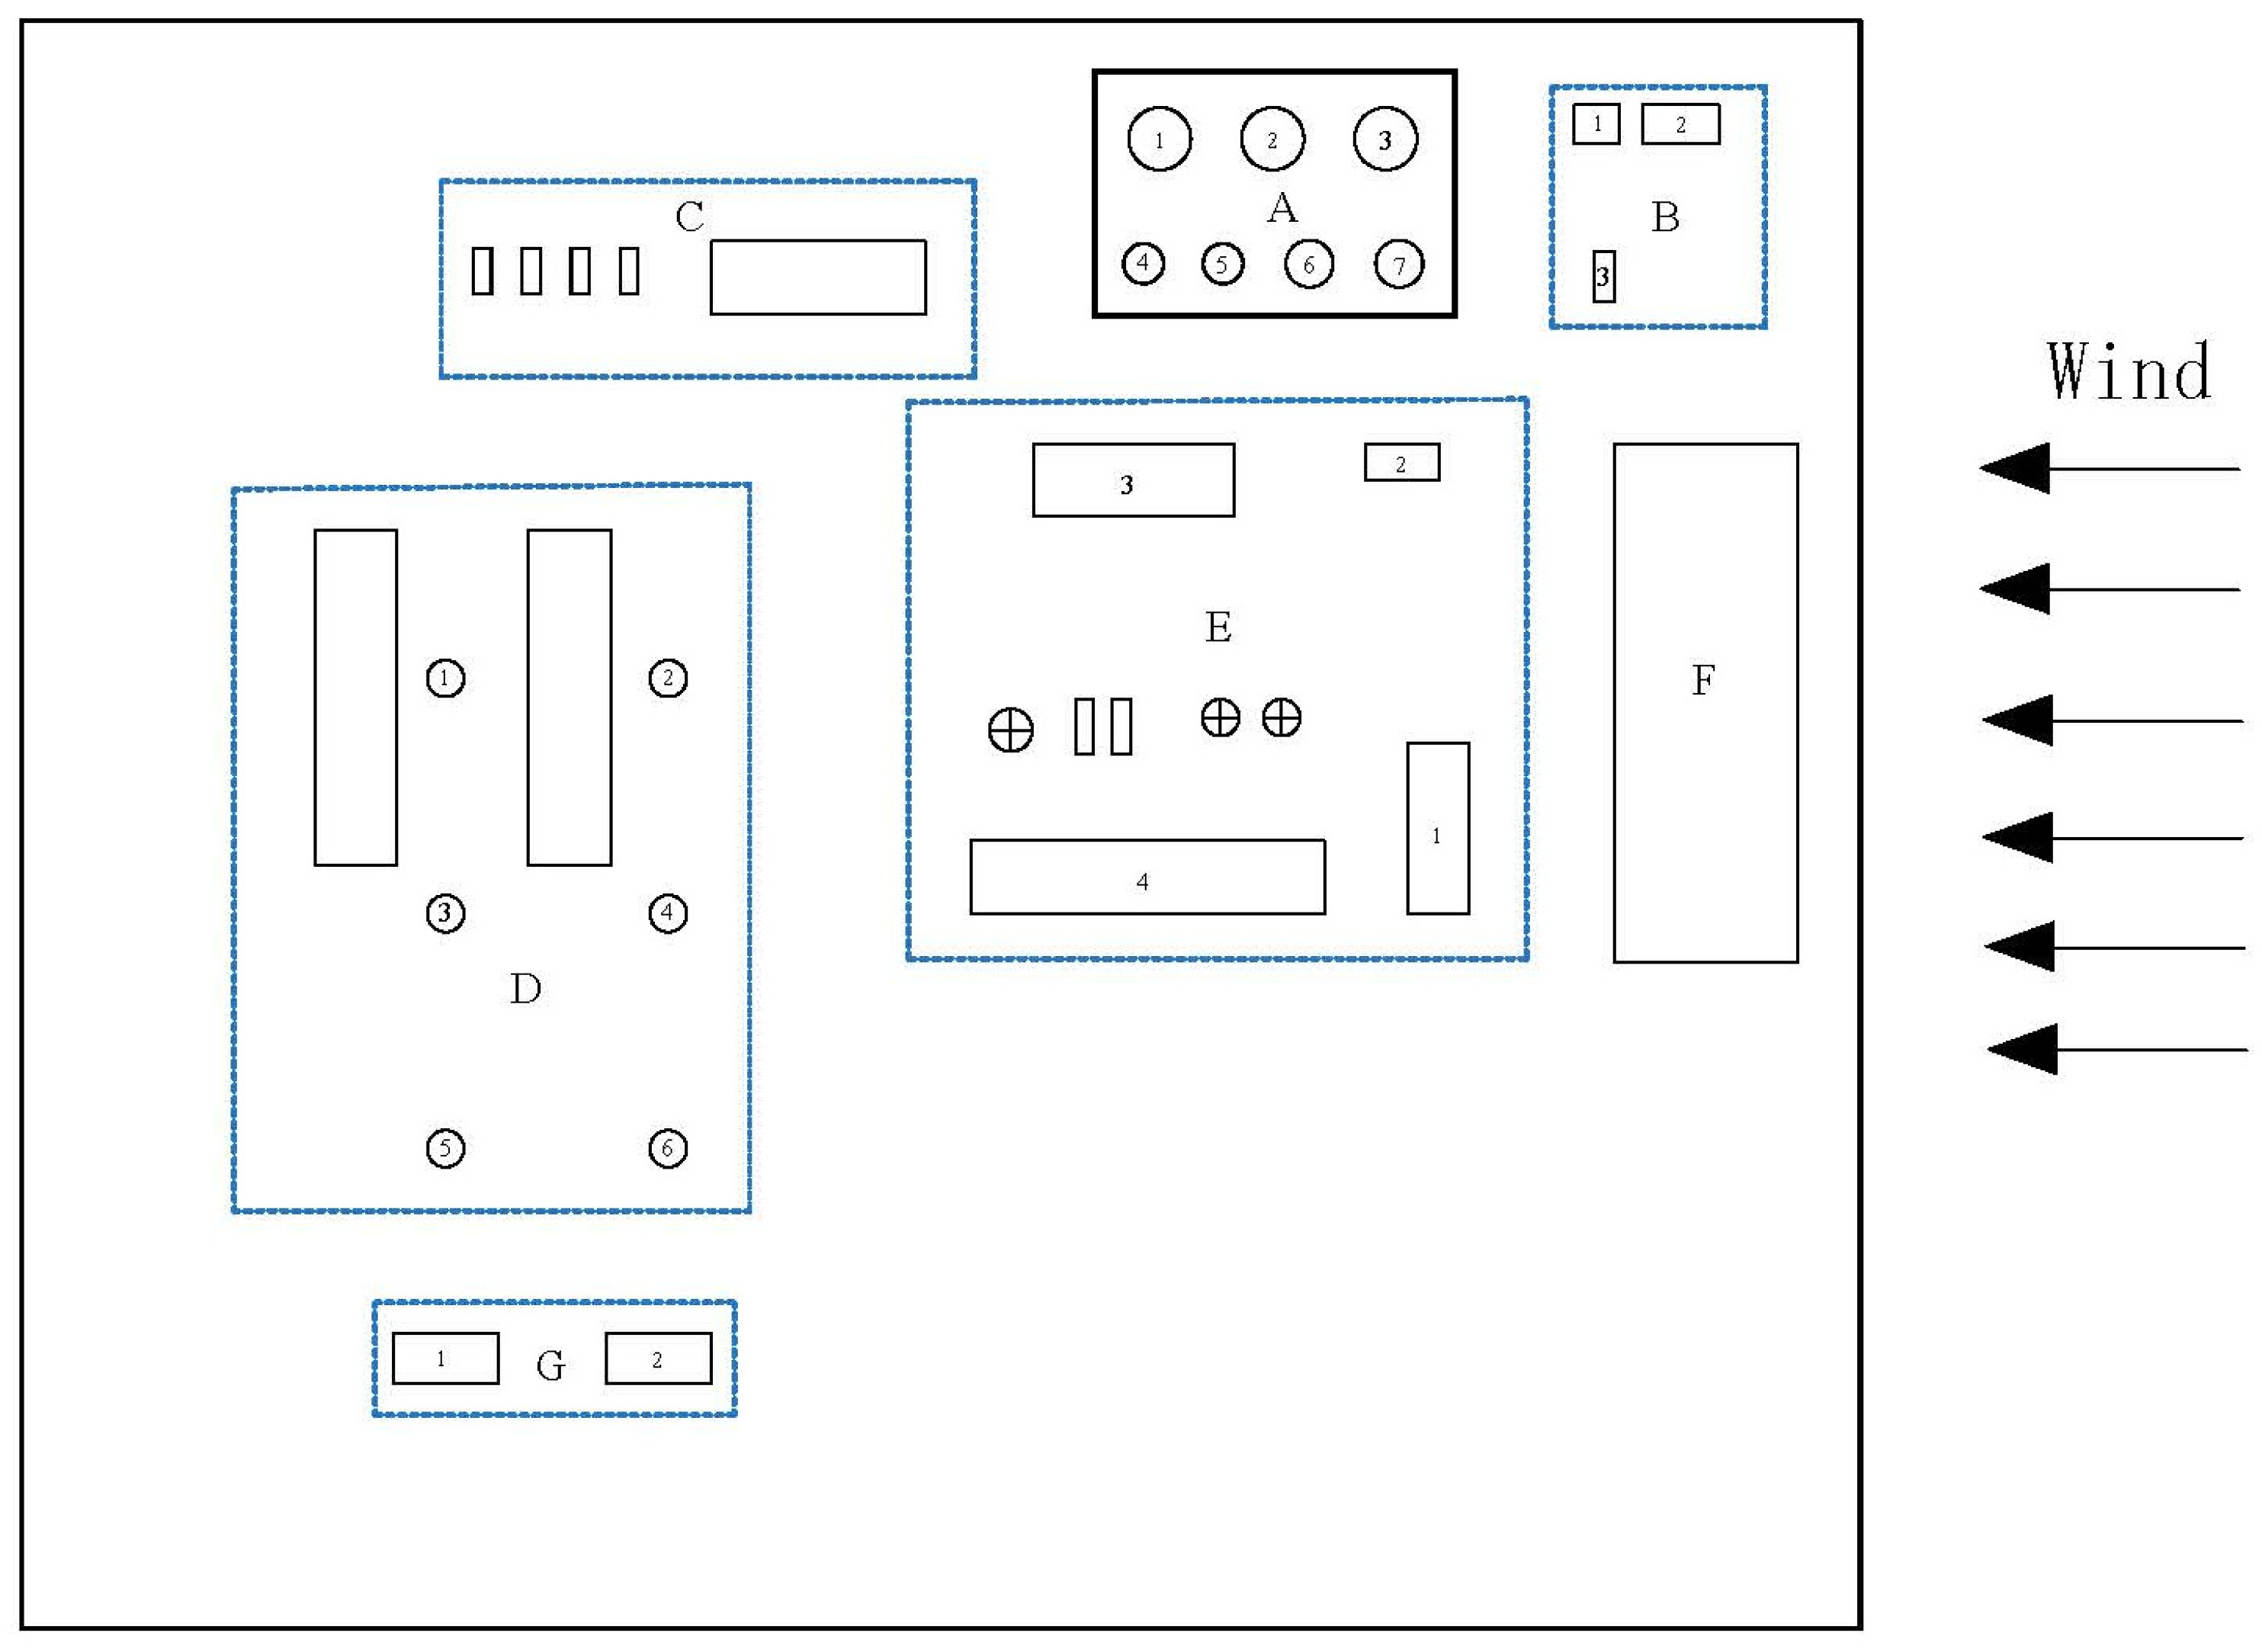
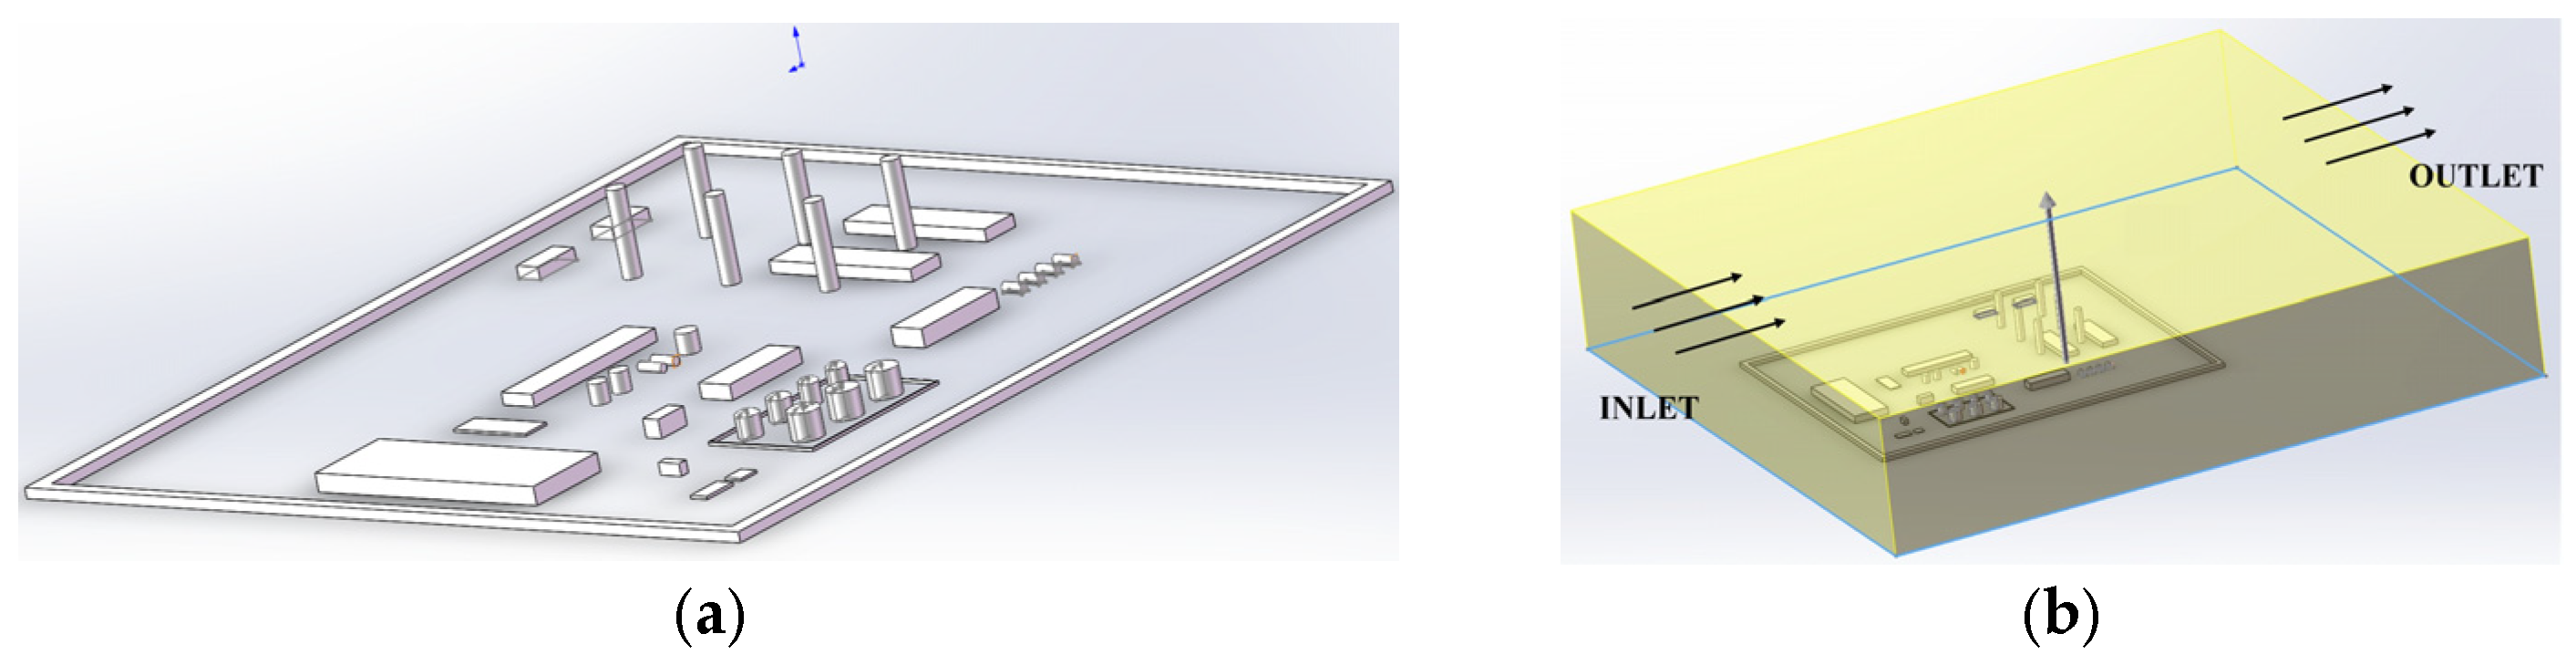
2.2. Model and Boundary Conditions

A specific typical natural gas purification plant was selected as the research subject, and on-site inspections were conducted. The overall design capacity of this natural gas purification plant is 30 × 108 m3 per year for processing natural gas. For the convenience of subsequent simulation result analysis, the structures within the purification plant are labeled with numbers, as shown in Figure 1. It mainly includes 7 dome roof tanks labeled as A1–A7 (where A1, A2, and A3 are 700 m3 raw material methanol wastewater tanks, A4 and A5 are 200 m3 methanol wastewater receiving tanks, and A6 and A7 are 300 m3 product methanol tanks). B1 is a cesspit, B2 and B3 are drying pools, Area C consists of exhaust gas treatment facilities, Area D includes two sets of natural gas purification units (D1–D6 is a desulfurization tower with a height of 40 m), Area E comprises a sewage treatment system (with E1 being the alcohol wastewater tank), Area F is a nitrogen station, and Area G serves as office space. The overall site dimensions are 312 m in length and 261 m in width, with specific parameters for the tanks outlined in Table 2. Specific dimensions of the sewage tank and the drying tank are shown in Table 3. The leakage port of the tank in Area A is the tank top breathing valve, and the size of the breathing valve is Φ 0.2 × 0.5 m. The open liquid surface size of B2 is 3.7 × 3.8 m, and the rest of B1, B3, and E1 are open liquid surfaces.
Through on-site investigations, it was found that the technical control level in the Area CDF is high, with good sealing conditions, and all emission sources meet the standards. The multiple emission sources of oil vapor in the natural gas purification plant are mainly located at the breather valves of the product methanol tanks in Area A, the sewage tank and drying pool in Area B, and the sewage tank in Area E. The oil vapor emissions from the dome roof tank breather valves primarily stem from the large and small breath losses during the inflow and outflow of oil from the tanks. The drying pool and sewage tank result in the direct dispersion of oil sludge waste gas into the environment due to incomplete sealing treatment. Based on on-site investigations, the average annual wind speed at the purification plant is determined to be 6 m·s−1. By simulating leaks under different wind speeds (4 m·s−1, 6 m·s−1, 8 m·s−1) during normal operating conditions at the purification plant, the study aims to explore the impact of major leakage sources on the overall site. A 3D geometric model of the purification plant, scaled 1:1 with the actual dimensions (see Figure 2a), and a schematic diagram of the external computational domain (Figure 2b) were established for this purpose.
Due to the complexity of the buildings and oil tanks in the natural gas purification plant, a non-structured mesh is suitable for adapting to such intricate models. ANSYS Meshing 2020R2 was used to generate a three-dimensional mesh, as illustrated in Figure 3. The wind speed of the flow field enters in the opposite direction along the x-axis. The inlet of the computational domain is set as a velocity-inlet boundary condition, the outlet is set as a pressure-outlet boundary condition, and the outer side of the computational domain is set as symmetry. The oil vapor dispersion source is set as a mass flow boundary condition, with the mass flow rate set to the measured value at the purification plant site. The pressure and velocity were coupled using the SIMPLE scheme, and the spatial discretization of pressure was based on the Standard algorithm. The mesh size for the oil vapor dispersion source in the model constructed in this paper was small, prompting the choice of a double-precision solution.

2.3. Grid Independence Verification

This article uses an unstructured grid generated by ANSYS Meshing 2020R2 to create a hybrid grid. The selection of grid sizes ensures the accuracy of the numerical model. Therefore, this study conducts grid independence verification using four different global grid quantities: 877,650; 1,380,025; 2,202,403; and 2,902,573. In the numerical simulation of oil and gas diffusion in the tank area, wind speed has a significant impact on the dispersion of oil and gas. After the calculation reaches a steady state, the velocity changes at a position 2 m above the center of the A7 tank are observed for the four grid sizes. The wind speed at the inlet is set to 6 m·s−1. The specific results of grid independence verification are shown in Table 4.
As seen in Table 4, the wind speed varies with changes in the grid count. When the grid count increases from 877,650 to 2,202,403, there is a significant change in the velocity along the X-axis. However, when the grid count increases to around 2.2 million, the wind speed no longer changes. This indicates that the grid count is sufficient for the calculations and meets the requirements of grid independence. Therefore, the subsequent grid counts were selected with reference to a count of around 2.2 million.

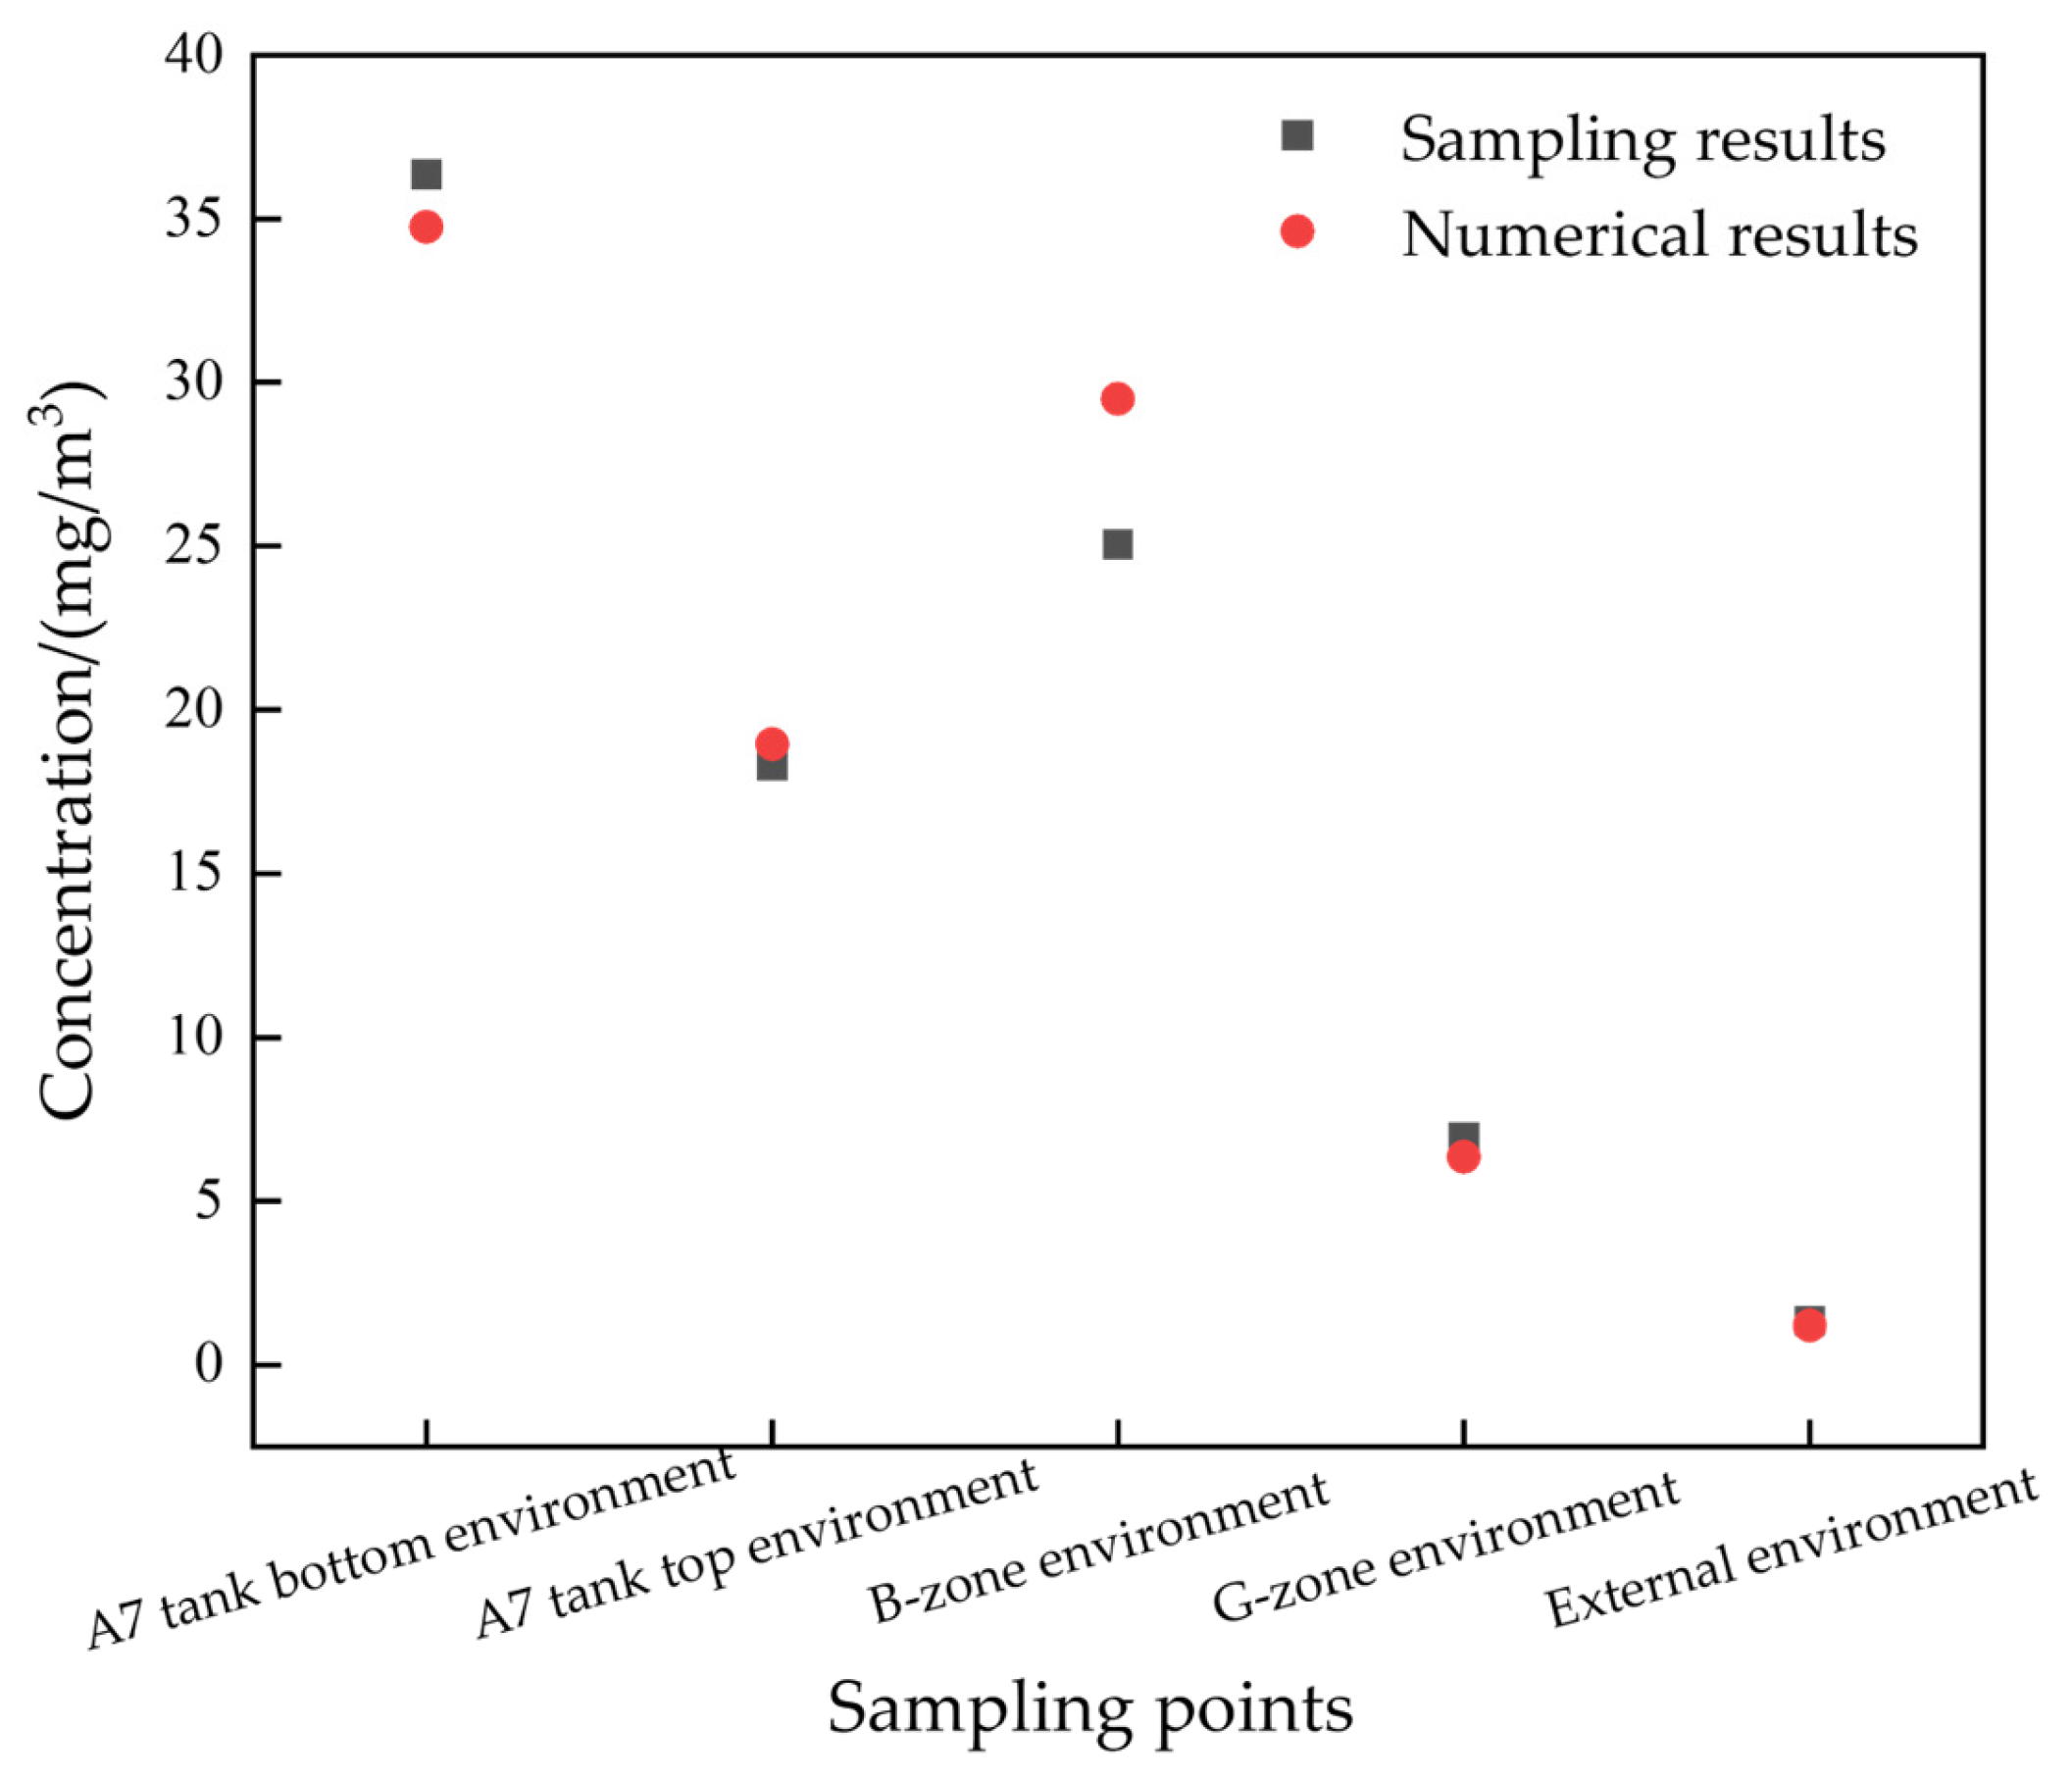
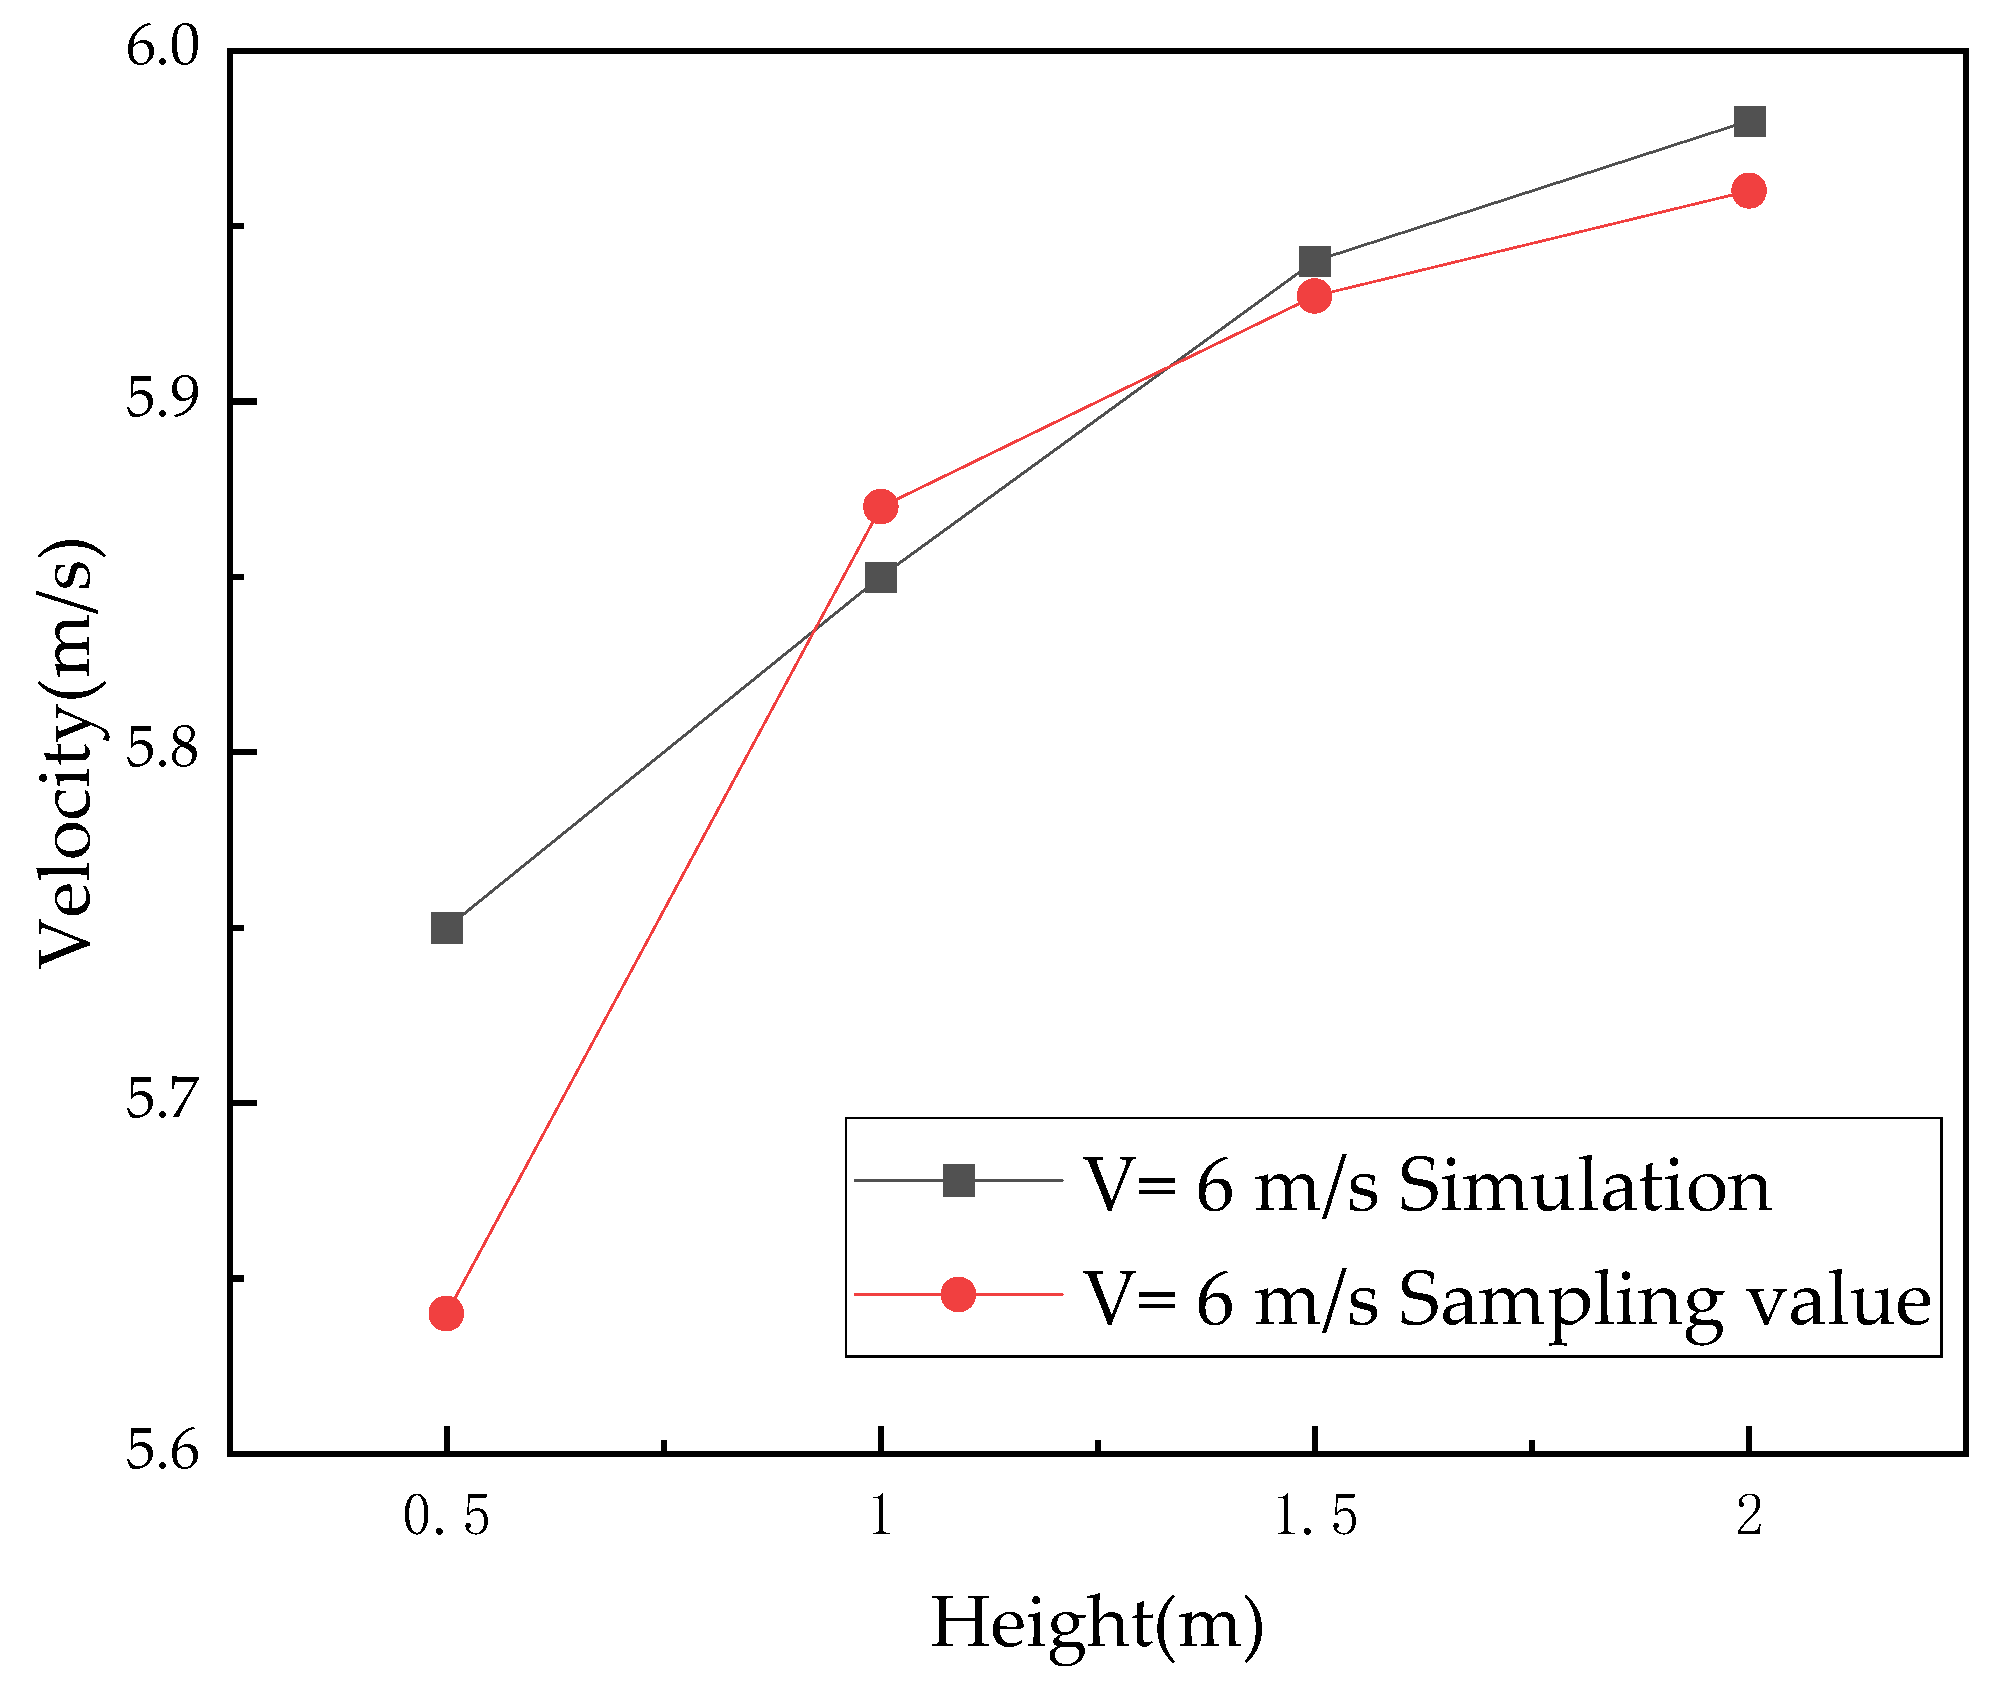
2.4. Accuracy Verification of Numerical Simulation

All tanks in Area A contain methanol, so methanol is selected as the simulation medium in this paper. Two methods were employed in this study to validate the feasibility and accuracy of the numerical model. Firstly, the commonly used method of numerical simulation has been demonstrated in previous research through experimental validation. Additionally, on-site testing instruments such as portable gas chromatographs, anemometers, and high-purity hydrogen generators were used to measure and validate the emission data at multiple points in the field. As shown in Table 5 and Figure 4, the sampling results at the same point were compared with the numerical results under the same condition, with an error of 10%. The simulation results closely match the measured data in most cases.
Differences between on-site sampling values and simulated values can be attributed to the non-constant nature of both experimental and simulated flow fields, introducing turbulence uncertainty and causing fluctuations in physical parameters like concentration within a certain range. Variations in measurements at different times are expected, and minor errors may arise from the disturbance of measurement instruments to the flow field. This study primarily focuses on exploring the overall mechanism of oil vapor dispersion, and as such, these errors do not significantly impact the analysis of oil vapor transport behavior.
Wind speed monitoring was conducted at a distance of 3 m in front of the G2 model (Figure 5). Samples were taken at different heights (0.5 m, 1 m, 1.5 m, 2 m) on-site to determine the wind speed distribution. Numerical simulations were performed to depict the wind speed distribution around the G2 model under a 6 m/s wind speed, and the results were compared with the on-site sampled data. As shown in Figure 6, there were slight discrepancies between the sampled wind speeds and the simulated wind speeds at each measurement point, with errors below 10%. However, the overall trend was consistent, indicating that the model is suitable for simulating the velocity field at the natural gas station.

3. Results and Discussion

3.1. Analysis of Pressure Field and Flow Field

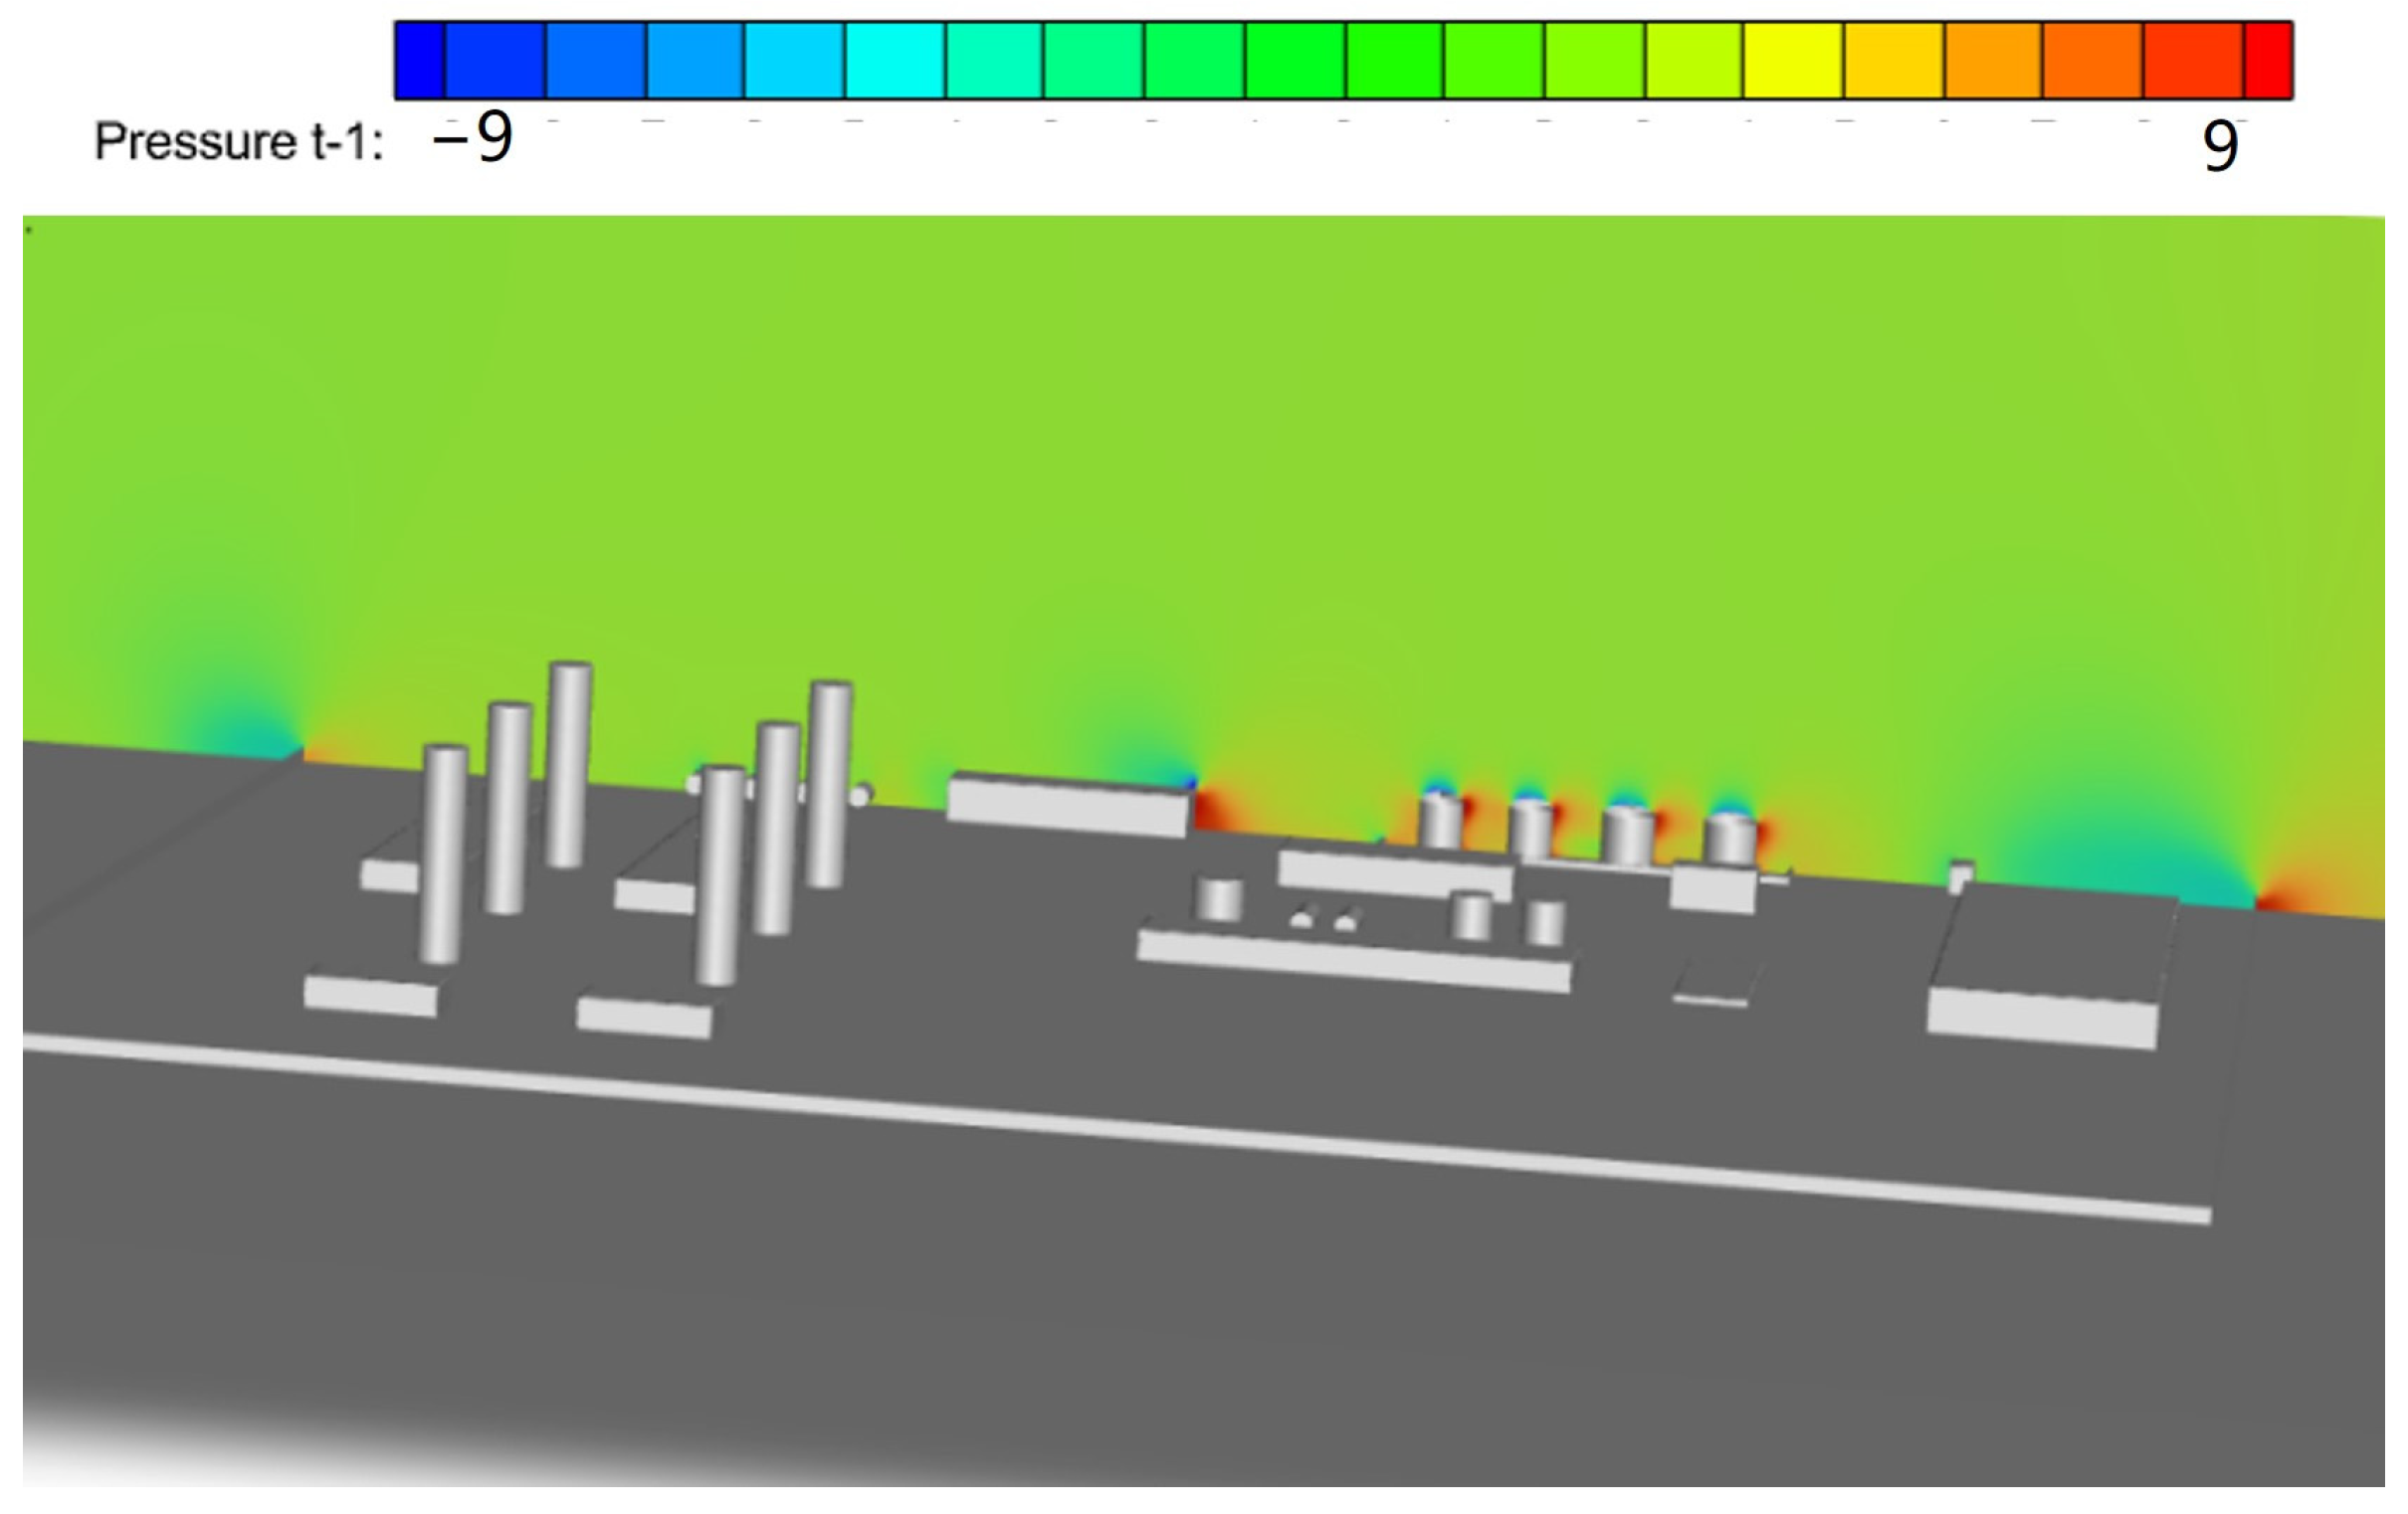
3.1.1. Pressure Field Analysis

Based on on-site research, the average annual wind speed at the purification plant is determined to be 6 m·s−1. The pressure distribution contour map at the natural gas purification plant when the wind speed is 6 m·s−1 (opposite to the X-axis direction) is shown in Figure 7. From Figure 7, it can be observed that the ambient wind flows along the negative direction of the X-axis, directly impacting the windward side of the front-row tanks, fire barrier, purification equipment, and office area. This results in the conversion of kinetic energy to pressure potential energy, leading to a maximum pressure of 9.8 Pa at this wind speed. Due to the obstruction caused by the front-row tanks, the windward side of the rear-row tanks experiences a smaller red area compared to the front-row. As the pressure difference above the tanks is relatively small, under the influence of this pressure difference, the airflow velocity above the top of the tank will be higher than in other regions at the same height. This results in a reduction in pressure at the top of the tanks, creating a negative pressure. The minimum and negative pressures on both sides and the lee side of the building are attributed to the phenomenon where some airflow, after impacting the tanks, moves into the cavity area. The airflow accelerates and flows along both sides of the tanks towards the rear, creating a swirling flow. This turbulent motion, with a sufficiently large Reynolds number (Re), enhances the backflow in the area in front of the tanks and the lee side of the cavity, leading to a rapid decrease in pressure.
Taking the XY section of the plant, the pressure contour map for this plane is obtained, as shown in Figure 8. There are distinct negative-pressure and high-pressure areas between the leeward side of the front-row tanks and the windward side of the rear-row tanks. The airflow from regions with higher pressure moves towards areas with lower pressure, creating vortices between the tanks. Oil vapors may accumulate in these regions, forming hazardous areas.

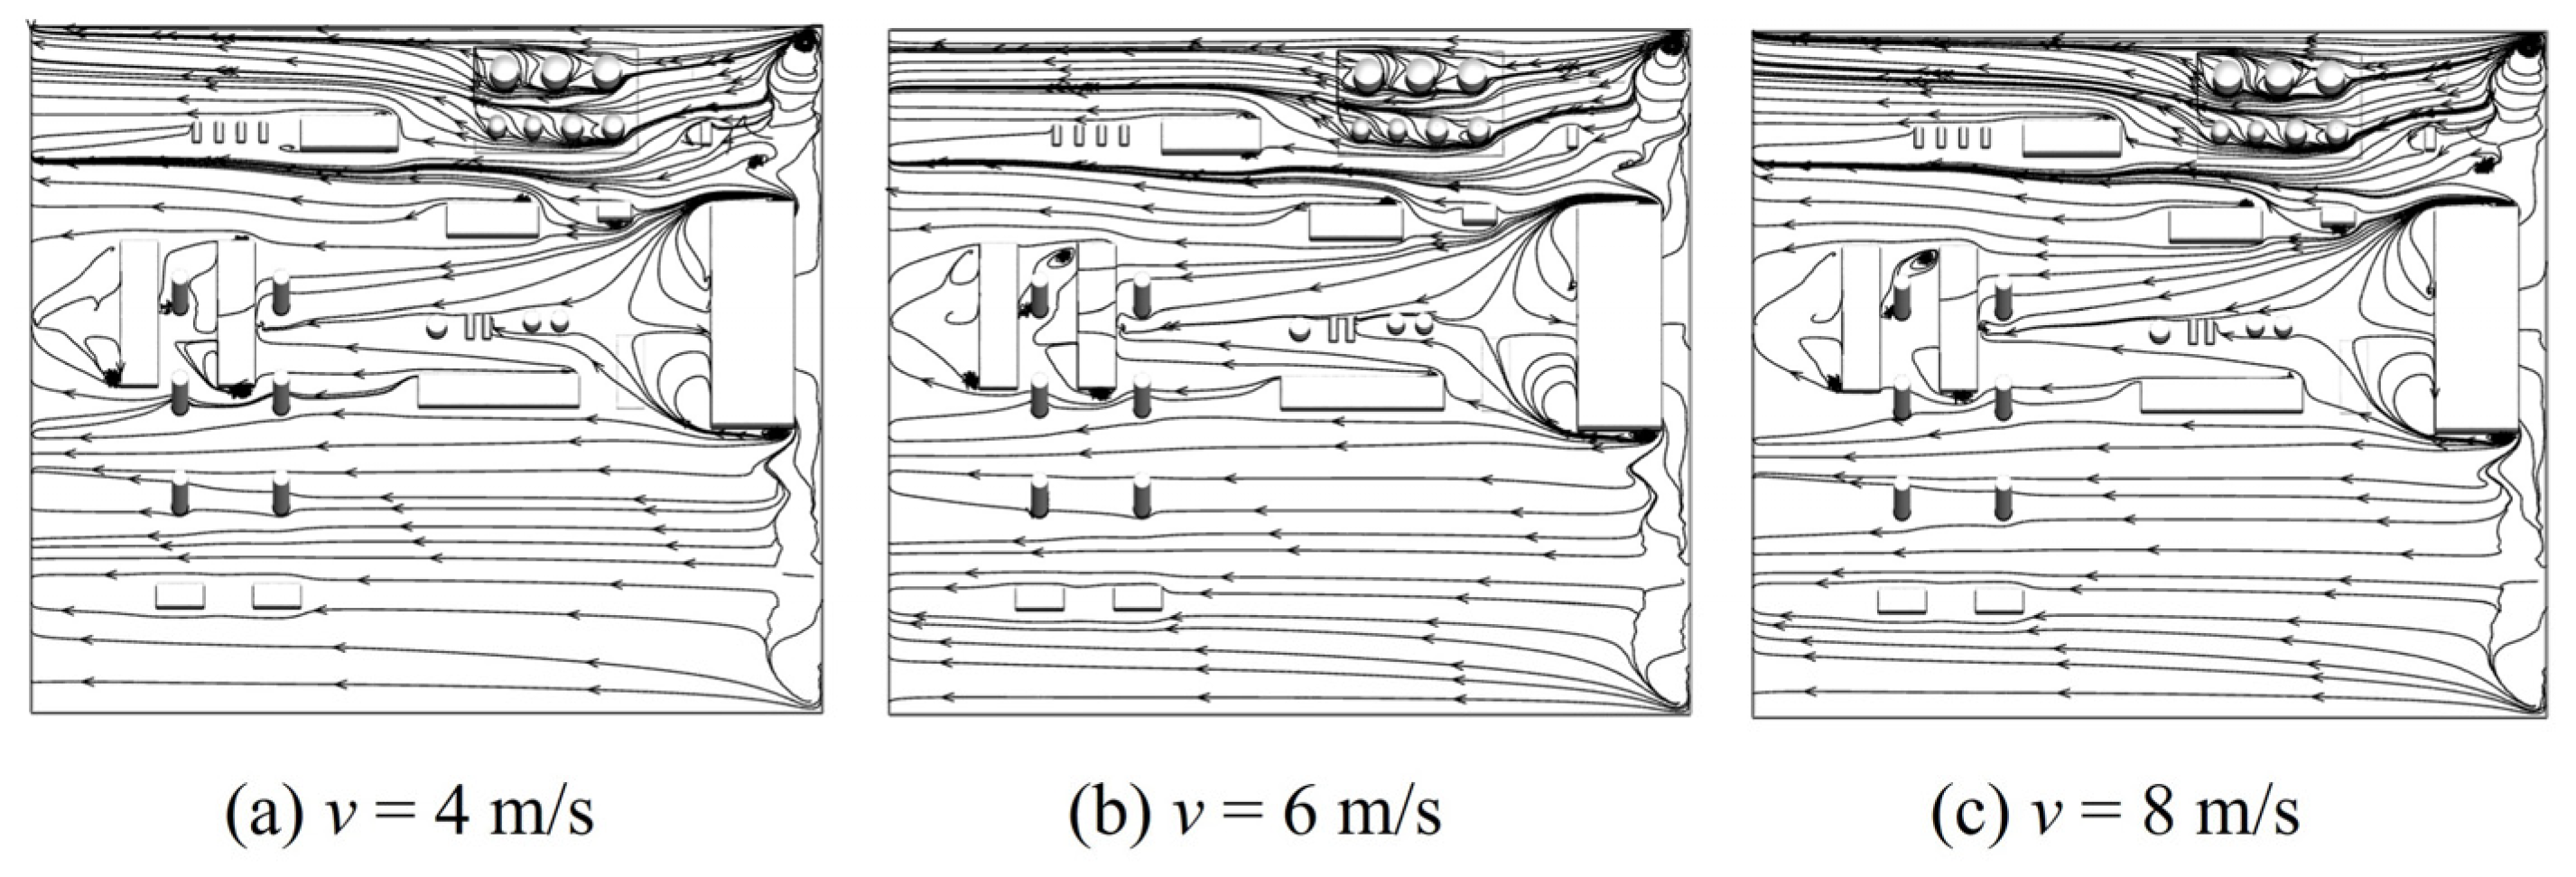
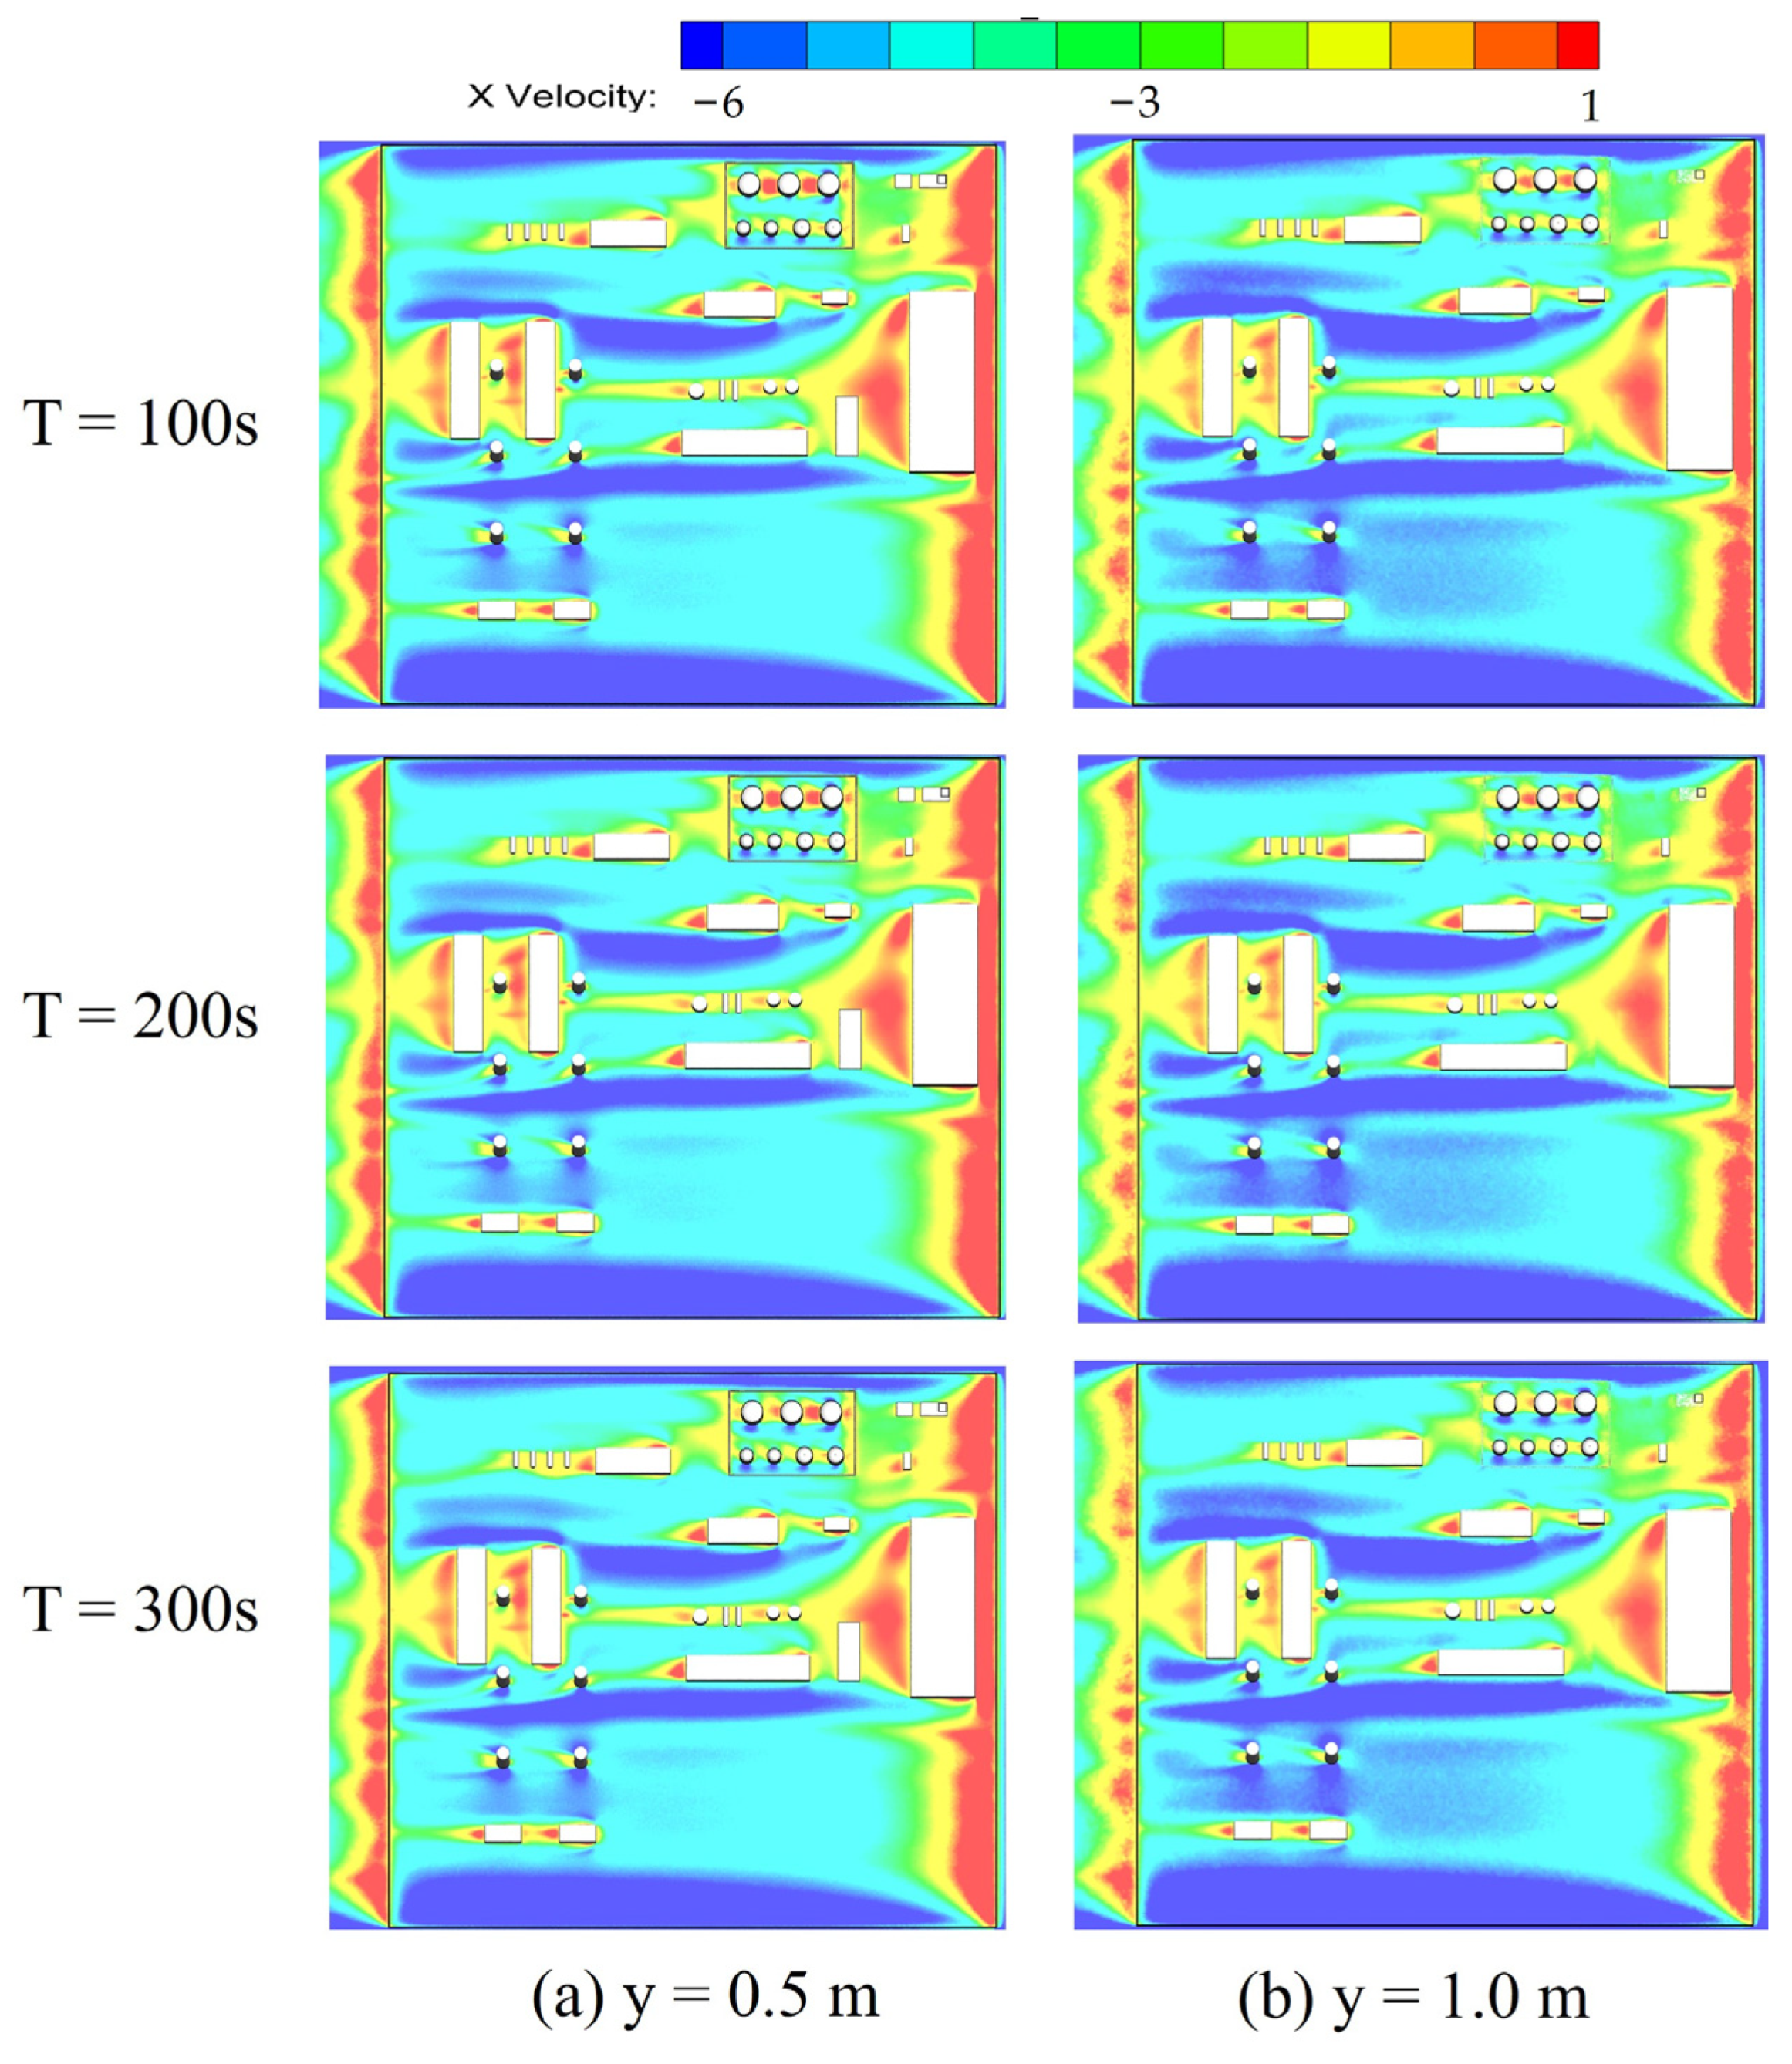
3.1.2. Flow Field Analysis

The diffusion of oil vapor from the leakage source is significantly influenced by environmental wind conditions. Aligning the environmental wind direction parallel to the horizontal plane, different wind speeds of 4 m·s−1, 6 m·s−1, and 8 m·s−1 are considered. The airflow trajectories in the natural gas purification plant under various wind speeds are shown in Figure 9. It is evident from the figure that the oil vapor emission sources are primarily concentrated in Areas A and B of the purification plant. As the ambient wind enters the tank farm from the right side along the X-axis in the opposite direction, the overall height of B1 and B2 poses minimal obstruction since they are nearly level with the ground. However, a minor vortex is formed on the lee side of B3. The fire dike in Area A exerts an obstructive effect, causing a portion of the airflow to accumulate on the lee side of the fire dike, forming a small vortex distributed along its length. Another part of the airflow directly crosses the fire dike to reach the tank group, resulting in the formation of vortices of varying sizes behind the tanks. Furthermore, a portion of the airflow traverses the top of Area F and reaches Area D. Due to the relatively open and low-profile nature of the buildings in Area E, no vortex is generated within this zone. However, a distinct vortex is formed on the leeward side of both Area F and Area D. As the wind speed increases from 4 m·s−1 to 8 m·s−1, the leeward vortices behind the tanks in Area A become larger. Moreover, the airflow in front collaborates with the vortex flow, converging towards Area C. It is worth noting that the airflow passing through Area B accumulates in Area A. At a wind speed of 4 m·s−1, multiple small vortices form on the leeward side of the tanks in Area A. As the wind speed increases to 6 m·s−1, these small vortices on the leeward side converge to form a larger vortex, causing a significant accumulation of oil vapor and the formation of a hazardous area.
The time-varying velocity distribution at different heights within the natural gas purification plant when the wind speed is 6 m·s−1 is shown in Figure 10. Taking the emission source in Area A as an example, when the airflow impacts the windward side, it accelerates and flows backward along both sides of the tank. When y = 0.5m, the A3 and A7 tanks are obstructed by the fire dike, creating a red low-speed zone inside the fire dike and at the bottom of the tanks. This condition is conducive to reducing the volatilization rate of oil vapor in this area. As the height increases, the red low-speed area disappears, indicating a decrease in the barrier effect of the fire dike. Since A3 and A7 tanks are located at the front of the windward side, it is evident that the airflow speed on both sides can reach up to 5.6 m·s−1. The remaining tanks are obstructed by the rightmost tanks (A3 and A7 tanks), with some of the air flowing directly from the top of the tank and a small part flowing between the two tanks. The minimum speed between tanks in Area A is only 1 m·s−1. It is important to note that the speed between tanks in Area A is much smaller than the speed on the windward side in front of the tank, and this area is prone to oil vapor accumulation. The building in Area F is situated near the yard wall, causing less obstruction to the airflow speed on the windward side compared to the leeward side. The pressure of the airflow increases at the windward corner of Area F, leading to the separation of shear airflow on the windward side and the diversion of incoming flow on both sides of the building. As the airflow approaches the building’s corner, it merges with the forward flow. This area is part of the displacement area and the wind speed of the separation flow increases in this region. Area F consists of an empty nitrogen station with a height of 6 m, and the E1 sewage tank has a height of 0.8 m. On both sides of Area F, the velocity is 4.8 m·s−1, but by the time it reaches E1, the velocity drops to only 1.6 m·s−1, which is one-third of the velocity at Area F. Due to the height gap, when the airflow passes through Area F, it encounters a significant blockage, resulting in low vertical flow velocity around the E1 sewage tank. When T = 100 s, the velocity changes in the station are quite noticeable, and as time progresses, the overall station velocity tends to stabilize. At y = 0.5 m, the airflow around B1, B2, and B3 diverts at the building corner, and the velocity on the lee side is low, emphasizing the need to monitor the accumulation of oil vapor in this area. At y = 1 m, the airflow directly passes B1 and B2, and the velocity on the lee side of B3 increases. Additionally, with the increase in height, the overall wind speed rises in the XZ plane of the purification plant, with the wind speed on the windward side of the desulfurization tower in Area D showing no significant difference. This indicates that the change in low wind speed is more influenced by the buildings.
The velocity distribution cloud diagram in the natural gas purification plant under different wind speeds (4 m·s−1, 6 m·s−1, 8 m·s−1) is shown in Figure 11. The general flow velocity trend aligns with Figure 10. With increasing speed, the influence of the buildings on the airflow intensifies. At v = 4 m·s−1, when the wind speed is low, areas A and B are comparatively less affected by the overall wind speed, making oil vapor more prone to sinking and accumulating, posing potential hazards.

3.2. Environmental Impact Assessment

In the natural gas purification plant, oil vapor emission sources are primarily concentrated in Areas A, B, and E. The oil vapor mass fraction distribution cloud for the G4 tank in the XZ section of the purification plant is shown in Figure 12. The visualization indicates an overall downward trend in oil vapor diffusion influenced by gravity and eddy currents. Given that the leakage port of the tank is positioned at the oil metering and breathing valve on the top of the tank, the height of the breakwater cannot impede the diffusion of oil vapor. Consequently, a majority of the oil vapor will traverse the fire dike and accumulate in Area C. The concentration distribution cloud of oil vapor in Area A and Area B under different wind speeds is shown in Figure 13. Clearly influenced by the ambient wind, the oil vapor emanating from the storage tanks in Area A will amass in Area C, creating a high-concentration region. A certain concentration of oil vapor accumulates between tanks in Area A and on the lee side of Area B, with a mass fraction ranging from 0.025 to 0.09. The explosive limit volume fraction of methanol is 6–36.5%, equivalent to a mass fraction of 0.0658–0.3881, placing the oil vapor concentration within the explosive limit range. As depicted in Figure 13, wind speed significantly affects the volatilization and diffusion of oil vapor. At v = 4 m·s−1, the red area of oil vapor diffusing from the tanks in Area A covers the entire Area C. At v = 8 m·s−1, the high concentration area in Area C is notably reduced, almost one-eighth of that at v = 4 m·s−1. Increasing wind speed can effectively reduce the accumulation of oil vapor and decrease the likelihood of accidents. Therefore, it is necessary to minimize the accumulation of buildings around the leak source to effectively reduce the gathering of oil vapor. This helps to prevent incidents such as poisoning or explosions caused by the accumulation of oil vapor.
The cloud map of oil vapor mass distribution in Area E under varying wind speeds is shown in Figure 14. The pattern of oil vapor diffusion in the E1 sewage tank aligns with that depicted in Figure 13. As indicated by the analysis in Figure 8, the E1 position is considerably lower than the height of Area F. Due to this height differential, the wind speed in E1 is low, facilitating the gathering of oil vapor. At v = 4 m·s−1, the airflow diverts through Area F, resulting in a substantial accumulation of high-concentration oil vapor on the leeward side of E1, reaching the explosion limit and posing a heightened risk of fire and explosion. At v = 4 m·s−1, the high-concentration area in Area E noticeably increases, nearly eight times that at v = 8 m·s−1, which is consistent with the pattern observed in the high-concentration area of Area C as depicted in Figure 13. Area E is situated in an open area without tall buildings obstructing it, allowing a significant quantity of highly concentrated oil vapor to disperse to the rear. This has a substantial impact on personnel, increasing the risk of oil vapor poisoning and compromising health.

4. Conclusions

Based on field measurements, the natural gas purification plant model is constructed and analyzed using Computational Fluid Dynamics (CFD) with Fluent software. The study focuses on the mechanism of oil vapor diffusion from multiple sources under normal operating conditions and concludes:
(1)
Combining numerical simulation with on-site data offers clear insights into the oil vapor diffusion process. Understanding parameters such as diffusion range, rate, and concentration aids in identifying hazardous zones and implementing effective emergency response measures, thereby minimizing environmental damage and accident losses. The findings are valuable for managing oil vapor emissions in the petroleum industry and have practical implications for leakage prevention and mitigation.
(2)
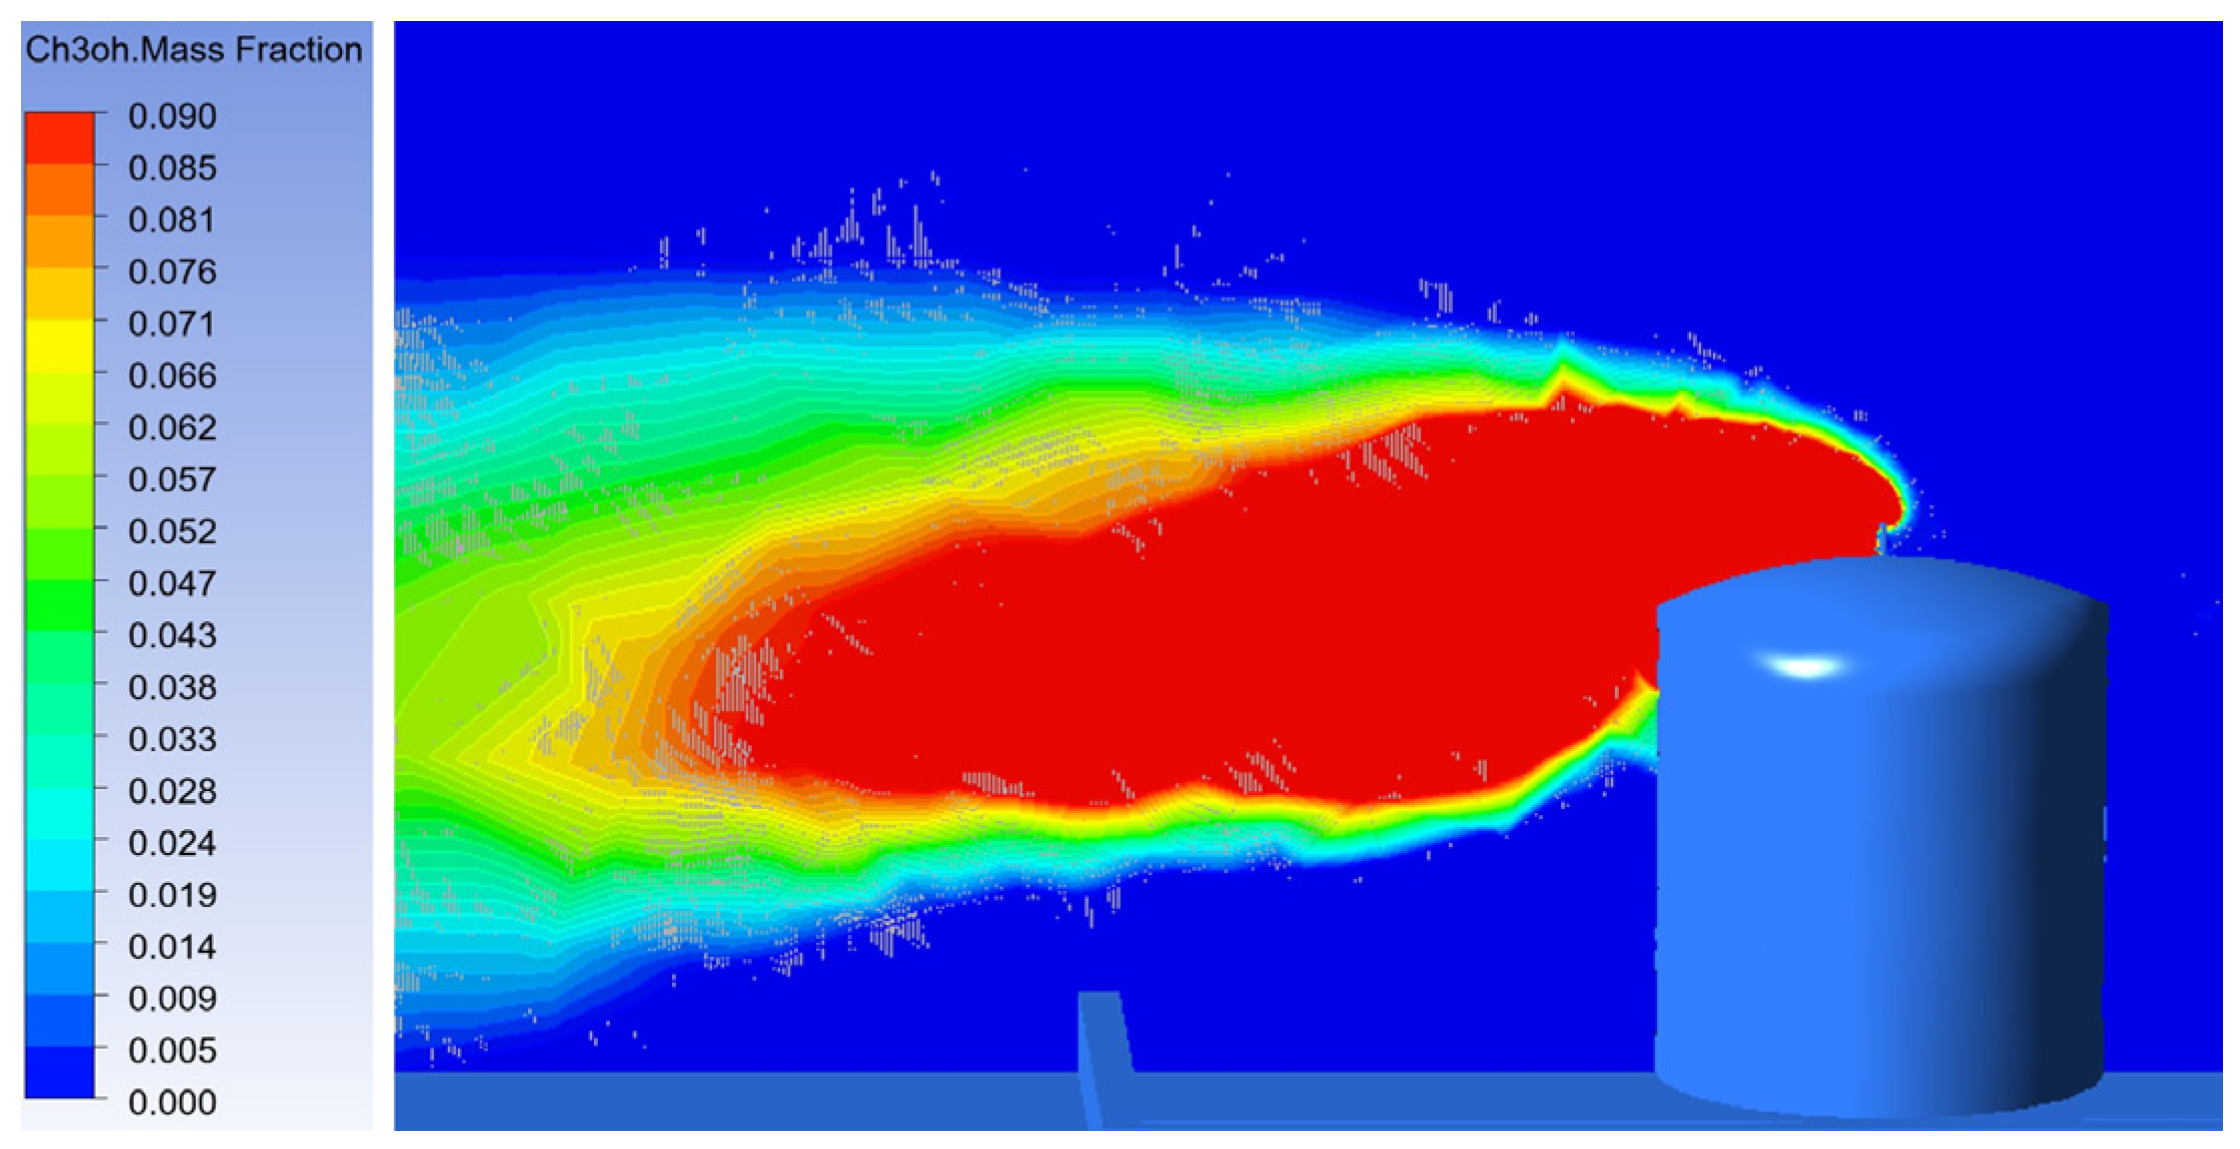
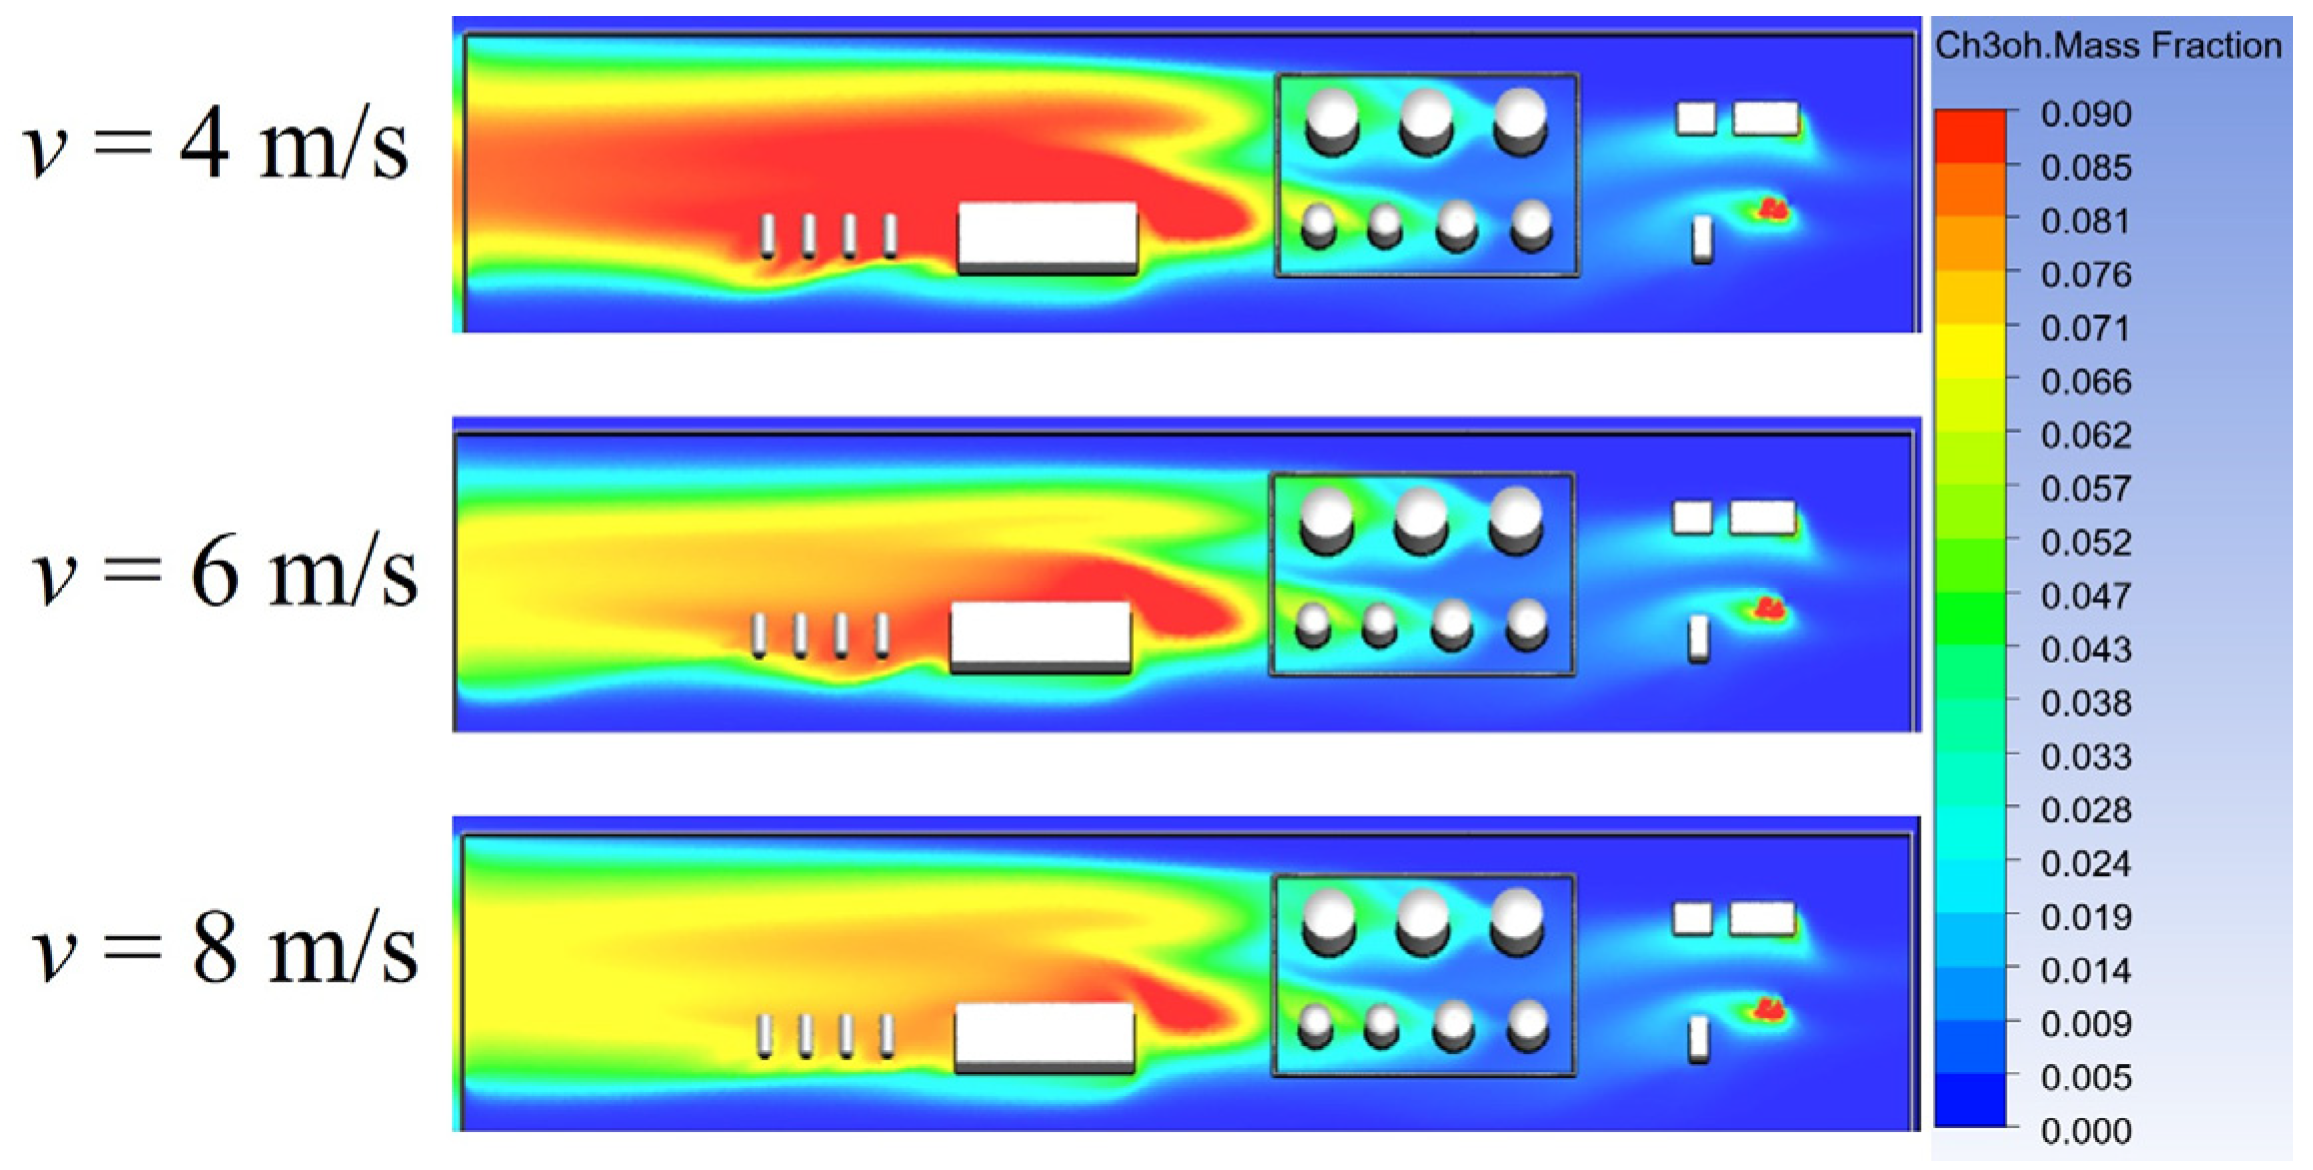
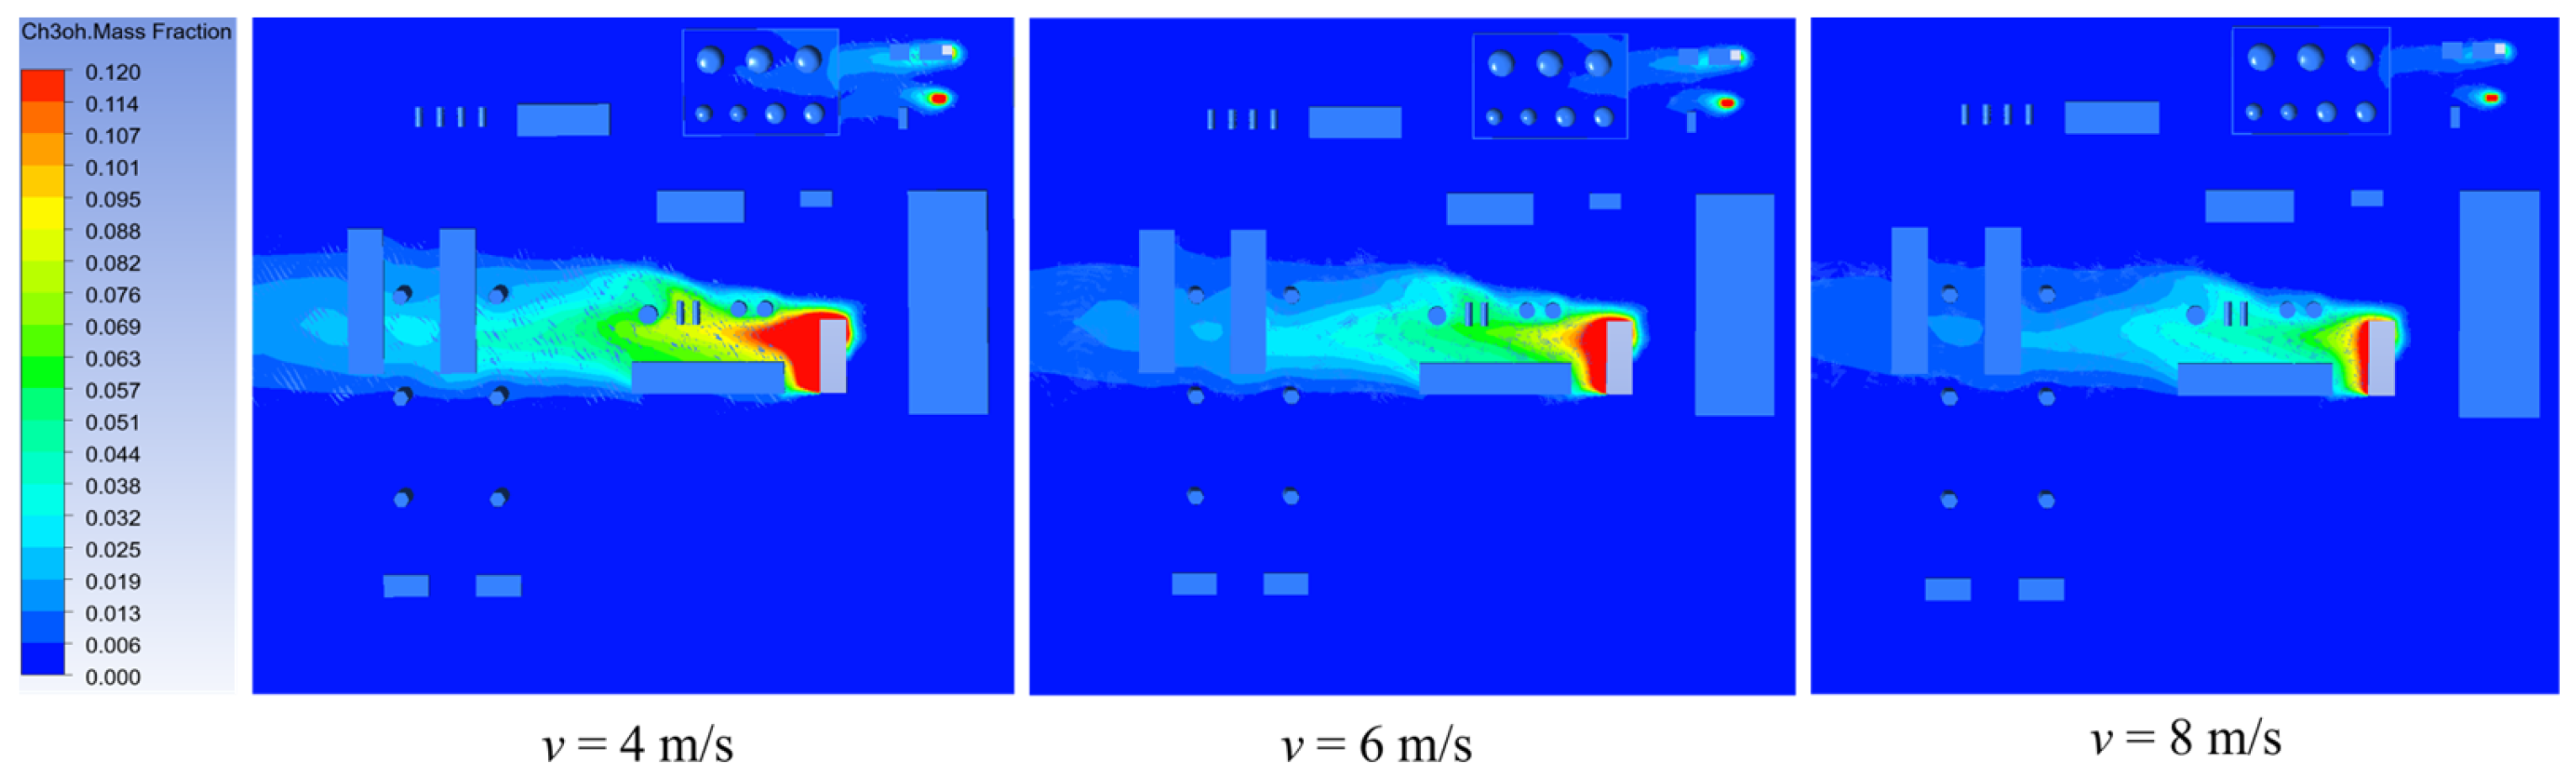
Wind speed significantly influences the natural gas purification plant, creating pressure differentials and areas of high oil vapor concentration. Eddy currents and backflow generate negative pressure zones between storage tanks and on the leeward side of leakage sources. The high-concentration area of oil vapor accumulation at v = 4 m·s−1 is eight times that at v = 8 m·s−1. Decreased wind speed exacerbates vapor accumulation, increasing the risk of explosions.
(3)
Obstacles around the leakage source complicate vapor diffusion. Encountering obstacles like tanks and pools results in the formation of high-concentration hazardous areas. Reduced airflow velocity and vortex phenomena on the leeward side hinder dispersion, raising the risk of reaching explosive limits. Constructing enclosed buildings near the source can effectively impede vapor dispersion and prevent leaks.
(4)
Based on real-time field surveys, the simulation conditions in this study represent the overall VOC dispersion scenario at the natural gas station under most circumstances. However, further investigation and research are needed for extreme weather conditions.

Author Contributions

Conceptualization, Y.G. and W.H.; software, Y.G. and C.Z.; formal analysis, W.H., Y.G., X.L., N.Z., X.K. and X.T.; investigation, Z.X. and Q.Y.; data curation, W.H., Y.G. and X.L.; writing—original draft preparation, Y.G., W.H., C.Z. and X.T.; writing—review and editing, Y.G., W.H., X.L., N.Z., Z.X. and Q.Y.; supervision, W.H.; funding acquisition, W.H. All authors have read and agreed to the published version of the manuscript.

Funding

This work was supported by the National Natural Science Foundation of China (No. 52174058), the Jiangsu Key Laboratory of Oil-gas Storage and Transportation Technology (No. CDYQCY202301), and Postgraduate Research & Practice Innovation Program of Jiangsu Province (No. SJCX23_1571 and No. KYCX23_3141).

Data Availability Statement

Data are contained within the article.

Acknowledgments

Thank you for the generous support from the Research Institute of Oil and Gas at China Petrochemical Corporation’s Changqing Oilfield.

Conflicts of Interest

Authors Ziqiang Xu and Qin Yang were employed by the company Institute of Oil and Gas Technology, PetroChina Changqing Oilfield. The remaining authors declare that the research was conducted in the absence of any commercial or financial relationships that could be construed as a potential conflict of interest.

References

  1. Onel, O.; Niziolek, A.M.; Floudas, C.A. Optimal Production of Light Olefins from Natural Gas via the Methanol Intermediate. Ind. Eng. Chem. Res. 2016, 55, 3043–3063. [Google Scholar] [CrossRef]
  2. Zheng, Y.H.; Luo, D.K. Industrial structure and oil consumption growth path of China: Empirical evidence. Energy 2013, 57, 336–343. [Google Scholar] [CrossRef]
  3. Khanjar, J.M.; Amiri, E.O. Simulation and parametric analysis of natural gas sweetening process: A case study of Missan Oil Field in Iraq. Oil Gas Sci. Technol. Rev. D IFP Energ. Nouv. 2021, 76, 53. [Google Scholar] [CrossRef]
  4. An, Q.E.; Zhu, M.; Qu, D.B.; Zhang, H. Embodied crude oil analysis of Chinese economy from 2011 to 2014. Innov. Solut. Energy Transit. 2019, 158, 3553–3558. [Google Scholar] [CrossRef]
  5. Zhou, M.; Jiang, X.; Zhai, L.; Jin, X.; An, H.; Ding, Z.; Shen, F. Simulation of the Internal Temperature Field and Flow Field in a Double-Layer Sintering Bed. ACS OMEGA 2022, 7, 46777–46786. [Google Scholar] [CrossRef] [PubMed]
  6. Zhang, P.; Chen, X.; Fan, C. Research on a safety assessment method for leakage in a heavy oil gathering pipeline. Energies 2020, 13, 1340. [Google Scholar] [CrossRef]
  7. Yang, M.; Khan, F.; Lye, L.; Amyotte, P.R. Risk assessment of rare events. Process Safety and Environmental Protection. Water Res. 2015, 98, 102–108. [Google Scholar] [CrossRef]
  8. Atkinson, G.; Cowpe, E.; Halliday, J.; Painter, D. A review of very large vapor cloud explosions: Cloud formation and explosion severity. J. Loss Prev. Process Ind. 2017, 48, 367–375. [Google Scholar] [CrossRef]
  9. Milazzo, M.F.; Ancione, G.; Lisi, R. Emissions of volatile organic compounds during the ship-loading of petroleum products: Dispersion modelling and environmental concerns. J. Environ. Manag. 2017, 204, 637–650. [Google Scholar] [CrossRef]
  10. Cirimello, P.G.; Otegui, J.L.; Ramajo, D.; Carfi, G. A major leak in a crude oil tank: Predictable and unexpected root causes. Eng. Fail. Anal. 2019, 100, 456–469. [Google Scholar] [CrossRef]
  11. Chen, K.; Khan, F.; Jing, X.F. Safety assessment of natural gas purification plant. Process Saf. Environ. Prot. 2018, 113, 459–466. [Google Scholar] [CrossRef]
  12. Zhang, M. Simulation and risk assessment of methanol tank leakage accidents. Guangdong Chem. Ind. 2014, 41, 259–260. [Google Scholar] [CrossRef]
  13. Liu, L.; Meng, B.; Wang, Q. Study on influence of cofferdam on leakage and diffusion law of LNG storage tank. New Technol. New Technol. 2014, 12, 115–118. [Google Scholar] [CrossRef]
  14. Liang, X.M.; Sun, X.B.; Xu, J.T.; Ye, D.Q.; Chen, L.G. Industrial Volatile Organic Compounds (VOCs) Emission Inventory in China. Environ. Sci. 2020, 41, 4767–4775. [Google Scholar] [CrossRef]
  15. Li, X.; Li, B.; Guo, L.; Feng, R.; Fang, X. Research progresses on VOCs emission investigations via surface and satellite observations in China. Environ. Sci. -Process. Impacts 2022, 24, 1968–1981. [Google Scholar] [CrossRef] [PubMed]
  16. Simayi, M.; Shi, Y.; Xi, Z.; Ren, J.; Hini, G.; Xie, S. Emission trends of industrial VOCs in China since the clean air action and future reduction perspectives. Sci. Total Environ. 2022, 826, 153994. [Google Scholar] [CrossRef]
  17. Wu, T.; Cui, Y.; Lian, A.; Tian, Y.; Li, R.; Liu, X.; Yan, J.; Xue, Y.; Liu, H.; Wu, B. Vehicle emissions of primary air pollutants from 2009 to 2019 and projection for the 14th Five-Year Plan period in Beijing, China. J. Environ. Sci. 2023, 124, 513–521. [Google Scholar] [CrossRef] [PubMed]
  18. Zheng, H.; Kong, S.; Xing, X.; Mao, Y.; Hu, T.; Ding, Y.; Li, G.; Liu, D.; Li, S.; Qi, S. Monitoring of volatile organic compounds (VOCs) from an oil and gas station in northwest China for 1 year. Atmos. Chem. Phys. 2018, 18, 4567–4595. [Google Scholar] [CrossRef]
  19. Goeury, C.; Hervouet, J.M.; Baudin-Bizien, I.; Thouvenel, F. A Lagrangian/Eulerian oil spill model for continental waters. J. Hydraul. Res. 2014, 52, 36–48. [Google Scholar] [CrossRef]
  20. Huang, W.; Huang, F.; Fang, J.; Fu, L. A calculation method for the numerical simulation of oil products evaporation and vapor diffusion in an internal floating-roof tank under the unsteady operating state. J. Pet. Sci. Eng. 2020, 188, 106867. [Google Scholar] [CrossRef]
  21. Zhang, T.; Li, G.; Yu, Y.; Ji, Y.; An, T. Atmospheric diffusion profiles and health risks of typical VOC: Numerical modelling study. J. Clean. Prod. 2020, 275, 122982. [Google Scholar] [CrossRef]
  22. Bellegoni, M.; Ovidi, F.; Landucci, G.; Tognotti, L.; Galletti, C. CFD analysis of the influence of a perimeter wall on the natural gas dispersion from an LNG pool. Process Saf. Environ. Prot. 2021, 148, 751–764. [Google Scholar] [CrossRef]
  23. Zhang, G.; Huang, F.; Huang, W.; Zhu, Z.; Fang, J.; Ji, H.; Fu, L.; Sun, X. Analysis of Influence of Floating-Deck Height on Oil-Vapor Migration and Emission of Internal Floating-Roof Tank Based on Numerical Simulation and Wind-Tunnel Experiment. Processes 2020, 8, 1026. [Google Scholar] [CrossRef]
  24. Ge, Y.Q.; Huang, W.Q.; Li, X.F.; Yao, J.; Yang, Q.; Zhang, C.; Kong, X.Y.; Zhou, N. Numerical investigation on oil leakage and migration from the accidental hole of tank wall in oil terminal of pipeline transportation system. J. Pipeline Sci. Eng. 2024, 100175. [Google Scholar] [CrossRef]
  25. Fujii, K. Progress and future prospects of CFD in aerospace—Wind tunnel and beyond. Prog. Aerosp. Sci. 2005, 41, 455–470. [Google Scholar] [CrossRef]
  26. Lapuerta, M.; Hernández, J.P.; Agudelo, J.R. An equation for the estimation of alcohol-air diffusion coefficients for modelling evaporation losses in fuel systems. Appl. Therm. Eng. 2015, 73, 539–548. [Google Scholar] [CrossRef]
  27. Kountouriotis, A.; Aleiferis, P.G.; Charalambides, A.G. Numerical investigation of VOC levels in the area of petrol stations. Sci. Total Environ. 2014, 470–471, 1205–1224. [Google Scholar] [CrossRef]
  28. Tominaga, Y.; Stathopoulos, T. CFD simulation of near-field pollutant dispersion in the urban environment: A review of current modeling techniques. Atmos. Environ. 2013, 79, 716–730. [Google Scholar] [CrossRef]
  29. Fang, J.; Huang, W.; Huang, F.; Fu, L.; Zhang, G. Investigation of the Superposition Effect of Oil Vapor Leakage and Diffusion from External Floating-Roof Tanks Using CFD Numerical Simulations and Wind-Tunnel Experiments. Processes 2020, 8, 299. [Google Scholar] [CrossRef]
  30. Matthew, J.R. CFD prediction of the trajectory of a liquid jet in a non-uniform air crossflow. Comput. Fluids 2006, 35, 463–476. [Google Scholar] [CrossRef]
  31. Moen, A.; Mauri, L.; Narasimhamurthy, V.D. Comparison of k-ε models in gaseous release and dispersion simulations using the CFD code FLACS. Process Saf. Environ. Prot. 2019, 130, 306–316. [Google Scholar] [CrossRef]
Figure 1. Natural gas purification plant building number drawing.
Processes 12 00364 g001
Figure 2. 3D geometric model diagram and calculation domain of natural gas purification plant should be listed as (a) Geometric model diagram and (b) Model and computing domain, *the upward arrow indicates that the model is upward in a positive direction.
Processes 12 00364 g002
Figure 3. Results of 3D grid division for natural gas purification plant.
Processes 12 00364 g003
Figure 4. Comparison of concentrations at each measuring point.
Processes 12 00364 g004
Figure 5. Sampling and numerical results at each sampling point.
Processes 12 00364 g005
Figure 6. Sampling and simulated values at different monitoring locations.
Processes 12 00364 g006
Figure 7. Building pressure distribution cloud image of natural gas purification plant (v = 6 m·s−1).
Processes 12 00364 g007
Figure 8. XY section pressure distribution cloud image of natural gas purification plant (v = 6 m·s−1).
Processes 12 00364 g008
Figure 9. Gas flow trajectory in natural gas purification plant under different wind speeds.
Processes 12 00364 g009
Figure 10. Velocity distribution cloud image in different height natural gas purification plant.
Processes 12 00364 g010
Figure 11. Velocity distribution cloud image in a natural gas purification plant at different wind speeds.
Processes 12 00364 g011
Figure 12. G4 tank oil vapor mass fraction distribution cloud.
Processes 12 00364 g012
Figure 13. Distribution of oil vapor mass fraction in Area A and Area B at different wind speeds.
Processes 12 00364 g013
Figure 14. Distribution of oil vapor mass fraction in Area E at different wind speeds.
Processes 12 00364 g014
Table 1. Parameters of the general conservation equation (Equations (1) and (2)).
EquationThe Value of the Generalized Variable ΦThe Value of the Generalized Diffusion Coefficient ΓGeneralized Source Term S
Mass conservation equation100
Momentum conservation equation u i μ p / x + S i
Energy conservation equation T k / c S T
Component transport equation C S D S ρ S S
Table 2. Specific dimensions of A and D areas.
NumberA1–A3A4, A5A6, A7D1–D6
Area nameRaw material methanol wastewater tanksMethanol wastewater receiving tanksProduct methanol tanksDesulfurization tower
Diameter (m)10.26.67.76.0
Height (m)8.96.97.140.0
Volume (m3)700200300-
Table 3. Specific dimensions of B, E, and F areas.
NumberB1B2B3E1E2E3E4F
Area nameCesspitDrying poolDrying poolCesspitSewage installationSewage installationSewage installationNitrogen station
Length(m)7.4512.53.410.012.033.058.030.0
Width (m)6.36.38.028.08.012.012.085.0
Height (m)0.81.20.80.83.03.03.06.0
Table 4. Independence test results of numerical simulation results and mesh quantity.
ProjectNumber of Grids
A/877,650B/1,380,025C/2,202,403D/2,902,573
Velocity in the X direction (m·s−1)5.215.445.725.72
Table 5. Sampling data at each sampling point.
Sampling PointSampling ResultsNumerical Results
A7 tank bottom environment36.3534.75
A7 tank top environment18.318.95
B-zone environment25.0529.5
G-zone environment6.956.35
External environment1.351.2
Disclaimer/Publisher’s Note: The statements, opinions and data contained in all publications are solely those of the individual author(s) and contributor(s) and not of MDPI and/or the editor(s). MDPI and/or the editor(s) disclaim responsibility for any injury to people or property resulting from any ideas, methods, instructions or products referred to in the content.

