
Analysis of Heat Transfer of the Gas Head Cover of Diaphragm Compressors for Hydrogen Refueling Stations

1
School of Energy and Power Engineering, Xi’an Jiaotong University, No. 28 Xianning West Road, Xi’an 710049, China
2
Qingdao Hisense Hitachi Air-Conditioning Systems Co., Ltd., No. 218, Qianwangang Road, Qingdao 266001, China
3
State Key Laboratory of Multiphase Flow in Power Engineering, Xi’an Jiaotong University, No. 28 Xianning West Road, Xi’an 710049, China
*
Author to whom correspondence should be addressed.
Processes 2023, 11(8), 2274; https://doi.org/10.3390/pr11082274
Submission received: 27 June 2023
/
Revised: 22 July 2023
/
Accepted: 25 July 2023
/
Published: 28 July 2023
(This article belongs to the Special Issue Process Design and Modeling of Low-Carbon Energy Systems)
Abstract
:The inadequate ability to dissipate heat of the gas head cover of the diaphragm compressor will result in its excessive temperature, which will put the operation of the hydrogen filling station at risk for safety issues and raise operating costs. This paper analyzed the structure and the heat transfer characteristics of the gas head cover, along with the relevant heat transfer boundaries, based on which a finite element simulation model of the temperature distribution was established. A test rig for the temperature test of a 22 MPa diaphragm compressor was built to validate this simulation model. The results indicated that the simulated temperatures agree well with the measured values, and the deviation is within 9.1%. Further, this paper proposed two head cover structures for enhancing the heat transfer according to the temperature field distribution characteristics, and the simulation and experimental verification were carried out, respectively. The findings demonstrate that the method of enhancing heat transfer around the centre area is more effective, reducing the highest temperature by 14.1 °C, because it greatly lowers thermal conduction resistance, which is the principal impediment to the heat dissipation of the gas head cover.
1. Introduction
Fossil energy consumption, including coal, oil, and natural gas, is the basis for supporting the progress of modern civilization, which leads to excessive global carbon dioxide emissions [1,2]. Hydrogen can be converted into electricity via hydrogen fuel cells, with only water as a by-product, making it an attractive green alternative to fossil energy, especially in transportation field [3,4,5,6,7]. Hydrogen is a never-ending renewable source of energy and thus can be the ideal solution to environmental and energy issues. However, hydrogen’s extremely low molecular weight makes it the lowest volumetric energy density of any commonly used fuel [8], which prevents the use of hydrogen as an efficient energy source. The most commonly used method is to pressurize hydrogen to 35 MPa or 70 MPa and store it in a storage tank to increase the energy density and enable the car to have a higher cruising range [9,10]. This makes the hydrogen refueling station an important infrastructure to promote the development of the hydrogen energy industry [11]. The hydrogen compressor is the core equipment in the hydrogen refueling station and dominates the cost [12,13]. The technological development of the hydrogen compressor directly determines the construction process of the refueling infrastructure.
The hydrogen-pressurized equipment mainly includes mechanical compression and non-mechanical compression [14]. The mechanical compressor is the most commonly used type, including the diaphragm compressor, piston compressor, liquid piston compressor, and ionic liquid compressor [14,15,16]. Diaphragm compressors are the most widely applied in refueling stations due to their unique advantages of no pollution and no leakage [17]. Even so, the technology of diaphragm compressors now is still unlikely to satisfy the targets of large-scale hydrogen refueling station construction.
The low efficiency and short life of the diaphragm are the most concerning issues of diaphragm compressors. The low flow and efficiency of diaphragm compressors result in high energy consumption of hydrogen refueling stations. Altukhov et al. [18] studied the thermodynamic characteristics of diaphragm compressors and researched the effect of the compressibility of the hydraulic fluid and dead volume in the gas cavity on the efficiency. Lei et al. [19] discussed the factors affecting the flow rate of diaphragm compressors and proposed solutions to these issues. Hyun et al. [20] analyzed the influence of oil density, deflection of diaphragm, gas, and oil pressure on the flow rate during a certain period of the compression process. Jia et al. [21] researched the effect of clearance volume on the flow rate of diaphragm compressors through experiments and proposed a method to increase the flow rate by reducing the dead volume of the cavity. Author [22] focused on the influence of hydraulic oil compressibility on volumetric efficiency and proposed a mathematical formula for the calculation of volumetric efficiency.
The short life of the diaphragm compressor, especially the easy fracture of the diaphragm, is a major problem in the application of the diaphragm compressor. To solve this problem, many efforts have been made to improve the stability and life of diaphragm compressors. Li et al. [23] studied the acoustic emission signal of diaphragm compressors in the working process and proposed a test method that can monitor the operating conditions and evaluate the reliability of the compressor. Altukhov et al. [24] found that the size of the exhaust orifice and the oil-gas pressure relationship are the main factors affecting the diaphragm life, and proposed a method to evaluate the design reliability of diaphragm compressors. Lu et al. [25] analyzed the factors affecting the diaphragm life of diaphragm compressors and found that the main factor is the cavity profile. Jia et al. [26] proposed an analysis method of diaphragm stress which is combined with the small deflection and thin-plate large deflection theories and investigated some influence factors of the diaphragm fracture. Hu et al. [27] proposed a new generatrix for cavity profile, which can eliminate the dead volume in the cavity and reduce the maximal and the centric redial stress of the diaphragm by 8.2% and 13.9%, respectively. Li et al. [28] studied the characteristics of diaphragm stress distribution during the working process of diaphragm compressors. Furthermore, Li et al. [29,30,31,32] presented two new generatrices of the cavity profile, which can change the stress distribution characteristics of the diaphragm, and verified the design theory through experimental and numerical methods. The new cavity profiles can somewhat improve the stress of the diaphragm, but they do not quite address the problem.
The phenomenon of low flow and high failure of diaphragm compressors has received the majority of research attention, while its fundamental performance, particularly thermal management, has received less attention. The gas head cover of the hydrogen compressor needs to use a hydrogen embrittlement-resistant material, which has poor thermal conductivity, not conducive to the export of compression heat, causing the temperature of the head cover to rise abnormally. A significant failure rate is also brought on by the thermal stress brought on by the gas head cover’s abnormally high temperature. The high temperature of the gas head cover can also exacerbate suction gas heating and reduces the volumetric efficiency. Nevertheless, little research has been done on this issue. Only Wang et al. [33,34] discussed that the thermal deformation of the gas head cover had a great influence on the diaphragm fatigue life through the thermal-structure coupled analysis, and proposed a method to improve the structure of the gas headcover. However, they calculated a temperature field result by given parameters and then studied the influence of the temperature field on the structural strength, but did not propose a universal simulation method for the temperature field of the head cover. Analyzing the heat transfer process and researching ways to improve it are both crucial [35,36,37].
The above research mainly focused on cavity profiles and diaphragm stress. However, the issue of poor heat dissipation of the gas head cover, which has a great impact on the life and efficiency of the compressor, has not been well studied. The purpose of this paper is to analyze the heat transfer process related to the gas head cover, establish a simulation model of the temperature field, and then explore ways to enhance heat dissipation. Analysis and experimental methods were applied to investigate and verify the method to calculate the temperature field of the gas headcover.
2. Analysis of the Heat Transfer Related to the Gas Head Cover
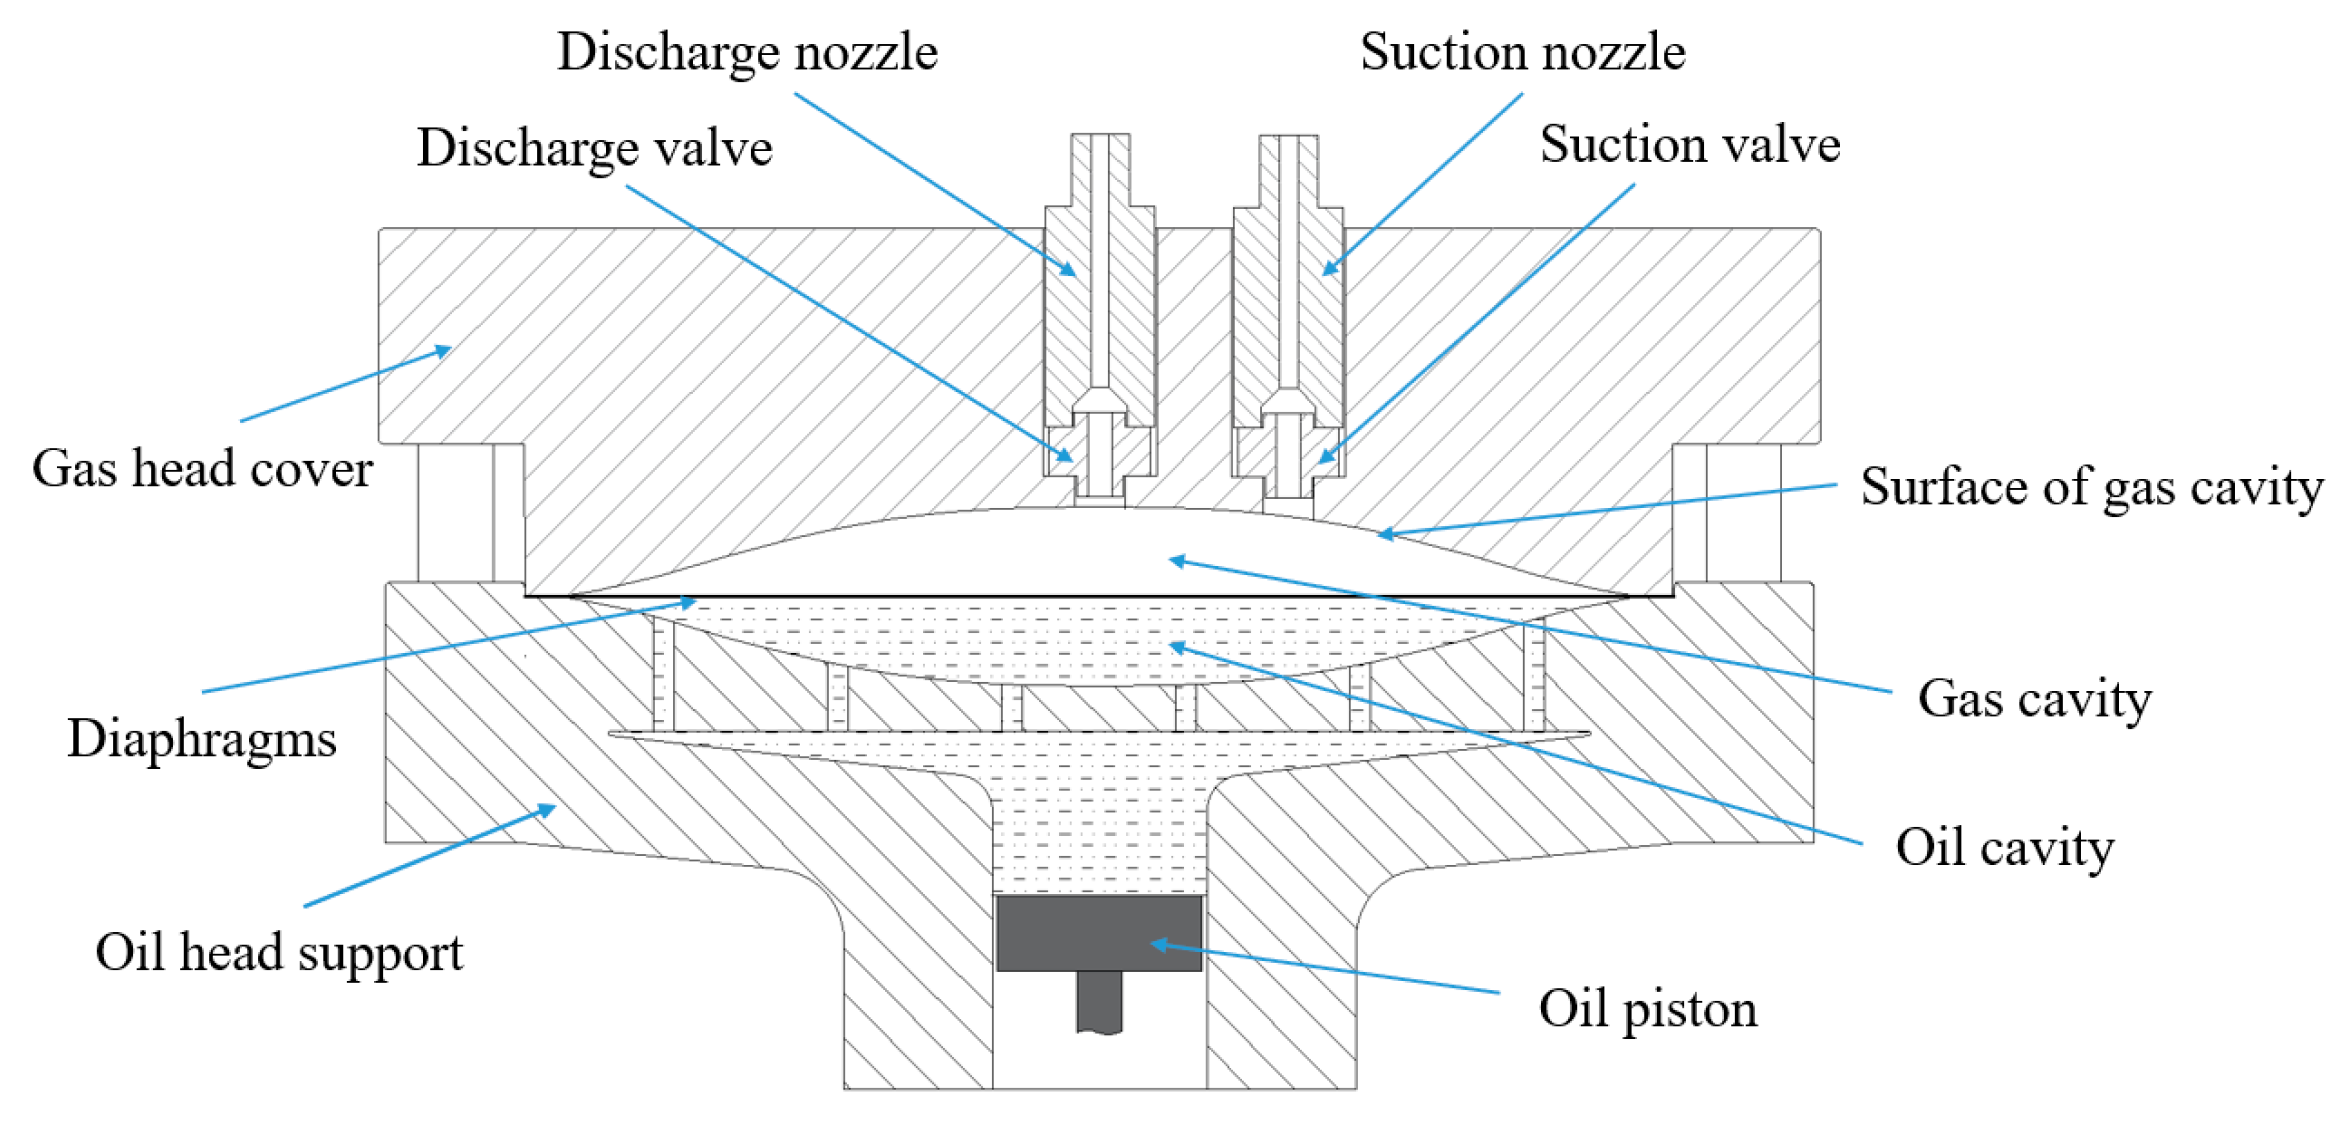
The structure of the diaphragm compressor is shown in Figure 1. Three diaphragms are fixed between the oil head support and the gas head cover. The volume enclosed by the surface of the diaphragm and the gas head cover is the gas cavity, and the other side of the diaphragm and the oil head support enclose the oil cavity. The oil piston is driven by the crank connecting rod mechanism to reciprocate in the oil head support. Then, the oil piston forces diaphragm deformation through hydraulic oil. Further, the volume of the gas cavity is changed as diaphragms move, and the gas can be compressed and discharged. The mechanical energy is converted into the internal energy of the gas during the compression process, and the temperature of the gas will increase. The compression process in the gas cavity of a diaphragm compressor is generally considered to be a nearly isothermal process in the past because the gas head cover of traditional diaphragm compressors is approximately a thin plate and is made of alloy steel with good thermal conductivity. However, for diaphragm compressors used in hydrogen refueling stations, the material of the gas head cover is generally made of stainless steel to prevent hydrogen embrittlement, which has poor thermal conductivity. The pressure of the compressor used in the hydrogen refueling station is relatively high, resulting in a thick gas head cover, which is further not conducive to heat dissipation. The aforementioned factors cause the thermal resistance of the gas head cover to be relatively high and the compression heat released to the environment through the gas head cover to be comparatively low, leading to a higher discharge temperature. The compression process in the gas cavity of hydrogen diaphragm compressors is nearly an adiabatic process. These problems are subjected to the high temperature of the discharge gas, as well as the gas head cover. High gas head cover temperature can lead to large thermal deformation, high thermal stress, and terrible intake heating, which affect the efficiency and life of the compressor. Therefore, it is of great significance to study the heat transfer process and temperature distribution related to the gas head cover to improve the performance of the diaphragm compressor.
This study focused on the temperature distribution characteristics of the gas head cover. The heat transfer processes related to the gas head cover are shown in Figure 2. The main heat transfer processes and characteristics are as follows:
2.1. Heat Transfer from Compressed Gas to the Surface of the Gas Cavity
The temperature of the gas in the gas cavity increases as compressed, and the high-temperature gas undergoes forced convection heat transfer with the surface of the gas cavity. It has been analyzed that the compression process in the gas cavity of the hydrogen diaphragm compressor used in refueling stations is nearly an adiabatic process. The temperature of the compressed gas can be calculated as:
where, and denote the temperature of compressed gas and suction gas, respectively; K; and represent the discharge pressure and suction pressure, respectively, MPa; is the temperature adiabatic index, which is 1.41 for hydrogen.
The cycle process of the compressor includes the expansion process, the suction process, the compression process, and the discharge process. The temperature of the gas in the gas cavity is not always maintained at the highest temperature. The fresh gas with a lower temperature enters the gas cavity during the suction process, and the heat will be transferred from the surface of the gas cavity to the fresh gas. The actual average temperature of the gas in the gas cavity is affected by many factors, such as compressor power, operating conditions, and structural parameters. The average temperature of the gas in the gas chamber of a reciprocating compressor is usually calculated by an empirical formula. The authors verified that the empirical formula is also applicable in diaphragm compressors through experiments. The average temperature can be expressed as:
where, is the average temperature in the gas cavity.
The convection heat transfer between the gas and the cavity surface is a complex dynamic process. In a cycle process, the convective heat transfer coefficient is constantly changing, but it is not necessary to calculate the heat transfer coefficient at each moment. The equivalent convective heat transfer coefficient of the entire working process can describe the heat transfer between the gas and the cavity surface more intuitively. Because the gas cavity is flat and the discharge holes are in the centre, the closer to the centre, the more heat exchange between the gas and the cavity surface. The equivalent convective heat transfer coefficient can be expressed as:
where denotes the convective heat transfer coefficient at radius r, is the convective heat transfer coefficient at the centre, is the radius of the gas cavity, and represents the rate of decrease of heat transfer coefficient with radius which is the distance from the gas cavity’s centre. The uncertainty around the deformation pattern of the diaphragm results in the shape change pattern of the gas cavity being unclear, which makes the theoretical calculation of and impossible now. In this study, the simulation model was corrected by the experimental results, and and are empirical values summarized through experimental measurements [33].
2.2. Heat Transfer from the Outer Surface of the Gas Head Cover to the Environment
The temperature of the outer surface of the gas head cover without cooling can generally reach 80 °C–100 °C when the discharge temperature is greater than 150 °C. Therefore, not only the convective heat transfer but also the heat radiation should be considered when calculating the heat transfer between the outer surface of the gas head cover and the environment. The gas head cover is generally not air-cooled in the design of diaphragm compressors. The form of the convective heat transfer between the outer surface and the environment is air-natural convective heat transfer. The heat transfer coefficient of air natural convective is 5–25 W·m−2·K−1. The heat transfer coefficient of heat radiation can be calculated as: [38]
where is the blackness of the surface of the gas head cover, is the Stefan-Boltzmann constant, and represent the temperature of the outer surface of the gas head cover and the environment, respectively, K. Thus, the total heat transfer coefficient between the surface of the gas head cover and the environment is the sum of the convective heat transfer coefficient and the radiation heat transfer coefficient, and is given by:
where denotes the total heat transfer coefficient, and and are the convective heat transfer coefficient and the radiation heat transfer coefficient, respectively.
2.3. Heat Transfer between the Gas and the Surface of Suction and Discharge Holes
There are some small holes under the suction and discharge valve for gas to enter and exit the gas cavity. As shown in Figure 3, there is forced convective heat transfer between the suction and discharge gas flow and the surfaces of the holes. The convective heat transfer coefficient is associated with the flow velocity and working conditions of the gases.
The flow velocities of the gases flowing through the suction and discharge holes are calculated as follows:
where and express the flow velocities through the suction and discharge holes; , , and represent the volume flow rate, pressure, and temperature in standard conditions, respectively; , , , and are the pressures and temperatures of suction and discharge gas, respectively; and are the compressibility factors in suction and discharge conditions, respectively; and and represent the total sectional areas of suction holes and discharge holes, respectively. Thus, the Reynolds numbers can be calculated as follows:
where and are the flow velocity and kinematic viscosity of suction or discharge gas, respectively, and is the diameter of the small holes. Further, the Nusselt number can be calculated by the Dittus-Boelter equation as follows [38]:
Therefore, the heat transfer coefficient can be expressed as:
where represents the heat transfer coefficient between the suction gas with the suction holes or between the discharge gas with the discharge holes, and are the flow velocity and kinematic viscosity of suction or discharge gas, respectively, is the diameter of the small holes, , and are the Prandtl number and thermal conductivity in suction or discharge conditions, respectively, which can be gained with physical property software, and is exponent of the Prandtl number, which is 0.3 for discharge gas and 0.4 for suction gas.
2.4. Heat Transfer between the Suction/Discharge Nozzles and the Gas Head Cover
The temperature of the discharge nozzle is relatively high due to the continuous discharge airflow through it. Similarly, the intake air temperature is relatively low, and thus the temperature of the intake manifold will also be relatively low. The calculation method of heat transfer between the gas and the suction and discharge nozzles is the same as that of the gas and the suction and discharge holes. There is generally a gap of about 1 mm between the suction and discharge holes and the gas head cover. However, as shown in Figure 4, the discharge nozzle still transfers heat to the cylinder head, but the thermal resistance will be larger. Certainly, the gas head cover also transfers heat to the suction nozzle. There are two forms of heat transfer here: thermal radiation and conduction through a thin layer of air. The heat transfer capacity through these two methods can be calculated by the following equations, respectively:
where and represent the heat transfer capacity of thermal radiation and heat conduction, respectively, is the blackness of the surface of the hole in the gas head cover, is the black body radiation constant, is the area of the outer surface of the nozzle, and represent the temperature of the nozzle and the surface of the hole in the gas head cover, respectively, and represent the diameter of the nozzle and the surface of the hole in the gas head cover, respectively, represents the length of the nozzle, and expresses the thermal conductivity of air. Then, the total heat transfer capacity can be expressed as follows:
where indicates the equivalent heat transfer coefficient between the nozzle and the gas head cover, and can be calculated as follows:
The simulation analysis of the temperature field of the gas head cover can be carried out after calculating the heat transfer coefficient of each heat transfer path.
3. Finite Element Analysis of the Temperature Field
3.1. Geometric Model of the Gas Head Cover
The research objects in this study are the gas head cover, the nozzles, and the valves of a diaphragm compressor used in a 22 MPa mother hydrogen refueling station. The gas head cover assembly model was built by 3D modeling software, as shown in Figure 5. There is a stepped hole in the centre of the cylinder for installing the discharge valve. The discharge nozzle presses the discharge valve against the step of the hole, and under the valve, there are some small holes for discharge. The suction step hole is set next to the discharge step hole, and the structure of suction is similar to that of discharge. The structural parameters of this model are shown in Table 1.
The effect of hydrogen embrittlement must be considered when selecting the material for the gas head cover assembly [39]. The material of the parts in contact with hydrogen should be made of hydrogen embrittlement-resistant materials, generally stainless steel [40]. The materials of the gas head cover and the nozzles of this model were 1.4418 duplex stainless steel, and the valves were made of 17-4PH martensite stainless steel. Both 1.4418 and 17-4PH have excellent resistance to hydrogen embrittlement, but their thermal conductivities are extremely low, 15 W·(m·K)−1 and 16 W·(m·K)−1, respectively. This is also one of the reasons for the poor heat dissipation of the hydrogen diaphragm compressor.
3.2. Mesh Generation
The dimensions of the different structural features of the gas head cover differ by two orders of magnitude. The diameter of the gas head cover is 615 mm, while the diameter of the suction and discharge small holes is only 4 mm, and it can be predicted that the area around the discharge holes is the hottest part. The temperature of the area around the discharge holes requires special attention. Therefore, the region of the small holes was divided from the gas head cover for a finer mesh as shown in Figure 6. The grid length of the mesh near the small holes was not more than 1 mm, and the other area of the gas head cover adopted a tetrahedral mesh with a size of 2–5 mm. The suction and discharge nozzles and valves adopted tetrahedral meshes with grid lengths of 1–2 mm.
3.3. Thermal Loads
A steady-state thermal analysis of the gas head cover requires thermal loads to be applied to each boundary. The simulation calculation was carried out in the Steady-State thermal module of ANSYS 2021R2 software. The simulation example in this study is the temperature field of the gas head cover of the hydrogen diaphragm compressor used in the 22 MPa hydrogen filling station. The simulated working conditions are that the suction pressure is 5 Mpa, the suction temperature is 20 °C, the exhaust pressure is 22 Mpa, and the ambient temperature is 20 °C. According to the analysis of the heat transfer of the gas head cover in the previous chapter, the heat transfer coefficient of each heat transfer boundary of the gas head cover can be calculated.
3.4. Mesh Independence Verification
Three meshes were generated with different numbers of elements by adjusting the mesh grid length of the gas head cover, as well as the suction and discharge nozzles and valves, and the number of elements is 2,200,498, 3,421,824, and 4,483,582, respectively. The three models with different mesh numbers were calculated separately. The highest temperature and the temperature of three feature points were taken as the comparison values, and the calculation results under different mesh densities were compared. The positions of the three feature points are shown in Figure 7. Point 1 was located in the middle of the suction and discharge stepped holes, 140 mm deep from the top surface of the gas head cover. Point 2 was located on the other side of the exhaust hole, which is symmetrical with point 1 about the discharge stepped hole. Point 3 was located on the inner wall surface of the discharge stepped hole, on the side away from the suction hole, and is 115 mm deep from the top surface of the gas head cover. The calculation results are shown in Figure 8. The highest temperature and the temperature of the three feature points calculated with three meshes of different densities had no difference, which proved that the mesh density did not affect the calculation results. To save computing resources, this study adopted the mesh density corresponding to the simulation number of 3.42 million.
4. Experimental Validation
To verify the correctness of the simulation analysis method of the temperature field, a test rig for the temperature test of the gas head cover of the diaphragm compressor was built, as shown in Figure 9. The experimental equipment is a two-stage horizontal hydrogen diaphragm compressor with a rotational speed of 420 rpm used in a 22 MPa mother hydrogen refueling station. Taking the secondary gas head cover as the research object, the structure size of the gas head cover is the same as that of the simulation analysis model. The second stage of the compressor was kept in the operation conditions, of which the suction pressure and temperature were 5 MPa and 20 °C, and the discharge pressure was 22 MPa. A vortex volume flowmeter was used to measure the actual flow rate, and six K-type thermocouples were installed in the gas head cover to measure the temperature at several special points. The uncertainty of the K-type thermocouple is ±1.5 °C. To measure the temperature of the internal temperature of the gas head cover, deep holes with a diameter of 5 mm and a depth of 140 mm were machined on it, and the thermocouple temperature measuring heads were inserted into the bottom of the holes and filled with thermal conductive silicone grease. The thermal conductivity of the silicone grease is larger than 6 W·(m−1·K−1). Several very fine K-type thermocouple wires were bonded at the surface of the discharge stepped holes and the discharge small holes by high-temperature-resistant glue.
The temperature measuring points on the gas head cover are shown in Figure 10. Point 1 was located on the central wall of the discharge small holes. Point 2 was located in the middle of the suction and discharge stepped holes, 140 mm deep from the top surface of the gas head cover. Point 3 was located on the other side of the exhaust hole, which is symmetrical with point 1 about the discharge stepped hole. Point 4 was located on the inner wall surface of the discharge stepped hole, on the side away from the suction hole, and is 115 mm deep from the top surface of the gas head cover. Point 5 was also located on the inner wall surface of the discharge stepped hole, 60 mm deep. Point 6 was located at the same depth as points 2 and 3, and was 150 mm away from the central.
5. Results and Discussion
5.1. Finite Element Analysis Results and Comparison with Experimental Values
Figure 11 illustrates the temperature distribution in the cross-section along the centerline of the suction and discharge holes and the surface of the gas head cover. The comparison between the measured temperature and the simulated temperature of each measuring point is shown in Table 2. There are many reasons for experiment and simulation analysis to cause the deviation between the measured value and the simulated value. When measuring the surface temperature, e.g., Point 1, Point 4, and Point 5, one side of the temperature measuring element is attached to the surface of the gas head cover, and the other side is in contact with the high-temperature gas so that there is an error between the measured temperature and the actual surface temperature. The measured temperature values are higher than the actual surface temperature values. Especially, Point 1 is located in the centre of the discharge holes, where the surface temperature is close to the discharge temperature. Thus, the error due to the influence of high-temperature gas on the temperature-measuring element is smaller, and the deviation at this point is smaller. When measuring the internal temperature, e.g., Point 2, Point 3, and Point 6, the thermal conductivity of the filled silicone grease is smaller than that of the gas head cover itself, and the contact surface between the two will also have contact thermal resistance, so the measured values are slightly lower than the actual values there. In addition, the gas cavity of the diaphragm compressor is a flat flexing space, and the thickness and diameter of the space are also constantly changing during operation. The heat transfer coefficient between the gas and the surface of the gas cavity is also dynamic and non-uniform. The heat transfer coefficient between the gas and the gas cavity surface is simplified to be uniform to calculate in this study, which also brings errors to the simulation results. But, in general, the deviation between the measured temperature and the simulated value of each measuring point is less than 9.1%, which is within a reasonable range. The simulation results can reflect the actual temperature distribution characteristics of the compressor well. This indicates that this simulation analysis method is feasible and can be used to study the effect of different methods of optimizing heat transfer.
The temperature distribution graph declares that the maximum temperature of the gas head cover is 162 °C, which is located in the centre of the discharge small holes. The high-temperature gas continues to flow to the discharge nozzle through the small holes, transferring a large amount of heat to the surface of the holes. However, the thermal conductivity of the gas head cover is very low, and the heat around the discharge holes is too late to conduct to the surroundings, resulting in heat accumulation in the region of the discharge holes. This makes the temperature around the exhaust hole too high and the thermal deformation too large, which further aggravates the local stress of the diaphragm and reduces the life of the compressor. The temperature distribution graph also displays that the region of the discharge holes is the core high-temperature zone of the diaphragm compressor, and the temperature exceeds 150 °C. From the discharge holes to the surroundings, the temperature gradient decreases. The temperature of the part of the outer surface of the gas head cover near the discharge stepped hole also exceeds 100 °C. These revelations demonstrate that the problem of the high temperature of the gas head cover can be improved by two methods: augmented heat transfer of the core high-temperature zone around the discharge holes and augmented heat transfer of the outer surface of the gas head cover. But, it can be predicted that the former effect will be better.
5.2. Influence of the Outer Surface Heat Transfer Coefficient on the Temperature Field of the Gas Head Cover
The heat transfer on the outer surface was simplified in this study, and the convective heat transfer coefficient was considered to be a constant value, which would bring certain errors to the simulation results. To verify the influence of this error on the results, the sensitivity analysis of the natural convection heat transfer coefficient of the outer surface was conducted. The temperatures at several special points when the natural convection heat transfer coefficients are 5, 10, 15, 20, and 25, are shown in Figure 12. It declares that the highest temperature hardly changes with the change of the natural convection conversion coefficient, and point 1 is located in the core high-temperature zone; the temperature at point 1 is approximately equal to the maximum temperature. Point 2 and Point 3 are 55 mm away from the centre of the discharge holes, and the temperature is slightly reduced, but the reduction value is within 5 °C. The results indicate that the error of the natural convection heat transfer coefficient has little effect on the simulation results, which is acceptable. The heat inside the gas head cover can only be released to the environment through heat conduction and convective heat transfer on the surface. The thermal conductivity of stainless steel is low, and the thermal resistance of natural convection on the surface is smaller than that of thermal conduction, so the change of natural convection heat transfer coefficient has no significant effect on heat dissipation. The heat conduction resistance increases with distance from the outer surface of the gas head cover, whereas the impact of the surface convective heat transfer coefficient decreases.
5.3. Effect of Augmented Heat Transfer of the Outer Surface and Core High-Temperature Zone
To study the effect of augmented heat transfer of the outer surface and the core high-temperature zone, simulation analysis and experimental verification of the two methods were carried out. Two gas head covers were fabricated, one with water grooves machined on the outer surface and the other with an annular water groove machined along the discharge stepped hole, as shown in Figure 13 and Figure 14.
Figure 15 illustrates the temperature distribution of the gas head cover with augmented heat transfer of the outer surface. The temperature in the area close to the water grooves significantly reduces, and the temperature of the upper part of the gas head cover is lower than 100 °C. However, the highest temperature at the discharge holes still reaches 160.4 °C, which is only 1.9 °C lower than the temperature without heat transfer enhancement. Although the internal temperature at most parts reduces significantly, the method of augmented surface heat transfer has a limited effect on reducing the highest temperature.
Figure 16 illustrates the temperature distribution of the gas head cover with augmented heat transfer of the core high-temperature zone. The highest temperature is reduced to 148.2 °C, which is 14.1 °C lower than that without heat transfer enhancement, and the area of the core high-temperature zone is also greatly reduced. The method of augmented heat transfer with cooling water around the discharge holes can effectively reduce the temperature of the gas head cover and solve the problem of the local excessive temperature of diaphragm compressors.
Table 3 lists the measured discharge temperature, as well as simulated and measured temperatures of several special test points under different gas head cover structures. It can be seen that the discharge temperature is also distinctly reduced with augmented heat transfer of the core high-temperature zone, and the temperature of each point is greatly reduced, which is of great significance for reducing thermal deformation of the gas head cover and improving the life of diaphragm compressors. The results also show that the simulated and measured temperatures are in good agreement for different structures of the head cover. This means that this temperature field simulation method can be used to evaluate the heat dissipation effect of the head cover structure when designing a diaphragm compressor.
This study also demonstrates that the thermal resistance of the gas head cover is the primary factor influencing the heat dissipation. Only through the heat conduction of the gas head cover can the heat inside the gas head cover exchange heat with the cooling water when the water is on the outer surface. The primary part of thermal resistance, heat conduction via the gas head cover, has not been much addressed. When the cooling water is close to the middle high-temperature area, the thermal resistance of the heat transfer process is greatly reduced, and the heat transfer effect is greatly improved.
6. Conclusions
This paper analyzed the heat transfer boundary of the gas head cover of hydrogen diaphragm compressors, based on which the simulation analysis was carried out to obtain the temperature distribution of the gas head cover, and a temperature test rig of a diaphragm compressor was built to measure the temperature of the gas head cover and verify the accuracy of the simulation calculation model. The main conclusions are as follows.
- The temperature field simulation analysis model established in this paper can calculate and has high accuracy to analyze the temperature distribution characteristics of the diaphragm compressor gas head cover of hydrogen refueling stations. The deviation between the measured temperature and the simulated value of each special measuring point is less than 9.1%.
- The region of the discharge holes is the core high-temperature zone of the diaphragm compressor, and the temperature exceeds 150 °C under the mother hydrogen refueling station conditions with suction pressure of 5 MPa and discharge pressure of 22 Mpa. From the discharge holes to the surroundings, the temperature gradient decreases. This is so because the central part has the maximum thermal resistance to the outside air and the highest temperature of the gas in contact with it.
- The temperature field simulation results of the two enhanced heat exchange head cover structures with different enhancing heat transfer methods are in good agreement with the measured values. This simulation method can be used to evaluate the heat dissipation effect of the head cover structure.
- The highest temperature and discharge are reduced by 14.1 °C and 16.1 °C with colling water around the discharge holes, respectively. This method successfully lowers the thermal resistance of heat dissipation in the middle high-temperature area, and significantly lowers the temperature, which can effectively solve the problem of the local excessive temperature of diaphragm compressors and enhance the reliability of diaphragm compressors for hydrogen refueling stations.
Author Contributions
Conceptualization, S.R.; Methodology, S.R.; Software, S.R.; Validation, S.R.; Investigation, J.Z.; Resources, X.J. and X.P.; Data curation, J.Z. and D.X.; Writing—original draft, S.R.; Writing—review & editing, X.J. and X.P.; Project administration, X.J. and X.P.; Funding acquisition, X.J. All authors have read and agreed to the published version of the manuscript.
Funding
This paper is supported by Inner Mongolia Major Science and Technology Major Project:2020ZD0022 and National Natural Science Foundation of China Grant No. 51876155.
Data Availability Statement
The data is unavailable due to privacy or ethical restrictions.
Conflicts of Interest
The authors declare that they have no known competing financial interests or personal relationships that could have appeared to influence the work reported in this paper.
Nomenclature
| Discharge temperature, K | |
| Suction temperature, K | |
| Discharge pressure, MPa | |
| Suction pressure, MPa | |
| Temperature adiabatic index | |
| Average temperature, K | |
| Convective heat transfer coefficient, W·m−2·K−1 | |
| Rate of decrease of heat transfer coefficient | |
| Radius of the gas cavity | |
| r | Radius |
| Blackness | |
| Stefan-Boltzmann constant | |
| Temperature of the outer surface, K | |
| Temperature of the environment, K | |
| Heat transfer coefficient of heat radiation, W·m−2·K−1 | |
| Heat transfer coefficient of air natural convective, W·m−2·K−1 | |
| Flow velocity of the gas flowing through the suction holes, m/s | |
| Flow velocity of the gas flowing through the discharge holes, m/s | |
| Volume flow rate in standard conditions, m3/h | |
| Pressure in standard conditions, MPa | |
| Temperature in standard conditions, K | |
| Compressibility factors in suction conditions | |
| Compressibility factors in discharge conditions | |
| Total sectional areas of suction holes, m2 | |
| Total sectional areas of discharge holes, m2 | |
| Reynolds numbers | |
| Kinematic viscosity | |
| Diameter of the small holes, m2 | |
| Nusselt number | |
| Prandtl number | |
| Thermal conductivity | |
| Exponent of the Prandtl number | |
| Heat transfer capacity of thermal radiation | |
| Heat transfer capacity of heat conduction | |
| Total heat transfer capacity | |
| Length of the nozzle, m | |
| Thermal conductivity of air |
References
- Zheng, F.; Zhou, X.; Rahat, B.; Rubbaniy, G. Carbon neutrality target for leading exporting countries: On the role of economic complexity index and renewable energy electricity. J. Environ. Manag. 2021, 299, 113558. [Google Scholar]
- Qin, L.; Kirikkaleli, D.; Hou, Y.; Miao, X.; Tufail, M. Carbon neutrality target for G7 economies: Examining the role of environmental policy, green innovation and composite risk index. J. Environ. Manag. 2021, 295, 113119. [Google Scholar]
- Espegren, K.; Damman, S.; Pisciella, P.; Graabak, I.; Tomasgard, A. The role of hydrogen in the transition from a petroleum economy to a low-carbon society. Int. J. Hydrogen Energy 2021, 46, 23125–23138. [Google Scholar]
- Muradov, N.Z.; Veziroğlu, T.N. “Green” path from fossil-based to hydrogen economy: An overview of carbon-neutral technologies. Int. J. Hydrogen Energy 2008, 33, 6804–6839. [Google Scholar]
- Winter, C. Hydrogen energy—Abundant, efficient, clean: A debate over the energy-system-of-change. Int. J. Hydrogen Energy 2009, 34, S1–S52. [Google Scholar]
- Acar, C.; Dincer, I. The potential role of hydrogen as a sustainable transportation fuel to combat global warming. Int. J. Hydrogen Energy 2020, 45, 3396–3406. [Google Scholar]
- Liu, F.; Zhao, F.; Liu, Z.; Hao, H. The impact of fuel cell vehicle deployment on road transport greenhouse gas emissions: The China case. Int. J. Hydrogen Energy 2018, 43, 22604–22621. [Google Scholar]
- Sherif, S.A.; Goswami, D.Y.; Stefanakos, E.L.; Steinfeld, A. (Eds.) Handbook of Hydrogen Energy; CRC Press: Boca Raton, FL, USA, 2014. [Google Scholar]
- Tarhan, C.; Çil, M.A. A study on hydrogen, the clean energy of the future: Hydrogen storage methods. J. Energy Storage 2021, 40, 102676. [Google Scholar]
- Kikukawa, S.; Yamaga, F.; Mitsuhashi, H. Risk assessment of Hydrogen fueling stations for 70 MPa FCVs. Int. J. Hydrogen Energy 2008, 33, 7129–7136. [Google Scholar]
- Chalk, S.G.; Miller, J.F.; Wagner, F.W. Challenges for fuel cells in transport applications. J. Power Source 2000, 86, 40–51. [Google Scholar]
- Bhogilla, S.S.; Niyas, H. Design of a hydrogen compressor for hydrogen fueling stations. Int. J. Hydrogen Energy 2019, 44, 29329–29337. [Google Scholar] [CrossRef]
- Weinert, J.X. A Near-Term Economic Analysis of Hydrogen Fueling Stations; Working Paper Series; Institute of Transportation Studies: Berkeley, CA, USA, 2005. [Google Scholar]
- Sdanghi, G.; Maranzana, G.; Celzard, A.; Fierro, V. Review of the current technologies and performances of hydrogen compression for stationary and automotive applications. Renew. Sustain. Energy Rev. 2019, 102, 150–170. [Google Scholar]
- Tian, Z.; Lv, H.; Zhou, W.; Zhang, C.; He, P. Review on equipment configuration and operation process optimization of hydrogen refueling station. Int. J. Hydrogen Energy 2022, 47, 3033–3053. [Google Scholar]
- Kermani, N.A.; Petrushina, I.; Nikiforov, A.; Jensen, J.O.; Rokni, M. Corrosion behavior of construction materials for ionic liquid hydrogen compressor. Int. J. Hydrogen Energy 2016, 41, 16688–16695. [Google Scholar]
- Reddi, K.; Elgowainy, A.; Sutherland, E. Hydrogen refueling station compression and storage optimization with tube-trailer deliveries. Int. J. Hydrogen Energy 2014, 39, 19169–19181. [Google Scholar] [CrossRef] [Green Version]
- Altukhov, S.M.; Kuznetsov, V.D.; Levin, G.A. Calculation of the volumetric characteristics of diaphragm compressors. Chem. Pet. Eng. 1971, 7, 671–675. [Google Scholar] [CrossRef]
- Lei, J.; Lin, Z.; Qian, Z.; Han, G.; Peng, L. Analysis of Diaphragm Compressor Exhausts Volume Decrease. In Proceedings of the 2013 Fifth International Conference on Measuring Technology and Mechatronics Automation, Hong Kong, China, 16–17 January 2013; pp. 233–235. [Google Scholar]
- Park, H.W.; Shin, Y.I.; Lee, Y.J.; Song, J.H.; Jeon, C.H. A Numerical Analysis on a Dependence of Hydrogen Diaphragm Compressor Performance on Hydraulic Oil Conditions. Trans. Korean Hydrog. New Energy Soc. 2009, 20, 471–478. [Google Scholar]
- Jia, X.; Zhao, Y.; Chen, J.; Peng, X. Research on the flowrate and diaphragm movement in a diaphragm compressor for a hydrogen refueling station. Int. J. Hydrogen Energy 2016, 41, 14842–14851. [Google Scholar]
- Ren, S.; Jia, X.; Jiang, J.; Zhang, S.; Zhao, B.; Peng, X. Effect of hydraulic oil compressibility on the volumetric efficiency of a diaphragm compressor for hydrogen refueling stations. Int. J. Hydrogen Energy 2022, 47, 15224–15235. [Google Scholar]
- Li, X.; Chen, J.; Wang, Z.; Jia, X.; Peng, X. A non-destructive fault diagnosis method for a diaphragm compressor in the hydrogen refueling station. Int. J. Hydrogen Energy 2019, 44, 24301–24311. [Google Scholar]
- Antonova, L.I.; Kalashnikov, V.F.; Degtyareva, T.S. Calculation of the reliability of the parametric and functional elements of diaphragm compressors. Chem. Pet. Eng. 1987, 23, 153–155. [Google Scholar]
- Lu, W.; Wang, X.; Cong, Y. Analysis on factors influencing diaphragm life of diaphragm compressors. China Sci. Technol. Overv. 2019, 4, 93–94. [Google Scholar]
- Jia, X.; Chen, J.; Wu, H.; Peng, X. Study on the diaphragm fracture in a diaphragm compressor for a hydrogen refueling station. Int. J. Hydrogen Energy 2016, 41, 6412–6421. [Google Scholar]
- Hu, Y.; Xu, X.; Wang, W. A new cavity profile for a diaphragm compressor used in hydrogen fueling stations. Int. J. Hydrogen Energy 2017, 42, 24458–24469. [Google Scholar]
- Li, J.Y.; Chen, J.H.; Zhao, H.L.; Wang, S.Y.; Jia, X.H. Theoretical analysis of diaphragm fracture in diaphragm compresssor. Eng. Mech. 2015, 32, 192–197. [Google Scholar]
- Li, J.; Jia, X.; Wu, Z.; Peng, X. The cavity profile of a diaphragm compressor for a hydrogen refueling station. Int. J. Hydrogen Energy 2014, 39, 3926–3935. [Google Scholar]
- Li, J.; Lin, L.; Jia, X.; Peng, X. A new generatrix of the cavity profile of a diaphragm compressor. Proc. Inst. Mech. Eng. Part C J. Mech. Eng. Sci. 2014, 228, 1754–1766. [Google Scholar]
- Li, J.Y.; Jia, X.H.; Jiang, R.M.; Peng, X.Y. Optimization Design of Diaphragm Compressor Cavity Contour with New Generatrix. Compress. Technol. 2013, 6–10. [Google Scholar] [CrossRef]
- Li, J.; Zhao, X.; Jia, X.; Peng, X. Design and experimental verification for diaphragm compressor cavity profile by two exponential terms generatrix. J. Xi’an Jiaotong Univ. 2014, 48, 127–132. [Google Scholar]
- Wang, T.; Jia, X.; Li, X.; Ren, S.; Peng, X. Thermal-structural coupled analysis and improvement of the diaphragm compressor cylinder head for a hydrogen refueling station. Int. J. Hydrogen Energy 2020, 45, 809–821. [Google Scholar]
- Wang, T.; Tang, Z.; Jia, X. Study on the stress and deformation of a diaphragm compressor cylinder head under extreme conditions. IOP Conf. Ser. Mater. Sci. Eng. 2019, 604, 12029. [Google Scholar] [CrossRef]
- Arasteh, H.; Mashayekhi, R.; Ghaneifar, M.; Toghraie, D.; Afrand, M. Heat transfer enhancement in a counter-flow sinusoidal parallel-plate heat exchanger partially filled with porous media using metal foam in the channels’ divergent sections. J. Therm. Anal. Calorim. 2020, 141, 1669–1685. [Google Scholar]
- El-Shorbagy, M.A.; Eslami, F.; Ibrahim, M.; Barnoon, P.; Xia, W.; Toghraie, D. Numerical investigation of mixed convection of nanofluid flow in a trapezoidal channel with different aspect ratios in the presence of porous medium. Case Stud. Therm. Eng. 2021, 25, 100977. [Google Scholar]
- Ahmadi, G.; Toghraie, D.; Akbari, O.A. Technical and environmental analysis of repowering the existing CHP system in a petrochemical plant: A case study. Energy 2018, 159, 937–949. [Google Scholar]
- Yang, S.; Tao, W. Heat Transfer; Higher Education Press: Beijing, China, 2006; pp. 246–249. [Google Scholar]
- Barthélémy, H. Effects of pressure and purity on the hydrogen embrittlement of steels. Int. J. Hydrogen Energy 2011, 36, 2750–2758. [Google Scholar] [CrossRef]
- Shin, H.; Custodio, N.A.; Baek, U. Numerical analysis for characterizing hydrogen embrittlement behaviors induced in STS316L stainless steel using an in-situ small-punch test. Theor. Appl. Fract. Mech. 2021, 116, 103139. [Google Scholar]
Figure 1.
Structure of the diaphragm compressor.

Figure 2.
Heat transfer processes of the gas head cover.

Figure 3.
Heat transfers between the gas and the surfaces of the holes. (a) Discharge holes. (b) Suction holes.
Figure 3.
Heat transfers between the gas and the surfaces of the holes. (a) Discharge holes. (b) Suction holes.

Figure 4.
Heat transfers between the surfaces of nozzles and the gas head cover.

Figure 5.
Model of the gas head cover assembly.

Figure 6.
Mesh around the discharge holes.

Figure 7.
Positions of feature points.

Figure 8.
Results of mesh independence verification.

Figure 9.
Temperature test rig.

Figure 10.
Positions of the temperature measurement points.

Figure 11.
Temperature distribution of the gas head cover.

Figure 12.
Temperature with different natural convection heat transfer coefficients.

Figure 13.
Structure of augmented heat transfer of the outer surface.

Figure 14.
Structure of augmented heat transfer of the core high-temperature zone.

Figure 15.
Temperature distribution with augmented heat transfer of outer surface.

Figure 16.
Temperature distribution with augmented heat transfer of the core high-temperature zone.


Table 1.
Main parameters of the gas head cover.
| Parameters | Values/mm |
|---|---|
| Diameter of the gas head cover | 615 |
| Thickness of the gas head cover | 160 |
| Diameter of the nozzles | 54 |
| Diameter of the hole in the gas head cover | 56 |
| Diameter of the suction and discharge small holes | 4 |
Table 2.
Comparison of measured temperature and simulation results.
| Positions | Point 1 | Point 2 | Point 3 | Point 4 | Point 5 | Point 6 |
|---|---|---|---|---|---|---|
| Measured temperature (°C) | 165.2 | 123.5 | 132.3 | 146.3 | 134.2 | 124.6 |
| Simulated temperature (°C) | 162 | 134.8 | 142.5 | 138.3 | 125.1 | 135.4 |
| Deviation | 1.8% | 9.1% | 7.7% | 5.5% | 6.8% | 8.7% |
Table 3.
Temperatures under different gas head cover structures.
| Structures | No Heat Transfer Enhancement | Augmented Heat Transfer of Outer Surface | Augmented Heat Transfer of Core High-Temperature Zone |
|---|---|---|---|
| Measured discharge temperature (°C) | 171.5 | 169.2 | 155.4 |
| Simulated highest temperature (°C) | 162.2 | 160.4 | 148.2 |
| Point 1 Simulated/Measured (°C) | 162/165.2 | 160.1/164.7 | 147.9/147.2 |
| Point 2 Simulated/Measured (°C) | 134.8/123.5 | 121.9/112.5 | 88.6/82.6 |
| Point 3 Simulated/Measured (°C) | 142.5/132.3 | 127.4/121.8 | 93.9/89.6 |
| Point 4 Simulated/Measured (°C) | 138.3/146.3 | 122.2/131.1 | 46.8/50.2 |
| Point 5 Simulated/Measured (°C) | 125.1/134.2 | 72.7/75.1 | 37.9/40.3 |
| Point 6 Simulated/Measured (°C) | 135.4/124.6 | 117.7/105.5 | 119.6/111.9 |
Disclaimer/Publisher’s Note: The statements, opinions and data contained in all publications are solely those of the individual author(s) and contributor(s) and not of MDPI and/or the editor(s). MDPI and/or the editor(s) disclaim responsibility for any injury to people or property resulting from any ideas, methods, instructions or products referred to in the content. |
© 2023 by the authors. Licensee MDPI, Basel, Switzerland. This article is an open access article distributed under the terms and conditions of the Creative Commons Attribution (CC BY) license (https://creativecommons.org/licenses/by/4.0/).
Share and Cite
MDPI and ACS Style
Ren, S.; Jia, X.; Zhang, J.; Xin, D.; Peng, X. Analysis of Heat Transfer of the Gas Head Cover of Diaphragm Compressors for Hydrogen Refueling Stations. Processes 2023, 11, 2274. https://doi.org/10.3390/pr11082274
AMA Style
Ren S, Jia X, Zhang J, Xin D, Peng X. Analysis of Heat Transfer of the Gas Head Cover of Diaphragm Compressors for Hydrogen Refueling Stations. Processes. 2023; 11(8):2274. https://doi.org/10.3390/pr11082274
Chicago/Turabian StyleRen, Shengdong, Xiaohan Jia, Jiatong Zhang, Dianbo Xin, and Xueyuan Peng. 2023. "Analysis of Heat Transfer of the Gas Head Cover of Diaphragm Compressors for Hydrogen Refueling Stations" Processes 11, no. 8: 2274. https://doi.org/10.3390/pr11082274
Note that from the first issue of 2016, this journal uses article numbers instead of page numbers. See further details here.