Article

Reinforcement Learning and Stochastic Optimization with Deep Learning-Based Forecasting on Power Grid Scheduling

1
Polytechnic Institute, Zhejiang University, Hangzhou 310027, China
2
Alibaba Group, Hangzhou 311121, China
3
School of Electrical Engineering and Automation, Harbin Institute of Technology, Harbin 150006, China
*
Author to whom correspondence should be addressed.
These authors contributed equally to this work.
Processes 2023, 11(11), 3188; https://doi.org/10.3390/pr11113188
Submission received: 26 September 2023 / Revised: 23 October 2023 / Accepted: 31 October 2023 / Published: 8 November 2023
(This article belongs to the Special Issue Process Design and Modeling of Low-Carbon Energy Systems)

Abstract

:
The emission of greenhouse gases is a major contributor to global warming. Carbon emissions from the electricity industry account for over 40% of the total carbon emissions. Researchers in the field of electric power are making efforts to mitigate this situation. Operating and maintaining the power grid in an economic, low-carbon, and stable environment is challenging. To address the issue, we propose a grid dispatching technique that combines deep learning-based forecasting technology, reinforcement learning, and optimization technology. Deep learning-based forecasting can forecast future power demand and solar power generation, while reinforcement learning and optimization technology can make charging and discharging decisions for energy storage devices based on current and future grid conditions. In the optimization method, we simplify the complex electricity environment to speed up the solution. The combination of proposed deep learning-based forecasting and stochastic optimization with online data augmentation is used to address the uncertainty of the dispatch system. A multi-agent reinforcement learning method is proposed to utilize team reward among energy storage devices. At last, we achieved the best results by combining reinforcement and optimization strategies. Comprehensive experiments demonstrate the effectiveness of our proposed framework.

Graphical Abstract

1. Introduction

Nowadays, with the rapid development of artificial intelligence (AI), household appliances and equipment intelligence are gradually becoming popularized. More and more families are installing home solar power generation equipment and small-scale energy storage equipment, not only to meet their own electricity needs but also to sell excess power through the sharing network. If we can make home electricity use more efficient, then the community power grid will be more economical and low-carbon. Furthermore, the efficient and stable of community power grid can provide a guarantee for the stability of the national power grid.
Electricity research generally includes Large-scale Transmission Grids (LTG for short) and Small-scale Micro-Grids (SMG for short). LTG focuses on high-voltage and long-distance power transmission, while SMG focuses on electricity consumption in small areas such as schools, factories, or residential areas. We focus on smart scheduling techniques in SMG. For example, Figure 1 shows a case of SMG. Households can generate electricity from solar energy, store the excess power, and share with neighbors on the grid network (green arrows). When neither self-generated power nor a shared network can provide enough electricity, power is supplied by the national grid (orange lines). The national grid generates electricity through wind power, hydroelectric, and thermal. The cost of electricity and carbon emissions vary over time. In this paper, we use an AI-based approach to enable efficient scheduling of household storages. The AI-based scheduling method leads to economical and decarbonized electricity use.
In the power generation process, increasing the proportion of new energy sources is one of the most important methods to reduce carbon emissions. The use of new energy sources, such as wind power and solar power, reduces carbon emissions for the grid network but adds more uncertainty to the entire power network. For example, solar power generation is affected by the weather, and if future weather changes cannot be accurately predicted, then this will affect the scheduling program of other power generation methods in the power network. Uncertainty in new energy generation poses a great challenge to traditional dispatch systems. We categorize the uncertainty as data drift: the relation between input data and the target variables’ changes over time [1]. For example, the sequential transition in a time series of renewable energy generation can be fluctuating (e.g., wind power and solar power).
The field of AI-based forecasting is continuously evolving. AI-based forecasting methods have been applied to predict the spread of contagious diseases such as COVID-19 [2], demonstrating their potential in public health applications. Deep learning techniques, including recurrent neural network (RNN) and long short-term memory (LSTM) networks [3], have been extensively studied for time series forecasting, showing promising results. Neural network architectures, such as feed-forward neural networks and convolutional neural network (CNN) [4], have been explored for time series forecasting, contributing to the advancement of AI-based forecasting models [5]. These studies provide insights into the use of advanced AI-based forecasting techniques and their applications in different domains, especially in the time series forecasting domain. Therefore, in the electricity power domain, we involve a deep learning-based method to predict future user demand and renewable generation (the task can be regarded as a sub-domain of time series forecasting domain).
For the problem of uncertainty, classical model predictive control (MPC)-based methods use rolling control to correct the parameters by realizing the feedback of rolling [6,7]. However, the effect is not up to expectations in practical applications. Taking industrial application as an example, the sequential MPC framework can usually be decomposed into point prediction of target variables (e.g., solar power generation), followed by deterministic optimization, which is unable to capture the uncertainty of probabilistic data distribution [8,9]. To solve the above problems, stochastic-based methods have been proposed, and they are able to eliminate the effects caused by some uncertainties.
Taking into account the uncertainty in forecasting, it is possible to improve energy efficiency by 13% to 30% [10,11]. Stochastic-based methods mainly include two types: one that requires prior knowledge of system uncertainty [12,13], and another is based on scenarios, generating values for multiple random variables [14,15]. Additionally, adaptive methods are also applied in the presence of uncertainty [16,17,18]. In this paper, enhanced generalization capability is achieved by combining stochastic optimization with online adaptive rolling updates.
Despite some recent progress, it is difficult for the existing system to meet the demand of real-time scheduling due to the huge number of SMGs and high model complexity. Under the requirement of real-time scheduling, the attempt of reinforcement learning in power grids is gradually emphasized.
Reinforcement learning has been proven to give real-time decisions in several domains and has the potential to be effectively applied in the power grid scenarios. In Large-scale Transmission Grids (LTG), reinforcement learning has not yet been successfully applied due to security concerns. In Small-scale Micro-Grids (SMG), where economy is more important (security can be guaranteed by the up-level grid network), reinforcement learning is gradually starting to be tried. In reinforcement learning, the model learns by trial and error through constant interaction with the environment [19] and ultimately obtains the best cumulative reward. Training for reinforcement learning usually relies on a simulation environment, which is assumed to be provided in this paper. Unlike the existing single agent approach, in this paper, we propose a multi-agent reinforcement learning method to adapt a grid scheduling task. Reinforcement learning in electricity power scheduling offers the potential to enhance the efficiency, reliability, and sustainability of power systems, leading to cost savings, reduced environmental impact, and improved overall performance. The main contributions of this paper are:
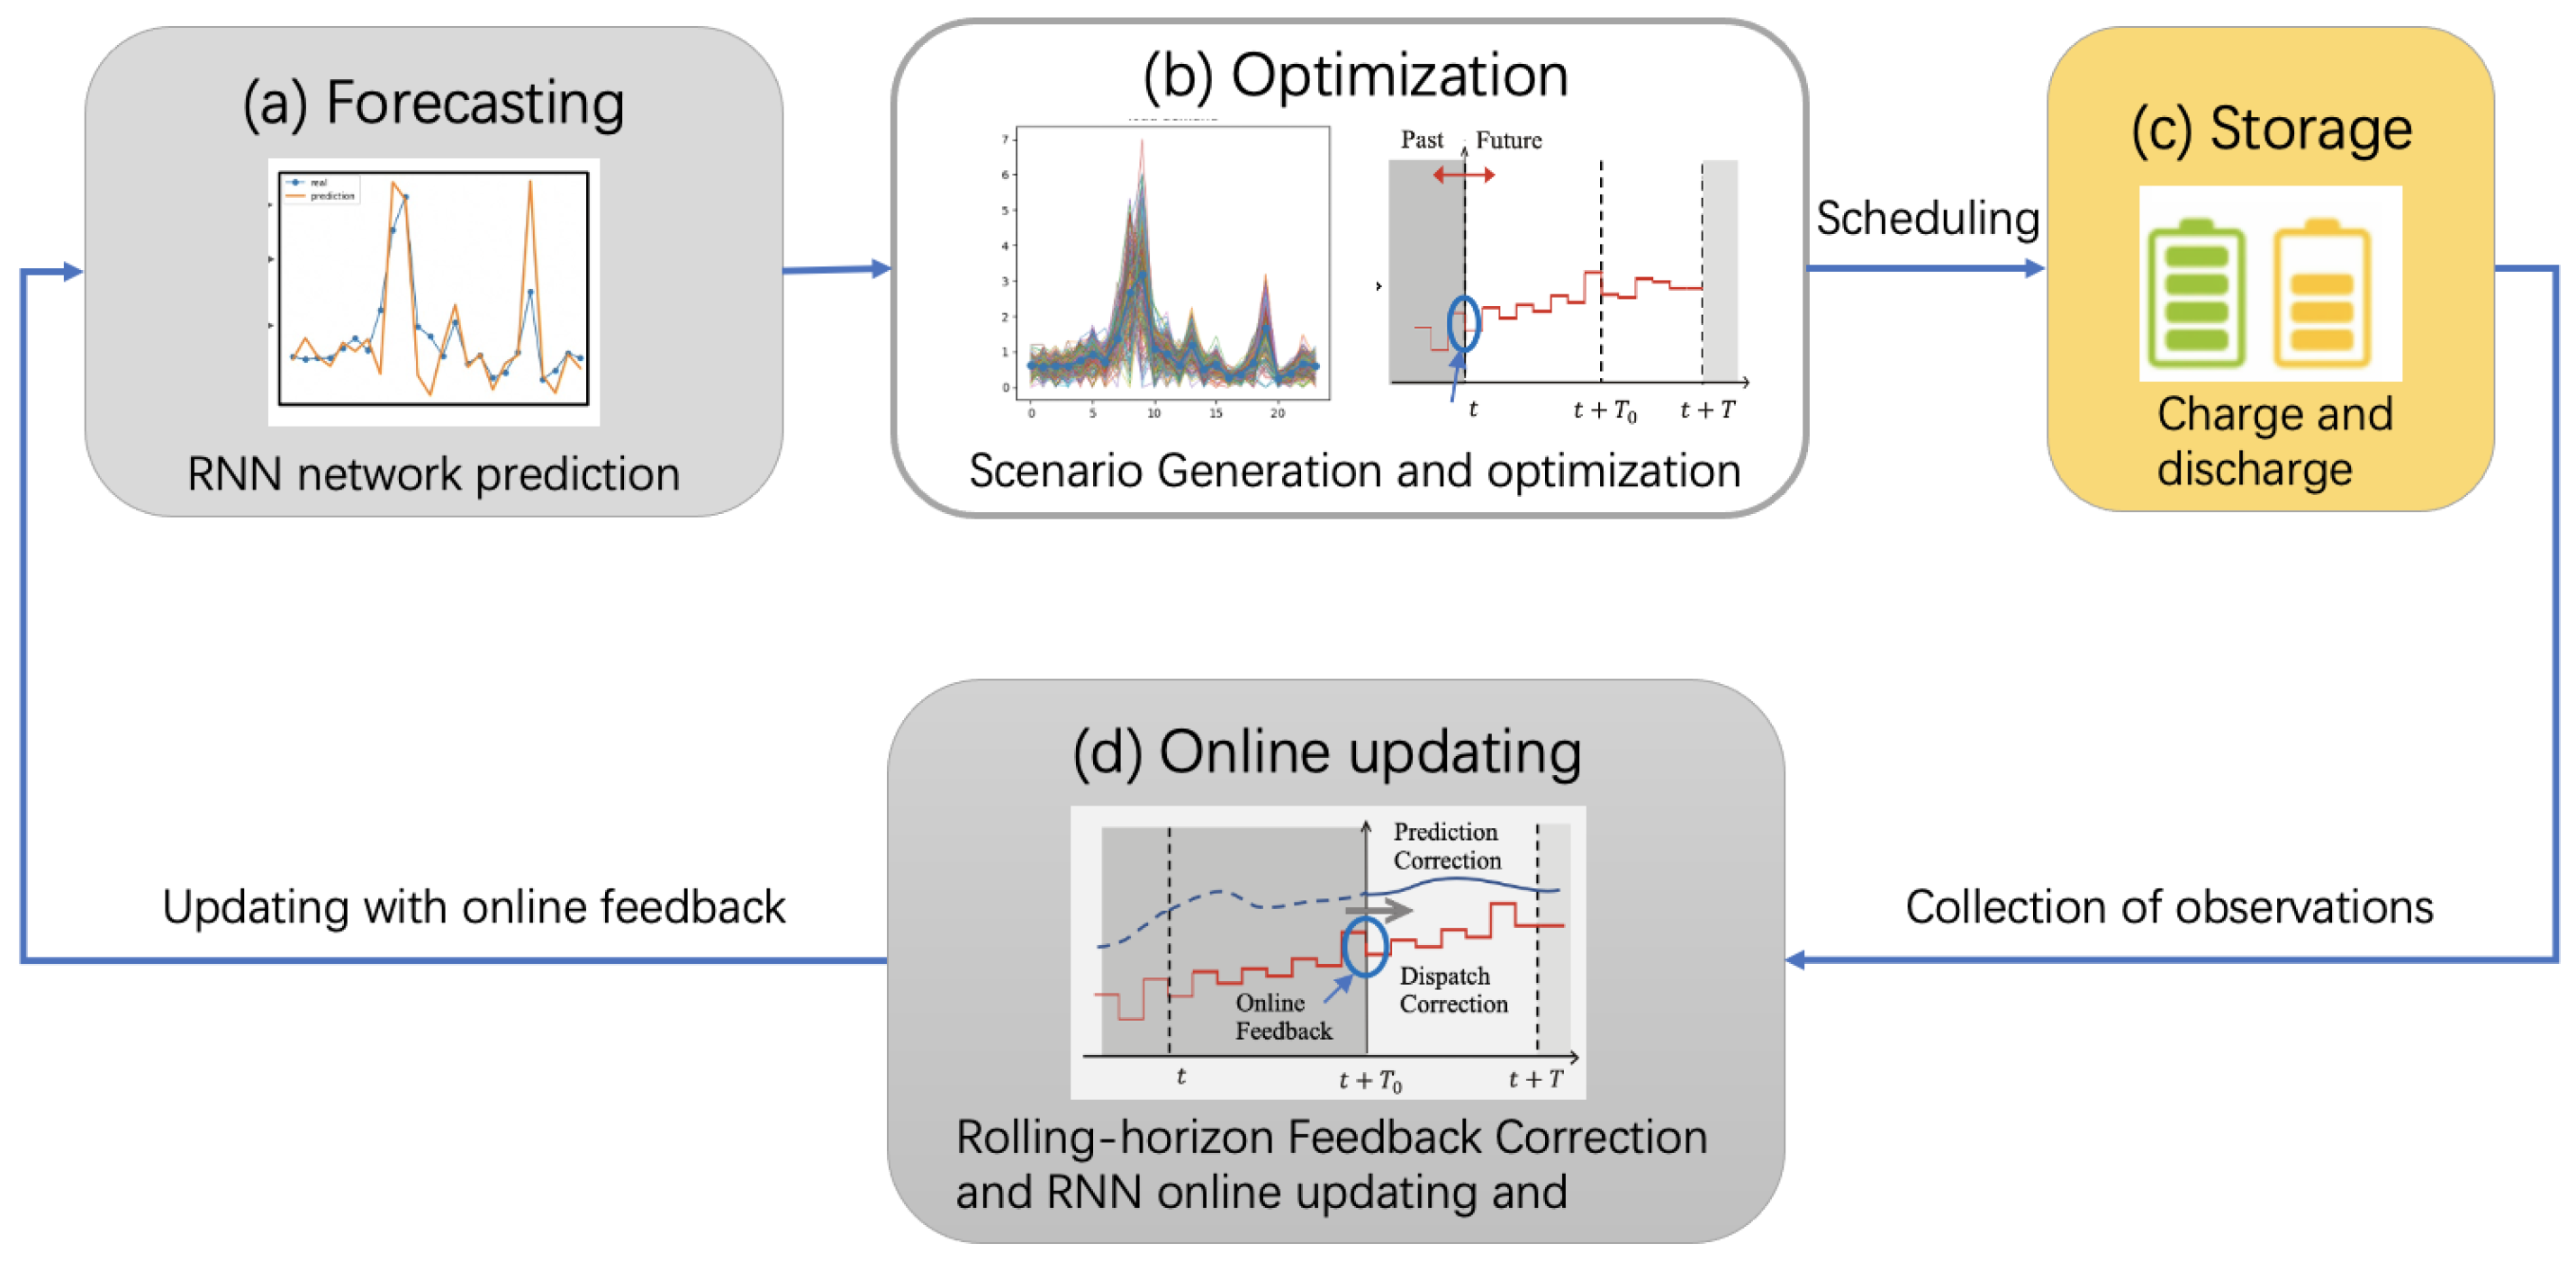
  • To adapt to uncertainty, we propose two modules to achieve robust scheduling. One module combines deep learning-based prediction techniques with stochastic optimization methods, while the other module is an online data augmentation strategy, including stages of model pre-training and fine-tuning.
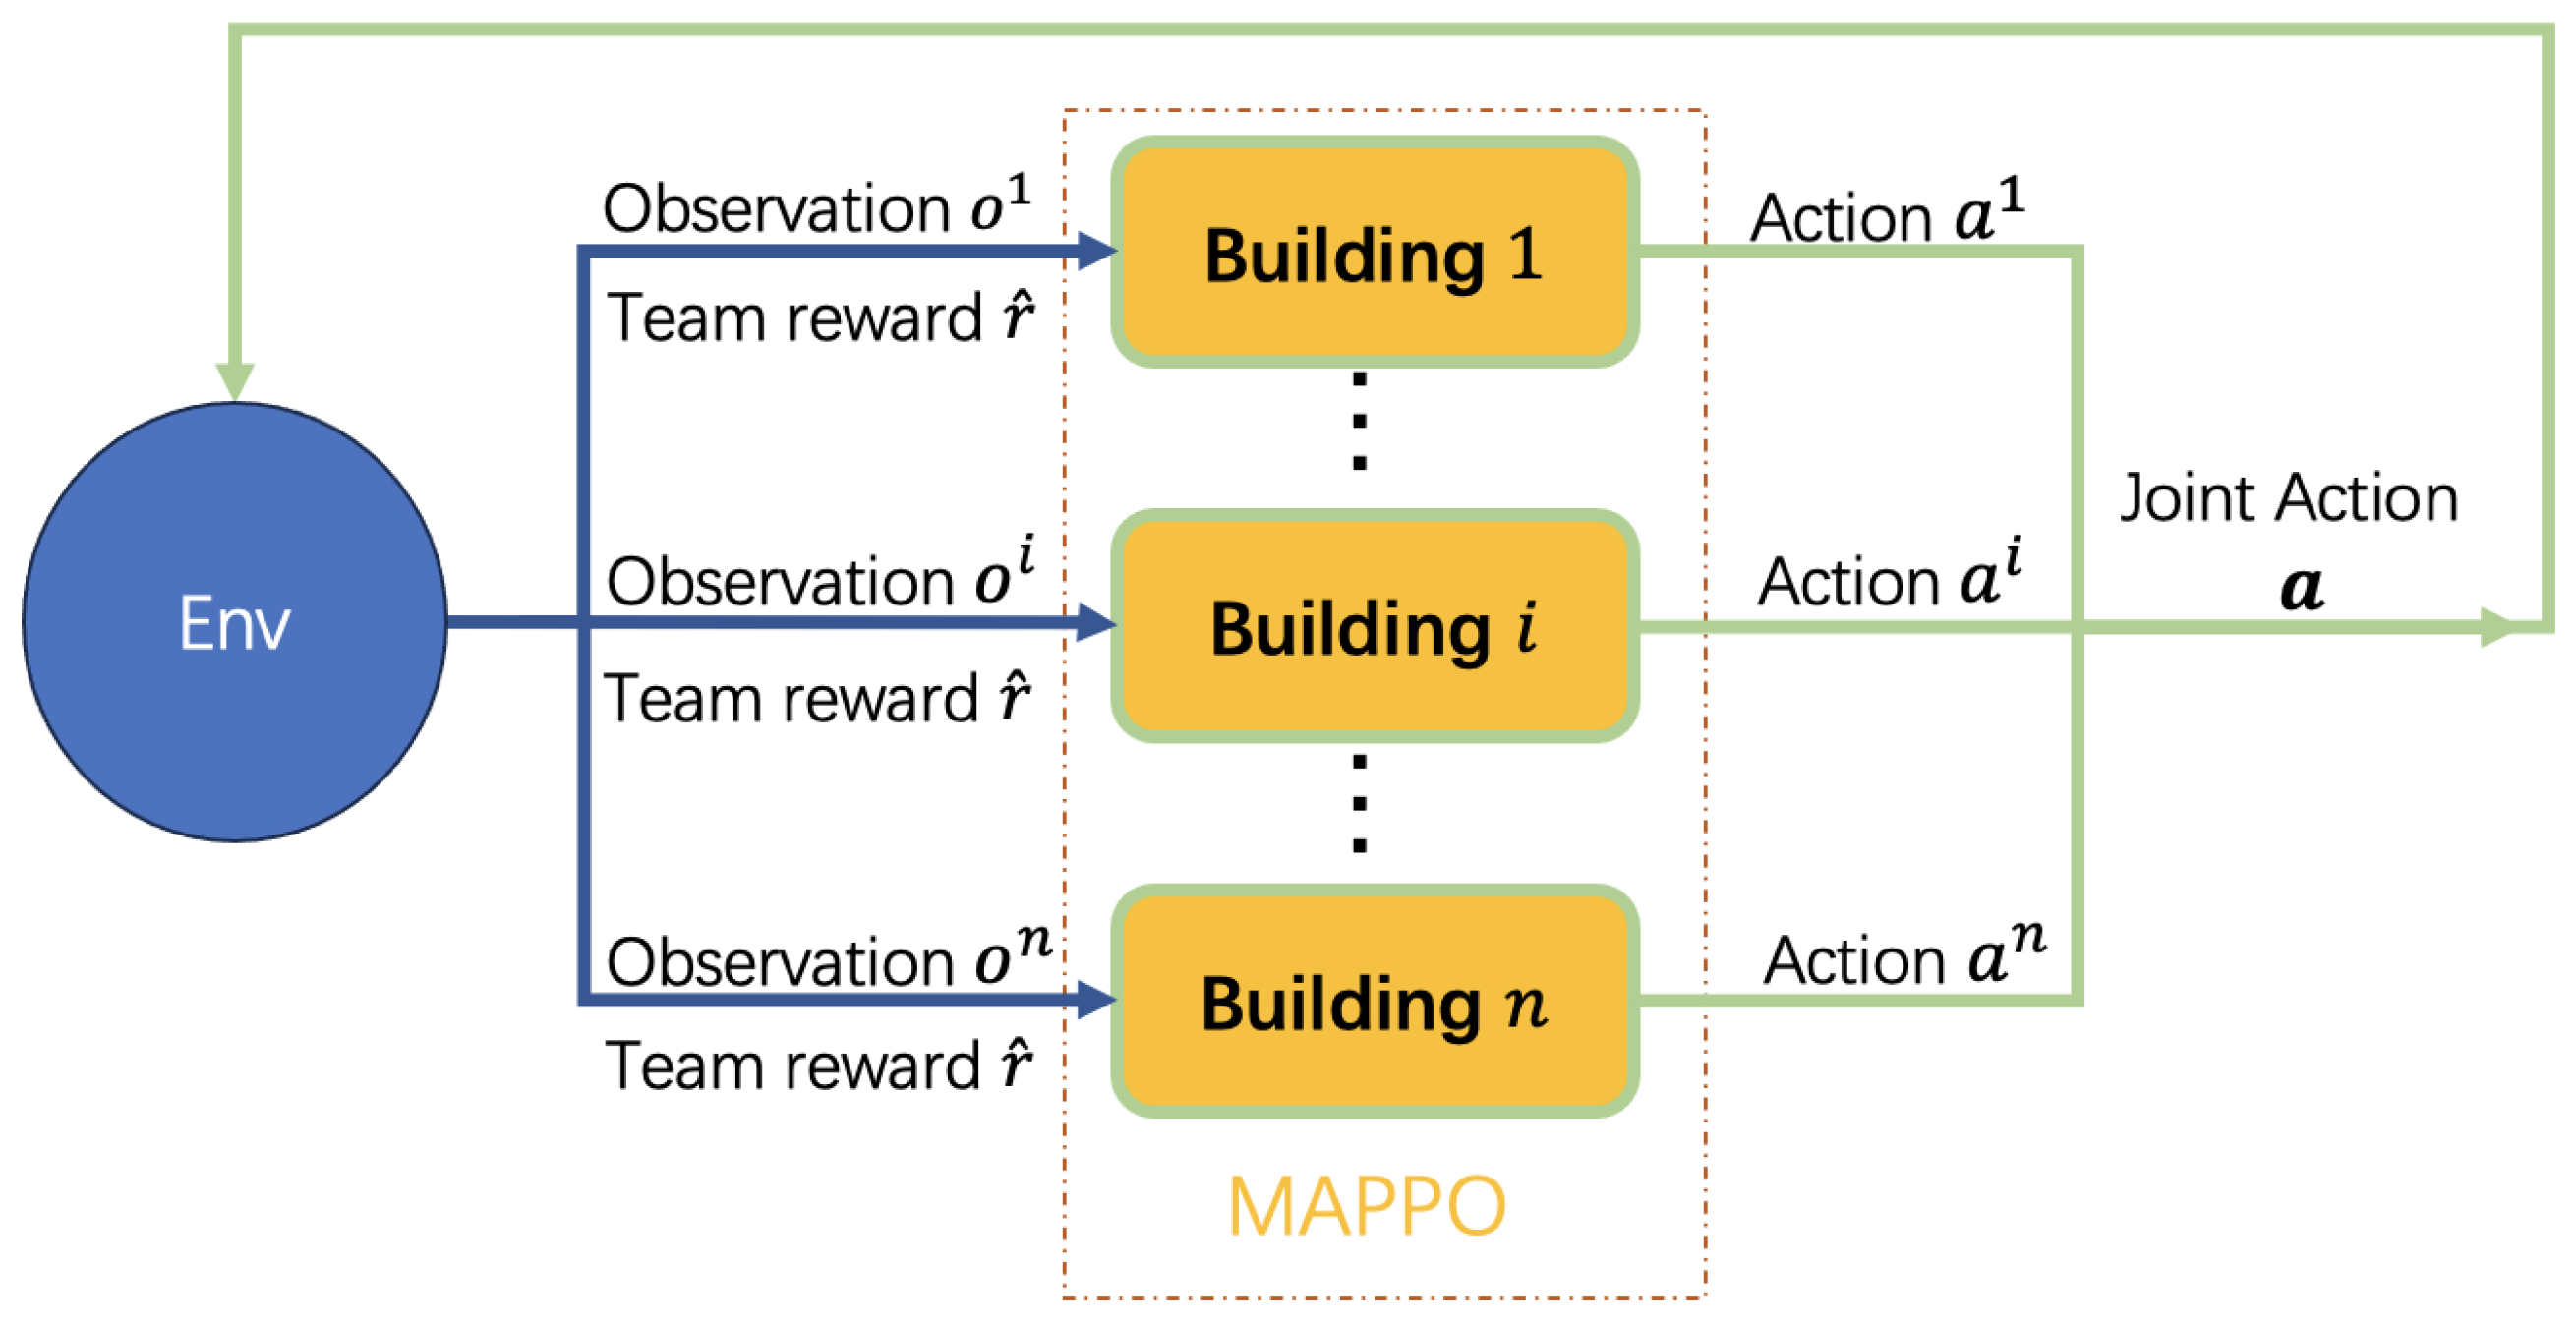
  • In order to realize sharing rewards among buildings, we propose to use multi-agent PPO to simulate each building. Additionally, we provide the ensemble method between reinforcement learning and optimization methods.
  • We conducted extensive experiments on a real-world scenario and the results demonstrate the effectiveness of our proposed framework.

2. Problem Statement

Generally, SMG contains various types of equipment, including solar generation machines (denoted as G ), storage devices (denoted as S ), and other user devices (denoted as U ). M denotes the markets, such as carbon and electricity. The total decision steps is set to T. We define the load demand of the user as: L u , t , where step t T = { 1 , , T } and u U . p t is the market price as time t per unit or the average price among M .
The variables in SMG include the electricity need from the national grid (denoted as P grid , t ), the power generation of device g G (denoted as P g , t ), the charging or discharging of storage (denoted as P s , t + or P s , t ), and the state of charge of device s S (denoted as E s , t ). We define the decision variables as: X = { P grid , t , P g , t , P s , t + , P s , t , E s , t } , where t T , s S , g G , and then the objective is to minimize the total cost of all markets, which is defined [20]:
minimize X t = 1 T p t · P grid , t
s.t.:
P grid , t 0             t T
P g , t min P g , t P g , t max g G , t T
0 P s , t + P s , t + max 0 P s , t P s , t max P s , t + · P s , t = 0 s S , t T
E s , t min E s , t E s , t max s S , t T E s , t = E s , t 1 + P s , t + P s , t s S , t T { 1 }
P grid , t + g G P g , t + s S P s , t = s S P s , t + + u U L u , t t T
To facilitate the understanding of the above constraints, we explain each formula with details:
(2)
Electricity need bounds from national grid: larger than zero and without upper bounds.
(3)
( P g , t min ) denotes the lower bound of each electricity generation device, such as solar generation, while ( P g , t max ) denotes the upper bound.
(4)
( P s , t + max ) represents the upper limit for battery/storage charging at timestamp t, while ( P s , t max ) represents the upper limit for discharging.
(5)
E s , t min represents the lower value of soc (state of charge), while E s , t max denotes the upper value, and the second equation denotes the updating of the soc.
(6)
This equation makes sure the power grid is stable (the sum of power generation is equal to the sum of power consumption).
In practical application scenarios, it is not possible to obtain exact data on market prices, new energy generation, and user loads in advance when conducting power scheduling. Therefore, it is necessary to predict these values before making decisions. In the following, we will provide a detailed introduction to our solution.

3. Framework

3.1. Feature Engineering

Feature engineering provides input for the subsequent modules, including the forecasting module, reinforcement learning module, and optimization method module. We extract features for each building (the detailed building information will be introduced in the subsequent dataset section). Due to the different scales of features, we normalize all features X as follows:
x n e w = x o l d m a x ( X ) m i n ( X ) + ϵ
where x n e w is the normalized output, m a x ( X ) denotes the max value of each domain, while m i n ( X ) represents the minimum, and ϵ is a value that prevents the denominator from being zero.
Moreover, to eliminate the influence of some outliers, we also performed data denoising processes as:
x n e w = ( 1 + α ) a v g ( X ) , if x o l d ( 1 + α ) a v g ( X ) ( 1 α ) a v g ( X ) , if x o l d ( 1 α ) a v g ( X ) x o l d , else
where α is a pre-set adjustable parameter, and a v g ( X ) represents the average value of the feature. We truncate the outliers that exceed a certain percentage of the average value.
We show the key feature components of continuous modules. For the forecasting module:
  • The user loads of past months;
  • The electricity generation of past months;
  • The radiance of solar direct or diffuse;
  • Detailed time including the hour of the day, the day of the week, and the day of the month;
  • The forecasting weather information including the values of humidity, temperature, and so on;
For the reinforcement learning module and optimization method module:
  • The key components detailed before;
  • The predictions of user load and electricity generation;
  • The number of solar generation units in each building;
  • The efficiency and capacity of the storage in each building;
  • Market prices including the values for electricity and carbon;

3.2. Deep Learning-Based Forecasting Model

The deep learning-based forecasting module generates the corresponding input data for the next modules, including the optimization method module (or reinforcement learning module). The target variables include user load (denoted as L u , t ), market prices (denoted as p t ), and capacity of solar generation (denoted as P g , t max ). The input features of the forecasting models are listed in the Feature Engineering part before.
In sequence prediction tasks, deep neural network methods have gradually become state-of-the-art (SOTA). Gated Recurrent Unit (GRU for short) is one of the most commonly applied types of recurrent neural network with a gating mechanism [21]. We employ recurrent neural network (RNN) with a GRU in our approach. Additionally, our framework can easily adapt to any other neural networks, including CNNs and transformers. Compared to other variants of recurrent networks, RNN shows good performance in small datasets with a gated mechanism [22]. Thus, when given the input sequence x = ( x 1 , , x T ) , the RNN we used is described as [23]:
h t = ϕ 1 h t 1 , x t , y t = ϕ 2 h t , t T ,
where h t denotes the hidden state of RNN at time t, y t denotes the corresponding output, and ϕ 1 and ϕ 2 represent the non-linear functions (active function or the combination with affine transformation). Fitting maximum likelihood on the training data, the model is able to predict f L u , f p , and f P g , corresponding to user load, market prices, and capacity of solar generation, respectively. Moreover, since each of our modules is decoupled, it is easy to incorporate the predictions of any other forecasting methods into the framework.

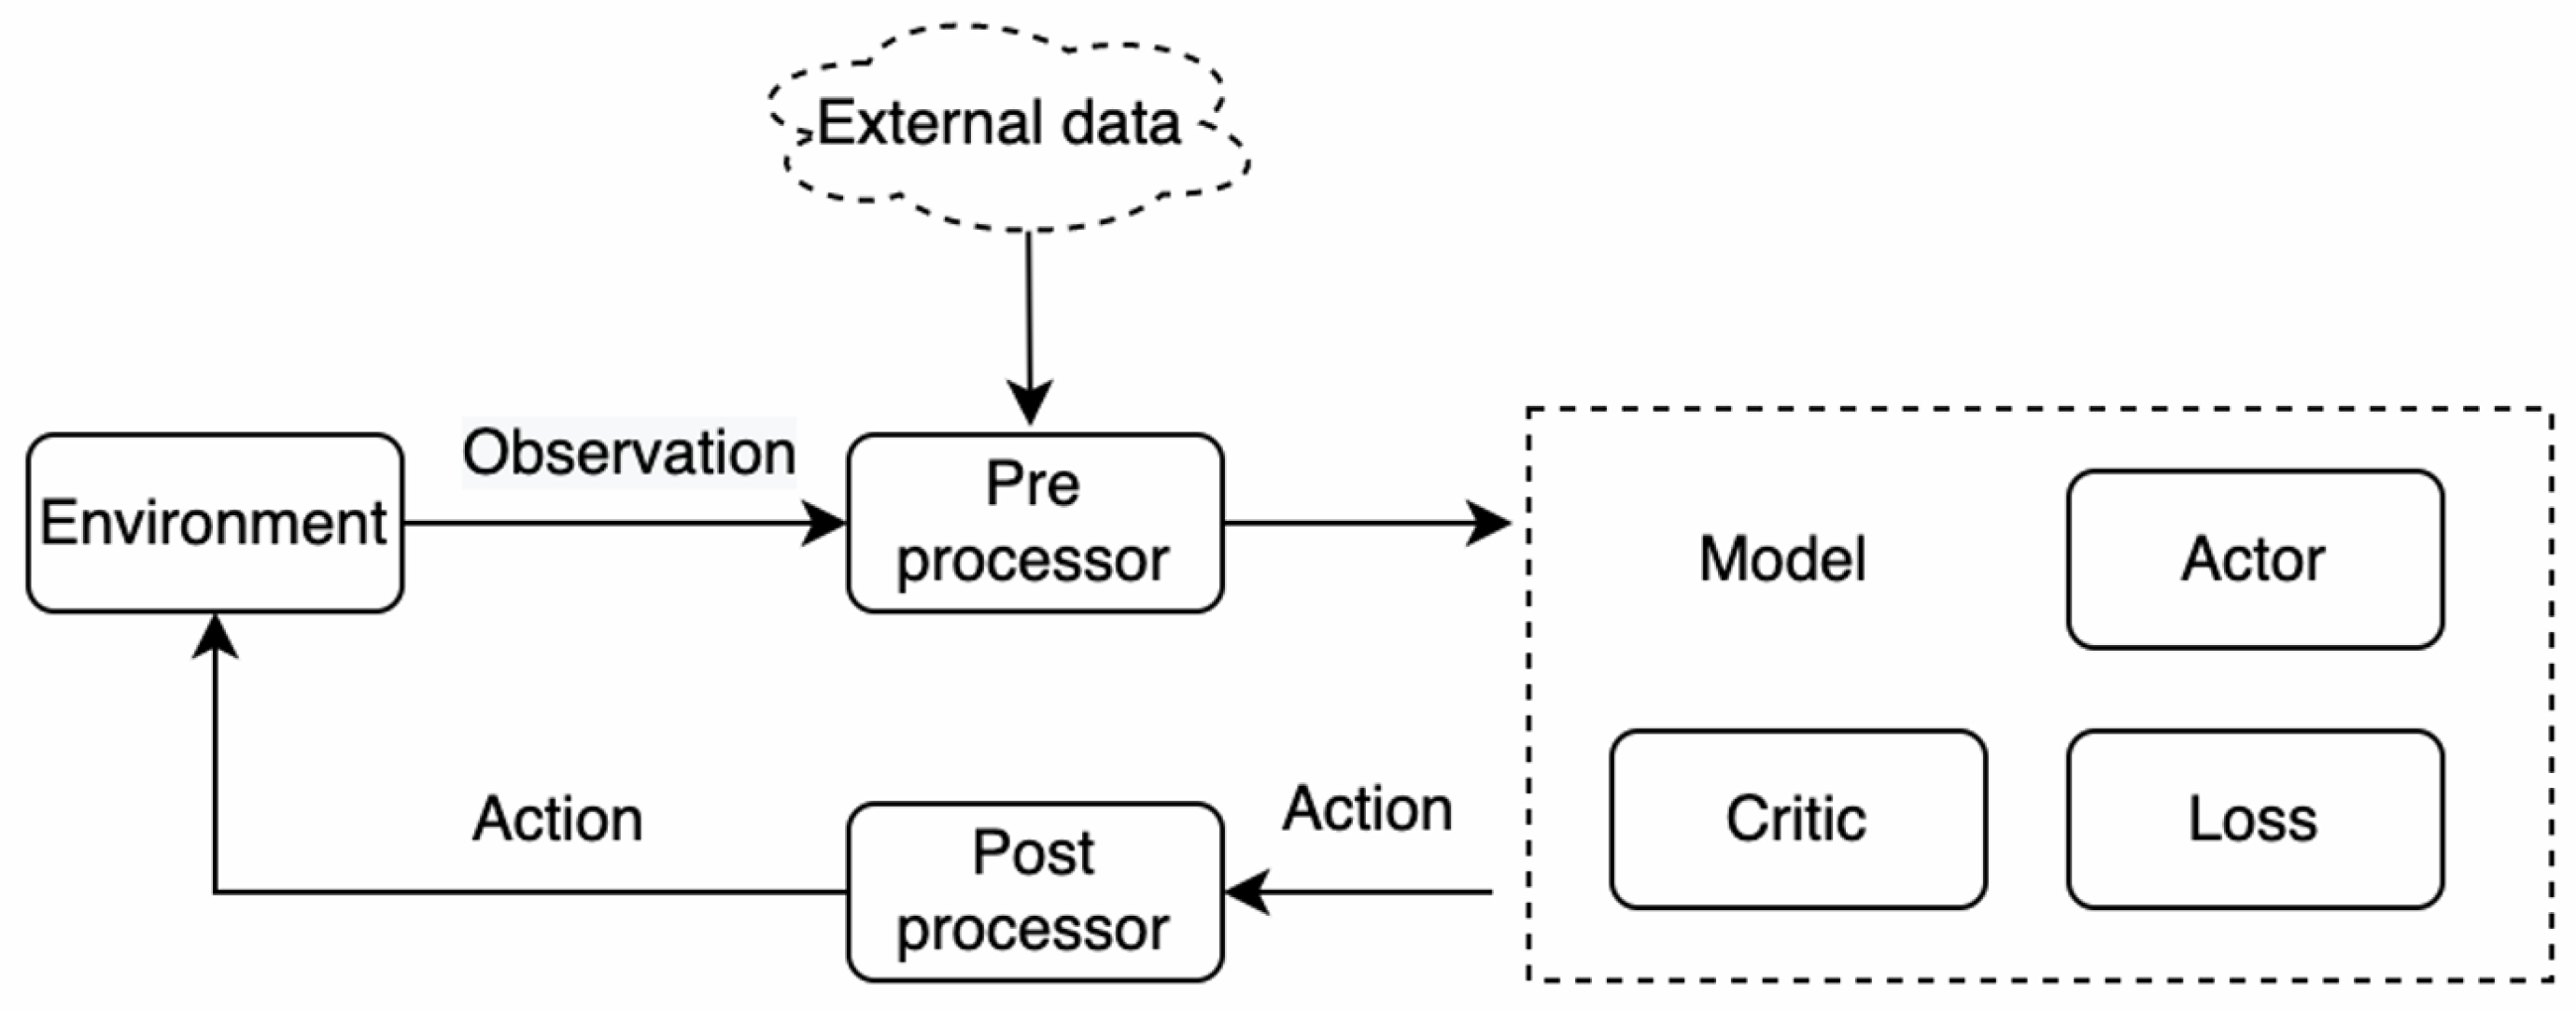
3.3. Reinforcement Learning

In most scenarios, reinforcement learning can provide real-time decision-making, but the safety of these decisions cannot be guaranteed. Therefore, reinforcement learning has not been practically applied in LTG. However, SMG serves as a good testing ground for reinforcement learning. Due to the fact that SMG does not require the calculation of power flow in the network, in the training process, the interaction between the agent and the simulation environment can be conducted within a limited time. Since its proposal, Proximal Policy Optimization (PPO) [19] has been validated to achieve good results in various fields. Therefore, here, we model and adapt the power grid environment based on the PPO method.
The reinforcement learning framework we principally used for SGM, as shown in Figure 2, includes several parts: simulation environment module, external data input module, data preprocessor module, model module, and result postprocessor module. The simulation environment simulates and models the microgrid, mainly using past years’ real data for practice simulations. External input data includes real-time climate information obtained from websites. The data preprocessor filters and normalizes the observed data. The model module consists of multi-agent PPO (MAPPO), which includes multiple neural network modules and loss function design. The final result postprocessor module handles the boundaries of the model’s output, such as checking whether the output of the generator exceeds the physical limits.
Most existing applications of reinforcement learning focus on single-agent methods, including centralized PPO (CPPO) and individual PPO (IPPO) [24]. As shown in Figure 3, CPPO learns the model by consolidating all inputs and interacting with the SMG. On the other hand, IPPO involves independent inputs for multiple learning instances. In the case of an SMG, each input represents a generation or consumption unit, such as a building.
In practical scenarios, there are various types of SMG, including factories, residential communities, schools, hospitals, etc. Therefore, the framework should be able to adapt to different types of SMG. The CPPO method mentioned above concatenates all inputs as one input each time, which cannot be applied to SMG with different inputs. For example, a model trained on a school SMG with 10 teaching buildings cannot be quickly adapted and applied to one with 20 teaching buildings. To address this issue, the IPPO method is introduced, which allows all teaching buildings to be inputted into the same agent in batches. However, in actual SMG, information sharing among teaching buildings is crucial. For example, the optimal power scheduling plan needs to be achieved through sharing solar energy between teaching buildings in the east and west. Since IPPO only has one agent, it cannot model the information sharing. Based on this, we propose a multi-agent PPO (MAPPO) model to address the information sharing problem in SMG.
As shown in the Figure 4, in the MAPPO framework, taking a school microgrid as an example, each agent represents a building, and each building has its own independent input. Additionally, the main model parameters are shared among all the buildings. If π i ( a i | τ i ) is an agent model, the joint model is: π ( a | s ) : = i = 1 n π i ( a i | τ i ) , where n denotes the number of teaching buildings. The expected discounted accumulated reward is defined as [24]:
J ( π ) = E π [ σ t = 0 γ t R ( s t , a t , s t + 1 ) ]
where γ represents the discount ratio, R is the reward, and s t = [ o ( t ) 1 , , o t n , a t , r ^ t ] is the current state of the whole system.

3.4. Optimization

3.4.1. Stochastic Optimization

In the deep learning forecasting module, we have trained models that can predict user load ( L ^ u , t ), market prices ( p ^ t ), and the capacity of solar generation ( P ^ g , t max ). In the validation dataset, we obtain the deviations of the models for these predictions, and their variances are denoted as Σ ^ L u , Σ ^ p , and Σ ^ P g , respectively. These values represent the level of uncertainty. To mitigate the impact of uncertainty, we propose a stochastic optimization method as shown in Figure 5b. We use the predicted values as means and uncertainty as variances, for example, ( P ^ g , t max , Σ ^ P g ), ( L ^ u , t , Σ ^ L u ), and ( p ^ t , Σ ^ p ), to perform Gaussian sampling. Through Gaussian sampling, we can obtain multiple scenarios, which are considered as a multi-scenario optimization problem. Assuming we have N scenarios, the n-th scenario can be represented as ( n S N ) [25]:
( P ˜ g max ) n = ( P ˜ g , 1 max ) n , ( P ˜ g , 2 max ) n , , ( P ˜ g , T max ) n , ( L ˜ u ) n = ( L ˜ u , 1 ) n , ( L ˜ u , 2 ) n , , ( L ˜ u , T ) n , ( p ˜ ) n = ( p ˜ 1 ) n , ( p ˜ 2 ) n , , ( p ˜ T ) n .
Then, the objective function in our proposed stochastic optimization can be redefined as:
minimize X t = 1 T E n S N ( p ˜ t ) n · P grid , t .
Constraint (3) is refined as:
P g , t min P g , t ( P ˜ g , t max ) n n S N , g G , t T .
Constraint (6) is refined as:
P grid , t + g G P g , t + s S P s , t = s S P s , t + + u U ( L ˜ u , t ) n n S N , t T .
Through solving the stochastic optimization problem (10), we obtain the scheduling plan: X ˙ = { P ˙ grid , t , P ˙ g , t , P ˙ s , t + , P ˙ s , t , E ˙ s , t } .

3.4.2. Online Data Augmentation

In order to address the data drift problem, we propose the data augmentation method as shown in Figure 5c. The module contains two parts: pre-training/fine-tuning scheme and rolling-horizon feedback correction.

Pre-Training and Fine-Tuning

In practice, the real-time energy dispatch process is a periodic task (e.g., daily dispatch). Considering that the prediction models are trained based on historical data and future data and may not necessarily follow the same distribution as the past, we perform online data augmentation. Online data augmentation consists of two parts: pre-training and fine-tuning. Firstly, we pre-train the neural network model using historical data to obtain a model capable of predicting f L u , f p , and f P g . Secondly, we fine-tune the neural network using the accumulated online data. Specifically, in the fine-tuning process, we employ partial parameter fine-tuning to obtain the refined network f ˜ L u , f ˜ p , and f ˜ P g .

Rolling-Horizon Feedback Correction

In addition to updating the prediction models online, we also employ the rolling-horizon control technique. In the optimization process, we solve the optimization problem every horizon H (to incorporate the latest prediction models and trade-off computational time). This operation is repeated throughout the scheduling period.

4. Experiments

4.1. Experiment Setup

4.1.1. Dataset

We conducted experiments on building energy management using a real-world dataset from Fontana, California. The dataset includes one year of electricity scheduling for 17 buildings, including their electricity demand, solar power generation, and weather conditions. This dataset was also used for the NIPS 2022 Challenge. With our proposed framework, we achieved the global championship in the competition [20].

4.1.2. Metric

We follow the evaluation setup of the competition. The 17 buildings are divided into visible (5 buildings) and invisible data (12 buildings). The visible data are used as the training set, while the invisible data include the validation set and the testing set. Visible data contain all labels including user load demand and solar generation in a year. The labels of the invisible data can only be evaluated through limited interactions with the competition organizers’ open API. The final leaderboard ranking is based on the overall performance of the model on all data sets. The evaluation metrics include carbon emissions, electricity cost, and grid stability. Specifically, the electricity consumption of each building i is calculated as E i , t = L i , t P i , t + X i , t , where L i , t represents the load demand at timestamp t, P i , t represents the solar power generation of the building, and X i , t represents the electricity dispatch value provided by the model. The electricity consumption of the entire district is denoted as E t dist = i = 1 I E i , t .
Using the above notations, three metrics are defined as:
C Emission = t = 1 T i = 1 I max E i , t , 0 · c t , C Price = t = 1 T max E t dist , 0 · p t , C Grid = 1 2 C Ramping + C Load Factor = 1 2 t = 1 T 1 E t + 1 dist E t dist + m = 1 # months avg t [ month m ] E t dist max t [ month m ] E t dist .

4.1.3. Baseline

To evaluate the proposed MAPPO, Optimization, and their Ensemble method, we compare them with the following baseline methods:
  • RBC: Rule-Based Control method. We tested several strategies and selected the best one: charging the battery by 10% of its capacity between 10 a.m. to 2 p.m., followed by discharging it by the same amount between 4 p.m. to 8 p.m.
  • MPC [26]: A classical Model-Predictive-Control method. A GBDT-based model [27] is used to predict future features, and a deterministic optimization is used for daily scheduling.
Moreover, after the competition, we also compared the proposals of several top-ranked contestants:
  • AMPC [26]: An adaptive Model-Predictive-Control method.
  • SAC [28]: A Soft Actor-Critic method that uses all agents with decentralization.
  • ES [29]: Evolution-Strategy method with adaptive covariance matrix.

4.1.4. Implementations

The environment simulator that employs reinforcement learning and an evaluation process is provided by the competition organizers [30]. The learning of deep learning networks is implemented using PyTorch. The optimization problem-solving utilizes our self-developed MindOpt [31]. All experiments are conducted on an Nvidia Tesla V100 GPU with eight cards.

4.2. Results

If only one metric is considered, any of the three metrics can perform very well. Therefore, the final effect needs to be seen in terms of the average value of the three metrics. In particular, as shown in Table 1, ‘Emission’, ‘Price’, and ‘Grid’ denote the metric C E m i m s s i o n , C P r i c e , and C G r i d , respectively. Since the performance is compared with no use of storage, a lower value indicates a better performance. Our proposed MAPPO method and Optimization method both achieve better results than other competitors.
As shown in Table 1, the individual model has limited performance. By combining reinforcement learning and optimization, we can achieve the best results. Through observing the validation dataset, we found that reinforcement learning and optimization perform alternately in different months. By leveraging their advantages, we fuse their results based on the month to create a yearly schedule (named Ensemble), ultimately obtaining the best outcome. Besides, all calculations of the models above are completed within 30 min to generate the scheduling for the next year.

4.3. Ablation Studies

We conducted ablation studies on some modules to understand their contributions to the overall performance.

4.3.1. Analysis of Online Data Augmentation

We compare the performances of different online updating methods, as shown in Figure 6: No-Ft: no fine-tuning on online data; Self-Adapt: adaptive linear correction by minimizing the mean squared error between historical value and predicted value; Scratch: re-learning from scratch; Small-LR: continuous learning with a smaller learning rate; Freeze: continuous learning with online data but freezing the weights of the first few layers and only updating the last layer. To compare the efficiency of the models, we evaluate the average execution time of real-time scheduling within 24 h.
Results show that fine-tuning with a smaller learning rate has advantages in terms of efficiency and effectiveness.

4.3.2. Analysis of Forecasting Models

As shown in Table 2, we evaluated different forecasting models. The evaluation metrics include overall scheduling performance, execution time, and forecasting performance measured by the weighted mean absolute percentage error (WMAPE). The experimental results indicate that the RNN model with online fine-tuning achieves the best performance.

4.3.3. Analysis of Stochastic Optimization

In stochastic optimization, the number of scenarios is a very important parameter. As shown in Figure 7, as the number of scenarios increases, the effectiveness of the model also gradually increases. This is in line with common sense, as a model that can cover more scenarios tends to have better performance.

5. Conclusions

The challenge of power grid scheduling lies in the complexity of long-term decision-making. Through our research, we have learned that achieving end-to-end learning with a single strategy is difficult for such complex problems. We have identified that future load and solar energy generation are key information for decision-making. Our results show that using pre-trained auxiliary tasks to learn representation and prediction ahead of optimization and reinforcement learning outperforms directly feeding all the data into the decision model. By employing optimization and multi-agent reinforcement learning algorithms for decision-making, we have found that the optimization algorithm achieves better generalization on an unknown dataset through target approximation, data augmentation, and rolling-horizon correction. On the other hand, multi-agent reinforcement learning better models the problem and finds better solutions on a known dataset. The issue of data augmentation to improve generalization in energy management tasks warrants further research. We have also observed that the policies learned by the optimization algorithm and reinforcement learning perform differently in different months, which has motivated us to explore ensemble learning approaches. We left the ensemble of forecasting models as future work.

Author Contributions

Methodology, C.Y., J.Z., W.J., L.W., H.Z., Z.Y. and F.L.; software, L.W., H.Z., Z.Y. and F.L.; writing—original draft preparation, J.Z. and W.J.; writing—review and editing, C.Y., Z.Y. and F.L.; supervision, C.Y., J.Z., Z.Y. and F.L. All authors have read and agreed to the published version of the manuscript.

Funding

This research received no external funding.

Data Availability Statement

Not applicable.

Conflicts of Interest

The authors declare no conflict of interest.

References

  1. Gama, J.; Žliobaitė, I.; Bifet, A.; Pechenizkiy, M.; Bouchachia, A. A survey on concept drift adaptation. ACM Comput. Surv. (CSUR) 2014, 46, 1–37. [Google Scholar] [CrossRef]
  2. Elsheikh, A.H.; Saba, A.I.; Panchal, H.; Shanmugan, S.; Alsaleh, N.A.; Ahmadein, M. Artificial intelligence for forecasting the prevalence of COVID-19 pandemic: An overview. Healthcare 2021, 9, 1614. [Google Scholar] [CrossRef] [PubMed]
  3. Torres, J.F.; Hadjout, D.; Sebaa, A.; Martínez-Álvarez, F.; Troncoso, A. Deep learning for time series forecasting: A survey. Big Data 2021, 9, 3–21. [Google Scholar] [CrossRef] [PubMed]
  4. Lara-Benítez, P.; Carranza-García, M.; Riquelme, J.C. An experimental review on deep learning architectures for time series forecasting. Int. J. Neural Syst. 2021, 31, 2130001. [Google Scholar] [CrossRef] [PubMed]
  5. Sina, L.B.; Secco, C.A.; Blazevic, M.; Nazemi, K. Hybrid Forecasting Methods—A Systematic Review. Electronics 2023, 12, 2019. [Google Scholar] [CrossRef]
  6. Camacho, E.F.; Alba, C.B. Model Predictive Control; Springer Science & Business Media: London, UK, 2013. [Google Scholar]
  7. Hewing, L.; Wabersich, K.P.; Menner, M.; Zeilinger, M.N. Learning-based model predictive control: Toward safe learning in control. Annu. Rev. Control Robot. Auton. Syst. 2020, 3, 269–296. [Google Scholar] [CrossRef]
  8. Muralitharan, K.; Sakthivel, R.; Vishnuvarthan, R. Neural network based optimization approach for energy demand prediction in smart grid. Neurocomputing 2018, 273, 199–208. [Google Scholar] [CrossRef]
  9. Elmachtoub, A.N.; Grigas, P. Smart “predict, then optimize”. Manag. Sci. 2022, 68, 9–26. [Google Scholar] [CrossRef]
  10. Lauro, F.; Longobardi, L.; Panzieri, S. An adaptive distributed predictive control strategy for temperature regulation in a multizone office building. In Proceedings of the 2014 IEEE International Workshop on Intelligent Energy Systems (IWIES), San Diego, CA, USA, 8 October 2014; pp. 32–37. [Google Scholar]
  11. Heirung, T.A.N.; Paulson, J.A.; O’Leary, J.; Mesbah, A. Stochastic model predictive control—How does it work? Comput. Chem. Eng. 2018, 114, 158–170. [Google Scholar] [CrossRef]
  12. Yan, S.; Goulart, P.; Cannon, M. Stochastic model predictive control with discounted probabilistic constraints. In Proceedings of the 2018 European Control Conference (ECC), IEEE, Limassol, Cyprus, 12–15 June 2018; pp. 1003–1008. [Google Scholar]
  13. Paulson, J.A.; Buehler, E.A.; Braatz, R.D.; Mesbah, A. Stochastic model predictive control with joint chance constraints. Int. J. Control 2020, 93, 126–139. [Google Scholar] [CrossRef]
  14. Shang, C.; You, F. A data-driven robust optimization approach to scenario-based stochastic model predictive control. J. Process Control 2019, 75, 24–39. [Google Scholar] [CrossRef]
  15. Bradford, E.; Imsland, L.; Zhang, D.; del Rio Chanona, E.A. Stochastic data-driven model predictive control using gaussian processes. Comput. Chem. Eng. 2020, 139, 106844. [Google Scholar] [CrossRef]
  16. Ioannou, P.A.; Sun, J. Robust Adaptive Control; Courier Corporation: Chelmsford, MA, USA, 2012. [Google Scholar]
  17. Åström, K.J.; Wittenmark, B. Adaptive Control; Courier Corporation: Chelmsford, MA, USA, 2013. [Google Scholar]
  18. Liu, X.; Paritosh, P.; Awalgaonkar, N.M.; Bilionis, I.; Karava, P. Model predictive control under forecast uncertainty for optimal operation of buildings with integrated solar systems. Sol. Energy 2018, 171, 953–970. [Google Scholar] [CrossRef]
  19. Yu, C.; Velu, A.; Vinitsky, E.; Gao, J.; Wang, Y.; Bayen, A.; Wu, Y. The Surprising Effectiveness of PPO in Cooperative Multi-Agent Games. Adv. Neural Inf. Process. Syst. 2022, 35, 24611–24624. [Google Scholar]
  20. Aicrowd. Neurips 2022 Citylearn Challenge. Available online: https://www.aicrowd.com/challenges/neurips-2022-citylearn-challenge (accessed on 18 July 2022).
  21. Cho, K.; van Merriënboer, B.; Bahdanau, D.; Bengio, Y. On the Properties of Neural Machine Translation: Encoder–Decoder Approaches. In Proceedings of the SSST-8, Eighth Workshop on Syntax, Semantics and Structure in Statistical Translation, Doha, Qatar, 25 October 2014; pp. 103–111. [Google Scholar]
  22. Chung, J.; Gulcehre, C.; Cho, K.; Bengio, Y. Empirical evaluation of gated recurrent neural networks on sequence modeling. arXiv 2014, arXiv:1412.3555. [Google Scholar]
  23. Graves, A. Generating sequences with recurrent neural networks. arXiv 2013, arXiv:1308.0850. [Google Scholar]
  24. Schulman, J.; Wolski, F.; Dhariwal, P.; Radford, A.; Klimov, O. Proximal policy optimization algorithms. arXiv 2017, arXiv:1707.06347. [Google Scholar]
  25. Wurdemann, H.A.; Stilli, A.; Althoefer, K. Lecture notes in computer science: An antagonistic actuation technique for simultaneous stiffness and position control. In Proceedings of the Intelligent Robotics and Applications: 9th International Conference, ICIRA 2015, Portsmouth, UK, 24–27 August 2015; Proceedings, Part III. Springer: Cham, Switzerland, 2015; pp. 164–174. [Google Scholar]
  26. Sultana, W.R.; Sahoo, S.K.; Sukchai, S.; Yamuna, S.; Venkatesh, D. A review on state of art development of model predictive control for renewable energy applications. Renew. Sustain. Energy Rev. 2017, 76, 391–406. [Google Scholar] [CrossRef]
  27. Ke, G.; Meng, Q.; Finley, T.; Wang, T.; Chen, W.; Ma, W.; Ye, Q.; Liu, T.Y. LightGBM: A Highly Efficient Gradient Boosting Decision Tree. In Proceedings of the 31st International Conference on Neural Information Processing Systems, NIPS’17, Red Hook, NY, USA, 4–9 December 2017; pp. 3149–3157. [Google Scholar]
  28. Kathirgamanathan, A.; Twardowski, K.; Mangina, E.; Finn, D.P. A Centralised Soft Actor Critic Deep Reinforcement Learning Approach to District Demand Side Management through CityLearn. In Proceedings of the 1st International Workshop on Reinforcement Learning for Energy Management in Buildings & Cities, RLEM’20, New York, NY, USA, 17 November 2020; pp. 11–14. [Google Scholar]
  29. Varelas, K.; Auger, A.; Brockhoff, D.; Hansen, N.; ElHara, O.A.; Semet, Y.; Kassab, R.; Barbaresco, F. A comparative study of large-scale variants of CMA-ES. In Proceedings of the Parallel Problem Solving from Nature—PPSN XV: 15th International Conference, Coimbra, Portugal, 8–12 September 2018; Proceedings, Part I 15. Springer: Cham, Switzerland, 2018; pp. 3–15. [Google Scholar]
  30. Vázquez-Canteli, J.R.; Kämpf, J.; Henze, G.; Nagy, Z. CityLearn v1.0: An OpenAI gym environment for demand response with deep reinforcement learning. In Proceedings of the 6th ACM International Conference on Systems for Energy-Efficient Buildings, Cities, and Transportation, New York, NY, USA, 13–14 November 2019; pp. 356–357. [Google Scholar]
  31. MindOpt. MindOpt Studio. Available online: https://opt.aliyun.com/platform/overview (accessed on 20 October 2022).
Figure 1. The micro-grid network framework. Green arrows denote solar power sharing among the micro-grid buildings and orange lines indicate how the micro-grid obtains power from the national grid.
Processes 11 03188 g001
Figure 2. Reinforcement learning framework.
Processes 11 03188 g002
Figure 3. CPPO and IPPO framework.
Processes 11 03188 g003
Figure 4. MAPPO framework.
Processes 11 03188 g004
Figure 5. The whole optimization method framework. The subplot (a) represents the flowchart of prediction based on deep learning. The output of the prediction module serves as the input for the stochastic optimization module, as shown in (b). During the scheduling process, real-time data accumulates over time, and we update the predictions based on the real data, as demonstrated in (d), named the online data augmentation module. This framework enhances the robustness of scheduling under uncertain conditions.
Processes 11 03188 g005
Figure 6. Analysis of online data augmentation, the evaluation about performance and execution time with various settings.
Processes 11 03188 g006
Figure 7. Effect of different number of scenarios N. The curve denotes the expected value, while the area is the standard deviation of the stochastic sample.
Processes 11 03188 g007
Table 1. Comparison of the performances of all methods in the entire building. All values are normalized against the simple baseline without strategy, i.e., not using the storage. Therefore, a lower value indicates a better performance.
MethodsOverall Performance
Average Cost Emission Price Grid
RBC0.9210.9640.8170.982
MPC0.8610.9210.7460.916
AMPC0.8270.8590.7500.872
ES0.8120.8630.7480.827
SAC0.8340.8590.7370.905
MAPPO0.8100.8770.7260.826
Optimization0.8040.8710.7190.822
Ensemble0.8010.8640.7180.821
Table 2. Analysis of different forecasting models, including scheduling performance, forecasting performance, execution time, and updating methods.
Forecast
Model
Online
Update
DispatchForecast (WMAPE)
Average Time Load Solar
Linear0.8788 s42.1%27.3%
GBDT0.8758 s44.7%10.7%
RNN0.8769 s46.0%10.7%
Transformer0.87911 s45.3%10.6%
Linear
Self-Adaptive
Linear Correction
0.8718 s39.4%21.2%
GBDT0.8689 s39.5%9.4%
RNN0.86610 s39.3%9.3%
Transformer0.86911 s39.9%9.1%
RNN
Online Fine-tuning
0.86211 s39.0%9.0%
Transformer0.86412 s39.3%9.1%
Disclaimer/Publisher’s Note: The statements, opinions and data contained in all publications are solely those of the individual author(s) and contributor(s) and not of MDPI and/or the editor(s). MDPI and/or the editor(s) disclaim responsibility for any injury to people or property resulting from any ideas, methods, instructions or products referred to in the content.

