
Pore Structure and Fractal Characteristics of Coal Measure Shale in the Wuxiang Block in the Qinshui Basin
1
School of Resources and Environment, Henan Polytechnic University, Jiaozuo 454003, China
2
Collaborative Innovation Center of Coal Work Safety and Clean High Efficiency Utilization, Jiaozuo 454003, China
*
Author to whom correspondence should be addressed.
Processes 2023, 11(12), 3362; https://doi.org/10.3390/pr11123362
Submission received: 3 November 2023
/
Revised: 27 November 2023
/
Accepted: 1 December 2023
/
Published: 3 December 2023
(This article belongs to the Section Energy Systems)
Abstract
:To study the fractal characteristics of the pore structure and the main controlling factors of coal measure shale in the Wuxiang block in Qinshui Basin, gas adsorption (CO2 and N2), mercury intrusion porosimetry (MIP), total organic carbon (TOC) content, and X-ray diffraction (XRD) experiments were carried out. The fractal dimensions of the micropores, mesopores, and macropores were computed by combining the V-S, FHH, and MENGER models. The results show that the fractal dimension increases with the increase in pore size; so, the macropore structure is the most complex. The effects of the TOC content, mineral fractions, and pore structure on the fractal dimensions were analyzed. The results showed that the TOC content certainly correlated with the mesopore fractal dimension, and the R2 is 0.9926. The pore volume and specific surface area show an obvious positive correlation with the macroporous fractal dimension, and their R2 values are 0.6953 and 0.6482, indicating that the macroporous pore structure of coal shale in the study area is more complex. There is a significant positive correlation between kaolinite and the macropore fractal dimension, and the R2 is 0.7295. Therefore, the organic carbon and kaolinite contents and the pore structure parameters are the most important factors affecting the fractal dimension characteristics.
1. Introduction
In recent years, shale gas has attracted attention as a clean energy source. The success of shale gas exploration and development in North America has prompted the practice of shale gas development and certain breakthroughs in China [1,2,3]. Shale gas is stored in pores in an adsorbed or free state [4]. Compared with conventional reservoirs, coal measure shale has a variety of mineral components, resulting in more complex pore structures [5]. Coal measure shale has the characteristics of low porosity, low permeability, and strong heterogeneity [6,7,8,9]. Differently sized pores are interlaced with each other, forming an intricate pore–fracture network [10,11]. The pore structure is an important factor in shale gas reservoir evaluation, which directly affects the gas storage and seepage characteristics [12]. The pore structure parameters, such as the pore volume, pore-specific surface area, and pore size distribution pattern, are of great significance in studying shale gas adsorption, desorption, seepage, and output [13,14]. Due to the strong heterogeneity of shale pores, the traditional pore structure evaluation method is not suitable for shale gas reservoirs. The application of the fractal theory in shale gas reservoirs is being paid more and more attention [15].
With the introduction of fractal theory, it has gradually become important to characterize the complexity of the shale pore structure [16,17]. However, in the process of studying the fractal characteristics of shale pores, previous researchers have suggested different views on the influencing factors of fractal dimension. Turlapati et al. studied shales in the Gondwana and Assam basins in India and came to the conclusion that the fractal dimension is positively correlated with the specific surface area, and the quartz content is negatively correlated with the TOC [18]. By studying the shale in northwest Hunan, Xi et al. concluded that the higher the clay mineral content is, the smaller the fractal dimension will be [19]. Li et al. found that the fractal dimension increases with the increase in the specific surface area and pore volume through the study of shale in the eastern Yunnan Malone area [20].
The Qinshui Basin is an important coal-containing basin in China [21]. It covers an area of 3 × 10⁴ km2. The main coal-containing strata are the Taiyuan and Shanxi Formations. The coal seam is generally buried at around 300 to 2000 m, and the gas content of the coal seam is present from 6 to 30 m3/t, which has great potential for exploration and development [22]. However, quantitative evaluations of the shale pore structure complexity in the Wuxiang area of the Qinshui Basin are relatively infrequent. Therefore, this work utilized fractal theory, combined with a series TOC content, XRD, gas adsorption, and MIP experiments to quantitatively characterize the pore complexity of the coal measure shales [23,24]. At the same time, the relationship between the pore structure complexity and the organic matter content, mineral composition, pore volume, specific surface area, and other influencing factors is revealed. In summary, the pore structure, TOC, and quartz and clay mineral contents are important factors affecting the fractal dimension. However, the influence of these factors on the fractal dimension may vary greatly from region to region.
2. Geological Setting
The investigated area is located in the middle of Qinshui Basin, which is the most favorable coalbed methane exploration district in China. Qinshui Basin is an intermontane graben basin that formed due to fault block differential uplift after the Late Paleozoic coal-forming period in North China (Figure 1). The main body of the basin is a large-scale syncline structure with an NNE–SSW layout. The internal NNE structural line is mainly composed of open short-axis folds and large-angle normal faults. The tectonic evolution of the Qinshui Basin has gone through three stages: the formation of a basin tectonic basement, the peat accumulation of the coal-containing basin, and tectonic uplift and denudation [25].
Coal measure shale reservoirs in the Qinshui Basin are mainly distributed in the Shanxi Formation and Taiyuan Formation. The Qinshui Basin was formed in the Carboniferous Permian period and was formed by the transition from marine to continental facies. Additionally, there are transitional facies deposits, such as tidal flats, lagoons, peat bogs, and coastal swamps. In the Late Carboniferous Age, seawater invaded, and the land undulated, forming the Taiyuan Formation, which is composed of sandstone, siltstone, mudstone, limestone, and coal seams. In the early Permian period, the crust rose, the sea water gradually retreated, and the offshore delta and flu-lacustrine facies of the Shanxi Formation were deposited, which developed into mudstone, siltstone, peat, and black mudstone [26].
3. Samples and Experimental Methods
3.1. Samples
The experimental samples in this work are from five CBM wells in the Wuxiang block, with sample depths ranging from 1542 m to 1889 m. The samples were collected from coal shale between the Taiyuan and Shanxi Formations. To clarify the influence of organic matter abundance and mineral composition on the fractal dimension, six samples with different TOC and mineral composition characteristics were selected according to the burial depth of the coal seam. The lithology of the six samples is pelitic siltstone, silty mudstone, and mudstone. These coal measure shales are black and rich in organic matter. Six samples were selected for the CO2 adsorption, N2 adsorption, and MIP experiments. And each sample was processed into different sizes to analyze the TOC content and mineral components.
3.2. Experimental Methods
3.2.1. N2 Adsorption
The low-temperature nitrogen adsorption experimental instrument used was the Macchik Bayer-BELSORP MaxII specific surface area and aperture tester, which was made in Japan. It employs the static volume method of isothermal physical adsorption. The temperature of liquid nitrogen under saturated vapor pressure was 77.35 K, and the minimum resolvable relative pressure was 2.6 × 10⁻⁷ Pa. The measurable specific surface area was no less than 0.5 × 10⁻³ cm3/g, the measurable pore volume was less than 0.1 × 10⁻³ cm3/g, and the pore size test ranged from 0.35 nm to 350 nm [27]. The samples were sealed and degassed before the nitrogen adsorption experiment (degassing at 97.0 °C for 5 h). In this work, liquid nitrogen with a purity greater than 99.99% was selected as the adsorption medium for the low-temperature liquid nitrogen experiment. Under a constant 77 K temperature, adsorption–desorption curves were obtained by measuring the adsorption and desorption volumes with an increasing relative pressure and decreasing pressure, respectively. Based on the BJH and BET principles, the specific surface area, pore size, and pore volume of the shale samples were calculated [28].
3.2.2. CO2 Adsorption
The CO2 adsorption experiment was similar to the N2 adsorption experiment, which belongs to the physical adsorption behavior of gas molecules on a solid surface. In the case when the adsorbate and adsorbent are the same, the process would only be affected by the temperature and pressure. Under a constant temperature, the pressure can be adjusted to obtain the ability of the solid surface to capture gas at different pressures, that is, the scale of gas adsorption [29]. At low temperatures, carbon dioxide molecules have greater kinetic energy than nitrogen molecules and can enter into smaller pore spaces.
CO2 adsorption experiments are mainly used to characterize the microporous pore structure(<2 nm)of shale reservoirs. The Macchik Byer-BELSORP MaxII specific surface area and pore size distribution analyzer (made in Shanghai, China) were used in this work. The experiments were conducted at 0 °C (ice water bath), and the pore size distribution data of the micropores were obtained via DFT modeling.
3.2.3. MIP
MIP is a conventional experimental method. Its basic principle is that non-wetting fluid mercury must overcome the capillary resistance of the pore before it is injected into the shale pore space. Therefore, there is a certain correspondence between the capillary resistance and the mercury intrusion capillary pressure.
According to Washburn’s formula, the pore radius under different mercury injection capillary pressures and the mercury injection volume of different pore diameters under different pressures can be calculated. Using the Young–Dupre equation, the specific surface area of pores at different scales can be attained.
In this work, the AutoPore9500 automatic mercury pore instrument(made in Guizhou, China) was used to determine the mercury injection pore, and the pore size ranged from 3 nm to 1000 μm. Before the experiments, the samples were dried at 110 °C for 24 h to remove the free and adsorbed water, and then they were placed in a desiccator and cooled down to room temperature [30,31].
3.2.4. XRD
The whole-rock mineral components and contents were analyzed via X-ray experiments. The experimental instrument used was a Smartlab X-ray diffraction instrument made in Japan. After crushing the sample, it was added to a glass slide and subjected to XRD. The sample preparation conformed to the analysis method for clay minerals and ordinary non-clay minerals in sedimentary rocks via X-ray diffraction in SY/T 5163-2018 (No. SY/T 5163-2018 of the National Standards of the People’s Republic of China). The experiment was carried out at room temperature, and the instrument voltage and current were set to 40 kV and 40 mA, respectively. The peak area integral method with Lorentz polarization correction was used for the semi-quantitative determination of the mineral composition [32].
3.2.5. TOC Content
The TOC fraction of the sample was tested with a T009CS-200 tester. Before the test, the sample was dried at a low temperature. According to the GB/T19145-2022(No. GB/T19145-2022 of the National Standards of the People’s Republic of China) and GB/T18602-2012 (No. GB/T18602-2012 of the National Standards of the People’s Republic of China) standards, the samples were ground to 200 mesh. The inorganic carbon in the sample was removed with dilute hydrochloric acid and then burned in high-temperature oxygen to convert all the organic carbon into carbon dioxide.
And the total organic carbon was detected with the T009CS-200 tester [33].
4. Fractal Dimension Calculation
According to the classification of the pore structure by the International Union of Pure and Applied Chemistry (IUPAC), the porous materials were divided into macropores (PSD > 50 nm), mesopores (2 nm < PSD < 50 nm), and micropores (PSD < 2 nm), which is currently widely used to classify the pore structure of shale [34,35]. The fractal dimension of shale pores is usually 2–3; when the value tends to 2, it indicates the absolute smoothness of the pores. The larger the fractal dimension is, the more complex the pore structure of shale is.
4.1. Calculation of Microporous Fractal Dimension
The V-S model was firstly proposed by Mandelbrot [36], who utilizes the correlation between the pore volume and the specific surface area of solid porous media to calculate the fractal dimension of the pores. As a porous sedimentary medium, previous studies have shown that the V-S model is characterized by high computational accuracy and has a high fitting accuracy and stability in the study of shale pore structure characteristics. In general, the V-S model is highly applicable only in the calculation of the microporous fractal dimension. The equation used to study the microporous fractal dimension is as follows:
where is a constant, is the cumulative pore volume, is the cumulative specific surface area, and is the fractal dimension of the micropores.
4.2. Calculation of the Mesopore Fractal Dimension
Pfeiferper et al. [37]. proposed the FHH fractal model, which is widely used to fit the gas adsorption behavior to the fractal surfaces of solid porous media. The low-temperature nitrogen adsorption–desorption curves of coal shale represent obvious adsorption misalignment phenomena. The curve morphology and hysteresis loop type indicate that the micropores and mesopores are mainly developed in the shale [38], which is consistent with the applicable range of pore sizes of the FHH model. Therefore, we adopted the FHH model to calculate the fractal dimension of the mesopores of the samples with this expression:
where is the adsorption volume under different relative pressure , is the saturated vapor pressure, is the actual pressure at any recording point during the experiment, is the slope of the plot of versus , and is a constant. When the adsorption mechanism is a Van der Waals force, ; while the adsorption mechanism is capillary condensation, .
4.3. Calculation of the Macrohole Fractal Dimension
The Menger sponge model is a generalized fractal computation curve with a topological dimension of 1, and it is considered that any curve is homogeneous with a subset of the Menger sponge. Its applications in the calculation of pore fractal dimension in porous media have been repeatedly demonstrated by many scholars, and the most commonly used mathematical model is expressed as:
where is the fractal dimension; is the pore volume of the macropores of the shales measured in the mercury intrusion porosimetry experiment; and is the mercury injection pressure.
5. Results
5.1. Characteristics of TOC and Mineral Components
The TOC of shale in the Wuxiang block has a wide distribution, ranging from 0.26% to 5.01%, with an average of 2.82%. The TOC of the shale varies greatly, and it can be from 0.1% to 25% [39]. The results of XRD show that the coal-containing shale is mainly composed of clay minerals, quartz, and carbonate minerals, with small amounts of the other minerals (Table 1).
The clay mineral content ranges from 69.7% to 79%, with an average of 74.52%. The quartz content ranges from 17.8% to 27.3%, with an average of 21.82%. The carbonate minerals (calcite and dolomite) total 0.67% on average. The other minerals are rhodochrosite, pyrite, and titanium oxide, with an average of 3%.
The shale clay minerals in the study area are mainly composed of illite, chlorite, muscovite, and kaolinite. The content of illite was the highest, ranging from 0 to 81.4%, with an average of 50.13%. The kaolinite content ranged from 12.5% to 29%, with an average of 21.12%. The muscovite content ranged from 0 to 87.5%, with an average of 27.08%. The content of chlorite ranged from 0 to 5%, with an average of 1.67%.
5.2. Characteristics of the Pore Structure
The pore structure, including the pore shape, pore size, pore volume, specific surface area, and the other parameters, is a main factor affecting natural gas storage, adsorption, and transportation [40]. In the low-temperature nitrogen adsorption experiment, due to the capillary condensation of the pores, there is an obvious adsorption hysteresis between the adsorption and desorption curves. This makes the gas adsorption amount in the desorption curve much higher than the adsorption amount under the same relative pressure, forming an obvious hysteresis loop.
The adsorption volume with an increasing relative pressure and desorption volume with a decreasing relative pressure were measured in the low-temperature nitrogen experiment. A low-temperature nitrogen adsorption–desorption curve was drawn (Figure 2). According to the classification of isothermal adsorption curves and hysteresis loop types of shale by the IUPAC, the shale nitrogen adsorption curve in the study area is similar to the IV isothermal adsorption curve, and the hysteresis loop type is similar to the H3 hysteresis loop. The adsorption–desorption curves of six samples were observed. It was found that the hysteresis curve appeared when the relative pressure (P/P0) was 0.45–0.5, and it was divided into ‘high-pressure ranges’ (P/P0 > 0.5) and ‘low-pressure ranges’ (P/P0 < 0.5) [41]. At the low-pressure ranges, the adsorption and desorption curves have basically the same shape. At the high-pressure ranges, there is a significant difference in shape between the two curves, showing obvious adsorption hysteresis.
In general, the coal shale develops micropores, mesopores, and macropores. The total pore volume of shale pores in the study area ranges from 0.0041 to 0.0125 mL/g, with an average of 0.0102 mL/g. The average pore volume of micropores with pore diameters less than 2 nm was 0.0019 mL/g, while that of the mesopores with pore diameters in the range of 2–50 nm was 0.0071 mL/g and that of the macropores with pore diameters greater than 50 nm was 0.0012 mL/g (Table 2). The results indicate that the mesopores are the main contributors to the current reservoir pore volume. The total specific surface area ranges from 3.0925 to 12.5843 m2/g, with an average of 8.485 m2/g. The contribution of microporous specific surface area was the largest, with an average of 4.3436 m2/g. The average specific surface area of mesopores is 4.1167 m2/g and that of the macropores is 0.0247 m2/g (Table 3). In general, the mesopores and macropores are the main carriers of CBM reservoirs in the shale in this area.
5.3. Fractal Dimension Results for Different Pore Size Ranges
5.3.1. Fractal Dimension of Micropores
The experimental data of the CO2 adsorption experiment with a pore size less of than 2 nm were selected to fit the curves of and using the Eq. The results show that there is a linear relationship between and , and the correlation coefficient reaches more than 0.99 (Figure 3). This indicates that the pores in the microporous ranges have fractal characteristics. The fractal dimension D1 of the micropores of shale in the study area ranges from 2.164 to 2.178 (Table 4), with an average of 2.169.
5.3.2. Fractal Dimension of Mesopores
According to the isothermal adsorption curves of each sample (Figure 1), it can be seen that a hysteresis loop occurs at the relative pressure P/P0 of 0.45–0.5. This indicates that the capillary condensation of nitrogen mainly occurs at relative pressures larger than this range. Therefore, the adsorption data when the relative pressure is greater than 0.45 and the pore size range of roughly 4–50 nm were selected to calculate the fractal dimension. The double logarithmic curve of the adsorption volume versus relative pressure was established using the Eq (Figure 4). The fitting curve of and has a good linear relationship, and the fractal dimension D2 of the mesopores has a range of 2.174–2.4224 (Table 5), with an average of 2.3338.
5.3.3. Fractal Dimension of Macropores
The experimental data of the pore sizes larger than 50 nm and smaller than 10 μm in the MIP experiments were selected, and a fractal fitting curve of and was made using the Eq. It was found that there was a strong linear relationship between and , and most of the correlation coefficients were above 0.95 (Figure 5). This indicates that the macropores of shale also have fractal characteristics. The fractal dimension D3 of the pores in the macropores ranges from 2.7125 to 2.8699 (Table 6), with an average of 2.8246.
The calculation results show that D3 > D2 > D1, which represents a microporous–mesoporous–macroporous sequence, indicating that the fractal dimension increases with an increasing pore diameter, as well as the roughness of the pore surface.
Due to diagenesis evolution, the macropores of shale in this area are mainly residual primary pores, such as intergranular pores of brittle minerals and clay minerals. A small number of secondary pores (such as dissolution pores and casting pores) are also developed in shale. In addition, the diagenetic processes, such as cementation, dissolution, leaching, and recrystallization, changed the original pore structure and made its surface rough. The organic matter is mainly elliptical, crescent-shaped, and pit-shaped, with a smooth pore surface. The pores between the layers are mainly slit-like, and the pore structure is relatively single and uneven during compaction. Due to the specificity of this pore structure, the fractal dimensions of the micropores and mesopores are much lower than that of the macropores.
6. Discussion
The size of the fractal dimension is affected by many factors. Generally speaking, all the factors affecting pore development have an impact on the pore fractal dimension. Therefore, the material composition determined by the sedimentary environment and diagenesis evolution is the fundamental factor. That is, the fractal dimension is affected by many factors, such as the shale organic carbon content, organic matter maturity, mineral composition, and pore structure.
6.1. Effect of the Organic Matter Abundance on the Fractal Dimension
Organic pores are mainly formed via the thermal evolution of organic matter. Therefore, it is generally believed that the organic pores mainly develop in nonorganic areas [42]. It can be inferred that an abundance of organic matter is one of the main controlling factors for the development of shale organic matter pores, and the abundance of organic matter in turn affects the fractal dimension of pores.
The correlation of the organic matter content with D1, D2, and D3 in six samples was analyzed. The results showed that the correlation coefficients between the TOC and D1, D2, and D3 were 0.131, 0.0164, and 0.0209, respectively (Figure 6). From the TOC of the six shale samples, one sample has a TOC of less than 0.3%, which does not reach the lower limit of organic carbon with the economic value of shale gas (reference to shale gas evaluation criteria). There is only one sample with TOC > 4%, and the TOC value of the remaining samples is 1–4%, showing a moderate TOC level. Because the macroporous pore volume accounts for the smallest percentage, only the correlation between the micropores’ and mesopores’ fractal dimensions and the TOC was analyzed. After excluding these two extreme values, it can be found that the fractal dimension D2 of mesopores showed a significant positive correlation with the TOC (Figure 7), while the fractal dimension D1 of micropores showed a weak negative correlation with the TOC. This indicates that the organic matter content has a significant effect on the organic matter pores in the mesopore range.
6.2. Effect of the Pore Structure on the Fractal Dimension
In this work, the relationships between the pore volume and specific surface area obtained from the CO2 adsorption, low-temperature liquid nitrogen, and MIP experiments and their respective fractal dimensions were established, respectively. As shown in Figure 8, the fractal dimensions D1 and D2 are weakly negatively correlated with the pore volume, and the correlation coefficients are 0.334 and 0.1901, respectively. D3 is positively correlated with the pore volume, and the correlation coefficient is 0.6953.
In Figure 9, the fractal dimensions D1 and D2 are weakly negatively correlated with the specific surface area, with correlation coefficients of 0.3375 and 0.0098, respectively. D3 is positively correlated with the specific surface area, with a correlation coefficient of 0.6482. Concerning the correlation between the pore volume, specific surface area, and fractal dimension, the correlation coefficients of the macropores are greater than 0.6. Therefore, the fractal dimension of macropores has stronger correlation with the pore volume and specific surface area. This indicates that when the macropores of shale are more developed, the pore volume and specific surface area are larger, the pore structure is more complex, and the fractal dimension is larger.
6.3. Effect of the Mineral Components on the Fractal Dimension
The fractal dimension can quantitatively describe the complexity of the pore structure, and its size is directly related to the pore development. Therefore, different control factors will have different effects on the fractal dimension. The diagenetic minerals are important carriers for the formation of inorganic pores and play an important role in the development and formation of inorganic pores.
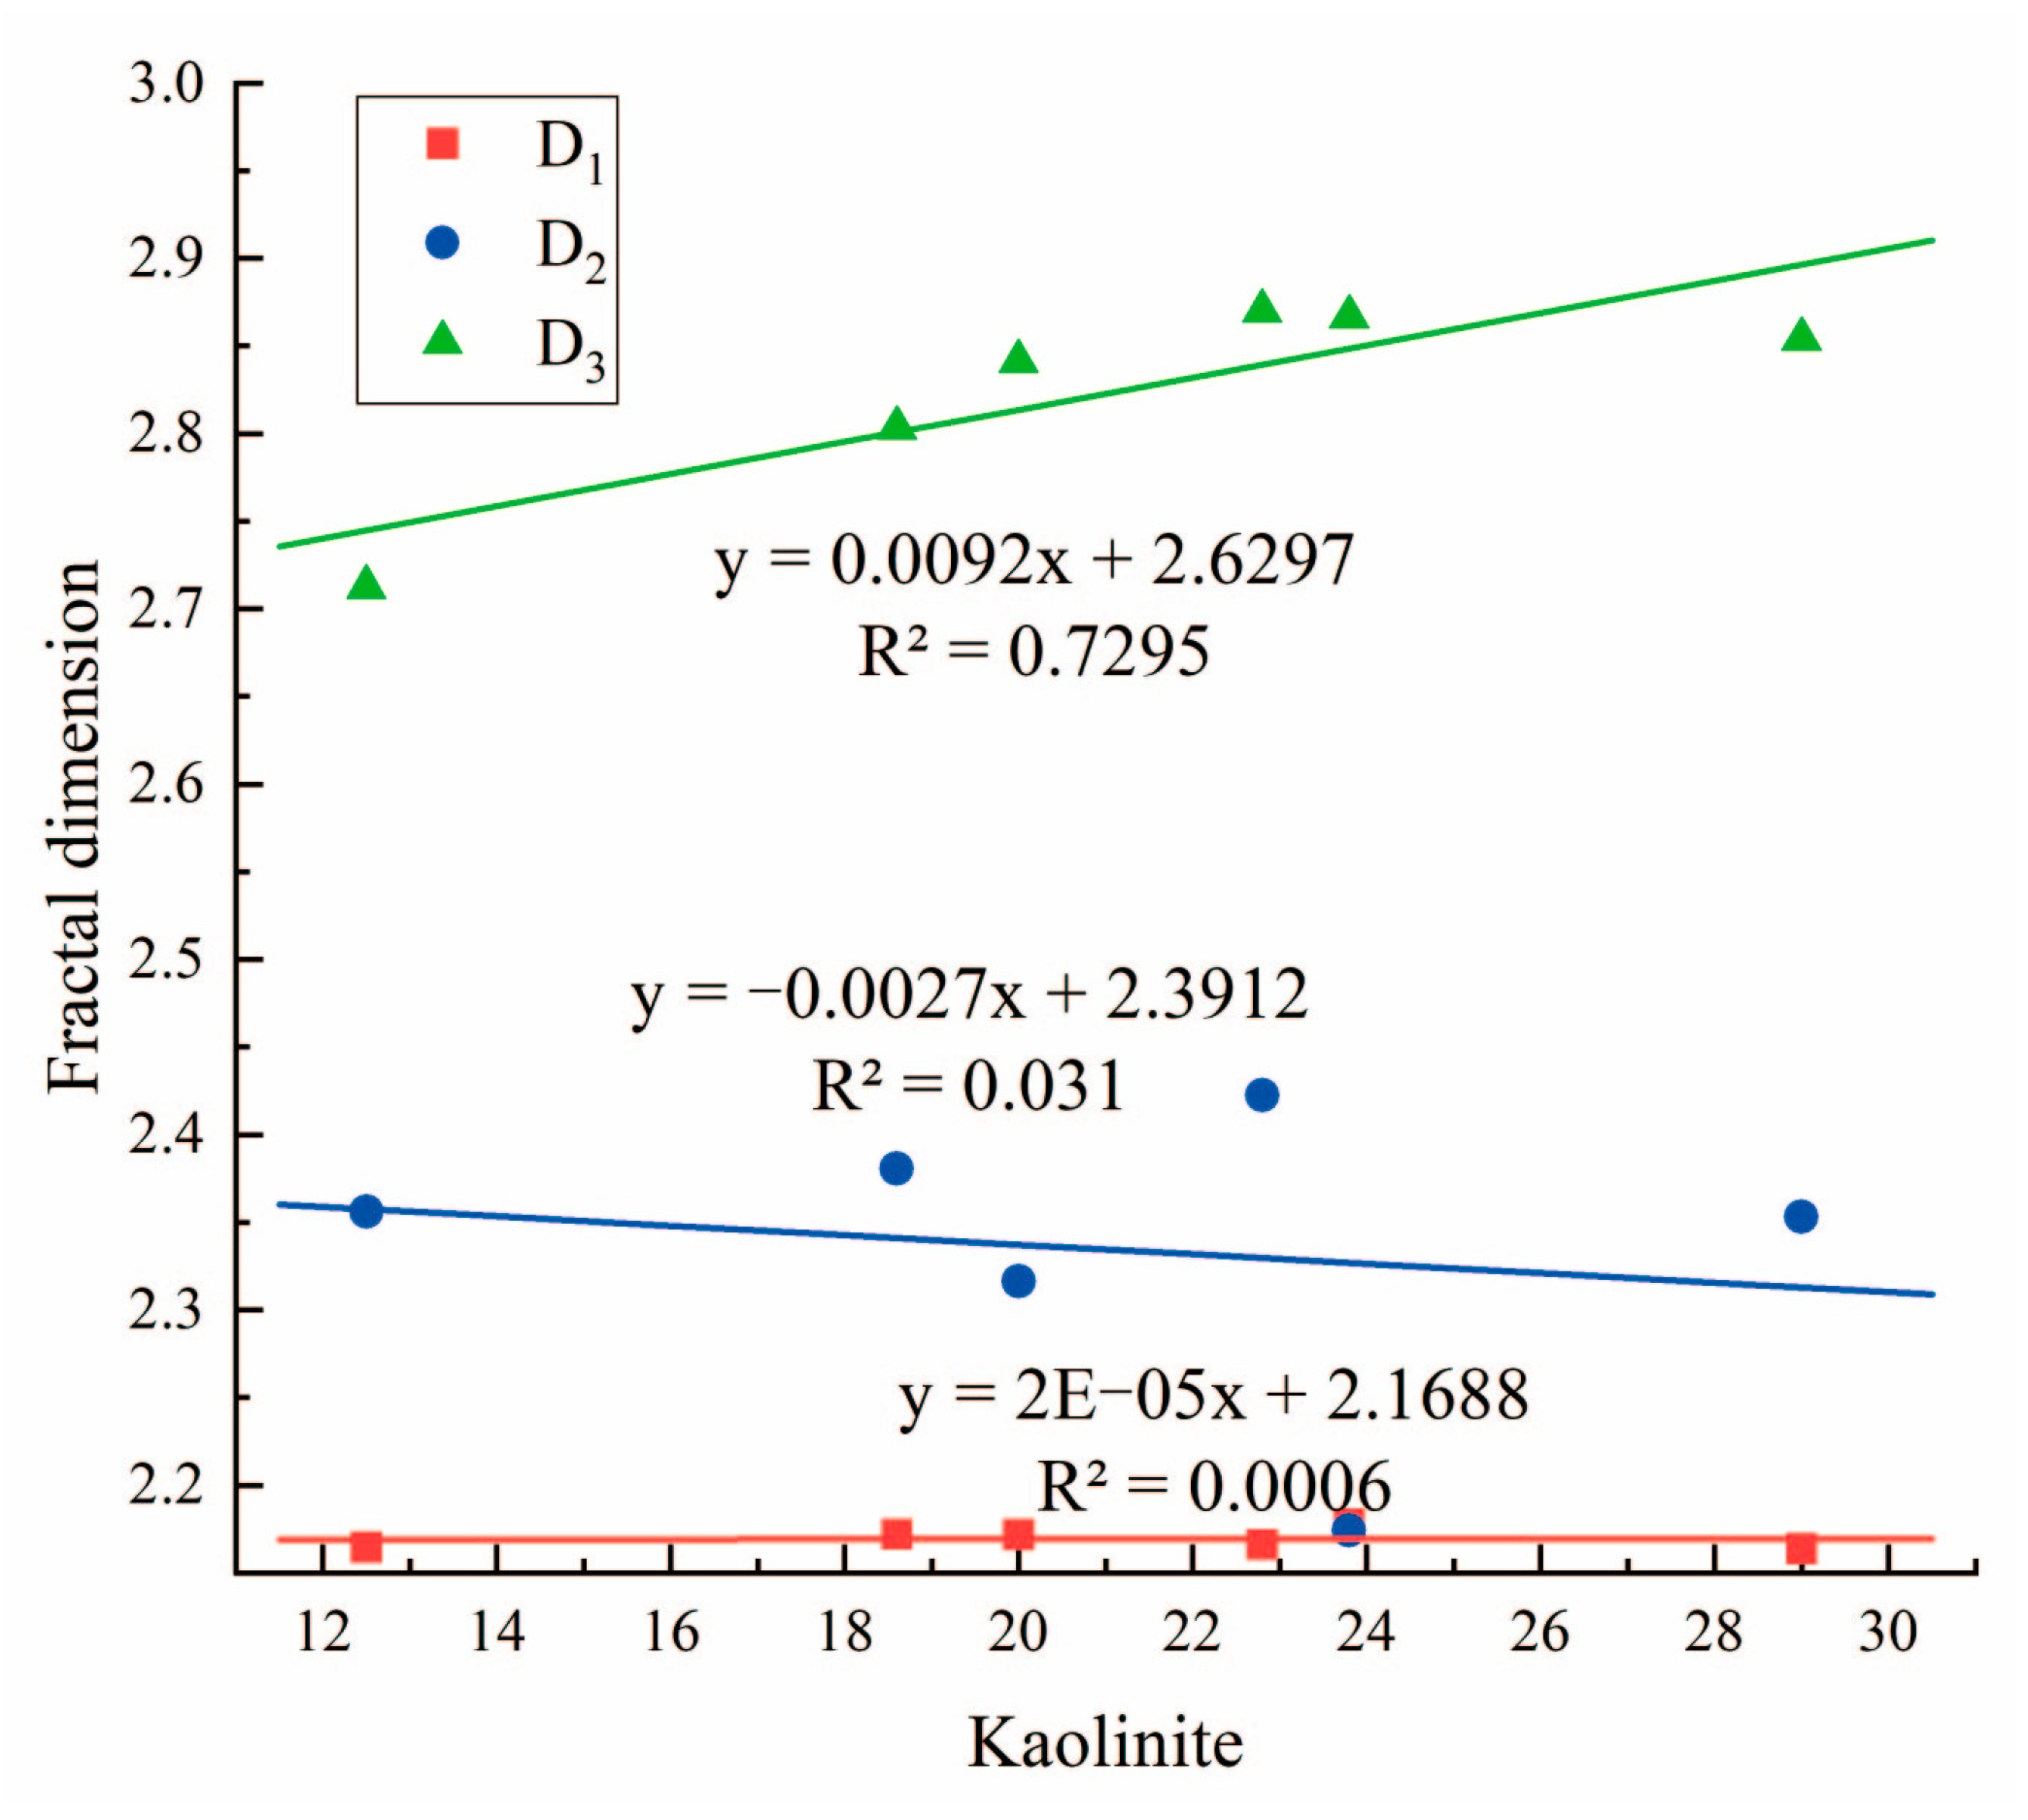
By establishing the correlation between the mineral content and fractal dimension, the results show that there is no significant correlation between the quartz contents and D1, D2, and D3, with correlation coefficients of 0.2998, 0.0008, and 0.0853 (Figure 10), respectively. There is no significant correlation between the carbonate mineral content and D1 or D2, with correlation coefficients of 0.1348 and 0.1031, respectively. D3 has a weak correlation with the carbonate mineral content, with a correlation coefficient of 0.3186 (Figure 11). The titanium oxide content has no correlation with D1, D2, or D3, with correlation coefficients of 0.005, 0.1162, and 0.1975 (Figure 12), respectively. The clay mineral content has a weak positive correlation with D1, with a correlation coefficient of 0.302, and has no obvious correlation with D2 or D3, with correlation coefficients of 0.0179 and 0.088 (Figure 13), respectively. The illite content has no significant correlation with the fractal dimension (Figure 14). The kaolinite content has no significant correlation with D1 or D2, with correlation coefficients of 0.0006 and 0.031, respectively, and has a significant positive correlation with D3, with a correlation coefficient of 0.7295 (Figure 15).
There is a negative correlation between the content of carbonate minerals and D3, but the correlation is small. The main reason is that carbonates are affected by the combination of formation water and trace organic acids generated by organic matter via hydrocarbon generation during sedimentation and burial. As a result, the dissolution pore size of carbonates is too large, which limits the distribution of their specific surface. Thus, there is a significant negative correlation between the content of carbonate rocks in shale and its specific surface area, which affects the development of the pore structure. Therefore, the content of carbonate rocks in shale is negatively correlated with its specific surface area, which affects the development of the pore structure. The content of carbonate minerals is negatively correlated with the fractal dimension of the shale macropores.
Fractal dimension D1 has a weak positive correlation with the clay minerals. Because the layered and flocculation structure of clay increases the inhomogeneity and complexity of the pore space structure of shale, fractal dimension D1 increases with the increase in clay minerals. Among them, the clay mineral composition of the six samples is dominated by illite and kaolinite, with only small amounts of chlorite and dolomite. Therefore, the analysis focuses on investigating the change in the illite and kaolinite contents with the fractal dimensions. The results show that the relationship between the pore fractal dimension and illite content is not significant. The correlation between the kaolinite content and D1 or D2 is not significant, while the correlation between the kaolinite content and D3 is significantly positive. Therefore, the kaolinite content mainly plays a positive role in the development of macropores of shale in this study area, which makes the pore structure of macropores more complex.
7. Conclusions
- (1)
- The fractal dimensions of the micropores, mesopores, and macropores of the shale samples in the study area are quite different, indicating that the shale pores in the study area are very complex. Among all the samples, the values of D3 are the largest, indicating that the pore structure of the macropores is more complex than those of the micropores and mesopores.
- (2)
- The correlation between the TOC and fractal dimension shows that the fractal dimensions of the pores at different scales are quite different. The fractal dimension D2 of the mesopores is significantly positively correlated with the TOC, and the fractal dimension D1 of the micropores is weakly negatively correlated with the TOC. This result indicates that the organic matter content has a significant effect on the organic matter pores in the mesopore range, and the TOC controls the development of pores. Therefore, with the increase in the TOC, the specific surface area becomes larger, and with an increase in the pore volume of shale, the fractal dimension of the pores becomes larger.
- (3)
- The pore volume and specific surface area were significantly positively correlated with D3. The results show that the more developed the macropores are, the larger the pore volume and specific surface area are, and the more complex the pore structure is. Carbonate minerals are weakly negatively correlated with D3 mainly because carbonate rocks have a limited distribution on the surface, which affects the pore development. The clay minerals are weakly positively correlated with D1. Under the compaction of clay minerals, the pore size of the shale decreases, the number of micropores and mesopores increases, and the pore morphology is complex. Kaolinite is significantly positively correlated with D3, which promotes the development of macropores.
Author Contributions
Methodology, S.L.; Formal analysis, M.Z.; Investigation, H.X.; Data curation, H.X.; Writing—original draft, S.L. and H.X.; Writing—review & editing, S.L. and M.Z.; Funding acquisition, S.L. All authors have read and agreed to the published version of the manuscript.
Funding
This research was funded by the Key Technologies Research and Development Program of Henan Province (Grant No. 222102320332), the Doctoral Foundation of Henan Polytechnic University (Grant No. B2020-59), the Youth Innovative Exploratory Fund of Henan Polytechnic University (Grant No. NSFRF230406), and the Program for Innovative Research Team (in Science and Technology) in Universities of Henan Province (Grant No. 21IRTSTHN007).
Data Availability Statement
Data are contained within the article.
Conflicts of Interest
The authors declare no conflict of interest.
References
- Ma, Z.; Pi, G.; Dong, X.; Chen, C. The situation analysis of shale gas development in China-based on Structural Equation Modeling. Renew. Sustain. Energy Rev. 2017, 67, 1300–1307. [Google Scholar] [CrossRef]
- Xingang, Z.; Jiaoli, K.; Bei, L. Focus on the development of shale gas in China—Based on SWOT analysis. Renew. Sustain. Energy Rev. 2013, 21, 603–613. [Google Scholar] [CrossRef]
- Wang, R.; Hu, Z.; Long, S.; Liu, G.; Zhao, J.; Dong, L.; Du, W.; Wang, P.; Yin, S. Differential Characteristics of the Upper Ordovician-Lower Silurian Wufeng-Longmaxi Shale Reservoir and its Implications for Exploration and Development of Shale Gas in/around the Sichuan Basin. Acta Geol. Sin. Engl. Ed. 2019, 93, 520–535. [Google Scholar] [CrossRef]
- Liu, Y.; Zhang, L.; Zhang, X.; He, X.; Li, J.; Xing, Y.; Jin, F.; Wang, Y. Pore Structure and Fractal Characteristics of Continental Low Maturity Organic-Rich Shale in the Sha-4 Member of the Liaohe Western Depression. Energies 2022, 16, 327. [Google Scholar] [CrossRef]
- Zhang, M.; Fu, X.; Zhang, Q.; Cheng, W. Research on the organic geochemical and mineral composition properties and its influence on pore structure of coal-measure shales in Yushe-Wuxiang Block, South Central Qinshui Basin, China. J. Pet. Sci. Eng. 2019, 173, 1065–1079. [Google Scholar] [CrossRef]
- Cao, X.; Gao, Y.; Cui, J.; Han, S.; Kang, L.; Song, S.; Wang, C. Pore Characteristics of Lacustrine Shale Oil Reservoir in the Cretaceous Qingshankou Formation of the Songliao Basin, NE China. Energies 2020, 13, 2027. [Google Scholar] [CrossRef]
- Bao, Y.; Ju, Y.; Yin, Z.; Xiong, J.; Wang, G.; Qi, Y. Influence of reservoir properties on the methane adsorption capacity and fractal features of coal and shale in the upper Permian coal measures of the South Sichuan coalfield, China. Energy Explor. Exploit. 2019, 38, 57–78. [Google Scholar] [CrossRef]
- Xiong, F.; Jiang, Z.; Tang, X.; Li, Z.; Bi, H.; Li, W.; Yang, P. Characteristics and origin of the heterogeneity of the Lower Silurian Longmaxi marine shale in southeastern Chongqing, SW China. J. Nat. Gas Sci. Eng. 2015, 27, 1389–1399. [Google Scholar] [CrossRef]
- Li, H.; Zhou, J.; Mou, X.; Guo, H.; Wang, X.; An, H.; Mo, Q.; Long, H.; Dang, C.; Wu, J.; et al. Pore structure and fractal characteristics of the marine shale of the longmaxi formation in the changning area, Southern Sichuan Basin, China. Front. Earth Sci. 2022, 10, 1018274. [Google Scholar] [CrossRef]
- Fu, Y.; Jiang, Y.; Dong, D.; Hu, Q.; Lei, Z.; Peng, H.; Gu, Y.; Ma, S.; Wang, Z.; Yin, X.; et al. Microscopic pore-fracture configuration and gas-filled mechanism of shale reservoirs in the western Chongqing area, Sichuan Basin, China. Pet. Explor. Dev. 2021, 48, 1063–1076. [Google Scholar] [CrossRef]
- Zhao, M.; Jin, Y.; Liu, X.; Zheng, J.; Liu, S. Characterizing the Complexity Assembly of Pore Structure in a Coal Matrix: Principle, Methodology, and Modeling Application. J. Geophys. Res. Solid Earth 2020, 125, e2020JB020110. [Google Scholar] [CrossRef]
- Jin, Y.; Zheng, J.; Liu, X.; Pan, J.; Liu, S. Control mechanisms of self-affine, rough cleat networks on flow dynamics in coal reservoir. Energy 2019, 189, 116146. [Google Scholar] [CrossRef]
- Wang, X.; Jiang, Z.; Jiang, S.; Chang, J.; Zhu, L.; Li, X.; Li, J. Full-Scale Pore Structure and Fractal Dimension of the Longmaxi Shale from the Southern Sichuan Basin: Investigations Using FE-SEM, Gas Adsorption and Mercury Intrusion Porosimetry. Minerals 2019, 9, 543. [Google Scholar] [CrossRef]
- Li, F.; Wang, M.; Liu, S.; Hao, Y. Pore characteristics and influencing factors of different types of shales. Mar. Pet. Geol. 2019, 102, 391–401. [Google Scholar] [CrossRef]
- Gu, Y.; Ding, W.; Yin, M.; Jiao, B.; Shi, S.; Li, A.; Xiao, Z.; Wang, Z. Nanoscale pore characteristics and fractal characteristics of organic-rich shale: An example from the lower Cambrian Niutitang Formation in the Fenggang block in northern Guizhou Province, South China. Energy Explor. Exploit. 2018, 37, 273–295. [Google Scholar] [CrossRef]
- Zhan, H.; Li, X.; Hu, Z.; Duan, X.; Wu, W.; Guo, W.; Lin, W. Fractal Characteristics of Deep Shales in Southern China by Small-Angle Neutron Scattering and Low-Pressure Nitrogen Adsorption. Fractal Fract. 2022, 6, 484. [Google Scholar] [CrossRef]
- Jiang, F.; Chen, D.; Chen, J.; Li, Q.; Liu, Y.; Shao, X.; Hu, T.; Dai, J. Fractal Analysis of Shale Pore Structure of Continental Gas Shale Reservoir in the Ordos Basin, NW China. Energy Fuels 2016, 30, 4676–4689. [Google Scholar] [CrossRef]
- Turlapati, V.Y.; Prusty, B.K.; Bakshi, T. Detailed Pore Structure Study of Damodar Valley and Upper Assam Basin Shales Using Fractal Analysis. Energy Fuels 2020, 34, 14001–14011. [Google Scholar] [CrossRef]
- Xi, Z.; Tang, S.; Wang, J.; Yi, J.; Guo, Y.; Wang, K. Pore Structure and Fractal Characteristics of Niutitang Shale from China. Minerals 2018, 8, 163. [Google Scholar] [CrossRef]
- Li, A.; Ding, W.; He, J.; Dai, P.; Yin, S.; Xie, F. Investigation of pore structure and fractal characteristics of organic-rich shale reservoirs: A case study of Lower Cambrian Qiongzhusi formation in Malong block of eastern Yunnan Province, South China. Mar. Pet. Geol. 2016, 70, 46–57. [Google Scholar] [CrossRef]
- Li, J.; Tang, S.; Zhang, S.; Li, L.; Wei, J.; Xi, Z.; Sun, K. Characterization of unconventional reservoirs and continuous accumulations of natural gas in the Carboniferous-Permian strata, mid-eastern Qinshui basin, China. J. Nat. Gas Sci. Eng. 2018, 49, 298–316. [Google Scholar] [CrossRef]
- Yan, X.; Tang, S.; Zhang, S.; Yi, Y.; Dang, F.; Zhang, Q. Analysis of productivity differences in vertical coalbed methane wells in the Shizhuangnan Block, Southern Qinshui Basin, and their influencing factors. Energy Explor. Exploit. 2020, 38, 1428–1453. [Google Scholar] [CrossRef]
- Zhang, J.; Li, X.; Wei, Q.; Sun, K.; Zhang, G.; Wang, F. Characterization of Full-Sized Pore Structure and Fractal Characteristics of Marine–Continental Transitional Longtan Formation Shale of Sichuan Basin, South China. Energy Fuels 2017, 31, 10490–10504. [Google Scholar] [CrossRef]
- Wang, B.; Zhang, Q.; Wang, G.; Liu, M. Analysis on the difference of material composition and reservoir space of Mesoproterozoic dark marine shale in the Yanshan area. Energy Explor. Exploit. 2018, 37, 332–354. [Google Scholar] [CrossRef]
- Sun, K.; Tang, S.; Zhang, S.; Xi, Z.; Li, J. The magma thermal field and the shallow-level gas accumulation of tight gas reservoirs in the middle-eastern parts of the Qinshui Basin. Earth Sci. Res. J. 2019, 23, 27–34. [Google Scholar] [CrossRef]
- Liu, B.; Chang, S.; Zhang, S.; Li, Y.; Yang, Z.; Liu, Z.; Chen, Q. Seismic-Geological Integrated Study on Sedimentary Evolution and Peat Accumulation Regularity of the Shanxi Formation in Xinjing Mining Area, Qinshui Basin. Energies 2022, 15, 1851. [Google Scholar] [CrossRef]
- Li, J.; Yin, J.; Zhang, Y.; Lu, S.; Wang, W.; Li, J.; Chen, F.; Meng, Y. A comparison of experimental methods for describing shale pore features—A case study in the Bohai Bay Basin of eastern China. Int. J. Coal Geol. 2015, 152, 39–49. [Google Scholar] [CrossRef]
- Wang, Z.; Fu, X.; Pan, J.; Deng, Z. Effect of N2/CO2 injection and alternate injection on volume swelling/shrinkage strain of coal. Energy 2023, 275, 127377. [Google Scholar] [CrossRef]
- Pan, J.; He, H.; Li, G.; Wang, X.; Hou, Q.; Liu, L.; Cheng, N. Anisotropic strain of anthracite induced by different phase CO2 injection and its effect on permeability. Energy 2023, 284, 128619. [Google Scholar] [CrossRef]
- Zheng, S.; Yao, Y.; Zhang, S.; Liu, Y.; Yang, J. Insights into Multifractal Characterization of Coals by Mercury Intrusion Porosimetry. Energies 2019, 12, 4743. [Google Scholar] [CrossRef]
- Han, W.; Zhou, G.; Gao, D.; Zhang, Z.; Wei, Z.; Wang, H.; Yang, H. Experimental analysis of the pore structure and fractal characteristics of different metamorphic coal based on mercury intrusion-nitrogen adsorption porosimetry. Powder Technol. 2020, 362, 386–398. [Google Scholar] [CrossRef]
- Chen, L.E.I.; Jiang, Z.; Liu, K.; Yang, W.E.I.; Jiang, S.H.U.; Tan, J. Investigation of Fractal Characteristics and Methane Adsorption Capacity of the Upper Triassic Lacustrine Shale in the Sichuan Basin, Southwest China. Fractals 2019, 27, 1940011. [Google Scholar] [CrossRef]
- Tian, T.; Zhou, S.; Fu, D.; Yang, F.; Li, J. Calculation of the original abundance of organic matter at high-over maturity: A case study of the Lower Cambrian Niutitang shale in the Micangshan-Hannan Uplift, SW China. J. Pet. Sci. Eng. 2019, 179, 645–654. [Google Scholar] [CrossRef]
- Tang, X.; Jiang, Z.; Li, Z.; Gao, Z.; Bai, Y.; Zhao, S.; Feng, J. The effect of the variation in material composition on the heterogeneous pore structure of high-maturity shale of the Silurian Longmaxi formation in the southeastern Sichuan Basin, China. J. Nat. Gas Sci. Eng. 2015, 23, 464–473. [Google Scholar] [CrossRef]
- Yang, F.; Ning, Z.; Liu, H. Fractal characteristics of shales from a shale gas reservoir in the Sichuan Basin, China. Fuel 2014, 115, 378–384. [Google Scholar] [CrossRef]
- Mandelbrot, B.B.; Wheeler, J.A. The Fractal Geometry of Nature. Am. J. Phys. 1983, 51, 286–287. [Google Scholar] [CrossRef]
- Pfeifer, P.; Avnir, D. Chemistry in noninteger dimensions between two and three. I. Fractal theory of heterogeneous surfaces. J. Chem. Phys. 1983, 79, 3558–3565. [Google Scholar] [CrossRef]
- Wood, D.A. Estimating Organic-Rich Shale Fractal Dimensions from Gas Adsorption Isotherms: Combining Different Methods Leads to More Reliable Values and Insight. Nat. Resour. Res. 2021, 30, 3551–3574. [Google Scholar] [CrossRef]
- Zhao, W.; Zhu, R.; Hu, S.; Hou, L.; Wu, S. Accumulation contribution differences between lacustrine organic-rich shales and mudstones and their significance in shale oil evaluation. Pet. Explor. Dev. 2020, 47, 1160–1171. [Google Scholar] [CrossRef]
- Li, Z.; Tang, L.; Jiang, Z.; Liang, Z.; Yu, H.; Yang, Y.; Xiao, L. Fractal characteristics of nanopores in lacustrine shales of the Triassic Yanchang Formation, Ordos Basin, NW China. Open Geosci. 2019, 11, 196–207. [Google Scholar] [CrossRef]
- Huang, Y.; Zhang, P.; Zhang, J.; Tang, X.; Liu, C.; Yang, J.; Chen, Z. Fractal Characteristics of Pores in the Longtan Shales of Guizhou, Southwest China. Geofluids 2020, 2020, 1–16. [Google Scholar] [CrossRef]
- Ji, W.; Song, Y.; Jiang, Z.; Meng, M.; Liu, Q.; Chen, L.; Wang, P.; Gao, F.; Huang, H. Fractal characteristics of nano-pores in the Lower Silurian Longmaxi shales from the Upper Yangtze Platform, south China. Mar. Pet. Geol. 2016, 78, 88–98. [Google Scholar] [CrossRef]
Figure 1.
Tectonic location of study area.

Figure 2.
Low temperature nitrogen adsorption–desorption curve.

Figure 3.
Curve of versus .

Figure 4.
Curve of versus .

Figure 5.
Curve of versus .
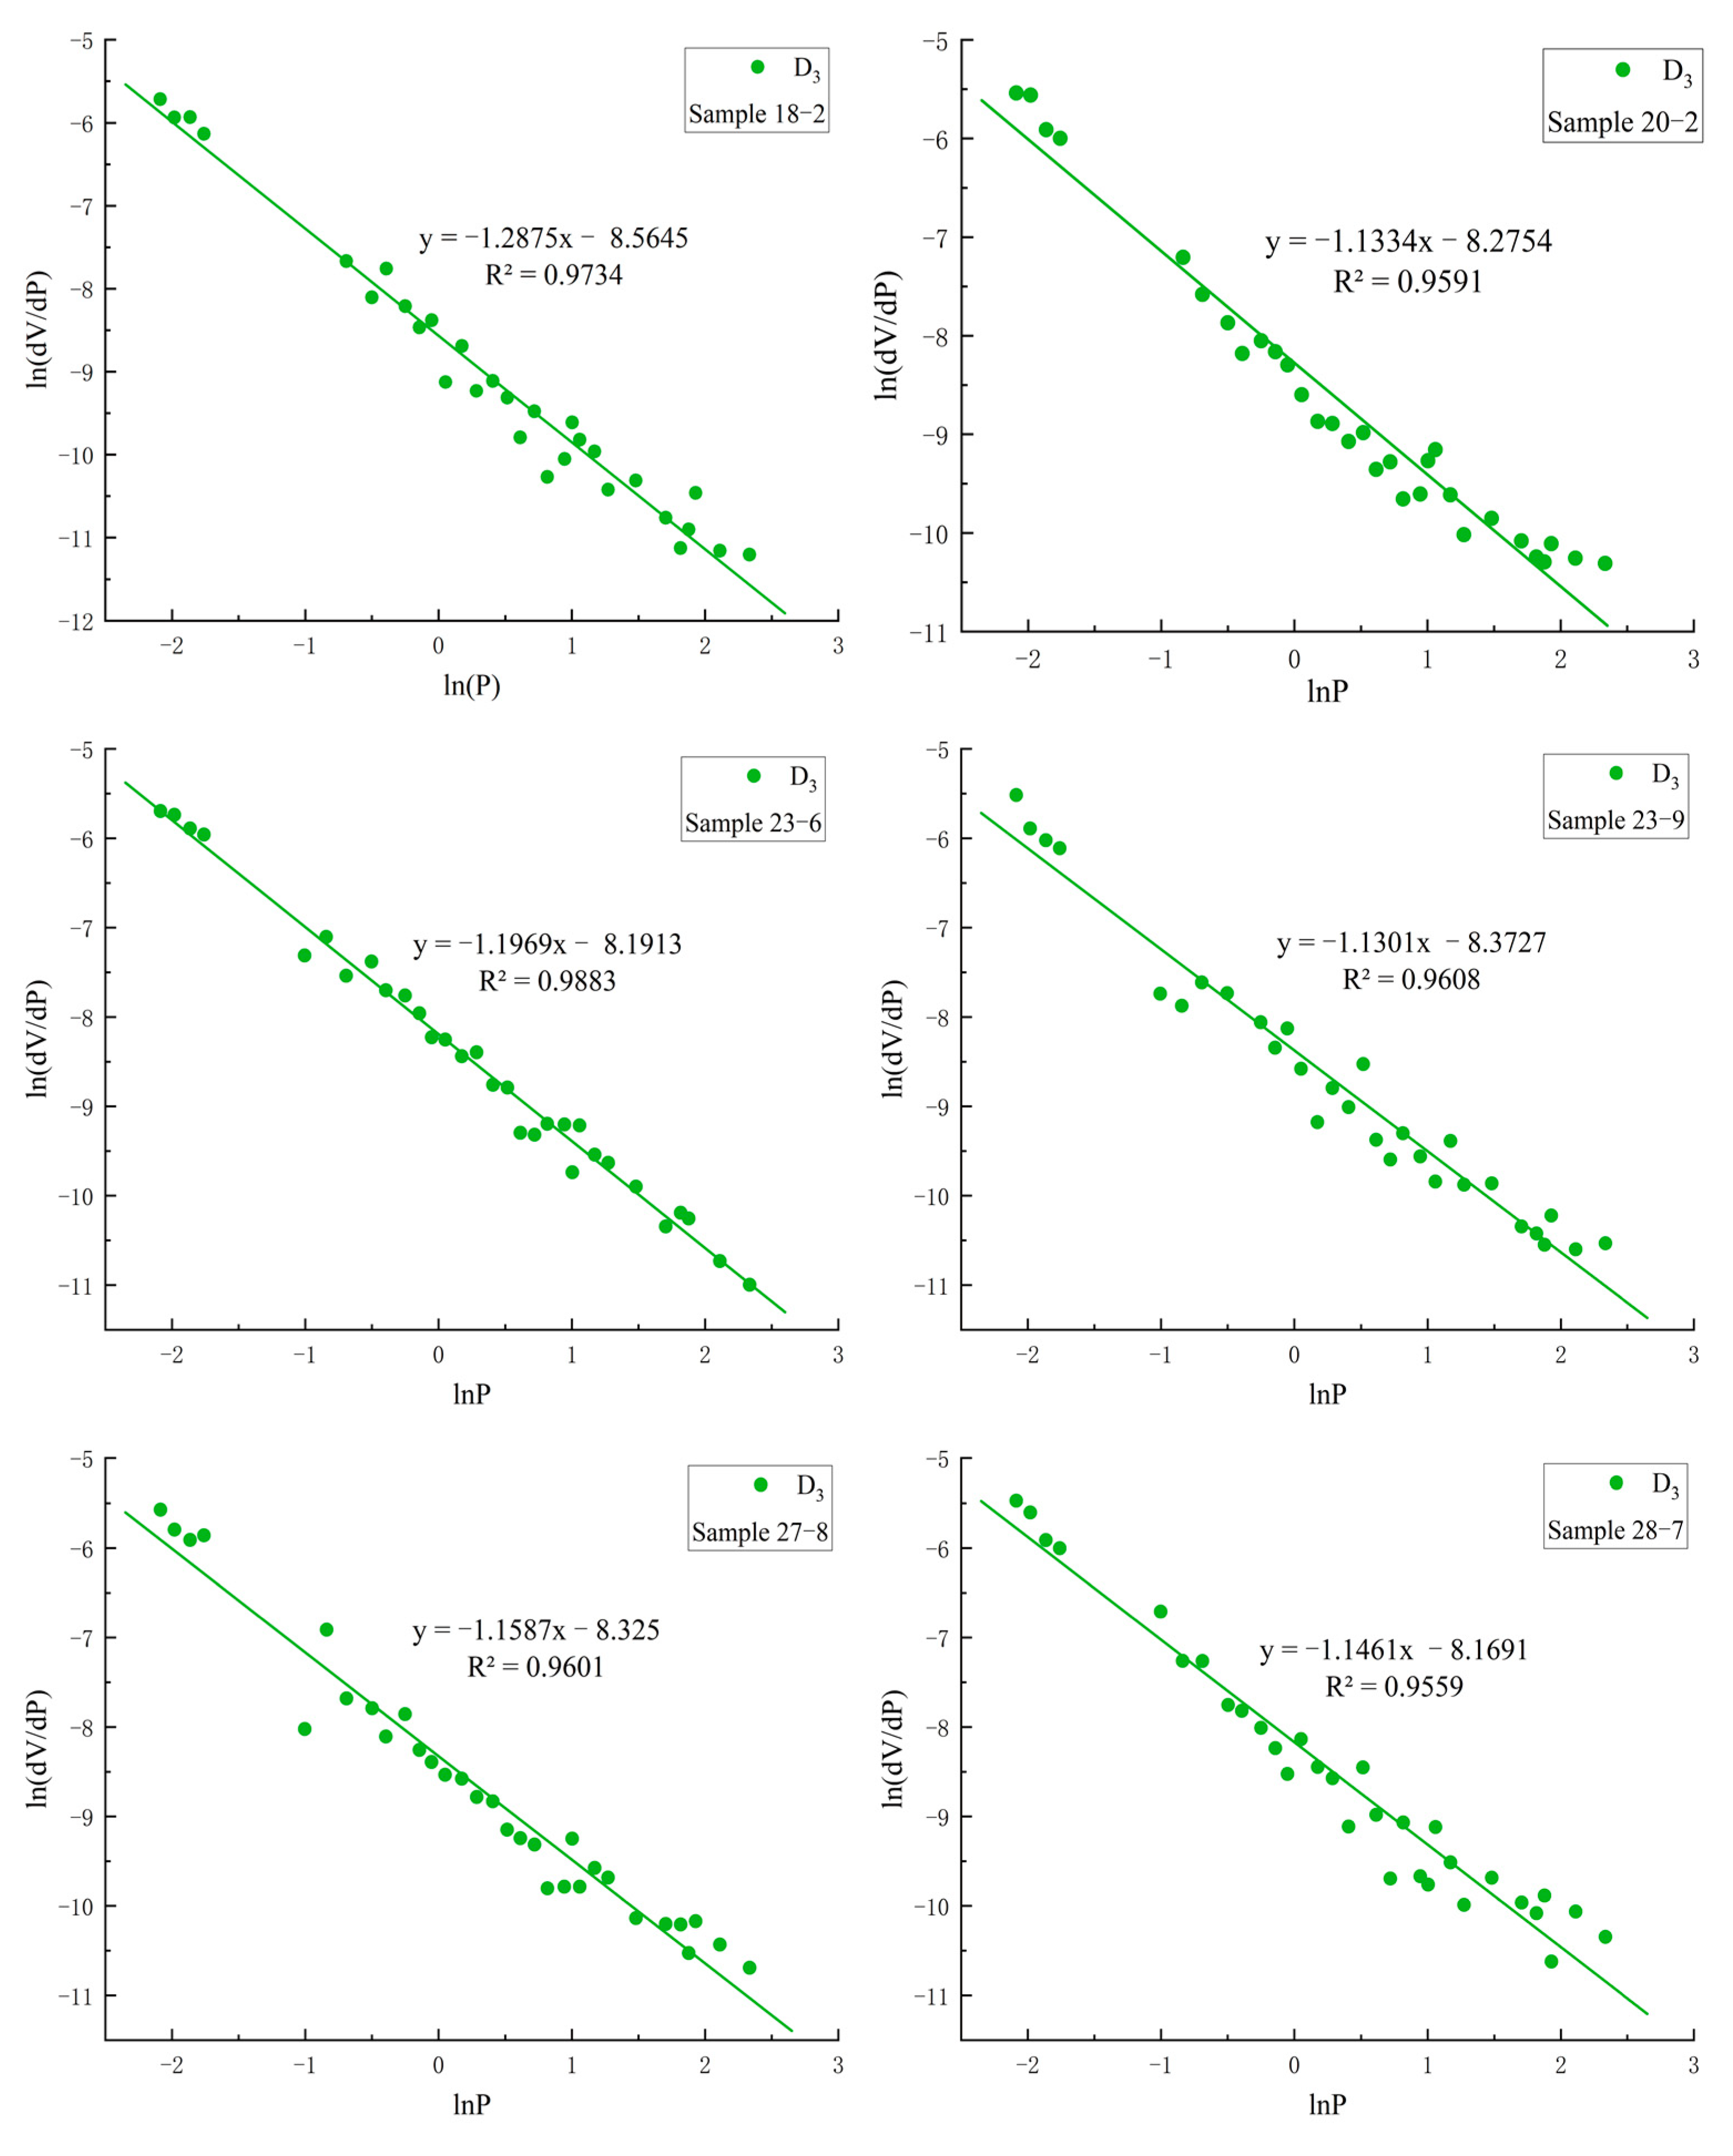
Figure 6.
Correlation between the fractal dimension and TOC.
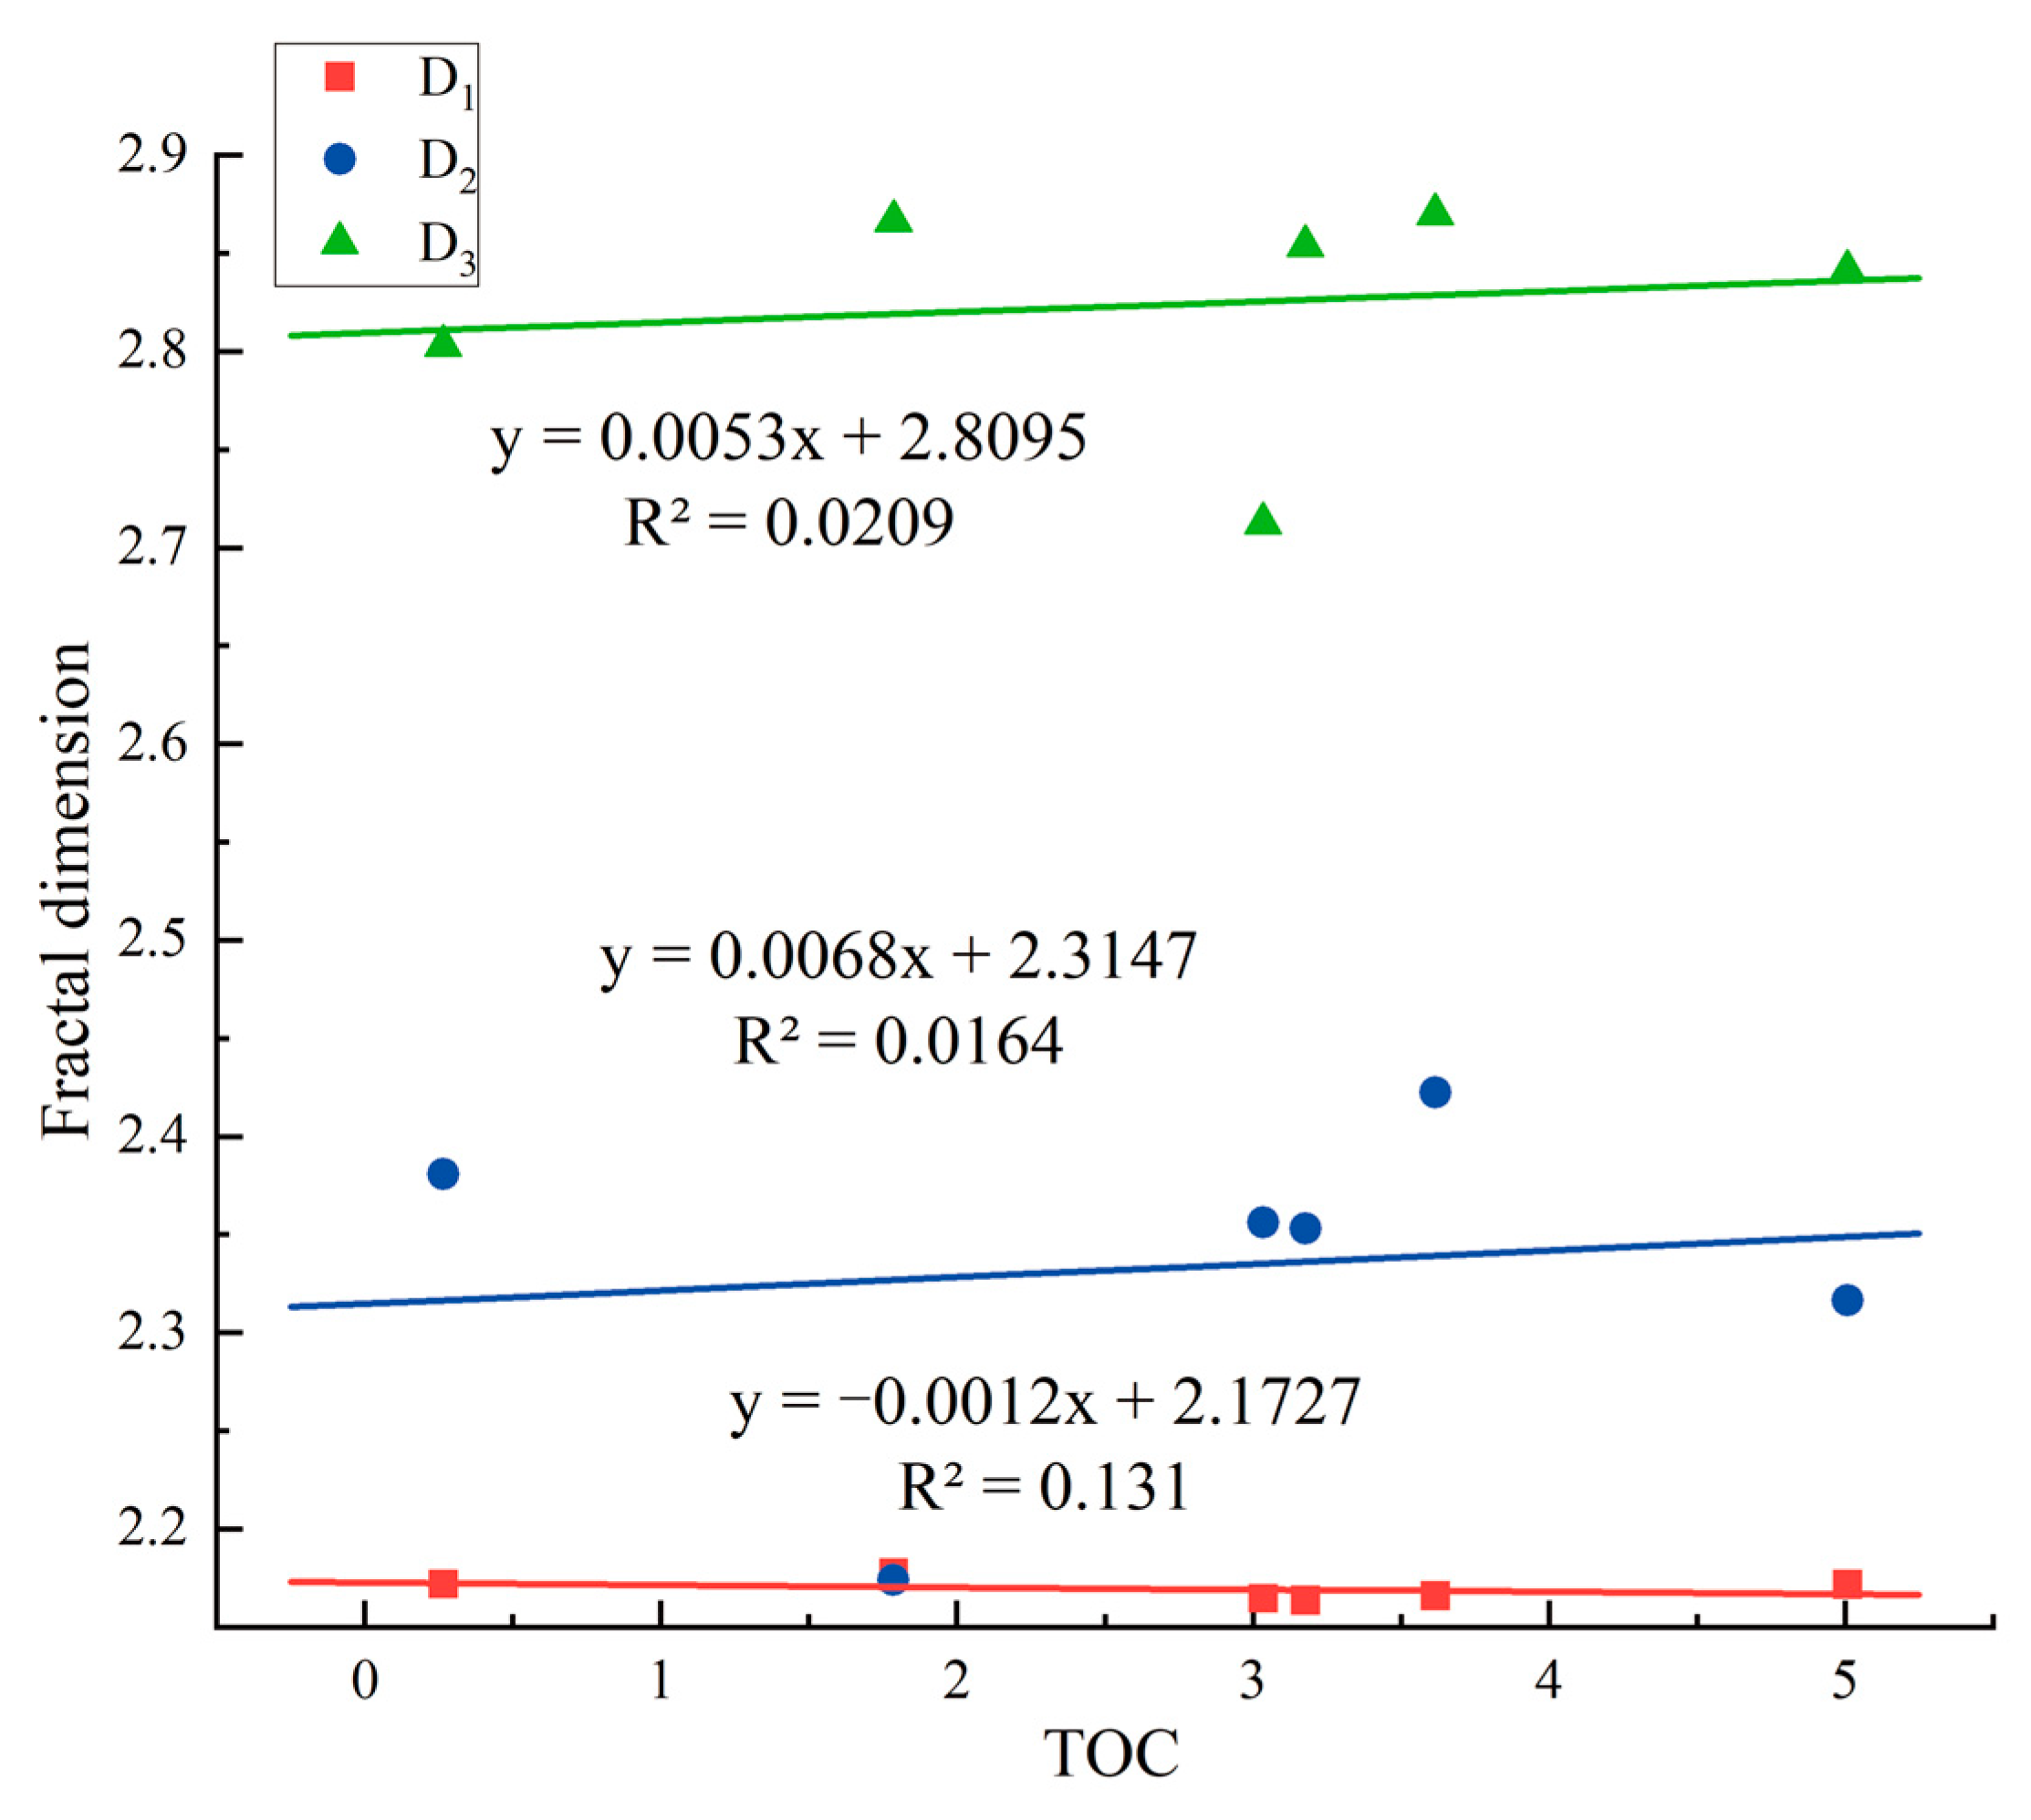
Figure 7.
Correlation between the mesoporous fractal dimension and TOC.

Figure 8.
Correlation between the fractal dimension and pore volume.
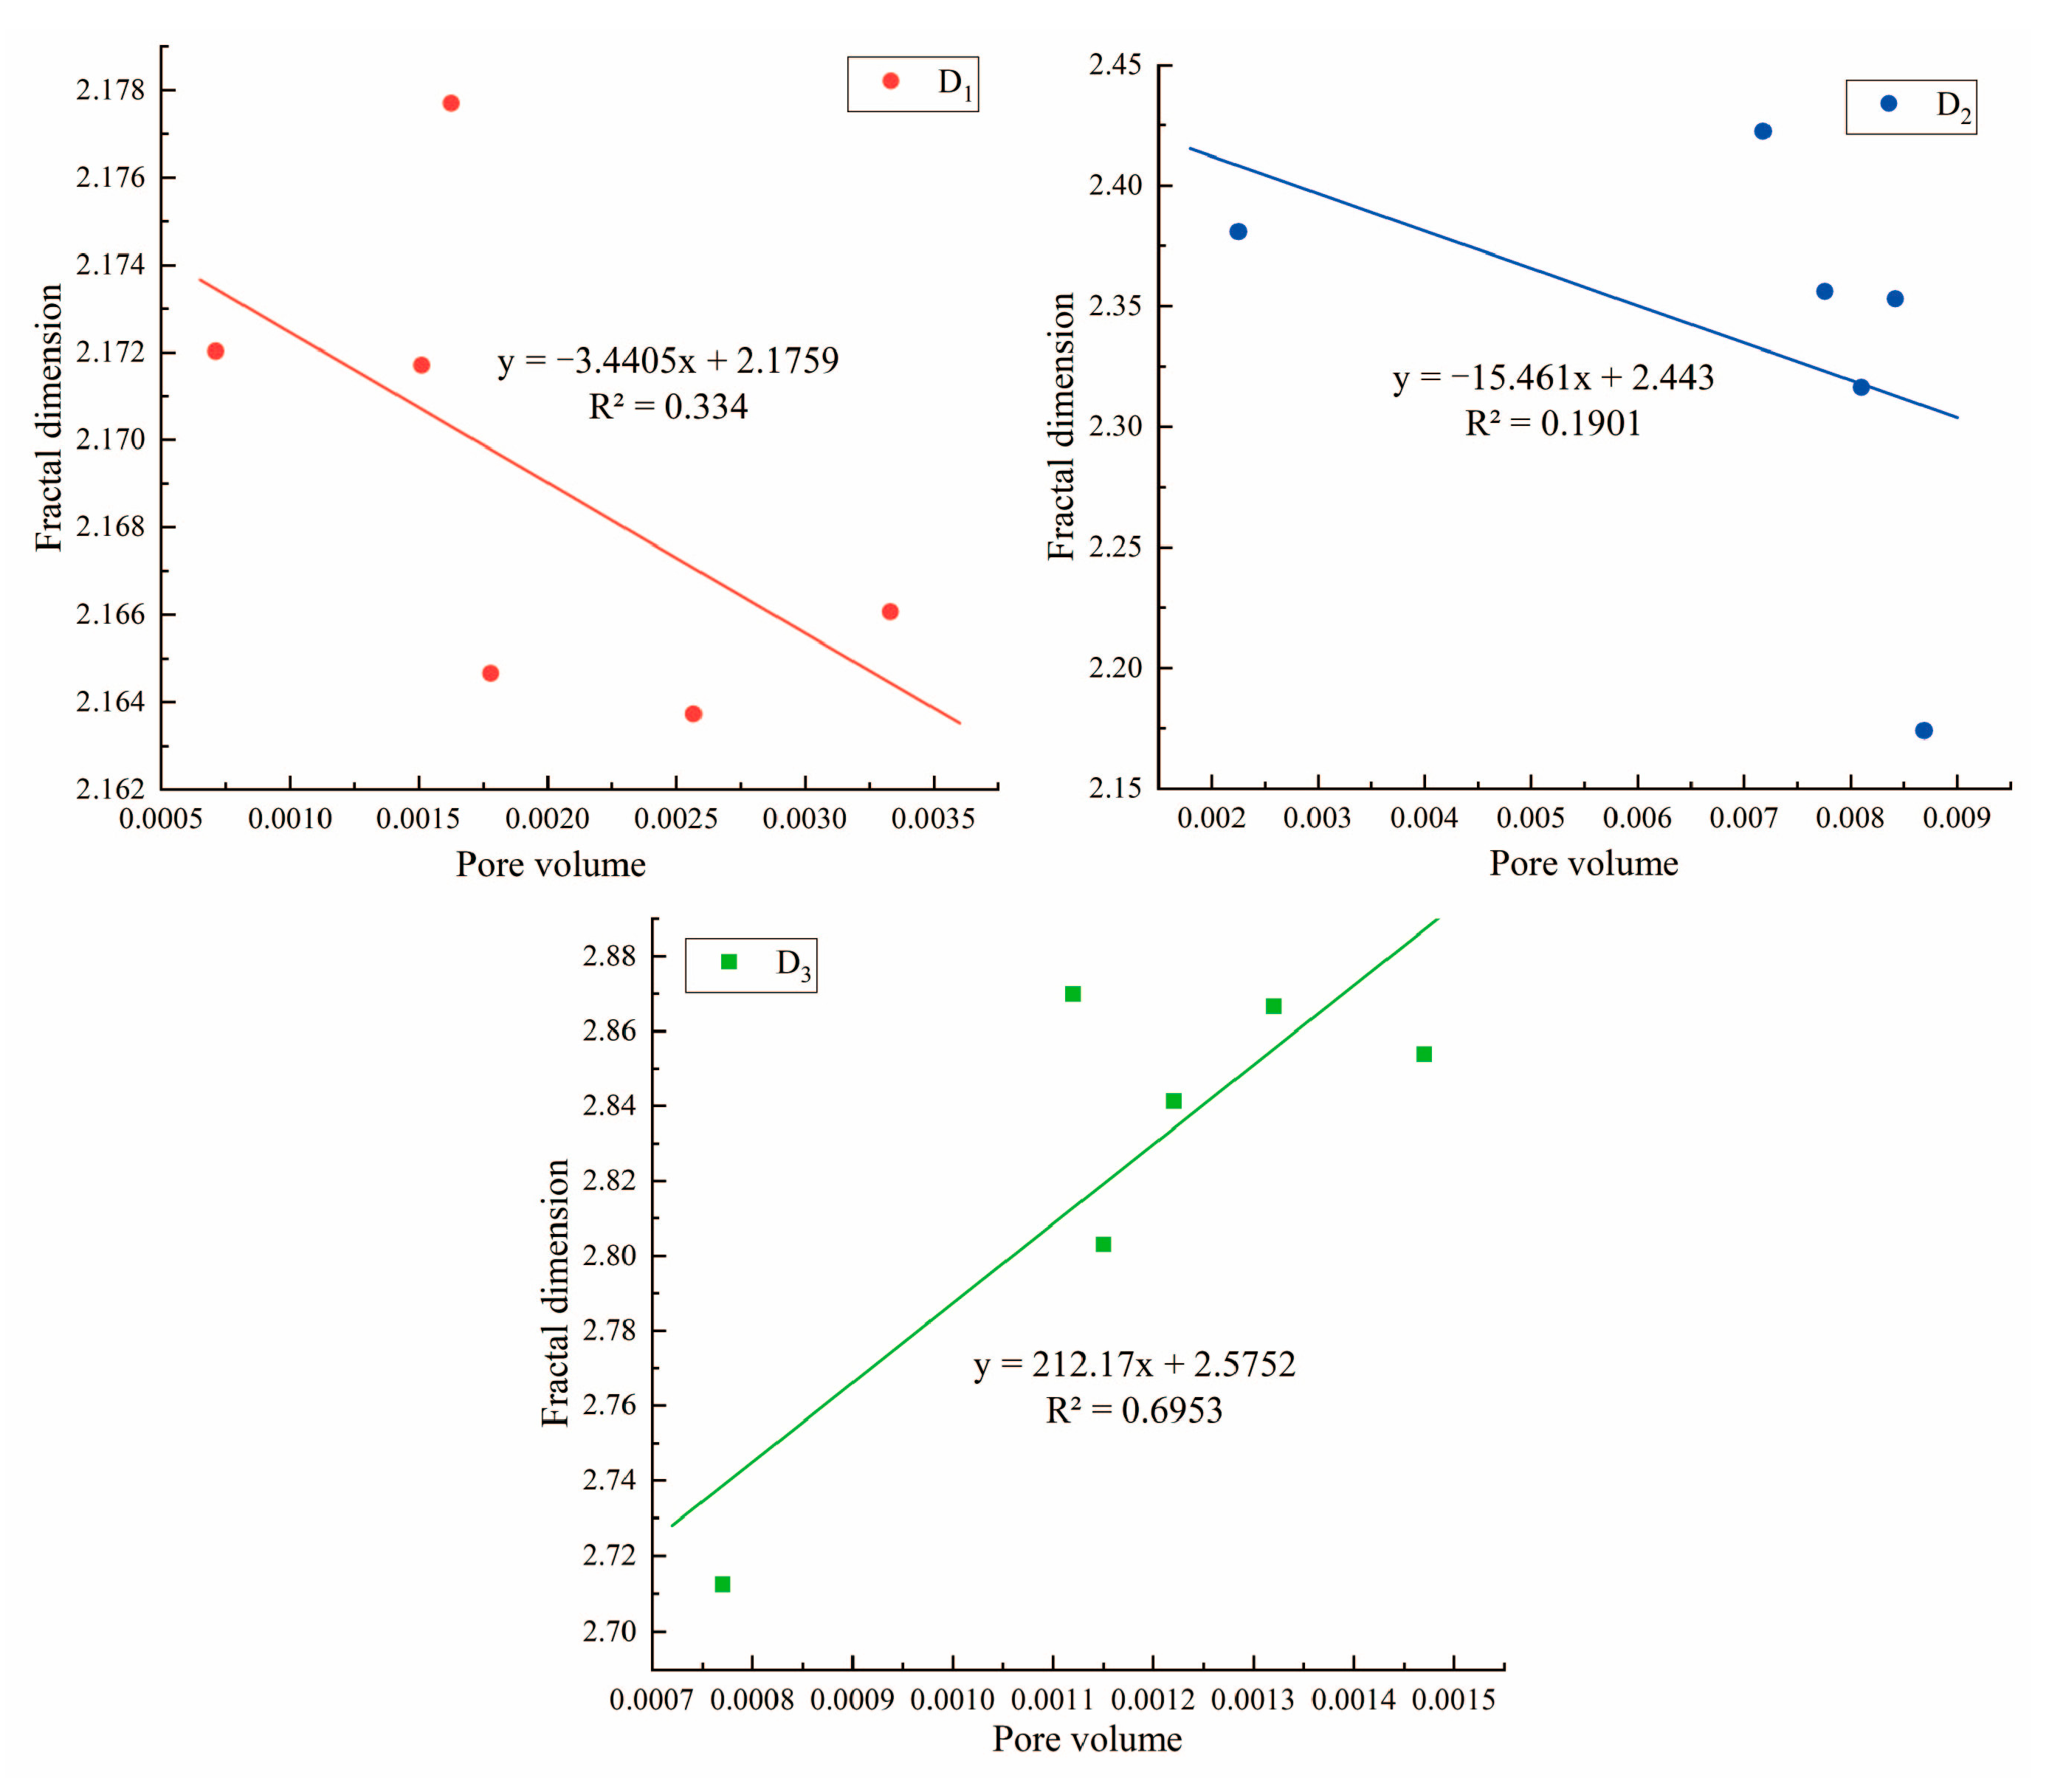
Figure 9.
Correlation between the fractal dimension and specific surface area.
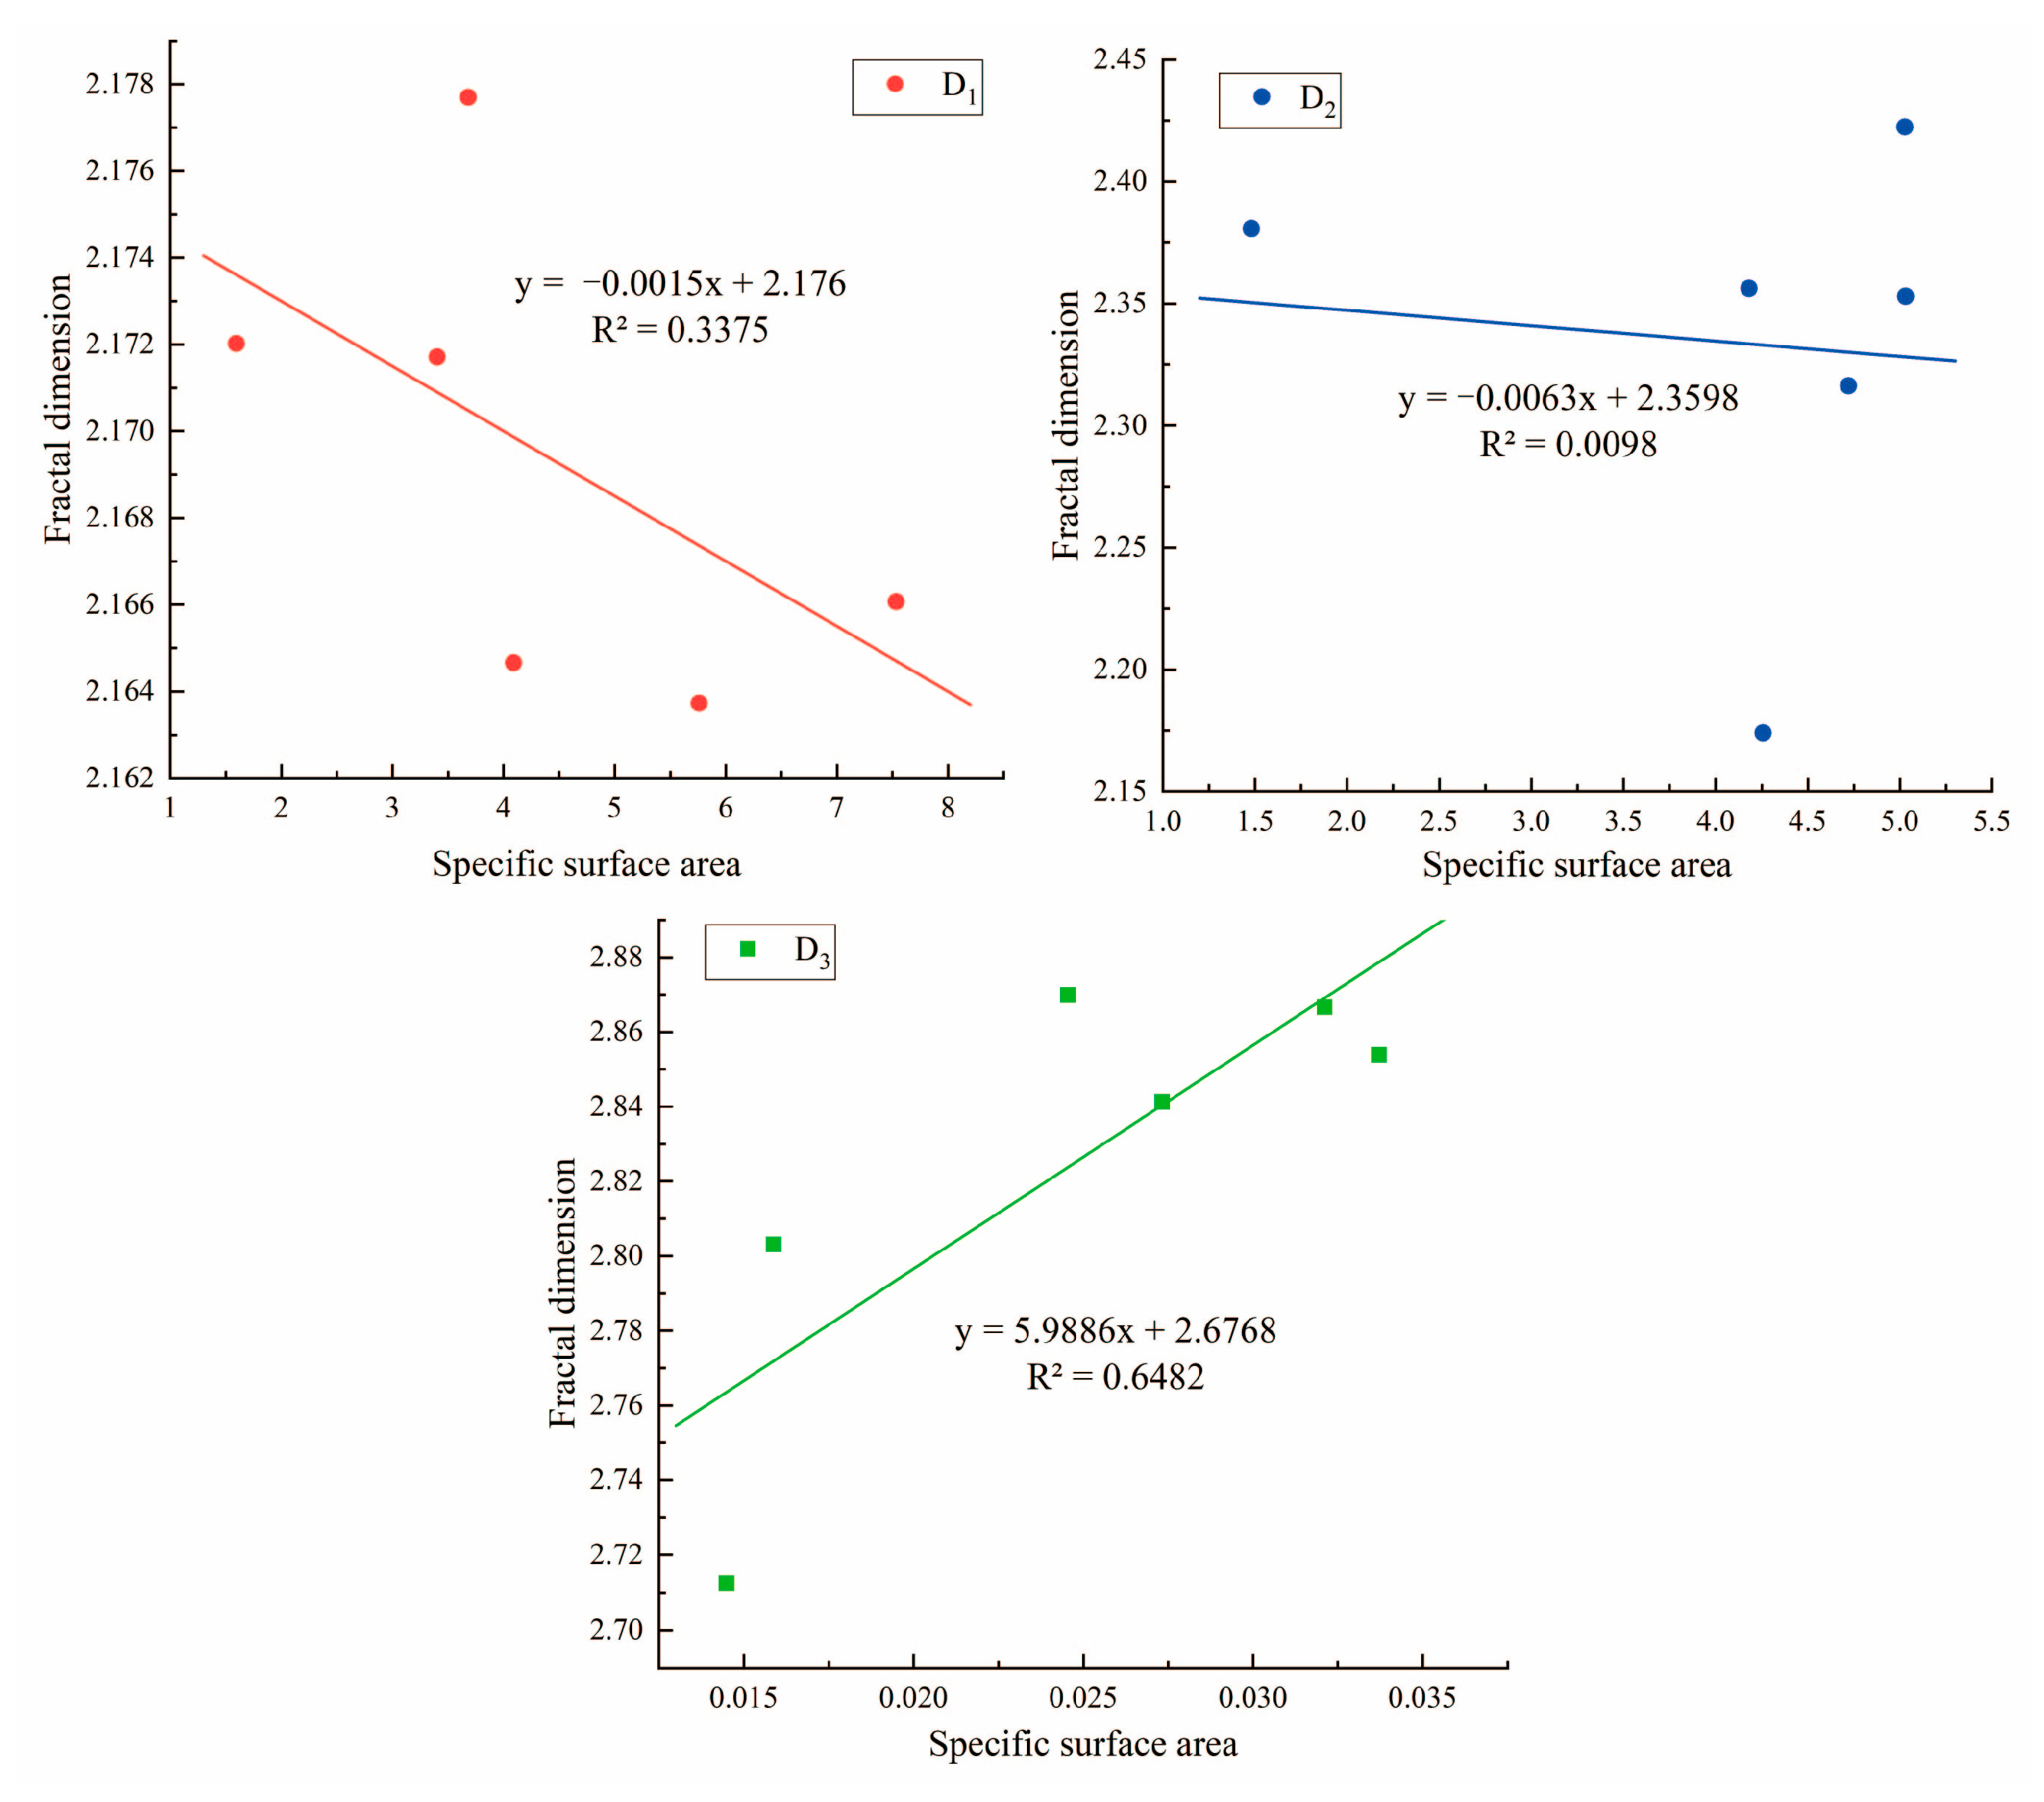
Figure 10.
Correlation between the fractal dimension and quartz.

Figure 11.
Correlation between the fractal dimension and carbonate minerals.

Figure 12.
Correlation between the fractal dimension and titanium oxide.
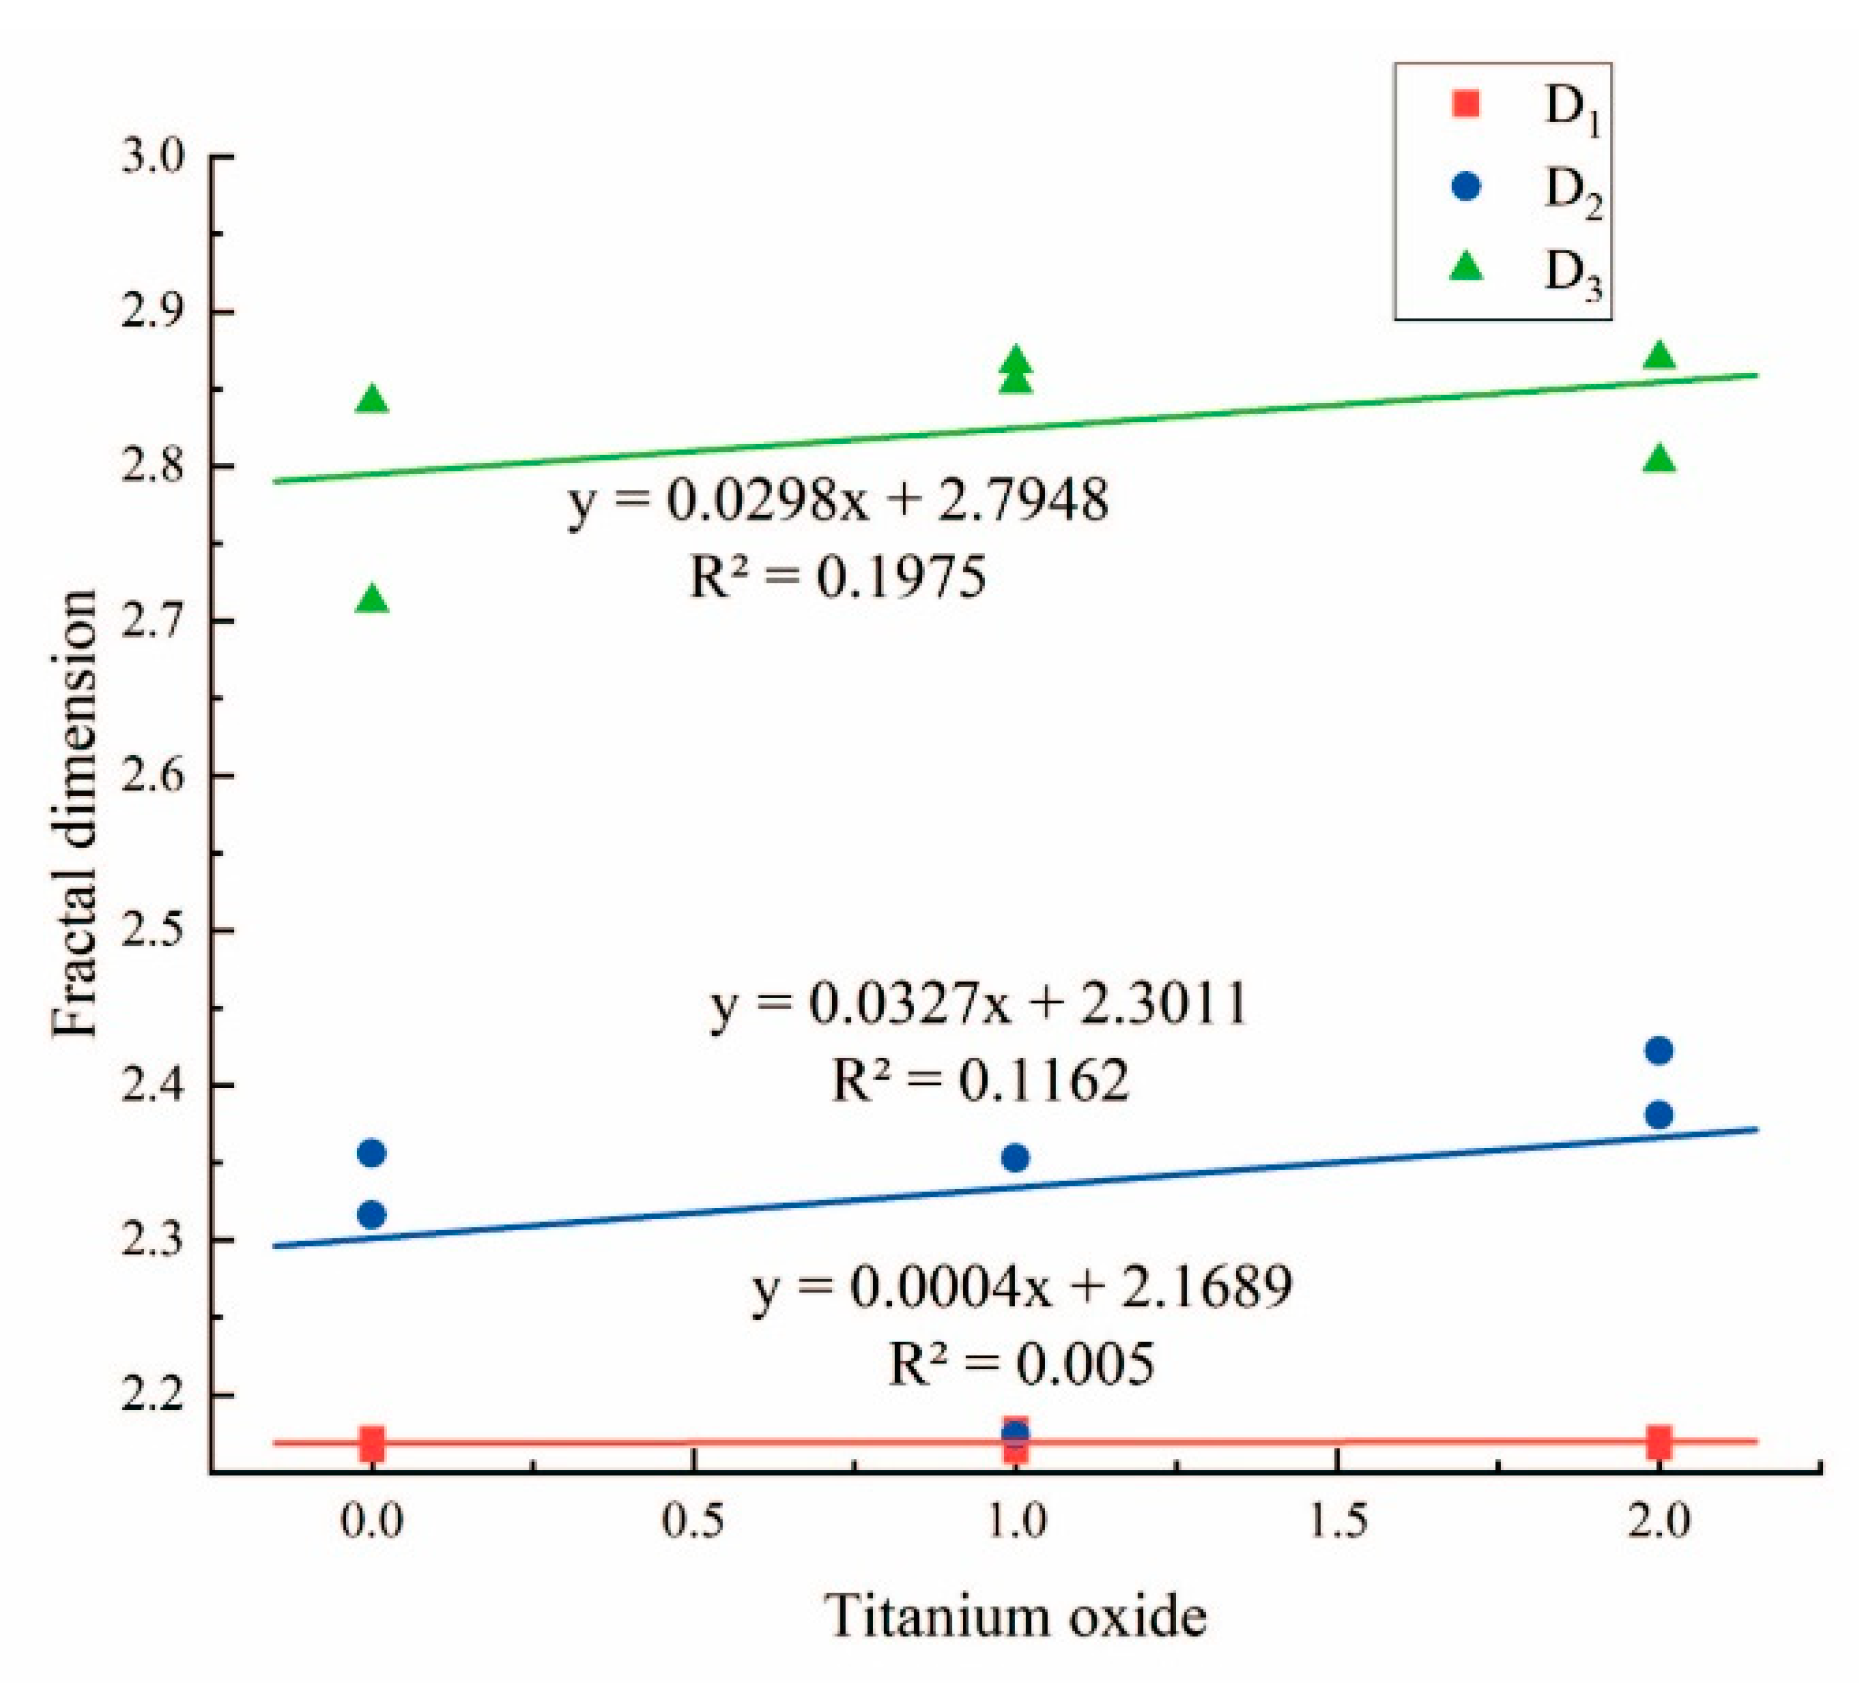
Figure 13.
Correlation between the fractal dimension and clay minerals.
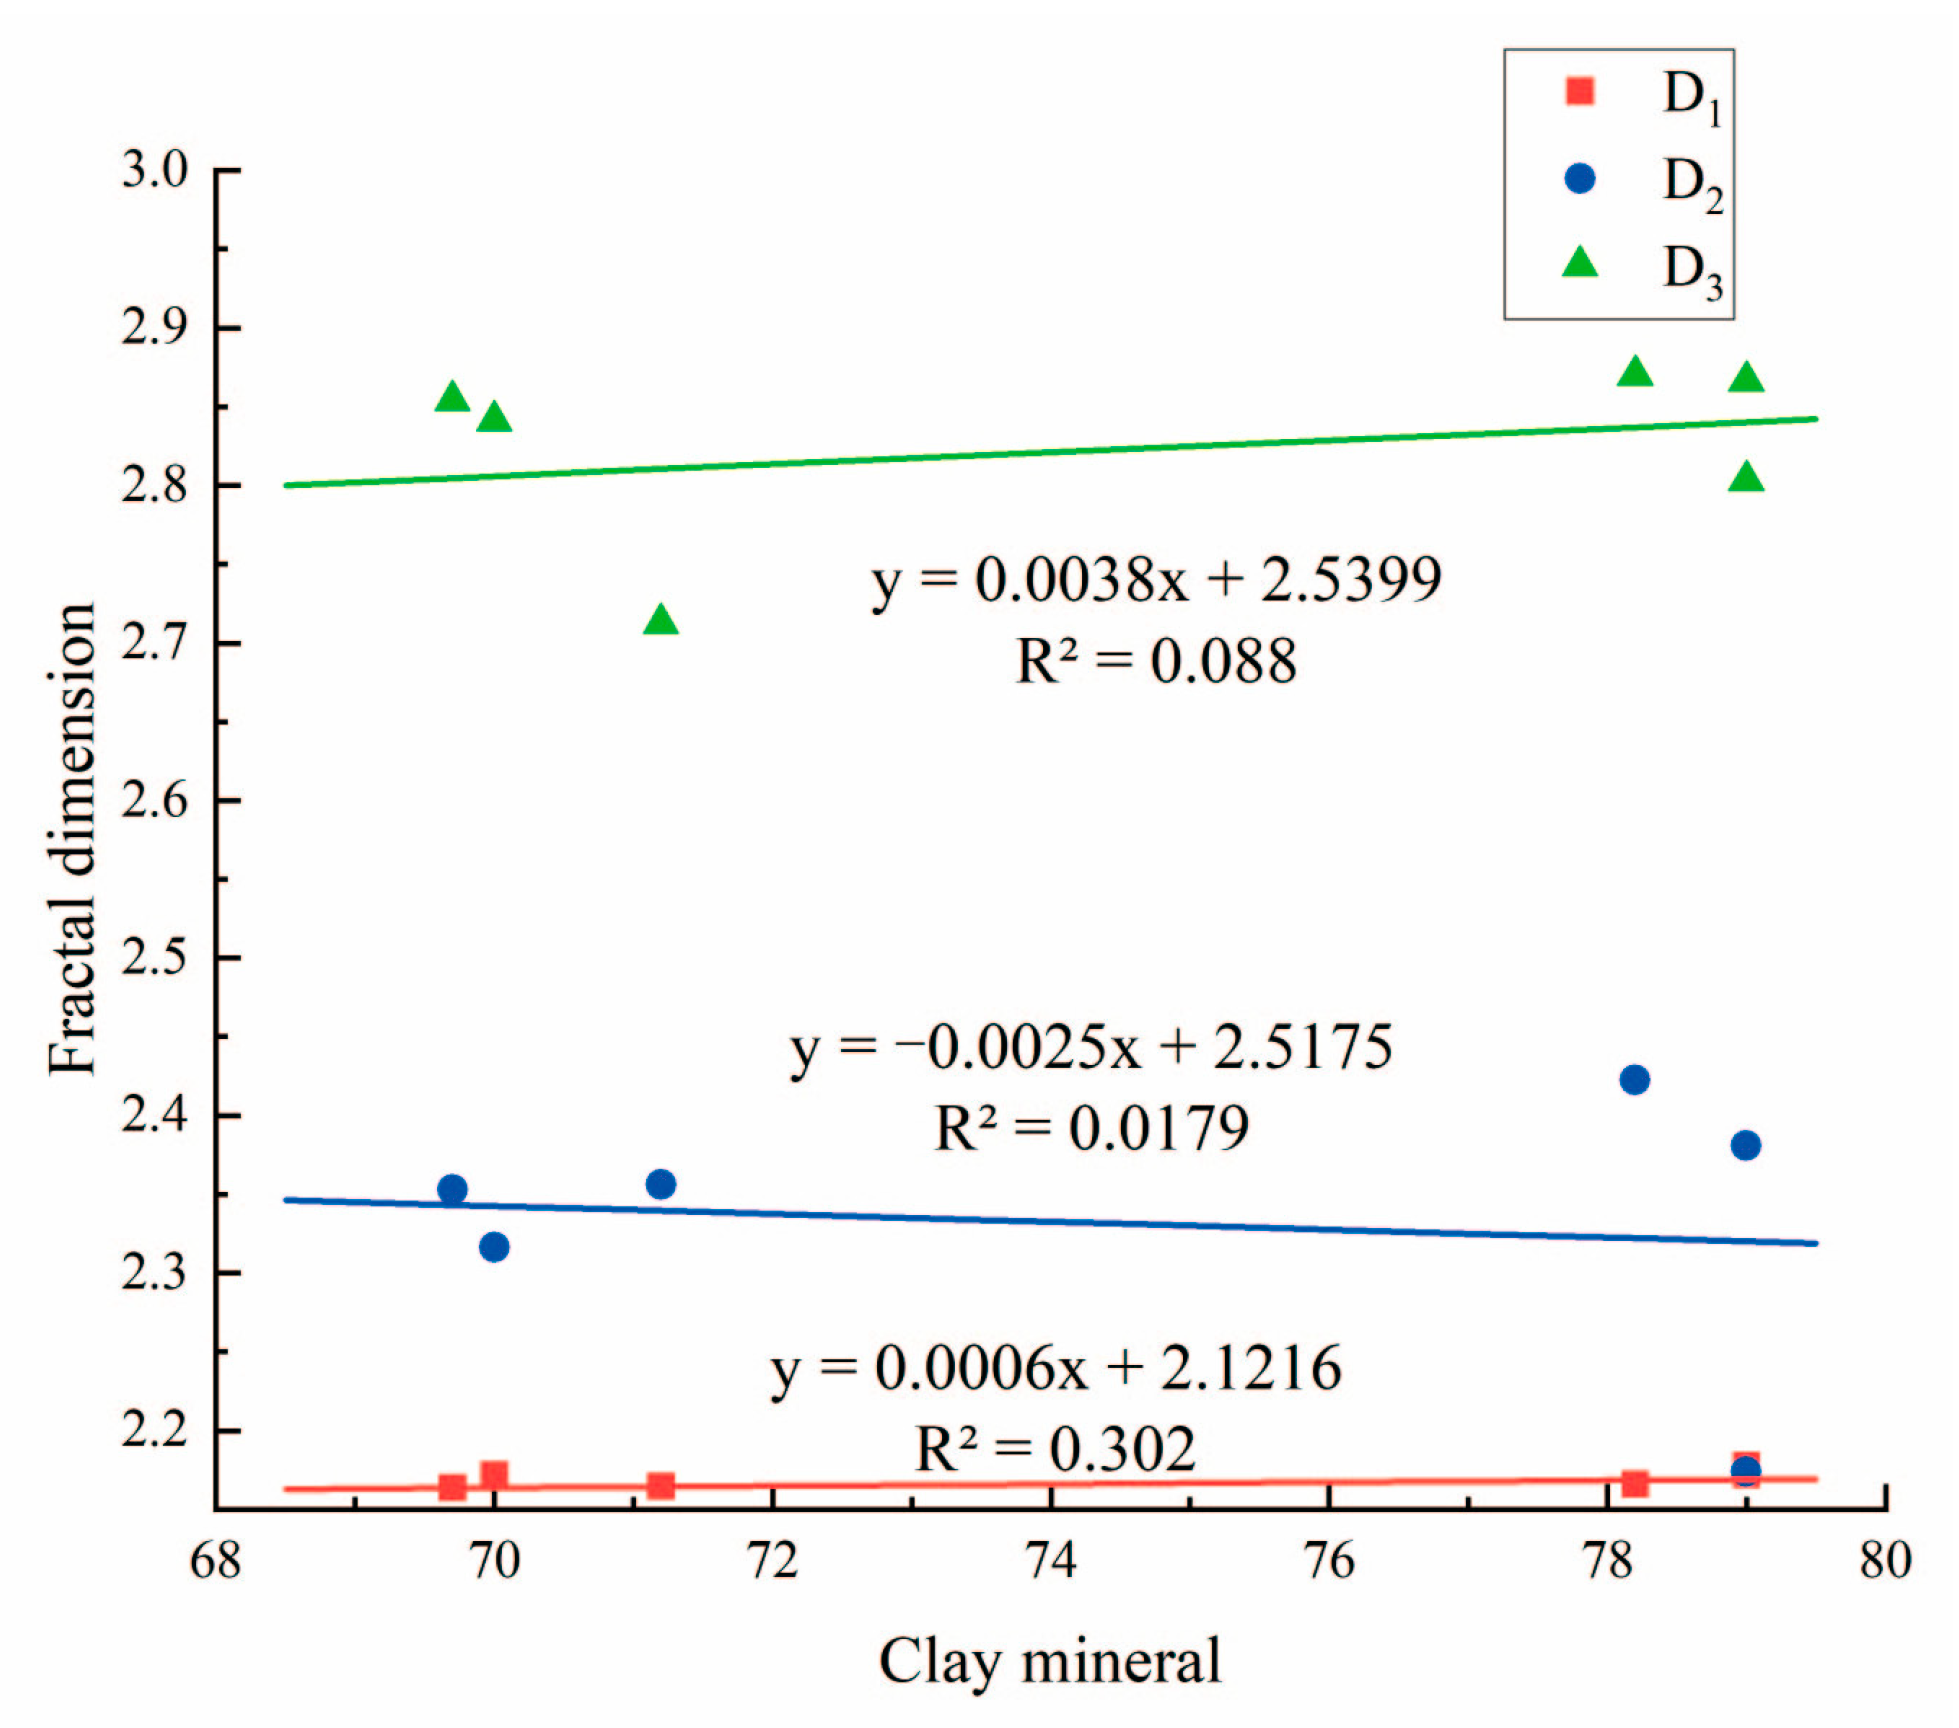
Figure 14.
Correlation between the fractal dimension and illite.
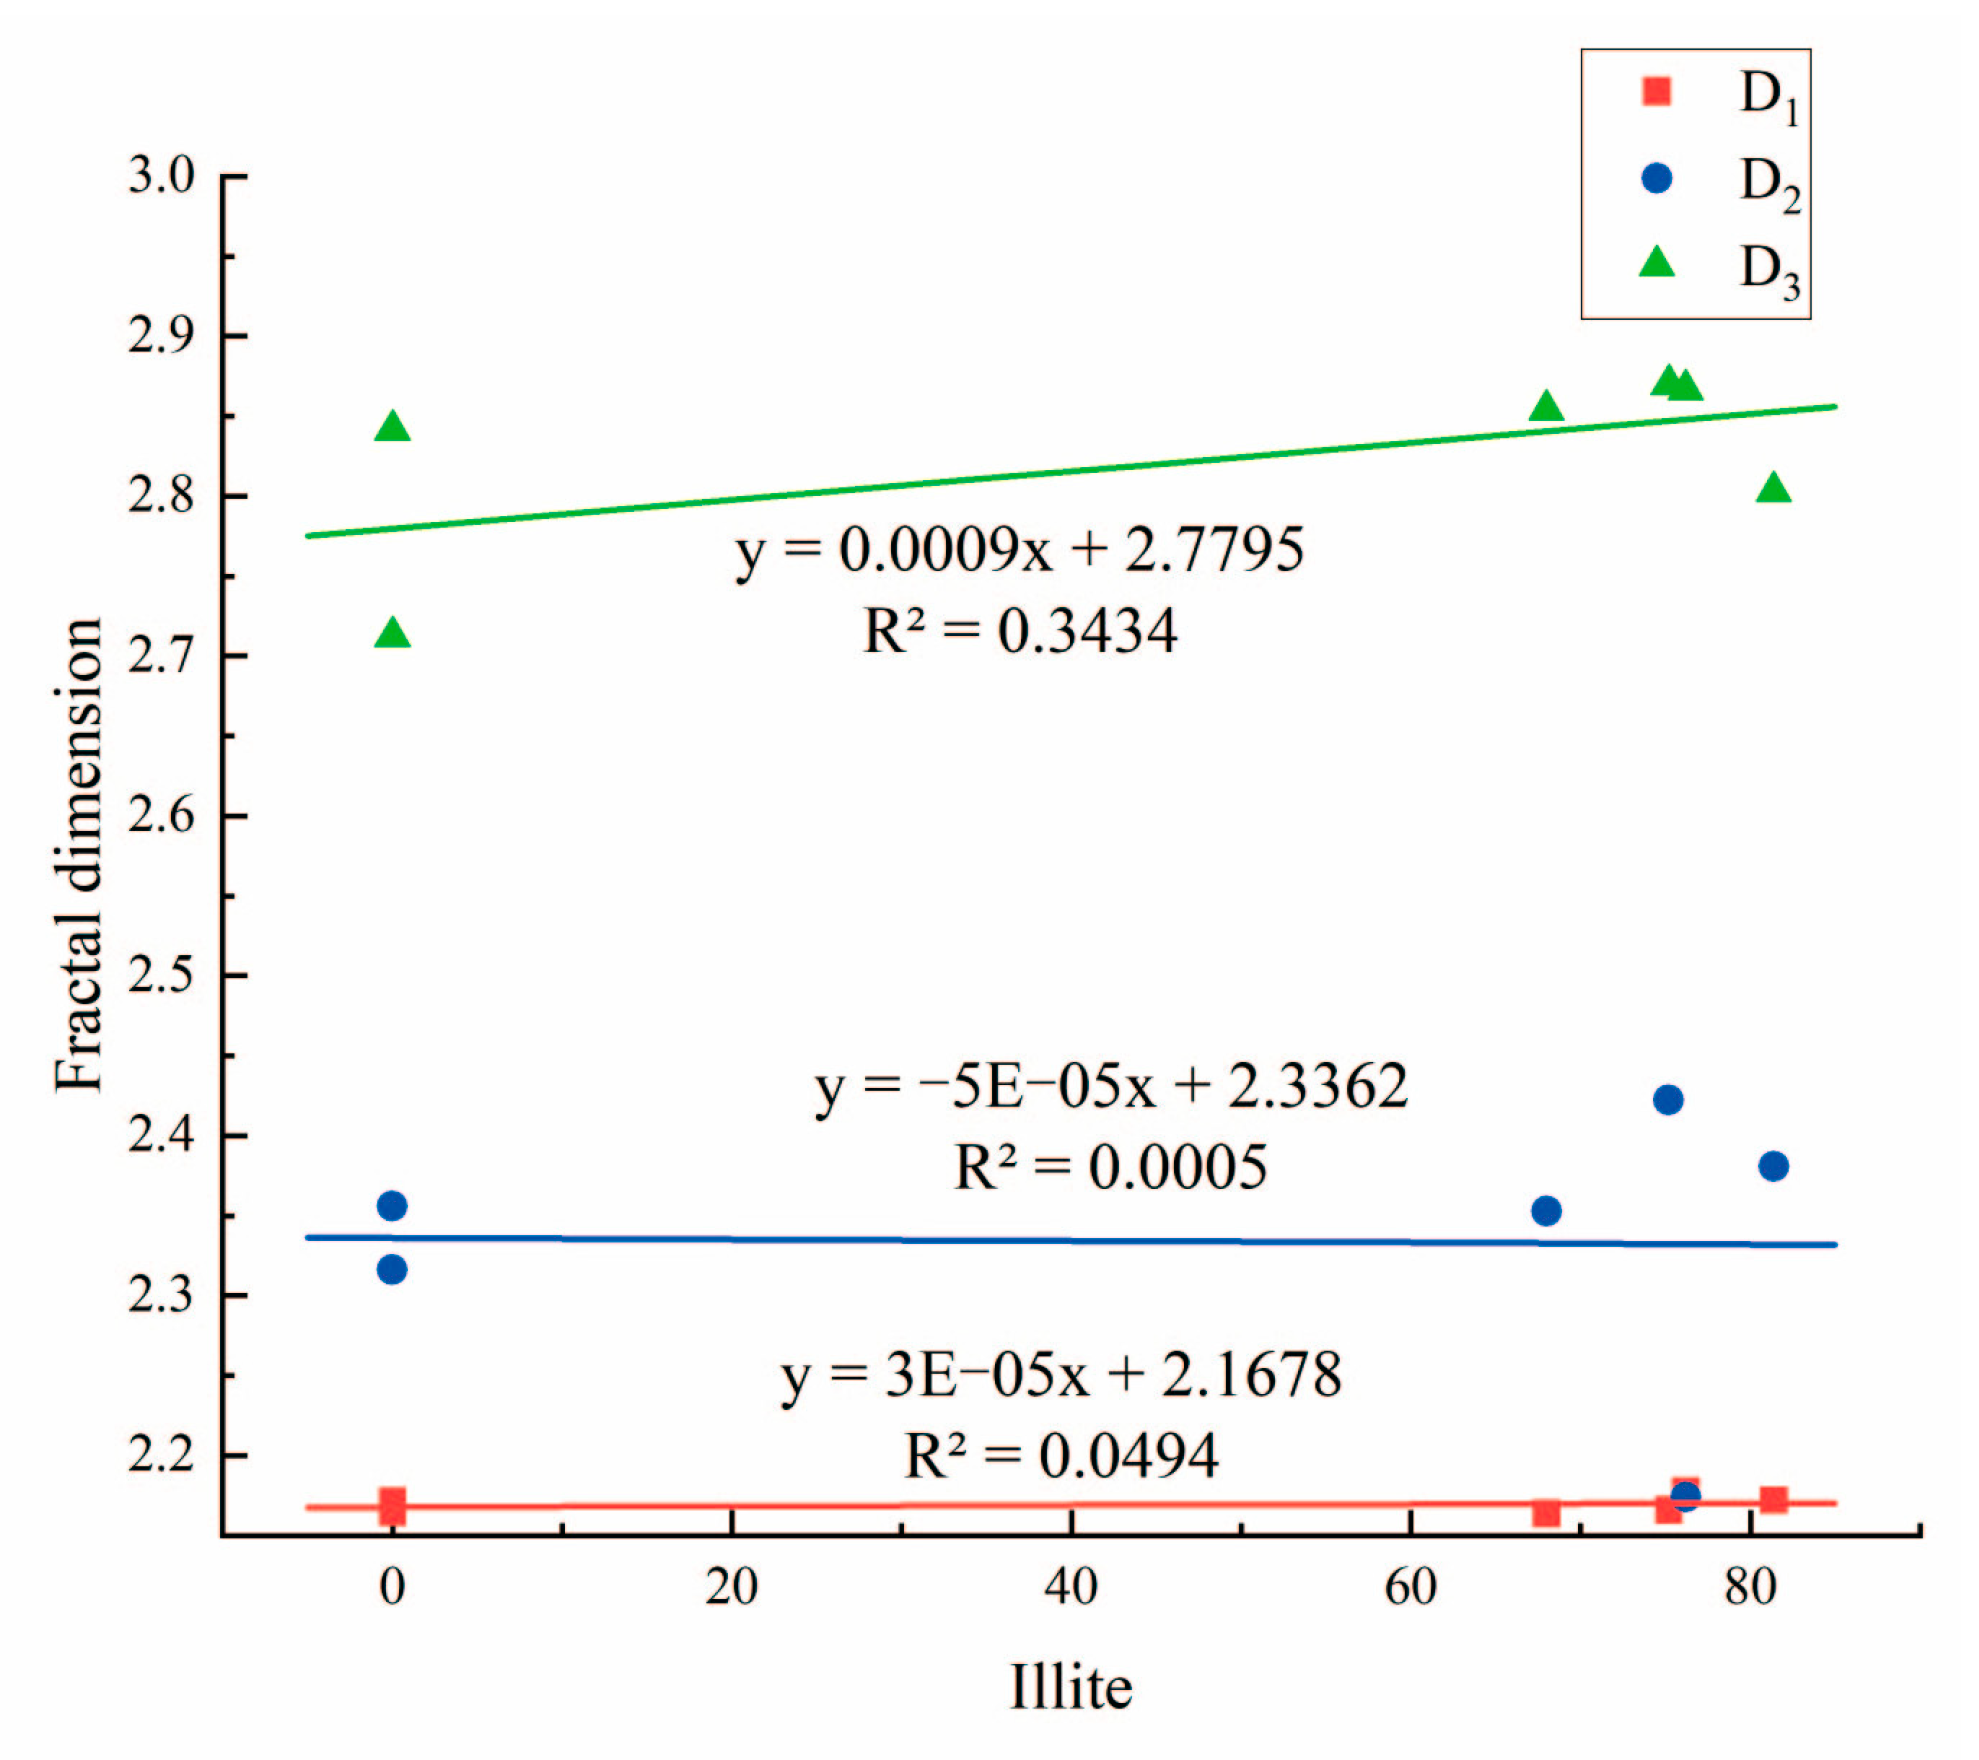
Figure 15.
Correlation between the fractal dimension and kaolinite.

Table 1.
TOC content and mineral fractions of shales.
| Sample Number | TOC (%) | Quartz (%) | Limonite (%) | Carbonate Mineral (%) | Pyrite (%) | Titanium Oxide (%) | Clay Mineral(%) | |||
|---|---|---|---|---|---|---|---|---|---|---|
| Illite (%) | Chlorite (%) | Muscovite (%) | Kaolin (%) | |||||||
| 18-2 | 3.06 | 24.8 | 0 | 1 | 3 | 0 | 0 | 0 | 87.5 | 12.5 |
| 20-2 | 1.79 | 19 | 1 | 0 | 0 | 1 | 76.2 | 0 | 0 | 23.8 |
| 23-6 | 0.26 | 18 | 0 | 1 | 0 | 2 | 81.4 | 0 | 0 | 18.6 |
| 23-9 | 3.62 | 17.8 | 2 | 0 | 0 | 2 | 75.2 | 2 | 0 | 22.8 |
| 27-8 | 5.01 | 24 | 0 | 1 | 5 | 0 | 0 | 5 | 75 | 20 |
| 28-7 | 3.18 | 27.3 | 1 | 1 | 0 | 1 | 68 | 3 | 0 | 29 |
Table 2.
Sample pore volumes.
| Sample Number | Micropore Pore Volume (mL/g) | Mesopore Pore Volume (mL/g) | Macropore Pore Volume (mL/g) | Total Pore Volume (mL/g) | Percentage of Micropore (%) | Percentage of Mesopore (%) | Percentage of Macropore (%) |
|---|---|---|---|---|---|---|---|
| 18-2 | 0.0018 | 0.0078 | 0.0008 | 0.0103 | 17.26 | 75.27 | 7.47 |
| 20-2 | 0.0016 | 0.0087 | 0.0013 | 0.0116 | 13.98 | 74.68 | 11.34 |
| 23-6 | 0.0007 | 0.0023 | 0.0012 | 0.0041 | 17.32 | 54.72 | 27.97 |
| 23-9 | 0.0033 | 0.0072 | 0.0011 | 0.0116 | 28.65 | 61.73 | 9.63 |
| 27-8 | 0.0015 | 0.0081 | 0.0012 | 0.0108 | 13.94 | 74.79 | 11.27 |
| 28-7 | 0.0026 | 0.0084 | 0.0014 | 0.0125 | 20.61 | 67.59 | 11.80 |
Table 3.
Specific surface area.
| Sample Number | Specific Surface Area of Micropore (m2/g) | Specific Surface Area of Mesopore (m2/g) | Specific Surface Area of Macropore (m2/g) | Total Specific Surface Area (m2/g) |
|---|---|---|---|---|
| 18-2 | 4.0899 | 4.1819 | 0.0145 | 8.2863 |
| 20-2 | 3.6814 | 4.2576 | 0.0321 | 7.9711 |
| 23-6 | 1.5962 | 1.4804 | 0.0159 | 3.0925 |
| 23-9 | 7.5328 | 5.0269 | 0.0246 | 12.5842 |
| 27-8 | 3.4014 | 4.7218 | 0.0273 | 8.1505 |
| 28-7 | 5.7599 | 5.0317 | 0.0337 | 10.8253 |
Table 4.
Calculation results of the microporous fractal dimension.
| Sample Number | Fitting Formula | R2 | D1 |
|---|---|---|---|
| 18-2 | y = 1.3859x − 8.3354 | 0.9972 | 2.1647 |
| 20-2 | y = 1.3776x − 8.2721 | 0.9973 | 2.1777 |
| 23-6 | y = 1.3812x − 7.9456 | 0.9969 | 2.1720 |
| 23-9 | y = 1.385x − 8.5542 | 0.9973 | 2.1661 |
| 27-8 | y = 1.3814x − 8.2416 | 0.9972 | 2.1717 |
| 28-7 | y = 1.3865x − 8.4466 | 0.9971 | 2.1637 |
Table 5.
Calculation results of the mesoporous fractal dimension.
| Sample Number | Fitting Formula | R2 | D2 |
|---|---|---|---|
| 18-2 | y = −0.6439x − 8.7474 | 0.9605 | 2.3561 |
| 20-2 | y = −0.826x − 8.8045 | 0.9299 | 2.174 |
| 23-6 | y = −0.6193x − 9.8552 | 0.9301 | 2.3807 |
| 23-9 | y = −0.5776x − 8.5328 | 0.9139 | 2.4224 |
| 27-8 | y = −0.6837x − 8.7077 | 0.9738 | 2.3163 |
| 28-7 | y = −0.647x − 8.5755 | 0.9083 | 2.353 |
Table 6.
Calculation results of the macroporous fractal dimension.
| Sample Number | Fitting Formula | R2 | D3 |
|---|---|---|---|
| 18-2 | y = −1.2875x − 8.5645 | 0.9734 | 2.7125 |
| 20-2 | y = −1.1334x − 8.2754 | 0.9591 | 2.8666 |
| 23-6 | y = −1.1969x − 8.1913 | 0.9883 | 2.8031 |
| 23-9 | y = −1.1301x − 8.3727 | 0.9608 | 2.8699 |
| 27-8 | y = −1.1587x − 8.325 | 0.9601 | 2.8413 |
| 28-7 | y = −1.1461x − 8.1691 | 0.9559 | 2.8539 |
Disclaimer/Publisher’s Note: The statements, opinions and data contained in all publications are solely those of the individual author(s) and contributor(s) and not of MDPI and/or the editor(s). MDPI and/or the editor(s) disclaim responsibility for any injury to people or property resulting from any ideas, methods, instructions or products referred to in the content. |
© 2023 by the authors. Licensee MDPI, Basel, Switzerland. This article is an open access article distributed under the terms and conditions of the Creative Commons Attribution (CC BY) license (https://creativecommons.org/licenses/by/4.0/).
Share and Cite
MDPI and ACS Style
Liu, S.; Xue, H.; Zhao, M. Pore Structure and Fractal Characteristics of Coal Measure Shale in the Wuxiang Block in the Qinshui Basin. Processes 2023, 11, 3362. https://doi.org/10.3390/pr11123362
AMA Style
Liu S, Xue H, Zhao M. Pore Structure and Fractal Characteristics of Coal Measure Shale in the Wuxiang Block in the Qinshui Basin. Processes. 2023; 11(12):3362. https://doi.org/10.3390/pr11123362
Chicago/Turabian StyleLiu, Shunxi, Hongjiao Xue, and Mengyu Zhao. 2023. "Pore Structure and Fractal Characteristics of Coal Measure Shale in the Wuxiang Block in the Qinshui Basin" Processes 11, no. 12: 3362. https://doi.org/10.3390/pr11123362
Note that from the first issue of 2016, this journal uses article numbers instead of page numbers. See further details here.