Article

Seepage Simulation of Conglomerate Reservoir Based on Digital Core: A Case Study of the Baikouquan Formation in Mahu Sag, Junggar Basin

1
Research Institute of Exploration and Development, Xinjiang Oilfield Company, China National Petroleum Corporation, Karamay 834000, China
2
Faculty of Petroleum, China University of Petroleum (Beijing) at Karamay, Karamay 834000, China
3
University of Chinese Academy of Sciences, Beijing 100049, China
*
Author to whom correspondence should be addressed.
Processes 2023, 11(11), 3185; https://doi.org/10.3390/pr11113185
Submission received: 11 October 2023 / Revised: 31 October 2023 / Accepted: 5 November 2023 / Published: 8 November 2023

Abstract

:
Pore structure and flow characteristics are key factors affecting oil recovery rates in heterogeneous tight conglomerate reservoirs. Using micron computed tomography (CT) and modular automated processing system (MAPS) techniques, the pore structure of downhole core samples taken from Mahu’s tight conglomerate reservoirs was analyzed in detail, and a two-scale digital core pore network model with both a wide field of view and high resolution was constructed based on these pore structure data; the digital pore model was corrected according to the mercury intrusion pore size distribution date. Finally, we simulated flow characteristics within the digital model and compared the calculated permeability with the indoor permeability test date to verify the dependability of the pore network. The results indicated that the pore–throat of the conglomerate reservoir in Mahu was widely distributed and exhibited significant bimodal characteristics, with main throat channels ranging from 0.5 to 4 μm. The pore structure showed pronounced microscopic heterogeneity and intricate modalities, mainly consisting of dissolved pores, intergranular pores, and microfractures. These pores were primarily strip-like, isolated, and played a more crucial role in enhancing pore connectivity rather than contributing to the overall porosity. The matrix pores depicted by the MAPS were relatively smaller in size and more abundant in number, with no individual pore type forming a functional seepage channel. The permeability parameters obtained from the two-scale coarse-fine coupled pore network aligned with the laboratory experimental results, displaying an average coordination number of two. Flow simulation results indicated that the core’s microscopic pore structure affected the shape of the displacement leading edge, resulting in a tongue-in phenomenon during oil–water flow. The dominant flow channel was mainly dominated by water, while tongue-in and by-pass flow were the primary microscopic seepage mechanisms hindering oil recovery. These findings lay a foundation for characterizing and analyzing pore structure as well as investigating flow mechanisms in conglomerate reservoirs.

1. Introduction

The effective development of tight conglomerate reservoirs has always been a global challenge as the sedimentary environment characteristics, variations in formation fluid, provenance considerations, and post-burial diagenesis collectively influence the physical properties of the reservoir [1,2]. Consequently, understanding the pore structure of such a reservoir impacted by multiple factors remains challenging. Numerous studies have shown that the pore structure characteristics and the occurrence mechanism and seepage characteristics of oil and gas are the key factors affecting the efficient development of tight oil [3,4,5,6]. According to the latest exploration progress in the Xinjiang oil fields, the Jungger Basin has rich tight oil resources, and tight oil has become the most realistic replacement field for increasing reserves and production in this region, among which Mahu oil field reserves exceed 1 billion tons [7]. The main production layers of the Mahu oilfield are characterized by ultra-low porosity and ultra-low permeability tight conglomerate with poor sorting, strong heterogeneity, and large particle size differences, resulting in a complex modal structure as well as an extremely intricate pore structure and seepage characteristics [8]. Given the current depressed crude oil prices and the vast reserves of crude oil in Mahu, conducting detailed research on the pore structure and flow characteristics is crucial for enhancing the development efficiency in this region.
In recent years, the characterization of the microscopic pore structure of reservoirs has been approached by scholars using various methodologies. In general, these methods can be categorized into two groups: (1) Direct image observation techniques, such as cast thin sections and scanning electron microscopy (SEM), are employed to qualitatively describe and semi-quantitatively observe the micropore structure of rock samples. (2) Experimental indirect measurement methods, including the mercury injection method and low-pressure gas (N2 or CO2) adsorption method, are utilized to obtain characteristic parameters of the sample pore structure. In terms of seepage characteristics, conventional core displacement experiments are the most widely employed method for determining macroscopic parameters and characterizing the seepage process. This approach employs intuitive and well-established technology; however, it falls short in achieving nondestructive measurement of a core sample. Moreover, the obtained pore structure information is limited to two-dimensional (2-D), rather than the desired three-dimensional (3-D) depiction, of reservoir pores. Consequently, these limitations hinder a comprehensive and insightful understanding of internal flow dynamics and microscopic percolation patterns within the cores. Currently, with the continuous advancement of micro/nano CT technology, the digital core simulation technique based on X-ray attenuation image reconstruction enables quantitative analysis of 3D pore characteristics and development of 3D digital core models for seepage simulation, thereby facilitating the elucidation of underlying physical mechanisms governing seepage. Research has been conducted to reconstruct the 3D pore models of carbonate rock, coals, sandstone, or shale to investigate the corresponding seepage characteristics of water or hydrocarbons within [9,10,11,12,13,14], as well as to investigate the particle movement or settlement in the pore network [15,16], and, lastly, the phase permeability characteristics can also be investigated by pore scale flow simulation [17,18]. Some researchers have even simulated three-phase flow characteristics under different wettability conditions within the digital cores [19,20]. These results demonstrate that micro-CT is an effective method for characterizing the 3-D pore structure and hydrocarbon flow characteristics of different types of rocks, providing a new approach to determining the complex pore structure of a tight conglomerate reservoir.
However, previous research has demonstrated that the pore network reconstruction method can significantly impact the reconstruction process, resulting in an excessively idealized or stochastic pore model. The limited and less representative area of super high-resolution scanning imaging makes it challenging to accurately depict the core’s pore structure and fluid seepage flow at a micro-scale, and there remains a need to address the issue of integrating pore information across different scales. Additionally, prior studies have predominantly focused on sandstone coal or carbonate rocks, with most investigations centered around constructing micron-scale pore network models that are restricted to specific apertures within a portion of the overall pore structure. The pore structure of tight conglomerate is quite different from that of shale, sandstone, or coal. The tight conglomerate is composed of large-sized gravel sediments and the interstitial material, and the pores inside the interstitial material are the main flow channel. The grain size in the interstitial material also varies greatly [21,22]. Therefore, the representative volume size of the tight conglomerate in pore modeling usually needs to be larger than that of tight sandstone or shale, and the range of corresponding pore sizes is also relatively wider. However, the current CT technology still cannot overcome the contradiction between sample size and resolution. If you need to obtain submicron pore details, your sample size will be limited to around 1–3 mm, and the corresponding field of view (FOV) will be limited to tens of microns. Additionally, if your sample is around 1 cm, the pore resolution you receive will drop down to a few microns, and both defects will lead to the loss of pore information [23]. For tight conglomerate, we need millimeter-level FOV as well as nanoscale pore details; therefore, further research for tight conglomerate pore modeling is warranted.
To address the aforementioned limitations, this study presents a dual-scale pore network model of conglomerate samples by integrating the structural characteristics of micron 3D pores obtained through micron CT with the reconstruction of nano-submicron pore structures acquired via MAPS. The actual distribution of pore throat scales in conglomerate samples was determined using mercury injection to validate the digital pore network. Utilizing this model, we conducted oil–water two-phase seepage simulations and calculated the permeability. This study provides a new idea for the pore modeling of tight conglomerates, and we hope that the findings provide valuable data support and serve as a reference for describing pore structures and analyzing percolation characteristics in tight conglomerate reservoirs.

2. Samples and Methods

The samples were collected from a tight conglomerate reservoir in the Mahu depression, with a burial depth of 3898.2 m. The basic parameters of the samples are presented in Table 1, and the porosity was obtained by a helium porosimeter (UltraPore-300), while the apparent permeability [24,25] was obtained by a pulse decay permeameter (YRD-II). As shown in Table 1, these samples are typically low-porosity and low-permeability conglomerates, and samples for CT scanning and MAPS analysis were extracted from them.
Core images were acquired using a Zeiss Xradia 510 Versa CT. The plunger sample was subjected to a coarse scan at a spatial resolution of 13 μm/pixel. Subsequently, a small plunger sample measuring 2 mm in diameter and approximately 5 mm in length was extracted from the original sample and subjected to a fine scan with a resolution of 2.3 μm/pixel. The Pergeos 2020.2 was employed to establish the 3D digital core, enabling analysis of parameters such as pore throat scale, distribution, and connectivity. Simultaneously, the maximum sphere algorithm was utilized to extract the coarse-scale pore network model.
A Zeiss CrossBeam550 was used to conduct MAPS. The spatial resolution ranges from 2 to 800 nm. The principle underlying MAPS is to collect SEM images in batches (following a specific order) and capturing them at high resolution. These small-view but high-resolution images are then stitched together using Atlas 5.3 software, resulting in a single image with both high resolution and a wide viewing range. The mercury intrusion pore size distribution data was collected from an AutoPore V mercury porosimeter manufactured by Micromeritics.

3. Results and Discussion

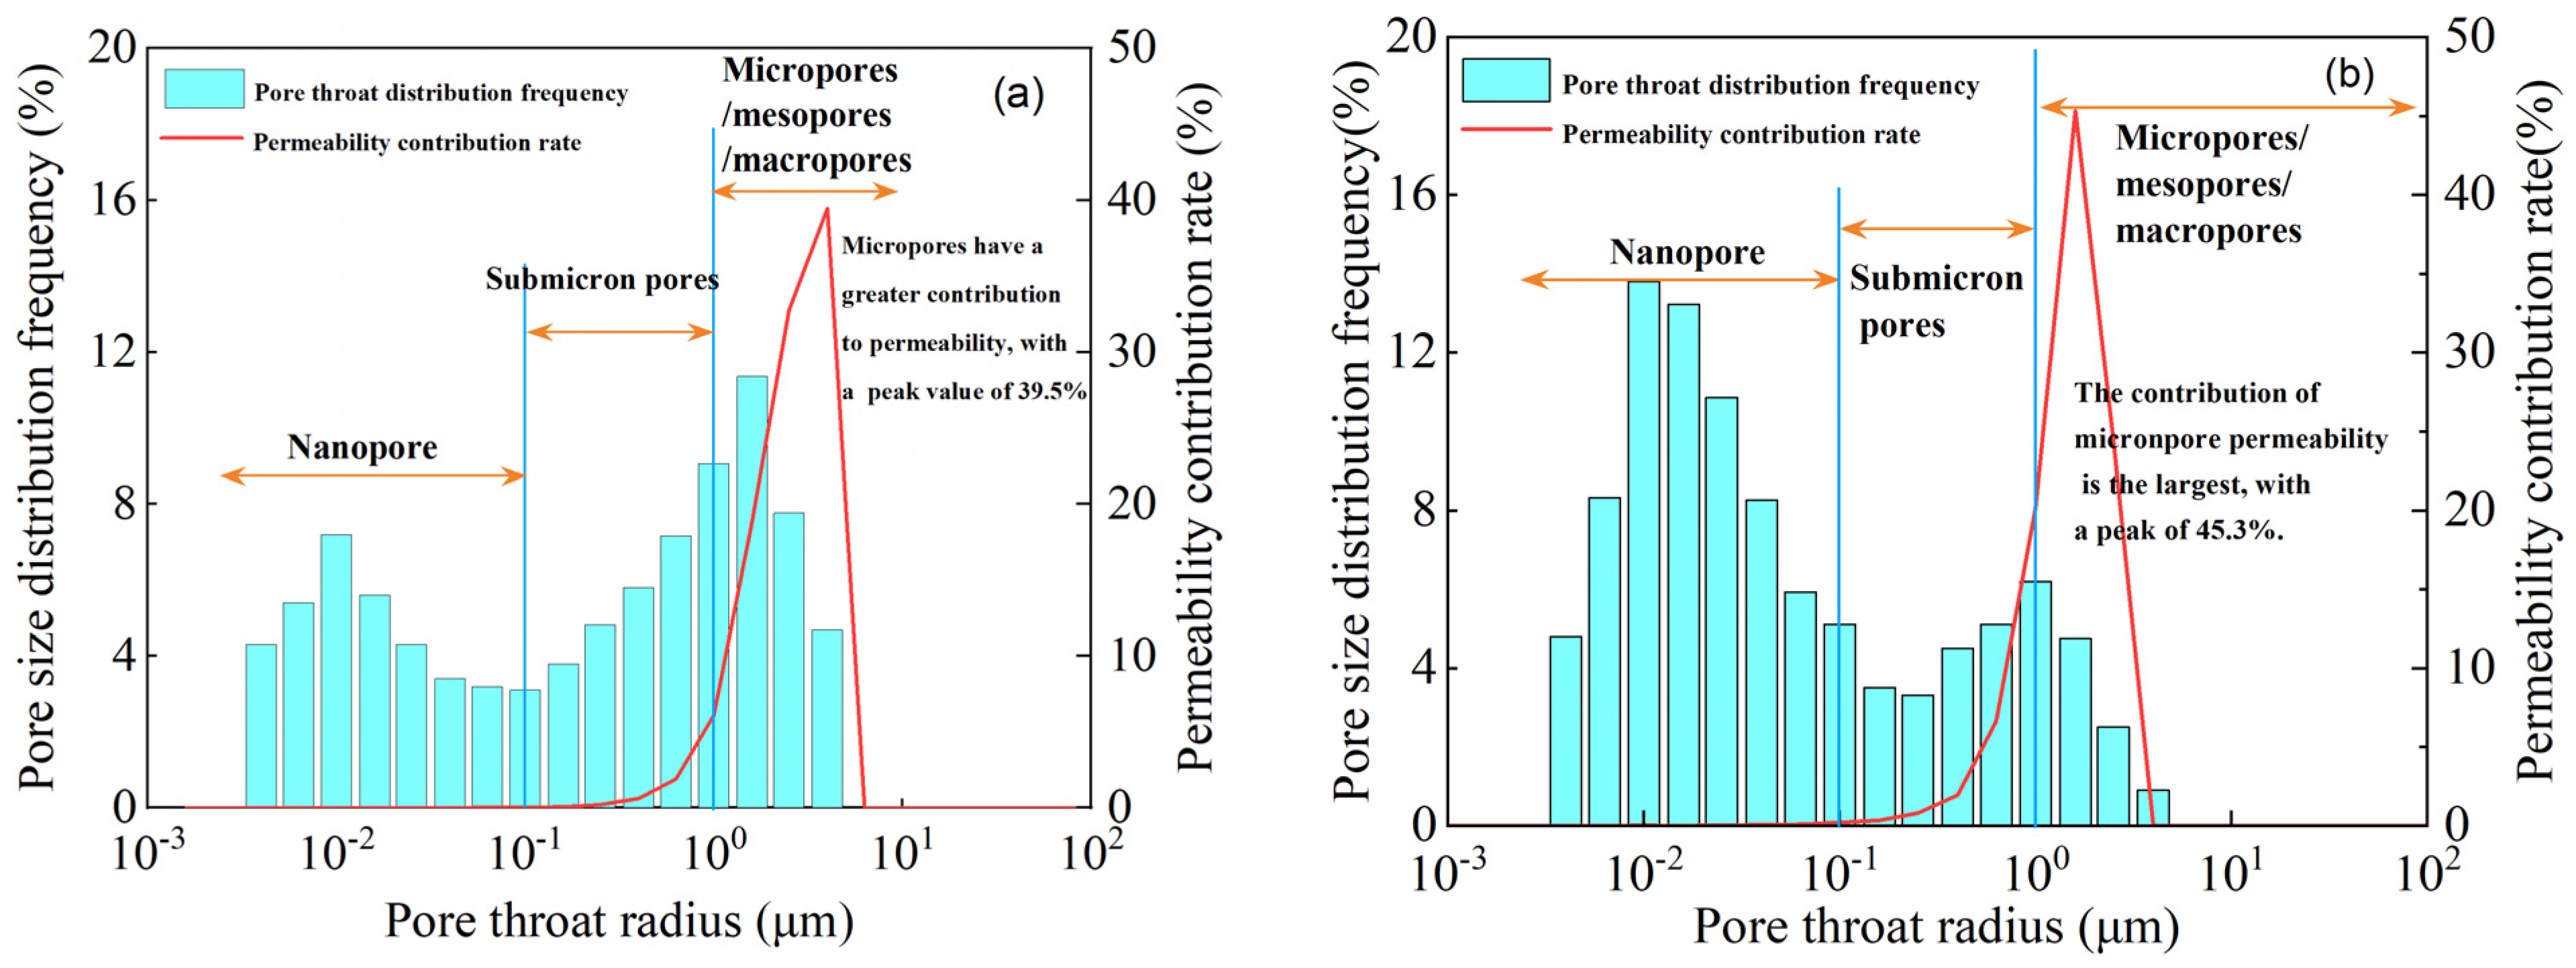
3.1. Pore Structure Characteristics

The experimental results of high-pressure mercury injection for the two selected samples (Figure 1a,b) indicate that the pores and throats have small sizes and poor sorting, resulting in low efficiency in mercury removal. These findings suggest a significant difference in pore and throat dimensions, and pronounced heterogeneity within the pore–throat network. The samples exhibit widely distributed pore and throat scales with a bimodal feature: large-scale pores and throats range from submicron to micron, while small-scale pores and throats range from nanometer to submicron units. The large pores (1–4 μm) in sample M746-3 were more developed, and the main channels were larger than 0.1 μm, while, in sample M746-4, more than 80% of the total pore throats were less than 0.1 μm in size, and pores within 0.5–4 μm contribute most to the permeability in both samples. The limited width of these pore throats is a key factor contributing to the low permeability observed in this reservoir, and the radius of the distribution curve for these pore throats serves as a crucial reference point for subsequent digital core modeling.

3.2. Micron CT Scale Pore Network Model

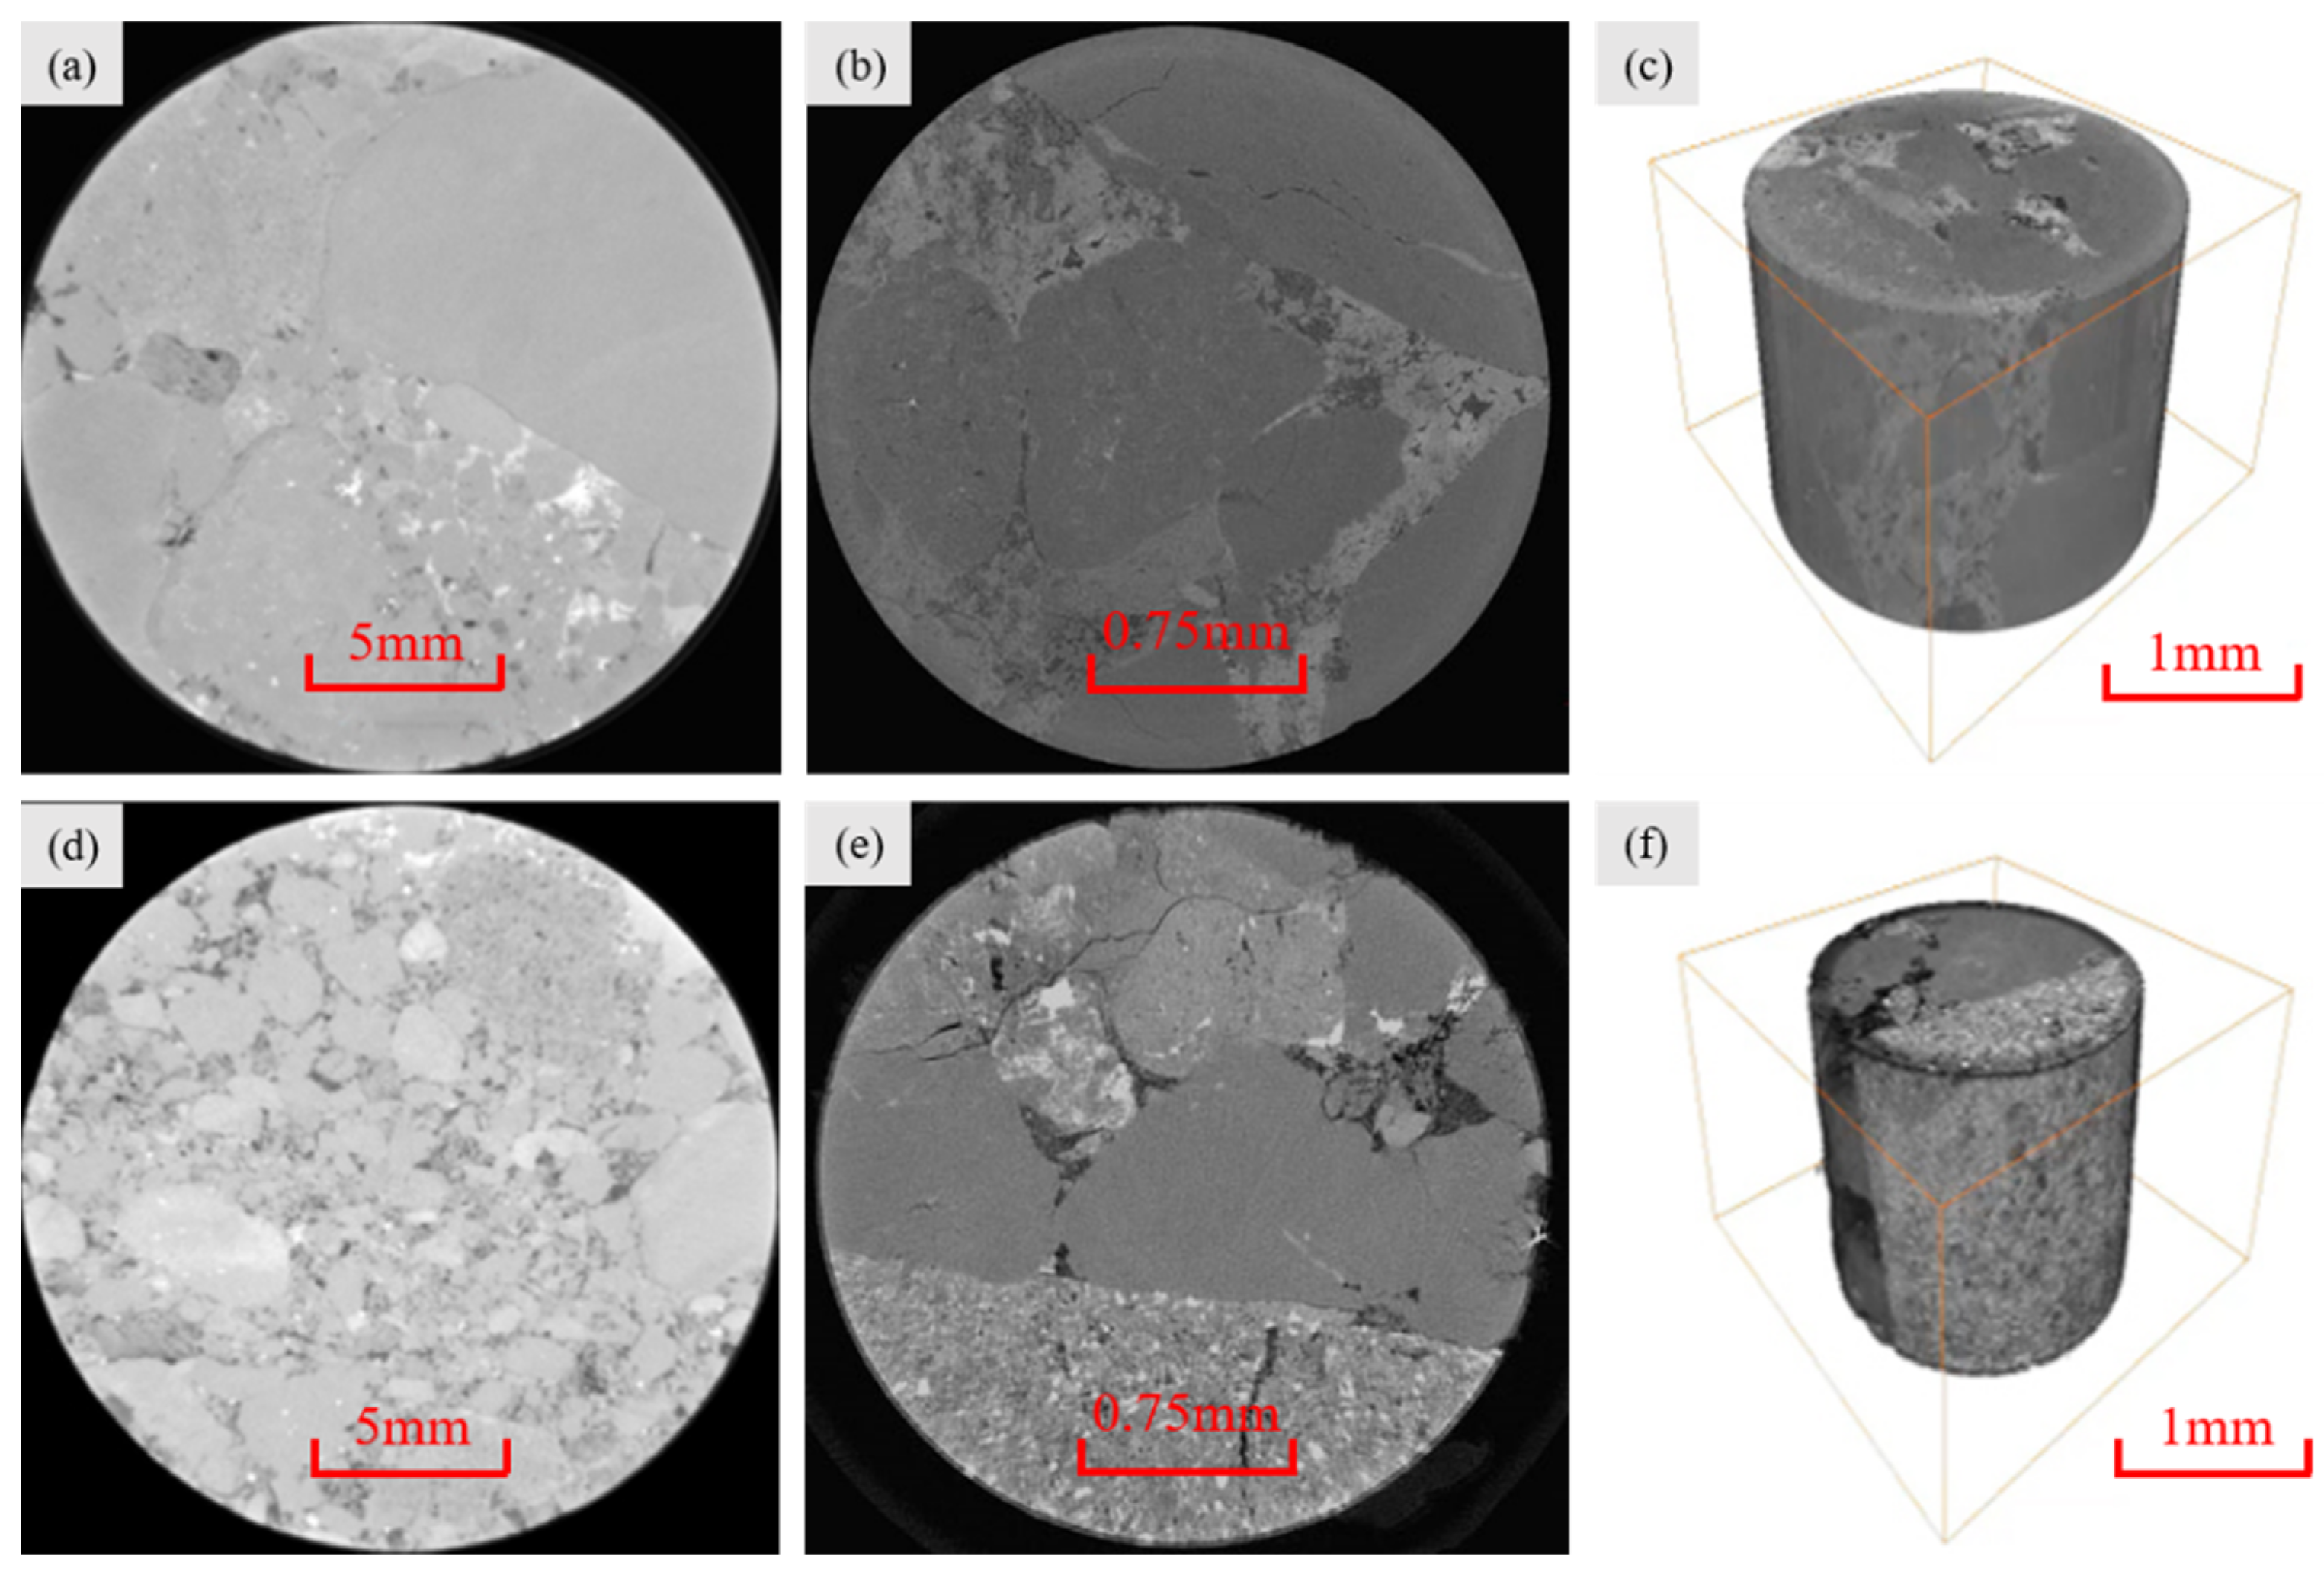
3.2.1. Characteristics of Micron-Scale 2-D Pore Structure

CT images are 16-bit grayscale images with a resolution of 2048 × 2048 pixels, and the voxel gray values are associated with the mineral components. Regions with high gray values correspond to high-density material, representing skeleton components, while regions with low gray values correspond to pores. The section diagrams of the core samples are presented in Figure 2a,d. It is evident from the diagrams that the sample exhibits pronounced heterogeneity. Among these, sample M746-3 displays a significant gravel size and high gravel content, with minimal intergranular pores and intergranular interface fractures, while sample M746-4 demonstrates relative homogeneity, where intergranular pores can be observed; however, most of these pores are filled, and the main type of pores were interstitial micropores. The microporous structures of the two samples exhibit intricate spatial modal characteristics, with significant variations in both size and micropore development across different locations within the samples. By counting the number of pixels corresponding to the pore part and the total number of pixels in the sample bulk area, the porosity of the section was calculated. Sample M746-3 demonstrates a porosity of 0.3%, while sample M746-4 exhibits a higher porosity of 0.9%. These values correspond to 4.5% and 16.1%, respectively, when compared to the helium measured porosity. It should be noted that most pores are indistinguishable under this resolution (13 μm/voxel).
To investigate the microscopic pore structure, further analysis was conducted on a smaller core sample that was 2 mm in diameter and approximately 5 mm in length. The scanning resolution was 2.3 μm/voxel and the resolution was 1024 × 1024 pixels. Figure 2b,c depict sectional diagrams of the smaller sample. Within the M746-3 samples, bright cements are present between grains that run throughout the entire rock skeleton. Conversely, M746-4 has less cement with intergranular pores. It can be seen that the sample contains part of gravel, and the brightness of the gravel is not uniform, indicating that this part of gravel is not composed of a single mineral and might belong to rock debris (Figure 3e,f). The porosities of samples M746-3 and M746-4 were calculated by PerGeo 2020.2 and are 1.6% and 2.2%, respectively. The porosity surpasses the values obtained under the resolution of 13 μm/voxel; however, pores under 2.3 μm remain unidentified at the current resolution.
Based on other scholars’ research on pore types and characteristics in this area [21], as well as the analysis at micron scale CT images, it reveals that the conglomerate in the study area predominantly comprises three types of pores: (1) secondary dissolution pores, characterized by highly irregular edges in grayscale images, exhibiting isolated spots and pits. These solution holes are believed to result primarily from the dissolution of unstable minerals, such as feldspar cleavage cracks or debris, during early diagenesis. Intergranular cement filling these pores subsequently leads to intergranular solution holes through water–rock reactions. (2) Residual intergranular pores, distinguished by clear contact edges between them and gravel in scan images, likely originate from insufficient compaction between particles resulting in unfilled intergranular spaces that have been preserved. (3) Micro-fractures observed as penetrating gravel lines across particles or curved and along gravel edges may be attributed to mechanical compaction. The presence of these features not only contributes to oil and gas reservoir formation but also enhances reservoir permeability.

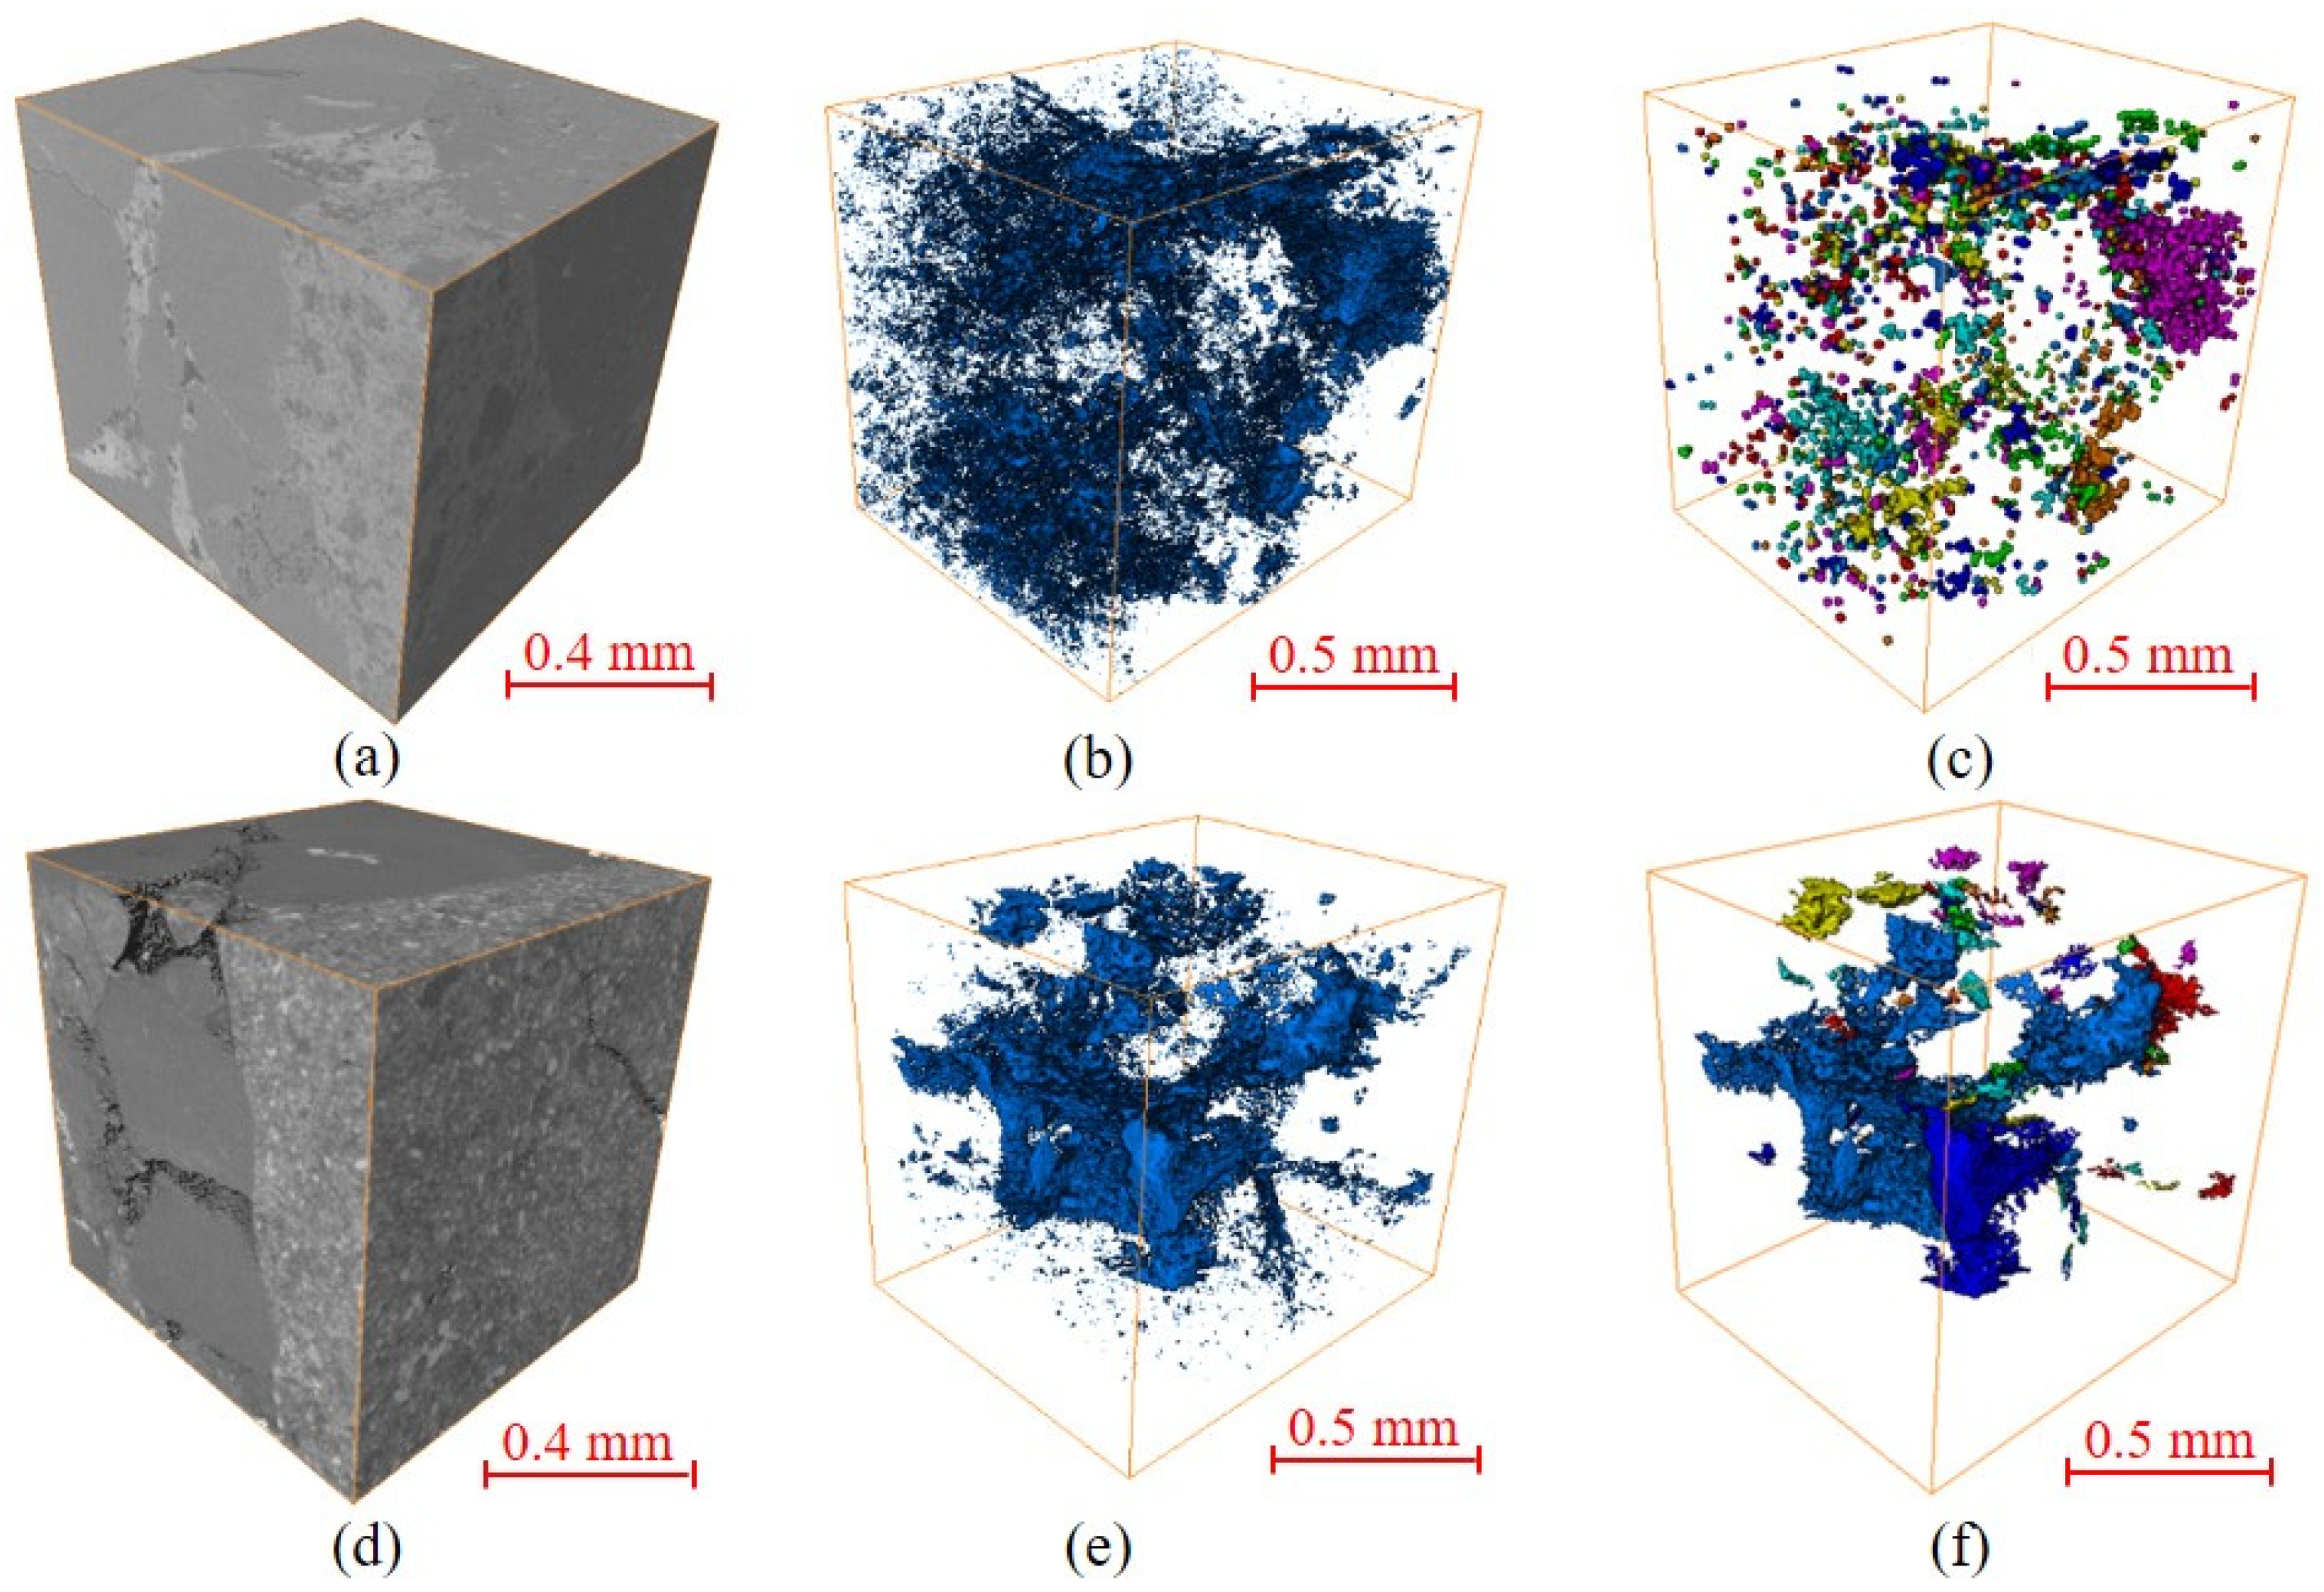
3.2.2. Characteristics of Micron-Scale 3-D Pore Structure

The 2-D grayscale images of the 2 mm sample were sequentially overlaid and merged to generate a 3-D grayscale representation (Figure 3a,d). A segmentation algorithm was employed to binarize the digital core’s three-dimensional gray image (Figure 3b,e). The transparent region represents the rock skeleton, while the blue area corresponds to pore space, enabling clear visualization of pore distribution within the rock skeleton. Pore shapes in the conglomerate sample are irregular with varying pore–throat sizes.
The microscale analysis in Figure 3 reveals that the predominant pore–throat types observed in the sample are isolated pores and strip-linked lamellar pores, with the latter exhibiting superior connectivity. Sample M746-4 exhibits a higher occurrence of continuous banded pores and a lower abundance of isolated pores, primarily attributed to the development of residual intergranular pores (Figure 3a–c). In contrast, sample M746-3 displays fewer lamellar pores and an increased presence of isolated ones, mainly due to the prevalence of dissolution micropores. Furthermore, at the micron scale, these pores exhibit a scattered distribution pattern, with areas featuring higher pore density appearing as strips or flakes. The primary or residual intergranular pores and intergranular corrosion holes are predominantly fragmented spaces that remain largely isolated. This isolation can be attributed to dissolution micropores or feldspar dissolution cavities within the gravel matrix. These findings indicate an uneven distribution of micropores within conglomerate reservoirs and pronounced micro-heterogeneity in samples characterized by low porosity, low permeability, and unfavorable physical properties—a conclusion consistent with mercury injection results.
The image labeling algorithm built in Pergeos was employed to analyze the connectivity of pores. A schematic diagram illustrating the results of pore connectivity is presented in Figure 3c,f. The image tagging algorithm defines the porosity of neighboring voxels and labels them as pore clusters. If the 3-D digital core exhibits consistent tag assignments for pore clusters in both the first and last sections along a particular direction, it indicates interconnection between pores in that direction; otherwise, a high number of isolated pore clusters are observed, indicating an absence of open pores. Based on the labeling results, analysis can be conducted on the connectivity of the pores, and different colors were utilized to distinguish between different pore clusters. The results reveal that samples with numerous isolated pore clusters exhibit a higher proportion of dead pores despite having large-scale porosity. The poor connectivity of micropores leads to low permeability in these samples, resulting in measured permeability values that are lower than expected based solely on their microscale porosity. Consequently, fluid migration channels cannot be formed through these identified pores, thereby preventing simulations involving permeability and other parameters related to seepage.

3.2.3. Pore Network Modeling

To establish a pore network model, it is essential to simplify the pore space by considering regions with a larger size as pore bodies and regions connecting these pore bodies with a smaller size as throats. This division of the pore space into a combination of pore bodies and throats facilitates the extraction of characteristic parameters and enables numerical simulation of conductivity characteristics, thereby enhancing storage efficiency and facilitating multi-scale coupling of pore information [26]. Currently, the most widely used method for constructing such models is the maximum sphere algorithm proposed by Silin, Dong, and Blunt [27]. By employing maximum sphere analysis along with cluster analysis to identify pores and throats, it becomes possible to extract the desired pore network model. The maximum ball algorithm was used to extract the coarse-scale pore network model, and Figure 4 illustrates the results, with balls representing pores and tubes representing throats. From this model, it can be observed that the micro-CT identified pore network exhibits disconnectedness due to tight lithology and strong heterogeneity. Sample M746-4 consists of numerous small-sized pores and throats, resulting in a relatively low measured porosity. Conversely, sample M746-3 contains a significant number of large-sized pores and throats, leading to a comparatively higher measured porosity.

3.3. Fine-Scale Pore Network Model Based on MAPS

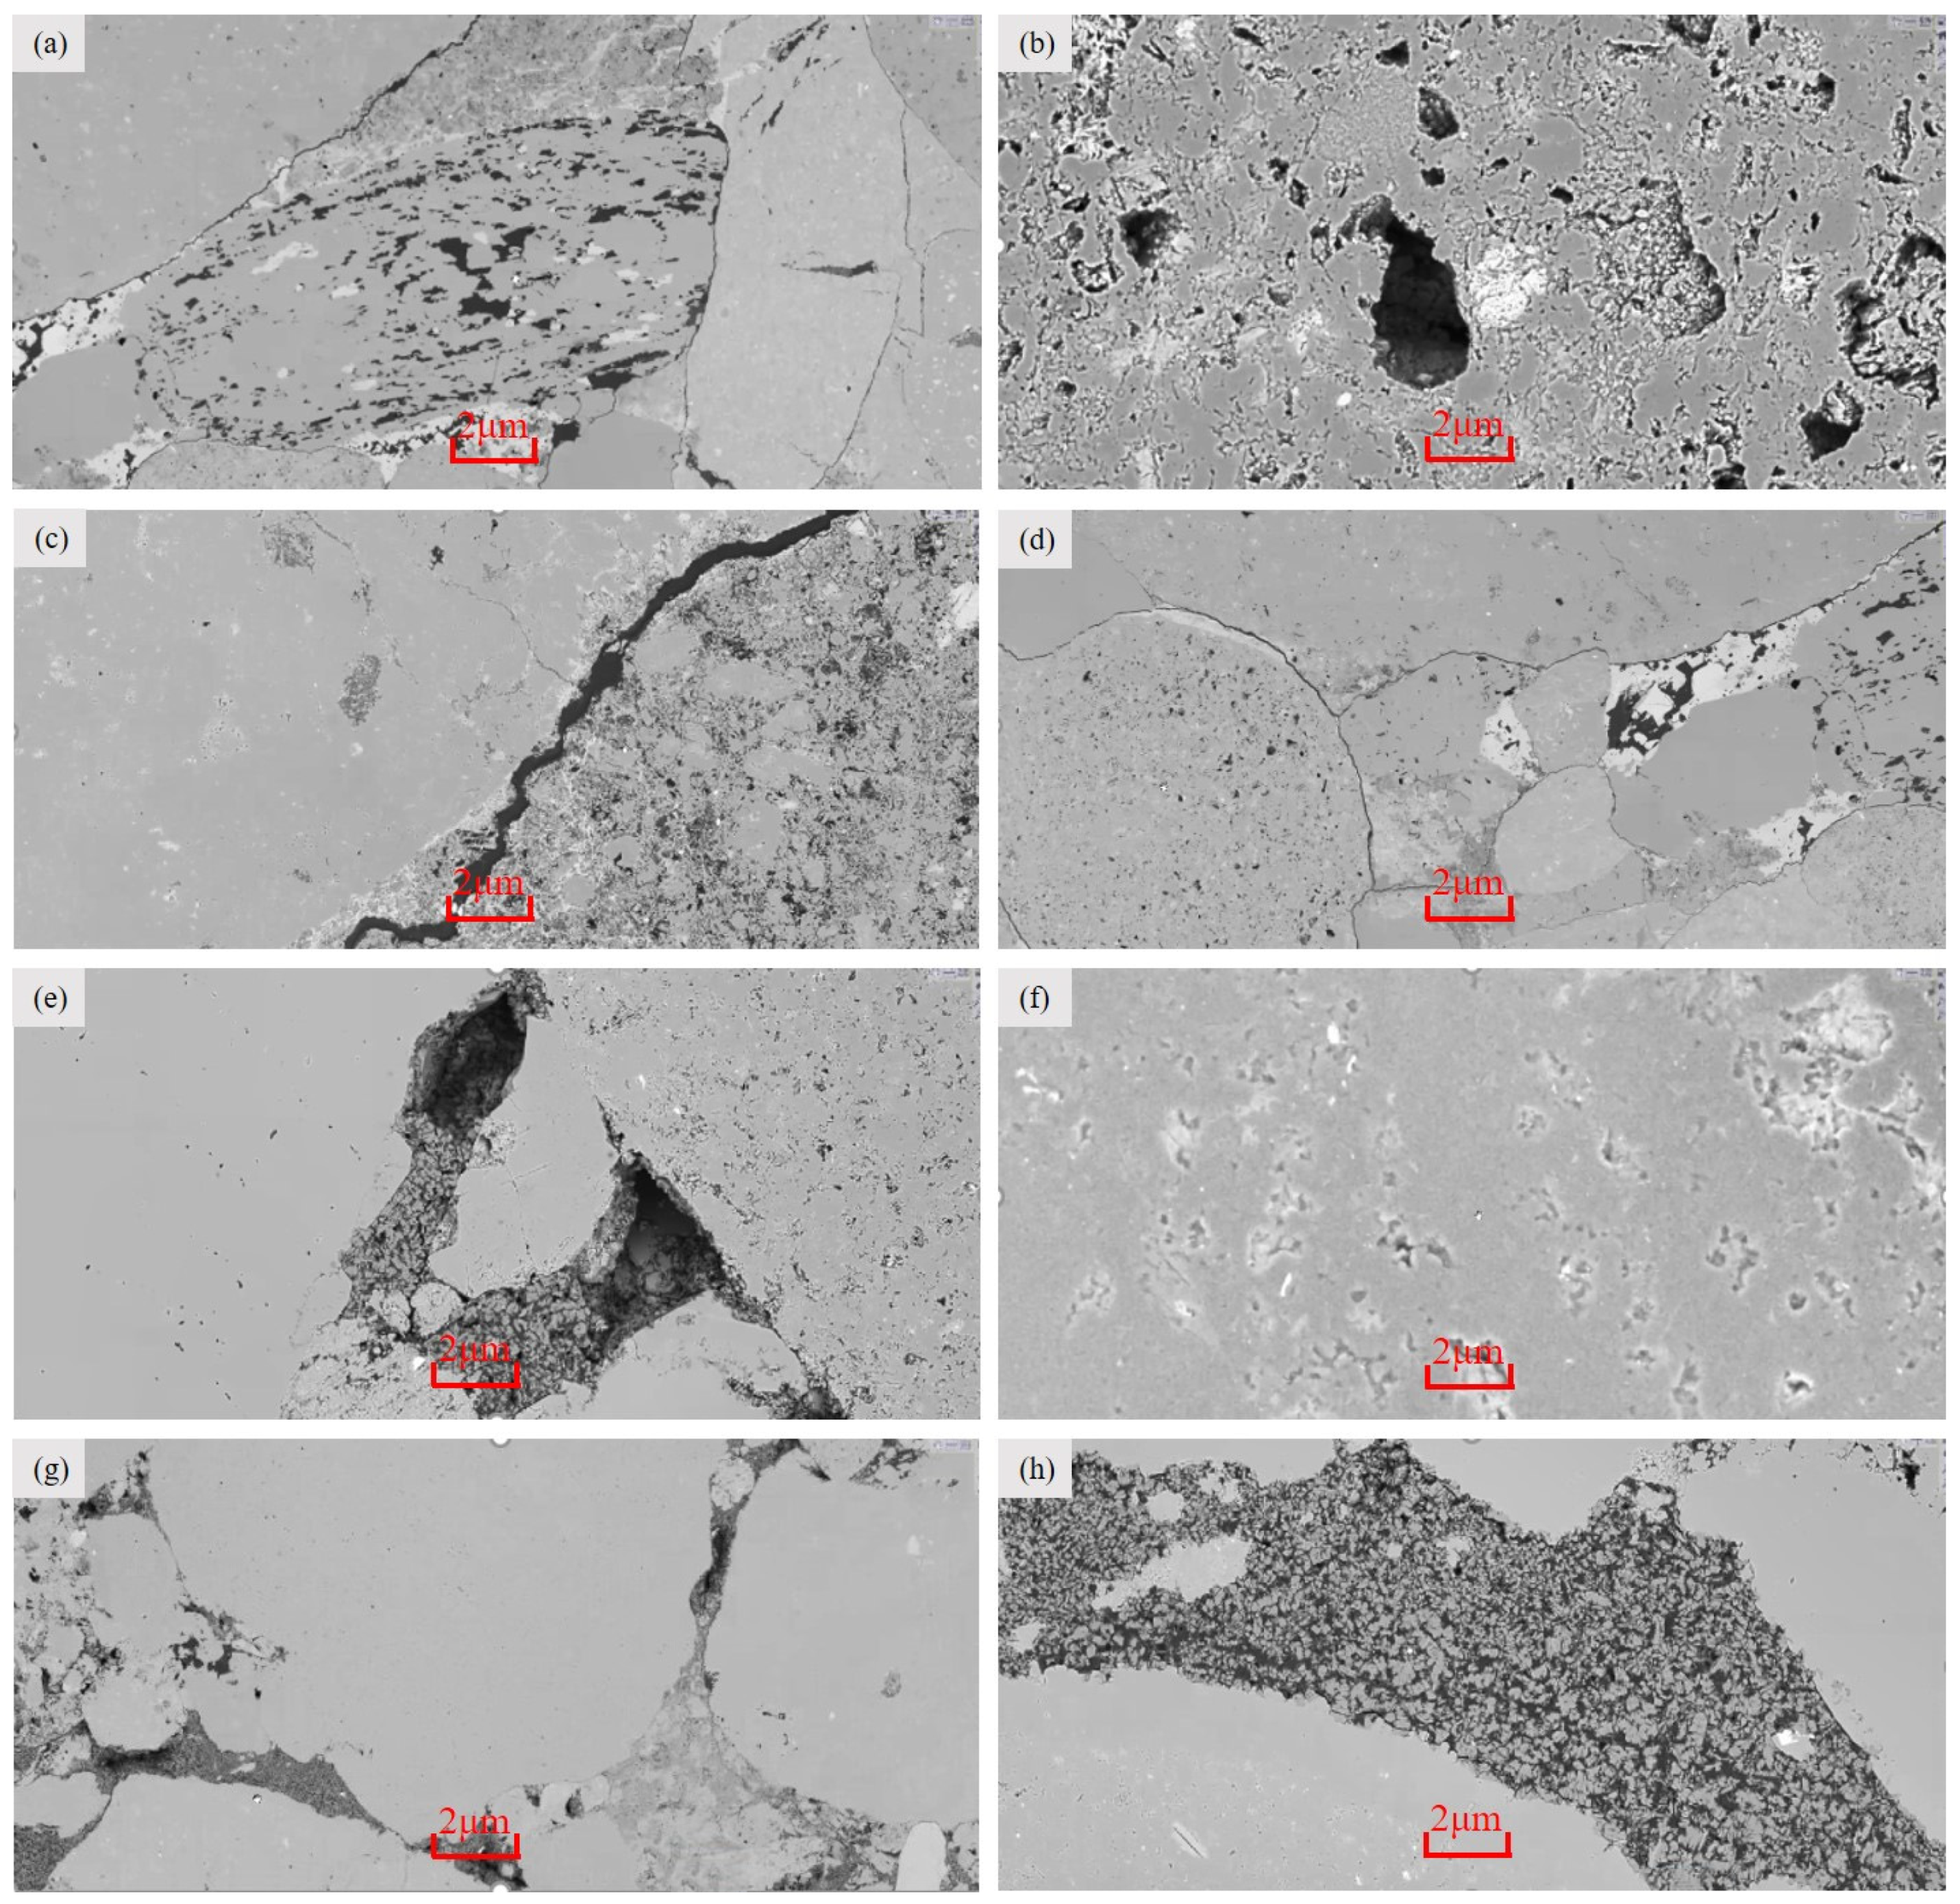
3.3.1. Nano-Submicron Pore Characteristics

The local map of the nano-scale pores in the matrix, as depicted in Figure 5, was acquired by MPAS for subsequent analysis, enabling clear differentiation of the nano-scale pores within the corresponding matrix.
The sample M746-3 exhibits a scarcity of intergranular pores, with predominant pore types being albitite dissolution pores, micropores within the gravel, and intergranular interfacial fractures (Figure 5a–c). The strong compaction of grains has resulted in a minimal proportion of intergranular pores, where macroscopic intergranular pores contribute insignificantly to the flow channel. Considering the mineral composition depicted by energy spectrum analysis, sample M746-3 is rich in calcite (Figure 5d), indicating that the microcracks shown in Figure 6 are elongated cleavage fractures of calcite particles. These microcracks may have formed through shear dislocation or dissolution processes during various geological tectonic events, as suggested by previous studies on calcite characteristics. The presence of such microcracks positively facilitates communication between micron-scale spherical micropores and nano-scale solution pores while serving dual functions as both pores and throats. Conversely, the main pore types observed in sample M746-4 include residual intergranular pores, intragranular pores, and kaolinite interstitial pores (Figure 5e–h). These pores primarily serve as storage spaces and can connect with adjacent nanoscale micropores. However, it should be noted that a single pore type alone cannot independently form a seepage channel due to poor pore connectivity in both samples. Our findings reveal that the tight conglomerate reservoir in the study area exhibits complex multi-scale and multi-type pore structures with significant spatial variations. Additionally, numerous submicron intergranular residual pores and nano-scale dissolution pores were identified. Therefore, when constructing a comprehensive pore network model for conglomerate reservoirs, it is crucial to consider multiple scales to accurately capture the internal pore structure characteristics and microscopic flow behavior of fluids.

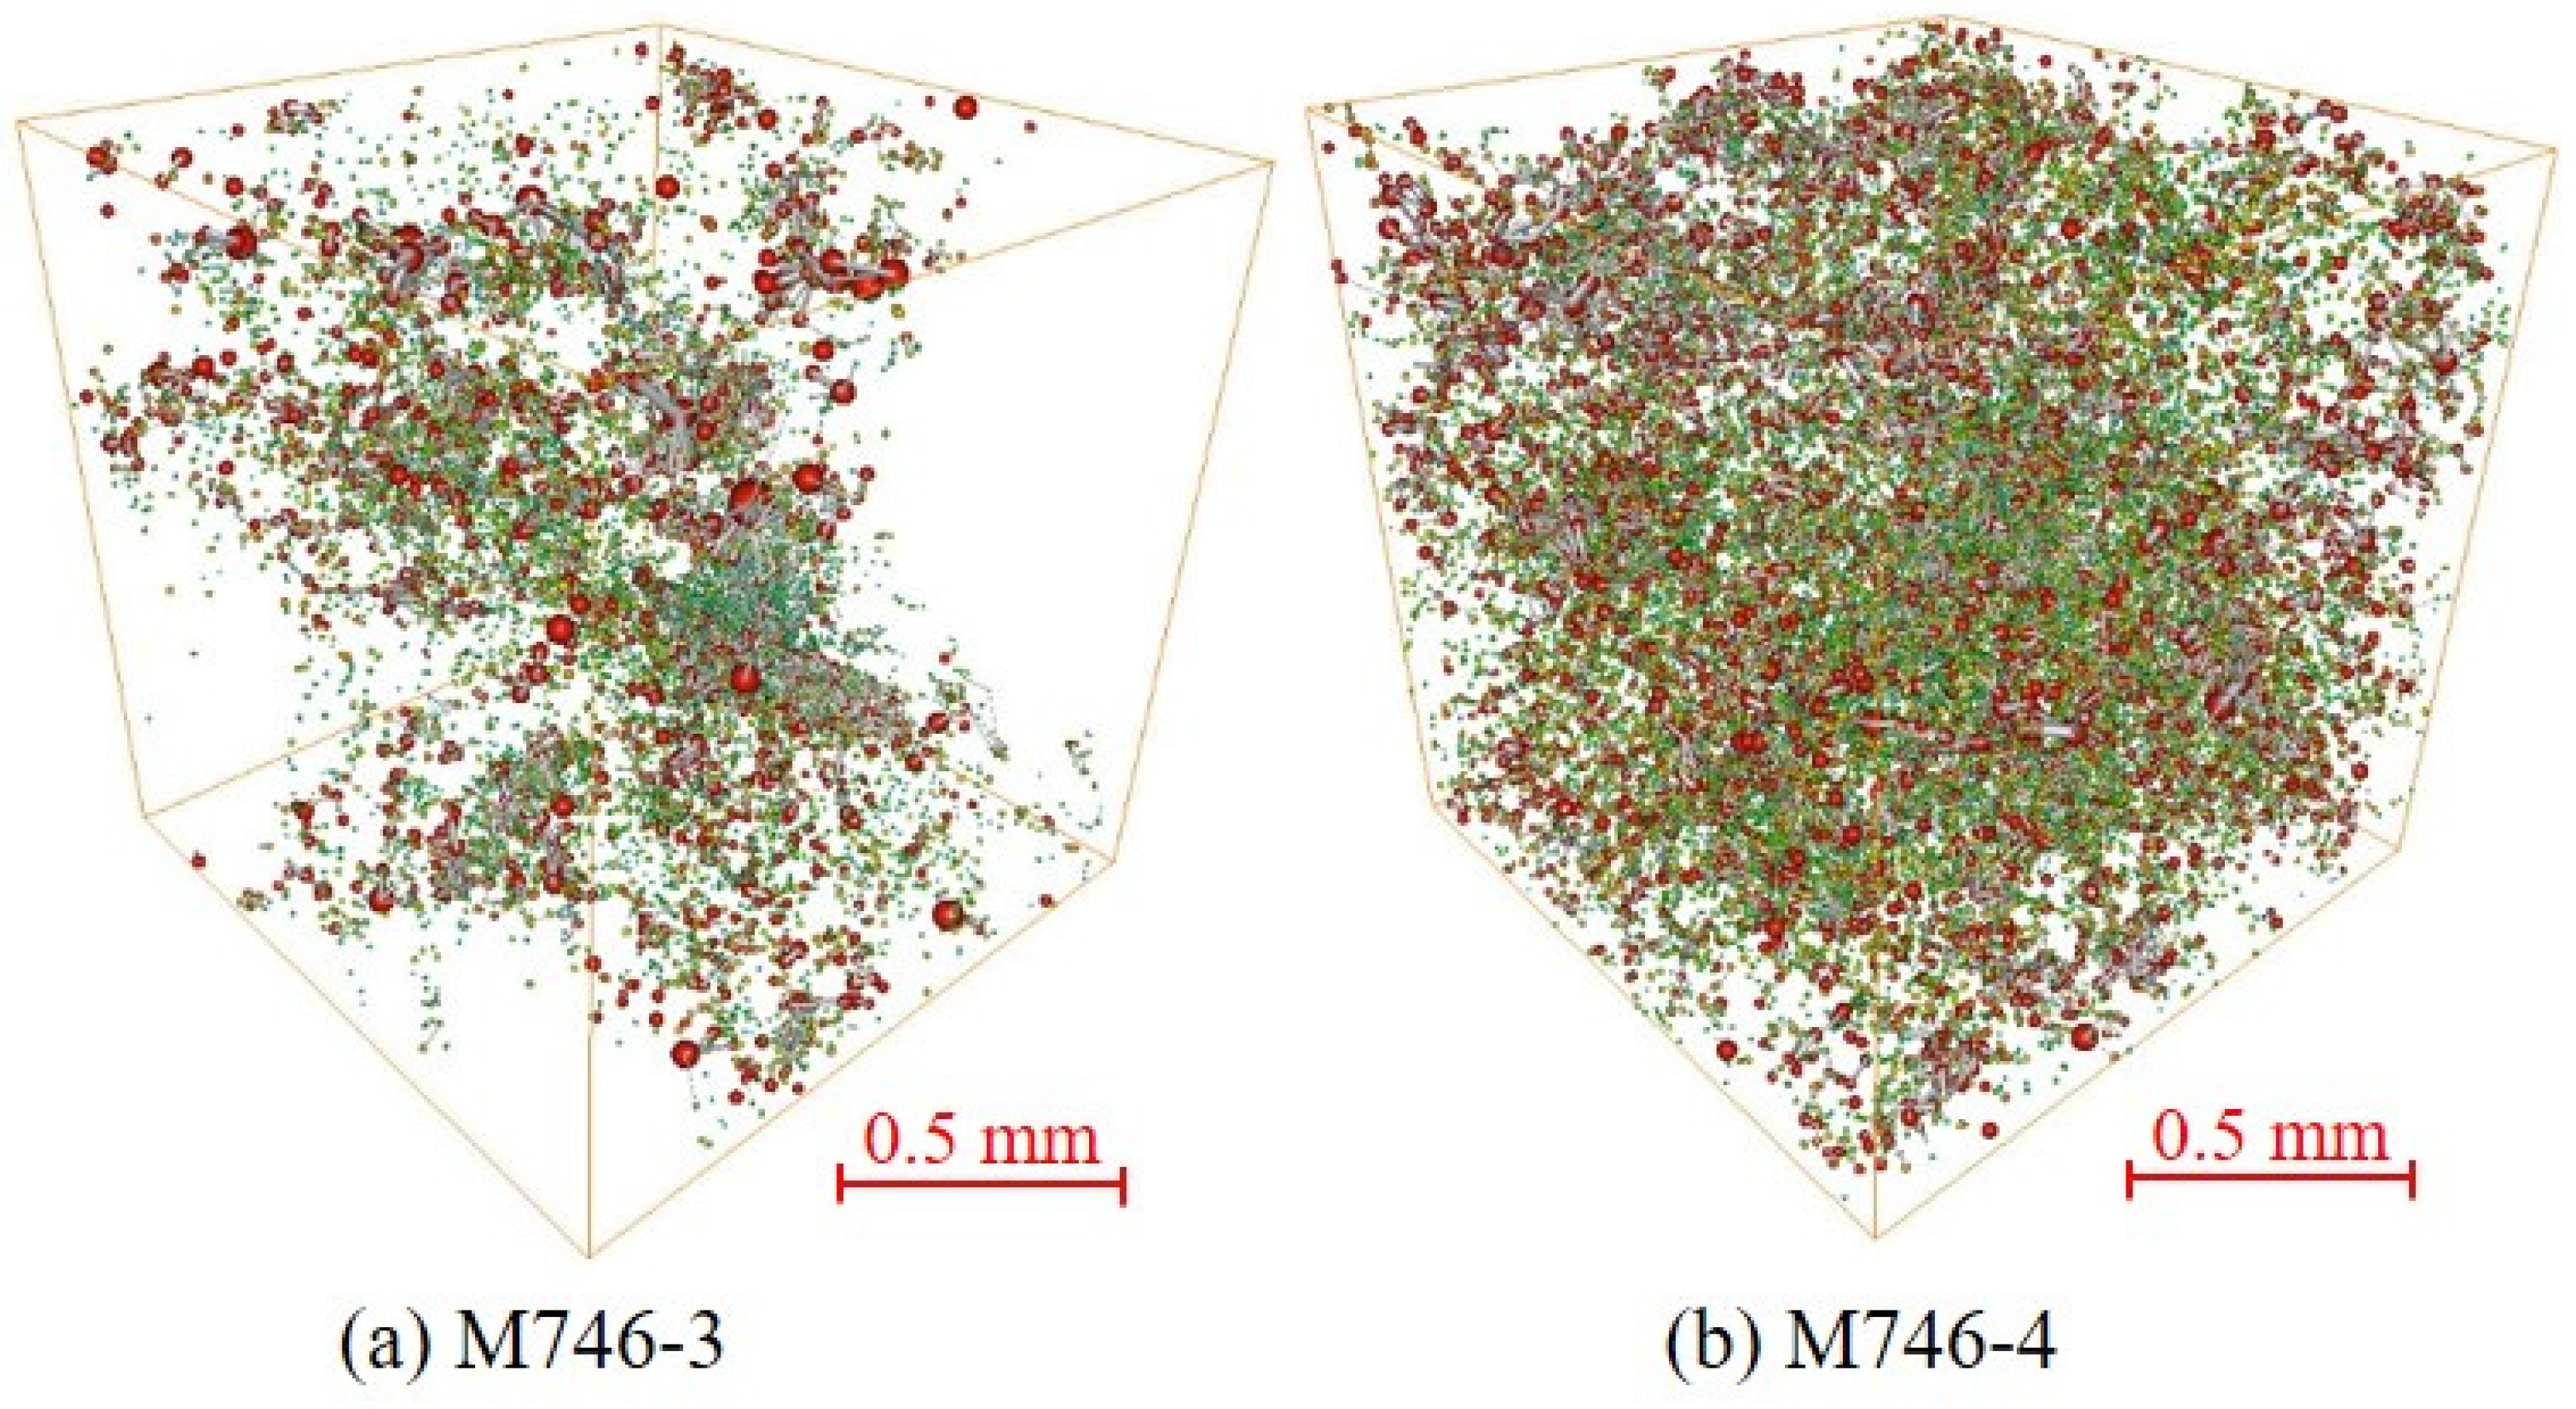
3.3.2. Fine-Scale Pore Network Modeling

The results from MAPS only provide 2D images of the rock’s microstructure and do not directly allow an extraction of a 3D pore network model. In this study, we utilized an image processing method to segment the grayscale image obtained from MAPS into a binarization image, followed by using the cluster marking algorithm to record adjacent single pore pixels as a pore cluster. We then calculated the maximum tangent circle, R, and minimum radius of the peripheral circle, r, for each pore cluster using digital image processing methods, defining the aspect ratio of pores as α = R/r. Pore clusters with α greater than a certain threshold was defined as fractures. As shown in Figure 6a, sample M746-3 exhibits strong heterogeneity, including large pieces of gravel in test areas; identified porosity is at 2.9% resolution at 100 nm resolution, while sample M746-4 (Figure 6b) has relatively good homogeneity. The resulting pore radius distribution curves based on MAPS images for both samples show that matrix pores in both samples are mainly at the nano-submicron scale exhibiting bimodal micropore distributions.
Based on the distribution curve of matrix pore radius obtained from MAPS, a fine-scale pore network model is generated through stochastic process simulation. Firstly, an empty cube box of the same size as the 3D digital core constructed by micron CT is established. Then, pores are randomly inserted into the cube box while adhering to the constraint of the matrix pore size distribution curve. It is ensured that there is no spatial overlap between the inserted pores and throats in the secondary pore network model established by CT. Additionally, considering the correlation between the pore body and throat, a throat is placed in a cube box under the constraint of the coordination number (i.e., number of throats connected by a pore body) and connected to an inserted pore body to form a fine-scale pore network model. Throughout this process, maintaining consistency with respect to the overall porosity of the core served as another constraint. It is evident that, compared to the micro-CT results, the fine-scale digital core pore network model (Figure 7) based on MAPS is significantly better than micron-scale CT in characterizing micro-matrix pores, resulting in relatively smaller and more numerous extracted three-dimensional pore spaces.

3.4. Construction of Two-Scale Pore Network Model

Based on the 3-D digital core established via micro-CT, a coarse-scale pore network model was constructed to reflect the secondary pores; however, the pores were not connected on the coarse scale, and, thus, they needed to be connected through the pores of the micro-matrix to conduct seepage simulation. The MAPS provides information on matrix pore size and spatial distribution characteristics, which was utilized to construct a fine-scale pore network model representing the matrix micro-pores. To connect different scales of pore networks, an additional throat-based superposition approach was employed, requiring a determination of two parameters: maximum pore space and cross-scale coordination number. The coupling algorithm is illustrated in Figure 8a–c. In Figure 8a, the red color represents the large pores and throats, while the black color represents the small pores and throats, and the maximum pore spacing is defined as the radius of the blue shaded ball with pore body N1 at its center, indicating that only small pore bodies located within this ball can be connected to the large pore body N1. The cross-scale coordination number refers to the count of large pores connected to small pores. Based on this number, a sequential connection between large and small pore bodies is established within a search range defined by the maximum pore spacing, starting from near to far distances. Figure 8c presents the resulting coupling outcome with a cross-scale coordination number of five. Based on this principle, the coarse-scale and fine-scale pore network models were integrated. Then, the permeability of the model was calculated and compared with the experimental lab results, and when the model results are closest to the experiment results, the pore space and coordination number can be determined. The method used to calculate model permeability will be introduced in the next section. The process and results are illustrated in Figure 8d–i. The integrated modeling results demonstrate that the digital reconstruction of the spatial distribution of the pore network model of the conglomerate reservoir exhibits pronounced heterogeneity and complex modal characteristics, which aligns well with the outcomes obtained from mercury intrusion and can ensure reliable seepage simulation.
The coordination number was determined using the two-scale coupled pore model to assess the connectivity characteristics of the reservoir’s pore–throat system. The samples predominantly exhibit coordination numbers ranging from 1 to 5, with an average value of 2, indicating limited connectivity. This distribution suggests significant heterogeneity in the conglomerate’s pore structure, resulting in a restricted number of effective seepage channels and extremely low permeabilities for the samples.

3.5. Pore Scale Seepage Simulation

3.5.1. Permeability Calculation

The absolute permeability of the core is a critical parameter that significantly influences the seepage characteristics and serves as an essential indicator for evaluating fluid flow through pores. By utilizing the coupled three-dimensional pore model and Darcy’s law, it becomes feasible to calculate the absolute permeability. The specific calculation equation can be expressed as follows:
k = μ p q p l A ( P i n P o u t )
where k is the absolute permeability (μm2); μp is the P-phase fluid viscosity (mPa.s); qp is the total flow rate driven by the pressure difference (PinPout) in fully saturated P-phase fluid (cm3/s); l is the length of the model (cm); and A is the cross-sectional area (cm2). When using the pore network model to simulate multiphase flow, the relative permeability of each phase can be calculated as follows:
k r p = q m p q s p
where krp is the relative permeability of the p-phase fluid; qmp is the flow rate of the p-phase fluid during the multiphase flow (cm3/s); and qsp is the flow rate of the p-phase fluid during single-phase flow (cm3/s).
Equations (1) and (2) demonstrate that the fundamental aspect of determining absolute and relative permeability lies in computing the flow rate. Assuming that the fluid is incompressible, the inflow and outflow of each pore unit connected to its corresponding throat unit in the network model must be conserved. Thus, the algebraic sum of inflow and outflow through the throat unit connected to the hole (assuming positive inflow and negative outflow) should equal zero.
i , k q i , j k = 0
where qi,jk is the flow rate of the phase i fluid between the adjacent pore unit (cm3/s).
The flow rate between any adjacent pore unit j and k can be calculated as follows:
q i , j k = g i , j k l j , k P i , j P i , k
where gi,jk is the conductivity of fluid phase i flowing between pore units j and k (cm4/(MPa·s)); lj,k is the distance between the centers of pore units j and k (cm); and Pi,j and Pi,k are the pressure of pores J and K, respectively (MPa). By applying the principle of mass conservation to each node, linear equations can be derived, and an iterative algorithm can be used to determine the total velocity of the pore network model. Subsequently, the absolute permeability can be calculated. The results presented in Table 2 demonstrate the permeability calculated by simulation and indoor experiments. All the permeability calculation processes can be achieved by the built-in function in the Pergeos 2020.2. Due to system errors during image binarization and scanning processes, the permeability calculated from digital tools tends to be underestimated compared to laboratory experiments. This underscores the limitations of using CT images for permeability calculations and emphasizes the importance of generating multi-scale pore network models for complex tight reservoirs.

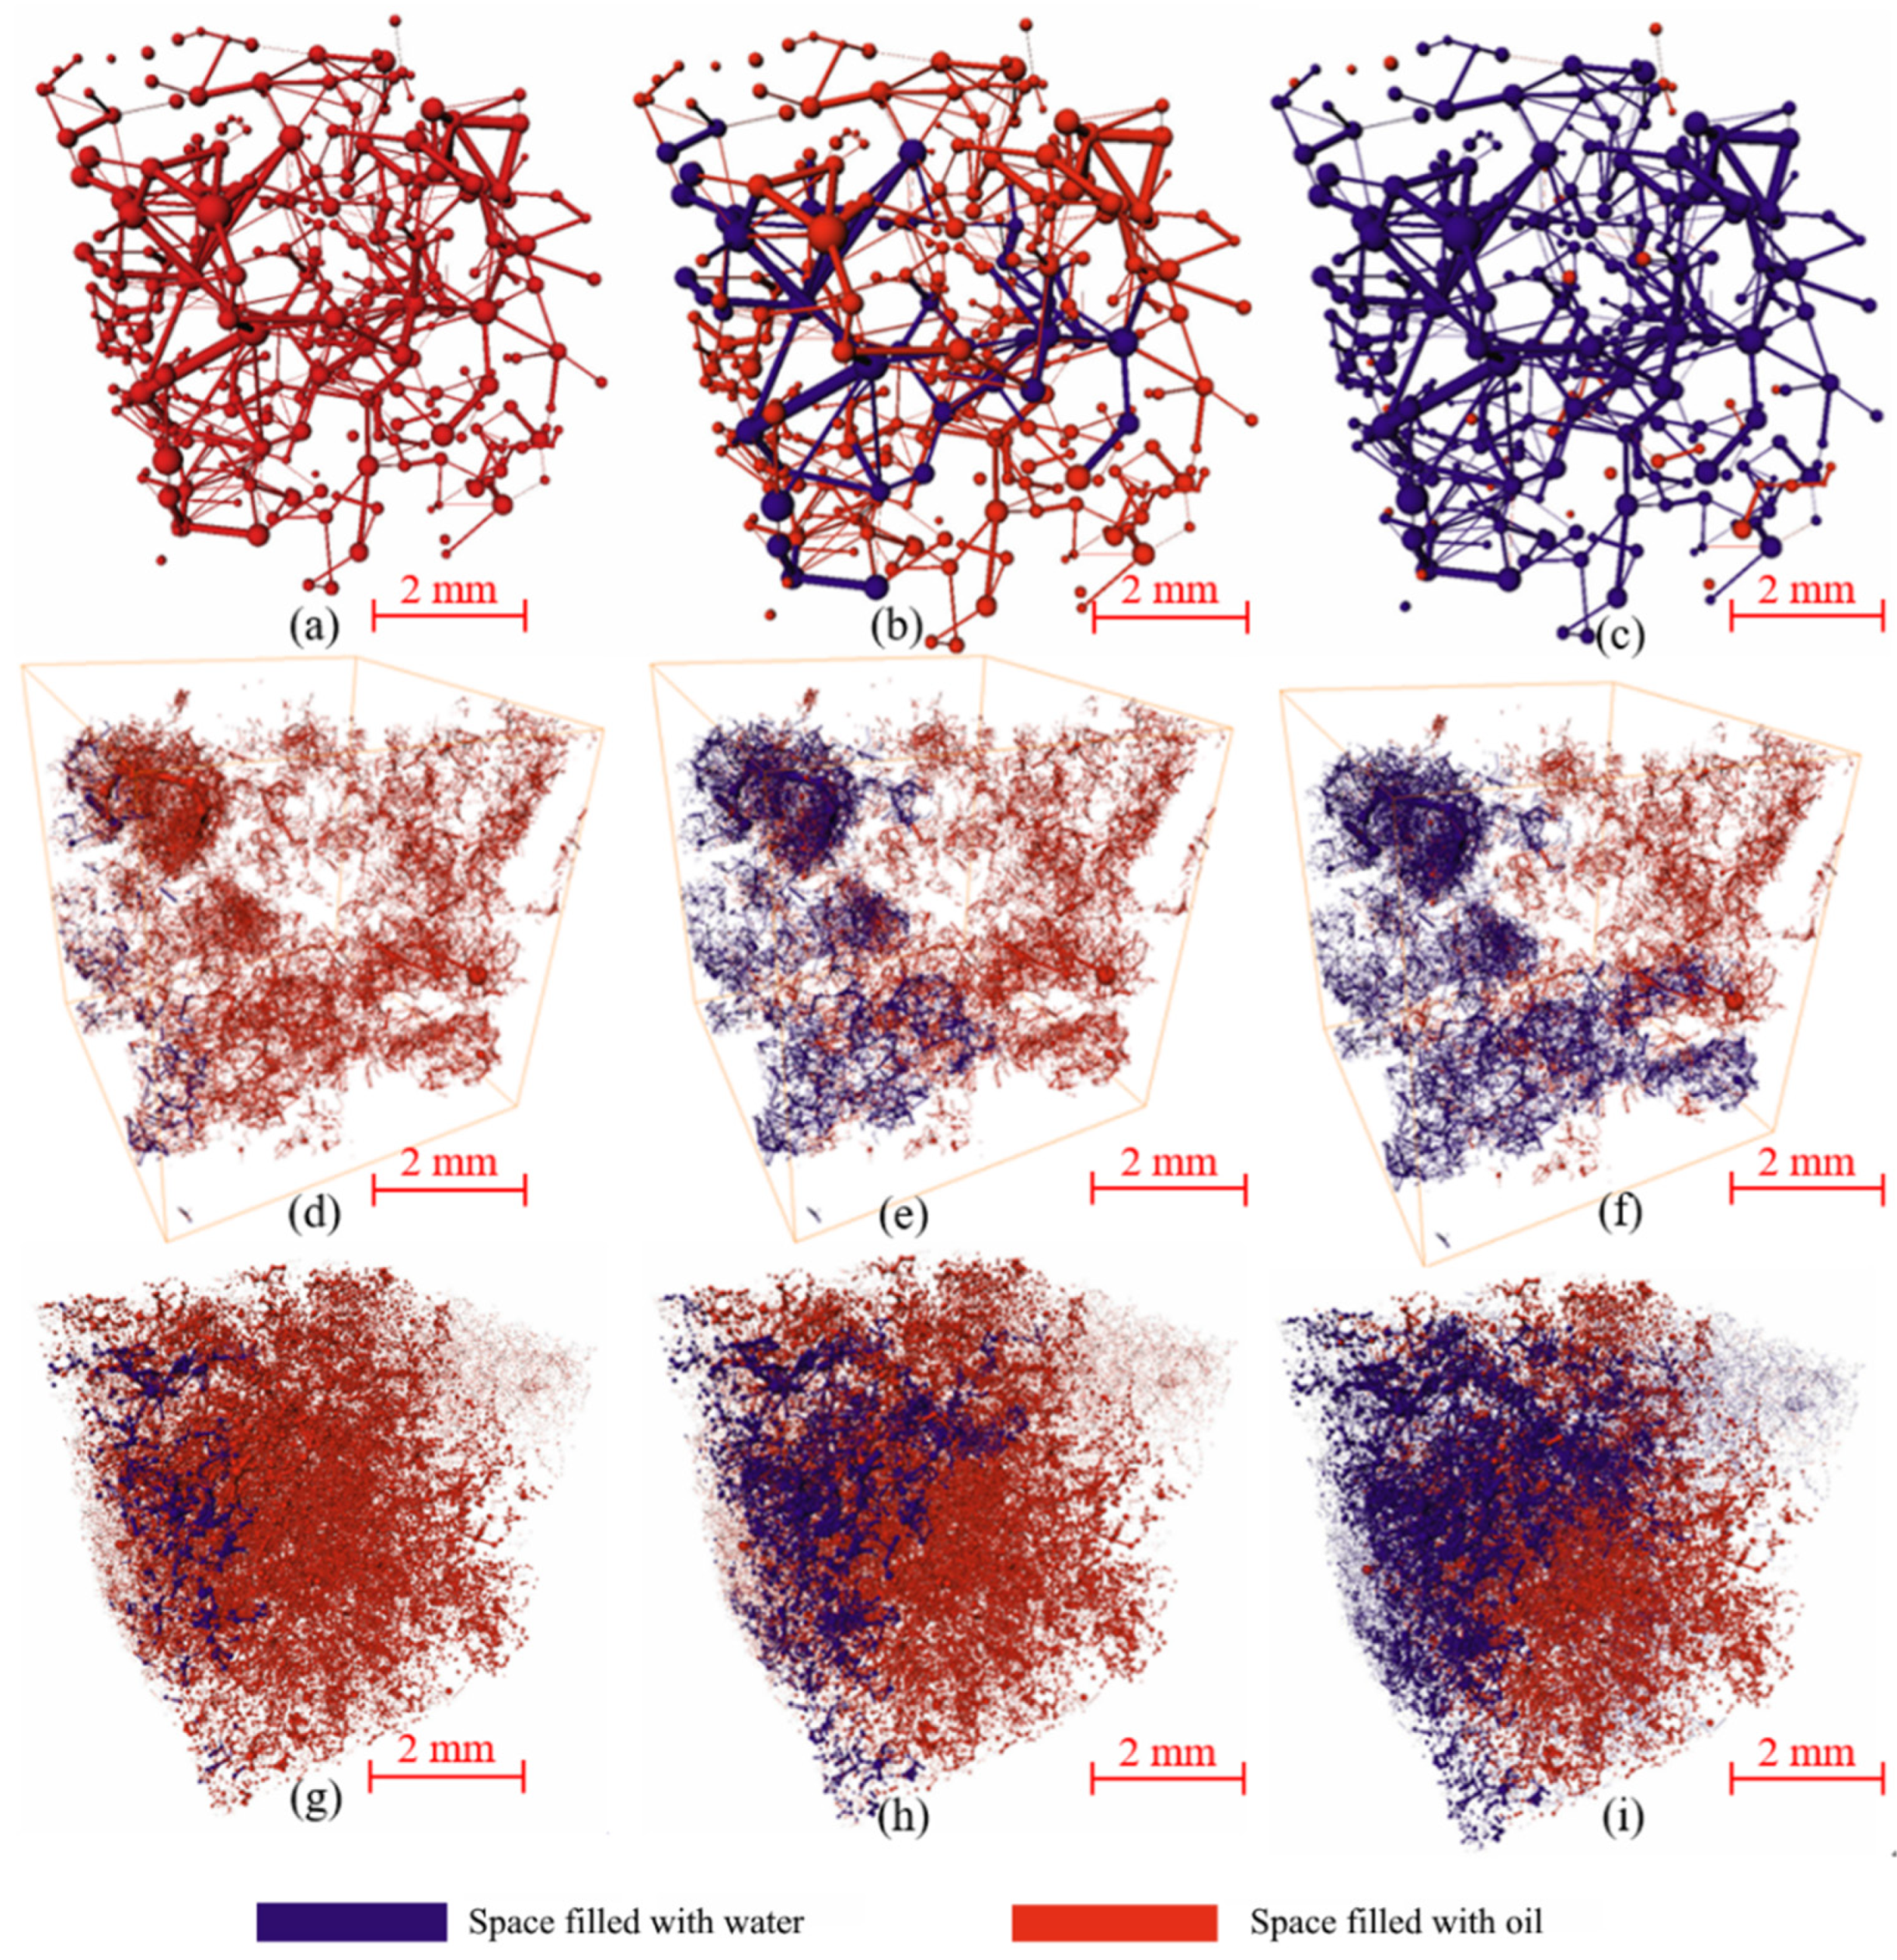
3.5.2. Pore Scale Flooding Simulation

The fluid seepage characteristics in microchannels of the conglomerate pore model were investigated by simulating water displacement and comparing the results with those obtained from a homogeneous sandstone digital core pore model. The wettability evaluation experiments were carried out to determine the wettability and capillary pressure parameters of the reservoir. The model is set to hydrophilic with an oil wettability index of 0.3 and a water wettability index of 0.6. The pore models were firstly saturated with oil and followed by water injection in one side of the pore model. The injection pressure was 3 MPa. The entire seepage simulation was conducted with OpenPNM 3.3, an open-source software package designed to offer a comprehensive framework for conducting diverse pore network simulations, catering specifically to researchers in the field of porous media. The detailed information can be found at https://openpnm.org/.
Figure 9 presents the simulation results of water flooding in three digital cores’ pore networks, where red indicates the saturated oil phase and blue represents the water phase. The simulation results indicate that, for homogeneous sandstones, an increase in displacement pressure leads to significant displacement of oil from the pores. In contrast, for heterogeneous conglomerates, as displacement time increases, changes occur in the spread area of displacement where water predominantly flows along percolation dominant channels and some pores remain unsaturated. It can be inferred that due to strong heterogeneity and variations in pore size within conglomerates, micro-pore structure alters the shape of the displacement front resulting in tongue-like formations during a two-phase flow of oil and water. Further analysis reveals consistency with experimental findings on water displacements conducted on tight conglomerate samples within laboratory settings. When highly heterogeneous conglomerates are flooded, a “dominant channel” forms without any new channels being created after water displaces existing fluids. Capillary resistance varies significantly due to micro-heterogeneity within porous media, leading to the formation of fine pore channels and increased seepage resistance, particularly evident in low permeability conglomerates where heterogeneity has a more pronounced influence. Under such conditions, the primary microscopic seepage mechanisms involve tongue entry and bypass flow, which may serve as key factors limiting the efficiency of oil recovery in the tight conglomerate matrix.
It should be noted that this study focuses on the matrix aspect of conglomerate and does not fully consider the effects of hydraulic fractures and natural fractures in real reservoirs. In addition, in the dual network fusion and the reconstruction of fine scale pore networks, the selection of key parameters is heavily dependent on the correction of experimental parameters, and conglomerate has strong heterogeneity. Therefore, the corresponding obtained pore network model can only represent a small part of our coring region.

4. Conclusions

(1) The pore structure of samples from the Mahu tight conglomerate reservoir is characterized by a complex and diverse range of pore types, including internal dissolution pores within mineral grains, residual intergranular pores, and micropores on gap-filler surfaces. The connectivity between different types of pores contributes more significantly to fluid flow than their individual sizes.
(2) A novel coupled digital core modeling approach was used to construct a two-scale pore network model of the conglomerate reservoir. This efficient and nondestructive method enables a more intuitive and accurate representation of real pore structures in the conglomerate and may provide some new ideas for the pore modeling that require both a large view area and high resolution.
(3) Dominant channels formed when water infiltrated the highly heterogeneous tight conglomerate, altering the leading-edge shape and resulting in a tongue-in phenomenon. Tongue-in and by-pass flow may be one of the key mechanisms that limit oil recovery efficiency in the tight conglomerate matrix.

Author Contributions

Conceptualization, D.L. and D.Z.; methodology, M.D.; software, M.D. and H.H.; investigation, Y.D. and Y.W.; resources, H.L.; data curation, H.H.; writing—original draft preparation, D.L. and D.Z.; writing—review and editing, D.L. and H.L.; visualization, D.L., H.L. and M.D.; supervision, D.L. and H.L.; project administration, H.L.; funding acquisition, H.L. and M.D. All authors have read and agreed to the published version of the manuscript.

Funding

This work was funded by the National Natural Science Foundation of China (51476081 and 41874152) and National Science and Technology Major Project (2016ZX05046-003 and 2017ZX05070-002).

Data Availability Statement

Data for this article can be obtained by email from the authors.

Acknowledgments

The authors would like to thank Xiang Yong from the China university of petroleum (Beijing) for his support and guidance in CT data processing.

Conflicts of Interest

The authors declare no conflict of interest.

References

  1. Zhong, X.; Liu, L.; Wang, H.; Xu, Z.; Chen, H.; Wang, X.; Zhu, Y. Characteristics and origins of the modal pore throat structure in weakly cemented sandy conglomerate reservoirs. J. Pet. Sci. Eng. 2022, 208, 109470. [Google Scholar] [CrossRef]
  2. Xiao, M.; Wu, S.; Yuan, X.; Cao, Z.; Xie, Z. Diagenesis effects on the conglomerate reservoir quality of the Baikouquan Formation, Junggar Basin, China. J. Pet. Sci. Eng. 2020, 195, 107599. [Google Scholar] [CrossRef]
  3. Li, L.; Hao, Y.; Lv, Y.; Wang, C.; Yao, C.; Zhao, Q.; Xiao, P. Experimental investigation on low-velocity seepage characteristics and influencing factors in a shale oil reservoir. J. Pet. Sci. Eng. 2020, 195, 107732. [Google Scholar] [CrossRef]
  4. Lv, W.; Chen, S.; Gao, Y.; Kong, C.; Jia, N.; He, L.; Wang, R.; Li, J. Evaluating seepage radius of tight oil reservoir using digital core modeling approach. J. Pet. Sci. Eng. 2019, 178, 609–615. [Google Scholar] [CrossRef]
  5. Meng, M.; Peng, J.; Ge, H.; Ji, W.; Li, X.; Wang, Q. Rock Fabric of Lacustrine Shale and Its Influence on Residual Oil Distribution in the Upper Cretaceous Qingshankou Formation, Songliao Basin. Energy Fuels 2023, 37, 7151–7160. [Google Scholar] [CrossRef]
  6. Wei, J.; Zhang, A.; Li, J.; Liu, X.; Wang, A.; Yang, Y.; Zhou, X.; Zeng, Q.; Niu, Y. Study on oil seepage mechanisms in lamellar shale by using the lattice Boltzmann method. Fuel 2023, 351, 128939. [Google Scholar] [CrossRef]
  7. Dang, W.; Gao, G.; You, X.; Wu, J.; Liu, S.; Yan, Q.; He, W.; Guo, L. Genesis and distribution of oils in Mahu Sag, Junggar Basin, NW China. Pet. Explor. Dev. 2023, 50, 840–850. [Google Scholar] [CrossRef]
  8. Li, J.; Tang, Y.; Tao, W.; Zhao, J.; Wu, H.; Wu, W.; Bai, Y. Overpressure origin and its effects on petroleum accumulation in the conglomerate oil province in Mahu Sag, Junggar Basin, NW China. Pet. Explor. Dev. 2020, 47, 726–739. [Google Scholar] [CrossRef]
  9. Pal, A.K.; Garia, S.; Ravi, K.; Nair, A.M. Pore scale image analysis for petrophysical modelling. Micron 2022, 154, 103195. [Google Scholar] [CrossRef]
  10. Al-Kharusi, A.S.; Blunt, M.J. Network extraction from sandstone and carbonate pore space images. J. Pet. Sci. Eng. 2007, 56, 219–231. [Google Scholar] [CrossRef]
  11. Fan, N.; Wang, J.; Deng, C.; Fan, Y.; Guo, X. Quantitative characterization of coal microstructure and visualization seepage of macropores using CT-based 3D reconstruction. J. Nat. Gas Sci. Eng. 2020, 81, 103384. [Google Scholar] [CrossRef]
  12. Tan, M.; Su, M.; Liu, W.; Song, X.; Wang, S. Digital core construction of fractured carbonate rocks and pore-scale analysis of acoustic properties. J. Pet. Sci. Eng. 2021, 196, 107771. [Google Scholar] [CrossRef]
  13. Hasnan, H.K.; Sheppard, A.; Hassan, M.H.A.; Knackstedt, M.; Abdullah, W.H. Digital core analysis: Improved connectivity and permeability characterization of thin sandstone layers in heterolithic rocks. Mar. Pet. Geol. 2020, 120, 104549. [Google Scholar] [CrossRef]
  14. Dixon, M.; Newton, B.; Schwartz, A.; Smart, E.; Hooghan, K. Use of Digital Imaging for Improved Evaluation of Unconventional Reservoirs. In Proceedings of the SPE Reservoir Characterisation and Simulation Conference and Exhibition, Abu Dhabi, United Arab Emirates, 16–18 September 2013. [Google Scholar]
  15. Yuan, H.; You, Z.; Shapiro, A.; Bedrikovetsky, P. Improved population balance model for straining-dominant deep bed filtration using network calculations. Chem. Eng. J. 2013, 226, 227–237. [Google Scholar] [CrossRef]
  16. Yang, H.; Balhoff, M.T. Pore-network modeling of particle retention in porous media. AIChE J. 2017, 63, 3118–3131. [Google Scholar] [CrossRef]
  17. Naik, S.; Gerke, K.M.; You, Z.; Bedrikovetsky, P. Application of percolation, critical-path, and effective-medium theories for calculation of two-phase relative permeability. Phys. Rev. E 2021, 103, 043306. [Google Scholar] [CrossRef] [PubMed]
  18. Zhang, S.; Zhang, Y.; Wang, B. Evolution of the effective permeability for transient and pore-scale two-phase flow in real porous media. Int. J. Heat Mass Transf. 2017, 113, 1093–1105. [Google Scholar] [CrossRef]
  19. Van Dijke, M.I.J.; Sorbie, K.S.; Sohrabi, M.; Danesh, A. Three-phase flow WAG processes in mixed-wet porous media: Pore-scale network simulations and comparison with water-wet micromodel experiments. SPE J. 2004, 9, 57–66. [Google Scholar] [CrossRef]
  20. Lie, K.A.; Juanes, R. A front-tracking method for the simulation of three-phase flow in porous media. Comput. Geosci. 2005, 9, 29–59. [Google Scholar] [CrossRef]
  21. Wu, J.; Yang, S.; Gan, B.; Cao, Y.; Zhou, W.; Kou, G.; Zhao, B. Pore structure and movable fluid characteristics of typical sedimentary lithofacies in a tight conglomerate reservoir, Mahu depression, northwest China. ACS Omega 2021, 6, 23243–23261. [Google Scholar] [CrossRef]
  22. Zhou, Y.; Wu, S.; Li, Z.; Zhu, R.; Xie, S.; Zhai, X.; Lei, L. Investigation of microscopic pore structure and permeability prediction in sand-conglomerate reservoirs. J. Earth Sci. 2021, 32, 818–827. [Google Scholar] [CrossRef]
  23. Zhou, Y.; Wu, S.; Li, Z.; Zhu, R.; Xie, S.; Jing, C.; Lei, L. Multifractal study of three-dimensional pore structure of sand-conglomerate reservoir based on CT images. Energy Fuels 2018, 32, 4797–4807. [Google Scholar] [CrossRef]
  24. Xu, J.; Wu, K.; Li, R.; Li, Z.; Li, J.; Xu, Q.; Chen, Z. Real gas transport in shale matrix with fractal structures. Fuel 2018, 219, 353–363. [Google Scholar] [CrossRef]
  25. Xu, J.; Wu, K.; Yang, S.; Cao, J.; Chen, Z.; Pan, Y.; Yan, B. Real gas transport in tapered noncircular nanopores of shale rocks. AIChE J. 2017, 63, 3224–3242. [Google Scholar] [CrossRef]
  26. Andrä, H.; Combaret, N.; Dvorkin, J.; Glatt, E.; Han, J. Digital rock physics benchmarks—Part I: Imaging and segmentation. Comput. Geosci. 2013, 50, 25–32. [Google Scholar] [CrossRef]
  27. Dong, H.; Blunt, M.J. Pore-network extraction from micro-computerized-tomography images. Phys. Rev. E 2009, 80, 036307. [Google Scholar] [CrossRef] [PubMed]
Figure 1. High-pressure mercury intrusion results for the conglomerate samples: (a) Sample M746-3, well MA604, 3898.2 m; (b) Sample M746-4, well MA152, 3898.2 m.
Processes 11 03185 g001
Figure 2. CT images of the samples under different resolutions: (ac) sample M746-3 contains very bright carbonate cement, well MA604, 3898.2 m; (df) sample M746-4 contains intergranular micropores, well MA152, 3898.2 m.
Processes 11 03185 g002
Figure 3. Three-dimensional digital core reconstruction and the pore connectivity of the reservoir samples from the Baikouquan Formation in the Mahu Sag: (ac) development of isolated dissolution pores in sample M746-3, well MA604, 3898.2 m; (df) sample M746-4 contains flaky intergranular pores, well MA152, 3898.2 m.
Processes 11 03185 g003
Figure 4. The maximum sphere algorithm for extracting the coarse-scale pore network model.
Processes 11 03185 g004
Figure 5. Nano-scale pore structure captured by MAPS: (a) albite dissolution pores, well MA604, 3898.2 m; (b) micropores in gravel, well MA604, 3898.2 m; (c) interfacial fracture, well MA604, 3898.2 m; (d) calcite particle dissolution, well MA604, 3898.2 m; (e) residual intergranular pore, well MA152, 3898.2 m; (f) intragranular micropores, well MA152, 3898.2 m; (g) micropores on the interstitial surface, well MA152, 3898.2 m; and (h) kaolinite interstitial micropore, well MA152, 3898.2 m.
Processes 11 03185 g005
Figure 6. Matrix pore size distribution based on MAPS: (a) Sample M746-3, well MA604 at a depth of 3898.2 m; (b) Sample M746-4, well MA152 at a depth of 3898.2 m.
Processes 11 03185 g006
Figure 7. Fine-scale pore network model: (a) Sample M746-3, well MA604, 3898.2 m; (b) Sample M746-4, well MA152, 3898.2 m.
Processes 11 03185 g007
Figure 8. Schematic diagram of the pore network coupling: (ac) schematic diagram of coupling algorithm; (df) coupling process for sample M746-3, well MA604, 3898.2 m; and (gi) coupling process for sample M746-4, well MA604, 3898.2 m.
Processes 11 03185 g008
Figure 9. Water flooding simulation in sandstone and conglomerate samples: (ac) displacement process of sandstone sample; (df) displacement process for sample M746-3, well MA604, 3898.2 m; and (gi) displacement process for sample M746-4, well MA152, 3898.2 m.
Processes 11 03185 g009
Table 1. Basic information of the core samples.
Sample NumberLength (mm)Diameter (mm)Porosity (%)Permeability (10−3 μm2)
M746-352.2224.916.70.601
M746-450.3425.285.60.598
Table 2. Simulated and experimental calculated permeability results of the two samples.
SamplesPorosity
(%)
Experimental Permeability
(mD)
Simulated Permeability
(mD)
M746-36.70.6010.403
M746-45.60.5980.485
Disclaimer/Publisher’s Note: The statements, opinions and data contained in all publications are solely those of the individual author(s) and contributor(s) and not of MDPI and/or the editor(s). MDPI and/or the editor(s) disclaim responsibility for any injury to people or property resulting from any ideas, methods, instructions or products referred to in the content.

