

Fracture Process and Failure Characteristics of Sandstone with Different Height-to-Diameter Ratios
1
School of Land and Resources Engineering, Kunming University of Science and Technology, Kunming 650093, China
2
Sanya Science and Education Innovation Park, Wuhan University of Technology, Sanya 572024, China
*
Author to whom correspondence should be addressed.
Processes 2023, 11(11), 3069; https://doi.org/10.3390/pr11113069
Submission received: 21 September 2023
/
Revised: 19 October 2023
/
Accepted: 23 October 2023
/
Published: 26 October 2023
(This article belongs to the Special Issue Numerical Simulation and Application of Process in Deep Mining Engineering and Petroleum Engineering)
Abstract
:The mechanical properties of rock materials significantly depend on their size due to their heterogeneity and the spatial randomness of joint development—a factor often neglected in pillar design and stability analyses within mining engineering. The rock samples examined herein were 100 mm in diameter and 100 mm, 200 mm, or 300 mm in height. This research analyzed the respective mechanical phenomena and failure patterns of rock specimens with varying height-to-diameter ratios under uniaxial compression. The experiment showed that the greater the height-to-diameter ratio, the smaller the elastic modulus and compressive strength. Remarkably, as the height-to-diameter ratio grew, the failure forms of the samples transitioned from splitting to shearing, while their peak strength gradually diminished. Specifically, a hike from 1:1 to 3:1 in the height-to-diameter ratio led to a roughly 20% decrease in peak strength. Utilizing the real rock fracture process analysis system (RFPA3D), the fracture processes and failure characteristics of rock specimens with dissimilar aspect ratios were comparatively explored from a microscopic viewpoint, with acoustic emissions revealing the entire process from crack initialization to penetration. The failure analysis affirmed that the simulation results corresponded closely with the experimental findings. The resultant research can offer theoretical support for the multiscale mechanical properties, fracture processes, and prediction of rock failure in mining engineering.
1. Introduction
Rock masses are composite materials composed of complete rocks and discontinuous systems of different scales such as joints and fissures [1,2,3]. The microstructure of rocks, including microcracks, voids, and mineral inclusions, significantly influences the development of microscopic cracks. The expansion and penetration stages of these cracks are fundamentally linked to the macroscopic damage and destruction of rocks, determining the stability and structural safety of engineering rock masses [4,5,6]. Consider the ore pillar in underground engineering, which singularly bears the uniaxial compressive load. The stress–strain curves obtained from uniaxial compression tests are used in its design and even in comparisons of ore pillar rock bursts to rock specimen instability patterns. Thus, the usage of smaller pillars or the employment of blasting loosening techniques could be beneficial in reducing pillar rigidity and circumventing rock bursts [7]. Arka Jyoti Das et al. [8] derived and proposed an energy-based safety factor through numerical modeling to determine the yield zone in the surrounding rock. And by installing fiberglass bolts and steel wire mesh, the side peeling and strain explosion were minimized to ensure the safety of the coal seam mining process.
The sizes and positions of pillars are often affected by their purposes in mining engineering. Reducing the sizes of pillars can improve the recovery rate of mining resources; however, it is necessary to increase the sizes of pillars for safe production in mines. Reducing the sizes of pillars and improving the stability of pillars have become the core of mine benefits and safety. The determination of pillar sizes is made by studying the pillar load and pillar strength. The goal of pillar design is to give the left pillars sufficient strength to carry the pillar loads [9,10,11,12].
Pillars of different lithology and size have different bearing capacities and failure characteristics. Similarly, different sizes of rock masses have different failure modes and mechanisms. Due to the size limitations of laboratory mechanical testing, the processing sizes of specimens cannot be too large, and the height should not be too great. Therefore, the size effects and fracture mechanisms of different rock masses still hinder the development and application of rock mechanics. Studying the multiscale mechanical properties of rock masses and their fracture process has always been an urgent problem to be solved in rock mechanics [13,14,15].
Scholars have studied the multiscale mechanical properties and fracture process of rock masses. Ohtsu [16] and Chang [17] et al. applied the elastic wave theory and moment tensor analysis to study the crack propagation mechanism during rock fracture. Jansen [18] used AE technology to explore the temporal and spatial evolution of rock fractures and the accumulation law of rock damage. Kun Du et al. [19] studied rock samples with different cross sections and shape ratios, and the results showed that the crack closure stress was not affected by the cross-sectional shape of the sample. Eren Komurlu et al. [20] conducted experiments on rock material specimens with the same aspect ratio and different sizes under different loading rates. Research has shown that the uniaxial compressive strength value significantly decreases with increasing specimen size. With an increase in the loading rate, the elastic modulus and brittleness of the specimen are significantly improved. Ako Daraei et al. [21] conducted uniaxial compressive tests on 78 rock samples and discussed the changes in the compressive strength and deformation modulus of rock masses under different saturation degrees. Ako Daraei et al. [22] determined the dynamic modulus of a tunnel in western Iran through downhole seismic testing (DS) and proposed a linear correlation between the static and dynamic elastic moduli (Es − Ed).
They also defined the changes in the fracture mode of the sample as the shape ratio increased. SU Haijian et al. [23] conducted uniaxial compression tests on five sandstone samples of different sizes after high-temperature treatment. The results showed that as the treatment temperature increased, the density, peak strength, and average modulus of the samples decreased, while the peak strain gradually increased and had a significant size effect. Qingsong Wang et al. [24] conducted acoustic emission tests on saturated limestone under uniaxial compression and found that the peak acoustic emission activity under uniaxial compression occurred near the peak stress of the rock.
Gong et al. [25] proposed a new criterion for rockburst tendency based on the linear energy storage law and residual elastic energy indices considering the energy consumption characteristics during rock loading. Wang Jianguo [26,27,28,29] et al. tested the dynamic compressive strength, damage morphology, fracture energy density, and other parameters of rocks using pomegranate biotite schist and metamorphic limestones. The fractal patterns of rock deformation and damage were reasonably explained from the perspective of energy dissipation. Tang et al. used the catastrophe theory to analyze the stability of a testing machine-sample system [30]. Li et al. [31] analyzed the nonlinear characteristics of the rock fracture process based on multifractal theory. Jia et al. [32] proposed a method to determine the width of coal pillars in fully mechanized caving face roadway protection using the limit equilibrium theory. They gave examples of observations and statistical results regarding the coal pillar widths and surrounding rock deformation of the roadway.
Zhang et al. [33] studied the influence of the cross-sectional size of a large-section rectangular roadway on the surrounding rocks of the roadway. You et al. [34] pointed out that the uniaxial compression failures of rock samples include shear slip, tensile splitting, fractures due to the instability of compression bars, etc. However, the main reason for the decreased bearing capacity is shear slip displacement, which has a linear relationship with the resulting axial plastic deformation. Guo et al. [35] studied the effects of size on the damage and failure of gangue-cemented backfill. The uniaxial compressive strength of gangue-cemented backfill decreases with increased size, and the failure form of backfill increases with increased size. Split failure gradually transforms into shear failure.
Wang et al. [36] studied the effects of modified high-water-filled pillar material sizes on bearing performance through a uniaxial compression test. Fu et al. [37] studied the size effects on the uniaxial compressive strength of four kinds of rocks with different aspect ratios. The uniaxial compressive strength of rocks first decreased, then increased, and then tended to be stable with increased height-to-diameter ratio, and the fracture mode also changed from complex splitting failure to shearing failure.
Although scholars have studied multiscale rock fracture processes and achieved fruitful results, most of their study objects were standard-size specimens. Based on this, in this work we comprehensively analyzed the failure laws of rock masses with different height–diameter ratios using the physical and mechanical characteristic tests of large-size specimens with a diameter of 100 mm and heights of 100, 200, and 300. Rock mass fracture process analysis software was used to explain the phenomena. The results provide a theoretical basis for studying the multiscale mechanical properties of rock masses, fracture processes, and related engineering issues [38,39,40,41].
2. Size Effect Theory of Rock Masses
The size effect, also known as the scale effect, is a common phenomenon in quasi-brittle materials such as rocks and concretes. In addition to axial compression, the scale effect of strength has also been found in various tests, such as point loads, radial compression loads, and shear, which shows the universality of the scale effect. For the same rocks or rock mass specimens that are geometrically similar under similar loading conditions in rock mechanics, their characteristic value is not a constant but a function of the specimen size.
3. Mechanical Property Testing of Sandstone with Different Height-to-Diameter Ratios
3.1. Test Plan
Uniaxial compressive strength testing of rock specimens in the laboratory is one of the main methods used to determine rock mechanical properties. Middle section 1380 of a metal mine roadway was used as the sampling point in this test. The surrounding rocks exposed in the middle section were mainly dark gray, lightly weathered, thick-layered sandstone, and the rock mass joints and fissures were relatively developed. Cores were cut and ground in the laboratory through on-site coring to produce cylindrical samples with height-to-diameter ratios of 1:1, 2:1, and 3:1. Three parallel samples were prepared for each group and numbered. The accuracy of specimens met the relevant standards of the rock mechanics test, and uniaxial compression testing was then performed to analyze the stress change law, strength characteristics, and failure characteristics of rock samples with different height-to-diameter ratios during uniaxial compression.
3.2. Test Equipment
The diameter of conventional mechanical test equipment is 50 mm. The strength of the core is greatly affected by the particle sizes of core samples, the particle size combinations, and the sizes of rock samples. Increasing the size can eliminate the influences of particle sizes and particle size combinations. The core sample diameter was 100 mm, and the maximum height was 300 mm. The conventional mechanical testing machine could not meet the requirements of test failure load and test accuracy because of the large sizes of the specimens. The HUT106C microcomputer-controlled electro-hydraulic servo testing machine was used instead for the compression testing of samples with different height-to-diameter ratios after comparison.
Figure 1 shows the HUT106C microcomputer-controlled electro-hydraulic servo testing machine. The maximum compression space is 900 mm, with a plate size of 200 × 200 mm and a maximum load of 1000 kN. The accuracy level of the testing machine is 1/0.5, with a relative error of test force indication within ±1%/±0.5% and total power of 4 kW, which met the test requirements.
The displacement loading control method was adopted in the test, and the loading rate was 0.02 mm/s until the specimen was damaged. The axial load and displacement of specimens were recorded during loading.
3.3. Sample Processing
3.4. Test Results and Analysis
3.4.1. Analysis of Rock Failure Characteristics with a Height-to-Diameter Ratio of 1:1
The fracture mode of each specimen with a height-diameter ratio of 1:1 was obtained by compression testing each group of specimens (see Figure 3).
(1) Destruction characteristics
Figure 3 shows that several parallel longitudinal cracks formed on the specimen surface. The longitudinal cracks of the three specimens extended from the top to the bottom, and the crack width and depth gradually narrowed and became shallower from the surface to the inside. The surface cracks of specimens numbered 10A and 10B were shallower, while 10C had deeper cracks and longer crack lengths. The inclination angle and direction of the fracture surface of each specimen were approximately the same, with an end effect, and wedge-shaped fragments were generated at both ends of the specimens.
(2) Strength and deformation characteristics
Figure 4 shows that the original open structural surface or microcracks inside the specimen gradually closed at the initial stage of loading, and specimens were coMPacted to form an early nonlinear deformation. New microcracks were generated inside specimens and continuously developed with the increased load. The stress–strain curve was approximately a straight line at the elastic deformation stage. Cracks gradually penetrated each other when developing to a certain extent, and specimens showed yield failure, changing from elastic deformation to plastic deformation. The internal structures of specimens were damaged after reaching peak strength, and the failure mode was blocks sliding along the macroscopic fracture surface, with a peak strength of 45.0 MPa. The ruptured specimen still had a certain bearing capacity.
(3) Fracture mechanism
Many split surfaces were present along the axial direction of rock specimens. Specimens showed typical brittle failure characteristics during the failure process, and the failure mode was mainly sudden tension failure. The tensile strength of rocks was much lower than their compressive strength. As far as the failure surface is concerned, rocks were dominated by tension, which even covered the shear failure surface.
3.4.2. Analysis of Rock Failure Characteristics with a Height-to-Diameter Ratio of 2:1
The fracture modes of each sample were finally obtained by compression testing each group of samples (see Figure 5), and the stress–strain curve was plotted (see Figure 6).
(1) Destruction characteristics
Split surfaces and one shear failure surface were present on the specimen surfaces, among which the longitudinal cracks of the specimens numbered 20A and 20C were more obvious, and longitudinal splitting failure was the main mode. 20B showed obvious single-bevel shear failure, and the cracks of 20A and 20C were wider and deeper. The cracks of 20C were shallower, and the surface unevenness of 20C was significantly greater than that of 20A and 20B. All three specimens showed a certain V-shaped failure, which changed from deep to shallow. When the test piece was damaged, it made the sound of a bang. Some fragments were generated and dropped, which destroyed the integrity of the test piece.
(2) Strength and deformation characteristics
Specimens showed obvious nonlinear deformation at the initial stage of loading, indicating that the internal structure of the sandstone contained defects such as voids and microcavities. The cementation degree of rock particles was incomplete in the dense and closed process. As the load increased, stress and strain gradually manifested as elastic deformations. The specimen deformation transformed from elastic to plastic after reaching the yield point, until the specimens failed. Its intensity increased first and then suddenly decreased after reaching the peak intensity (40.0 MPa).
(3) Fracture mechanism
Split surfaces were present along the axial direction of the specimens. A shear failure surface ran through the entire rock specimens, and its rupture was a combination of shear and axial failure.
3.4.3. Analysis of Rock Failure Characteristics with a Height-to-Diameter Ratio of 3:1
The fracture modes of each specimen were obtained by compression testing each group of samples (see Figure 7), and Figure 8 shows the stress–strain curve.
(1) Destruction characteristics
An axial crack and a shear crack appeared on the surface of specimen 30A, and the two formed a V shape. The fracture form was due to shear failure and axial failure, and the former was the main cause. Such damage may be related to the friction effect at the end of the specimen. Both 30B and 30C had multiple shear failure surfaces. These shear surfaces were new fractured ones on the specimens. The inclination angles were roughly the same, but the directions were different. The specimens showed conical failure. After all the specimens were damaged, large blocks fell away, and even caving occurred with a huge sound. They were not intact, and some of the specimens were peeled off a cone surface.
(2) Strength and deformation characteristics
Figure 8 shows that the peak strength was 36.0 MPa, and the deformation characteristics were like those of the previous two groups of samples with different height-to-diameter ratios. They experienced nonlinear deformation, elastic deformation, and plastic deformation, but there were differences in the nonlinear deformation. The duration of this stage was longer than that for the first two groups, indicating that the internal structure contained more defects such as voids and microholes.
(3) Fracture mechanism
The rock specimens had some split surfaces along the axial direction, and shear failure surfaces ran through the entire rock specimens. Generally, single-slope shear failure of the specimens was the main reason, and the shear surfaces penetrated through the inside of the specimens, forming obvious cone shapes.
3.4.4. Comparative Analysis of Failure Characteristics of Rocks with Different Height-to-Diameter Ratios
(1) Analysis of damage characteristics
The failure of the specimens was affected by various factors, and the real fractured forms of the rock specimens under uniaxial compression were various. Both the height-to-diameter ratios of 2:1 and 3:1 produced a “V”-shaped failure surface. The failure forms and characteristics of the specimens gradually changed with increasing height-to-diameter ratio of the specimens. Specimens with an aspect ratio of 1:1 were mainly damaged by splitting parallel to the longitudinal direction, and the cracks changed from deep to shallow. The failure cracks of the rock specimens were roughly parallel to the loading direction, and wedge-shaped fragments were generated at both ends, which was related to the end effect.
The specimens with height-to-diameter ratios of 2:1 and 3:1 were mainly sheared. When the bearing limit was reached, the failure of the rock specimens was extremely uneven with the increased height-to-diameter ratio. Local failure was serious, and most samples had vertical cracks. The larger the height-to-diameter ratio of the specimens, the more sudden the failure. For large failure, rock specimens collapsed during failure, and brittle failure became more and more intense.
(2) Strength and deformation characteristics
The compressive strength of each specimen was determined (see Table 2). The average compressive strength varied with the height-to-diameter ratio (see Figure 9), and Figure 10 shows the relationship between the mean elastic modulus and the height-to-diameter ratio.
Table 2 and Figure 9 and Figure 10 show that the compressive strength gradually decreased and brittleness gradually increased with increasing size of the specimens. When the height-to-diameter ratio of the specimen was 1:1, the uniaxial compressive strength was 45.0 MPa; when the ratio was 3:1, the strength was 36.0 MPa. When the height-to-diameter ratio increased from 1:1 to 3:1, compressive strength decreased by 20%.
The strength and elastic modulus of the rocks decreased exponentially with the increased scale. A positive linear relationship was found between the rock strength and elastic modulus. The increased elastic modulus was rooted in increased rock material strength, and the size of the rock specimens significantly affected the peak strength. The stress–strain curves of specimens with different height-to-diameter ratios showed that their deformation characteristics were the same: from early nonlinear deformation to elastic deformation and then on to plastic deformation after failure. However, the difference is that the length of time in the nonlinear deformation stage was different, and it increased with increasing height-to-diameter ratio. The size of the specimen increased, and the internal structure contained more defects such as voids and microholes. The variation law of the stress–strain curve was axial with the typical plastic–elastic–plastic body.
4. Analysis of the Fracture Process of Rock Masses with Different Height-to-Diameter Ratios
4.1. Real Rock Fracture Analysis System
Real fracture process analysis (RFPA-3D) software (http://www.rfpa.com/) can simulate the whole process of microscopic and macroscopic failure of rocks and analyze rock fracture characteristics and acoustic emissions [17]. Figure 11 shows the RFPA-3D calculation program flow. The calculation method, based on the finite element theory and statistical damage theory, takes into account the nonuniformity of material properties and the randomness of the defect distribution. The assumed statistical distribution of this material property is introduced into the numerical calculation method. The element is destroyed so that a numerical simulation of the failure process of nonuniform materials can be realized. The unique calculation and analysis method of RFPA-3D software enables it to solve problems that most geotechnical engineering simulation software products cannot solve. It is widely used in engineering related to the fracture processes of nonuniform rock masses, such as in situations involving slopes, underground chambers, tunnel excavation, and surface subsidence.
4.2. Model Test Scheme Design
The plan for this test was to establish cylindrical models with a diameter of 100 mm and respective heights of 100, 200, and 300 mm (see Figure 12) to study the strength characteristics and fracture forms of rocks of different sizes. Different colors represent different material properties. The uniformity reflects that RFPA-3D software (http://www.rfpa.com/) can take into account material inhomogeneity. Longitudinal displacement loading, via Z-axis direction loading, was used. The increment of each step was ΔS = 0.002 mm. The number of loading steps was automatically generated by the system. The parameters obtained from the indoor test were converted into mesoparameters, with an average elastic modulus of 37 GPa, an average strength of 146 MPa, a pressure–pull ratio of 10, a Poisson’s ratio of 0.23, and a degree of homogeneity of 3.
4.2.1. Analysis of Rock Failure Characteristics with a Height-to-Diameter Ratio of 1:1
Figure 13 shows that the failure mode was mainly tensile failure when the height-to-diameter ratio of the model was 1:1. Partial shear failure reflects the typical characteristics of brittle materials, with a peak intensity of 45.9 MPa. When loading to step 99, cracks appeared at about 1/3 from the lower left corner and upper right of the model. At this time, the compressive strength was 9.6 MPa, accounting for 21% of the peak strength.
Cracks initially formed and mainly concentrated at both ends at step 101. At this time, the compressive strength was 18.4 MPa, accounting for 40% of the peak strength. Cracks at both ends developed towards the middle and gradually penetrated at step 102. At step 104, the original crack had completely penetrated; new cracks appeared next to the main crack but were not obvious. At this time, the compressive strength was 36.7 MPa, accounting for 80% of the peak strength. At step 110, the specimen completely failed and formed an N-shaped crack.
4.2.2. Analysis of Rock Failure Characteristics with a Height-to-Diameter Ratio of 2:1
When the height-to-diameter ratio of the model was 2:1, the failure form was mainly single-slope shear failure. As loading steps continued, the model cracked with a peak intensity of 40.8 MPa. At step 139, cracks appeared in the middle of the specimen and were not obvious. The compressive strength was 8.0 MPa, accounting for 19.6% of the peak strength.
Figure 14 shows the step 148-0, cracks formed, becoming more obvious as steps continued. At step 148-11, the crack deepened and extended to both ends of the initially formed crack. At steps 148-14, new cracks in different directions appeared at the lower end of the original crack. They developed to the edge of the specimen until they penetrated the specimen. The compressive strength was 28.6 MPa, accounting for 70% of the peak strength. At step 148-22, cracks penetrated the specimen, which was destroyed. The compressive strength was 33.5 MPa, accounting for 82% of the peak strength.
4.2.3. Analysis of Rock Failure Characteristics with a Height-to-Diameter Ratio of 3:1
Figure 15 shows that when the height-to-diameter ratio of the model was 3:1, the failure mode was still dominated by single-slope shear failure, with a peak strength of 36.5 MPa. With the progress of loading, crack initiation occurred in the middle of the lower left and right edges of the model at step 179. The compressive strength was 7.7 MPa, accounting for 21% of the peak strength. At step 197-19, obvious cracks appeared at the crack initiation site, and new cracks formed between the two cracks.
At step 197-22, the cracks at both ends were more obvious and gradually penetrated to the crack formed in the middle. The compressive strength was 21.9 MPa, accounting for 60% of the peak strength. From steps 197-24 to 197-26, a new crack was generated at the upper left of the middle crack until it penetrated to the positions of the cracks at both ends. At step 197-32, the crack was completely formed and fully penetrated, forming a single-slope shear failure. The compressive strength was 29.2 MPa, accounting for 80% of the peak strength.
4.2.4. Comparative Analysis of Failure Characteristics of Rock Specimens with Different Height-to-Diameter Ratios
Figure 16, Figure 17 and Figure 18 show that the average uniaxial compressive strength of the rock specimens decreased exponentially as the size of the specimens increased. When the height-to-diameter ratio of the model was 1:1, the peak strength was 45.2 MPa; when the ratio was 3:1, the peak strength was 36.0 MPa; and when the ratio increased from 1:1 to 3:1, peak strength decreased by 25.5%. This is very close to the previous laboratory test value, which proves the reliability of the numerical simulation. As the size of the specimen increased, the post-peak brittleness of rocks increased. Plastic deformations increased gradually, and the failure form of the specimens changed significantly.
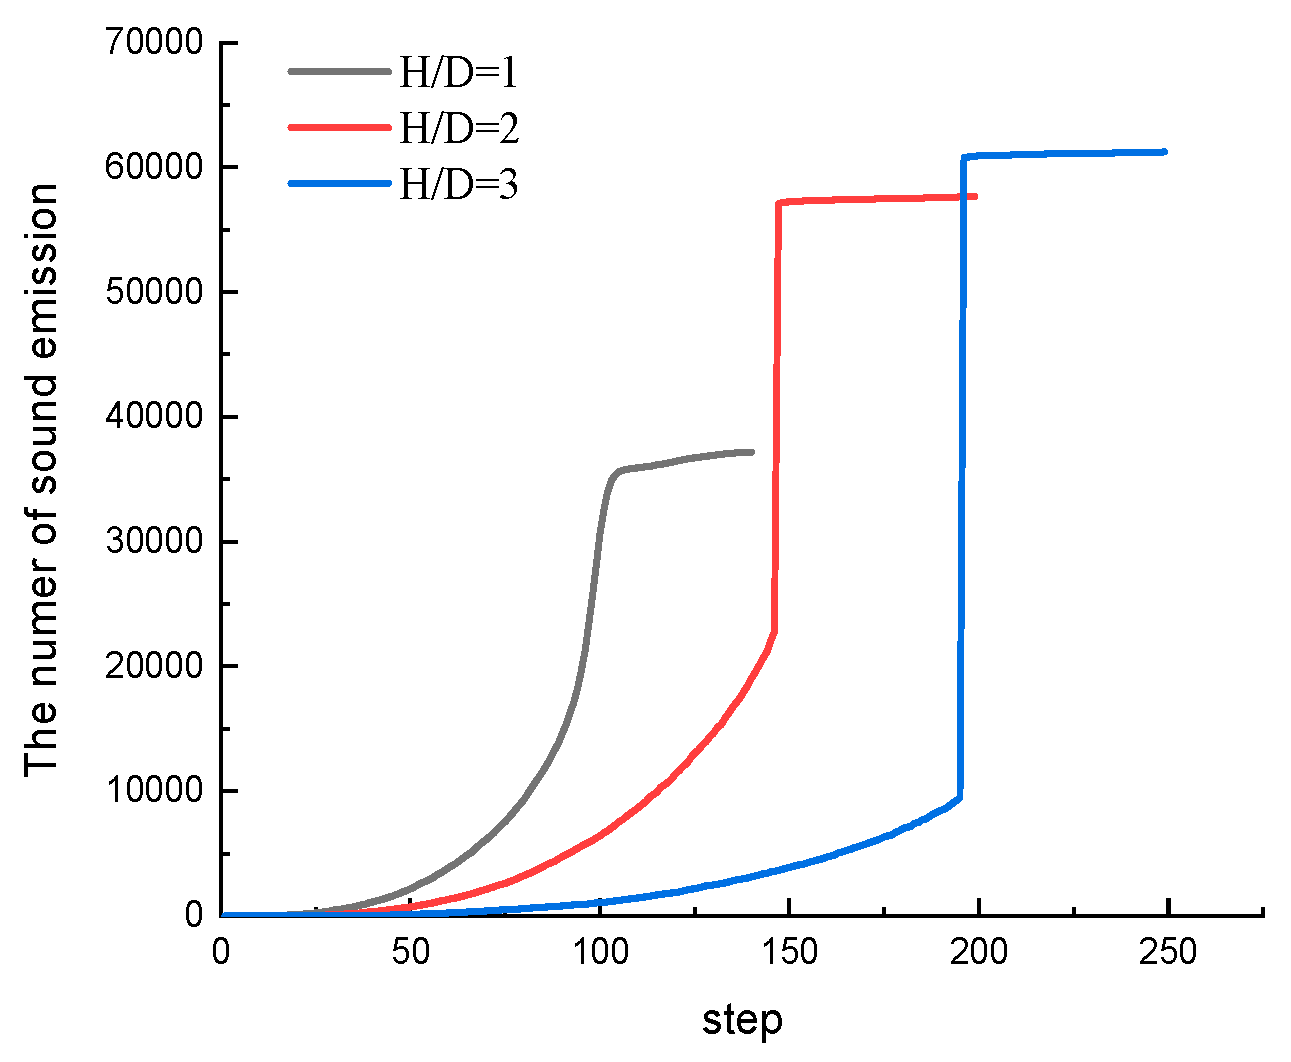
From the analysis of acoustic emissions in the process of damaging the model, shown in Figure 19, the acoustic emissions roughly went through three stages: (1) Stable stage: This is mainly the stage of compacting rocks. Small cracks and dense voids are slowly squeezed and closed, and the acoustic emission presents a weak signal. (2) Slow growth stage: Acoustic emissions increase significantly with the increased load. However, the early and middle stages are relatively stable on the whole because of the relatively small stress. (3) Active stage: The acoustic emission signal increases rapidly as it approaches the stress peak value, and acoustic emissions show a jumping increase, with intermittent activity. Original cracks in the specimen develop and new cracks are generated with the increased load.
An inflection point appears during the ascent, which is an important signal that the specimen will be destroyed. When acoustic emissions increase to a certain extent, the specimen is damaged, and the acoustic emission characteristics of specimens of different sizes have similarities. Acoustic emissions first increase slowly with the increased number of loading steps and then increase rapidly. This results in a sudden increase, which eventually tends to stabilize. When the main cracks penetrate the rock specimen, the specimen becomes completely fragmented. Failure occurs, which sharply decreases the bearing capacity of the specimen.
5. Conclusions
Indoor uniaxial compression tests were conducted in this study to determine the compressive strength, elastic modulus, stress–strain curves, and failure forms of different-sized specimens. To identify scale effects, with potential applications to pillar sizes in mining engineering, the failure characteristics of these specimens were meticulously analyzed. Subsequently, RFPA3D software was employed for further simulation analyses. The congruence between the simulation and experimental outcomes affirmed the numerical simulation’s reliability.
Uniaxial compression tests on specimens with varying height-to-diameter ratios revealed a decline in compressive strength and elastic modulus as the ratio increased. Notably, variations in failure characteristics and forms were evident with the changing size. In smaller specimens, longitudinal cracks spanned from top to bottom, while the crack width and depth progressively narrowed and become shallower from the surface inward. With increasing size, the specimens exhibited a certain Type-V failure. Here, Type V changed from being deep to shallow, primarily characterizing the specimen’s fracture mode as shear failure. Based on the indoor tests, RFPA3D software was employed to perform a systematic analysis of failure forms, considering the entire process of crack generation, penetration, and failure from a microscopic perspective. Differences were apparent in the crack initiation position and damage degree across the models with varying aspect ratios, and in the fracture patterns between small-sized and large-sized models. The smaller models primarily demonstrated tensile failure, while the larger ones predominantly exhibited shear failure. Acoustic emissions from specimens of different sizes were observed to progress through three stages: the original crack compaction stage, the crack development stage, and the post-fracture stage. The characteristics of acoustic emissions displayed marked consistency: acoustic emissions initially rose slowly with increasing number of load steps, then surged abruptly and ultimately stabilized.
Upon juxtaposing the findings from the laboratory examination with the numerical analysis of the microfracture procedure in the rocks, a high degree of correspondence was found. Irrespective of micro or macro conditions, the specimens’ compressive strength and elastic modulus demonstrated a decline in response to an increased aspect ratio. Correspondingly, the fracture pattern shifted from tensile failure to shear failure. Consequently, enlarging the ore pillar’s size is not a viable solution to the issues of roof caving and ore pillar instability during subterranean mining. The results of this study can bolster the theoretical understanding of rock masses’ multiscale mechanical properties, the fracture process, and related engineering implications.
6. Future Work and Prospects
RFPA-3D showed a good ability to simulate fracture propagation during rock failure. There have not been many physical studies on prefabricated fractures. Future studies could be conducted by means of uniaxial or triaxial experiments on rock masses with prefabricated fractures and combined with RFPA-3D to analyze the characteristics of rock mass failure.
Author Contributions
Conceptualization, J.Z.; Methodology, C.Z.; Software, T.D.; Validation, M.L.; Formal analysis, X.Y. All authors have read and agreed to the published version of the manuscript.
Funding
This research was supported by the PhD Scientific Research and Innovation Foundation of Sanya Yazhou Bay Science and Technology City (HSPHDSRF-2023-03-017).
Data Availability Statement
The data presented in this study are available on request from the corresponding author.
Conflicts of Interest
The authors declare no conflict of interest.
References
- Ye, D. Stability Analysis and Reinforcement Measures of Road Tunnels crossing Coal Seam Goaf Groups. Ph.D. Dissertation, Kunming University of Science and Technology, Kunming, China, 2021. [Google Scholar]
- Hosung, S.; Carlos, J.S. Numerical study of fractured rock masses: Transverse isotropy vs. implicit joint-continuum models. Comput. Geotech. 2021, 138, 104317. [Google Scholar]
- Yan, B.; Qi, Q.; Liu, J.; Cai, M.; Li, X.; Wang, P. Fracture propagation and permeability evolution mechanism of jointed rock mass in coastal mines. Rock Mech. Rock Eng. 2022, 56, 2763–2778. [Google Scholar] [CrossRef]
- Liu, Y.; Wang, S.; Zheng, R.; Li, H. Quantitative Characterization of Tight Rock Microstructure of Digital Core. Geofluids 2022, 2022, 3554563. [Google Scholar] [CrossRef]
- Kumar, A.G.; Kanti, M.M. Evaluating Road-Cut Slope Stability Using Newly Proposed Stability Charts and Rock Microstructure: An Example from Dharasu-Uttarkashi Roadway, Lesser Himalayas, India. Rock Mech. Rock Eng. 2022, 55, 3959–3995. [Google Scholar]
- Huang, D.; Chang, X.; Tan, Y.; Fang, K.; Yin, Y. From rock microstructure to macromechanical properties based on fractal dimensions. Adv. Mech. Eng. 2019, 11, 1–13. [Google Scholar] [CrossRef]
- You, M.; Hua, A. Scale effect of uniaxial compression of rock samples and pillar bearing performance. Chin. J. Coal 1997, 22, 39–43. [Google Scholar]
- Das, A.J.; Mandal, P.K.; Ghosh, N.; Singh, A.P.; Kumar, R.; Tewari, S.; Bhattacharjee, R. Evaluation of energy accumulation, strain burst potential and stability of rock mass during underground extraction of a highly stressed coal seam under massive strata—A field study. Eng. Geol. 2023, 322, 107178. [Google Scholar] [CrossRef]
- Jiang, Z.; Guo, W.; Xie, S. Coal Pillar Size Determination and Surrounding Rock Control for Gob-Side Entry Driving in Deep Soft Coal Seams. Processes 2023, 11, 2331. [Google Scholar] [CrossRef]
- Li, Q.; Li, J.; Wang, Z.; Li, K.; Zhang, C. Study on Coal Pillar Size Design Based on Non-integral Contact Structure of Coal and Rock Under Static and Dynamic Loads. Front. Mater. 2021, 8, 721713. [Google Scholar] [CrossRef]
- Yang, R.; Zhu, Y.; Li, Y.; Li, W.; Lin, H. Coal pillar size design and surrounding rock control techniques in deep longwall entry. Arab. J. Geosci. 2020, 13, 453. [Google Scholar] [CrossRef]
- Meng, Z.X. Optimization Studies on Pillar Size of Fully Mechanized Caving Face. Adv. Mater. Res. 2014, 3384, 1010–1012. [Google Scholar] [CrossRef]
- Zhang, G.C.; He, F.L.; Jia, H.G.; Lai, Y.H. Analysis of Gateroad Stability in Relation to Yield Pillar Size: A Case Study. Rock Mech. Rock Eng. 2017, 50, 1263–1278. [Google Scholar] [CrossRef]
- Zhou, J.; Zhao, G.; Meng, X.; Liu, C.; Ma, L.; Xu, W.; Cheng, X. Experimental Investigation of the Size Effect of Rock under Impact Load. Minerals 2022, 13, 43. [Google Scholar] [CrossRef]
- Zhao, Y.; Mishra, B.; Shi, Q.; Zhao, G. A Size-Dependent Bonded-Particle Model for Transversely Isotropic Rock and its Application in Studying the Size Effect of Shale. Geotech. Geol. Eng. 2022, 40, 5437–5453. [Google Scholar] [CrossRef]
- Kun, Q. Pillar Design Based on Sandstone Pillar Strength Characteristics and Failure Mechanism. Ph.D. Dissertation, China University of Mining and Technology, Beijing, China, 2015. [Google Scholar]
- Ohtsu, M. Acoustic emission theory for moment tensor analysis. Res. Nondestruct. Valuat. 1995, 6, 169–184. [Google Scholar] [CrossRef]
- Chang, S.H.; Lee, C.I. Estimation of cracking and damage mechanisms in rock under triaxial compression by moment tensor analysis of acoustic emission. Int. J. Rock Mech. Min. Sci. 2004, 41, 1069–1086. [Google Scholar] [CrossRef]
- Jansen, D.P.; Carlson, S.R.; Young, R.P.; Hutchins, D.A. Ultrasonic imaging, and acoustic emission monitoring of thermally induced microcracks in Lac du Bonnet granite. J. Geophys. Res. Solid Earth 1993, 98, 22231. [Google Scholar] [CrossRef]
- Du, K.; Su, R.; Tao, M.; Yang, C.; Momeni, A.; Wang, S. Specimen shape and cross-section effects on the mechanical properties of rocks under uniaxial compressive stress. Bull. Eng. Geol. Environ. 2019, 78, 6061–6074. [Google Scholar] [CrossRef]
- Komurlu, E. Loading rate conditions and specimen size effect on strength and deformability of rock materials under uniaxial compression. Int. J. Geo-Eng. 2018, 9, 1–11. [Google Scholar] [CrossRef]
- Daraei, A.; Sharifi, F.; Qader, D.N.; Hama Ali, H.F.; Kolivand, F. Prediction of the static elastic modulus of limestone using downhole seismic test in Asmari formation. Acta Geophys. 2023, 1–9. [Google Scholar] [CrossRef]
- Daraei, A.; Zare, S. Determination of critical saturation degree in rocks based on maximum loss of uniaxial compression strength and deformation modulus. Geomech. Geophys. Geo-Energy Geo-Resour. 2018, 4, 343–353. [Google Scholar] [CrossRef]
- Su, H.J.; Jing, H.W.; Mao, X.B.; Zhao, H.H.; Yin, Q.; Wang, C. Size effect of sandstone after high temperature under uniaxial compression. J. Cent. South Univ. 2015, 22, 1901–1908. [Google Scholar] [CrossRef]
- Wang, Q.; Chen, J.; Guo, J.; Luo, Y.; Wang, H.; Liu, Q. Acoustic emission characteristics and energy mechanism in karst limestone failure under uniaxial and triaxial compression. Bull. Eng. Geol. Environ. 2019, 78, 1427–1442. [Google Scholar] [CrossRef]
- Gong, F.; Yan, J.; Li, X. Criteria for rockburst tendency based on linear energy storage law and residual elastic energy index. Chin. J. Rock Mech. Eng. 2018, 37, 1993–2014. [Google Scholar]
- Wang, J.; Zuo, T.; Li, X.; Tao, Z.; Ma, J. Study on the fractal characteristics of the pomegranate biotite schist under impact loading. Geofluids 2021, 2021, 1570160. [Google Scholar] [CrossRef]
- Zhang, Z.; Qian, Q.; Wang, H.; Huang, Y.; Wang, J.; Liu, H. Study on the dynamic mechanical properties of metamorphic limestone under impact loading. Lithosphere 2021, 2021, 8403502. [Google Scholar] [CrossRef]
- Zuo, T.; Zhao, Z.; Wang, J.; Li, X.; Tao, Z.; Yang, C. Analysis of dynamic damage fractal and energy consumption characteristics of dolomite marble. Shock Vib. 2022, 2022, 9440222. [Google Scholar] [CrossRef]
- Wang, H.; Zhang, C.; Jiang, J.; Huang, W.; Guo, D.; Sheng, T. Vibration characteristics and isolation in vibration-sensitive areas under moving vehicle load. Soil Dyn. Earthq. Eng. 2022, 153, 107077. [Google Scholar] [CrossRef]
- Honglu, F.; Xiaohe, X.; Chunan, T. Application of catastrophe theory on unstable failure of rock and experimental verification. China Mining Magazine, 1995. [Google Scholar]
- Li, Y. Numerical simulation of rock sample fracture process based on multifractal theory. J. Liaoning Univ. Sci. Technol. 2016, 39, 76–80. [Google Scholar]
- Jia, G.; Kang, L. Study on the stability of coal pillars for roadway protection in fully mechanized caving mining. Chin. J. Coal 2002, 1, 6–10. [Google Scholar]
- Zhang, P. Simulation study on size effect of large-section rectangular roadway. Coal Technol. 2018, 37, 119–122. [Google Scholar] [CrossRef]
- You, M.; Hua, A. The failure mode and bearing capacity reduction of rock samples under uniaxial compression. Chin. J. Rock Mech. Eng. 1998, 3, 292–296. [Google Scholar]
- Guo, Y.; Zhao, Y.; Feng, G.; Ran, H.; Zhang, Y. Study on the damage size effect of gangue cemented backfill under uniaxial compression damage. Chin. J. Rock Mech. Eng. 2021, 40, 2434–2444. [Google Scholar]
- Wang, L.; Xiong, Z.; Su, C. Analysis of Size Effect and Failure Characteristics of Modified High-Water Filling Pillar Materials. Coal Sci. Technol. 2021, 49. [Google Scholar]
- Fu, W. Experimental study on size effect of uniaxial compressive strength of rocks with different aspect ratios. Resour. Environ. Eng. 2019, 33, 232–234. [Google Scholar]
- Han, S. Research on Scale Effect and Slenderness Ratio Effect of Rock Mass Characteristics. Ph.D. Dissertation, Taiyuan University of Technology, Taiyuan, China, 2007. [Google Scholar]
- Xiong, Q.; Lin, Q.; Hampton, J.C. Temporal evolution of a shear-type rock fracture process zone (FPZ) along continuous, sequential and spontaneously well-separated laboratory instabilities—From intact rock to thick gouged fault. Geophys. J. Int. 2021, 226, 351–367. [Google Scholar] [CrossRef]
- Zhang, H.; Sun, Q.; Ge, Z. Analysis of the characteristics of magnetic properties change in the rock failure process. Acta Geophys. 2020, 68, 289–302. [Google Scholar] [CrossRef]
Figure 1.
Microcomputer-Controlled Electro-hydraulic Servo Testing Machine.
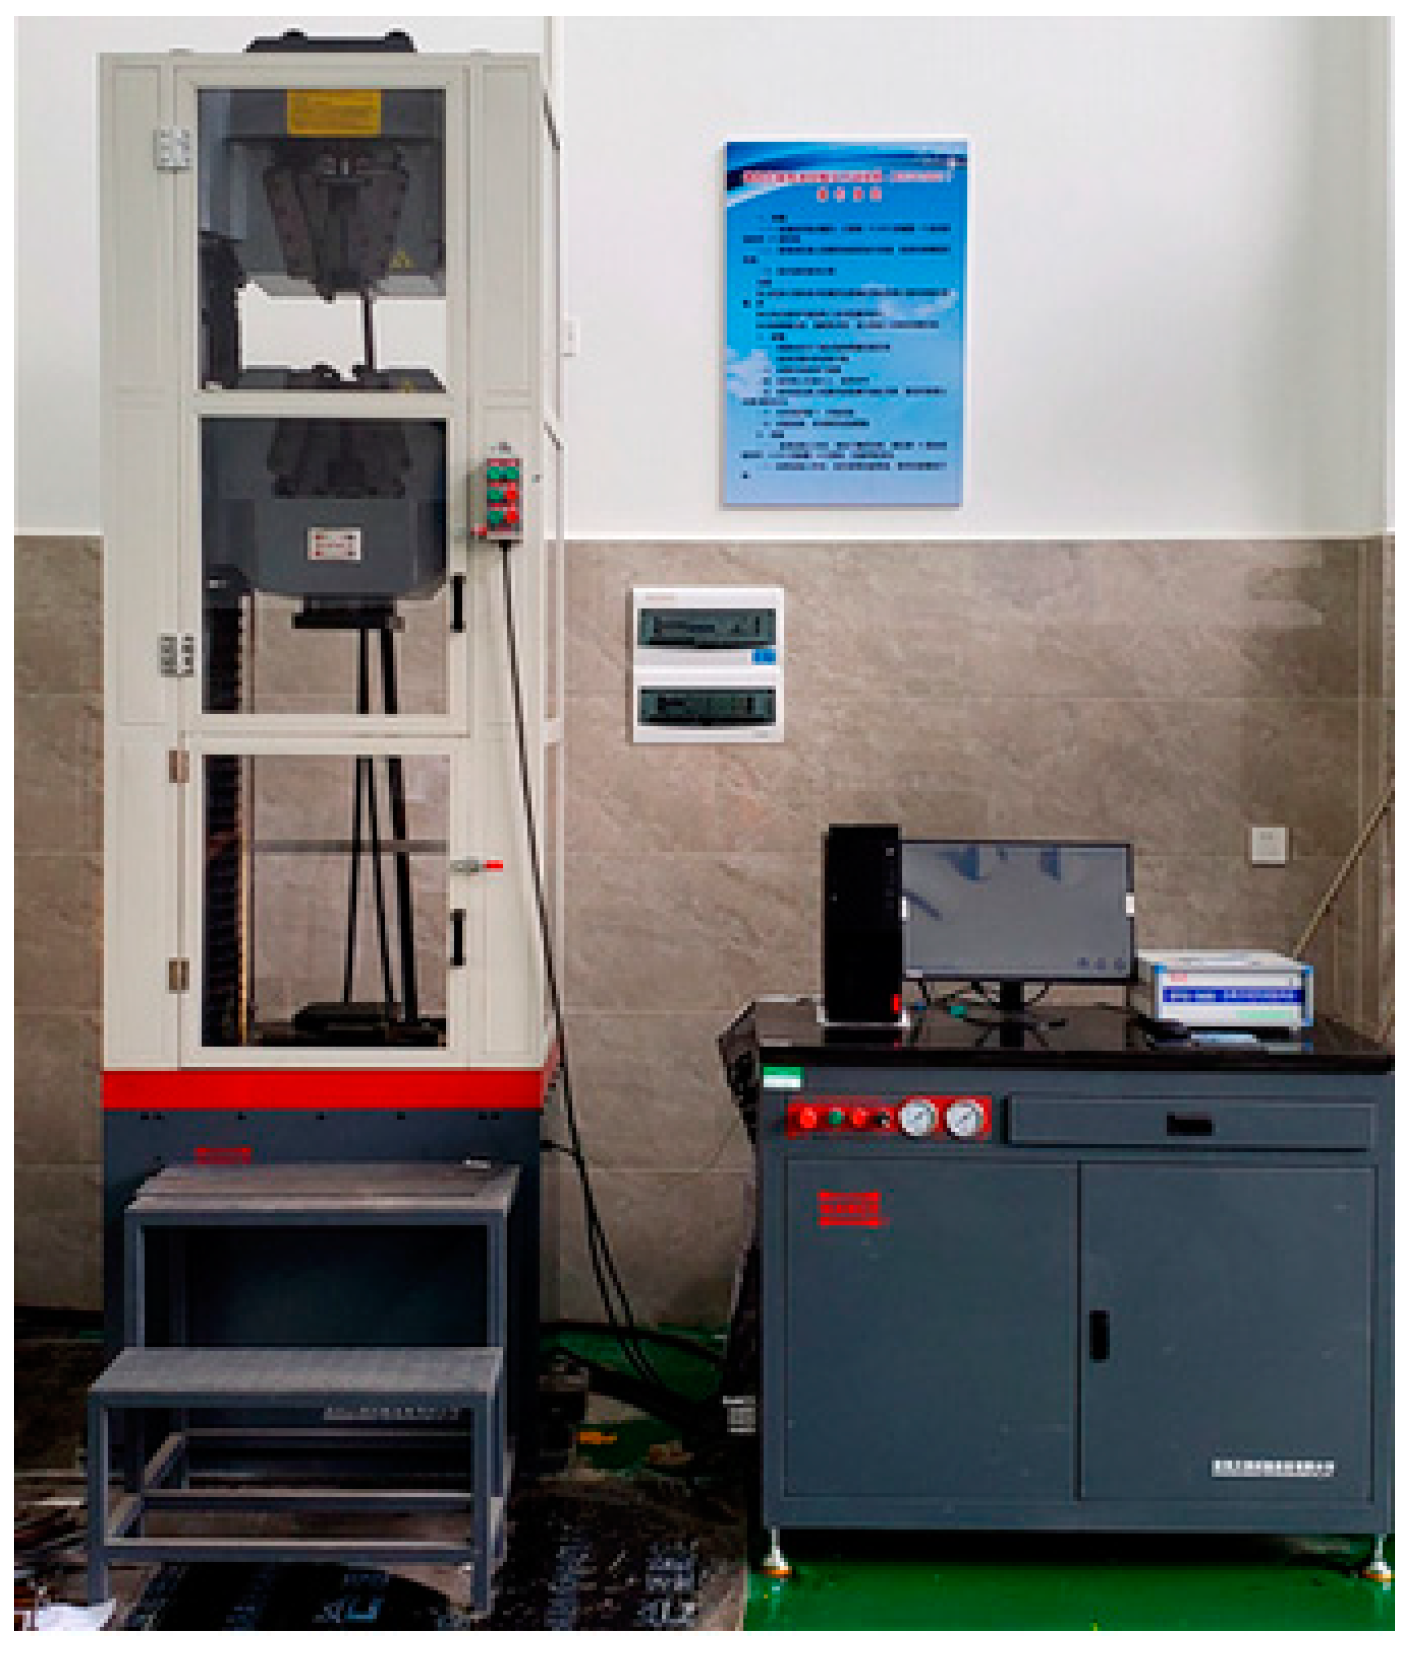
Figure 2.
Processing and physical map of test pieces.

Figure 3.
Fractured forms of specimens.
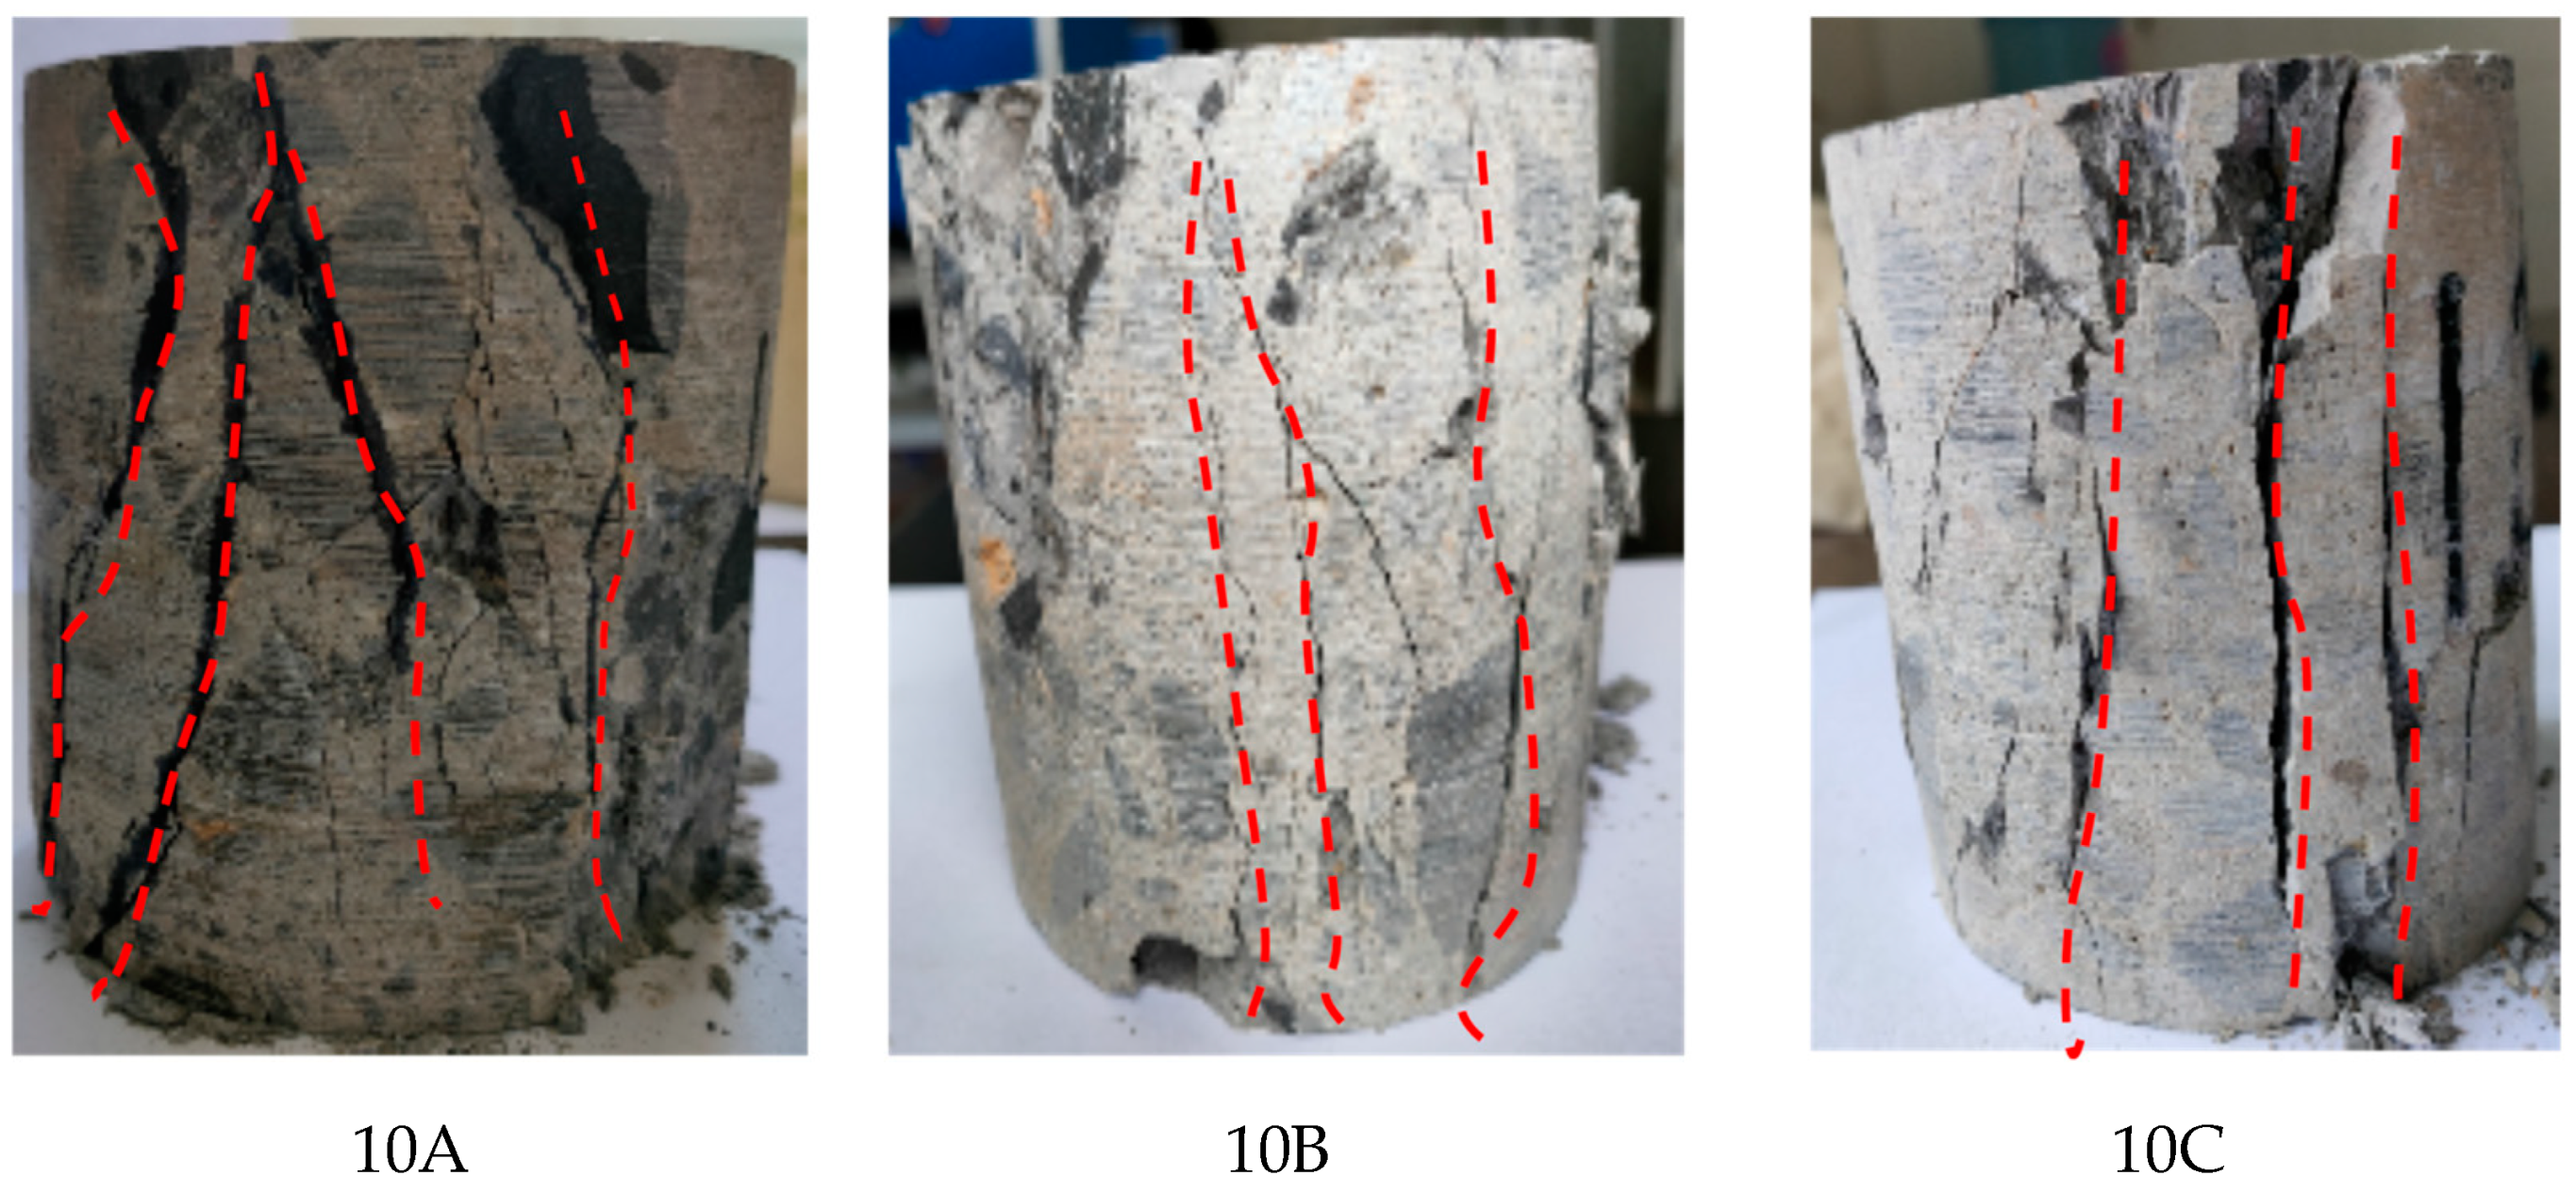
Figure 4.
Typical stress–strain curve.
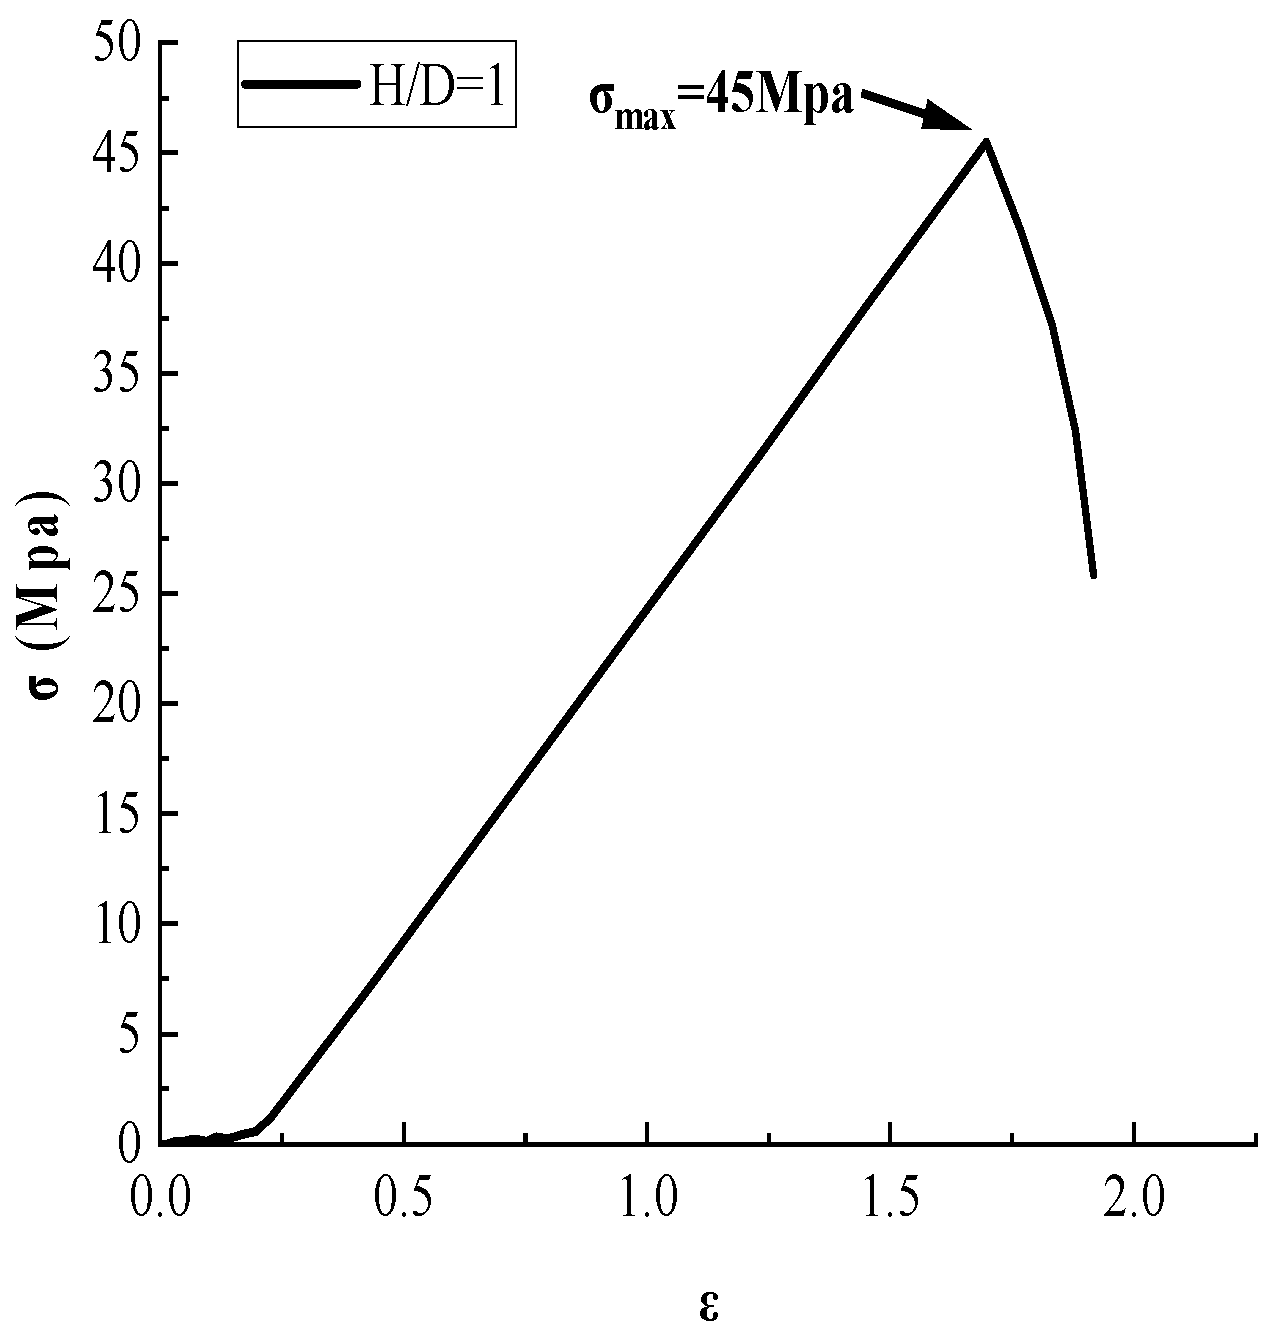
Figure 5.
Fractured forms of specimens.
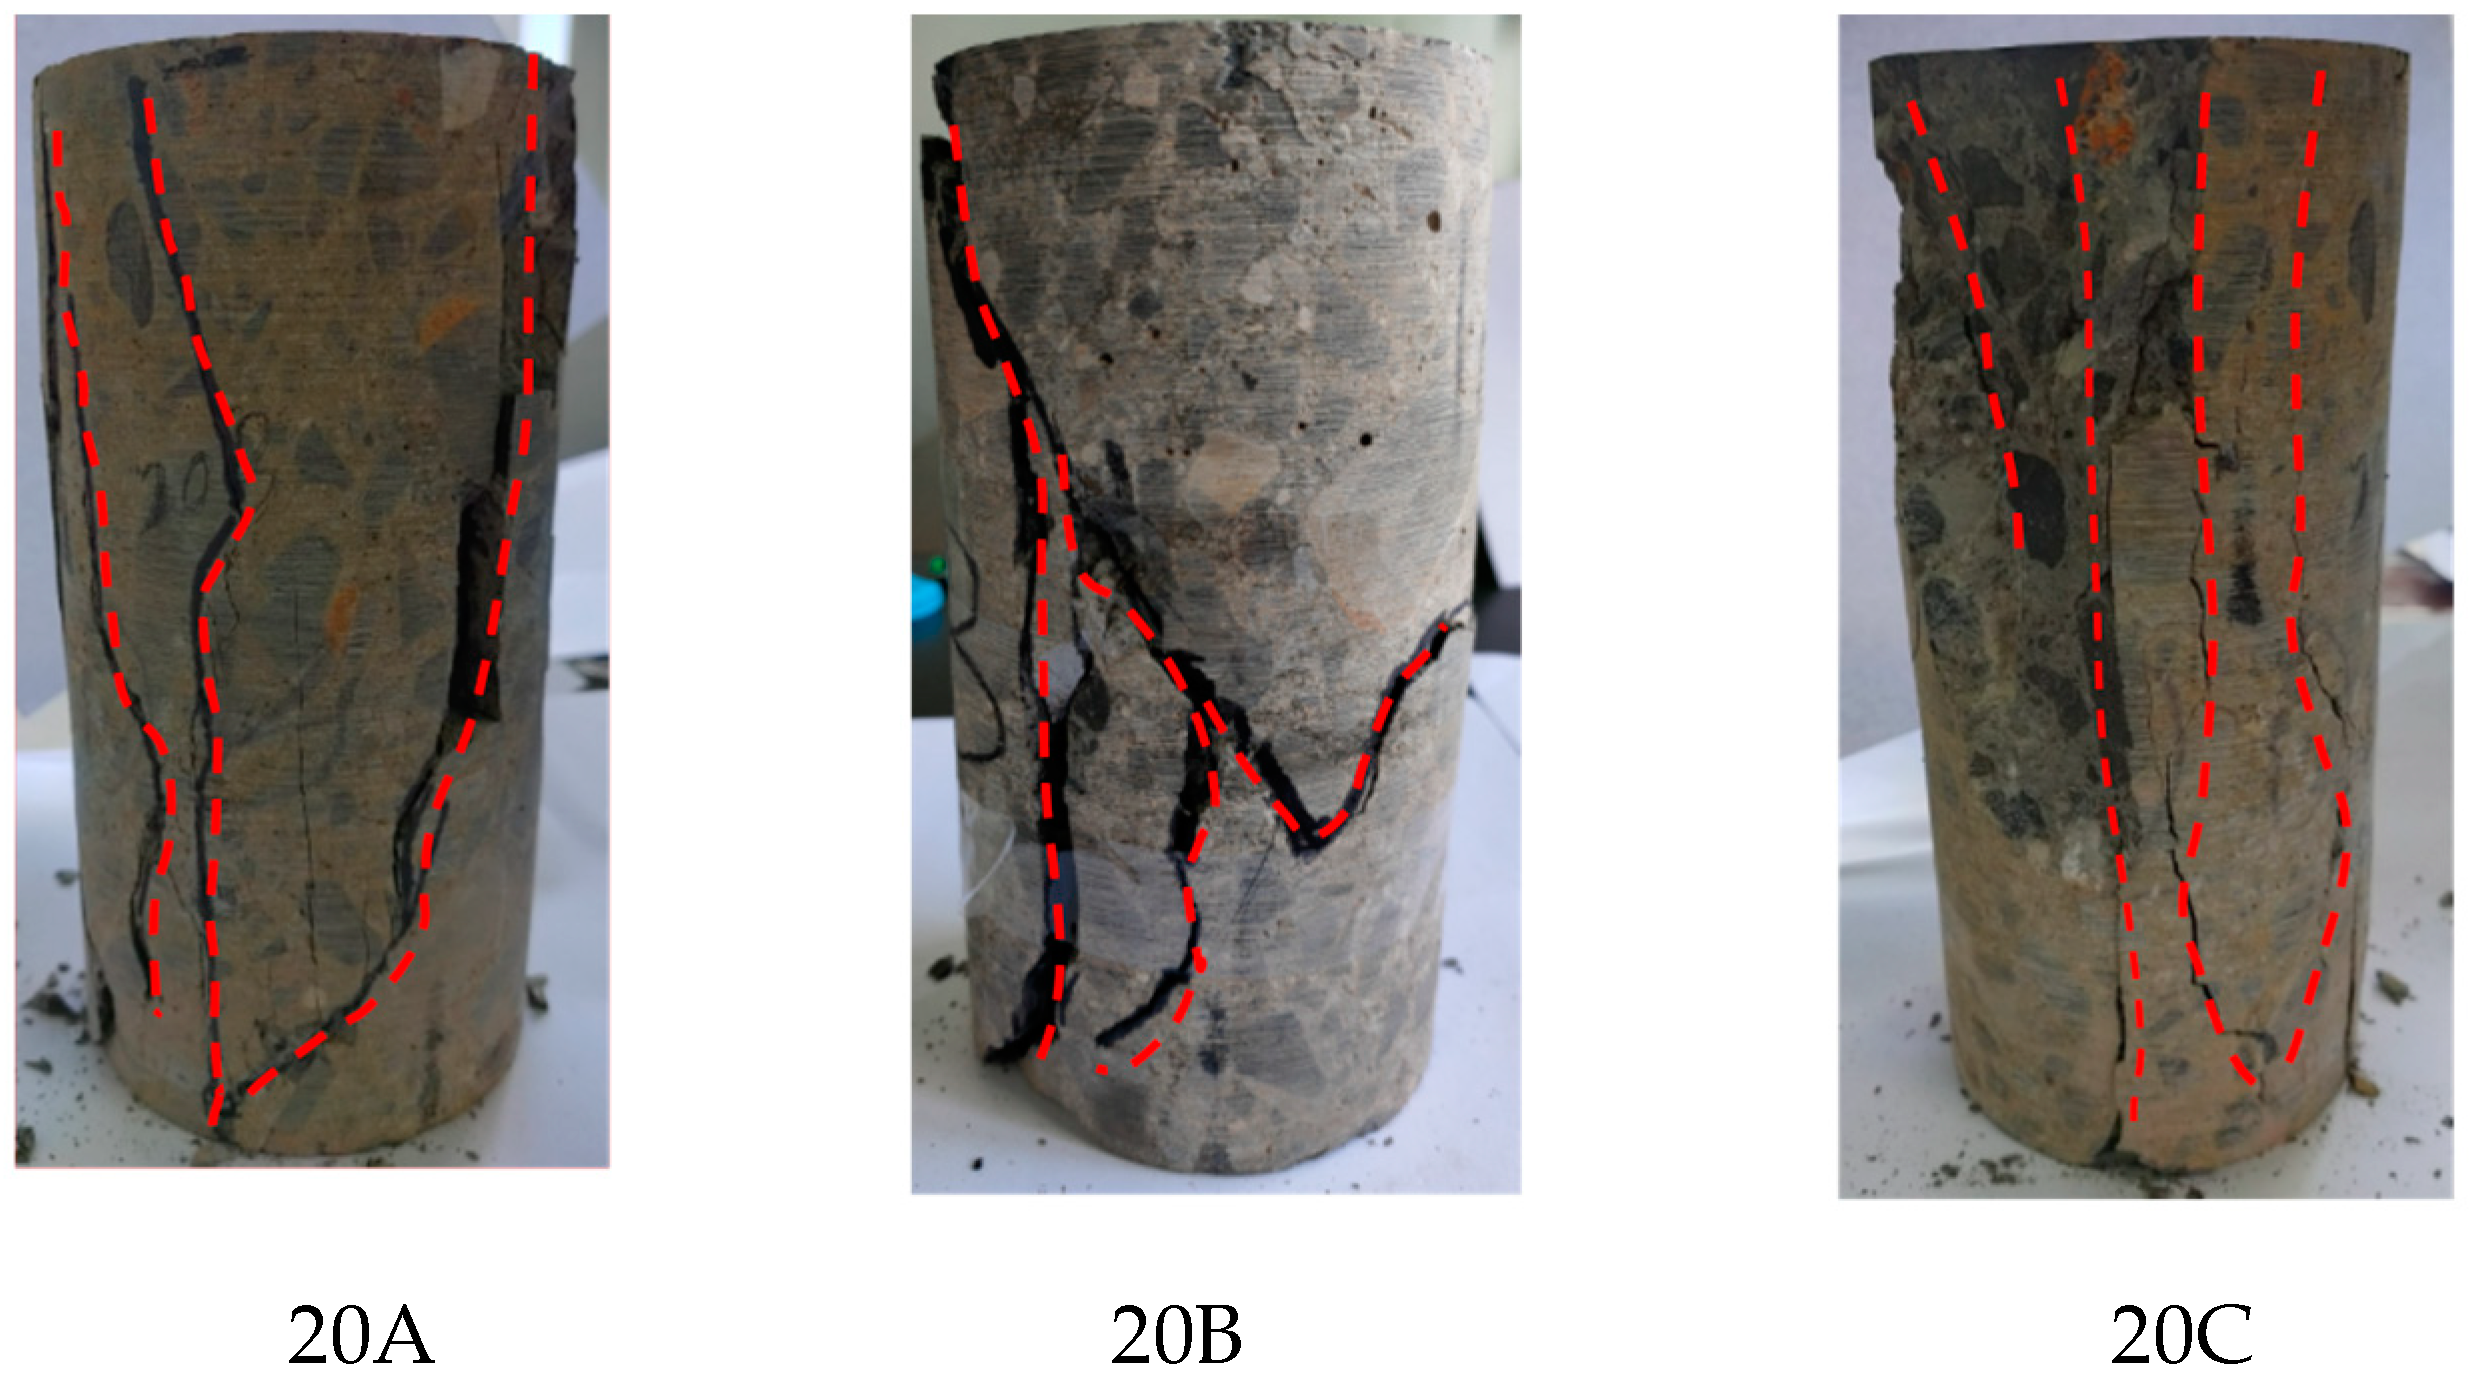
Figure 6.
Typical stress–strain curve.

Figure 7.
Fractured forms of specimens.
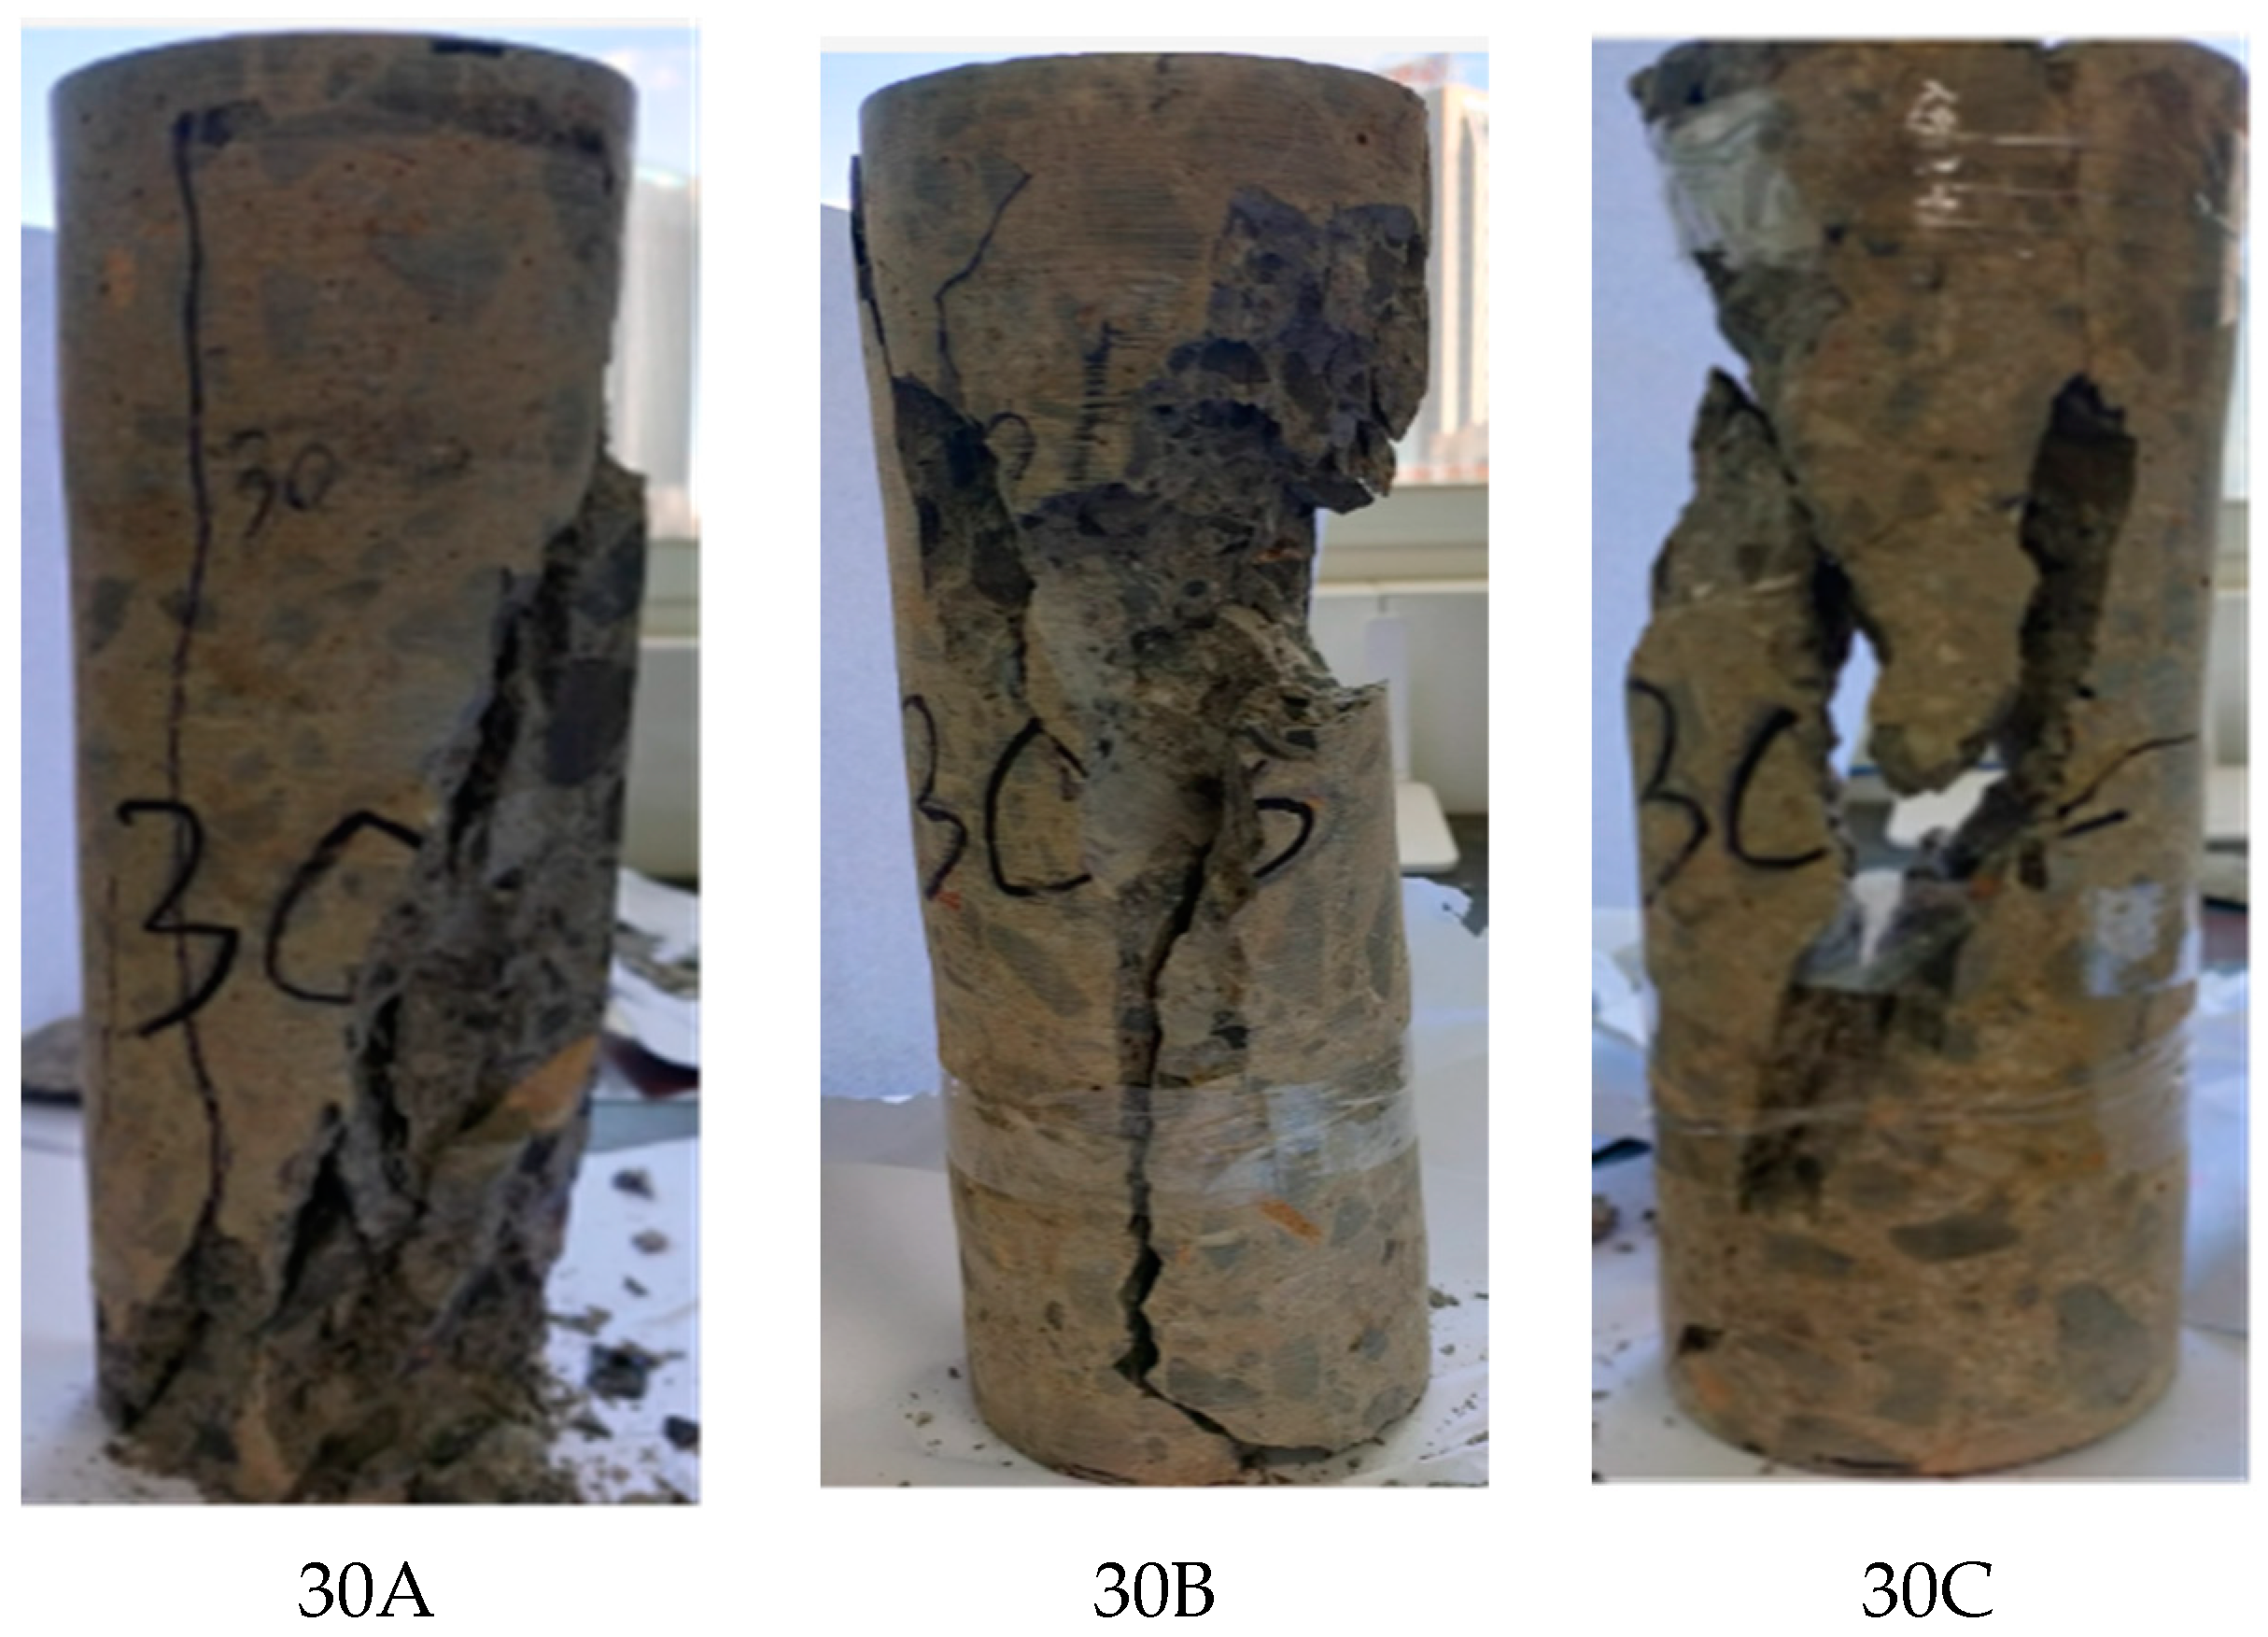
Figure 8.
Typical stress–strain curve.
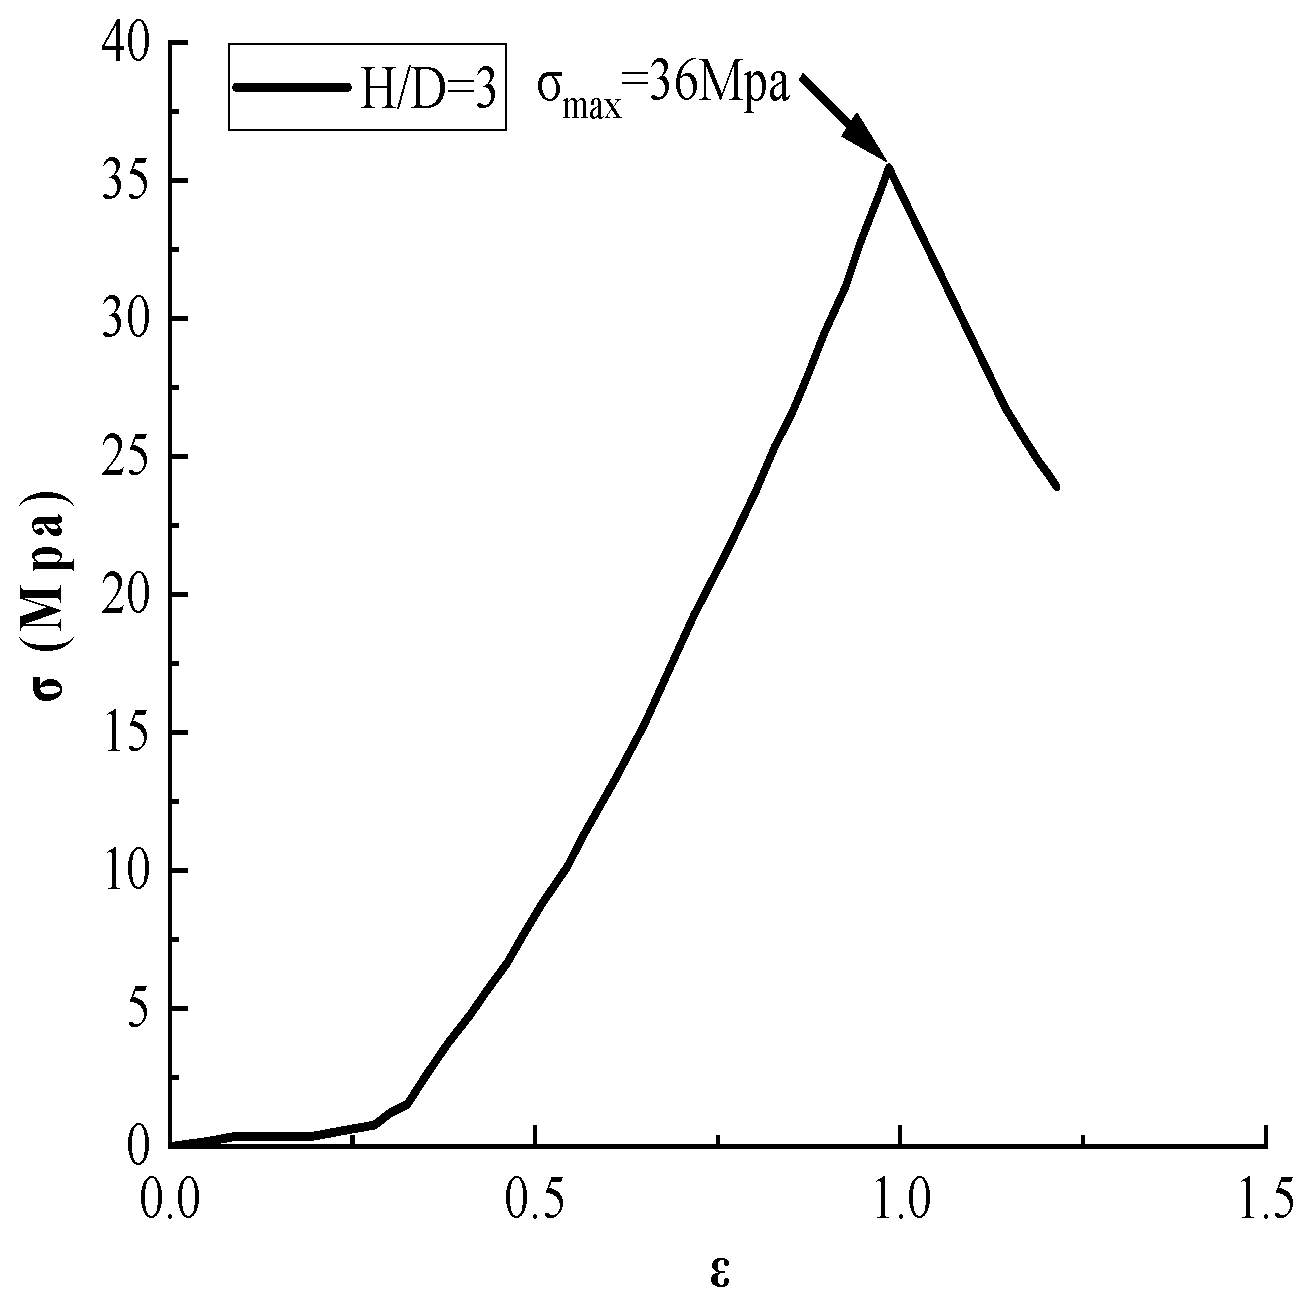
Figure 9.
Relationship between the mean value of compressive strength and the height-to-diameter ratio.
Figure 9.
Relationship between the mean value of compressive strength and the height-to-diameter ratio.

Figure 10.
Relationship between the mean value of the elastic modulus and the height-to-diameter ratio.
Figure 10.
Relationship between the mean value of the elastic modulus and the height-to-diameter ratio.

Figure 11.
RFPA3D calculation program flow.
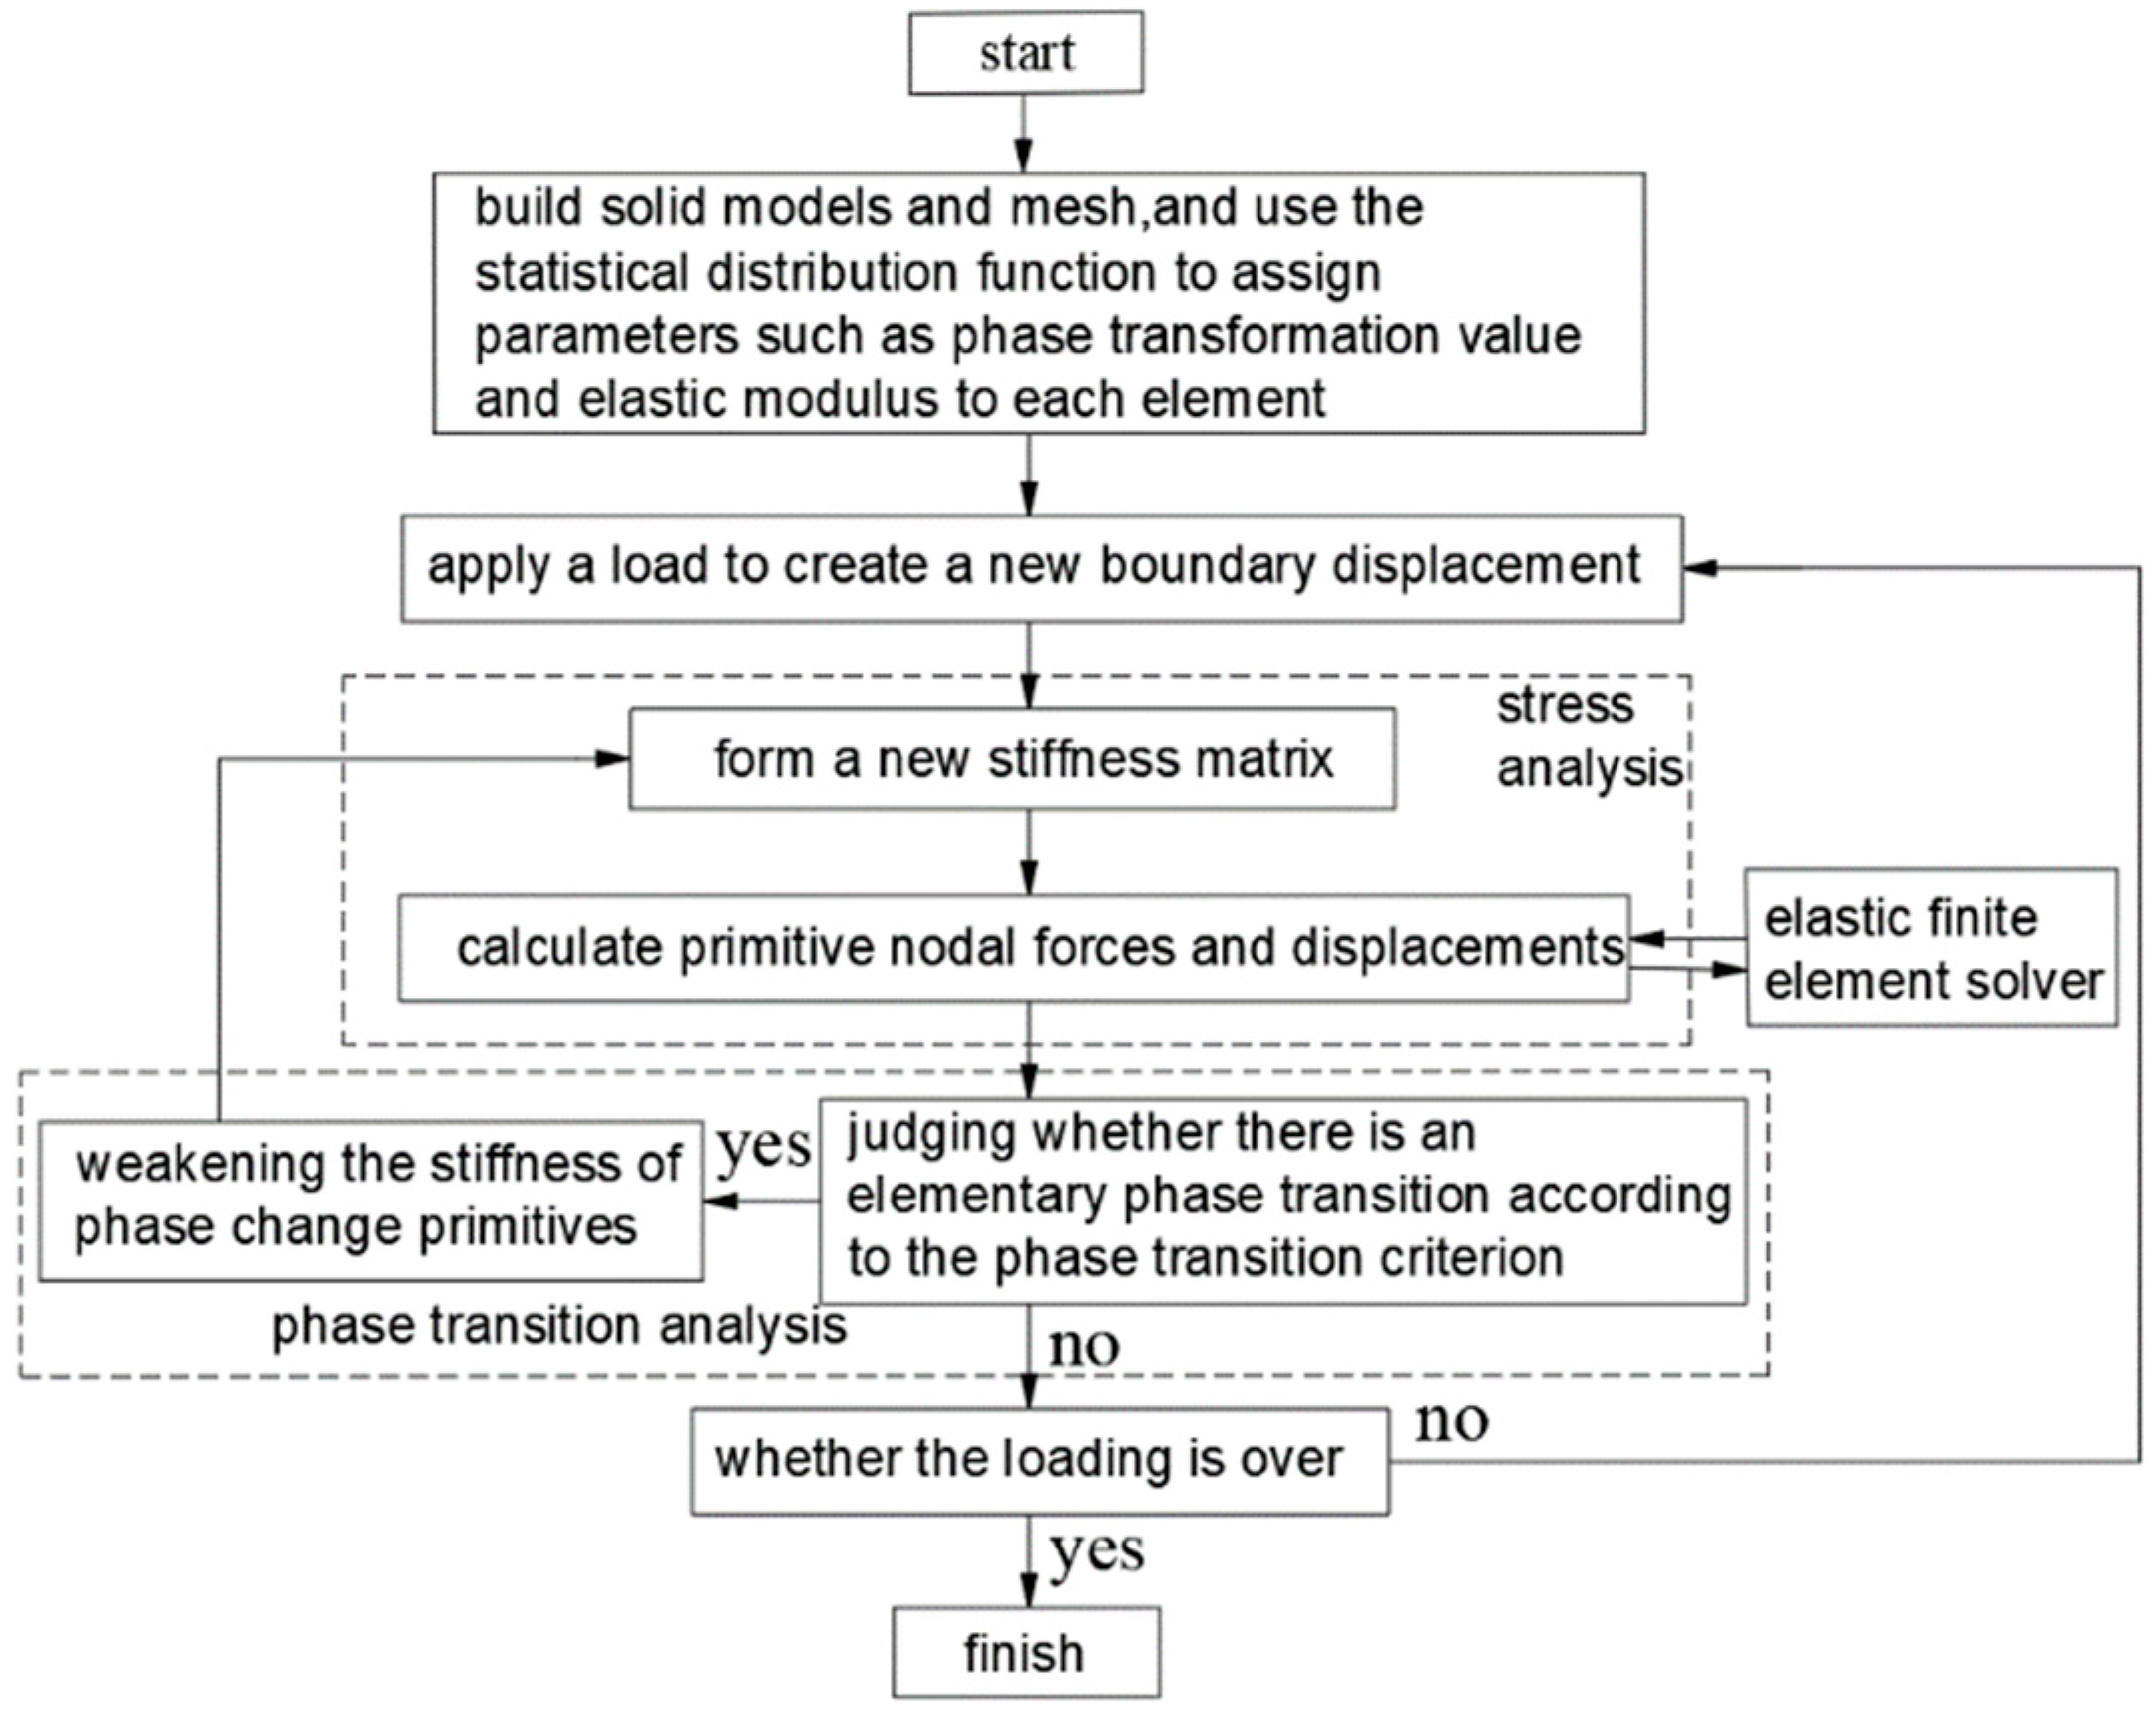
Figure 12.
Initial models.

Figure 13.
Fracture process of the specimen with a height-to-diameter ratio of 1:1.
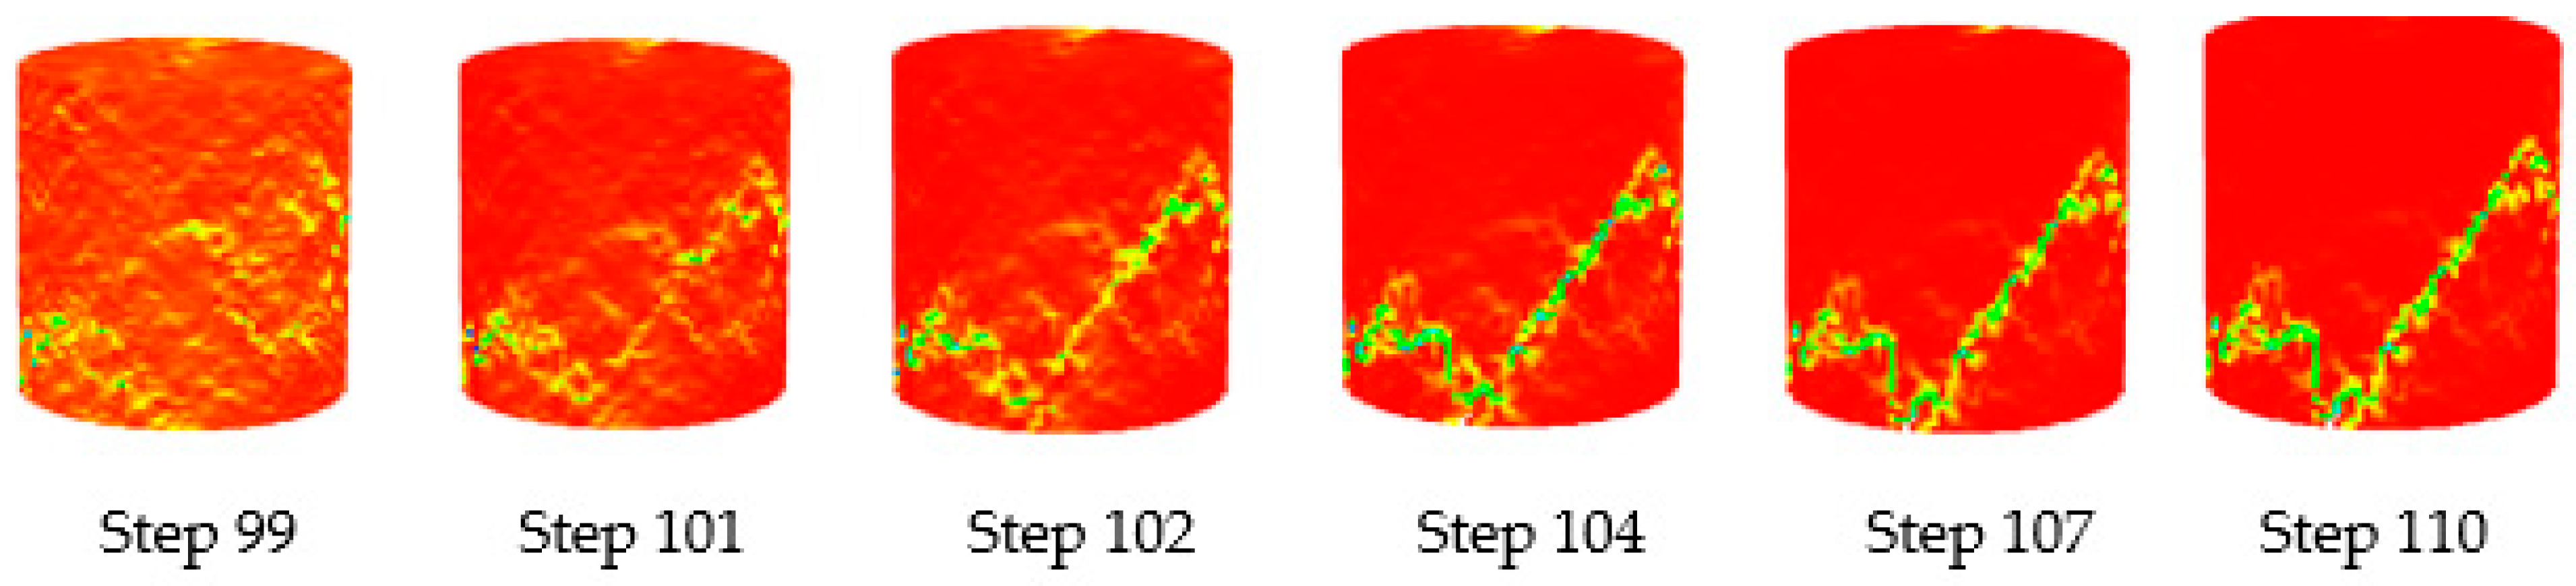
Figure 14.
Fracture process of the specimen with a height-to-diameter ratio of 2:1.

Figure 15.
Fracture process of the specimen with a height-to-diameter ratio of 3:1.
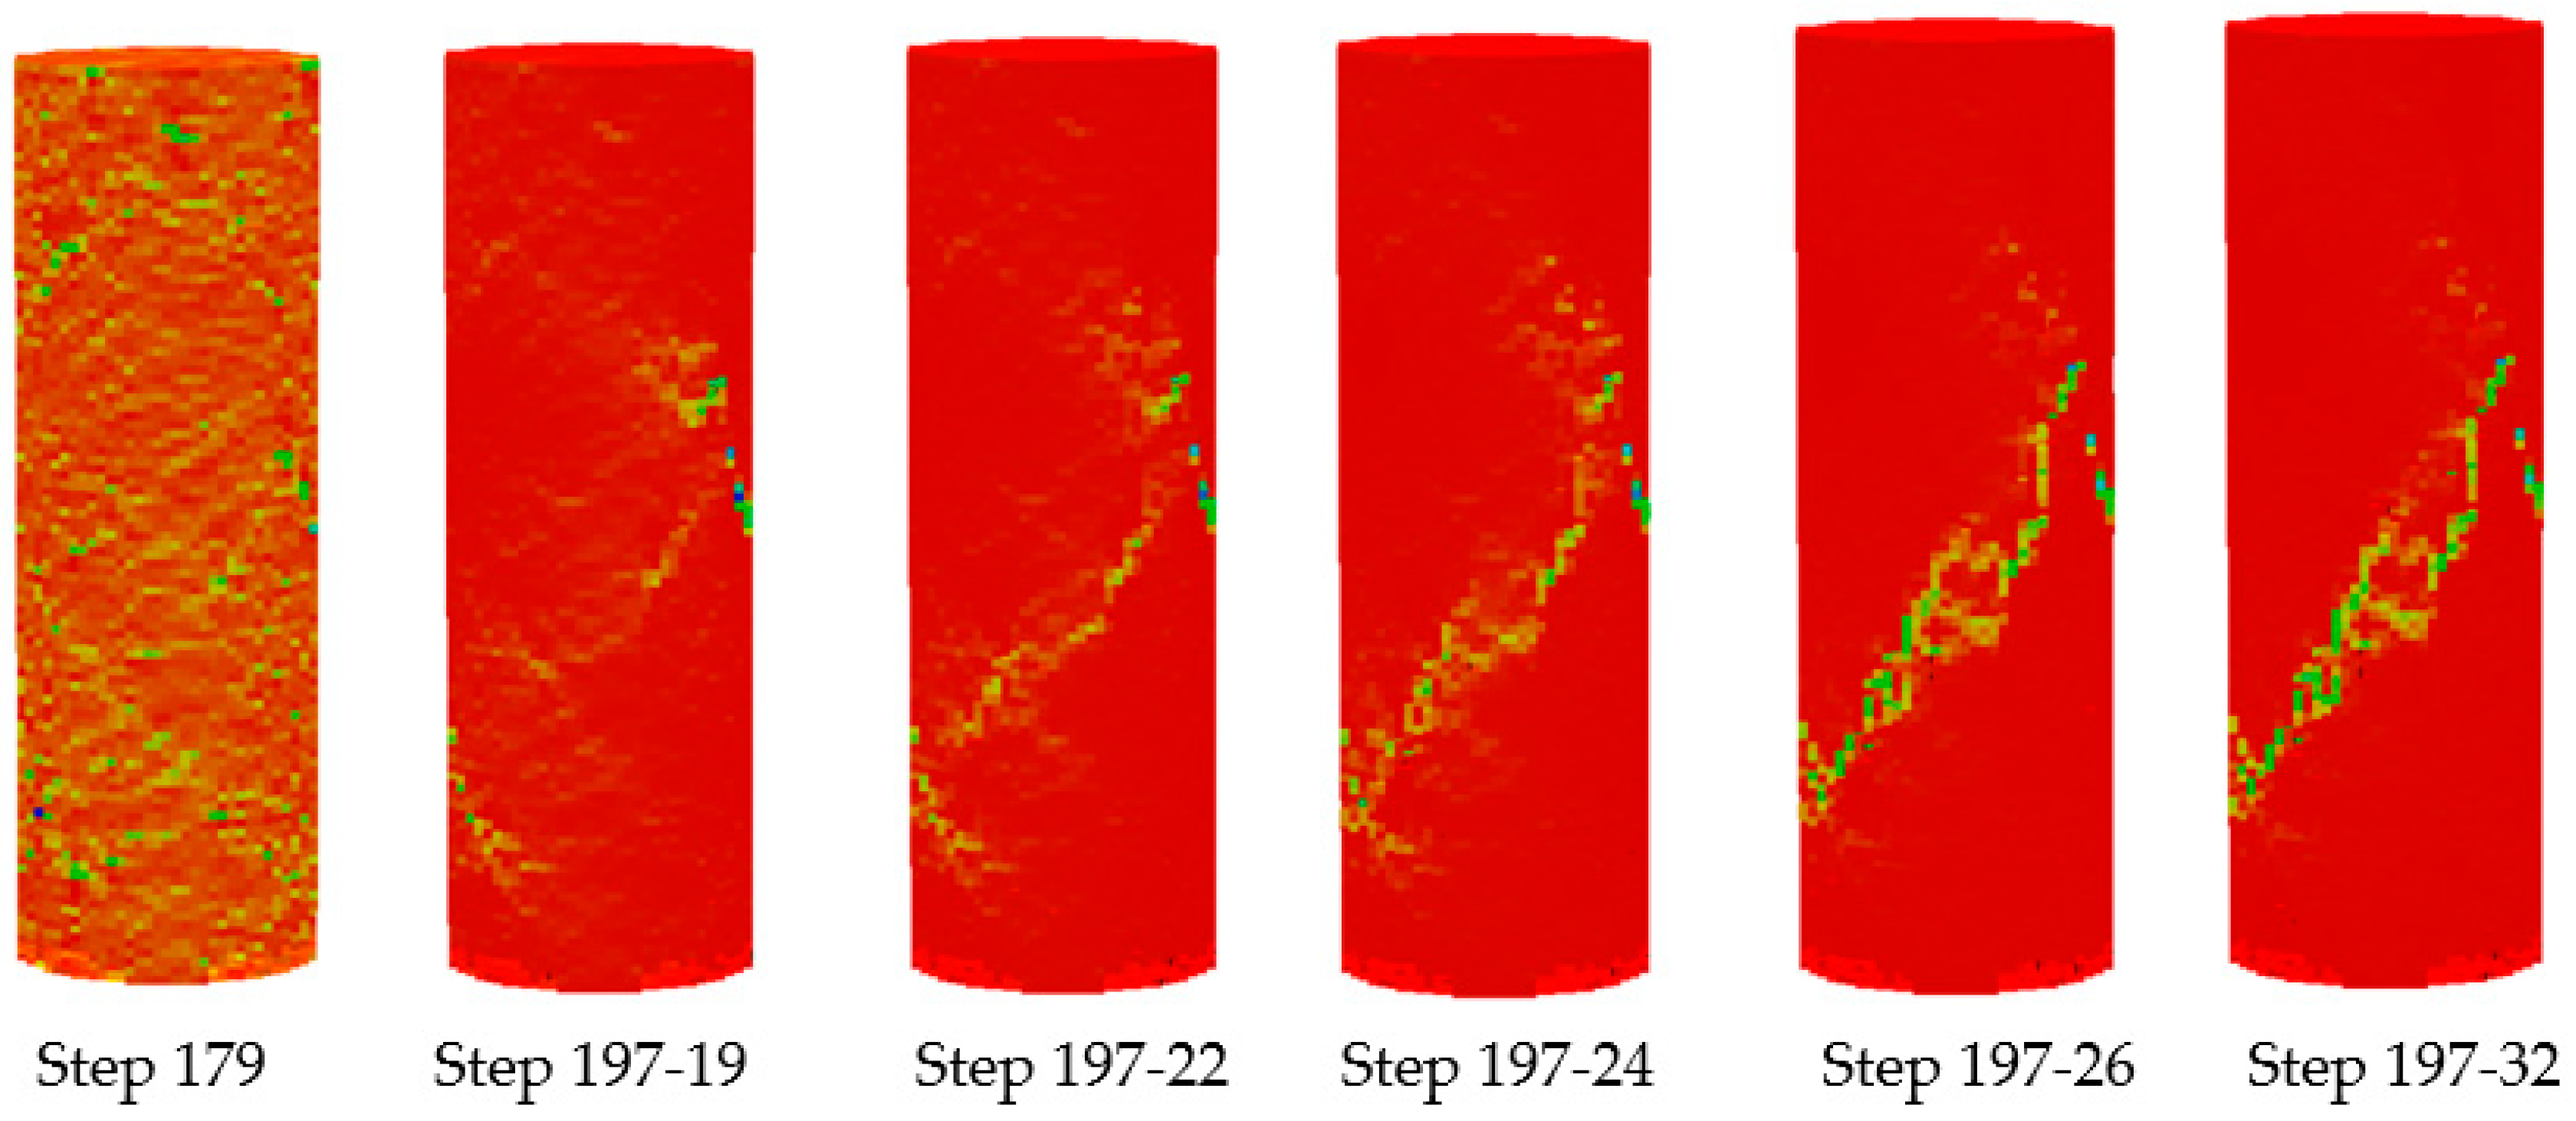
Figure 16.
Stress–strain of specimens with different sizes.
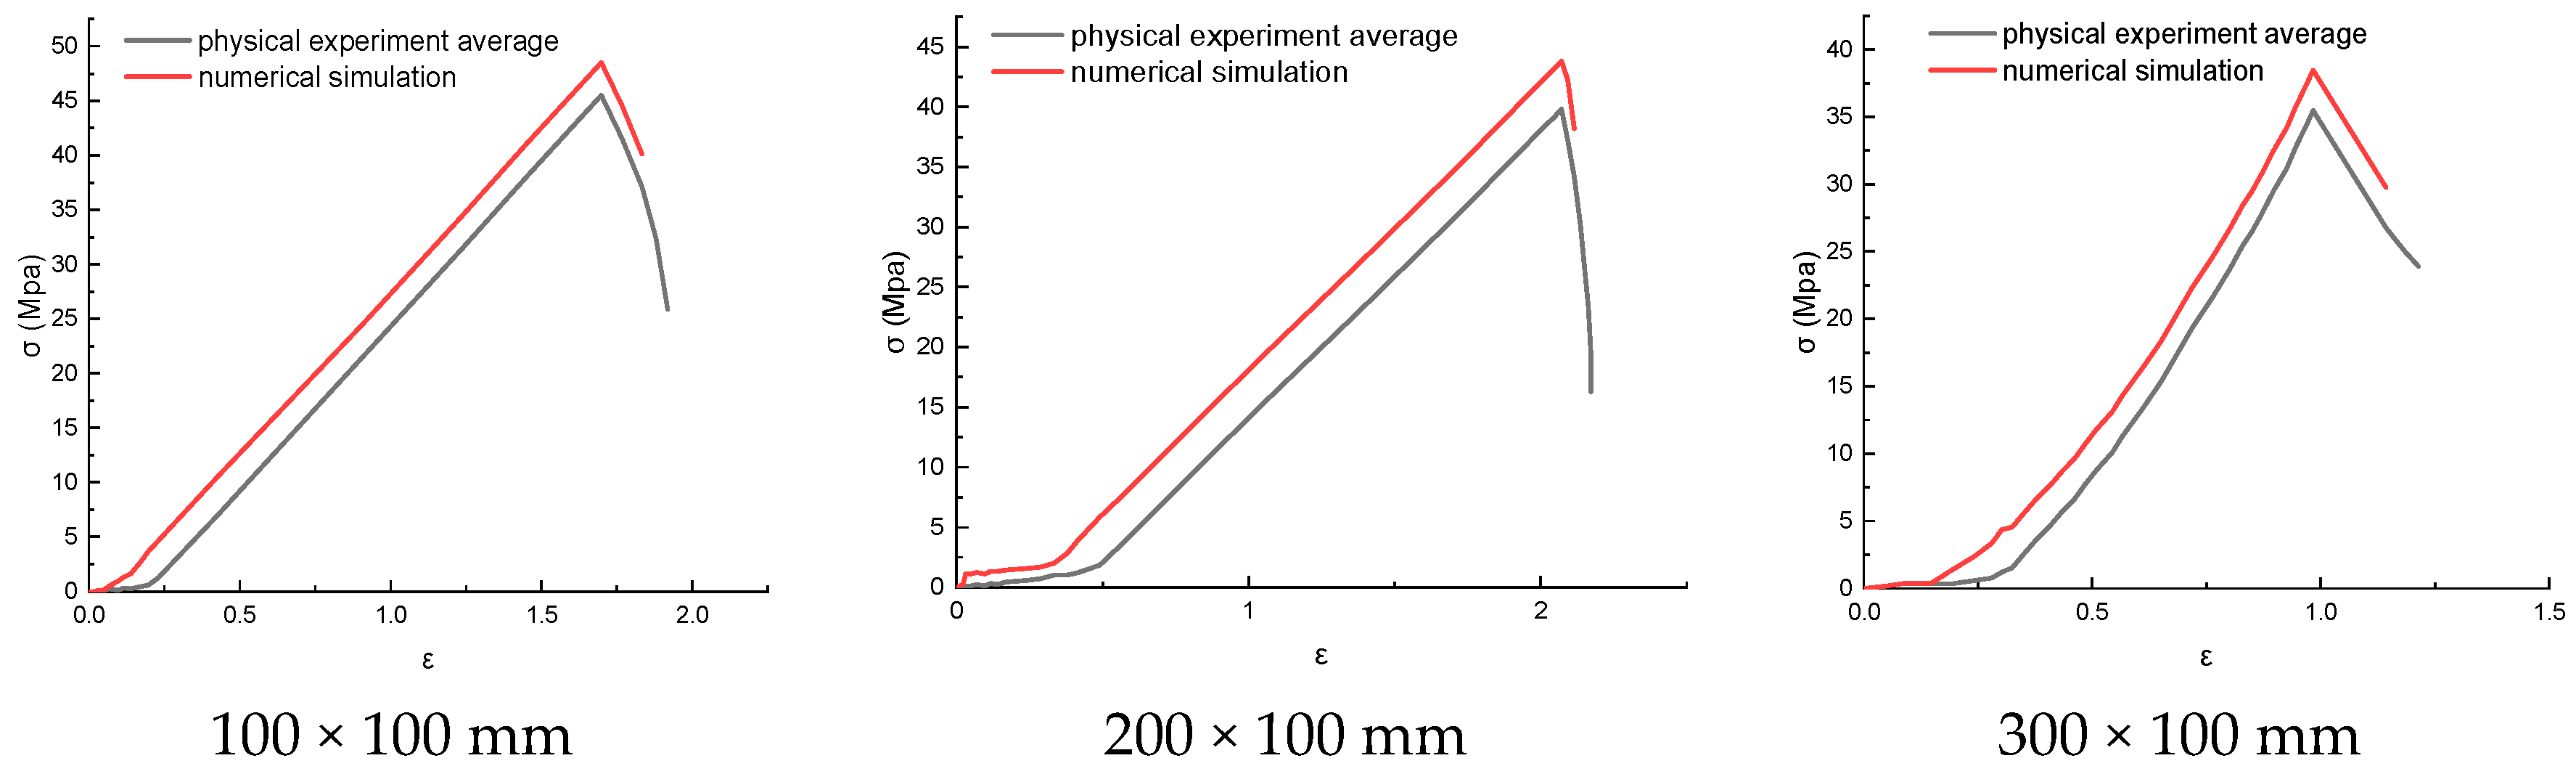
Figure 17.
CoMParison of failure modes in the laboratory tests and simulations for different height-to-diameter ratios.
Figure 17.
CoMParison of failure modes in the laboratory tests and simulations for different height-to-diameter ratios.
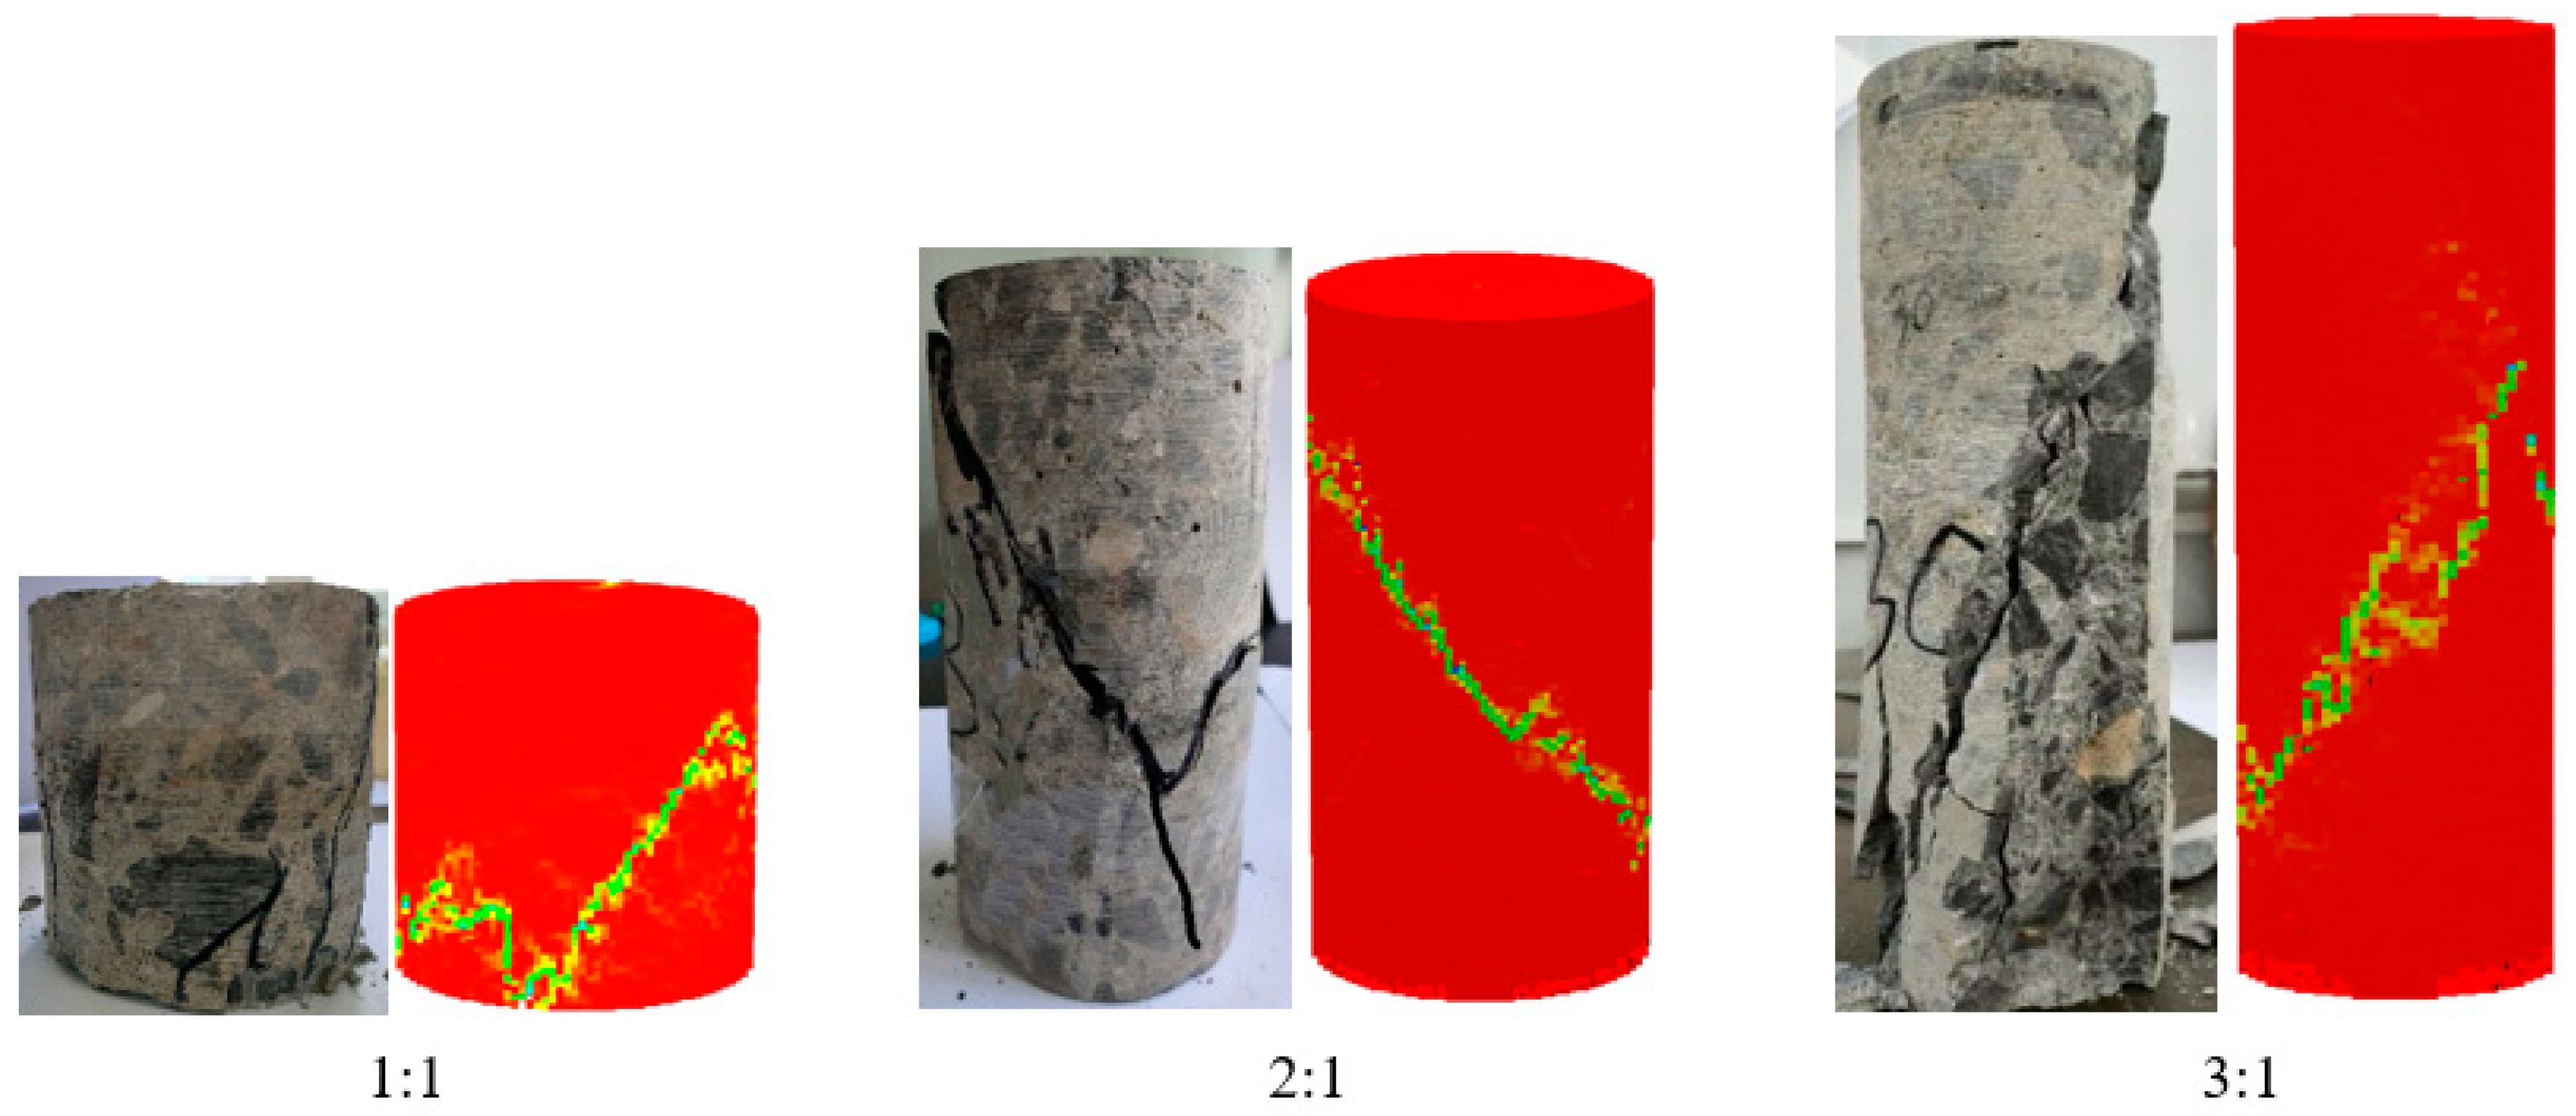
Figure 18.
Relationship between the peak strength and height-to-diameter ratio of the specimens.
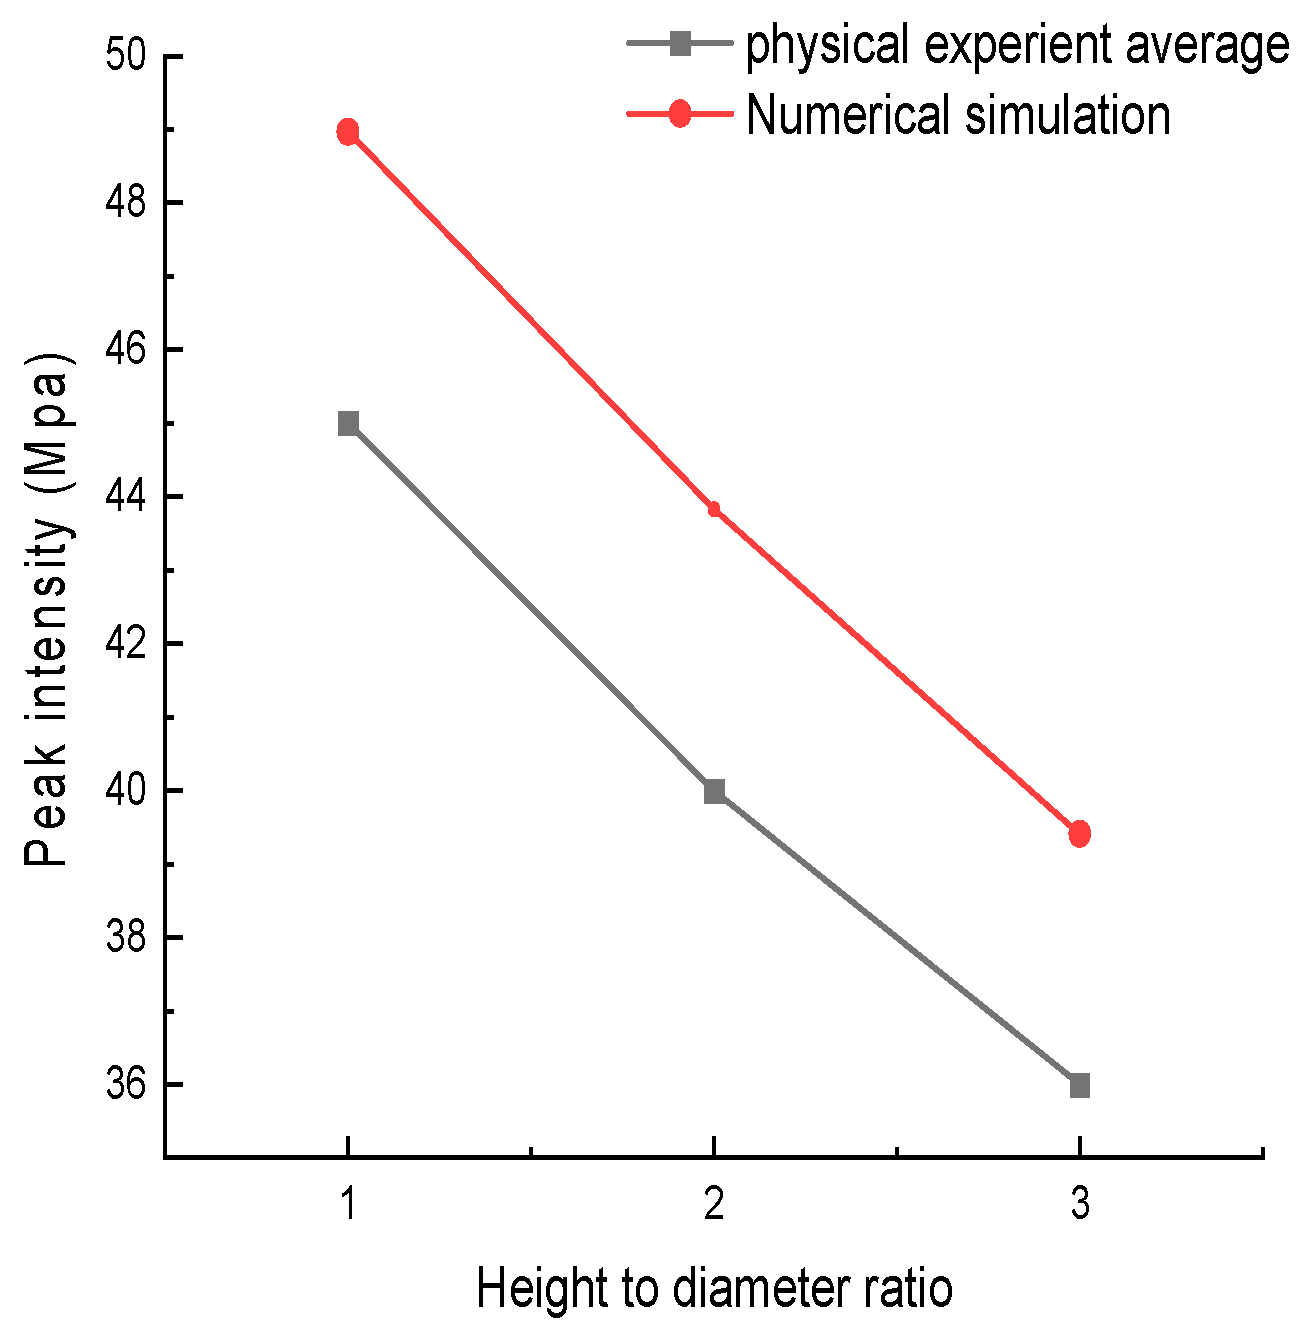
Figure 19.
Change in the number of acoustic emissions with the number of steps.

Table 1.
Specimen sizes and numbers.
| Height-to-Diameter Ratio H/D | Numbering | H (mm) | D (mm) | Actual Aspect Ratio H/D |
|---|---|---|---|---|
| 1 | 10A | 100.1 | 99.8 | 1.0 |
| 10B | 100.2 | 99.8 | 1.0 | |
| 10C | 100.2 | 99.8 | 1.0 | |
| 2 | 20A | 200.2 | 99.8 | 2.0 |
| 20B | 200.3 | 99.8 | 2.0 | |
| 20C | 200.2 | 99.8 | 2.0 | |
| 3 | 30A | 300.1 | 99.8 | 3.0 |
| 30B | 300.3 | 99.8 | 3.0 | |
| 30C | 300.2 | 99.8 | 3.0 |
Table 2.
Compressive strength of each test specimen.
| Numbering | Elastic Modulus (Gpa) | Compressive Strength (MPa) | Average Strength (MPa) |
|---|---|---|---|
| 10A | 29.7 | 45.3 | 45.0 |
| 10B | 29.8 | 47.5 | |
| 10C | 29.9 | 42.2 | |
| 20A | 24.6 | 43.5 | 40.0 |
| 20B | 25.4 | 39.8 | |
| 20C | 25.0 | 36.7 | |
| 30A | 20.7 | 34.6 | 36.0 |
| 30B | 21.4 | 38.4 | |
| 30C | 20.9 | 35.0 |
Disclaimer/Publisher’s Note: The statements, opinions and data contained in all publications are solely those of the individual author(s) and contributor(s) and not of MDPI and/or the editor(s). MDPI and/or the editor(s) disclaim responsibility for any injury to people or property resulting from any ideas, methods, instructions or products referred to in the content. |
© 2023 by the authors. Licensee MDPI, Basel, Switzerland. This article is an open access article distributed under the terms and conditions of the Creative Commons Attribution (CC BY) license (https://creativecommons.org/licenses/by/4.0/).
Share and Cite
MDPI and ACS Style
Zhang, C.; Li, M.; Yan, X.; Deng, T.; Zhang, J. Fracture Process and Failure Characteristics of Sandstone with Different Height-to-Diameter Ratios. Processes 2023, 11, 3069. https://doi.org/10.3390/pr11113069
AMA Style
Zhang C, Li M, Yan X, Deng T, Zhang J. Fracture Process and Failure Characteristics of Sandstone with Different Height-to-Diameter Ratios. Processes. 2023; 11(11):3069. https://doi.org/10.3390/pr11113069
Chicago/Turabian StyleZhang, Chengliang, Mingjian Li, Xiang Yan, Tao Deng, and Jinrui Zhang. 2023. "Fracture Process and Failure Characteristics of Sandstone with Different Height-to-Diameter Ratios" Processes 11, no. 11: 3069. https://doi.org/10.3390/pr11113069
Note that from the first issue of 2016, this journal uses article numbers instead of page numbers. See further details here.