

Multi-Objective Disassembly Sequence Planning in Uncertain Industrial Settings: An Enhanced Water Wave Optimization Algorithm


1
China Energy JiangSu Power Co., Ltd., Nanjing 210000, China
2
Mechanical and Electrical Engineering College, Northeast Forestry University, Harbin 150040, China
3
Department of Health Administration, College of Business Administration, King Saud University, Riyadh 11437, Saudi Arabia
*
Authors to whom correspondence should be addressed.
Processes 2023, 11(11), 3057; https://doi.org/10.3390/pr11113057
Submission received: 25 September 2023
/
Revised: 12 October 2023
/
Accepted: 20 October 2023
/
Published: 24 October 2023
(This article belongs to the Special Issue Motor Drive Systems: Control Technology, Fault Diagnosis and Fault Tolerance)
Abstract
:Disassembly plays a pivotal role in the maintenance of industrial equipment. However, the intricate nature of industrial machinery and the effects of wear and tear introduce inherent uncertainty into the disassembly process. The inadequacy in representing this uncertainty within equipment maintenance disassembly has posed an ongoing challenge in contemporary research. This study centers on disassembly sequence planning (DSP) in the context of industrial equipment maintenance, with a primary aim to mitigate the adverse effects of uncertainty. To effectively address this challenge, we introduce a multi-objective DSP problem and utilize triangular fuzzy numbers from fuzzy logic to manage uncertainty throughout the disassembly process. Our objectives encompass minimizing disassembly time, reducing tool changes and directional reversals, and improving responsiveness to emergency maintenance needs. Recognizing the complexities of this problem, we present an innovative multi-objective enhanced water wave optimization (EWWO) algorithm, integrating propagation, refraction, and breaking wave operators alongside novel local search strategies. Through rigorous validation with real-world industrial cases, we not only demonstrate the algorithm’s potential in solving disassembly maintenance challenges but also underscore its exceptional performance in producing high-quality and efficient solutions. In comparison to other algorithms, EWWO provides significant advantages in multi-objective evaluation metrics, including Hypervolume (HV), Spread, and CPU time. Moreover, the application of triangular fuzzy numbers offers a comprehensive evaluation of solutions, empowering decision makers to make informed choices in diverse scenarios. Our findings lead to the conclusion that this research provides substantial support for addressing uncertainty in the field of industrial equipment maintenance, with the potential to significantly enhance the efficiency and quality of disassembly maintenance processes.
1. Introduction
Industrial equipment maintenance plays a crucial role in ensuring production continuity and equipment lifespan [1,2]. In this context, disassembly sequence planning (DSP) assumes a pivotal role, focusing on the determination of the optimal disassembly sequence for components [3]. The efficiency of equipment maintenance largely relies on the rational planning of DSP, as it is through this process that substantive maintenance work can commence [4].
In recent years, DSP has garnered significant attention from researchers. However, it is noteworthy that much of this research has been conducted in the context of deterministic disassembly information, which presents a gap with real-world industrial operations. In practical settings, industrial operations often entail uncertainties such as intelligent scheduling of power systems [5,6], equipment assembly [7], and job shop scheduling [8]. When extending these uncertainty factors to the equipment maintenance disassembly problem we propose, the complexities arise from intricate equipment structures, various maintenance components, differing maintenance conditions, and equipment wear, all contributing to the dynamic nature of the disassembly task.
While some scholars have begun addressing uncertain DSP problems, it has come to our attention that many of them primarily employ stochastic simulation methods [9,10], such as chance-constrained programming or expected constrained programming. These approaches typically model uncertain factors in disassembly as normal or uniform distributions, requiring extensive simulations. This approach may lead to a significant increase in computational resources, and the choice of the number of random simulations introduces subjectivity. All of these factors compound the complexity of the DSP problem, diminishing the effectiveness of traditional methods. Therefore, there is an urgent need for a novel approach to address these uncertainties, enhancing maintenance efficiency and quality.
In this study, we propose an innovative approach to address the multi-objective DSP problem in uncertain environments. To flexibly handle uncertainty, we employ fuzzy logic, specifically triangular fuzzy numbers. This approach not only conserves computational resources but also enables adaptive decision making based on uncertain conditions, comprehensively optimizing maintenance. Our primary objective is to reduce disassembly time, minimize tool direction changes during disassembly, and enhance responsiveness to emergency maintenance components.
Furthermore, even the simplest allocation problems are NP-hard, and DSP is no exception [11,12,13]. As the task scale expands, computational resource requirements exhibit exponential growth. Consequently, metaheuristic algorithms have become the primary means to solve DSP problems. Although numerous algorithms have emerged for solving DSP problems, in light of the “no free lunch” theorem, no universal algorithm can effectively solve all optimization problems. Hence, this paper proposes an enhanced water wave optimization (EWWO) algorithm in multi-objective settings, which extensively explores solutions to the proposed DSP problem by redefining propagation, reflection, and along-wave operators. Additionally, it incorporates innovative local search strategies to further improve the quality of the solution set, effectively addressing our proposed problem.
In summary, the significant contributions of this study can be summarized as follows:
- In addressing the complexities of equipment maintenance in an industrial context, we introduce triangular fuzzy numbers to cope with uncertainty factors. This not only enhances decision accuracy but also demonstrates unique adaptability when facing uncertainty in practical operations.
- We integrate multi-objective optimization into industrial equipment maintenance within an uncertain environment, comprehensively considering complexities such as reducing disassembly time, minimizing tool and direction change frequency, and enhancing responsiveness to emergency maintenance components.
- We introduce the innovative EWWO algorithm, which, by redefining propagation, refraction, and breaking operators, extensively searches for solutions to the DSP problem, effectively addressing its complexities and NP-hard nature. This algorithm provides a powerful tool for addressing real-world industrial challenges.
These unique contributions collectively bring new methods and tools to the field of industrial equipment maintenance, with the potential to improve the efficiency and quality of maintenance work, thereby creating tangible value for the manufacturing and industrial sectors.
The remainder of this paper is structured as follows: Section 2 provides a comprehensive review of the DSP problem, offering an in-depth understanding of the existing literature and research. Section 3 outlines our modeling approach, describing the construction process of the mathematical model. Section 4 introduces our innovative EWWO algorithm. Section 5 shows the applicability of our model in different real-world industrial examples. Section 6 demonstrates the superior performance of EWWO. Finally, we conclude the research findings, discuss limitations, and propose future research directions in Section 7.
2. Literature Review
Here, we first analyze the latest research advances in DSP issues (Section 2.1), after which we summarize them, analyze the shortcomings of the current research, and highlight the contributions of this paper (Section 2.2).
2.1. Research on DSP
Since the inception of DSP problems, they have garnered significant research attention and driven progress in related fields [13]. Initially, researchers focused on studying various graph-based models associated with DSP challenges, including AND/OR graphs, hybrid disassembly graphs, task prioritization graphs, and component prioritization graphs [13], aimed at meeting the requirements of diverse DSP problems. Solving DSP problems typically demands exact solving techniques and heuristic algorithms. However, as the complexity of product component structures continues to rise, leading to exponential growth in computation time, this poses significant challenges for both exact- solving techniques and heuristic algorithms [10,11,12,13].
To address this crucial obstacle, researchers turned their attention to metaheuristic algorithms, which have become indispensable tools for achieving optimal or near-optimal solutions in DSP scenarios. For instance, Zhang et al. [12] employed a social engineering optimizer to address a cost-centric single-objective DSP problem, applying their proposed method and model to a case involving a turbine gearbox. They demonstrated the convergence and accuracy of their algorithm [12]. Simultaneously, Ren et al. [13] designed a discrete multi-objective artificial bee colony algorithm to tackle a collaborative DSP challenge, aiming to minimize disassembly time and maximize profit. Their contribution lies not only in the proposed algorithm but also in improving the disassembly tree and introducing new graph theory matrices to represent collaboration relationships [13]. Furthermore, Wu et al. [14] introduced a simplified gravitational search algorithm to minimize DSP costs and time constraints. While it is important to note that their research was conducted under deterministic conditions, this approach offers a more efficient and cost-effective solution for DSP challenges related to maintenance, especially in applications where tasks need to be completed within a finite time [14].
Mahmoudi et al. [15] focused on a selective DSP problem related to building selection, aiming to reduce disassembly time, costs, and environmental impact. They utilized a non-dominated sorting genetic algorithm II (NSGA-II) to optimize these objectives, showcasing their algorithm’s outstanding performance. This work provides a promising approach to optimizing DSP in complex environments [15]. Yu et al. [16] introduced an enhanced whale optimization algorithm for solving an energy-centric single-objective DSP problem. Their study offers a new and effective choice for addressing DSP problems, particularly in optimizing energy consumption for sustainability and energy efficiency [16]. Chen et al. [17] concentrated on an end of life (EoL) smartphone DSP problem and developed a Q-learning approach. Experimental results demonstrate the effectiveness of this method in intelligently planning the target component sequence for EoL smartphone disassembly, offering an intelligent solution for sustainable electronic waste processing and reducing waste and resource consumption [17]. Sun et al. [18] proposed an asynchronous parallel operation selective DSP problem, aiming to minimize disassembly time and maximize disassembly profit. Their multi-objective evolutionary algorithm based on improved multi-neighborhood search strategy provides a powerful tool for solving complex DSP problems, which is crucial for enhancing production efficiency and profitability [18].
Additionally, Qiu et al. [19] addressed a selective DSP problem but introduced an improved NSGA-II algorithm to tackle these issues. Their optimization objectives include total disassembly time, disassembly direction change frequency, and disassembly tool change frequency, offering new directions for multi-objective optimization of DSP problems [19]. Ji et al. [20] enhanced the immune optimization algorithm, providing new tools for rapidly finding optimal or near-optimal disassembly sequences to solve DSP problems, which are essential for accelerating the DSP process and improving production efficiency, providing strong support for the manufacturing industry [20].
The above-mentioned literature provides valuable insights and support for DSP problem research. However, these studies were conducted under deterministic information, while uncertainty is prevalent in DSP scenarios. Therefore, it is necessary to consider and analyze these uncertain factors [21,22,23]. This prompted researchers to consider and analyze these uncertain factors. For example, Fu et al. [21] introduced a hybrid algorithm that combines probabilistic constraint programming with multi-objective multi-universe optimization to simultaneously consider uncertainty related to operational failures during the disassembly process. Their method balances energy maximization and disassembly profit minimization, providing an effective approach to optimizing DSP problems in uncertain situations [21]. Similarly, Liang et al. [22] addressed a stochastic DSP challenge affected by noise pollution and energy uncertainty. They employed a probabilistic constraint approach to handle this model, demonstrating the feasibility of optimizing DSP problems in uncertain environments [22]. Tian et al. [23] introduced a novel stochastic DSP approach, considering uncertain component quality and variable disassembly operation costs. They applied an improved artificial bee colony algorithm [23]. Kim et al. [24] focused on DSP challenges with stochastic operation time characteristics. They proposed a solution algorithm based on sample mean approximation to reduce costs. They also explored a DSP problem involving stochastic multi-product scenarios [24]. Additionally, Yeh et al. [25] employed a simplified swarm intelligence algorithm to address a DSP scenario with stochastic operation frequency features [25]. Furthermore, Zhang et al. proposed an improved social engineering optimizer to address an energy-driven end-of-battery disassembly planning problem, utilizing expected constraint programming as a solution method [26]. Guo et al. [26] considered task failure risks and introduced a profit-oriented stochastic disassembly planning problem, using a hybrid metaheuristic approach to enhance solution performance. These methods offer promising research directions and solutions for addressing uncertainty in DSP problems [27].
2.2. Research Gap and Contribution
In spite of significant advancements in DSP challenge research, there remain several critical shortcomings that require focused attention:
(1) Gap in Equipment Maintenance Research: Presently, a conspicuous gap exists in the realm of DSP research concerning disassembly issues associated with uncertain equipment maintenance. Equipment maintenance stands as a pivotal pillar for numerous industries, yet it grapples with diverse challenges, one of which revolves around the efficient disassembly of equipment for repair or the replacement of crucial components in uncertain and challenging environments. It is regrettable that this pivotal aspect remains scarcely addressed within the current landscape of DSP research.
(2) Underutilization of Fuzzy Logic: At present, most of the methods used in uncertain DSP problems are stochastic programming. Fuzzy logic, renowned for its remarkable flexibility and adaptability in managing situations characterized by fuzziness and uncertainty, holds particular significance within the maintenance and dismantling domain. Regrettably, its current application in this specific context falls short of realizing its full potential.
(3) Enhancements Needed for Metaheuristic Algorithms: While metaheuristic algorithms have showcased their effectiveness in tackling DSP challenges, it is essential to acknowledge the “no free lunch” theorem, which underscores the need for continuous improvements. This encompasses bolstering the efficiency of algorithms to expedite the dismantling process and fortifying their applicability to diverse equipment and scenarios. Innovations in metaheuristic algorithms hold the key to significantly enhancing the efficiency and precision of disassembly processes.
Hence, the primary objective of this study is to introduce a pioneering fuzzy multi-objective DSP disassembly model, meticulously crafted to address the aforementioned deficiencies. The core design of this model is geared towards achieving multiple pivotal objectives, which encompass the reduction of disassembly time, minimization of tool and direction change frequency, and enhancement of response time concerning critical maintenance components. To adeptly confront the inherent uncertainty linked with component usage, we embrace the utilization of triangular fuzzy numbers. This strategic choice provides a more adaptable framework for managing uncertainty effectively. Furthermore, we undertake the development of an efficient metaheuristic algorithm expressly tailored to tackle this formidable challenge.
3. Proposed Model
In this section, we first introduce the graph-theoretic approach used (Section 3.1), followed by describing the fuzzy logic used (Section 3.2), and finally constructing the mathematical model of our proposed multi-objective DSP (Section 3.3).
3.1. Disassembly Hybrid Graph
To provide a reasonable and accurate representation of disassembly information, we need to select an appropriate modeling method. Among the various modeling methods available, researchers commonly choose the classic approach of disassembly hybrid graphs [28]. This method enjoys widespread usage in a substantial body of literature and demonstrates notable simplicity and efficiency [12,26,28]. Therefore, we similarly chose the disassembly hybrid graph.
A typical disassembly hybrid graph, as shown in Figure 1, comprises two types of relationships: precedence constraints and direct contact relationships. If there is a directed edge connecting component 1 and component 2, it signifies that component 1 must be disassembled before component 2, indicating a precedence constraint relationship between these two components. Conversely, if components 2 and 4 are connected by an undirected edge, it signifies a direct contact relationship between components 2 and 4.
Based on these relationships, researchers can represent them as a precedence constraint matrix P and a direct contact matrix C. In the precedence constraint matrix P, assuming two components are denoted as i and j, with i as the row and j as the column, if component i must be disassembled before component j, then Pij = 1. The direct contact matrix C follows a similar logic. Figure 2 shows the two matrices evolved from Figure 1.
3.2. Triangular Fuzzy Numbers
Due to the complexity of equipment structures and factors such as wear and tear, which can introduce disassembly uncertainty, we employ triangular fuzzy numbers as a representation.
Compared to other uncertainty handling methods such as probability distributions, interval analysis, and stochastic processes, triangular fuzzy numbers exhibit several distinct advantages. These advantages include the following [29,30,31]:
(1) Flexibility in fuzziness representation: Triangular fuzzy numbers offer a more flexible way to express fuzziness compared to some methods like probability distributions. They allow the representation of fuzziness within a numerical range, not confined to a single-point estimate. This proves highly useful in capturing the diversity and complexity of uncertainty, particularly in addressing the ambiguity and uncertainty present in the domain of equipment disassembly and maintenance.
(2) Intuitiveness and interpretability: The graphical representation of triangular fuzzy numbers is relatively intuitive, making it easy to understand and explain, especially for non-specialists. This aids in conveying uncertain information during the decision-making process and facilitates effective communication with relevant stakeholders.
(3) Applicability to multi-dimensional uncertainty: Triangular fuzzy numbers can be employed to represent uncertainty across multiple dimensions, not limited to a single dimension. This is crucial for addressing problems that involve the comprehensive consideration of multiple factors.
(4) Wide applicability: Triangular fuzzy numbers find extensive application in engineering and technology fields. Moreover, they are widely used in various domains such as decision analysis, control systems, and fuzzy logic. This versatility positions them as a universal uncertainty modeling tool suitable for diverse applications, showcasing potential in disassembly problem scenarios.
Triangular fuzzy numbers typically consist of three key values: the minimum value, the maximum value, and the peak value. These values collectively define the potential range of the random variable, with the peak value representing the most probable value, while the minimum and maximum values establish the boundaries of the possible value range [29]. The shape of a triangular fuzzy number resembles a triangle, with the peak value at its apex. This representation is further explained by the membership function presented in Equation (1).
The following is the general representation of a triangular fuzzy number:
where a represents the minimum value of the triangular fuzzy number; b represents the maximum value of the triangular fuzzy number; c represents the peak value of the triangular fuzzy number, which is the most likely value.
Triangular fuzzy numbers come with defined arithmetic rules and scoring functions, which we utilize for computations in the model.
Next, we need to introduce some operational definitions of triangular fuzzy numbers, including the definition of operational rules and scoring functions. We utilize these definitions for computations within the model [29].
Assume two triangular fuzzy numbers and . Their operational rules are defined as shown in Equations (3)–(7) [29].
In order to compare triangular fuzzy numbers, we need to convert them into scoring functions. By comparing the magnitude of their scoring functions, we can determine the ordering between two triangular fuzzy numbers.
3.3. Proposed Model
After that, we build a mathematical model of the proposed problem, and the notations used in the model are shown below:
| Indices: | |
| m: | Index denoting the disassembly component, m 1, 2,…, M} |
| Parameters: | |
| M: | Total count of disassembly components |
| Fuzzy disassembly time associated with component m | |
| sm | Level of complexity for the removal of component m |
| Fuzzy time required for tool change | |
| Fuzzy time required for direction change | |
| Im | Position of component m in the disassembly sequence |
| dn | Number of direction changes in the disassembly sequence |
| tn | Number of tool changes in the disassembly sequence |
| Decision variables: | |
| hm | Priority indicator for component m, where hm = 1 if component m has priority; otherwise, hm = 0. |
Our model comprises three distinct objective functions. Equation (9) serves as the primary optimization direction, as it is minimized to guide the overall optimization process, is used to represent the fuzzy information in the model.
Afterward, the detailed descriptions of each objective are as follows:
- (1)
- Reducing disassembly time
Equipment maintenance often needs to be completed rapidly to minimize production interruptions and reduce costs. Therefore, setting the reduction of disassembly time as an objective is reasonable as it contributes to improving equipment availability, shortening maintenance cycles, reducing downtime losses, and enhancing production efficiency.
- (2)
- Enhancing responsiveness to urgent maintenance components
In emergency situations, responding quickly to maintenance demands is crucial. By improving the responsiveness to urgent maintenance components, it ensures the rapid availability of necessary parts and tools when needed, thereby reducing downtime and enhancing equipment reliability.
- (3)
- Reducing tool and direction change frequency
In uncertain environments, frequent tool and direction changes can introduce additional complexity and the possibility of errors. By minimizing these changes, it is possible to improve the continuity of work, reduce the likelihood of errors, and decrease maintenance time. This helps ensure more effective execution of equipment maintenance tasks in uncertain environments.
Therefore, integrating these three objectives into our multi-objective optimization method makes our approach more aligned with practical operations. It allows for effective balancing of key factors such as production efficiency, maintenance efficiency, and responsiveness in emergency situations. This contributes to achieving more sustainable industrial equipment maintenance and upkeep, ultimately enhancing overall production efficiency.
Subsequently, Equations (7)–(12) are subject to the following constraints:
Equations (13) and (14) outline prerequisites for disassembling a component. These prerequisites demand that there be no interference from higher-priority components and a limit on the number of components in contact with the target component. These conditions play a significant role in ensuring a smooth disassembly process. Finally, Equation (15) introduces binary variables into the model, providing further definition to decision-making processes and constraint conditions.
4. Proposed Solution Method
Nowadays, there are numerous methods available for solving optimization problems, including exact solution techniques [23], data-driven approaches [32], heuristic algorithms [28], metaheuristic algorithms [28], and linear programming techniques based on metaheuristic algorithms [33]. As mentioned earlier, given the NP-hard, fuzzy nature and discrete nature of the problem under consideration, it is imperative to customize a metaheuristic algorithm to obtain viable solutions. Among the array of metaheuristic algorithms available, the WWO algorithm stands out due to its unique attributes. Firstly, it operates in multi-dimensional spaces, making it versatile and adaptable to a wide spectrum of optimization problems such as home healthcare decision problems [33]. Moreover, this algorithm boasts a notable advantage in terms of faster convergence and higher precision, enabling it to yield near-optimal solutions within relatively short timeframes [34]. Notably, the WWO algorithm demonstrates remarkable robustness, effectively managing uncertainties and noise inherent in the problem. Its versatility extends to diverse domains, such as engineering, where it finds utility in tasks like structural design and parameter tuning. In economics, it is a valuable tool for challenges like portfolio optimization and resource allocation [34]. Beyond these applications, the WWO algorithm finds its place in fields like image processing, machine learning, and data mining, underscoring its potential to address DSP problems effectively [34].
Before introducing EWWO, let us first explain some terminology related to EWWO. In traditional WWO, each water wave represents a solution, and multiple water waves form a population to solve a problem. In traditional WWO, there are three forms of searching the solution space: 1. propagation, 2. refraction, and 3. breaking waves. Propagation is when water waves spread outwards, refraction changes the direction of propagation when the wave height approaches zero, and breaking waves occur when the wave height is relatively high, causing the wave to break into foam. By combining these three search methods with specific rules for accepting solutions, the WWO algorithm achieves its superior exploration capabilities [34].
With the WWO algorithm chosen as our primary solution approach, we proceed to tailor it to the unique characteristics of the problem at hand. This customization involves several key components, each contributing to the algorithm’s effectiveness. We begin by elucidating the multi-objective handling approach employed in this study (Section 4.1), followed by an in-depth description of the population initialization method (Section 4.2). Subsequently, we delve into the specialized propagation operator (Section 4.3), refraction operator (Section 4.4), breaking operator (Section 4.5), and the incorporation of a local search strategy (Section 4.6). To provide a comprehensive overview, we conclude by presenting the overall framework of the EWWO algorithm in Section 4.7.
4.1. Multi-Objective Handling Techniques
We utilize Pareto dominance and the crowding distance calculation to balance between three objectives, which are commonly used concepts in multi-objective optimization problems for comparing and selecting solutions.
Pareto dominance is a method used to compare different solutions in multi-objective optimization problems. In multi-objective problems, there are typically multiple conflicting objectives, so there is no single best solution but rather a set of possible optimal solutions known as the Pareto front. Solution A is said to Pareto dominate Solution B if Solution A is at least as good as Solution B in at least one objective and strictly better in at least one objective.
The conditions for Pareto dominance are as follows:
- Solution A is at least as good as Solution B in at least one objective.
- Solution A is strictly better than Solution B in at least one objective.
- If both of the above conditions are met, then Solution A Pareto dominates Solution B.
The crowding distance calculation is one of the methods used in multi-objective optimization to select solutions on the Pareto front. It helps determine which solutions are more worth keeping to maintain diversity on the front. Crowding distance represents how crowded a solution is within the Pareto front, which is essentially the distance between a solution and its nearest neighbors on the front.
The steps for the crowding distance calculation are as follows:
- Sort the solutions on the Pareto front for each objective based on their values.
- Calculate the distances of each solution on each objective.
- Sum the distances on each objective to obtain the crowding distance for each solution.
- A larger crowding distance indicates a lower crowding level of a solution on the front and is typically more worth retaining. This helps maintain diversity on the front while selecting solutions with higher performance.
Pareto dominance and crowding distance calculation are important concepts and methods in multi-objective optimization that aid in selecting suitable solutions in multi-objective problems.
4.2. Population Initialization
Population initialization stands as the pivotal initial step in any algorithm, as emphasized in reference [35]. In the context of our DSP problem, the task revolves around determining the disassembly order for components. However, the WWO algorithm primarily operates in a continuous fashion. To align it with our problem’s discrete nature, we must discretize its search space and represent the disassembly sequence as strings.
To achieve this, we employ integer encoding to discretize the search space and effectively represent the disassembly sequence as strings. This process begins with the generation of the initial population, which is intricately tied to the disassembly mixed graph.
First, we transform the disassembly mixed graph into two matrices, designated as P and C. Subsequently, we identify all rows in matrix P that are entirely composed of zeros and satisfy the condition of being less than or equal to 1 in matrix C. Among these rows, one is randomly selected to serve as the starting point for a component in the disassembly sequence. Following this selection, the chosen row is removed, and the above steps are iterated until all components have been assigned their positions within the disassembly sequence.
By employing this meticulous approach, we effectively initialize the population. This enables the EWWO algorithm to embark on its search within the solution space, ultimately pursuing the optimal disassembly sequence.
4.3. Propagation Operator
Here, we design a new propagation operator and employ it within the traditional WWO update rules. Specifically, we randomly select three points from the current individual (water wave) and exchange their positions, as illustrated in Figure 3.
Next, we calculate the sum of the scoring functions for the updated solution, denoted as , where the scoring functions for individual x are computed as shown in Equation (16).
If the score of the new solution is less than that of the original solution, i.e., , we update the solution, setting , otherwise, we calculate Equation (17).
where is a parameter, is a uniformly random number between 0 and 1.
If , we update the solution, setting Otherwise, we retain the original solution and decrement by 1. In addition, here, represents the maximum propagation count for the current water wave. When all solutions have been updated or no improvement is achieved, meaning h becomes 0, the propagation operation in this iteration concludes, and we proceed to the refraction operation.
4.4. Refraction Operator
If a solution has not improved after multiple searches, i.e., the solution’s corresponding value of h is 0, we perform a refraction operation on it.
We identify the solution with the minimum crowding distance in the first level of the current Pareto front, and refract part of its solution into the solution that needs to be updated. For the remaining positions in the current solution that have not been refracted, we reverse their order, as shown in Figure 4.
4.5. Breaking Operator
If an individual, after undergoing a propagation operation, produces a better individual than the current best individual, we then subject the new individual to the breaking wave operation. We randomly select two points from it and swap them, continuing this process up to a preset maximum number of times, . If the score of the new solution is less than that of the old one, i.e., , the solution is updated. Otherwise, if , the solution is also updated.
Note that is randomly generated between 1 and 10 during each iteration. After that, Figure 5 shows a schematic of the refraction operator.
The updated population is merged with the original population. Pareto dominance and crowding distance calculations are performed on the merged population to update it. Non-dominated solutions are saved to an external archive for the next rounds of propagation, refraction, and breaking wave operations.
After completing the main loop of the EWWO algorithm, for the solutions saved in the external archive, duplicate solutions are removed, and a local search strategy is introduced.
4.6. Local Search
To further enhance the quality of the non-dominated solution set obtained by EWWO, we introduce a local search strategy. Specifically, we randomly select n points within the current solution (where 1 < n < M/2) and reposition these n points within the disassembly sequence. Similar to the process described in Section 4.5, we perform a search times for each individual scheme. Figure 6 shows a schematic of the local search strategy.
4.7. EWWO Algorithm General Framework
Combining the aforementioned components, the overall steps of our EWWO algorithm are as follows:
Step 1: Generate an initial population using the method described in Section 4.2.
Step 2: Perform Pareto dominance and crowding distance calculations on the initial population to find non-dominated solutions.
Step 3: Execute the propagation operation as described in Section 4.3.
Step 4: Apply the refraction operation to solutions not optimized by the propagation operation.
Step 5: Apply the breaking operation to solutions optimized by the propagation operation.
Step 6: Merge the new population obtained from Steps 3–5 with the original population to find non-dominated solutions and save them in an external archive.
Step 7: Check if the maximum iteration count (Maxit) has been reached. If it has, terminate the main EWWO loop and proceed to Step 8; otherwise, continue with Step 3.
Step 8: Remove duplicate solutions from the external archive, and perform a local search process on them according to the scheme outlined in Section 4.6. Output the final non-dominated solution set.
The overall flowchart of the EWWO framework, combining the above-mentioned components and using the maximum iteration count Maxit as the stopping criterion, is illustrated in Figure 7.
5. Case Study
Here, we use two real-world industrial cases to verify the effectiveness of the proposed algorithm and model. We use a disassembly and maintenance process of a coal mill with 21 components to represent a small-scale case (Section 5.1) and a disassembly process of a generator with 40 components to represent a large-scale case (Section 5.2).
The decision to choose coal mills and generators as subjects for case studies can be attributed to multiple reasons. Firstly, these two types of equipment play a vital role in the industrial sector, not only in power generation but also in other industries. Therefore, studying their performance and maintenance holds significant practical significance. Secondly, these devices often possess complex mechanical structures involving multiple components and systems. Thus, selecting them as research subjects aids in delving deeper into multi-objective optimization and disassembly issues, providing valuable insights for addressing challenges posed by similar complex mechanical equipment. Additionally, coal mills and generators require frequent maintenance during operation to ensure their long-term performance and reliability. This makes the study of their maintenance processes directly valuable, as it can help companies save on maintenance costs, reduce downtime, and enhance production efficiency. Furthermore, these case studies provide an ideal platform for validating the applicability of new algorithms and models in complex industrial environments. This validation not only aids in improving existing technologies but also fosters technological innovation, offering better solutions for the maintenance and optimization of future industrial equipment. In summary, the selection of coal mills and generators as case study subjects aims to address complex real-world industrial issues, enhance equipment performance and reliability, validate the applicability of new technologies, and promote technological innovation. These reasons collectively drive this decision.
5.1. Case Study A
We first demonstrate its disassembly information (Section 5.1.1), then carry out parameter calibration of the EMMO algorithm (Section 5.1.2), and finally, solve the case. The results are then analyzed (Section 5.1.3).
5.1.1. Case Description
Here, we solve a coal mill case with 21 parts. Table 1 shows its disassembly information; to simplify the presentation, the same tools are represented with the same numerical code, and Figure 8 shows its disassembly hybrid graph. In Table 1, the first column represents the component number, the second column contains the component name, and the third column indicates the tools used for disassembling the corresponding component, with the same number indicating the use of the same tool. Similarly, the fourth column specifies the disassembly direction for the corresponding component, with the same number indicating the same direction. The fifth column shows the fuzzy operation time for disassembling the corresponding component. The seventh column determines whether the component has maintenance priority, and the last column represents the difficulty level of disassembling that component.
5.1.2. Parameter Calibration
When applying metaheuristic algorithms, a crucial step is the precise adjustment and calibration of parameters, a process of paramount importance [35]. This step can significantly enhance both the quality and efficiency of the algorithm’s solutions. To achieve this, we initiate the process by conducting parameter calibration. Drawing from experience, preliminary experiments, and literature analysis [3,6,8,23], we designate three reference values for each parameter, as illustrated in Table 2.
Conducting a full experiment would necessitate a daunting number of trials, given the exponential nature of the parameter combinations. To streamline this process and reduce the number of experiments, we employ the Taguchi experimental design method for parameter calibration.
Additionally, we employ the relative percentage deviation (RPD) to assess the algorithm’s performance under different parameter settings, with the calculation formula for RPD as shown in Equation (18).
where is the minimum of the sum of the score functions in all experiments, is the sum of the objective score functions in the current experiment.
Finally, the Taguchi experimental results are presented in Table 3.
After averaging the results across various experiments for each parameter, the final parameter calibration outcomes are summarized in Table 4.
5.1.3. Computational Result
After the steps in Section 5.2, we run the program once to obtain the set of non-dominated solutions shown in Table 5, and Figure 9 illustrates the distribution of their score functions.
The data presented in Table 5 and Figure 9 clearly demonstrate conflicts among our three primary objectives. Specifically, the fuzzy range for disassembly time falls between 575.7 and 627.4, while the range for part maintenance priority spans from 97 to 115, and the range for tool and direction change time is between 17 and 23.
For decision makers whose primary goal is to minimize both disassembly time and tool/direction change time, Scheme 6 emerges as a viable choice. However, it must be acknowledged that, in terms of part maintenance priority, this scheme ranks the lowest. Conversely, for decision makers who prioritize the highest-level part maintenance, Scheme 4 stands out. However, the cost of this choice is an extended disassembly time.
It can be seen that representing objective function values with triangular fuzzy numbers allows decision makers to conduct a more comprehensive macro-level analysis of various disassembly schemes. The application of triangular fuzzy numbers helps decision makers gain a more holistic understanding and analysis of various decision options, better aligning them with their objectives and needs.
The solutions generated by the EWWO algorithm provide decision makers with multiple choices within this complex multi-objective decision space. Ultimately, decisions will depend on the specific priorities, constraints, and trade-offs that decision makers are willing to accept in their particular circumstances. This underscores the need for a cautious and data-driven decision-making process to select the most appropriate solution.
5.2. Case Study B
Here, we first demonstrate its disassembly information (Section 5.2.2), then, solve the case. The results are then analyzed (Section 5.2.2).
5.2.1. Case Description
5.2.2. Computational Result
After applying the parameter calibration method described in Section 5.1.2, for Case Study B, we set the parameters as follows: N = 50, Maxit = 200, hmax = 3, λ = 2, α = 1.5, β = 0.03, and keep other parameters the same as in the previous section. Subsequently, the results after running the program once are shown in Table 7, and the score function Pareto distribution is depicted in Figure 10.
When considering solutions for a large-scale case, we still need to balance three key objectives, and it is evident that there are complex and conflicting relationships among these objectives. Firstly, we focus on time, and the need to complete tasks promptly. Scheme 2 excels in this regard as it minimizes the time required for disassembly and also performs well in terms of tool and direction change frequency.
However, it is not just about time; we also need to consider the responsiveness of urgent components. Scheme 10 excels in this aspect by maximizing the responsiveness of urgent components. However, Scheme 10 requires a significant amount of disassembly time during implementation, which could potentially have a negative impact on overall process efficiency. Therefore, decision makers must make appropriate trade-offs between time and responsiveness. The multiple sets of schemes we provide can assist decision makers in considering a variety of factors to make choices based on their specific circumstances and priority objectives.
6. Comparison with Other Algorithms
Here, in order to validate the superiority of the proposed EWWO algorithm, we conduct a comparative analysis against NSGA-II [15], the multi-objective artificial bee colony algorithm (MODABC) [37], and the ant colony optimization algorithm (ACO) [38].
MOABC adopts a variable neighborhood depth search strategy to enhance the mining ability in the stage of honey mining by hiring bees and observation bees, and constructs a global learning strategy to improve the quality of honey and jump out of the local optimum in the stage of honey exploration by scouting bees, and adopts the left–right mutation mechanism to improve the convergence and accuracy of the algorithm.
ACO defines a new pheromone matrix and optimization operator, which ensures that the algorithm has both randomness and determinism and guarantees the diversity of ants’ optimization paths so that the algorithm does not easily appear as the local optimum.
NSGA-II is an algorithm proposed for the DSP problem, which sets specialized crossover and mutation operators and also has superior performance.
We perform a comparison of HV, Spread, and CPU time for the four algorithms as follows:
(1) HV is one of the key metrics used to assess the performance of multi-objective optimization algorithms. It measures the volume of the set of non-dominated solutions found by the algorithm in a multi-dimensional objective space. A higher HV value indicates that the algorithm’s solution set is closer to the ideal Pareto front, indicating better algorithm performance.
(2) Spread measures the dispersion of solutions in the Pareto front. This metric is used to assess whether the algorithm can provide a diverse set of non-dominated solutions rather than concentrating them in a small region. A higher Spread value indicates that the algorithm can find more dispersed solutions on the Pareto front, demonstrating better diversity.
(3) CPU time represents the computer processing time required for algorithm execution. This metric is used to evaluate the computational efficiency of the algorithm. A shorter CPU time typically indicates that the algorithm can find better solutions within the same time frame or handle more problem instances in a given amount of time.
These metrics are collectively used to evaluate the performance of multi-objective optimization algorithms and determine which algorithm performs best on a given problem. HV and Spread focus on the quality and diversity of the algorithm’s solution set, while CPU time assesses efficiency. Therefore, considering these metrics together provides a comprehensive assessment of the algorithm’s overall performance.
To ensure fairness, we initially perform parameter calibration for all these algorithms using the method described in Section 4. Subsequently, we employ the same encoding method and utilize the rules of triangular fuzzy number arithmetic. All performance metrics are derived from scoring functions, and each metric runs 10 times, with the averages calculated and presented in Table 8. The best values are indicated in bold for reference. Furthermore, to validate the effectiveness of our results, we include 95% confidence intervals for each algorithm’s performance metrics, as depicted in Figure 11 and Figure 12.
Based on the results presented in Table 8, it is evident that our EWWO algorithm demonstrates excellent performance levels in terms of the HV and Spread metrics when solving the small-scale case (Case Study A). Additionally, in terms of CPU time, it maintains a competitive edge, closely following the leading NSGA-II algorithm.
When addressing the large-scale case (Case Study B), it is clear that our EWWO algorithm outperforms the other three algorithms in all three of these metrics. To reinforce the validity of these findings, we turn to the 95% confidence intervals (Figure 11 and Figure 12), which consistently support our conclusions. These intervals further underscore the outstanding performance of the EWWO algorithm and emphasize its significant potential in effectively solving the DSP problem. These compelling findings highlight the superiority of the EWWO algorithm when faced with complex and challenging problems, providing a solid foundation for addressing DSP problems.
7. Conclusions and Future Work
In industrial equipment maintenance, disassembly is a crucial step, as it allows for efficient maintenance. However, the disassembly process is filled with high dynamics and uncertainty. To address this challenge, in this paper we employ triangular fuzzy numbers to effectively represent uncertain information and construct a multi-objective equipment maintenance disassembly model suitable for uncertain environments. Our model aims to minimize disassembly time, reduce the number of tool orientation changes, and enhance the response to emergency components. Furthermore, to tackle this complex problem, we propose a novel algorithm called EWWO. Through real-world industrial case studies, we demonstrate the superiority of triangular fuzzy numbers in handling uncertainty. They provide a more comprehensive assessment of the advantages and disadvantages of various disassembly approaches. Our proposed EWWO algorithm successfully addresses the complexity of the problem and outperforms other methods such as NSGA-II, ACO, and MOABC in terms of performance. These results highlight the potential of the EWWO algorithm in solving DSP problems and bringing new successful algorithms to the field of industrial equipment maintenance.
Our research makes significant breakthroughs in the field of industrial equipment disassembly and maintenance, offering various potential benefits, including economic gains, improved efficiency, and increased equipment availability.
Future research directions include exploring collaborative disassembly planning in multi-agent systems, enhancing efficiency and safety in human–machine collaboration, and delving deeper into handling uncertainty in dynamic operational environments [39,40,41,42]. Additionally, as automation and human–machine interaction continue to evolve, understanding the role of human factors in equipment disassembly becomes crucial, encompassing aspects such as operator training, safety, and ergonomics [43,44]. Finally, our model can consider additional objectives such as cost and environmental benefits [45,46]. By comprehensively considering these additional objectives, our model better meets the needs of various stakeholders, including economic, environmental, safety, and sustainability aspects, ensuring that equipment maintenance and disassembly processes yield optimal benefits in multiple dimensions. Therefore, we encourage further research to expand our model to better address various challenges and opportunities. This range of research directions further advances the field of industrial equipment maintenance.
Author Contributions
Conceptualization, Y.F.; funding acquisition, M.A.; software, M.A.; supervision, C.Z. and M.A.; validation, Y.F.; writing—original draft, Y.F.; writing—review and editing, C.Z. All authors have read and agreed to the published version of the manuscript.
Funding
The authors would like to extend our appreciation to King Saud University (KSU) for funding this work through the Researcher Supporting Project (RSP2023R481), King Saud University, Riyadh, Saudi Arabia.
Data Availability Statement
Not applicable.
Conflicts of Interest
The authors declare no conflict of interest.
References
- Tian, G.; Lu, W.; Zhang, X.; Zhan, M.; Dulebenets, M.A.; Aleksandrov, A.; Fathollahi-Fard, A.M.; Ivanov, M. A survey of multi-criteria decision-making techniques for green logistics and low-carbon transportation systems. Environ. Sci. Pollut. Res. 2023, 30, 57279–57301. [Google Scholar] [CrossRef] [PubMed]
- Du, N.; Fathollahi-Fard, A.M.; Wong, K.Y. Wildlife resource conservation and utilization for achieving sustainable development in China: Main barriers and problem identification. Environ. Sci. Pollut. Res. 2023. Epub ahead of print. [Google Scholar] [CrossRef] [PubMed]
- Tian, G.; Ren, Y.; Feng, Y.; Zhou, M.; Zhang, H.; Tan, J. Modeling and Planning for Dual-Objective Selective Disassembly Using and/or Graph and Discrete Artificial Bee Colony. IEEE Trans. Ind. Inform. 2018, 15, 2456–2468. [Google Scholar] [CrossRef]
- Meng, K.; Xu, G.; Peng, X.; Youcef-Toumi, K.; Li, J. Intelligent disassembly of electric-vehicle batteries: A forward-looking overview. Resour. Conserv. Recycl. 2022, 182, 106207. [Google Scholar] [CrossRef]
- Nikolaidis, P.; Poullikkas, A. Evolutionary priority-based dynamic programming for the adaptive integration of intermittent distributed energy resources in low-inertia power systems. Eng 2022, 2, 643–660. [Google Scholar] [CrossRef]
- Nikolaidis, P.; Poullikkas, A. Co-optimization of active power curtailment, load shedding and spinning reserve deficits through hybrid approach: Comparison of electrochemical storage technologies. IET Renew. Power Gener. 2021, 16, 92–104. [Google Scholar] [CrossRef]
- Wang, Y.; Gerchak, Y. Capacity games in assembly systems with uncertain demand. Manuf. Serv. Oper. Manag. 2003, 5, 252–267. [Google Scholar] [CrossRef]
- Chen, Z.; Zou, J.; Wang, W. Digital twin-oriented collaborative optimization of fuzzy flexible job shop scheduling under multiple uncertainties. Sadhana 2023, 48, 78. [Google Scholar] [CrossRef]
- Bentaha, M.L.; Dolgui, A.; Battaïa, O.; Riggs, R.J. Profit-oriented partial disassembly line design: Dealing with hazardous parts and task processingtimes uncertainty. Int. J. Prod. Res. 2018, 56, 7220–7242. [Google Scholar] [CrossRef]
- Ren, Y.; Zhang, C.; Zhao, F.; Xiao, H.; Tian, G. An asynchronous parallel disassembly planning based on genetic algorithm. Eur. J. Oper. Res. 2018, 269, 647–660. [Google Scholar] [CrossRef]
- Baghizadeh, K.; Ebadi, N.; Zimon, D.; Jum’a, L. Using Four Metaheuristic Algorithms to Reduce Supplier Disruption Risk in a Mathematical Inventory Model for Supplying Spare Parts. Mathematics 2022, 11, 42. [Google Scholar] [CrossRef]
- Zhang, C.; Fathollahi-Fard, A.M.; Li, J.; Tian, G.; Zhang, T. Disassembly sequence planning for intelligent manufacturing using social engineering optimizer. Symmetry 2021, 13, 663. [Google Scholar] [CrossRef]
- Ren, Y.; Tian, G.; Zhao, F.; Yu, D.; Zhang, C. Selective cooperative disassembly planning based on multi-objective discrete artificial bee colony algorithm. Eng. Appl. Artif. Intell. 2017, 64, 415–431. [Google Scholar] [CrossRef]
- Wu, P.; Wang, H.; Li, B.; Fu, W.; Ren, J.; He, Q. Disassembly sequence planning and application using simplified discrete gravitational search algorithm for equipment maintenance in hydropower station. Expert Syst. Appl. 2022, 208, 118046. [Google Scholar] [CrossRef]
- Motahar, M.M.; Nourzad, S.H.H. A hybrid method for optimizing selective disassembly sequence planning in adaptive reuse of buildings. Eng. Constr. Arch. Manag. 2022, 29, 307–332. [Google Scholar] [CrossRef]
- Fang, Y.; Ming, H.; Li, M.; Liu, Q.; Pham, D.T. Multi-objective evolutionary simulated annealing optimisation for mixed-model multi-robotic disassembly line balancing with interval processing time. Int. J. Prod. Res. 2020, 58, 846–862. [Google Scholar] [CrossRef]
- Chen, Z.; Li, L.; Zhao, F.; Sutherland, J.W.; Yin, F. Disassembly sequence planning for target parts of end-of-life smartphones using Q-learning algorithm. Procedia CIRP 2023, 116, 684–689. [Google Scholar] [CrossRef]
- Sun, X.; Guo, S.; Guo, J.; Du, B. A two-stage interactive evolutionary algorithm for multi-objective asynchronous parallel selective disassembly sequence planning problem. Comput. Ind. Eng. 2023, 175, 108855. [Google Scholar] [CrossRef]
- Qiu, L.; Dong, L.; Wang, Z.; Zhang, S.; Xu, P. Asynchronous parallel disassembly sequence planning method of complex products using discrete multi-objective optimization. Proc. Inst. Mech. Eng. Part B J. Eng. Manuf. 2022, 236, 1466–1482. [Google Scholar] [CrossRef]
- Ji, J.; Wang, Y. Selective disassembly sequence optimization based on the improved immune algorithm. Robot. Intell. Autom. 2023, 43, 96–108. [Google Scholar] [CrossRef]
- Fu, Y.; Zhou, M.; Guo, X.; Qi, L.; Sedraoui, K. Multiverse optimization algorithm for stochastic biobjective disassembly sequence planning subject to operation failures. IEEE Trans. Syst. Man Cybern. Syst. 2021, 52, 1041–1051. [Google Scholar] [CrossRef]
- Liang, P.; Fu, Y.; Ni, S.; Zheng, B. Modeling and optimization for noise-aversion and energy-awareness disassembly sequence planning problems in reverse supply chain. Environ. Sci. Pollut. Res. 2021. Online ahead of print. [Google Scholar] [CrossRef]
- Tian, G.; Zhou, M.; Li, P. Disassembly sequence planning considering fuzzy component quality and varying operational cost. IEEE Trans. Autom. Sci. Eng. 2017, 15, 748–760. [Google Scholar] [CrossRef]
- Kim, H.-W.; Park, C.; Lee, D.-H. Selective disassembly sequencing with random operation times in parallel disassembly environment. Int. J. Prod. Res. 2018, 56, 7243–7257. [Google Scholar] [CrossRef]
- Yeh, W.-C. Simplified swarm optimization in disassembly sequencing problems with learning effects. Comput. Oper. Res. 2012, 39, 2168–2177. [Google Scholar] [CrossRef]
- Zhang, X.; Zhou, H.; Fu, C.; Mi, M.; Zhan, C.; Pham, D.T.; Fathollahi-Fard, A.M. Application and planning of an energy-oriented stochastic disassembly line balancing problem. Environ. Sci. Pollut. Res. 2023. Online ahead of print. [Google Scholar] [CrossRef]
- Guo, H.; Zhang, L.; Ren, Y.; Li, Y.; Zhou, Z.; Wu, J. Optimizing a stochastic disassembly line balancing problem with task failure via a hybrid variable neighborhood descent-artificial bee colony algorithm. Int. J. Prod. Res. 2023, 61, 2307–2321. [Google Scholar] [CrossRef]
- Tian, G.; Zhang, X.; Fathollahi-Fard, A.M.; Jiang, Z.; Zhang, C.; Yuan, G.; Pham, D.T. Hybrid evolutionary algorithm for stochastic multiobjective disassembly line balancing problem in remanufacturing. Environ. Sci. Pollut. Res. 2023. Online ahead of print. [Google Scholar] [CrossRef]
- Zhang, Z.; Wang, K.; Zhu, L.; Wang, Y. A Pareto improved artificial fish swarm algorithm for solving a multi-objective fuzzy disassembly line balancing problem. Expert Syst. Appl. 2017, 86, 165–176. [Google Scholar] [CrossRef]
- Akyar, E.; Akyar, H.; Düzce, S.A. A new method for ranking triangular fuzzy numbers. Int. J. Uncertain. Fuzziness Knowl. Based Syst. 2012, 20, 729–740. [Google Scholar] [CrossRef]
- Zhan, J.; Deng, J.; Xu, Z.; Martínez, L. A three-way decision methodology with regret theory via triangular fuzzy numbers in incomplete multi-scale decision information systems. IEEE Trans. Fuzzy Syst. 2023, 31, 2773–2787. [Google Scholar] [CrossRef]
- Gao, Y.; Lou, S.; Zheng, H.; Tan, J. A data-driven method of selective disassembly planning at end-of-life under uncertainty. J. Intell. Manuf. 2021, 34, 565–585. [Google Scholar] [CrossRef]
- Georgiou, G.S.; Nikolaidis, P.; Lazari, L.; Christodoulides, P. A genetic algorithm driven linear programming for battery optimal scheduling in nearly zero energy buildings. In Proceedings of the 2019 54th International Universities Power Engineering Conference (UPEC), Bucharest, Romania, 3–6 September 2019; pp. 1–6. [Google Scholar]
- Zheng, Y.-J. Water wave optimization: A new nature-inspired metaheuristic. Comput. Oper. Res. 2015, 55, 1–11. [Google Scholar] [CrossRef]
- Zhan, C.; Zhang, X.; Tian, G.; Pham, D.T.; Ivanov, M.; Aleksandrov, A.; Fu, C.; Zhang, J.; Wu, Z. Environment-oriented disassembly planning for end-of-life vehicle batteries based on an improved northern goshawk optimisation algorithm. Environ. Sci. Pollut. Res. 2023, 30, 47956–47971. [Google Scholar] [CrossRef]
- Fathollahi-Fard, A.M.; Tian, G.; Ke, H.; Fu, Y.; Wong, K.Y. Efficient Multi-Objective Metaheuristic Algorithm For Sustainable Harvest Planning Problem. Comput. Oper. Res. 2023, 158, 106304. [Google Scholar] [CrossRef]
- Wang, S.; Guo, X.; Zhou, Y. Improved artificial bee colony algorithm for solving stochastic demolition line balancing problems. Ind. Eng. Manag. 2018, 2, 16–22+32. [Google Scholar] [CrossRef]
- Wang, D.; Liu, G.; Li, R.; Sun, D.; Fu, G.; Li, L. Research on target disassembly sequence planning of discarded mobile phones based on ant colony algorithm. Home Appl. Technol. 2021, 4, 34–38. [Google Scholar]
- Huang, J.; Pham, D.T.; Li, R.; Qu, M.; Wang, Y.; Kerin, M.; Su, S.; Ji, C.; Mahomed, O.; Khalil, R.; et al. An experimental human-robot collaborative disassembly cell. Comput. Ind. Eng. 2021, 155, 107189. [Google Scholar] [CrossRef]
- Nikolaidis, P.; Chatzis, S. Gaussian process-based Bayesian optimization for data-driven unit commitment. Int. J. Electr. Power Energy Syst. 2021, 130, 106930. [Google Scholar] [CrossRef]
- Liu, Q.; Li, X.; Liu, H.; Guo, Z. Multi-objective metaheuristics for discrete optimization problems: A review of the state-of-the-art. Appl. Soft Comput. 2020, 93, 106382. [Google Scholar] [CrossRef]
- Baghizadeh, K.; Zimon, D.; Jum’a, L. Modeling and optimization sustainable forest supply chain considering discount in transportation system and supplier selection under uncertainty. Forests 2021, 12, 964. [Google Scholar] [CrossRef]
- Lee, M.-L.; Behdad, S.; Liang, X.; Zheng, M. Task allocation and planning for product disassembly with human–robot collaboration. Robot. Comput. Manuf. 2022, 76, 102306. [Google Scholar] [CrossRef]
- Wei, T.; Guo, X.; Wang, J.; Qi, L.; Qin, S.; Xu, G. Multi-objective discrete harmony search algorithm for disassembly line balance problems considering human body posture change. In Proceedings of the 4th International Conference on Informatics Engineering & Information Science, Tianjin, China, 19–21 November 2021. [Google Scholar]
- Tian, G.; Zhang, L.; Fathollahi-Fard, A.M.; Kang, Q.; Li, Z.; Wong, K.Y. Addressing a collaborative maintenance planning using multiple operators by a multi-objective metaheuristic algorithm. IEEE Trans. Autom. Sci. Eng. 2023, 1–13. [Google Scholar] [CrossRef]
- Fathollahi-Fard, A.M.; Hajiaghaei-Keshteli, M.; Tavakkoli-Moghaddam, R.; Smith, N.R. Bi-level programming for home health care supply chain considering outsourcing. J. Ind. Inf. Integr. 2022, 25, 100246. [Google Scholar] [CrossRef]
Figure 1.
A base disassembly hybrid graph.

Figure 2.
Constraint matrix P and C.

Figure 3.
Propagation operator example.

Figure 4.
Refraction operator example.

Figure 5.
Breaking operator example.

Figure 6.
Local search example.

Figure 7.
EWWO algorithm flowchart.
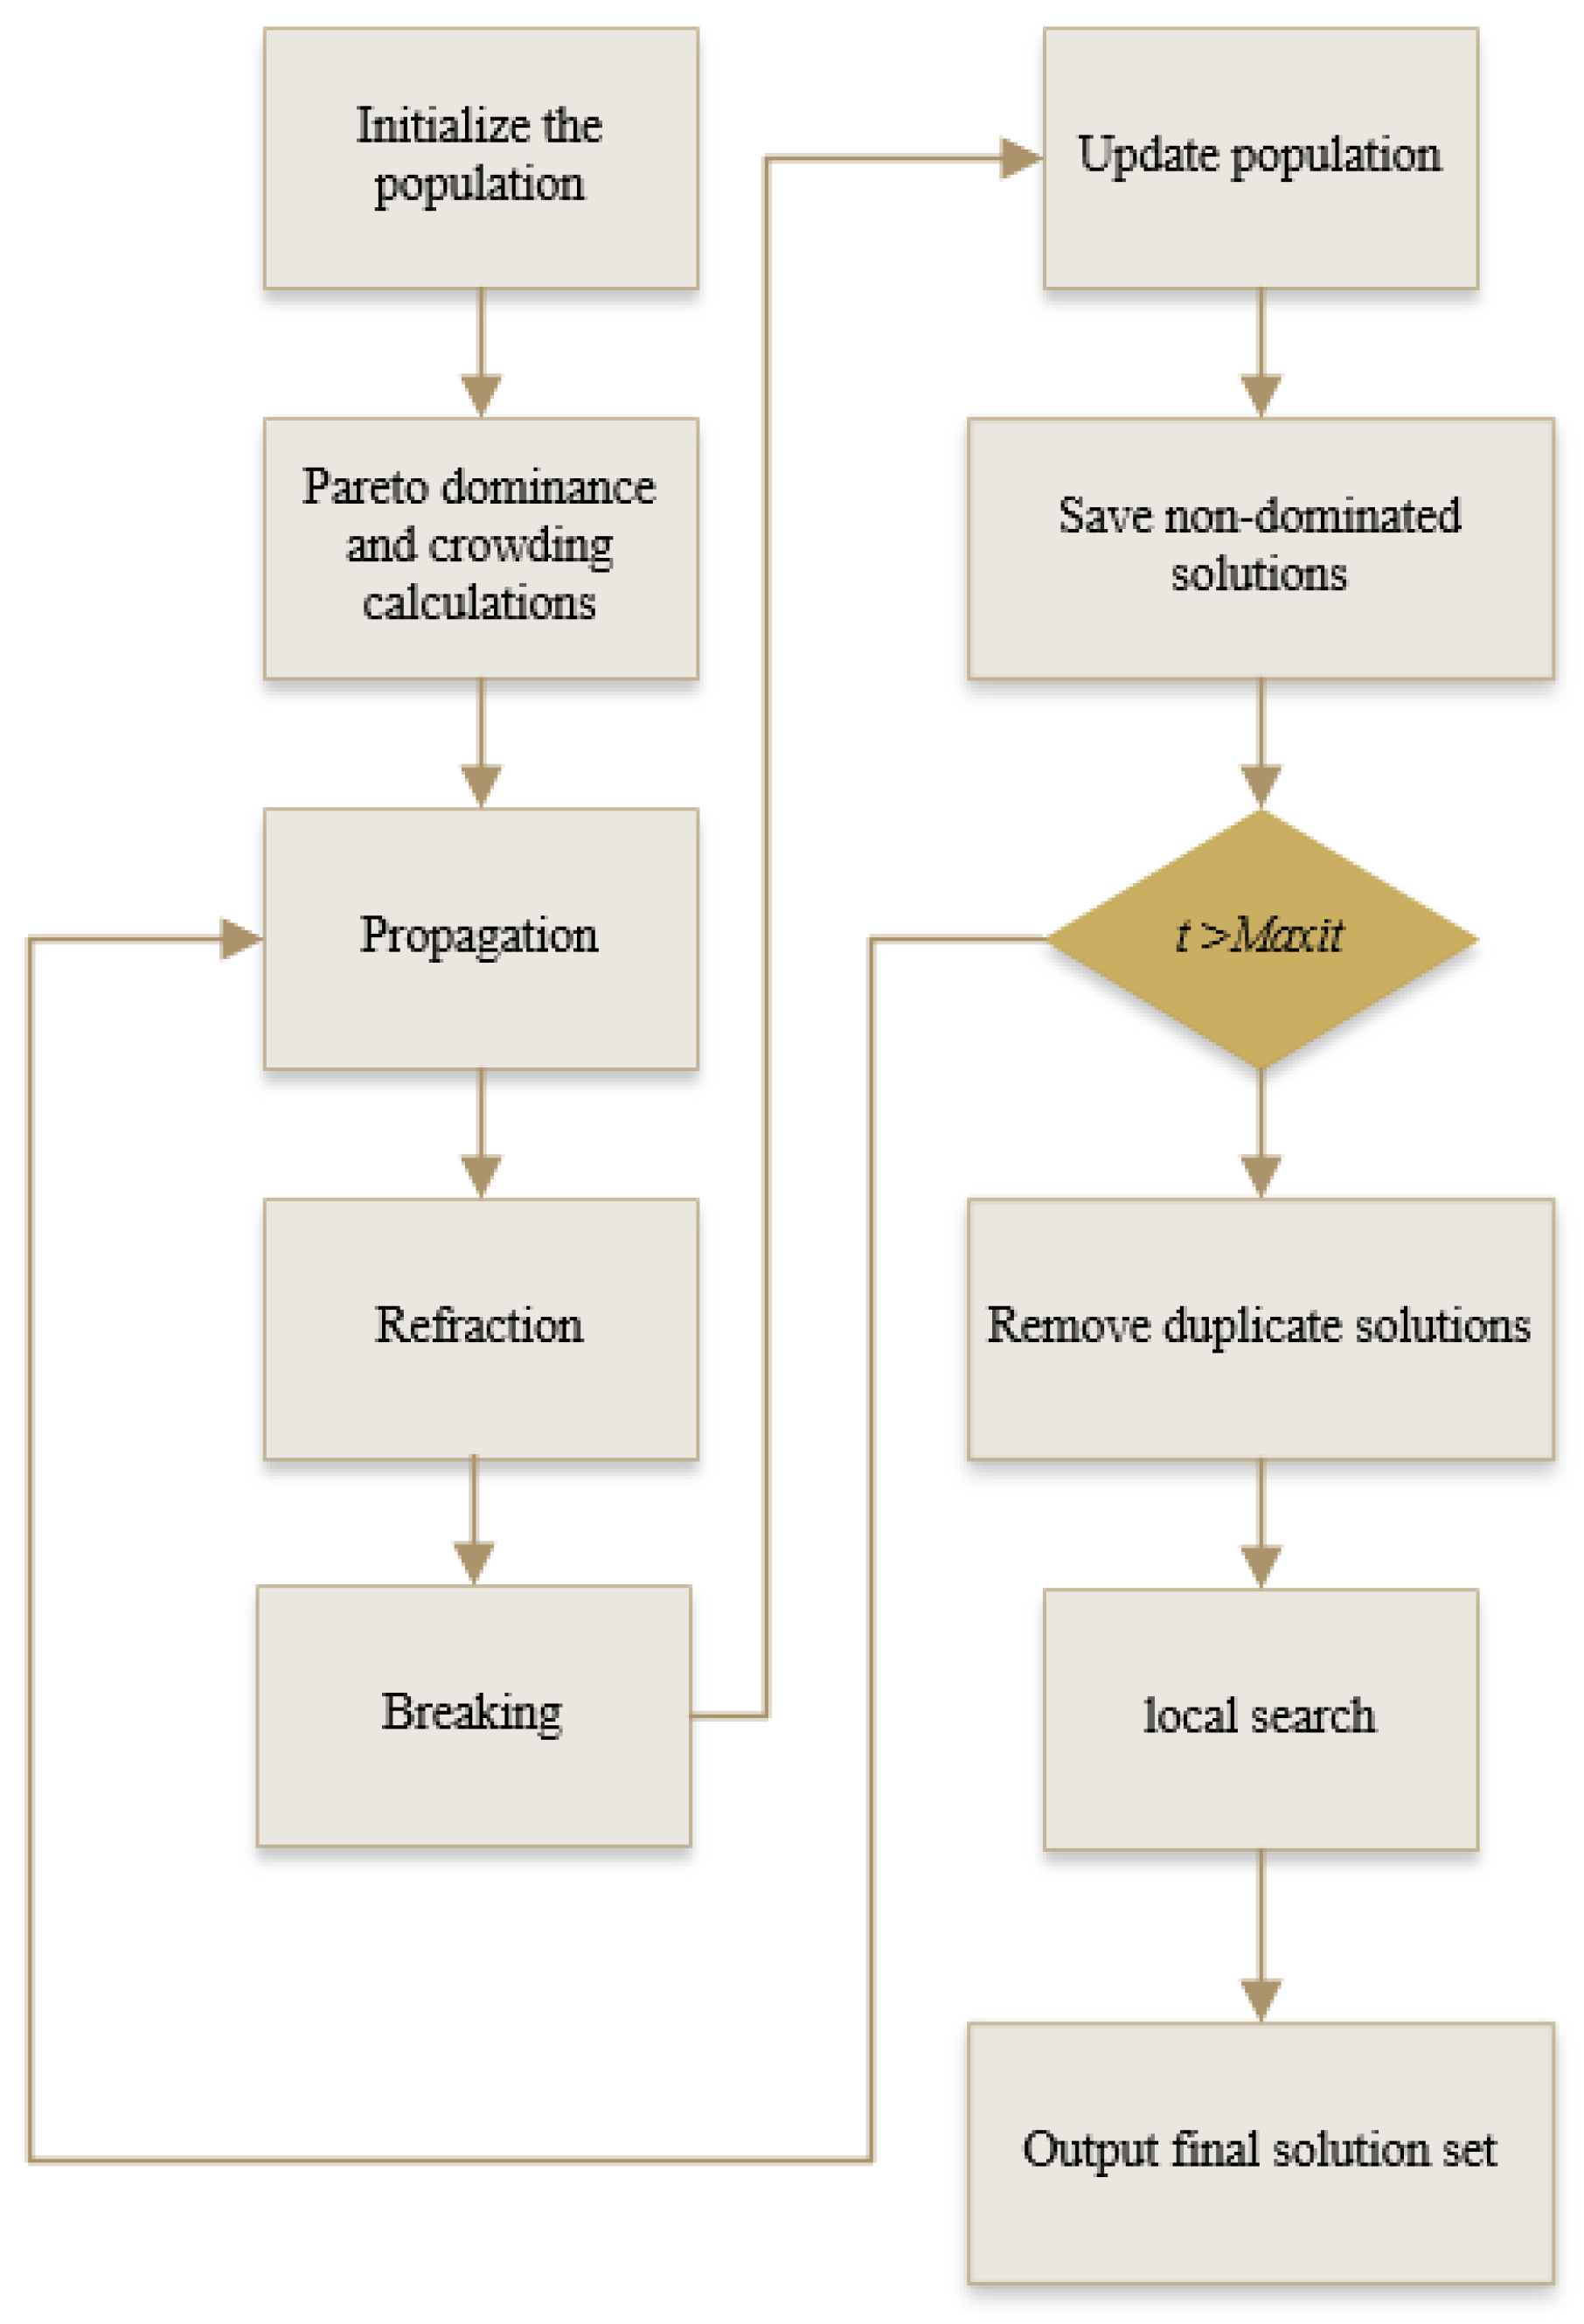
Figure 8.
Disassembly hybrid graph for Case Study A.
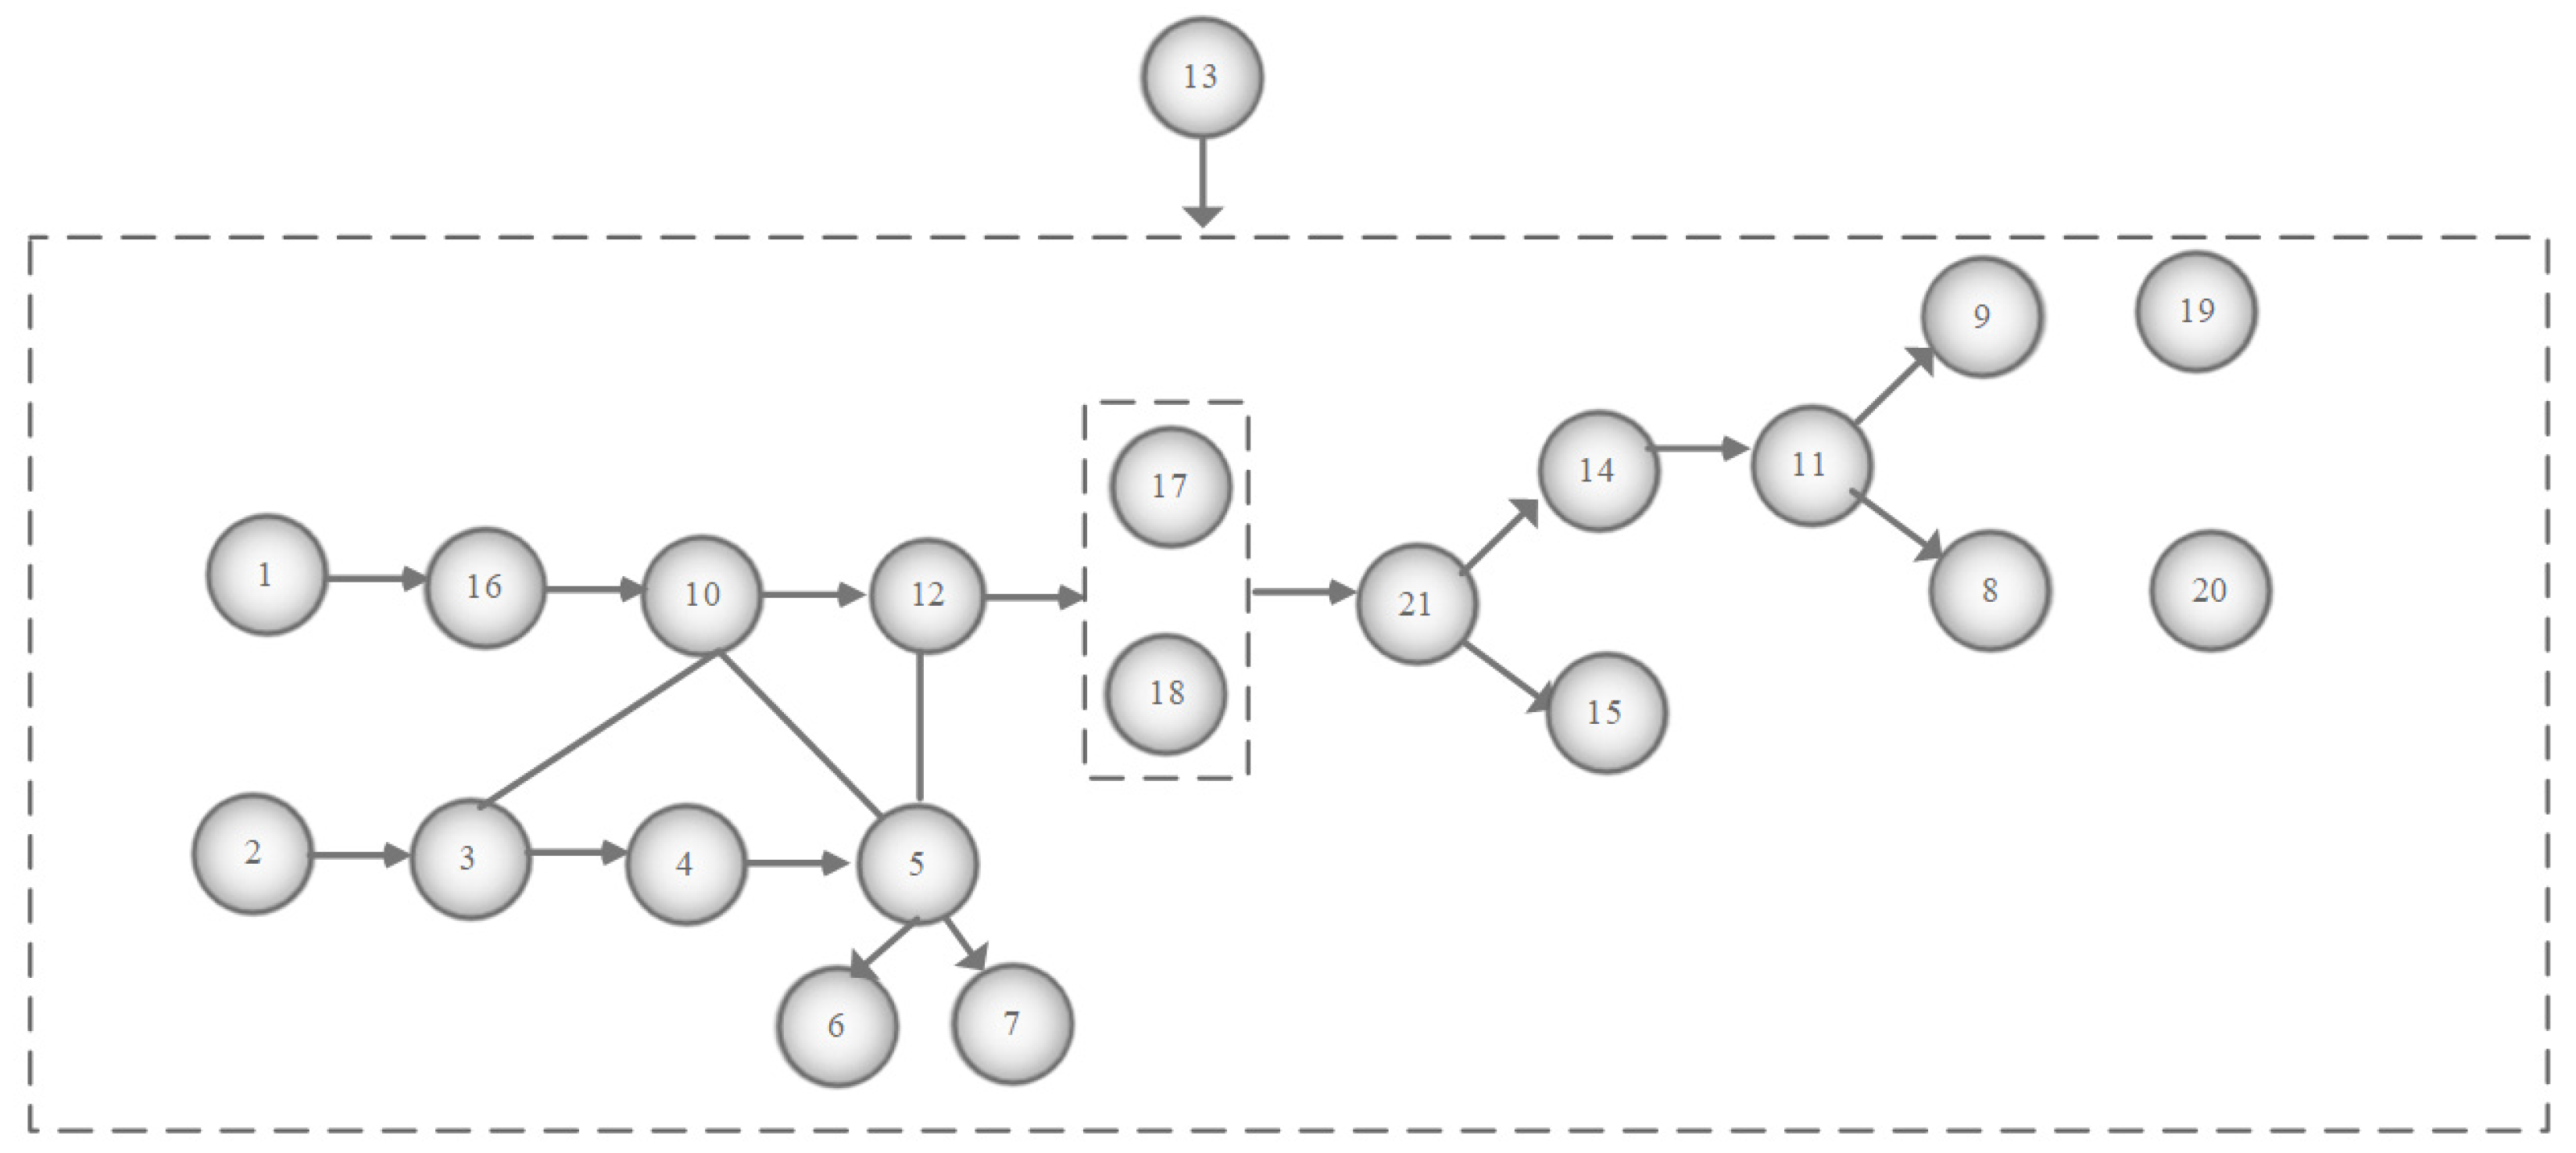
Figure 9.
Distribution of non-dominated solution sets (Case Study A).
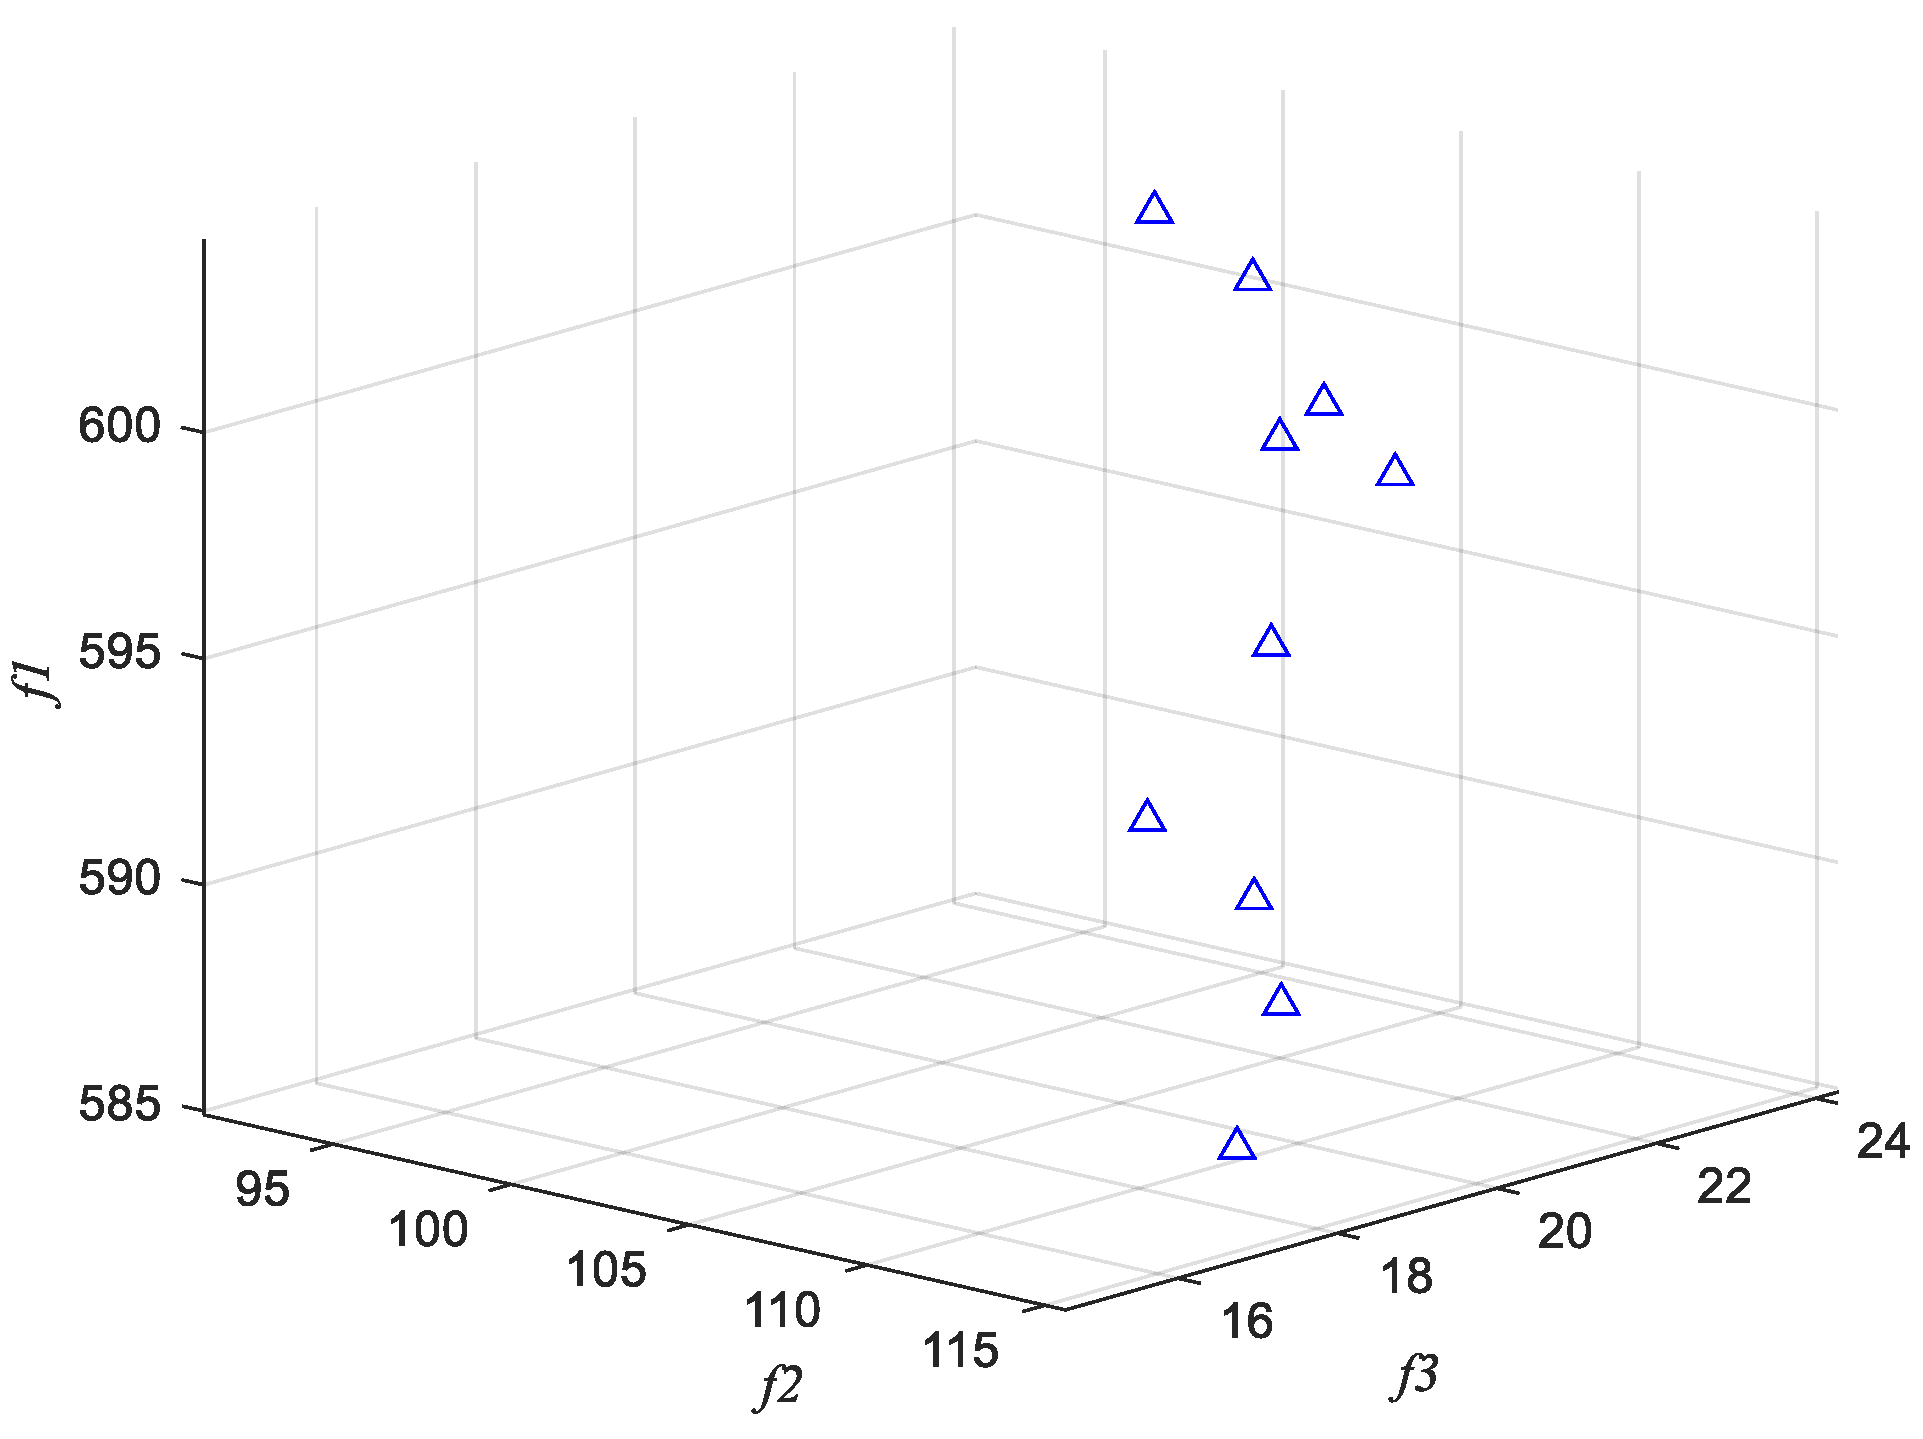
Figure 10.
Distribution of non-dominated solution sets (Case Study B).
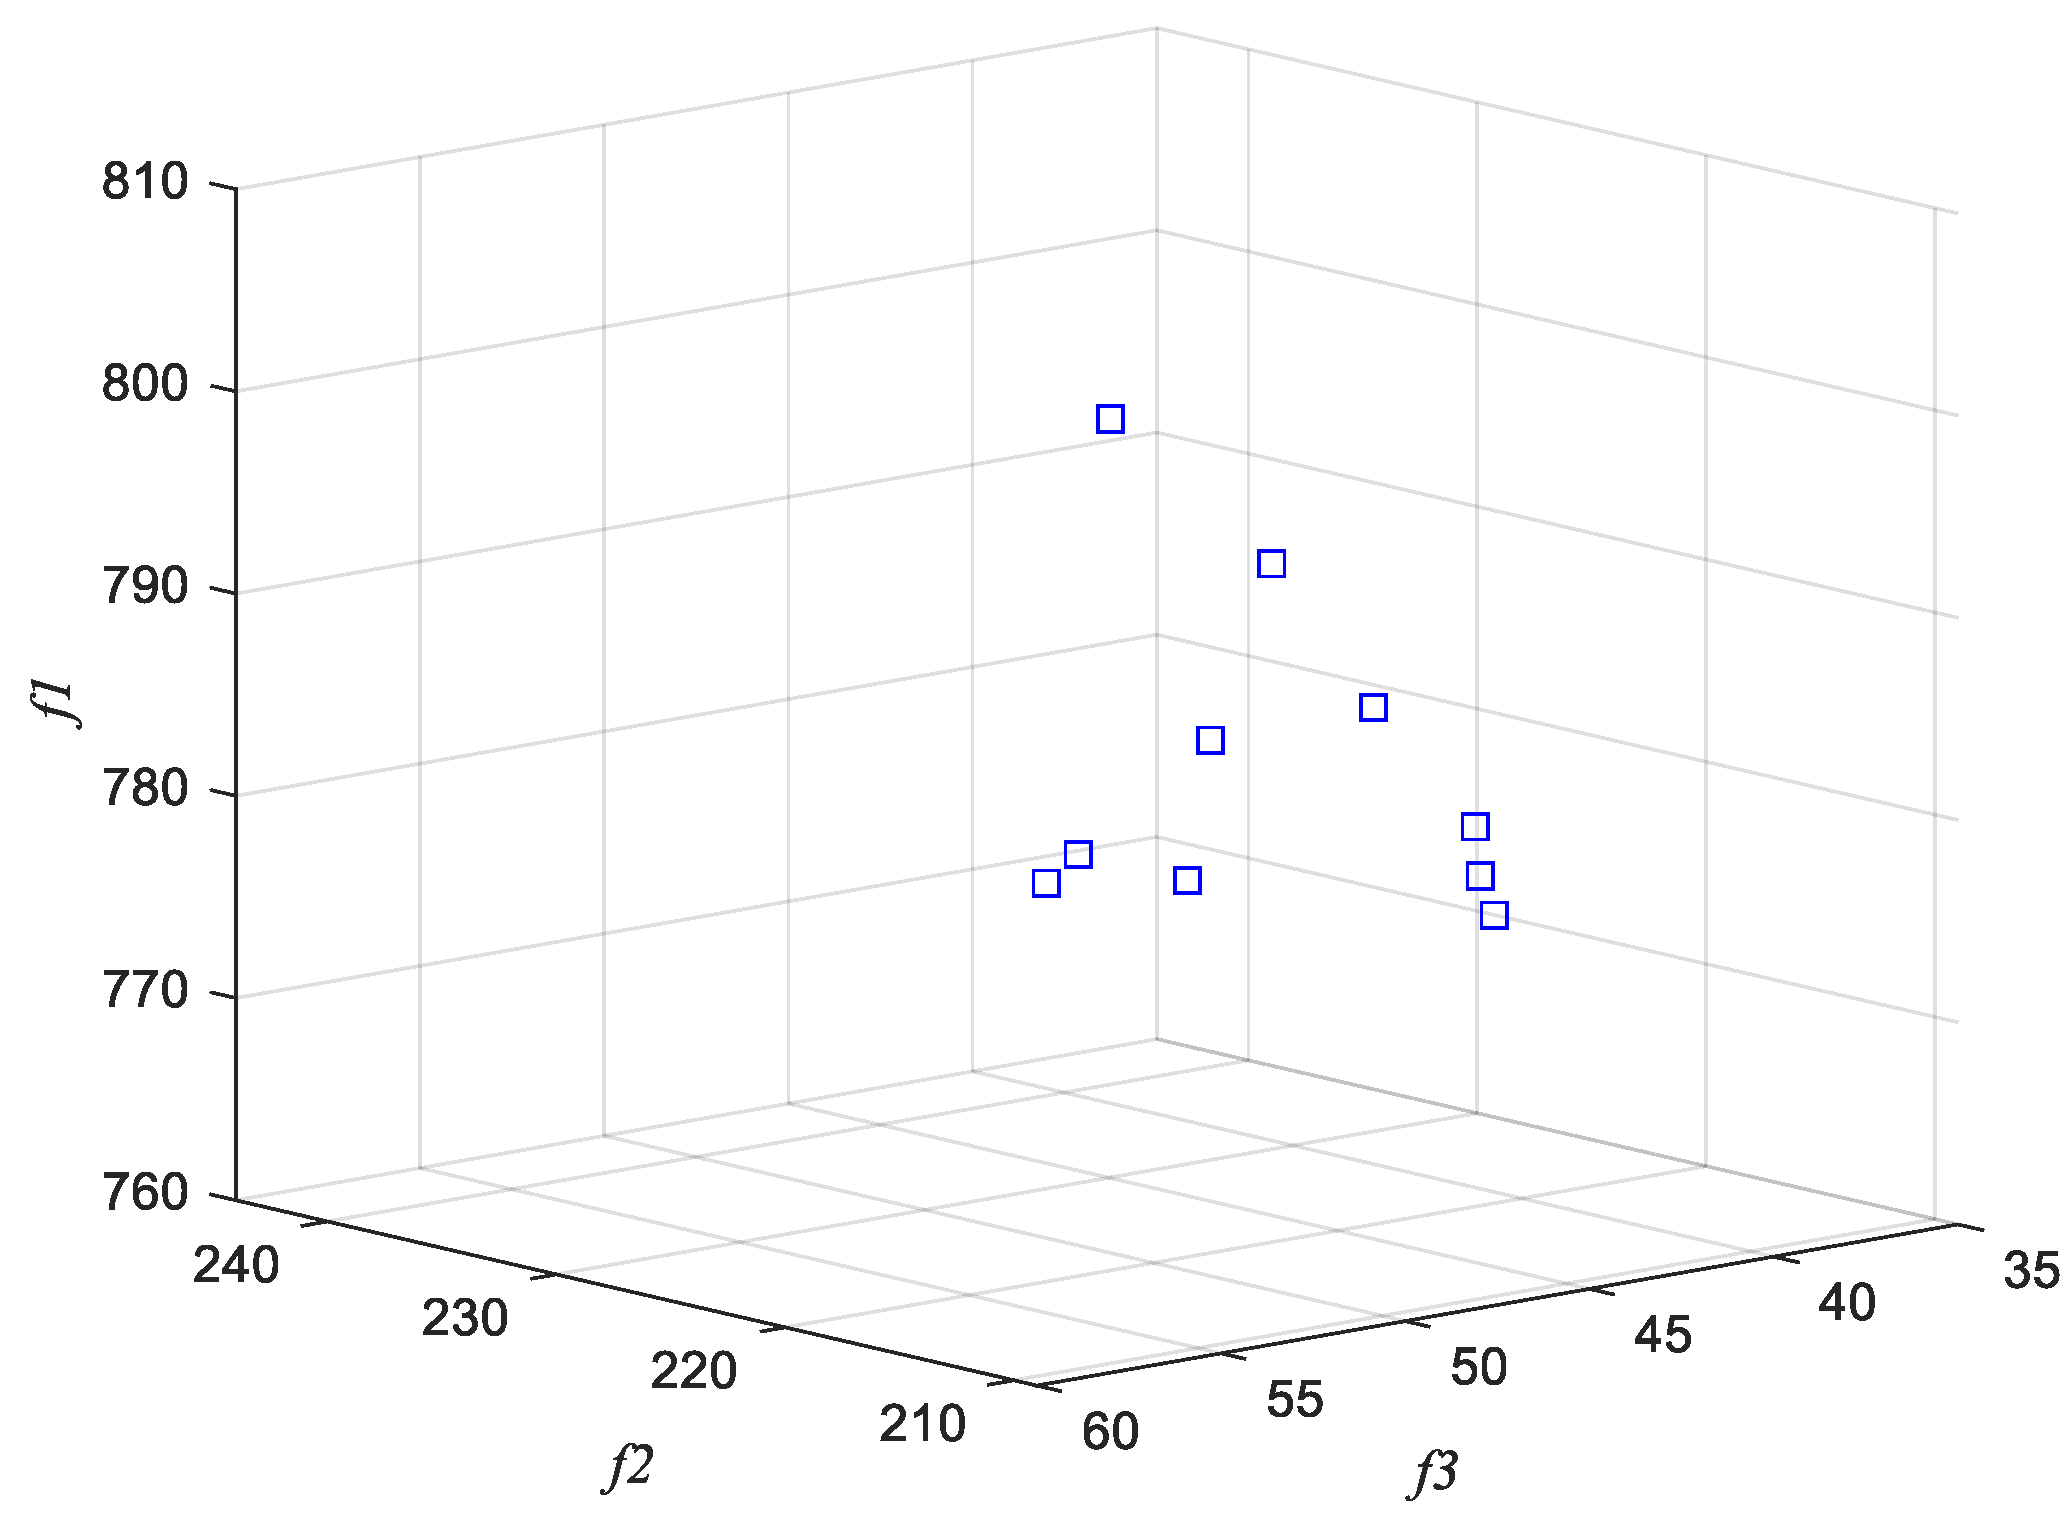
Figure 11.
Demonstration of 95% confidence intervals for four algorithms (Case Study A).

Figure 12.
Demonstration of 95% confidence intervals for four algorithms (Case Study B).


Table 1.
Disassembly information.
| Order | Name | Tool | Direction | Disassembly Time/s | Priority | Difficulty |
|---|---|---|---|---|---|---|
| 1 | Platen | 1 | +y | 16.83, 17.64, 18.50 | 0 | 0.25 |
| 2 | Electric motor | 1 | +y | 37.35, 40.15, 41.92 | 0 | 0.1 |
| 3 | Coupling | 1 | +y | 22.99, 23.85, 24.07 | 0 | 0.0 |
| 4 | Gearbox | 2 | +y | 41.06, 41.57, 43.20 | 1 | 0 |
| 5 | Machine base | 2 | −x | 28.13, 29.00, 30.01 | 0 | 0 |
| 6 | Slag discharge box | 1 | −x | 10.78, 11.68, 12.22 | 0 | 0.2 |
| 7 | Machine base sealing device | 2 | −x | 21.59, 22.45, 23.53 | 1 | 0.2 |
| 8 | Drive plate and scraper device | 3 | −x | 24.48, 25.39, 25.83 | 1 | 0.15 |
| 9 | Grinding ring and nozzle ring | 3 | +x | 28.08, 28.87, 29.77 | 1 | 0 |
| 10 | Grinding roller assembly | 2 | +x | 11.82, 12.81, 13.95 | 0 | 0.1 |
| 11 | Press frame assembly | 3 | +x | 10.94, 11.66, 12.57 | 1 | 0.2 |
| 12 | Articulated shaft assembly | 1 | +z | 11.78, 12.72, 13.34 | 0 | 0.1 |
| 13 | Machine casing | 2 | +z | 25.65, 26.43, 27.02 | 0 | 0.1 |
| 14 | Rod loading device | 2 | +z | 10.54, 11.26, 12.13 | 0 | 0.25 |
| 15 | Loading oil cylinder | 3 | +y | 27.84, 29.06, 29.41 | 1 | 0 |
| 16 | Separator | 3 | +y | 27.94, 29.06, 29.33 | 1 | 0 |
| 17 | Sealing manifold | 3 | −x | 26.06, 27.08, 28.08 | 0 | 0 |
| 18 | Fire suppression gas piping | 1 | −x | 22.52, 23.54, 24.33 | 0 | 0.15 |
| 19 | High-pressure oil station and low-pressure oil station | 2 | −y | 37.25, 37.91, 39.25 | 0 | 0.1 |
| 20 | Oil–water piping | 2 | −y | 28.10, 28.70, 30.29 | 0 | 0 |
| 21 | Disc drive device | 2 | +z | 28.08, 28.83, 30.14 | 1 | 0 |
Table 2.
Reference level for parameters’ setting.
| Parameters | Level 1 | Level 2 | Level 3 |
|---|---|---|---|
| N | 30 | 40 | 50 |
| Maxit | 100 | 150 | 200 |
| hmax | 3 | 4 | 5 |
| λ | 1 | 2 | 3 |
| α | 1.3 | 1.5 | 1.8 |
| β | 0.01 | 0.02 | 0.03 |
Table 3.
Taguchi experimental reference results.
| Numbers | N | Maxit | hmax | λ | α | β | RPD |
|---|---|---|---|---|---|---|---|
| 1 | 1 | 1 | 1 | 1 | 1 | 1 | 0.1168 |
| 2 | 1 | 1 | 2 | 2 | 3 | 3 | 0.1340 |
| 3 | 1 | 2 | 1 | 3 | 3 | 2 | 0.1665 |
| 4 | 1 | 2 | 3 | 1 | 2 | 3 | 0.1339 |
| 5 | 1 | 3 | 2 | 3 | 2 | 1 | 0.0526 |
| 6 | 1 | 3 | 3 | 2 | 1 | 2 | 0.1446 |
| 7 | 2 | 1 | 1 | 3 | 2 | 3 | 0.0886 |
| 8 | 2 | 1 | 3 | 1 | 3 | 2 | 0.0809 |
| 9 | 2 | 2 | 2 | 2 | 2 | 2 | 0.1320 |
| 10 | 2 | 2 | 3 | 3 | 1 | 1 | 0.1056 |
| 11 | 2 | 3 | 1 | 2 | 3 | 1 | 0.1201 |
| 12 | 2 | 3 | 2 | 1 | 1 | 3 | 0.0969 |
| 13 | 3 | 1 | 2 | 3 | 1 | 2 | 0.1412 |
| 14 | 3 | 1 | 3 | 2 | 2 | 1 | 0.0558 |
| 15 | 3 | 2 | 1 | 2 | 1 | 3 | 0.0495 |
| 16 | 3 | 2 | 2 | 1 | 3 | 1 | 0.0713 |
| 17 | 3 | 3 | 1 | 1 | 2 | 2 | 0.0025 |
| 18 | 3 | 3 | 3 | 3 | 3 | 3 | 0 |
Table 4.
Parameters’ selection results.
| Level | N | Maxit | hmax | λ | α | β |
|---|---|---|---|---|---|---|
| 1 | 0.249 | 0.206 | 0.181 | 0.167 | 0.218 | 0.174 |
| 2 | 0.208 | 0.220 | 0.209 | 0.212 | 0.155 | 0.223 |
| 3 | 0.107 | 0.139 | 0.174 | 0.185 | 0.191 | 0.168 |
Table 5.
Case study A: undominated solution set.
| Order | Scheme | f2 | f3 | |
|---|---|---|---|---|
| 1 | 13, 2, 3, 4, 1, 16, 5, 7, 6, 10, 12, 18, 17, 21, 14, 15, 11, 8, 9, 19, 20 | 575.6, 600.7, 627.4 | 102 | 23 |
| 2 | 13, 2, 3, 1, 16, 19, 10, 4, 12, 18, 17, 21, 14, 11, 15, 8, 9, 5, 7, 20, 6 | 572.3, 597.1, 623.5 | 106 | 23 |
| 3 | 13, 19, 1, 16, 2, 3, 4, 10, 12, 18, 17, 21, 14, 15, 11, 8, 9, 5, 7, 20, 6 | 573.4, 598.3, 624.8 | 104 | 23 |
| 4 | 13, 2, 3, 4, 5, 7, 1, 16, 10, 12, 18, 17, 21, 14, 11, 15, 8, 9, 6, 19, 20 | 575.7, 600.8, 627.6 | 97 | 24 |
| 5 | 13, 1, 16, 2, 3, 4, 19, 20, 5, 7, 10, 12, 18, 17, 21, 14, 15, 11, 9, 8, 6 | 567.5, 591.9, 617.5 | 108 | 19 |
| 6 | 13, 2, 3, 1, 16, 4, 20, 19, 5, 7, 10, 12, 18, 6, 17, 21, 14, 11, 9, 8, 15 | 562.9, 586.9, 611.9 | 115 | 17 |
| 7 | 13, 1, 16, 2, 3, 4, 19, 20, 10, 5, 7, 12, 18, 6, 17, 21, 14, 15, 11, 9, 8 | 565.2, 589.4, 614.7 | 114 | 18 |
| 8 | 13, 1, 16, 2, 3, 4, 5, 7, 19, 20, 10, 6, 12, 18, 17, 21, 14, 11, 9, 8, 15 | 566.4, 590.7, 616.2 | 111 | 19 |
| 9 | 13, 1, 2, 16, 3, 4, 5, 7, 10, 20, 6, 12, 18, 17, 21, 14, 15, 11, 9, 8, 19 | 569.9, 594.5, 620.5 | 107 | 21 |
| 10 | 13, 19, 1, 16, 2, 3, 4, 10, 5, 7, 12, 17, 18, 21, 14, 15, 11, 9, 8, 6, 20 | 573.3, 598.2, 624.6 | 105 | 22 |
Table 6.
Information on the disassembly of a generator.
| Order | Name | Tool | Direction | Disassembly Time/s | Priority | Difficulty |
|---|---|---|---|---|---|---|
| 1 | Oil inlet plug | 1 | z | 3.12, 4.08, 4.99 | 0 | 0 |
| 2 | Rear bearing cover | 3 | z | 5.78, 6.54, 7.17 | 0 | 0.25 |
| 3 | Speed sensors | 3 | −y | 8.70, 8.97, 9.70 | 0 | 0.15 |
| 4 | Transmission cover | 2 | y | 5.97, 6.14, 6.88 | 0 | 0 |
| 5 | Snap Ring | 4 | y | 12.35, 13.21, 13.82 | 1 | 0 |
| 6 | Front bearing cover | 1 | −y | 45.42, 46.64, 47.75 | 1 | 0 |
| 7 | Transmission rear housing | 5 | y | 33.73, 33.93, 34.66 | 1 | 0.15 |
| 8 | Transmission front housing | 3 | y | 10.14, 10.37, 10.97 | 0 | 0.25 |
| 9 | Intermediate shaft | 1 | −y | 18.59, 19.07, 19.31 | 0 | 0.1 |
| 10 | Fork pulling | 3 | −y | 11.65, 12.38, 12.75 | 0 | 0.12 |
| 11 | Input shaft | 2 | −y | 7.62, 8.03, 8.58 | 1 | 0 |
| 12 | Output shaft | 3 | y | 7.54, 8.72, 9.26 | 0 | 0 |
| 13 | Fastener 1 | 5 | −y | 15.92, 16.48, 16.79 | 0 | 1 |
| 14 | Fastener 2 | 5 | −y | 35.76, 36.62, 38.85 | 0 | 0 |
| 15 | Fastener 3 | 4 | −y | 24.80, 25.53, 26.19 | 0 | 0.15 |
| 16 | Fastener 4 | 4 | −y | 23.49, 24.10, 25.06 | 1 | 0.25 |
| 17 | Fastener 5 | 5 | y | 28.07, 28.60, 29.60 | 1 | 0.2 |
| 18 | Fastener 6 | 5 | −y | 32.43, 33.47, 34.30 | 0 | 0.1 |
| 19 | Fastener 7 | 3 | −y | 10.34, 10.81, 12.05 | 0 | 0.15 |
| 20 | Fastener 8 | 2 | −y | 4.69, 4.98, 5.09 | 0 | 1 |
| 21 | Fastener 9 | 2 | y | 3.98, 4.49, 4.68 | 0 | 1 |
| 22 | Fastener 10 | 5 | y | 15.68, 16.37, 16.99 | 1 | 0 |
| 23 | Fastener 11 | 4 | −y | 5.64, 6.43, 6.51 | 0 | 1 |
| 24 | Fastener 12 | 4 | y | 7.73, 8.37, 8.77 | 0 | 0.15 |
| 25 | Fastener 13 | 5 | y | 10.74, 11.25, 11.91 | 0 | 0.25 |
| 26 | Fastener 14 | 3 | y | 7.05, 7.68, 7.89 | 0 | 0 |
| 27 | Fastener 15 | 4 | −y | 19.05, 19.38, 20.34 | 1 | 0.1 |
| 28 | Fastener 16 | 5 | y | 23.44, 24.11, 24.68 | 0 | 0.1 |
| 29 | Fastener 17 | 4 | −y | 15.22, 15.62, 16.18 | 0 | 0.25 |
| 30 | Fastener 18 | 4 | y | 15.29, 15.93, 16.24 | 0 | 0.15 |
| 31 | Fastener 19 | 3 | −y | 6.01, 6.39, 6.63 | 0 | 1 |
| 32 | Fastener 20 | 3 | x | 4.03, 4.29, 4.52 | 1 | 1 |
| 33 | Fastener 21 | 3 | x | 5.38, 5.64, 6.08 | 0 | 1 |
| 34 | Fastener 22 | 3 | x | 11.55, 12.08, 12.20 | 0 | 0.15 |
| 35 | Fastener 23 | 2 | −x | 7.52, 7.78, 8.20 | 1 | 0 |
| 36 | Fastener 24 | 4 | −x | 16.73, 17.02, 17.36 | 0 | 0 |
| 37 | Fastener 25 | 3 | x | 9.53, 10.05, 11.55 | 1 | 0.15 |
| 38 | Fastener 26 | 4 | −x | 12.62, 12.86, 13.10 | 0 | 0.25 |
| 39 | Fastener 27 | 3 | −x | 8.71, 9.88, 10.42 | 0 | 0.15 |
| 40 | Fastener 28 | 3 | −x | 10.86, 11.17, 11.34 | 0 | 0.25 |
Table 7.
Case study B undominated solution set.
| Order | Scheme | f2 | f3 | |
|---|---|---|---|---|
| 1 | 22, 17, 25, 13, 19, 20, 21, 4, 15, 16, 18, 3, 2, 26, 24, 23, 5, 35, 39, 40, 34, 33, 32, 37, 31, 38, 36, 7, 9, 28, 14, 29, 1, 30, 27, 6, 10, 8, 11, 12 | 737.8, 771.5, 809.6 | 234 | 41 |
| 2 | 20, 21, 17, 25, 22, 14, 19, 3, 15, 16, 18, 13, 4, 1, 2, 26, 24, 23, 5, 36, 32, 37, 34, 35, 38, 40, 39, 31, 33, 7, 9, 28, 30, 27, 29, 6, 10, 8, 12, 11 | 734.2, 767.6, 805.1 | 244 | 38 |
| 3 | 17, 22, 14, 18, 25, 13, 16, 15, 2, 20, 21, 24, 26, 23, 5, 32, 35, 37, 38, 31, 19, 34, 36, 39, 33, 40, 1, 7, 4, 3, 9, 27, 29, 30, 28, 6, 10, 8, 12, 11 | 752.9, 787.9, 828.1 | 212 | 49 |
| 4 | 18, 17, 22, 15, 16, 20, 14, 19, 3, 13, 1, 2, 21, 4, 24, 23, 26, 25, 5, 37, 32, 34, 33, 35, 38, 39, 36, 40, 31, 7, 9, 27, 29, 30, 28, 6, 10, 8, 12, 11 | 744.4, 778.7, 817.4 | 231 | 41 |
| 5 | 13, 16, 15, 18, 17, 22, 25, 20, 2, 21, 24, 26, 23, 5, 32, 35, 37, 38, 31, 3, 14, 34, 36, 19, 33, 40, 39, 7, 1, 4, 9, 27, 29, 30, 28, 6, 10, 8, 11, 12 | 761.0, 796.7, 838.0 | 210 | 53 |
| 6 | 16, 20, 18, 25, 22, 17, 14, 13, 15, 19, 3, 2, 23, 26, 24, 5, 37, 32, 35, 34, 31, 33, 36, 38, 40, 39, 7, 1, 21, 4, 9, 30, 27, 29, 28, 6, 10, 8, 12, 11 | 740.1, 774.04, 812.4 | 218 | 42 |
| 7 | 18, 17, 16, 22, 21, 14, 15, 20, 3, 2, 26, 25, 24, 23, 5, 35, 39, 40, 34, 33, 32, 37, 31, 38, 36, 7, 13, 19, 4, 1, 9, 27, 29, 30, 28, 6, 10, 8, 12, 11 | 742.4, 776.5, 815.2 | 217 | 43 |
| 8 | 16, 22, 18, 17, 3, 19, 15, 13, 20, 2, 26, 25, 24, 23, 5, 35, 39, 40, 34, 33, 32, 37, 31, 38, 36, 7, 14, 1, 21, 4, 9, 27, 29, 28, 30, 6, 10, 8, 11, 12 | 745.9, 780.3, 819.5 | 214 | 45 |
| 9 | 22, 17, 14, 18, 25, 21, 13, 3, 19, 1, 20, 16, 15, 2, 26, 24, 23, 5, 34, 33, 32, 37, 31, 38, 36, 39, 40, 35, 7, 4, 9, 27, 29, 28, 30, 6, 10, 8, 12, 11 | 736.5, 770.1, 807.9 | 241 | 39 |
| 10 | 22, 16, 17, 14, 19, 21, 25, 15, 3, 18, 2, 23, 26, 24, 5, 37, 32, 35, 20, 39, 4, 40, 33, 13, 34, 38, 36, 31, 7, 9, 28, 30, 27, 29, 1, 6, 10, 8, 11, 12 | 769.2, 805.6, 848.1 | 209 | 58 |
Table 8.
Performance comparison results of each algorithm.
| Case study A | |||
| Algorithms | HV | Spread | CPU (based on s) |
| NSGA-II | 0.73 | 0.79 | 12.91 |
| MODABC | 0.75 | 0.73 | 14.61 |
| ACO | 0.70 | 0.77 | 14.32 |
| EWWO | 0.82 | 0.69 | 13.15 |
| Case study B | |||
| Algorithms | HV | Spread | CPU (based on s) |
| NSGA-II | 0.69 | 0.82 | 46.29 |
| MODABC | 0.72 | 0.75 | 47.58 |
| ACO | 0.65 | 0.80 | 53.34 |
| EWWO | 0.78 | 0.73 | 45.57 |
Disclaimer/Publisher’s Note: The statements, opinions and data contained in all publications are solely those of the individual author(s) and contributor(s) and not of MDPI and/or the editor(s). MDPI and/or the editor(s) disclaim responsibility for any injury to people or property resulting from any ideas, methods, instructions or products referred to in the content. |
© 2023 by the authors. Licensee MDPI, Basel, Switzerland. This article is an open access article distributed under the terms and conditions of the Creative Commons Attribution (CC BY) license (https://creativecommons.org/licenses/by/4.0/).
Share and Cite
MDPI and ACS Style
Fan, Y.; Zhan, C.; Aljuaid, M. Multi-Objective Disassembly Sequence Planning in Uncertain Industrial Settings: An Enhanced Water Wave Optimization Algorithm. Processes 2023, 11, 3057. https://doi.org/10.3390/pr11113057
AMA Style
Fan Y, Zhan C, Aljuaid M. Multi-Objective Disassembly Sequence Planning in Uncertain Industrial Settings: An Enhanced Water Wave Optimization Algorithm. Processes. 2023; 11(11):3057. https://doi.org/10.3390/pr11113057
Chicago/Turabian StyleFan, Yongsheng, Changshu Zhan, and Mohammed Aljuaid. 2023. "Multi-Objective Disassembly Sequence Planning in Uncertain Industrial Settings: An Enhanced Water Wave Optimization Algorithm" Processes 11, no. 11: 3057. https://doi.org/10.3390/pr11113057
Note that from the first issue of 2016, this journal uses article numbers instead of page numbers. See further details here.