
Laser Doppler Velocimetry Test of Flow Characteristics in Draft Tube of Model Pump Turbine

1
Key Laboratory of Fluid and Power Machinery, Ministry of Education, Xihua University, Chengdu 610039, China
2
Research & Testing Center of Dongfang Electric Machinery, Deyang 618000, China
*
Author to whom correspondence should be addressed.
Processes 2022, 10(7), 1323; https://doi.org/10.3390/pr10071323
Submission received: 13 June 2022
/
Revised: 29 June 2022
/
Accepted: 1 July 2022
/
Published: 6 July 2022
(This article belongs to the Special Issue Design and Optimization Method of Pumps)
Abstract
:For Francis pump turbines, the pressure pulsation characteristics of the draft tube are some of the key concerns during the operation of the units. The pressure pulsation characteristics of the draft tube are directly related to the draft tube spiral cavitating vortex rope. In this paper, the velocity distribution in the draft tube of a Francis pump turbine is tested by means of laser Doppler velocimetry. The velocity pulsation was found to be directly related to the pressure pulsation, while the velocity pulsation was also influenced by the cavitation coefficient. The main frequency of the velocity pulsation was close to the main frequency of the pressure pulsation and became larger as the cavitation factor increased.
1. Introduction
Modern energy policies require power generation solutions with minimal environmental impact and low carbon footprints. These solutions favor renewable and sustainable energy sources, such as wind, solar, nuclear, and hydroelectric power [1]. However, wind and solar energy sources tend to be intermittent and inconsistent. It is therefore difficult to plan the integration of these sources into the power system to generate electricity. An energy-storage device that can regulate the power generation and consumption of power systems is consequently required. Currently, the most mature power system energy-storage method is pumped storage. It is a key part of hydropower production and has been recognized as the most ideal method for large-scale peak shifting and energy storage in power systems [2]. Pumped-storage power plants improve power grid stability by peaking and regulating the frequency, thereby increasing grid stability, while also providing the backup capability to respond quickly to accidents.
With the rapid development of pumped-storage power plants, pump turbines—key components of pumped-storage power plants—increasingly have higher heads, capacities, and speeds [3]. Nevertheless, the hydraulic instability of the pump turbine is becoming a growing concern. Pressure fluctuations, vibrations, and swings are three major unfavorable phenomena that deteriorate the stability of the hydraulic turbine system [4]. The rapid and frequent switching between pumping and power generation modes, as well as the prolonged operation under off-design conditions, pose technical challenges for pump turbine design [5]. The draft tube vortex rope is a cavitation phenomenon that may appear in the draft tube when the water pump turbine is operated in off-design conditions, and several studies have been carried out using Venturi channels to elucidate the mechanisms underlying it [6,7,8,9,10]. The appearance of the vortex rope corresponds to the intensity of the vortex at the exit of the runner. The rotation of the vortex rope causes pressure oscillations. Pressure pulsations caused by complex internal flow are present under almost any operating condition. These pulsations are the main source of mechanical vibration and fatigue. Therefore, pressure pulsation is an important indicator for assessing the safety level in the final test of a pump turbine [11]. It is well known that the flow in the draft tube has an important influence on the overall hydraulic performance of the pump turbine. In particular, the hydraulic stability largely depends on the flow pattern in the draft tube [12,13]. Thus, it is crucial to understand the flow pattern inside the draft tube under various operating conditions for hydraulic stability, and an accurate study of the flow inside the draft tube has become increasingly important in the design and operation of reversible pump turbines [14,15,16,17,18].
Laser Doppler Velocimetry (LDV), Particle Image Velocimetry (PIV) [19,20,21,22,23], and other non-contact measurement techniques are widely used in fluid testing. LDV is an effective tool for testing flow phenomena inside draft tubes, especially flow velocity [24]. The basic principle of LDV is to measure the fluid velocity in the flow field by detecting the Doppler effect in the laser beam. When two laser beams act on a flow field of particles at a certain velocity, a frequency shift occurs when they intersect. This shift occurs according to the laser Doppler particle scattering law. The intensity of the frequency shift is proportional to the particle velocity. The velocity of the intersection point in the flow field can be obtained by capturing and analyzing the frequency shift information of the scattered light. The velocity of the impeller can be determined by measuring the velocity difference between particles, and images can be captured using high-speed photography.
Zhang et al. [25] used LDV measurements and hydrodynamic analysis to investigate and reveal the mechanism of flow separation in a pump. Their findings confirmed that any flow separation, including rotational stall in the vane diffuser, is a diffuser effect caused by an excessive diffuser expansion angle. To evaluate the strong three-dimensional flow in the retention vane channel, Edinger et al. [26] performed measurements with a two-dimensional LDV device at different locations. It was found that the number of vortices at zero discharge was not significantly different from that at very low loads. Ji et al. [27] studied the flow characteristics of the draft tube of a Francis turbine by the LDV technique and derived the relationship between draft tube pressure pulsation and velocity pulsation.
In this study, we tested the internal flow field of the draft tube of a model pump turbine using the LDV test method. We then conducted an error analysis of the LDV test results. Finally, the LDV test results for the draft tube flow field of the pump turbine in the high-efficiency area of the turbine and the high-efficiency area of the pump were analyzed.
2. Materials and Methods
2.1. Draft Tube Testing Program
2.1.1. Test Location and Distribution of Test Points
According to the IEC Hydraulic Machinery Model Test Standard, the pressure transducer should be placed at 0.3 to 1 times the diameter of the flow path of the conical section of the draft tube for the pressure pulsation test with the draft tube of the Francis pump turbine model. The axial test position in the LDV test is shown in Figure 1. The downward axial position at the center line of the guide vane is the runner outlet diameter, D2, while the circumferential position is perpendicular to the center end face of the draft tube.
Twenty-nine measurement points were determined on a radial line between the center of the test window and the center of the test section, with an overall length of 138.9 mm. The spacing of the measurement points near the wall was 1.389 mm (0.01 R), with ten points in total (including the wall point). The remaining measurement point spacing was 6.93 mm (0.05 R). See Figure 2 for details.
2.1.2. Draft Tube Transparency and Light Path Positioning
The straight cone section of the draft tube in the model test was made of Plexiglass, and the outer wall surface was cylindrical. During measurement, two beams of green light were in the vertical direction and two beams of blue light were in the horizontal direction. Four beams of light had to intersect at one point before measurement. Lasers passing through the curved boundary would have affected the optical path, and four beams of laser light could not focus on the test point, resulting in test failure. Therefore, a flat measurement window was established on a cylindrical Plexiglass tube, as shown in Figure 3. The outer surface of the test window was a circular plane with a diameter of 60 mm, and the inner surface was 30 mm in diameter.
According to the principle of light refraction, the distance traveled by a laser through Plexiglass into water is not the same as the actual distance traveled by the laser emission probe, that is, the ratio of the constant n (refractive index). This constant is related to the glass material and the material processing procedure. Thus, the actual refractive index was tested to ensure the accuracy of the test. A schematic of the calibration process is shown in Figure 4.
The laser focus point travel distance in water, the laser probe travel distance, and refractive index n can be expressed by Equation (1).
The test results are listed in Table 1, where n = 1.329 is the average value after calculation using Equation (1), and n = 1.33 is the actual adopted value.
To ensure that the laser focusing point moved along the radial line from the center point to the sidewall during measurement, the positions of the green and blue lights were repeatedly adjusted in the vertical and horizontal directions before the measurement. Meanwhile, the “cross” positioning mark of the LDV measurement window of the tapered tube section was used to locate the position, and the coordinate frame was moved back and forth by at least 200 mm. Alternatively, the height of the coordinate frame was adjusted to ensure that the green-light path was on the vertical line of the cross mark of the front and rear Plexiglass and that the blue-light path was on the horizontal line of the cross mark of the front and rear Plexiglass. This is illustrated in Figure 5. The coordinate frame was fixed to prevent it from moving during measurement.
The main technical specifications of the LDV test system are shown in Table 2.
2.2. LDV Test Measurement Error Analysis
2.2.1. Repeatability Test
Five measuring points were taken at equal distances from the center point to the side wall, each point measured five times, and an average value was taken to calculate the repeatability. Repeatability was obtained by dividing the data from each test by the average. The results are shown in Table 3. The repeatability of the test data for each measurement point was above 95%, which was considered to fully meet the repeatability requirement of the test. In the table, Cu is the circumferential velocity and Cm is the axial velocity.
2.2.2. Integral Flow Rate and Flow Meter Flow Deviation
The LDV measurement is a single-point measurement from the center point to the side wall. The integrated flow rate of each section is summed using the model test flow meter to verify that the error is reasonable. The formula for the integral flow rate is given by Equation (2):
where is the total flow rate, is the axial velocity of point , and is the distance from the measurement point to the center point.
The error distributions of the integrated flow rate and flow meter flow rate under a 14° opening degree of the turbine working condition and the pump working condition were counted, and 15 comparisons were made for the high-efficiency zone of the turbine and the high-efficiency zone of the pump, respectively, as shown in Figure 6. The errors were all within 5%, which was considered to fully meet the test accuracy requirements.
2.2.3. Error Analysis
According to the repeatability test, as well as the integral flow rate and flow meter flow deviation comparison, the error control was generally within a reasonable range, which was in line with the contract provisions. At the same time, errors were generated by many factors, mainly in the following areas:
(1) The error of the LDV test system is unavoidable; however, because the system itself has the characteristic of high precision, the system error in the test results can be negligible.
(2) The error of the LDV system instrument displacement is due to the vibration of the model test. In the test process, the unavoidable instrument displacement will cause the attenuation of the laser energy and laser light path offset; therefore, the laser energy size and laser light path position are observed in real time, and corrections are made in real time to minimize the displacement-caused error.
(3) The error is caused by the offset of the model test working point. Each test should be conducted in a stable working condition; however, a test requires a certain amount of time. At this point, the working point will incur a certain offset, resulting in errors in the final integral flow and flow meter flow.
3. Results
3.1. Analysis of LDV Test Results
The test conditions mainly included the turbine working conditions and pump working conditions under four opening degrees. The turbine braking zone, anti-pump working conditions, and pump braking working conditions were not tested. The test conditions were consistent with the parameters listed in Table 4 (6, 14, 18, and 20 are the opening angles, −1 represents the turbine mode, and −2 represents the pump mode).
3.1.1. LDV Testing for Hydraulic Turbine Operating Conditions
The axial velocity of each working condition on the draft tube test plane was obtained via the LDV test, and the time-averaged axial velocity and circumferential velocity distribution trends of each working condition are shown in Figure 7. The positive values of the axial and circumferential velocities are both in the direction of turbine operation, that is, the axial velocity is positive-downward and the circumferential velocity is clockwise-positive.
As shown in Figure 7, in the high-efficiency zone of the turbine, the time-averaged circumferential velocity and axial velocity under each opening degree exhibit similar trends in the test area. The common trend is a gradual increase from the center point of the draft tube to the position of 0.8 R, and the flow velocity decreases slightly from 0.9 R to the side wall owing to the viscous effect of the boundary layer.
With an increase in the opening degree, the flow rate increased, thereby increasing the extreme values of the axial and circumferential velocities of the draft tube. Negative axial velocities, that is, upward flow, were observed in the center of the draft tubes of OP14-1, OP18-1, and OP20-1, indicating that backflow was formed in the center of the draft tubes owing to the influence of the vortex rope of the draft tubes. The backflow area generated by the periodic rotation of the vortex rope caused the hourly average axial velocity in some areas of the test radius to show negative values. At the same time, owing to the influence of the vortex rope rotation, there was a counterclockwise rotation trend of the circumferential velocity in some areas.
The internal draft tube of the water pump turbine is a transient flow field of constant motion; observation of the time-averaged velocity has minimal significance. The pressure pulsation of the draft tube caused by the asymmetry of the pressure distribution on the section of the draft tube owing to the vortex rope is an unstable factor in the operation of the pump turbine under hydraulic turbine operating conditions. However, because the test of the draft tube pressure pulsation is often set at the wall of the pressure sensor, its change cannot represent the pressure fluctuations inside the draft tube; the internal draft tube can only be measured for the velocity pulsation.
It was found that the axial velocity pulsation and circumferential velocity pulsation exhibited strong regularity; therefore, the transient axial velocity and circumferential velocity at each working point under the turbine working condition were subjected to fast Fourier transform to analyze the spectral characteristics of the velocity pulsation. The velocity pulsations under turbine working conditions are shown in Figure 8, where the test point is 0.5 R.
As observed in Figure 8, the main frequency of pulsation of the axial velocity and circumferential velocity inside the draft tube of the pump turbine was between 0.32 and 0.38 fn under the turbine operating conditions, which is close to the main frequency of draft tube pressure pulsation of 0.33 fn. The direct source of the draft tube pressure pulsation was the velocity pulsation inside the draft tube. The direct cause of the axial velocity pulsation was the periodic feed of the runner, which was directly associated with the runner outlet flow field and was affected by the back flow caused by the draft tube vortex rope. The main source of the circumferential velocity pulsation was the asymmetry of the test plane velocity field owing to the draft tube vortex rope rotation. The pulsation intensity of the axial and circumferential velocities was affected by the vortex rope disturbance range and was associated with the test location. The measurement points in the center of the draft tube were more strongly disturbed by the vortex rope. This disturbance could be directly reflected in the directional distribution of the circumferential velocity and the distribution of the circumferential turbulence intensity over the test radius.
In the center of the draft tube, the circumferential velocity was affected by the vortex rope in the opposite direction of the rotating wheel, while the circumferential velocity at the measurement points far from the center was in the same direction as the rotating wheel; the scatter diagram of the circumferential velocity at different measurement points of OP6-4 is shown in Figure 9. In the figure, it can be observed that, in the range of OP6-4, 0–0.4 R, the direction of circumferential velocity gradually changes to become the same as the runner direction of rotation as the distance between the measurement point and the center increases. After 0.4 R, the direction of circumferential velocity is almost entirely in the runner direction of rotation, indicating that the affection range of the draft tube vortex rope in OP6-4 is 0–0.4 R. The influence range of the draft tube vortex rope is related to the opening degree in OP14-4, OP18-4, and OP20-4; the influence range of vortex ropes found by the velocity distribution of circumferential velocity was 0~0.25 R, 0~0.3 R, and 0~0.3 R, respectively.
The circumferential turbulence intensity was calculated using Equation (3). The distribution of the turbine operating condition circumferential turbulence intensity over the test radius is shown in Figure 10.
where Iu is the intensity of the circumferential turbulence, Uu’ is the root mean square of the circumferential pulsation velocity, and Uu is the average circumferential velocity.
In Figure 10, it can be observed that the turbulence intensity in the center region of the draft tube increased with the increase in opening degree. This occurred because the draft tube vortex rope was in the center of the draft tube at large opening degrees. As the opening decreased, the eccentricity of the draft tube vortex rope increased, making the range of the vortex rope influence larger. It reached the maximum range of 0~0.4 R at an opening of 6°, which is consistent with the phenomenon shown in Figure 9. It was also found that the turbulence intensity increased in the region close to the draft tube wall because the decrease in the average circumferential velocity near the boundary layer was larger than the decrease in circumferential velocity pulsation.
3.1.2. LDV Test for Water Pump Conditions
The flow inside the draft tube was stable under pump conditions, and the distributions of the circumferential and axial velocities over the test radius are shown in Figure 11.
As observed in the figure, the axial velocity distribution on the test radius of the draft tube in the high-efficiency area of the pump was highly uniform, and the circumferential velocity fluctuated slightly, similar to the turbine working condition. In addition, the average velocity decreased near the wall of the draft tube owing to the viscous effect of the boundary layer. With an increase in the opening degree, the axial velocity of the draft tube increased. As the water flow in the draft tube in the high-efficiency area of the pump was slightly disturbed by the rotation of the rotor, the circumferential velocity of the draft tube at each opening degree was maintained at a low level.
3.1.3. LDV Test of Hydraulic Turbine Operating Conditions with Different Cavitation Coefficients
The draft tube pressure pulsation is directly related to the velocity pulsation of the draft tube, while the draft tube pressure pulsation is influenced by the cavitation coefficient. Moreover, the decrease in the cavitation coefficient leads to an increase in the cavity diameter and eccentricity of the vortex core of the draft tube [28]. Thus, LDV tests of the pump turbine under different cavitation coefficients were conducted under different turbine operating conditions. The cavitation coefficient of the turbine unit is defined in Equation (4).
where Pa is the atmospheric pressure, Pi is the static pressure at the measurement point, γ is the capacitance of the water, hs is the height of the suction, and H is the water head.
Figure 12 shows the distribution of the circumferential and axial velocities over the radius of the draft tube test for different cavitation coefficients in the high-efficiency zone of the turbine at a 14° opening.
In Figure 12, it can be observed that different cavitation coefficients cause the mean circumferential velocity and mean circumferential velocity distribution on the test radius of the draft tube to change. This is because a change in the cavitation coefficient changes the diameter and eccentricity of the vortex rope, which changes the influence range of the vortex rope. It can be observed that, as the cavitation coefficient decreases, the negative range of circumferential velocities increases: the range affected by the rotation of the vortex rope increases, and the negative range of axial velocities increases, i.e., the range of backflow areas in the draft tube increases.
The fast Fourier transform of the circumferential and axial velocity pulsations on the test radius of the draft tube with different cavitation coefficients is shown in Figure 13 (test point is 0.5 R). In the figure, it can be seen that the cavitation coefficient has a direct effect on the velocity distribution in the draft tube. The vortex rope range and resonance between the vortex rope cavity and water body increase the principal frequencies of the axial and circumferential velocities with an increase in the cavitation coefficient.
In fact, as the cavitation coefficient decreases, not only does the cavity diameter of the vortex core increase, but the eccentricity distance also increases further, which in turn increases the pressure pulsation amplitude. The reason for the increase in eccentricity is that the rotational inertia of the eccentric vortex nucleus remains essentially constant, but the enlargement of the vortex nucleus reduces the mass of the central part and lengthens the force arm, which causes the eccentricity to increase. However, there is a limit to the increase in the vortex core and eccentricity imposed by the solid side walls, which cannot be expanded. The earliest limit is the eccentricity, and when the cavitation factor is reduced to a certain value, the cavity vortex core increases but the eccentricity decreases.
The increase in the cavity vortex core and eccentricity is limited by the solid boundary of the draft tube. As the cavitation factor gradually increases, the cavity vortex core increases while the eccentricity decreases. Meanwhile, the fluctuation of circumferential and axial velocity decreases, and the amplitude of the high-frequency components of axial velocity and circumferential velocity decreases significantly in the frequency domain.
4. Conclusions
This study focused on the LDV test of the internal flow field of the draft tube of a model water pump turbine. First, the test scheme of the LDV test, draft tube transparency and optical positioning, and the main components of the LDV test were introduced. Then, an error analysis of the LDV test results was performed. Finally, an analysis of the LDV test results for the draft tube flow field was performed for the pump turbine in the high-efficiency zone of the turbine and pump. The conclusions are as follows:
- 1.
- Under turbine operating conditions, the draft tube vortex rope created a backflow area in the center region of the draft tube, and the circumferential velocity pulsation and axial velocity pulsation caused by the periodic rotation of the vortex rope were the direct causes of pressure pulsation in the draft tube.
- 2.
- The range affected by the draft tube vortex rope rotation was related to the opening degree and cavitation factor. Under the three cavitation coefficient conditions tested, it was observed that, as the cavitation coefficient increased, the axial velocity and the principal frequency associated with it both decreased, while the degree of pulsation of the axial velocity and circumferential velocity also decreased.
- 3.
- LDV testing techniques on draft tubes can be used to optimize the runner design of pump turbines. They enable the performance of the runner to be tested in the design process through model tests.
Author Contributions
W.D. and Z.L. contributed equally to this paper. Conceptualization, Z.L. and W.D.; methodology, W.D.; software, Z.L. and L.S.; validation, Z.L. and W.D.; formal analysis, L.S.; investigation, W.D.; resources, D.L.; data curation, W.D.; writing—original draft preparation, Z.L. and W.D.; writing—review and editing, X.L. and W.D.; visualization, L.J. and L.S.; supervision, X.L.; project administration, L.J.; funding acquisition, X.L. All authors have read and agreed to the published version of the manuscript.
Funding
This research was funded by the National Key R&D Program of China (grant no.: 2018YFB0905200).
Institutional Review Board Statement
Not applicable.
Informed Consent Statement
Not applicable.
Data Availability Statement
Not applicable.
Acknowledgments
The authors would also like to thank Lianchen Xu, Key Laboratory of Fluid and Power Machinery, Ministry of Education, for providing support in data processing.
Conflicts of Interest
The authors declare no conflict of interest.
References
- Schleicher, W.C.; Oztekin, A. Hydraulic design and optimization of a modular pump-turbine runner. Energy Convers. Manag. 2015, 93, 388–398. [Google Scholar] [CrossRef] [Green Version]
- Li, D.; Wang, H.; Qin, Y.; Li, Z.; Wei, X.; Qin, D. Mechanism of high amplitude low frequency fluctuations in a pump-turbine in pump mode. Renew. Energy 2018, 126, 668–680. [Google Scholar] [CrossRef]
- Zhang, H.; Chen, D.; Wu, C.; Wang, X.; Lee, J.M.; Jung, K.H. Dynamic modeling and dynamical analysis of pump-turbines in S-shaped regions during runaway operation. Energy Convers. Manag. 2017, 138, 375–382. [Google Scholar] [CrossRef] [Green Version]
- Liu, S.; Shao, J.; Wu, S.; Wu, Y. Numerical simulation of pressure fluctuation in Kaplan turbine. Sci. China Technol. Sci. 2008, 51, 1137–1148. [Google Scholar] [CrossRef]
- Guo, L.; Liu, J.; Wang, L.; Qin, D.; Wei, X. Pressure fluctuation propagation of a pump turbine at pump mode under low head condition. Sci. China Technol. Sci. 2014, 57, 811–818. [Google Scholar] [CrossRef]
- Ge, M.; Petkovšek, M.; Zhang, G.; Jacobs, D.; Coutier-Delgosha, O. Cavitation dynamics and thermodynamic effects at elevated temperatures in a small Venturi channel. Int. J. Heat Mass Transf. 2021, 170, 120970. [Google Scholar] [CrossRef]
- Ge, M.; Sun, C.; Zhang, G.; Coutier-Delgosha, O.; Fan, D. Combined suppression effects on hydrodynamic cavitation performance in Venturi-type reactor for process intensification. Ultrason. Sonochem. 2022, 86, 106035. [Google Scholar] [CrossRef]
- Zhang, G.; Khlifa, I.; Fezzaa, K.; Ge, M.; Coutier Delgosha, O. Experimental investigation of internal two-phase flow structures and dynamics of quasi-stable sheet cavitation by fast synchrotron x-ray imaging editors-pick. Phys. Fluids 2020, 32, 113310. [Google Scholar] [CrossRef]
- Li, W.; Li, Z.; Qin, Z.; Yan, S.; Wang, Z.; Peng, S. Influence of the solution pH on the design of a hydro-mechanical magneto-hydraulic sealing device. Eng. Fail. Anal. 2022, 135, 106091. [Google Scholar] [CrossRef]
- Li, Z.; Li, W.; Wang, Q.; Xiang, R.; Cheng, J.; Han, W.; Yan, Z. Effects of medium fluid cavitation on fluctuation characteristics of magnetic fluid seal interface in agricultural centrifugal pump. Int. J. Agric. Biol. Eng. 2021, 14, 85–92. [Google Scholar] [CrossRef]
- Husmatuchi, V.; Farhat, M. Experiment investigation of a pump turbine at off design operating conditions. In Proceedings of the 3rd IAHR International Meeting of the Working Group on Cavitation and Dynamic Problems in Hydraulic Machinery and Systems, Brno, Czech Republic, 14–16 October 2009; pp. 339–347. [Google Scholar]
- Bergan, C.; Amiri, K.; Cervantes, M.J. Preliminary measurements of the radial velocity in the Francis-99 draft tube cone. J. Phys. Conf. Ser. 2015, 579, 012014. [Google Scholar] [CrossRef]
- Sundstrom, L.R.J.; Amiri, K.; Bergan, C. LDA measurements in the Francis-99 draft tube cone. In Proceedings of the 27th IAHR Symposium on Hydraulic Machinery and Systems, Montreal, QC, Canada, 22–26 September 2014. [Google Scholar]
- Jese, U.; Fortes-Patella, R.; Antheaume, S. High head pump-turbine: Pumping mode numerical simulations with a cavitation model for off-design conditions. In Proceedings of the 28th IAHR Symposium on Hydraulic Machinery and Systems, Grenoble, France, 4–8 July 2016. [Google Scholar]
- Zhang, X.; Burgstaller, R.; Lai, X.D. Experimental and numerical analysis of performance discontinuity of a pump-turbine under pumping mode. In Proceedings of the 28th IAHR Symposium on Hydraulic Machinery and Systems, Grenoble, France, 4–8 July 2016. [Google Scholar]
- Gentner, C. Numerical and experimental analysis of instability phenomena in pump-turbines. In Proceedings of the 26th IAHR Symposium on Hydraulic Machinery and Systems, Beijing, China, 19–23 August 2012. [Google Scholar]
- Trivedi, C.; Cervantes, M.; Gandhi, B.; Dahlhaug, O. Experimental and numerical studies for a high head Francis turbine at several operating points. J. Fluid. Eng. 2013, 135, 111102. [Google Scholar] [CrossRef]
- Krappel, T.; Riedelbauch, S.; Jester-Zuerker, R.; Jung, A.; Flurl, B.; Unger, F.; Galpin, P. Turbulence resolving flow simulations of a Francis turbine in part load using highly parallel CFD simulations. In Proceedings of the 28th IAHR Symposium on Hydraulic Machinery and Systems, Grenoble, France, 4–8 July 2016. [Google Scholar]
- Sheng, S. New development in the technology of flow measurement over the last decade. Mech. Eng. 2002, 24, 1–14. [Google Scholar]
- Ge, M.; Manikkam, P.; Ghossein, J.; Subramanian, R.K.; Coutier-Delgosha, O.; Zhang, G. Dynamic mode decomposition to classify cavitating flow regimes induced by thermodynamic effects. Energy 2022, 254 Pt C, 124426. [Google Scholar] [CrossRef]
- Ge, M.; Zhang, G.; Petkovšek, M.; Long, K.; Coutier-Delgosha, O. Intensity and regimes changing of hydrodynamic cavitation considering temperature effects. J. Clean. Prod. 2022, 338, 130470. [Google Scholar] [CrossRef]
- Deng, W.; Xu, L.; Li, Z.; Tang, W.; Wang, X.; Shang, L.; Liu, D.; Liu, X. Stability Analysis of Vaneless Space in High-Head Pump-Turbine under Turbine Mode: Computational Fluid Dynamics Simulation and Particle Imaging Velocimetry Measurement. Machines 2022, 10, 143. [Google Scholar] [CrossRef]
- Xu, L.; Jin, X.; Li, Z.; Deng, W.; Liu, D.; Liu, X. Particle Image Velocimetry Test for the Inter-Blade Vortex in a Francis Turbine. Processes 2021, 9, 1968. [Google Scholar] [CrossRef]
- Liu, D.M.; Zhao, Y.Z.; Zuo, Z.G. Experimental research on flow field in the draft tube of pump turbines based on LDV. IOP Conf. Ser. Earth Environ. Sci. 2019, 240, 072030. [Google Scholar] [CrossRef] [Green Version]
- Zhang, Z. Rotating stall mechanism and stability control in the pump flows. IOP Conf. Ser. Earth Environ. Sci. 2010, 12, 012010. [Google Scholar] [CrossRef] [Green Version]
- Edinger, G.; Erne, S.; Doujak, E.; Bauer, C. Flow determination of a pump-turbine at zero discharge. IOP Conf. Ser. Earth Environ. Sci. 2014, 22, 032051. [Google Scholar] [CrossRef] [Green Version]
- Ji, L.; Xu, L.; Peng, Y.; Zhao, X.; Li, Z.; Tang, W.; Liu, D.; Liu, X. Experimental and Numerical Simulation Study on the Flow Characteristics of the Draft Tube in Francis Turbine. Machines 2022, 10, 230. [Google Scholar] [CrossRef]
- Liu, S.-B.; Shi, G.-T.; Liu, D.-M. Hydraulic Turbine Pressure Pulsation and Hydraulic Vibration; China Water Conservancy and Hydropower Press: Beijing, China, 2020. [Google Scholar]
Figure 1.
LDV test location of the model test.

Figure 2.
Test point distribution along the test radius.
Figure 3.
(a) Test window design diagram. (b) Test window of the model pump turbine.
Figure 4.
Data calibration principle.
Figure 5.
Schematic diagram of laser optical path positioning.

Figure 6.
Error between integrated flow and flow meter flow.

Figure 7.
Average tangential velocity and axial velocity in turbine mode.
Figure 8.
Frequency domain diagram of axial and tangential velocity pulsations under turbine mode.

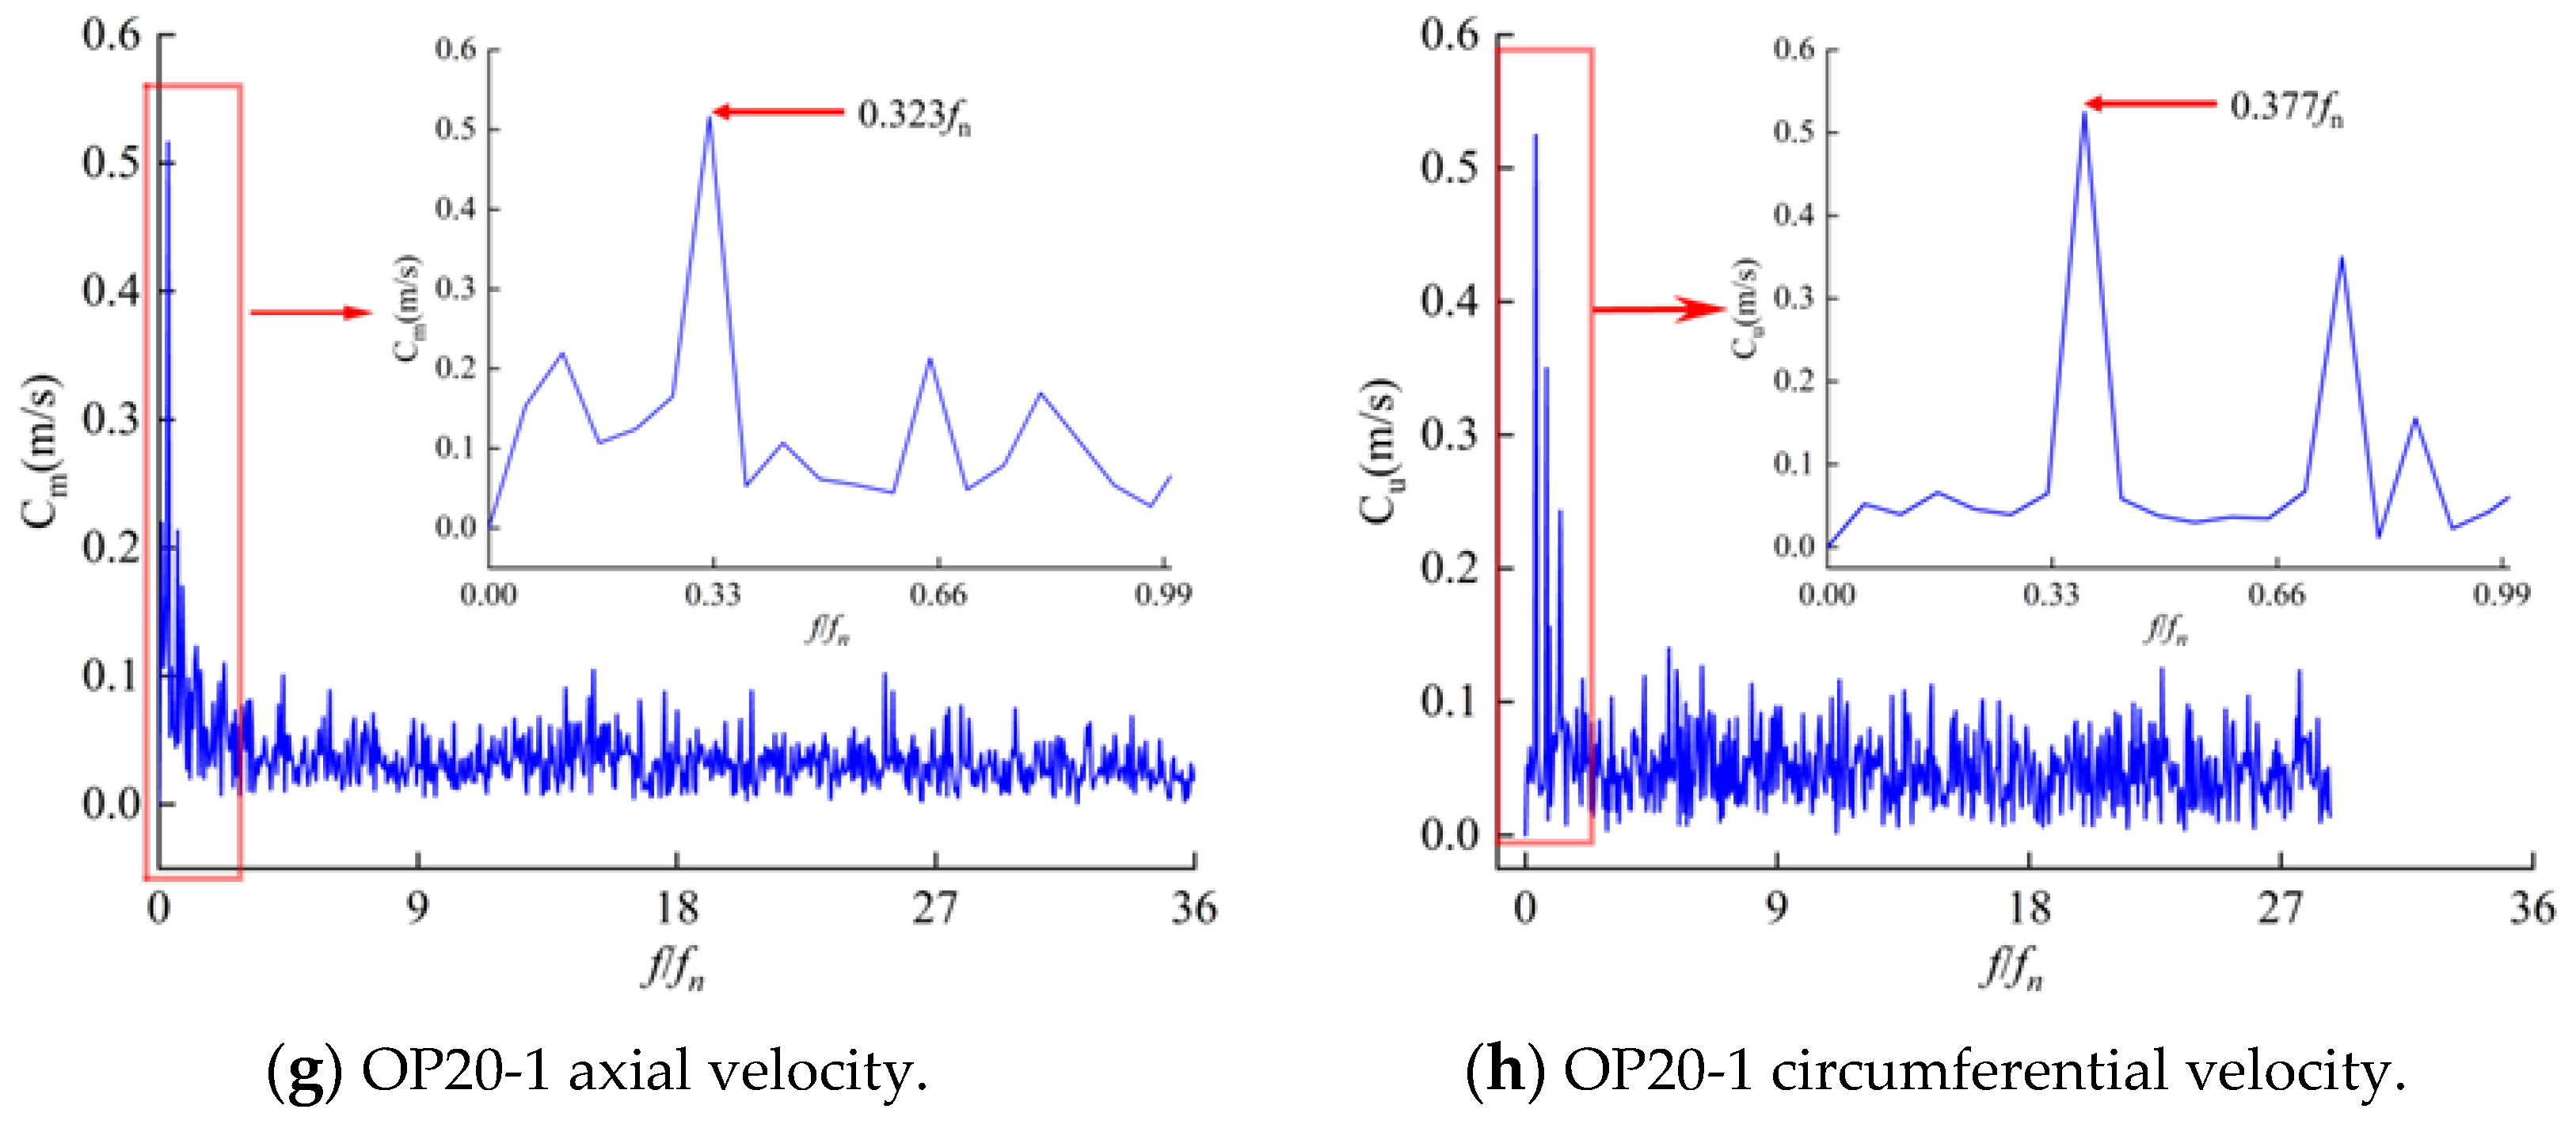
Figure 9.
OP6-4 scatter plot of tangential velocity.
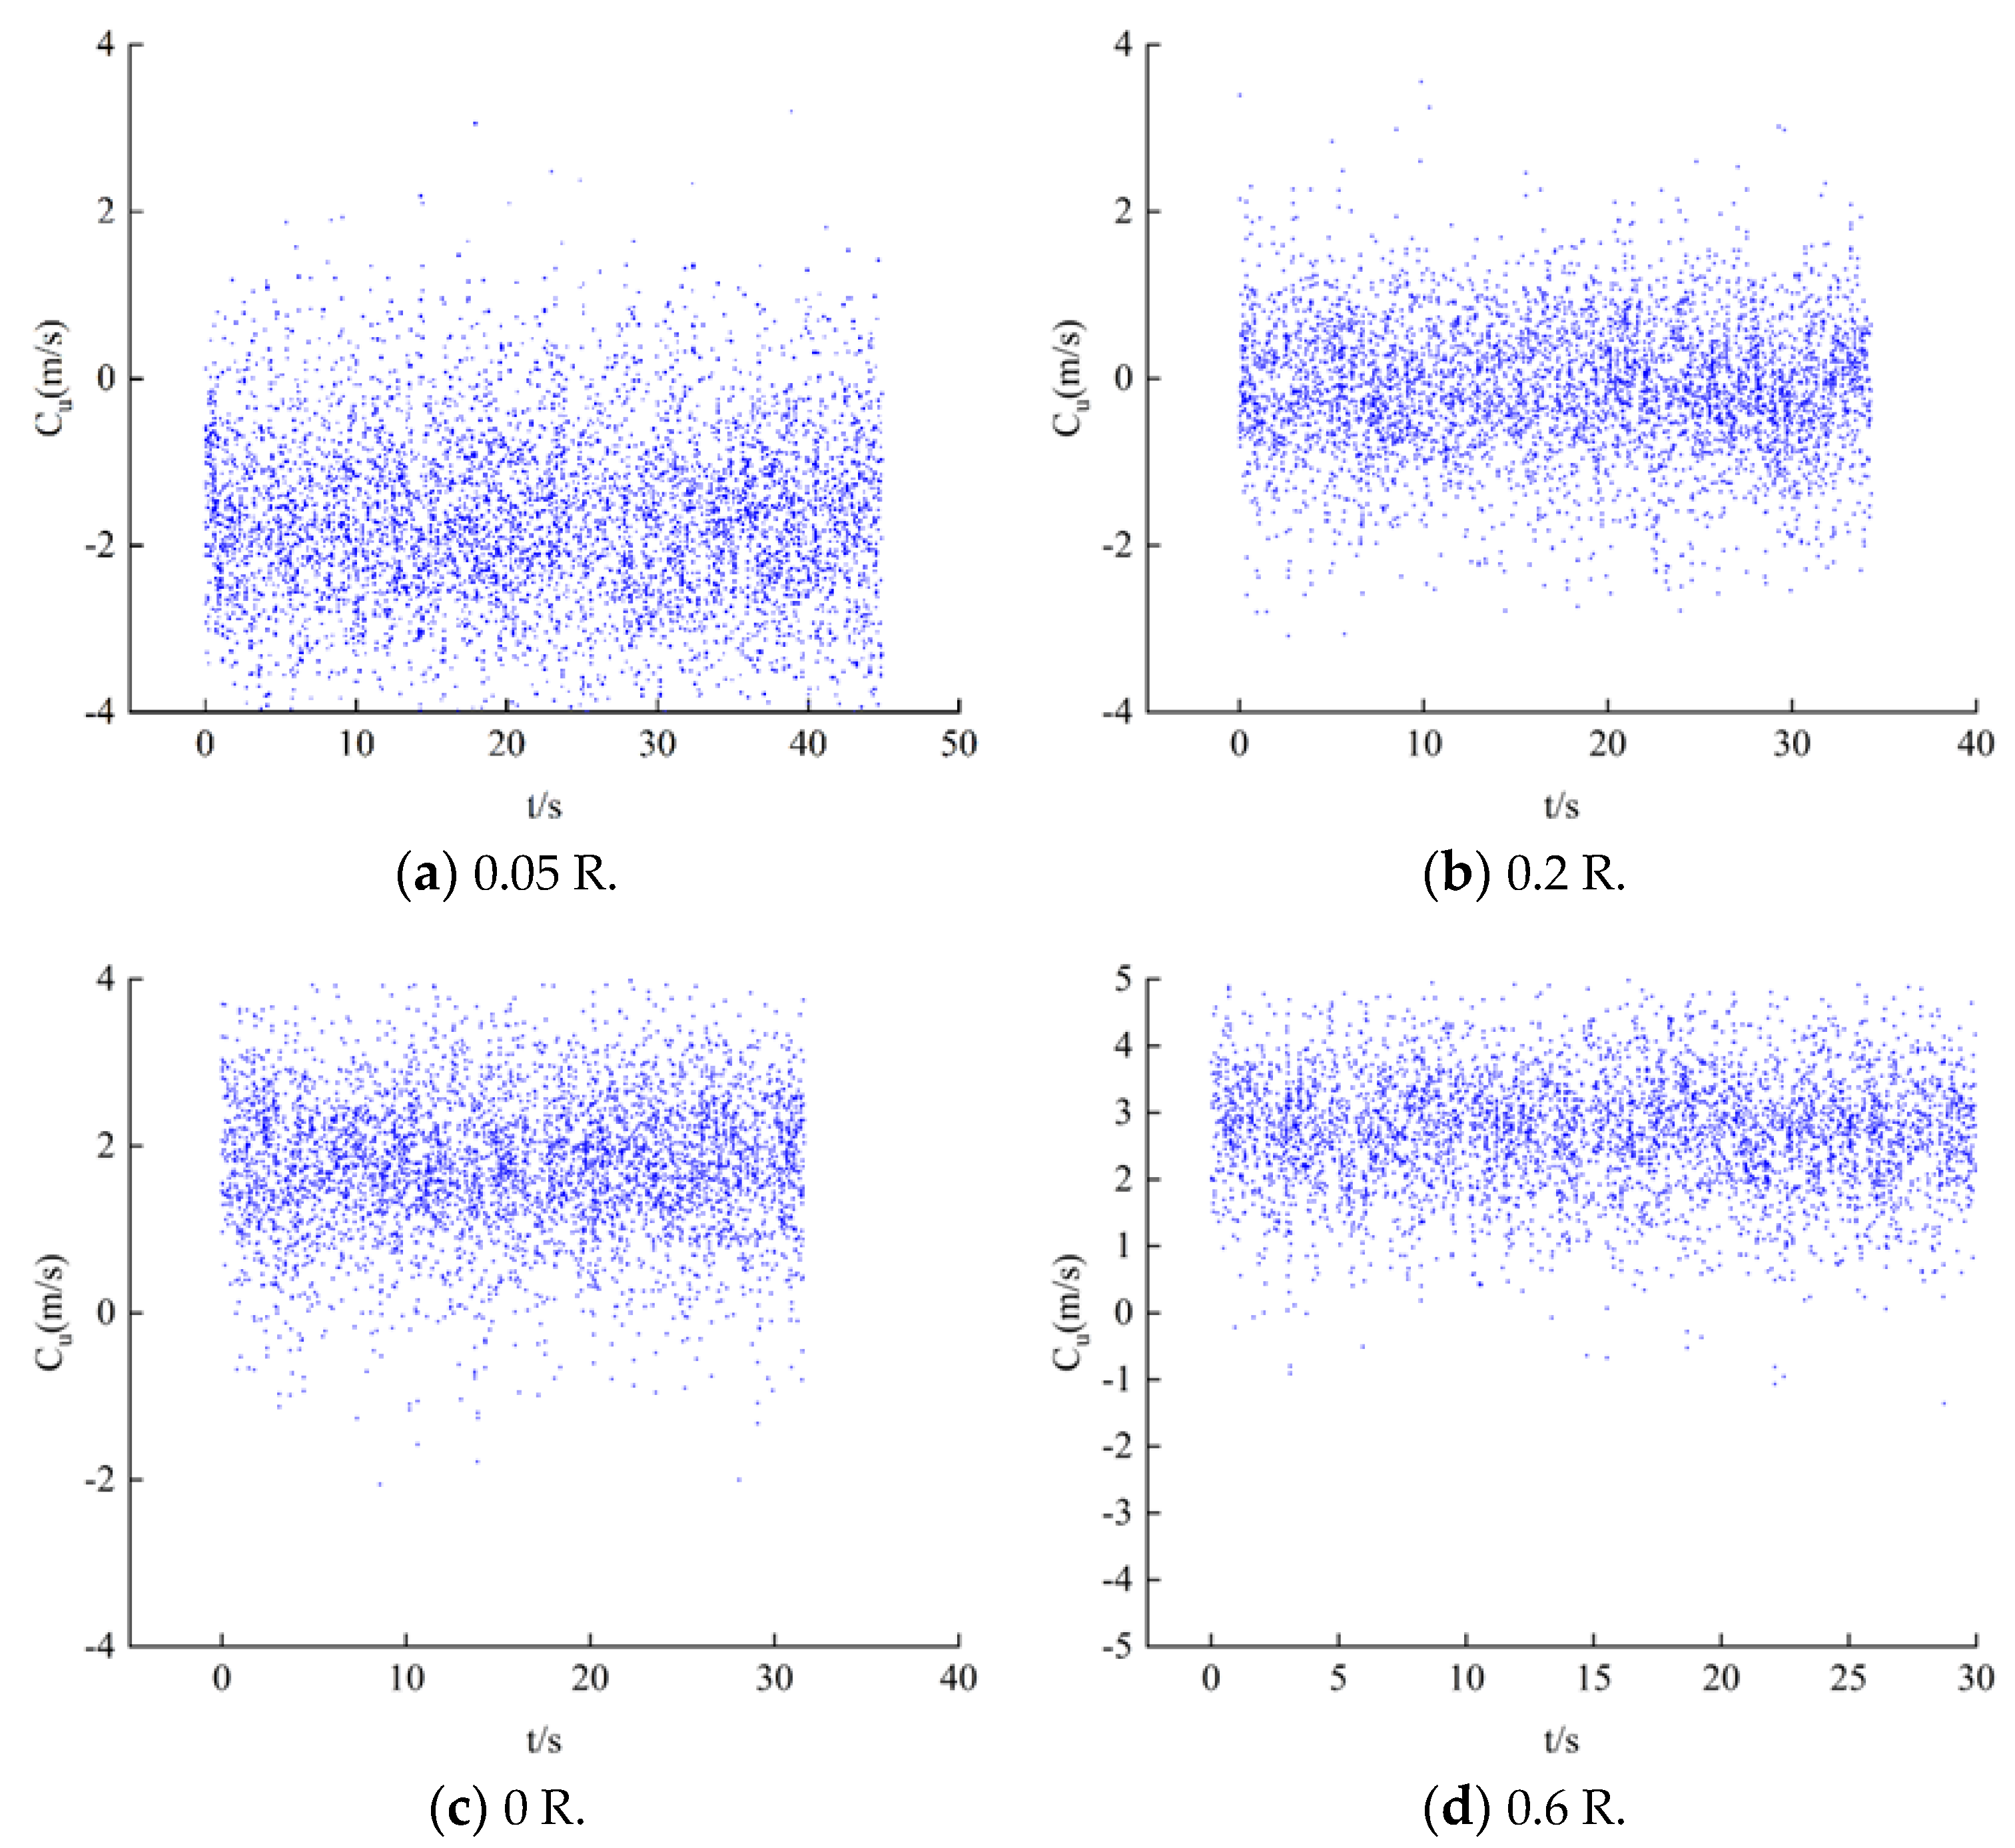
Figure 10.
Turbulence intensity distribution in turbine mode.

Figure 11.
Average tangential velocity and axial velocity in pump mode.
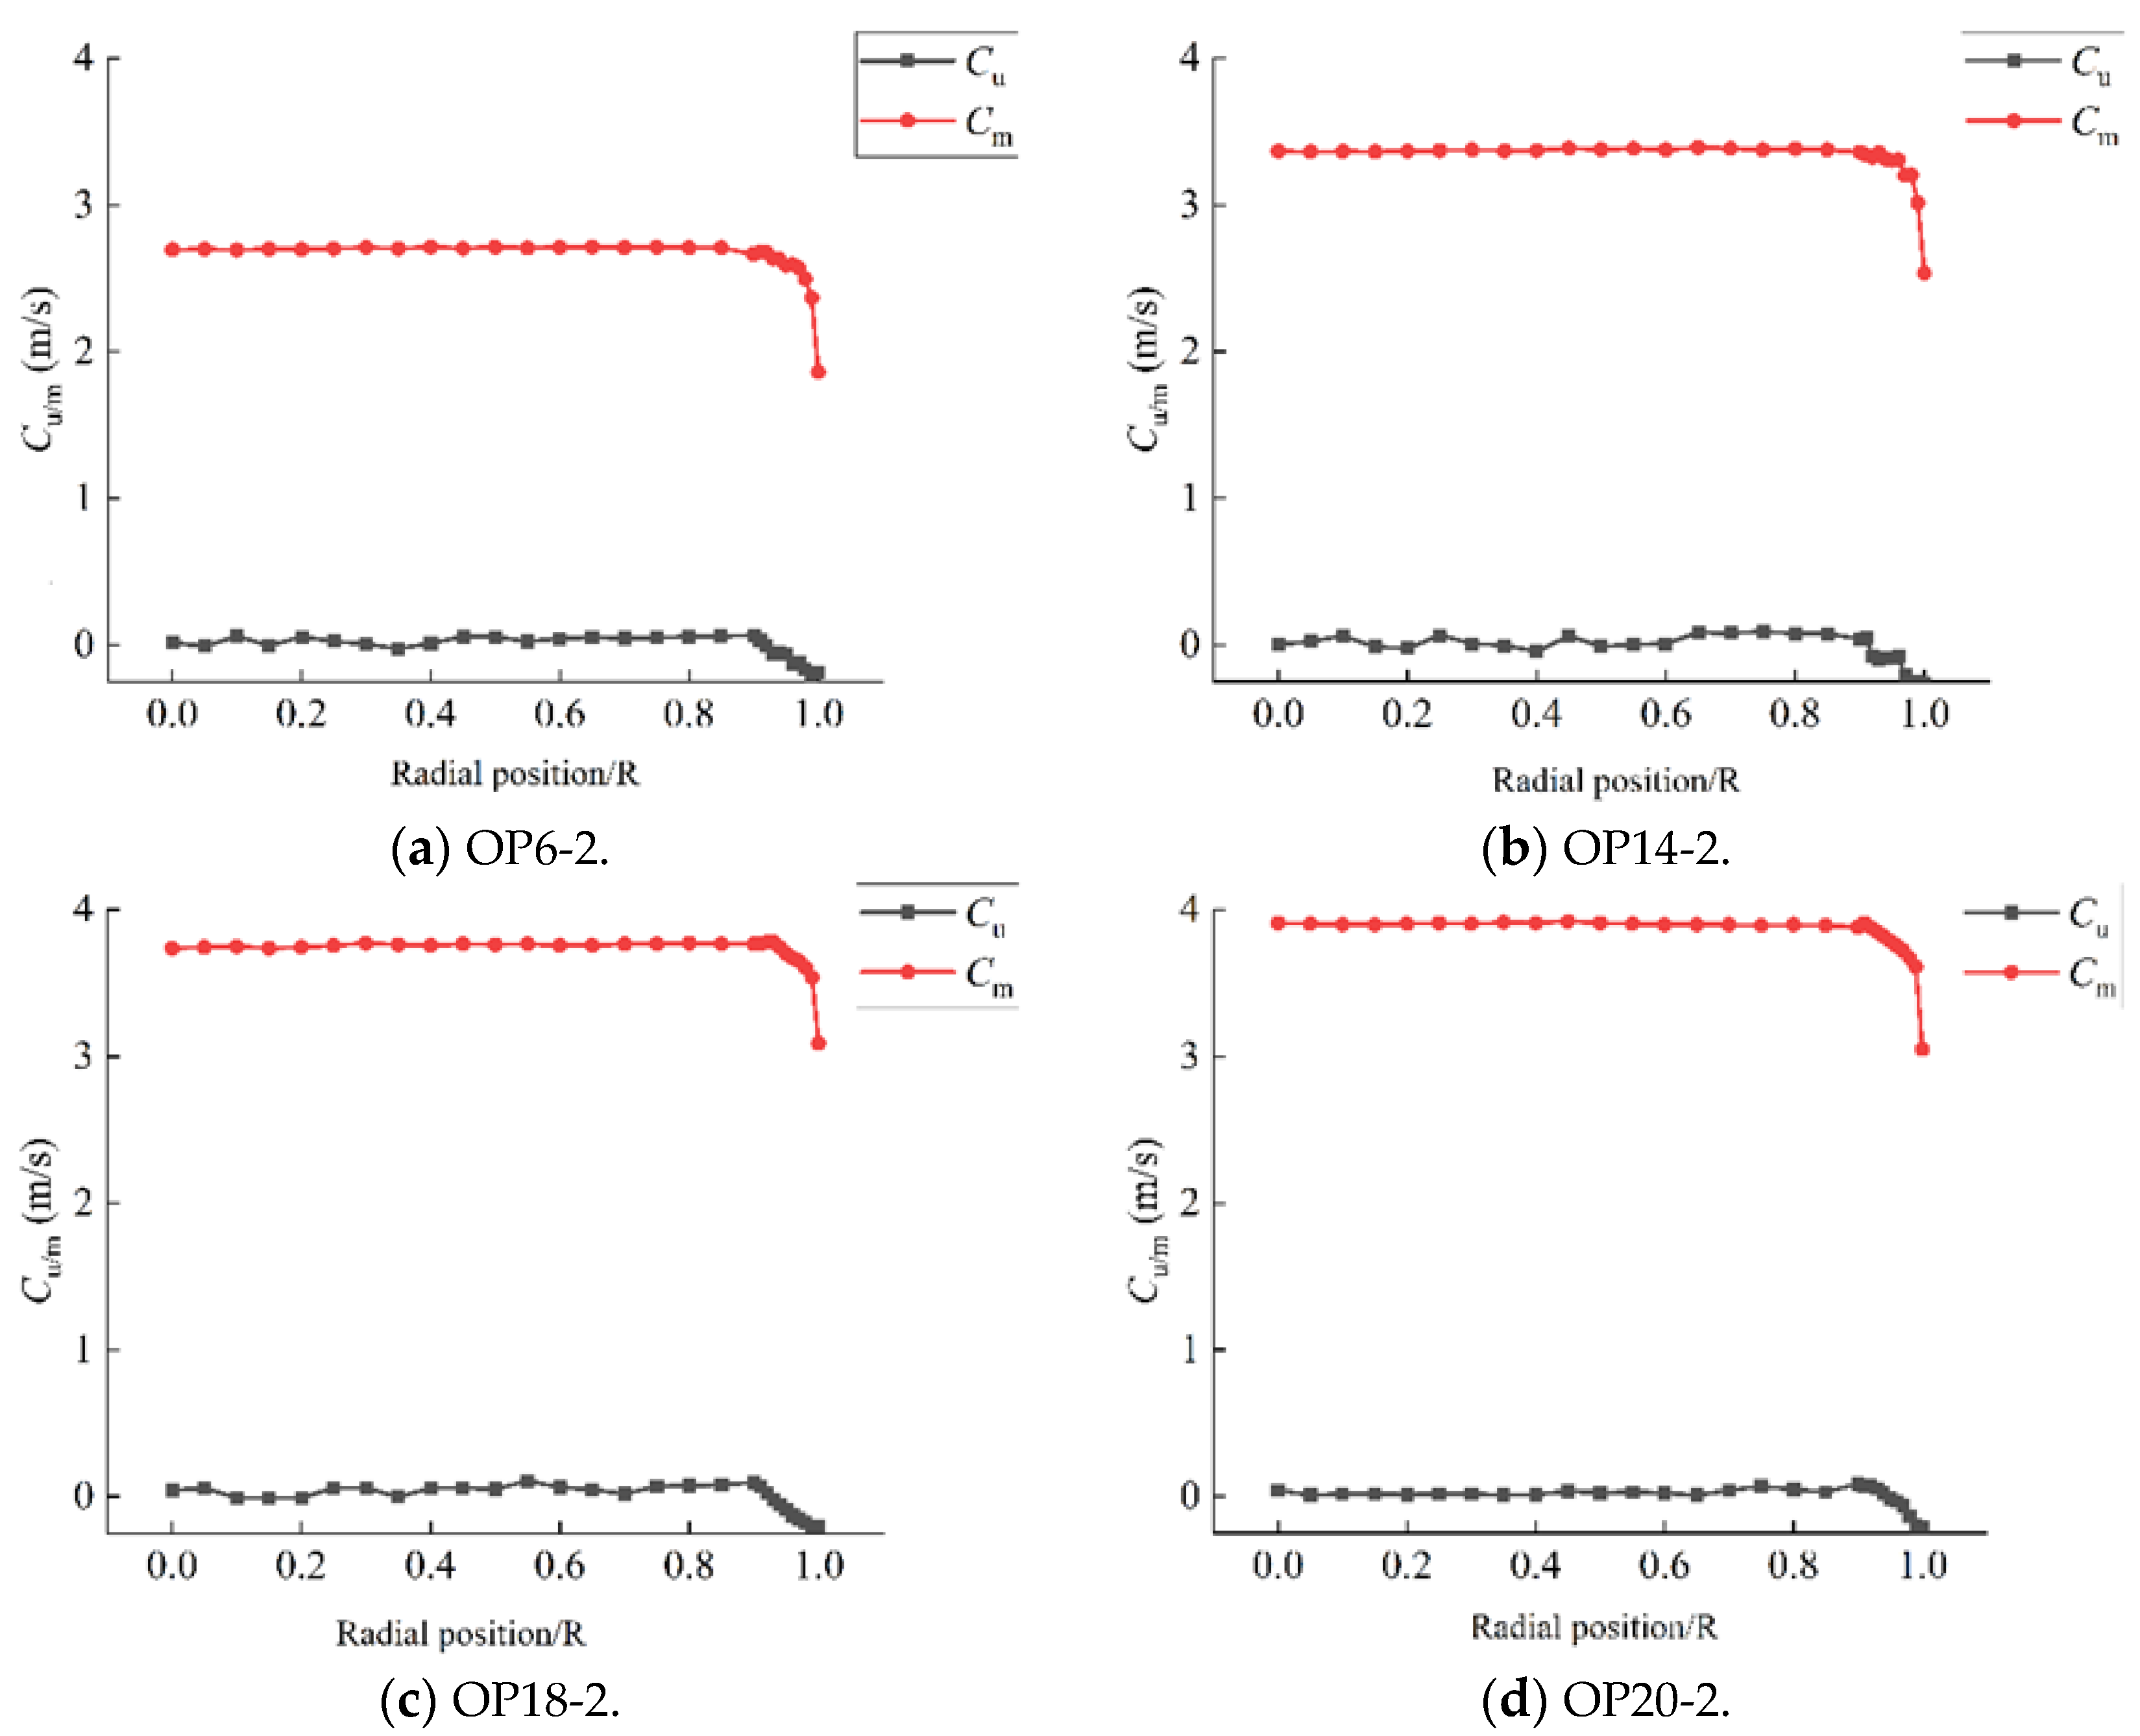
Figure 12.
Draft tube velocity distribution for different cavitation coefficients under turbine mode.
Figure 12.
Draft tube velocity distribution for different cavitation coefficients under turbine mode.
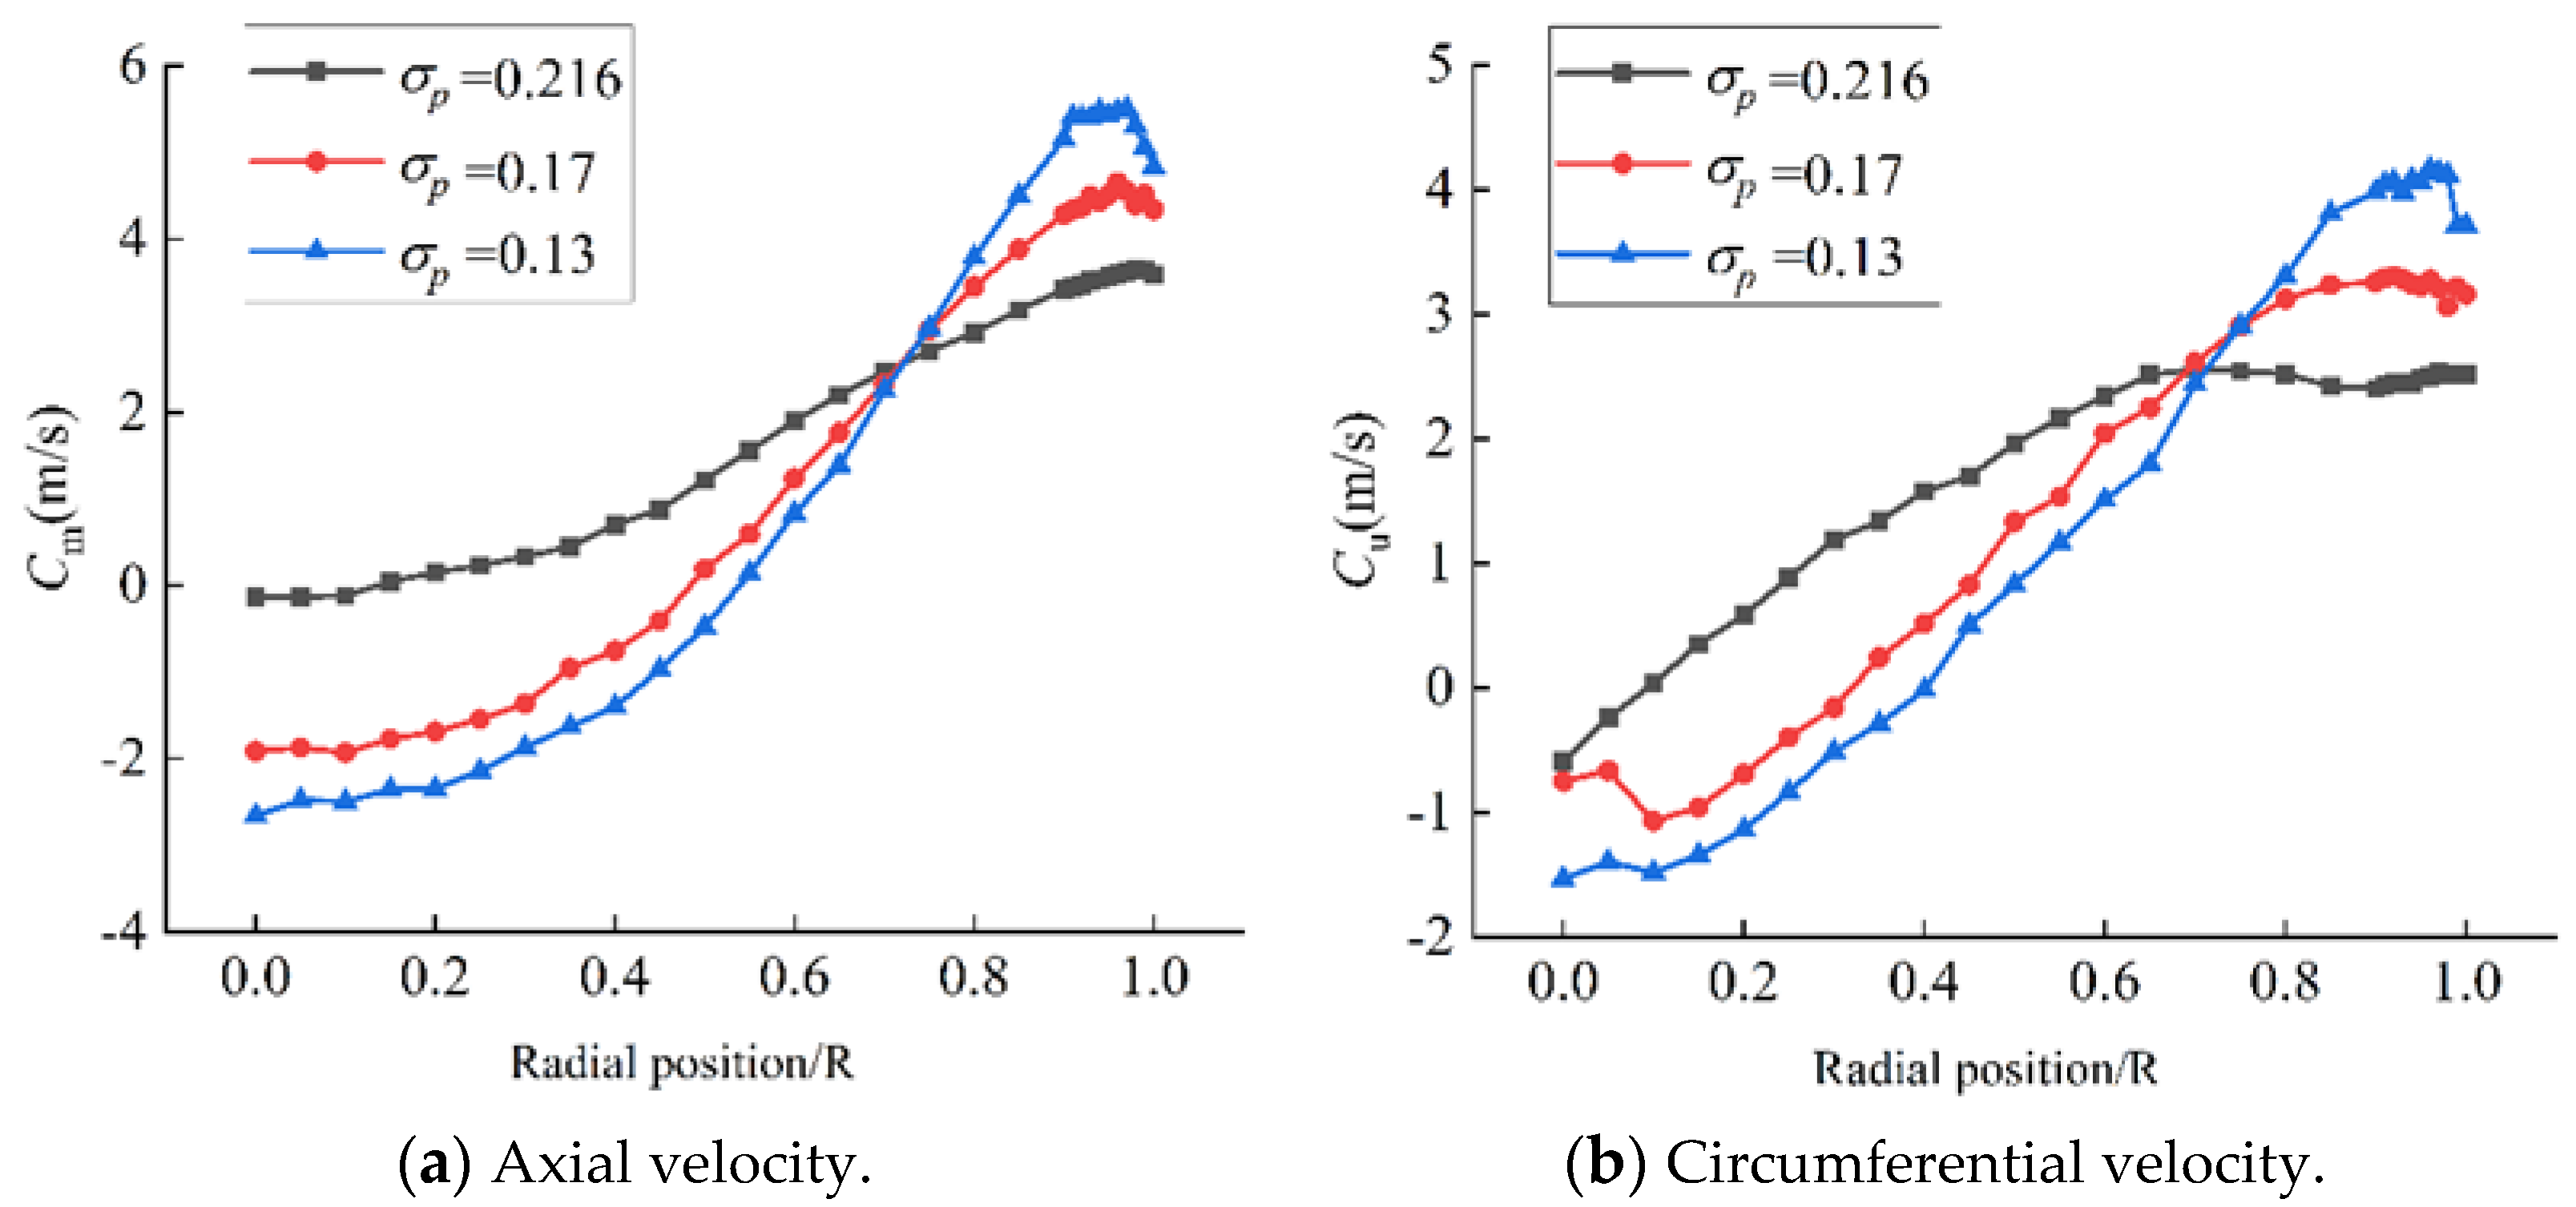
Figure 13.
Draft tube velocity distribution for different cavitation coefficients under turbine mode.
Figure 13.
Draft tube velocity distribution for different cavitation coefficients under turbine mode.


Table 1.
Travel distance between the laser focus point and laser probe.
| Group | Group | ||||
|---|---|---|---|---|---|
| Group 1 | 160 | 131.50 | Group 2 | 140 | 103.34 |
| 130 | 107.49 | 130 | 95.15 | ||
| 105 | 78.76 | 115 | 84.02 | ||
| 75 | 56.22 | 80 | 58.48 |
Table 2.
Technical index of LDV test system.
| Parameters | Information |
|---|---|
| Test range | −150~1000 m/s |
| Precision | 0.1% |
| Scope of application | 3D measurement of gas, liquid, or multiphase flows |
| Sampling frequency | 400~800 MHz |
| Maximum processing frequency | 175 MHz |
| Minimum processing frequency | 300 Hz |
| Dynamic range | 8-bit |
| Frequency Shift | Built-in |
| Minimum Time | 50 ns |
| Maximum sampling rate | 800 MHz |
Table 3.
LDV test repeatability test.
| Distance/mm | Number of Repetitions | Cu (m/s) | Cm (m/s) | Cu Repeatability/% | Cm Repeatability/% |
|---|---|---|---|---|---|
| 18 | 1 | 1.179 | 0.7849 | 96.452 | 97.054 |
| 2 | 1.1172 | 0.7254 | 98.120 | 95.142 | |
| 3 | 1.1088 | 0.7711 | 97.383 | 98.864 | |
| 4 | 1.1205 | 0.7775 | 98.410 | 98.025 | |
| 5 | 1.1675 | 0.7533 | 97.462 | 98.801 | |
| 36 | 1 | 1.9698 | 3.7116 | 98.931 | 99.277 |
| 2 | 1.9543 | 3.7656 | 99.726 | 99.279 | |
| 3 | 1.9400 | 3.7234 | 99.540 | 99.592 | |
| 4 | 1.9472 | 3.7635 | 99.910 | 99.335 | |
| 5 | 1.9335 | 3.7291 | 99.207 | 99.745 | |
| 54 | 1 | 1.478 | 3.7446 | 99.586 | 99.856 |
| 2 | 1.5028 | 3.7261 | 98.743 | 99.650 | |
| 3 | 1.4748 | 3.7545 | 99.371 | 99.591 | |
| 4 | 1.4905 | 3.7450 | 99.571 | 99.845 | |
| 5 | 1.4746 | 3.7258 | 99.357 | 99.642 | |
| 72 | 1 | 1.5128 | 3.7672 | 99.324 | 99.885 |
| 2 | 1.5231 | 3.7453 | 100.000 | 99.533 | |
| 3 | 1.5302 | 3.7535 | 99.534 | 99.751 | |
| 4 | 1.5300 | 3.7835 | 99.547 | 99.451 | |
| 5 | 1.5194 | 3.7648 | 99.757 | 99.948 | |
| 90 | 1 | 2.2578 | 3.1054 | 98.988 | 99.995 |
| 2 | 2.2241 | 3.0730 | 99.504 | 98.952 | |
| 3 | 2.2530 | 3.1177 | 99.203 | 99.608 | |
| 4 | 2.2159 | 3.1148 | 99.137 | 99.702 | |
| 5 | 2.2251 | 3.1168 | 99.549 | 99.637 |
Table 4.
Table of operating points.
| Operating Point | Q11/(L/s) | n11/(r/min) | n/(r/min) |
|---|---|---|---|
| OP6-1 | 237.28 | 31.60 | 599.91 |
| OP14-1 | 524.09 | 33.53 | 599.86 |
| OP18-1 | 636.4 | 34.30 | 599.95 |
| OP20-1 | 667.8 | 36.27 | 599.92 |
| OP6-2 | −348.46 | −38.01 | −639.87 |
| OP14-2 | −504.33 | −37.78 | −599.85 |
| OP18-2 | −540.4 | −38.32 | −599.84 |
| OP20-2 | −704.83 | −40.17 | −599.92 |
Publisher’s Note: MDPI stays neutral with regard to jurisdictional claims in published maps and institutional affiliations. |
© 2022 by the authors. Licensee MDPI, Basel, Switzerland. This article is an open access article distributed under the terms and conditions of the Creative Commons Attribution (CC BY) license (https://creativecommons.org/licenses/by/4.0/).
Share and Cite
MDPI and ACS Style
Deng, W.; Li, Z.; Ji, L.; Shang, L.; Liu, D.; Liu, X. Laser Doppler Velocimetry Test of Flow Characteristics in Draft Tube of Model Pump Turbine. Processes 2022, 10, 1323. https://doi.org/10.3390/pr10071323
AMA Style
Deng W, Li Z, Ji L, Shang L, Liu D, Liu X. Laser Doppler Velocimetry Test of Flow Characteristics in Draft Tube of Model Pump Turbine. Processes. 2022; 10(7):1323. https://doi.org/10.3390/pr10071323
Chicago/Turabian StyleDeng, Wanquan, Zhen Li, Lei Ji, Linmin Shang, Demin Liu, and Xiaobing Liu. 2022. "Laser Doppler Velocimetry Test of Flow Characteristics in Draft Tube of Model Pump Turbine" Processes 10, no. 7: 1323. https://doi.org/10.3390/pr10071323
Note that from the first issue of 2016, this journal uses article numbers instead of page numbers. See further details here.