
Design and Optimization of γ-Shaped Settlement Training Wall Based on Numerical Simulation and CCD-Response Surface Method


College of Hydraulic Science and Engineering, Yangzhou University, Yangzhou 225009, China
*
Author to whom correspondence should be addressed.
Processes 2022, 10(6), 1201; https://doi.org/10.3390/pr10061201
Submission received: 29 April 2022
/
Revised: 8 June 2022
/
Accepted: 14 June 2022
/
Published: 17 June 2022
(This article belongs to the Special Issue Design and Optimization Method of Pumps)
Abstract
:To ameliorate the inflow state of the joint hub of a pump station and sluice, a γ-shaped settlement training wall was designed with its state adjusted automatically in line with the actual working condition of the project. The central composite design (CCD) of the response surface method was adopted to optimize the geometrical size of the training wall in the operational states of pumping and free-draining separately. The results showed that the alteration of different size factors of the γ-shaped settlement training wall had different degrees of influence on its rectification effect; the intake flow state of the joint hub of the sluice and pumping station with the γ-shaped settlement training wall can be significantly improved with the flow velocity uniformity in the inlet channel next to the junction of the sluice chamber, reaching 80.42%, and the flow velocity uniformity ahead of the sluice, reaching 84.78%, in the operational state of free-draining. By combining the results of numerical simulation, the feasibility of the response surface method was further verified and the optimal combination of geometric parameters of the γ-shaped settlement training wall were also obtained, which can be adopted in the design of the actual joint hub of the pump station and sluice.
1. Introduction
Over the past few years, the joint hub of the pump station and sluice has been rapidly promoted because of its compact layout and small occupancy area, effectively solving the problems of land acquisition, demolition, and resettlement, achieving some remarkable economic and social benefits. However, due to the restriction of its structural form and working conditions during the actual operation process, it is quite easy to cause deterioration of the flow state in upstream and downstream of the joint hub of the pump station and sluice [1,2]. When the sluice or pump station work separately, water flows into the sluice or the forebay of pump station at a certain lateral angle, which will affect the flow state and momentum distribution of the original river channel, resulting in the imbalance of momentum between both sides of the riverbed and causing a wide range of backflow and transverse flow. Finally, it abates the operation efficiency of the joint hub of the pump station and sluice, even affecting the secure working of the whole construction [3,4]. As a result, it is of great practical significance to study the inlet flow state of the joint hub of the pump station and sluice and analyze the causes of its bad flow state so that some reasonable and effective rectification measures can be put forward scientifically, thus ensuring the secure and efficient operation of the whole project.
With the rapid development of fluid calculation technology, numerical simulation has become an important research means to explore the hydraulic flow characteristics in hydraulic engineering [5,6,7,8]. As for some representative large hydraulic structures like pump stations, sluices, dams, and reservoirs, some scholars have studied their hydraulic flow characteristics and designed some effective rectification measures [9,10,11], while regarding the joint hub of the pump station and sluice, due to the restriction of their structural form, their inflow patterns are often relatively worse and some progress have also been achieved in relevant research [12,13]. Luo et al. [14] assessed the flow state in the forebay of the joint hub of a pump station and sluice by numerical simulation. The results showed that there is a large-scale back-flow region near the partition pier in the forebay and setting the diversion pier can significantly abate the scope of the reflux area, improving the velocity distribution in the section of inlet channel. Su et al. [15] analyzed the flow rectification effect of various rectification schemes on the joint hub of a pump station and sluice under different conditions by the method of CFD numerical simulation and put forward the layout scheme of combined rectifier pier, which can greatly abate the lateral large-scale reflux intensity of the side pier unit and improve the bad flow state of the pump station effectively. Xi et al. [16] used FLUENT software to simulate the rectification effect of the combined rectification measures formed by setting a water hole on the training wall next to the junction of the sluice chamber and pump station. The results showed that this measure can move up and narrow the scope of the reflux area, relieving the phenomenon of mainstream bias flow and the uniformity of flow velocity distribution of the inlet channel can also be improved. For the joint hub of the pump station and sluice with complex and changeable operation conditions, most studies are still focused on the rectification under a single operation condition and they only achieved a relatively better rectification measure by optimizing from the pre-designed scheme. In this case, the research method will be limited to the pre-designed design criteria of the research scheme and the optimal scheme still needs to be further optimized. Xu et al. [17] proposed a Y-shaped settlement training wall suitable for the joint hub of a pump station and sluice with 15° transverse side angle, greatly improving the inflow flow pattern under both the operational state of free-draining and pumping. However, the implementation conditions of this study are limited to the formulation of flow state improvement measures based on a specific project example. There is still a lack of some relevant universal application analyses for various kinds of joint hubs of sluice and pump stations under various operating conditions. Additionally, though this study analyzed the characteristics of the inlet flow under the schemes with different geometric parameters of the training wall through orthogonal test, it can only analyze isolated test points, which has the disadvantages of low accuracy and poor predictability, let alone the provision of the regression model and summary of the relevant universal laws.
For the sake of improving the inflow state of the joint hub of pump station and sluice when it is operating, this study designed a γ-shaped settlement training wall fixed at the junction of the sluice and the pump station with its state adjusted automatically in line with the actual working condition. To begin with, based on the research of reference [17], this study reproduced the research model and the relevant method while the schemes of the size parameters combination of the training wall were designed based on the method of central composite design (CCD) of the response surface method, then the parameter sample points were drawn up. Secondly, by selecting the research indicators respectively in the operational state of pumping and free-draining, the scheme was fitted with the response surface model combined with the calculated values of numerical simulation. Combined with the fitting results, the complex functional relationship between the parameters designed and the research indexes can be obtained through statistical analysis so as to optimize the parameters and reasonably predict the optimal scheme of the size of the training wall. Thirdly, through the analysis of the flow field under different working conditions of the predicted optimal scheme, the rationality of the results of CCD can be further verified and the degree of the influence of the changes of dimensional parameters of the training wall on the inflow state of the joint hub of pump station and sluice can be obtained. Finally, through the horizontal comparison with other related similar studies, the applicability of the γ-shaped settlement training wall designed in this study and the feasible improvement scheme were summarized and analyzed. The structural form and the optimization method of the γ-shaped settlement training wall designed in this study can provide technical support for the design of asymmetric joint hubs of sluices and pump stations with engineering training walls.
2. Research Area and Object
Based on the numerical simulation software of NX and Fluent, a 3D numerical model of the intake part of a joint hub of a sluice and pump station was established with its calculation area displayed in Figure 1. The model mainly consisted of an intake river, sluice, pump station, and inlet channel and the forebay of the pump station was arranged on the right bank of the intake river with the sluice set on the left bank. It was a typical arrangement of asymmetric joint hub of sluice and pump station with a total of six pump units in the pump station with a design flow of 30 m3/s of a single unit. The inlet channels of the pumping station were numbered as 1#, 2#, 3#, 4#, 5#, and 6# from left to right in the direction of the water flow of which the 1# inlet channel was set at the side of left wing wall, 6# water inlet channel was set at the side of sluice, and there were three gates set in the sluice chamber with the numbers of 7#, 8#, and 9# separately, of which the 7# sluice was set at the side of the pumping station and the 9# sluice was set at the side of the right wing wall. In Figure 2, the specific layout plan is shown, where the total length of the calculation model was 280 m, the widest part was 117.0 m long, the bottom level of the forebay and approach river was 11.4 m, the altitude of the pump station inlet basin floor was 6.65 m, and the altitude of the sluice basin floor was 11.4 m. In the operational state of pumping and free-draining, the pump station operated and the sluice was closed when the upstream water level was taken as 21.0 m and the downstream water level was taken as 24.3 m. In the operational state of free-draining, the pump station stopped running and sluice was opened when the upstream water level was taken as 22.2 m and the downstream water level was taken as 22.05 m.
As shown in Figure 3, this study designed a γ-shaped settlement training wall set at the junction of the sluice and the pump station wall and it was mainly divided into curved part I, curved part II, curved part III, curved part IV, and junction section. The layout of the training wall can be adjusted automatically in line with the actual working condition of the project. In the operational state of pumping, as displayed in Figure 4, the curved part III and curved part IV settled automatically until their top levels were lower than the bottom level of the forebay. In the operational state of free-draining, as displayed in Figure 5, the curved part I and curved part II settled automatically until their top levels were lower than the bottom level of gate.
As displayed in Figure 6, the main dimensional parameters of the training wall were the arc radius R1 and the center angle θ1 of curved part I, arc radius R2 and center angle θ2 of curved part II, arc radius R3 and center angle θ3 of curved part III, and arc radius R4 and center angle θ4 of curved part IV. In the operational state of pumping, the curved part I and curved part II settled automatically, in which case the arc radius R1 of curved part I, the center angle θ1 of curved part I, the arc radius R2 of curved part II, and the center angle θ2 of curved part II were regarded as the research factors. In the operational state of free-draining, the curved part III and the curved part IV settled automatically, in which case the arc radius R3 of curved part III, the center angle θ3 of curved part III, the arc radius R4 of curved part IV, and the center angle of curved part IV θ4 were regarded as the research factors.
3. Study Method
3.1. Numerical Simulation
In order to facilitate horizontal comparison, the same calculation model was established and meshed on the basis of reference [17] and the error of the number of meshes was controlled within 3%. At the same time, for the sake of calculation accuracy being ensured, the independence analysis of the calculation grid was carried out [18,19]. In the operational state of pumping and free-draining, the head loss from the intake river to the admission section of the inlet channel was selected as the feature index to obtain a suitable grid number. When the calculated grid number was 1267834, 1337106, 1578652, 1885234, 2090125, and 2215625 respectively, the corresponding hydraulic losses were 0.025350 m, 0.025230 m, 0.025150 m, 0.025147 m, 0.025149 m, and 0.025150 m. As shown in Figure 7, when the grid number exceeds 1578652, the head loss keeps roughly unchanged, coming up to the standard of grid independence analysis. In the operational state of free-draining, the head loss from the upstream of intake river to the gate was selected as the characteristic index to obtain a suitable grid number. After the independence analysis, the number of calculation grids was less than that in the operational state of pumping and free-draining, so it can also come up to the standard of grid independence analysis in the operational state of free-draining, in which case the number of calculation grids was also 1686251. The grid division of the inlet section of the calculation area under pumping and free-draining conditions is shown in Figure 8.
After a series of calculation, the Reynolds number of the flow in the forebay of this model in the operational state of pumping was 1.5 × 10⁵ and in the operational state of free-draining, the Reynolds number of the flow ahead of the sluice was 1.1 × 10⁵, both of which were far greater than 3 × 10⁴. Therefore, the flow in the forebay in the operational state of pumping and the flow in front of the sluice in the operational state of free-draining can be regarded as incompressible turbulent motion [20]. So, the realizable k– turbulence model and SIMPLEC algorithm were selected to solve the flow distribution in the forebay in the operational state of pumping and the flow distribution ahead of the sluice in the operational state of free-draining [21,22]. Additionally, because the flow of water follows three equations, the basic governing equations calculated in this paper were continuity equation, momentum equation, the continuity equation, and momentum equation:
where and represent the direction coordinate axis; and represent velocity vectors in the direction of and respectively; g represents the acceleration of gravity; p represents the turbulent pressure; represents the fluid density; and represents the effective viscosity coefficient of turbulence.
Combined with the turbulent kinetic energy k and its dissipation rate equation, the realizable k– turbulence model was adopted and the corresponding equation is:
According to the reference value provided in reference [21] and a large number of experimental verification, the calculation parameters , , , , and in the realizable k– model were taken as 1.44, 1.92, 0.09, 1.00, and 1.30 respectively.
According to the method of setting boundary condition in reference [17], in the operational state of pumping, the inlet boundary was set at the admission section of the intake river where the inlet condition adopts the parameter of flow velocity and the outlet boundary was set at the admission section of each inlet channel of the pump station. In the operational state of free-draining, the inlet boundary was still fixed at the admission section of the intake river where the flow velocity was adopted as the inlet condition and the outlet boundary was set at the admission section of the sluice. The water surface is free, which changes little with time, so it adopted the rigid cover assumption whose boundary condition was set as a symmetrical type. As for the wall boundary condition, in this study, the realizable k– turbulence model was used for numerical simulation and the Reynolds number was high under both operating conditions, so the wall function method was considered to deal with the flow near the wall. Additionally, the research object of this article is only the flow in the forebay and in front of the sluice. As a result, considering that the flow near the wall has little impact on the research problem of this paper, the standard wall function was directly adopted.
3.2. Response Surface Method
The response surface method is kind of an experimental optimization design method integrating mathematical modeling and optimization design which has high accuracy and good predictability. It can obtain the optimal parameters by analyzing the relationship between the fitting factors of multiple quadratic regression equation and the response value. This method can continuously analyze all levels of the factors tested in the process of optimization, making up for the shortcomings of time-consuming and difficult implementation of the single-factor method. Additionally, it also overcomes the defects of experimental design methods such as orthogonal design and uniform design, which can only analyze isolated test points and cannot provide regression models. So, it has been widely used in fluid machinery research in recent years [23,24,25] and designing the scheme based on the response surface method is to select the sample points of parameters designed first, according to the selected experimental design method, within the reasonable range of parameters and carry out response surface fitting combined with the calculated values of numerical simulation calculation. Through the analysis of fitting results, the response surface model approximates the complex functional relationship between characteristic quantities and design parameters, summarizing relevant and reliable research conclusions [26,27]. Response surface design usually adopts central composite design (CCD) with five levels or Box Behnken design (BBD) with three levels for experimental design. The former has more tests than the latter, but it can obtain a better fitting model and higher calculation accuracy. BBD method is mostly used in the case that the test level design is limited and cannot be tested [28] while in this research the horizontal design range of geometric parameters of the γ-shaped settlement training wall was wide. So, in order to make the test data processing more accurate and the results more reliable, the central composite design (CCD) was selected in this study.
3.3. Notability Analysis
Notability analysis is a kind of data analysis method. By formulating a hypothesis about the parameters of the random variables and the distribution form of the population in advance, it can use the sample information to judge whether this hypothesis is reasonable, that is, to judge whether there is a significant difference between the real situation of the population and the original hypothesis [29]. In this research, we adopted the notability analysis to analyze the data produced in response surface design and then by calculating the p value of the significance level of each parameter to the statistical characteristic quantity, the influence degree of each dimension factor of the diversion wall on its rectification effect can be judged.
4. Scheme Design and Result Analysis
4.1. Selection of Research Indicators
Xu et al. [30] used the overall normal model to carry out hydraulic model test and research on the joint hub of the pump station and sluice with a conventional zigzag training wall. The results showed that in the operational state of pumping, there was a large area of reflux at the side of sluice and the edge of the reflux area bypassed the head of the diversion pier which disturbed the flow state of the forebay and resulted in serious oblique flow near the diversion pier in the forebay. In the operational state of free-draining, there was a large area of reflux in the forebay with its edge still bypassing the head of the diversion pier and which violently disturbed the flow state in front of the sluice in which a more obvious vortex was generated in front of the sluice next to the diversion pier.
By making the preliminary analysis of the flow state of the joint hub of the pumping station and sluice under the initial plan, which was not designed with any rectification measure, as shown in Figure 9, the adverse flow state in the forebay in the operational state of pumping mainly has a relatively serious impact on the inlet conditions of the 6# inlet channel. In the operational state of free-draining, as displayed in Figure 10, the flow state in front of the 7# sluice was the most disordered. Therefore, as for the research index in the operational state of pumping, the uniformity of flow velocity distribution of the admission section of the 6# channel was selected while in the operational state of free-draining, the uniformity of flow velocity distribution of the admission section of the 7# sluice was selected as the research index.
4.2. Scheme Design and Result Calculation
As for different types joint hubs of pump stations and sluices, the range of each parameter of the training wall needs to be determined in combination with the disturbance range of the adverse flow state in the forebay and ahead of the gate chamber under the initial plan, which was not designed with any rectification measure; the data of the inflow state of the joint hub of pump station and sluice with the training wall is designed with the proposed size. In this study, the central composite design parameters of the joint hub of the pump station and sluice operating in the operational state of pumping were arc radius R1 of curved part I, center angle θ1 of curved part I, arc radius R2 of curved part II, and center angle θ2 of curved part II of the γ-shaped settlement training wall. When designing the composite test point, the above four factors were selected, along with five levels also selected for each factor. In the operational state of free-draining, the central composite design parameters were arc radius R3 of arc section III, center angle θ3 of arc section III, arc radius R4 of curved part IV, and center angle θ4 of curved part IV of the γ-shaped settlement training wall. As shown in Table 1 and Table 2, the central composite design of response surface test with four factors and five levels was carried out under two working conditions and the coding level takes −α, −1, 0, 1, α (α = 2) as indicators.
The central composite design of the response surface method was used for experimental design in this research. As shown in Table 3 and Table 4, with 30 response test points designed respectively under two working conditions, the response sample values were obtained by numerical simulation of each test point.
4.3. Model Fitting and Notability Analysis
This study used the software Design-Expert to carry out statistical processing on the experimental results. In the operational state of pumping, the uniformity of flow velocity distribution of the admission section of the 6# channel was selected as the research indicator. The multiple linear regression and binomial fitting were carried out on the tested factors including the arc radius R1 of curved part I, the center angle θ1 of curved part I, the arc radius R2 of curved part II, and the center angle θ2 of curved part II. In this research, ANOVA was used to analyze the regression parameters of effect surface and the results of analysis of variance are shown in Table 5. Similarly, in the operational state of free-draining, the uniformity of flow velocity distribution of the admission section in front of the 7# sluice was taken as the research index. Factors arc radius R3 of curved part III, center angle θ3 of curved part III, arc radius R4 of curved part IV, and the center angle θ4 of curved part IV were selected to carry out multiple linear regression and binomial fitting. In this case, ANOVA was still used to analyze the regression parameters of the effect surface in the operational state of free-draining and the results of analysis of variance were shown in Table 6.
It can be seen from the data in the above table that under the pumping condition, the value of F of the fitting model was 4.55, which demonstrates that the calculation model and the fitted equation have good reliability, so it can be used to analyze and predict the optimal size parameters of the training wall. When the value of p of the tested factor was less than 0.05, it indicates that this factor had a prominent impact on the variation of the research index [31]. Therefore, in this calculation model, the arc radius R1 of curved part I and the center angle θ2 of curved part II were the key factors affecting the variation of the index while the center angle θ1 of curved part I and the arc radius R2 of curved part II were secondary factors (p > 0.1). So, as for some specific actual situations, the parameters θ1 and R2 can be adjusted within the test range. After a series of calculations, in the operational state of pumping, the fitted equation of the dimension parameters selected on the research index is as follows:
where RC represents the uniformity of flow velocity distribution of the admission section of the 6# Channel which is expressed as a percentage.
It can be seen from the data in the above table that under the condition free-draining, the value F of the fitting model was 5.9, which demonstrates that the calculation model and the fitted equation have good reliability, so they can be well used to analyze and predict the best size parameters of the training wall. By analyzing the results, it can be found that the were angle θ3 of curved part III was the key factor affecting the variation of research index while the arc radius R3 of curved part III, the center angle θ4 of curved part IV, and the arc radius R4 of curved part IV were secondary factors. So, as for some specific actual situations, the parameters R3, θ4, and R4 can be adjusted within the test range. After a series of calculations, in the operational state of free-draining the fitted equation of the dimension parameters selected on the research index is as follows:
where RZ represents the uniformity of flow velocity distribution of the admission section in front of the 7# sluice which is expressed as a percentage.
4.4. Parameter Optimization
According to the results of model analysis, in the operational state of pumping, the factors R1, θ2, θ1, R1, R12, and R22 have a prominent impact on the variation of the specific indicator while in the operational state of free-draining, factors θ3, θ32, R32, θ42, R42 have a remarkable influence on the change of the corresponding indicator. By using the software Design Expert, the interaction effect of various factors under two working conditions can be calculated and the factors that have a relatively noteworthy impact on the variation of the index investigated under the interaction of each factor can be obtained. That is, as shown in Figure 11, factors arc radius R1 of curved part I and center angle θ2 of curved part II were selected to investigate their degrees of influence on the variation of the uniformity of velocity distribution of the admission section of the 6# inlet channel in the operational state of pumping. Similarly, in Figure 12, in the operational state of free-draining factors arc radius R3 and center angle θ3 of curved part III were selected as critical factors affecting the variation of the uniformity of velocity distribution of the admission section in front of the 7# sluice.
Under the pumping condition, comprehensively considering the influencing factors and the optimal area in Figure 11, the upper limit of the investigation factors θ1, R1, θ2, R2, and the optimization index RC were set as large as possible. According to the optimization module of the software Design Expert, the optimal condition range procured by superimposing each model was calculated to obtain the final optimal size combination of the training wall: the center angle θ1 of curved part I: 43.5°, arc radius R1 of curved part I: 5.36t, center angle θ2 of curved part II: 46.2°, arc radius R2 of curved part II: 2.62b where b represents the net width of the 7# sluice and t represents the net width of the 6# inlet channel in which case it was predicted that the uniformity of velocity distribution of the admission section of the 6# inlet channel can reach 80.53%.
Under the free-draining condition, comprehensively considering the influencing factors and the optimal area in Figure 12, the upper limit of the investigation factors θ3, R3, θ4, R4, and the optimization index Rz were set as large as possible. According to the optimization module of the software Design Expert, the optimal condition range procured by superimposing each model was calculated to obtain the final optimal size combination of the training wall: the center angle θ3 of curved part III: 43.0°, arc radius R3 of curved part III: 6.43b, center angle θ4 of curved part IV: 40.6°, arc radius R4 of curved part IV: 1.37t where b represents the net width of the 7# sluice and t represents the net width of the 6# inlet channel in which case it was predicted that the uniformity of velocity distribution of the admission section ahead of the 7# sluice can reach 84.79%.
5. Numerical Simulation and Scheme Verification
5.1. Feature Section Selection
In order to further understand the inflow features of the γ-shaped settlement training wall applied in the joint hub of the pump station and sluice, the horizontal section and vertical section of the calculation model were selected as the characteristic section under the pumping condition and the flow field features were analyzed. While under the free-draining condition, the superficial horizontal section of the calculation model was selected as the characteristic section and the distribution characteristics of transverse velocity and axial velocity were analyzed.
As shown in Figure 13, under the pumping condition, two horizontal sections and a vertical section were selected for flow field analysis in which a-a was the horizontal section 0.1h right from the water surface, b-b was the bottom horizontal section 0.9h from the water surface, and c-c was the vertical section at the inlet segment of the inlet channel which was 0.1L from the inlet section of the inlet channel. In this case, h represents the calculated water depth of the model under the pumping condition and L represents the axial length of the inlet channel of the calculated model. Under the free-draining condition, as displayed in Figure 14, the horizontal section d-d was selected as the characteristic section which was 0.1h away from the water surface of the sluice where h represents the calculated depth of the water under the free-draining condition.
5.2. Analysis of Numerical Simulation Results
In this study, by the central composite design of the response surface method, there were 30 training wall parameter combination schemes designed in the operational state of pumping and free-draining respectively. The test results were analyzed by variance and the relevant parameters were optimized, obtaining a set of optimal training wall size combination schemes, Z1: the center angle θ1 of curved part I: 43.5°, arc radius R1 of curved part I: 5.36t, center angle θ2 of curved part II: 46.2°, arc radius R2 of curved part II: 2.62b, the center angle θ3 of curved part III: 43.0°, arc radius R3 of curved part III: 6.43b, center angle θ4 of curved part IV: 40.6°, and the arc radius R4 of curved part IV: 1.37t where b represents the net width of the 7# sluice and t represents the net width of the 6# inlet channel. For the sake of further analyzing and verifying the rationality of the optimization results, the optimal scheme was numerically simulated and its flow field diagram was analyzed in the operational state of pumping and free-draining respectively.
5.2.1. Operational State of Pumping
When the joint hub of the pump station and sluice operates under the pumping condition, the curved part III and curved part IV of the γ-shaped settlement training wall settled automatically until their top levels were lower than the bottom level of the forebay. By numerical simulation, the flow field of the joint hub of the pump station and sluice was studied during the operation of the pumping station and the optimal scheme of the size of the training wall was analyzed and verified. The flow field diagram of its characteristic section was shown in Figure 15. In the operational state of pumping, there was a large region of low-speed area and reflux phenomenon at the side of the sluice in which case the curved part II of the γ-shaped training wall isolates the backflow at the side of the sluice and abates its disturbance to the flow state of the forebay. Compared with the flow field diagram of the initial scheme in Figure 9, the curved part I guides the flow in the forebay around the training wall into the inlet channel smoothly, so that the oblique flow phenomenon in front of the 6# inlet channel was greatly improved and basically, the flow lines in the forebay became smoother, entering each water inlet channel evenly. Additionally, it can be found that under the optimal size combination design scheme of the training wall, the flow state on the surface and bottom of the forebay was relatively smooth and the velocity distribution in the 1–6# inlet channel was relatively uniform. Through numerical simulation and the analysis of its results, 1–6#, the axial velocity distribution uniformity of the inlet channel was 79.82%, 80.13%, 79.82%, 79.85, 80.75%, and 80.42% of which the axial velocity distribution uniformity of the 6# inlet channel was the research index of this research, was also close to the final prediction result of the response surface scheme, and it was higher than that of the schemes calculated in the response surface scheme design. To conclude, in the operational state of pumping, the results of the analysis of the response surface method were basically consistent those that of numerical simulation, i.e., the optimal size combination scheme of the training wall in the operational state of pumping is: the center angle θ1 of curved part I: 43.5°, the arc radius R1 of curved part I: 5.36t, the center angle θ2 of curved part II: 46.2°, and the arc radius R2 of curved part II: 2.62b where b represents the net width of the 7# sluice and t represents the net width of the 6# inlet channel.
5.2.2. Operational State of Free-Draining
When the joint hub of the pump station and sluice operates under the free-draining condition, the curved part I and curved part II of the γ-shaped settlement training wall settled automatically until their top levels were lower than the bottom level of the sluice. Likewise, by numerical simulation, the flow field diagram of the joint hub of pump station and sluice was studied during the operation of sluice and the optimal scheme of the size of the training wall was analyzed and verified. The flow field diagram of its characteristic section is shown in Figure 16 in, which Figure 16a shows the transverse velocity cloud diagram and Figure 16b shows the axial velocity cloud diagram. In the operational state of free-draining, there was a large region of low-speed area and reflux in the forebay, in which case the curved part IV of the γ-shaped training wall isolatesd the backflow in the forebay and abated its disturbance to the flow state ahead of the sluice. Compared with the flow field under the initial scheme displayed in Figure 10, the curved part III guided the water in front of the sluice into the sluice chamber smoothly, so that the eccentric flow phenomenon at 5# sluice was greatly improved. It can be found that under the optimal size combination scheme of the training wall, the flow state in its 7–9# sluice chambers was even, the streamline was relatively smooth, and the maximum transverse velocity of water flow was less than 0.3 m/s. After calculation and analysis, the uniformity of axial velocity distribution ahead of the 7–9# sluices was 84.78%, 85.22%, and 84.51% respectively of which the axial velocity distribution uniformity in front of the 7# sluice was the research index of this paper, was also close to the final prediction result of the response surface scheme, and it was higher than that of the schemes calculated in the response surface scheme design. To conclude, under the free-draining condition, the results of the analysis of the response surface method were basically consistent with those of numerical simulation, i.e., the optimal size combination scheme of the training wall under the free-draining condition is: the center angle θ3 of curved part III: 43.0°, arc radius R3 of curved part III: 6.43b, center angle θ4 of curved part IV: 40.6°, and arc radius R4 of curved part IV: 1.37t where b represents the net width of the 7# sluice and t represents the net width of the 6# inlet channel.
6. Discussion
Xu et al. [32,33] designed an open-cell diversion pier which can be applied to the joint hub of the pump station and sluice. Through numerical calculation and model test, the flow state in the forebay and ahead of the sluice of the joint hub of pump station and sluice were studied. The results showed that when the opening width of diversion pier was 1.55D, the corresponding length was 8.62D, the opening height was 0.66 h, and the center distance between adjacent orifices was 2.16d where D was the diameter of the tested pump impeller and h was the water depth of the forebay; the rectification effect of the diversion pier on the forebay was the best. When the length of diversion pier was 25 m, the opening width was 4.5 m, the center distance between adjacent orifices was 25 m, and the opening height was 3.8 m, setting the diversion pier could greatly abate the transverse and axial velocity of the water in superficial layer and improve the navigation safety. On this foundation, Xu et al. [17] improved and designed a Y-shaped settlement training wall which can optimize the inlet conditions of the side wall of the training wall and improve the inlet flow state by isolating the backflow, which can be better applied in the joint hub of the pump station and sluice with a 15° transverse side angle.
This study designed a γ-shaped settlement training wall and analyzed the relevant inflow state of the joint hub of pump station and sluice operating under two designed conditions by numerical simulation. To carry out a horizontal comparison of the data, the margin of error between the grid number of the research model and that of the model in reference [17] was controlled within 3%. As shown in Figure 17, under the pumping condition, the axial uniformity of velocity distribution of inlet sections of the 1~6# inlet channels was 79.82%, 80.13%, 79.84%, 79.85%, 80.75%, and 80.42% respectively and it could be found that compared with the original design scheme, setting the γ-shaped settlement training wall could greatly grow the research index by 14.49%, 2.78%, 3.95%, 9.47%, 3.15%, and 7.94% respectively, demonstrating that for all inlet channels, setting the γ-shaped settlement training wall can effectively ameliorate their flow state. Additionally, compared with the scheme of perforated diversion pier in the literature [32], when the pump station operates, setting the γ-shaped settlement training wall can grow the research index by 4.22%, 2.25%, 4.30%, 7.11%, 6.50%, and 7.54% respectively, which indicates that the γ-shaped settlement training wall is more applicable. As for the scheme of the Y-shaped settlement training wall in document [17], when the pump station operates, setting the γ-shaped settlement training wall can also grow the research index by 3.50%, 1.37%, 2.31%, 3.10%, 0.05%, and 0.09% respectively, which indicates that the γ-shaped settling training wall is also effective to enhance the velocity uniformity, especially for the 1–4# channels. In general, it was considered that in the operational state of pumping, in comparison with the perforated training wall and the Y-shaped settlement training wall, the γ-shaped settlement training wall was more applicable to ameliorate the inlet flow state of the joint hub of pump station and sluice.
When the sluice was operating, after setting the γ-shaped settlement training wall, the flow line in front of the sluice was relatively smooth and the original reflux area basically disappeared. Considering the navigation requirements of the sluice, we took the maximum transverse velocity in front of the 7# sluice as the research index and then performed the horizontal comparison of the rectification effects between the γ-shaped settlement training wall and three other measures: the initial scheme, which was not designed with any rectification measure, the perforated training wall scheme in document [32], and the Y-shaped settlement training wall in document [17]. As displayed in Figure 18, when the γ-shaped settlement training wall applied, the maximum lateral velocity in front of the 7# sluice was 0.28 m/s, which was less than the limit value of 0.3 m/s regulated in reference [34], satisfying the requirements of modern navigation. Compared with the initial scheme, the maximum transverse velocity was abated by 0.47 m/s, which shows the γ-shaped settlement training wall can effectually ameliorate the flow state ahead of the sluice of the joint hub of pump station and sluice. Meanwhile, compared with the Y-shaped settlement training wall scheme in document [17], its maximum lateral velocity in front of the 7# sluice was still 0.28 m/s, indicating that there was no significant difference between the two forms of the training wall on the variation of transverse velocity in front of the sluice next to the junction of the sluice and the pump station. While in comparison with the scheme of perforated the training wall in the literature [32], its maximum transverse velocity in front of the 7# sluice was 0.06 m/s lower than that of the γ-shaped settlement training wall, indicating that under the free-draining condition, the perforated training wall was the most effective one to abate the transverse velocity in front of the sluice next to the junction of the pump station and sluice chamber and alleviate the oblique inlet flow. Additionally, considering the actual operation conditions of project, the average transverse velocity in front of the sluice chamber was taken as an extra research indicator and by a series of calculations, the index values of each scheme were as follows: the initial scheme: 0.74 m/s, the scheme of Y-shaped settlement training wall: 0.28 m/s, the scheme of γ-shaped settlement training wall: 0.26 m/s, and the scheme of perforated training wall: 0.24 m/s. It can be found that compared with the initial scheme and the Y-shaped settlement training wall, the γ-shaped settlement training wall was more applicable and can relatively reduce the average transverse velocity by 64.9% and 7.1% respectively. While regarding the scheme of perforated training wall, its average transverse velocity was 7.7%, relatively lower than that of the scheme of γ-shaped settlement training wall, indicating that the scheme of perforated training wall was still the most effective rectification measure during the operational condition of free-draining. So, it is reasonable to consider adopting the combined rectification measures in the future design of the joint hub of pump station and sluice, that is, in the operational state of pumping, the γ-shaped settlement training wall can be applied while under the free-draining condition, the γ-shaped settlement training wall can be perforated to realize the optimization effect under multiple working conditions.
7. Conclusions
In this paper, a γ-shaped settlement training wall was designed, which was applicable in the joint hub of the pump station and sluice and its geometric parameter combination was optimized by using the central composite design of response surface method. By selecting the research index and analyzing its value under each scheme, the optimized parameter combination could be obtained, which was further verified by numerical simulation and the results of this research showed that:
- (1)
- For the joint hub of pump station and sluice, there was a large area of oblique flow often arising near the junction of the sluice and pumping station under any single operating condition, in which case setting the γ-shaped settlement training wall could effectually ameliorate the inflow state.
- (2)
- The variation of the size parameters of γ-shaped settlement training wall can greatly affect its rectification effect. To be specific, in the operational state of pumping, the arc radius of curved part I and the center angle of curved part II were the key factors affecting the variation of flow state while the center angle of curved part I and the radius of curved part II were the secondary factors. In the operational state of free-draining, only the arc radius of curved part III had a prominent impact on the flow state and the other factors such as the arc radius of curved part III, the center angle of curved part IV, and the arc radius of curved part IV were the secondary factors affecting the flow state in front of the sluice.
- (3)
- For the joint hub of the pump station and sluice, the optimal size combination scheme of the γ-shaped settlement training wall was: center angle of curved part I: 43.5°, arc radius of curved part I: 5.36t, center angle of curved part II: 46.2°, arc radius of curved part II: 2.62b, center angle of curved part III: 43.0°, arc radius of curved part III: 6.43b, center angle of curved part IV: 40.6°, and arc radius of curved part IV: 1.37t where b represents the net width of the 7# sluice and t represents the net width of the 6# inlet channel.
- (4)
- This paper designed and optimized a γ-shaped settlement training wall which could ameliorate the inlet conditions of the side wall of the training wall by completely cutting off the interference of lateral reflux, greatly ameliorating the inlet flow state of the joint hub of pump station and sluice under the conditions of pumping and free-draining. Compared with the previous studies, the γ-shaped settlement training wall designed in this study is more applicable and has a rectification effect. Additionally, the CCD-Response surface method was adopted in the case of fluid machinery research. The structural form and the optimization method of the γ-shaped settlement training wall designed in this study can provide technical support for the design of asymmetric joint hub of sluices and pump stations with engineering training walls. In the future, some consideration will be given to the design of γ-shaped settlement training walls with open-cell and the relevant physical model tests will be launched to further verify the rationality of the results of numerical simulation.
Author Contributions
Conceptualization, B.X. and J.L.; methodology, B.X.; software, B.X.; validation, W.L., B.X. and J.L.; formal analysis, J.L.; investigation, B.X.; resources, B.X.; data curation, J.L.; writing—original draft preparation, J.L.; writing—review and editing, J.L.; visualization, J.L.; supervision, B.X., L.X. and R.X.; project administration, W.L.; funding acquisition, W.L. All authors have read and agreed to the published version of the manuscript.
Funding
This research was funded by the National Natural Science Foundation of China (No. 52079120; Funder: Bo Xu) and the Priority Academic Program Development of Jiangsu Higher Education Institutions (PAPD).
Institutional Review Board Statement
Not applicable.
Informed Consent Statement
Not applicable.
Data Availability Statement
Not applicable.
Conflicts of Interest
The authors state that they have no known competing financial interests or personal relationships that could affect the work described in this article.
References
- Cao, Q.; Meng, Y.; Chen, L. Nonlinear Finite Elements Analysis on Structure of Pumping Station in the Joint Hub of Sluice and Pumping Station. Appl. Mech. Mater. 2011, 90, 2546–2552. [Google Scholar] [CrossRef]
- Yan, P.; Zhang, Z.; Lei, X. A Simple Method for the Control Time of a Pumping Station to Ensure a Stable Water Level Immediately Upstream of the Pumping Station under a Change of the Discharge in an Open Channel. Water 2021, 13, 355. [Google Scholar] [CrossRef]
- Cao, Q.; Ma, Y. Analysis on the causes of cracks on the Concrete Structure of Large and Medium-sized Pumping Station. Adv. Mater. Res. 2012, 486, 484–491. [Google Scholar] [CrossRef]
- Van, K.; Van, R.; Volken Winter, H. Behavioral responses of eel (Anguilla anguilla) approaching a large pumping station with trash rack using an acoustic camera (DIDSON). Fisheries. Manag. Ecol. 2020, 27, 464–471. [Google Scholar]
- Matsui, J.; Sugino, Y.; Kawakita, K. Numerical simulation on flow in pump sump with free surface. In Proceedings of the 6th International Symposium on Fluid Machinery and Fluid Engineering, Wuhan, China, 22–25 October 2014. [Google Scholar]
- Desmukh, T.S.; Gahlot, V.K. Numerical study of flow behavior in a multiple intake pump sump. Int. J. Adv. Eng. Technol. 2011, 2, 118–128. [Google Scholar]
- Valero, D.; Viti, N.; Gualtieri, C. Numerical simulation of hydraulic jumps. Part 1: Experimental data for modelling performance assessment. Water 2018, 11, 36. [Google Scholar] [CrossRef] [Green Version]
- Al-Mansori, N.J.H.; Laith, S.A.A.; Al-Zubaidi, L.S.A. One-dimensional hydrodynamic modeling of the Euphrates river and prediction of hydraulic parameters. Civ. Eng. J. 2020, 6, 1074–1090. [Google Scholar] [CrossRef]
- Al-Mansori, N.J.H.; Alfatlawi, T.J.M.; Hashim, K.S.; Al-Zubaidi, L.S. The Effects of Different Shaped Baffle Blocks on the Energy Dissipation. Civ. Eng. J. 2020, 6, 961–973. [Google Scholar] [CrossRef]
- Yamini, O.A.; Kavianpour, M.R.; Movahedi, A. Performance of Hydrodynamics Flow on Flip Buckets Spillway for Flood Control in Large Dam Reservoirs. J. Hum. Earth Future 2020, 1, 39–47. [Google Scholar] [CrossRef]
- Yang, F.; Zhang, Y.; Liu, C. Numerical and Experimental Investigations of Flow state and Anti-Vortex Measures of Forebay in a Multi-Unit Pumping Station. Water 2021, 13, 935. [Google Scholar] [CrossRef]
- Fan, J.; Lu, D.; Shi, Z.; Hou, H. Lateral Water Pumping Station Forebay of Jingtai Electric Power Irrigation District Flow State Numerical Simulation and Preventing Silt Research. Int. J. Comput. Eng. 2016, 1, 30–32. [Google Scholar]
- Teaima, I.R.; El-Gamal, T. Improving flow performance of irrigation pump station intake. J. Appl. Water Eng. Res. 2017, 5, 9–21. [Google Scholar] [CrossRef]
- Luo, C.; Qian, J.; Liu, C.; Chen, F.; Xu, J.; Zhou, J. Numerical simulation and test verification on diversion pier rectifying flow in forebay of pumping station for asymmetric combined sluice-pump station project. Trans. Chin. Soc. Agric. Eng. 2015, 31, 100–108. [Google Scholar]
- Su, Y.; Xu, W.; Xu, J.; Li, X. Study on combined rectifier pier to improve water inlet conditions of Weicun hub pump station. People’s Yangtze River 2021, 52, 151–156. (In Chinese) [Google Scholar]
- Xi, B.; Zhen, Y.; Duan, Y.; Yang, X.; Lu, R. Optimization of flow state in forebay of gate station combined pump station. J. Chang. Acad. Sci. 2021, 1, 9–28. (In Chinese) [Google Scholar]
- Xu, B.; Liu, J.; Lu, W. Optimization Design of Y-Shaped Settling Diversion Wall Based on Orthogonal Test. Machines 2022, 10, 91. [Google Scholar] [CrossRef]
- Panapakidis, I.P.; Sarafianos, D.N.; Alexiadis, M.C. Comparative analysis of different grid-independent hybrid power generation systems for a residential load. Renew. Sustain. Energ. Rev. 2012, 16, 551–563. [Google Scholar] [CrossRef]
- Krishan, O.; Suhag, S. Grid-independent PV system hybridization with fuel cell-battery supercapacitor: Optimum sizing and comparative techno-economic analysis. Sustain. Energy Technol. 2020, 37, 100625. [Google Scholar] [CrossRef]
- Chen, X.; Zillé, P.; Shao, L.; Corpetti, T. Optical flow for incompressible turbulence motion estimation. Exp. Fluids 2015, 56, 1–14. [Google Scholar] [CrossRef] [Green Version]
- Axell, L.B.; Liungman, O. A one-equation turbulence model for geophysical applications: Comparison with data and the k–ε model. Environ. Fluid Mech. 2001, 1, 71–106. [Google Scholar] [CrossRef]
- Shaheed, R.; Mohammadian, A.; Kheirkhah, H. A comparison of standard k–ε and realizable k–ε turbulence models in curved and confluent channels. Environ. Fluid. Mech. 2019, 19, 543–568. [Google Scholar] [CrossRef]
- Wang, G.; Zhao, G.; Li, H. Research on optimization design of the heating/cooling channels for rapid heat cycle molding based on response surface method and constrained particle swarm optimization. Expert. Syst. Appl. 2011, 38, 6705–6719. [Google Scholar] [CrossRef]
- Versele, C. A Response Surface Method Approach to Study the Influence of Specifications or Model Parameters on the Multi-objective Optimal Design of Isolated DC–DC Converters. IEEE. Trans. Power Electron. 2012, 27, 3383–3395. [Google Scholar] [CrossRef]
- Sinopoli, L.; Ordonez, M.; Quaicoe, J. Wind turbine rotor modelling using response surface method. Electr. Comput. Eng. 2010, 6, 2–5. [Google Scholar]
- Doebling, S.W.; Hemez, F.M.; Schultze, J.F. A meta-model-based approach to model validation for nonlinear finite element simulations. In Proceedings of the 20th International Modal Analysis Conference (IMAC), Los Angeles, CA, USA, 3 October 2002; pp. 671–678. [Google Scholar]
- Hussain, M.F.; Barton, R.R.; Joshi, S.B. Meta-modeling radial basis functions versus polynomials. Eur. J. Oper. Res. 2002, 138, 142–154. [Google Scholar] [CrossRef]
- Rywinska, A.; Marcinkiewicz, M.; Cibis, E. Optimization of Medium Composition for Erythritol Production from Glycerol by Yarrowia Lipolytica Using Response Surface Method. Prep. Biochem. Biotech. 2015, 45, 515. [Google Scholar] [CrossRef]
- Xue, J. Experimental Study on the Notability of Social Cognitive Components on the Amount of Cognitive Dissonance. Inf. Technol. J. 2013, 12, 5102–5106. [Google Scholar] [CrossRef] [Green Version]
- Xu, B.; Yao, T.; Xia, H.; Gao, C. Experimental study on rectification of perforated diversion pier of Xifeihe sluice station project. J. Water Conserv. Transp. Eng. 2018, 6, 55–61. (In Chinese) [Google Scholar] [CrossRef]
- Ying, Z.; Seberry, J.; Xia, T.; Wysocki, B.J.; Wysocki, T.A. Construction of amicable orthogonal designs of quaternions. Australas. J. Comb. 2009, 44, 19–35. [Google Scholar]
- Xu, B.; Gao, C.; Xia, H.; Lu, W. Influence of geometric parameters of perforated diversion pier on rectification effect of forebay of gate station project. J. Chang. Acad. Sci. 2019, 36, 58–62. (In Chinese) [Google Scholar]
- Xu, B.; Zhang, C.; Li, Z.; Gao, C.; Bi, C. Study on the influence of geometric parameters of diversion pier on navigable flow conditions of gate station joint hub based on CFD. J. Irrig. Drain. 2019, 38, 115–122. (In Chinese) [Google Scholar] [CrossRef]
- China Communications Planning and Design Institute for Water Transportation. Code for Master Design of Shiplocks, 1st ed.; Nanhai Press: Haikou, China, 2002; pp. 305–2001. [Google Scholar]
Figure 1.
Computational area of the calculated model.
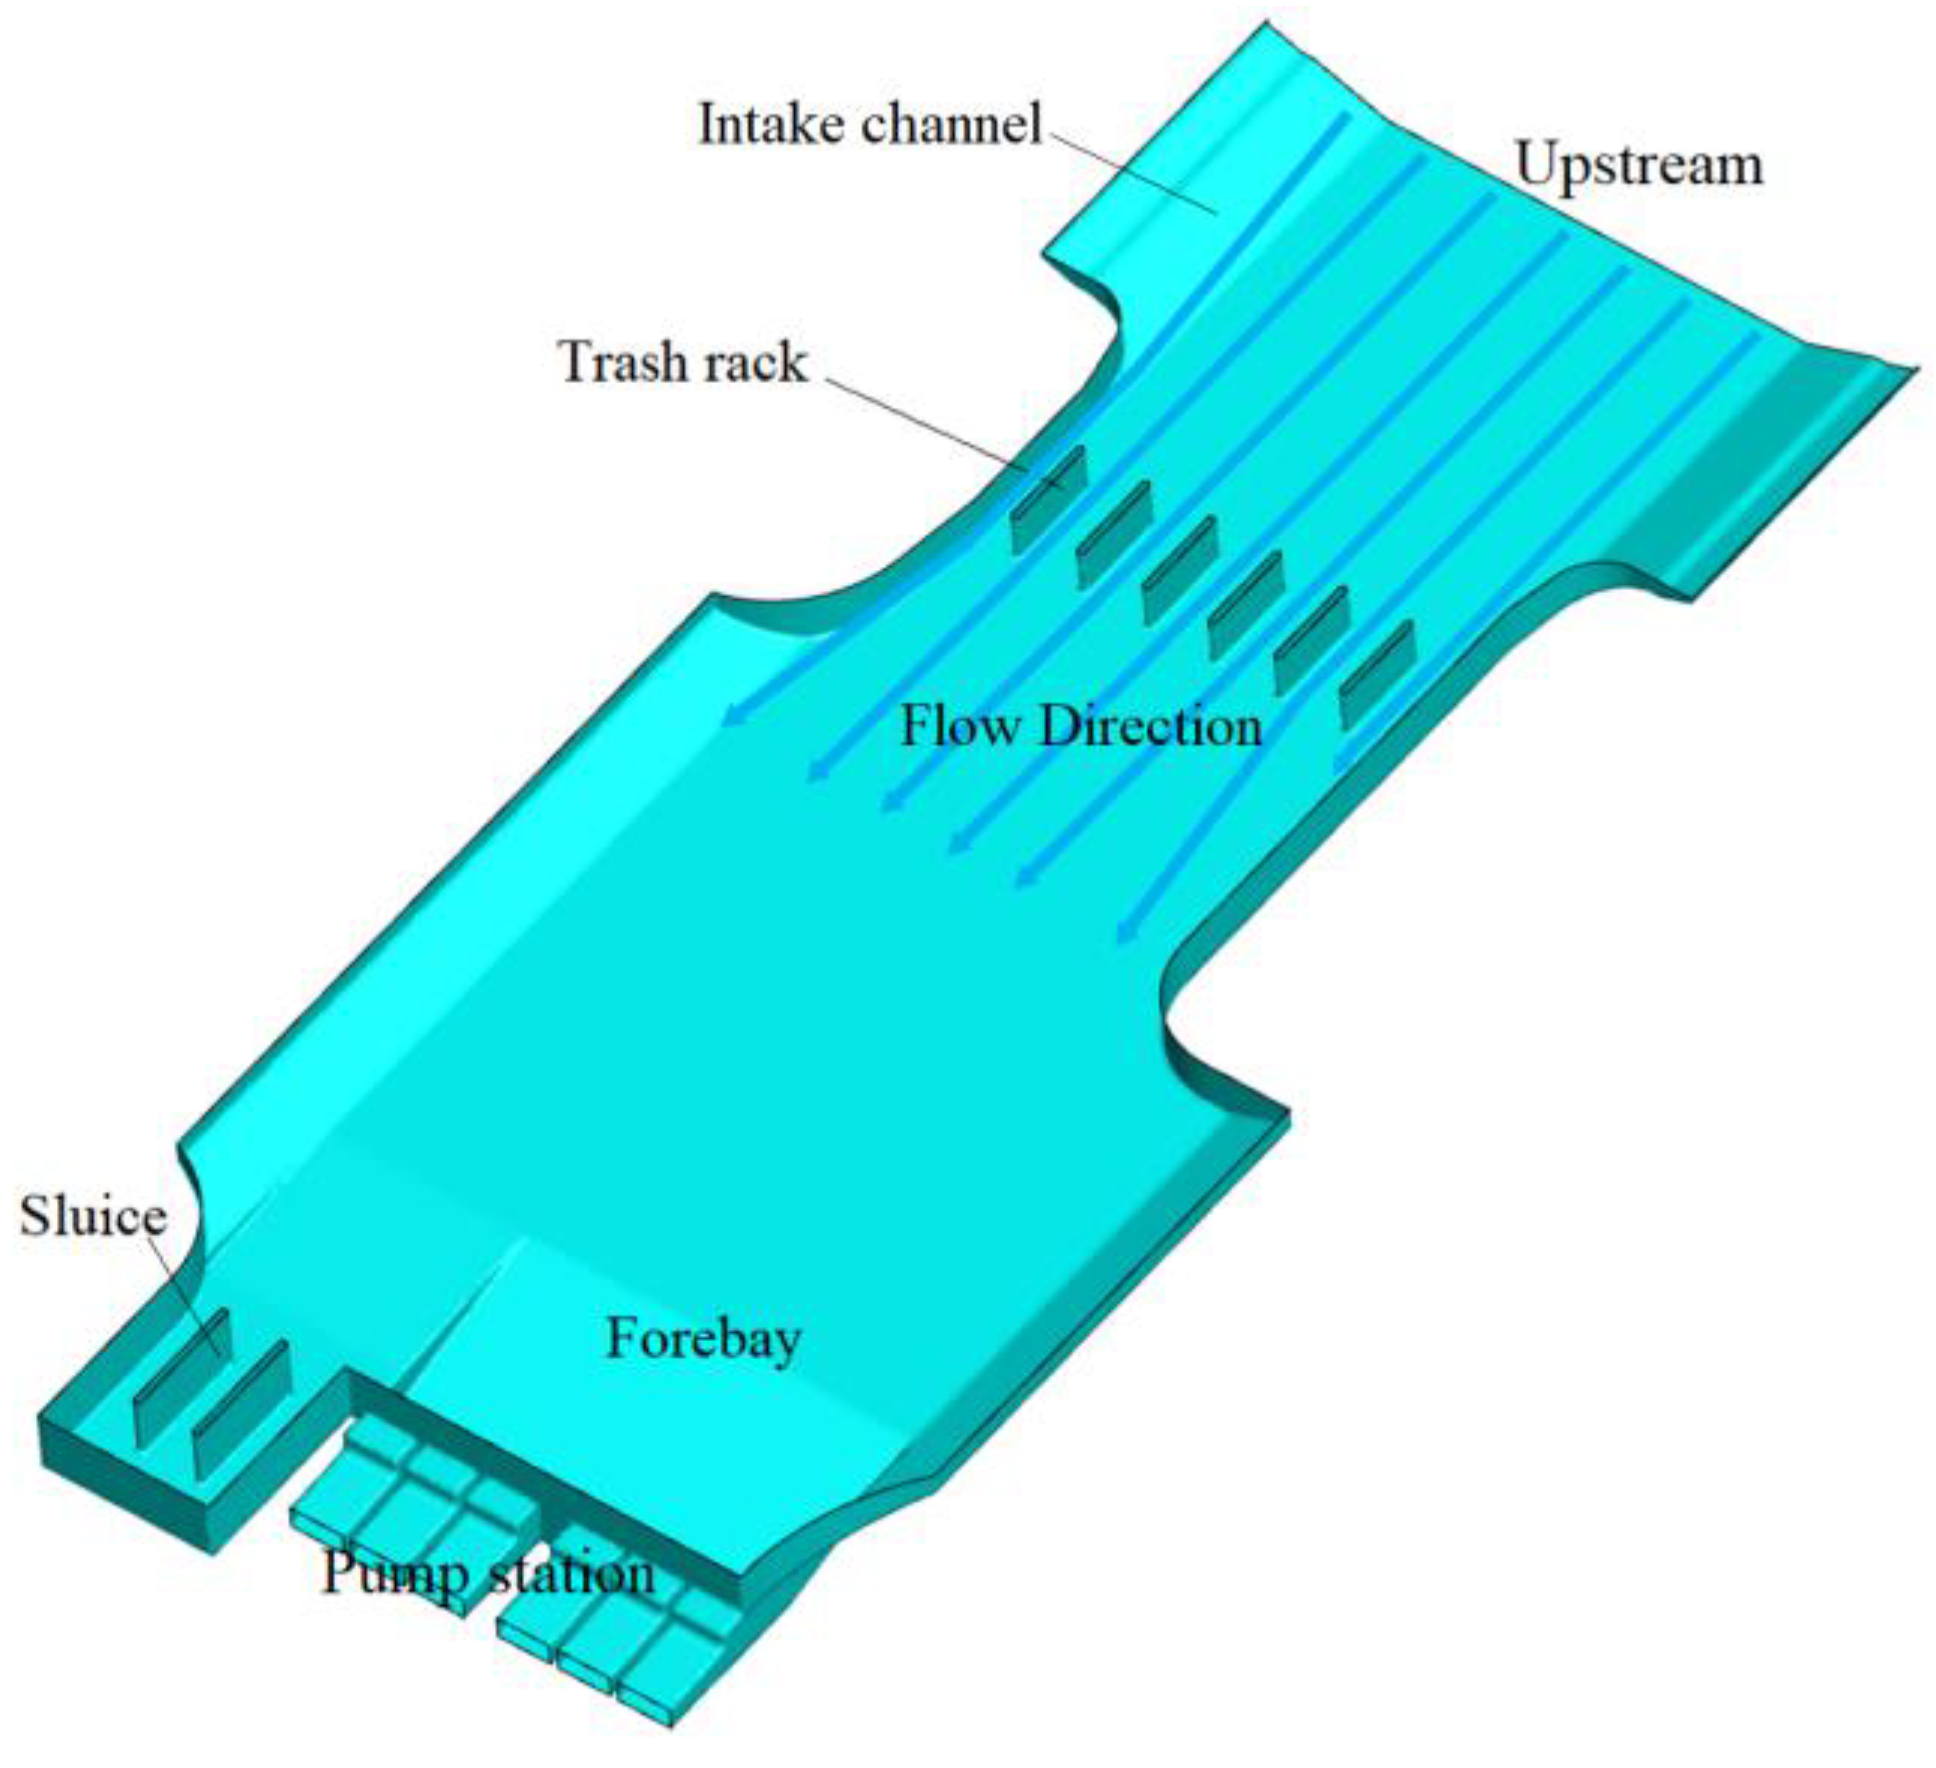
Figure 2.
Layout chart of the calculated model.
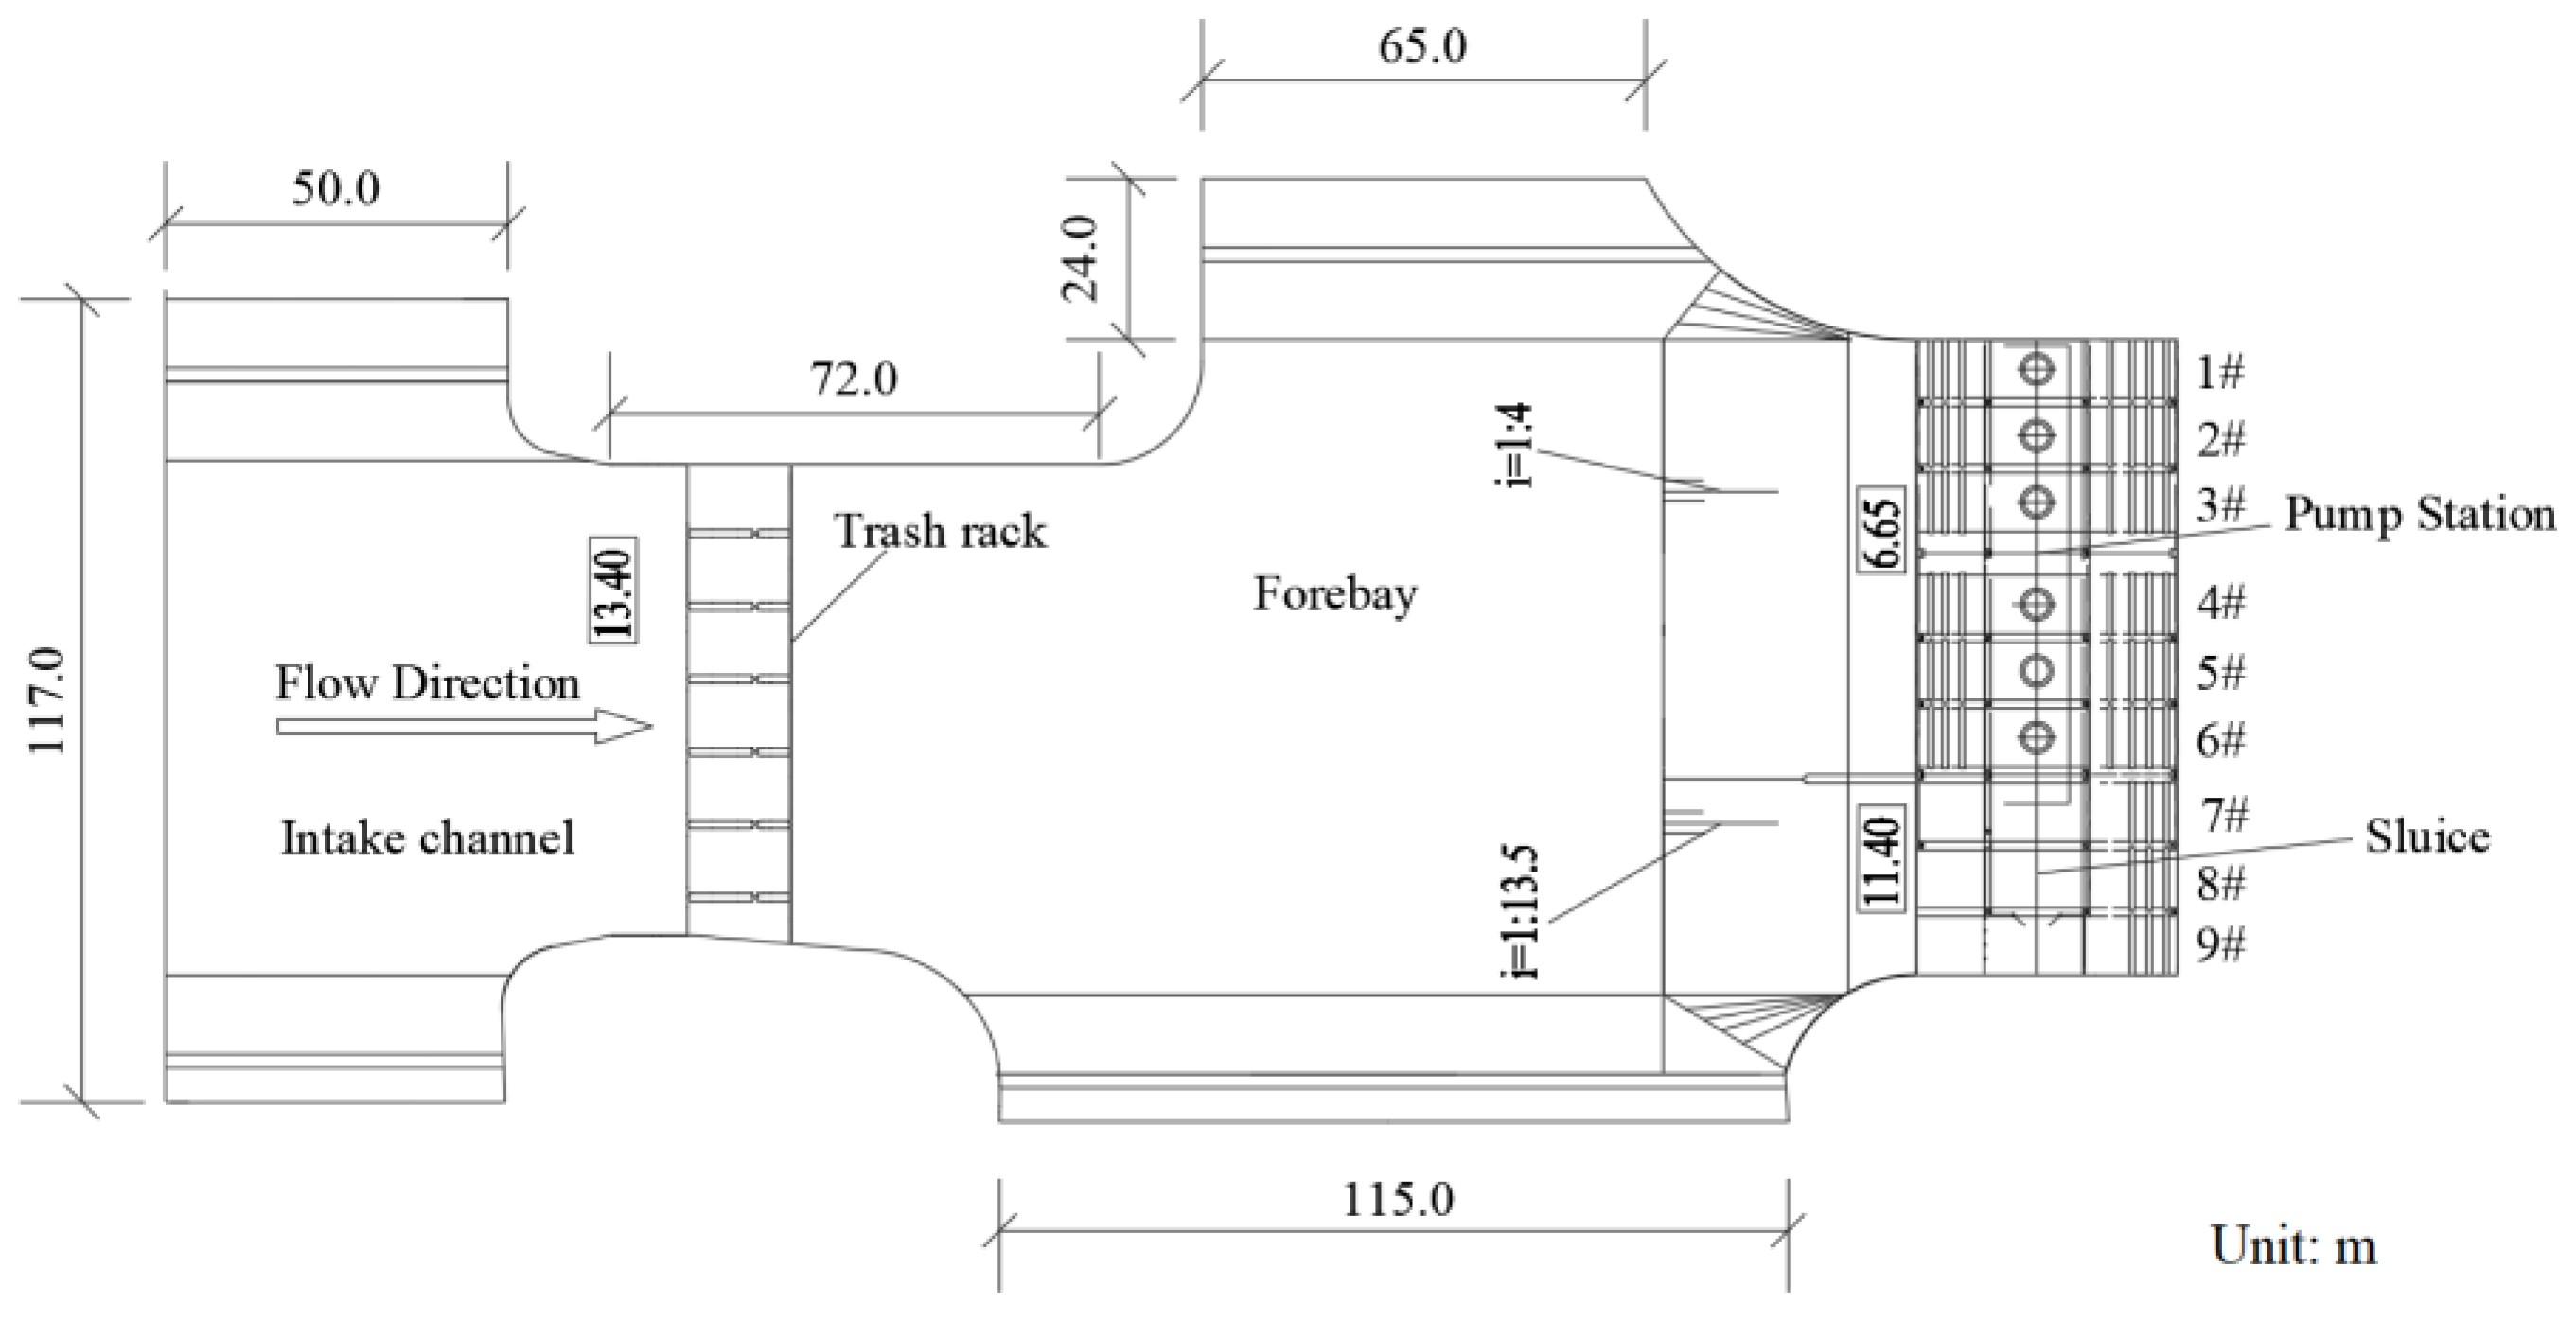
Figure 3.
Layout plan of the training wall.

Figure 4.
3D layout of the training wall (operational state of pumping).
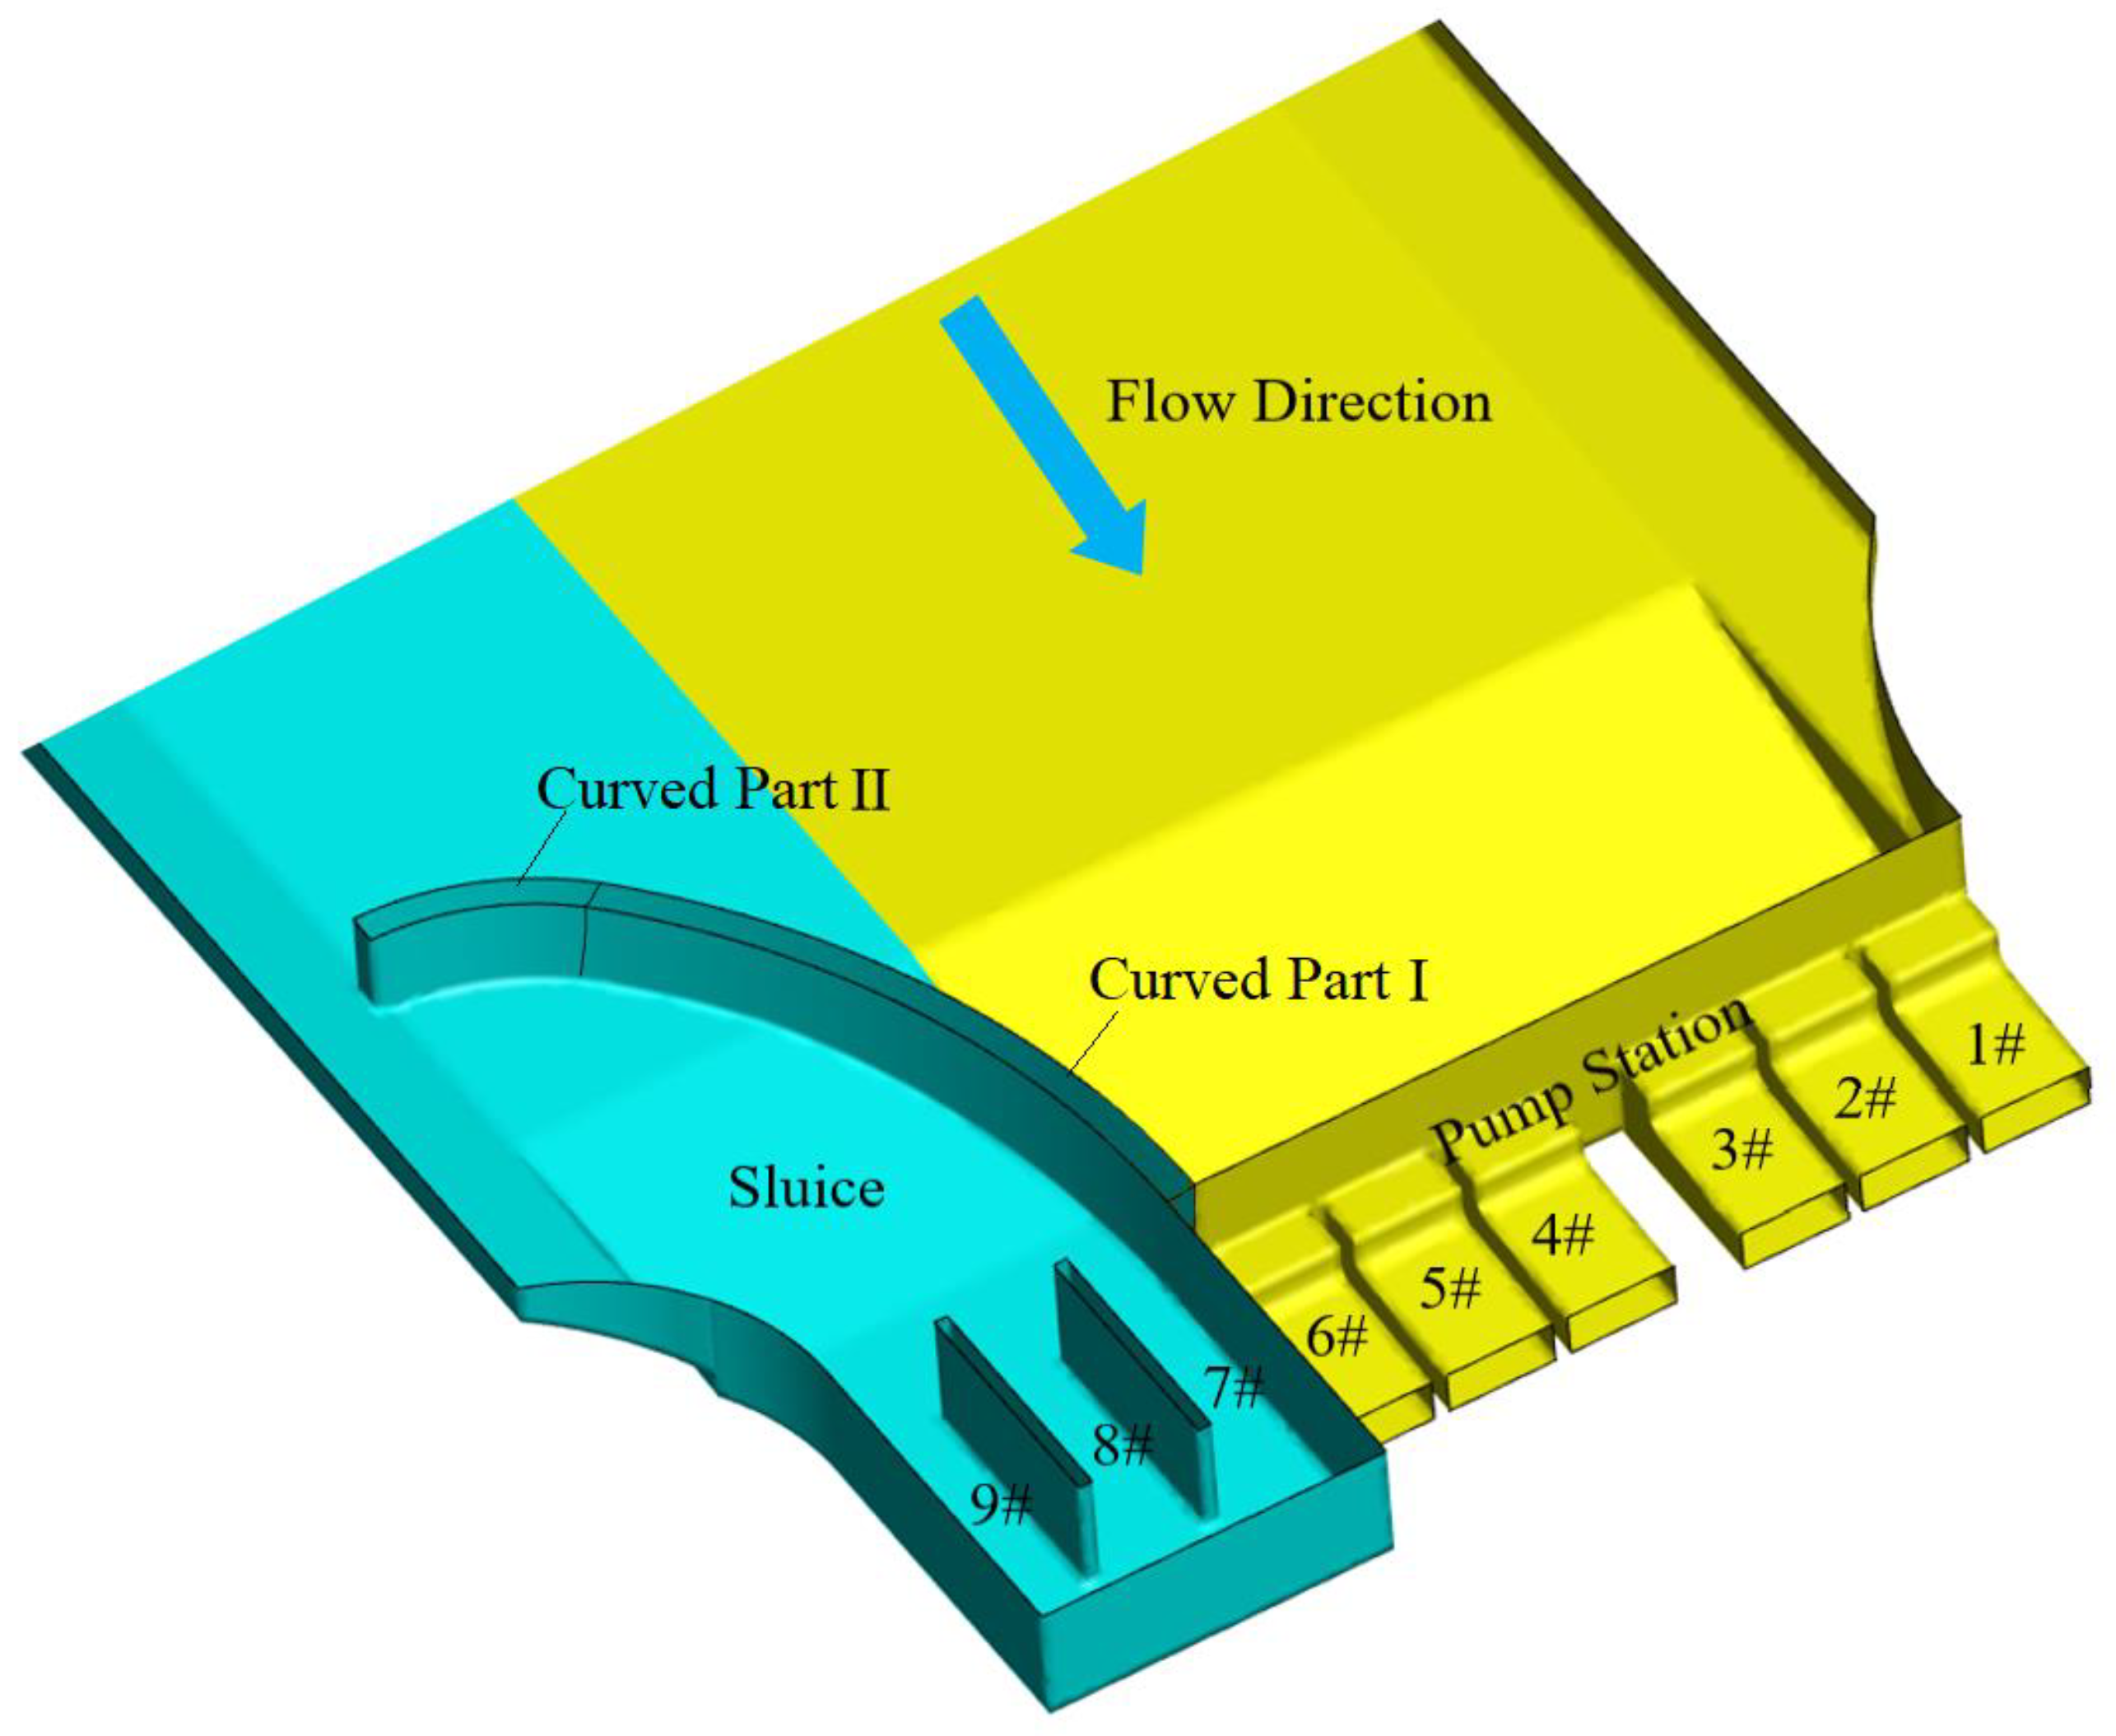
Figure 5.
3D layout of the training wall (operational state of free-draining).

Figure 6.
Diagrammatic sketch of the geometric parameters of the training wall.

Figure 7.
Grid independence calculation diagram.
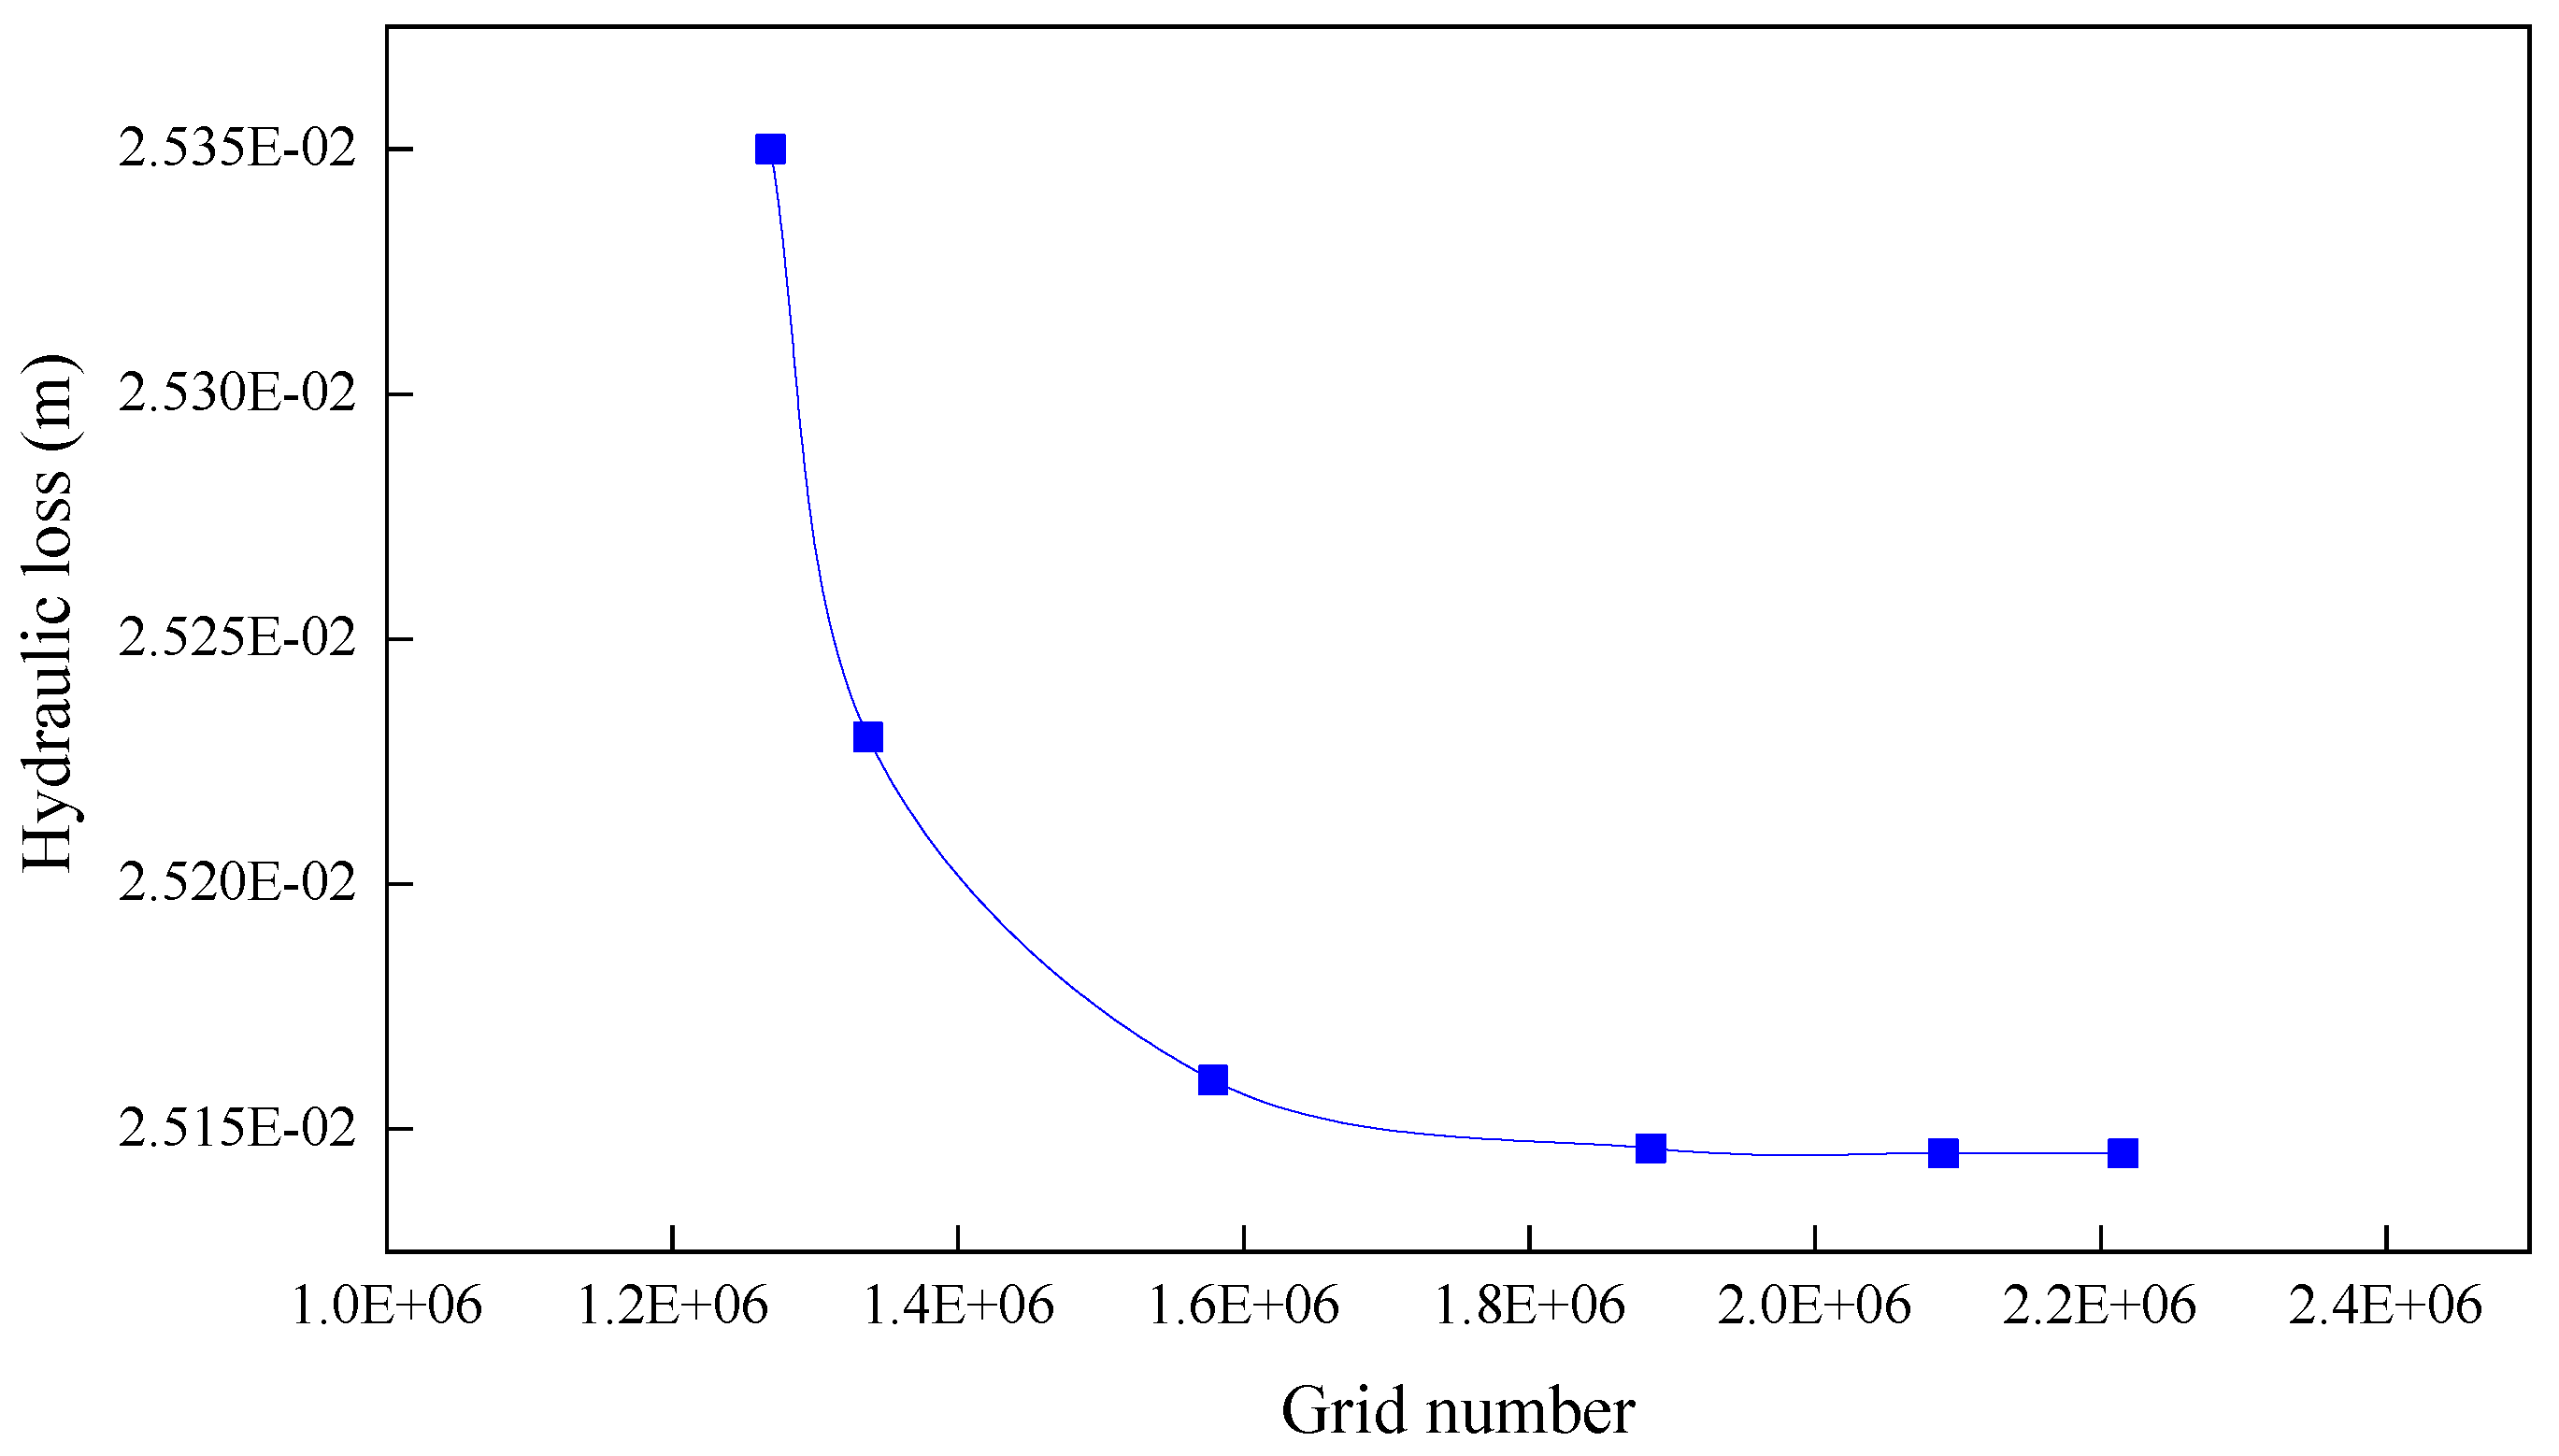
Figure 8.
Schematic diagram of grid division in the inlet section of the calculation area: (a) Schematic diagram of grid division in the inlet section of the calculation area under pumping condition; (b) the grid of the inlet section of the calculation area under free-draining condition.
Figure 8.
Schematic diagram of grid division in the inlet section of the calculation area: (a) Schematic diagram of grid division in the inlet section of the calculation area under pumping condition; (b) the grid of the inlet section of the calculation area under free-draining condition.
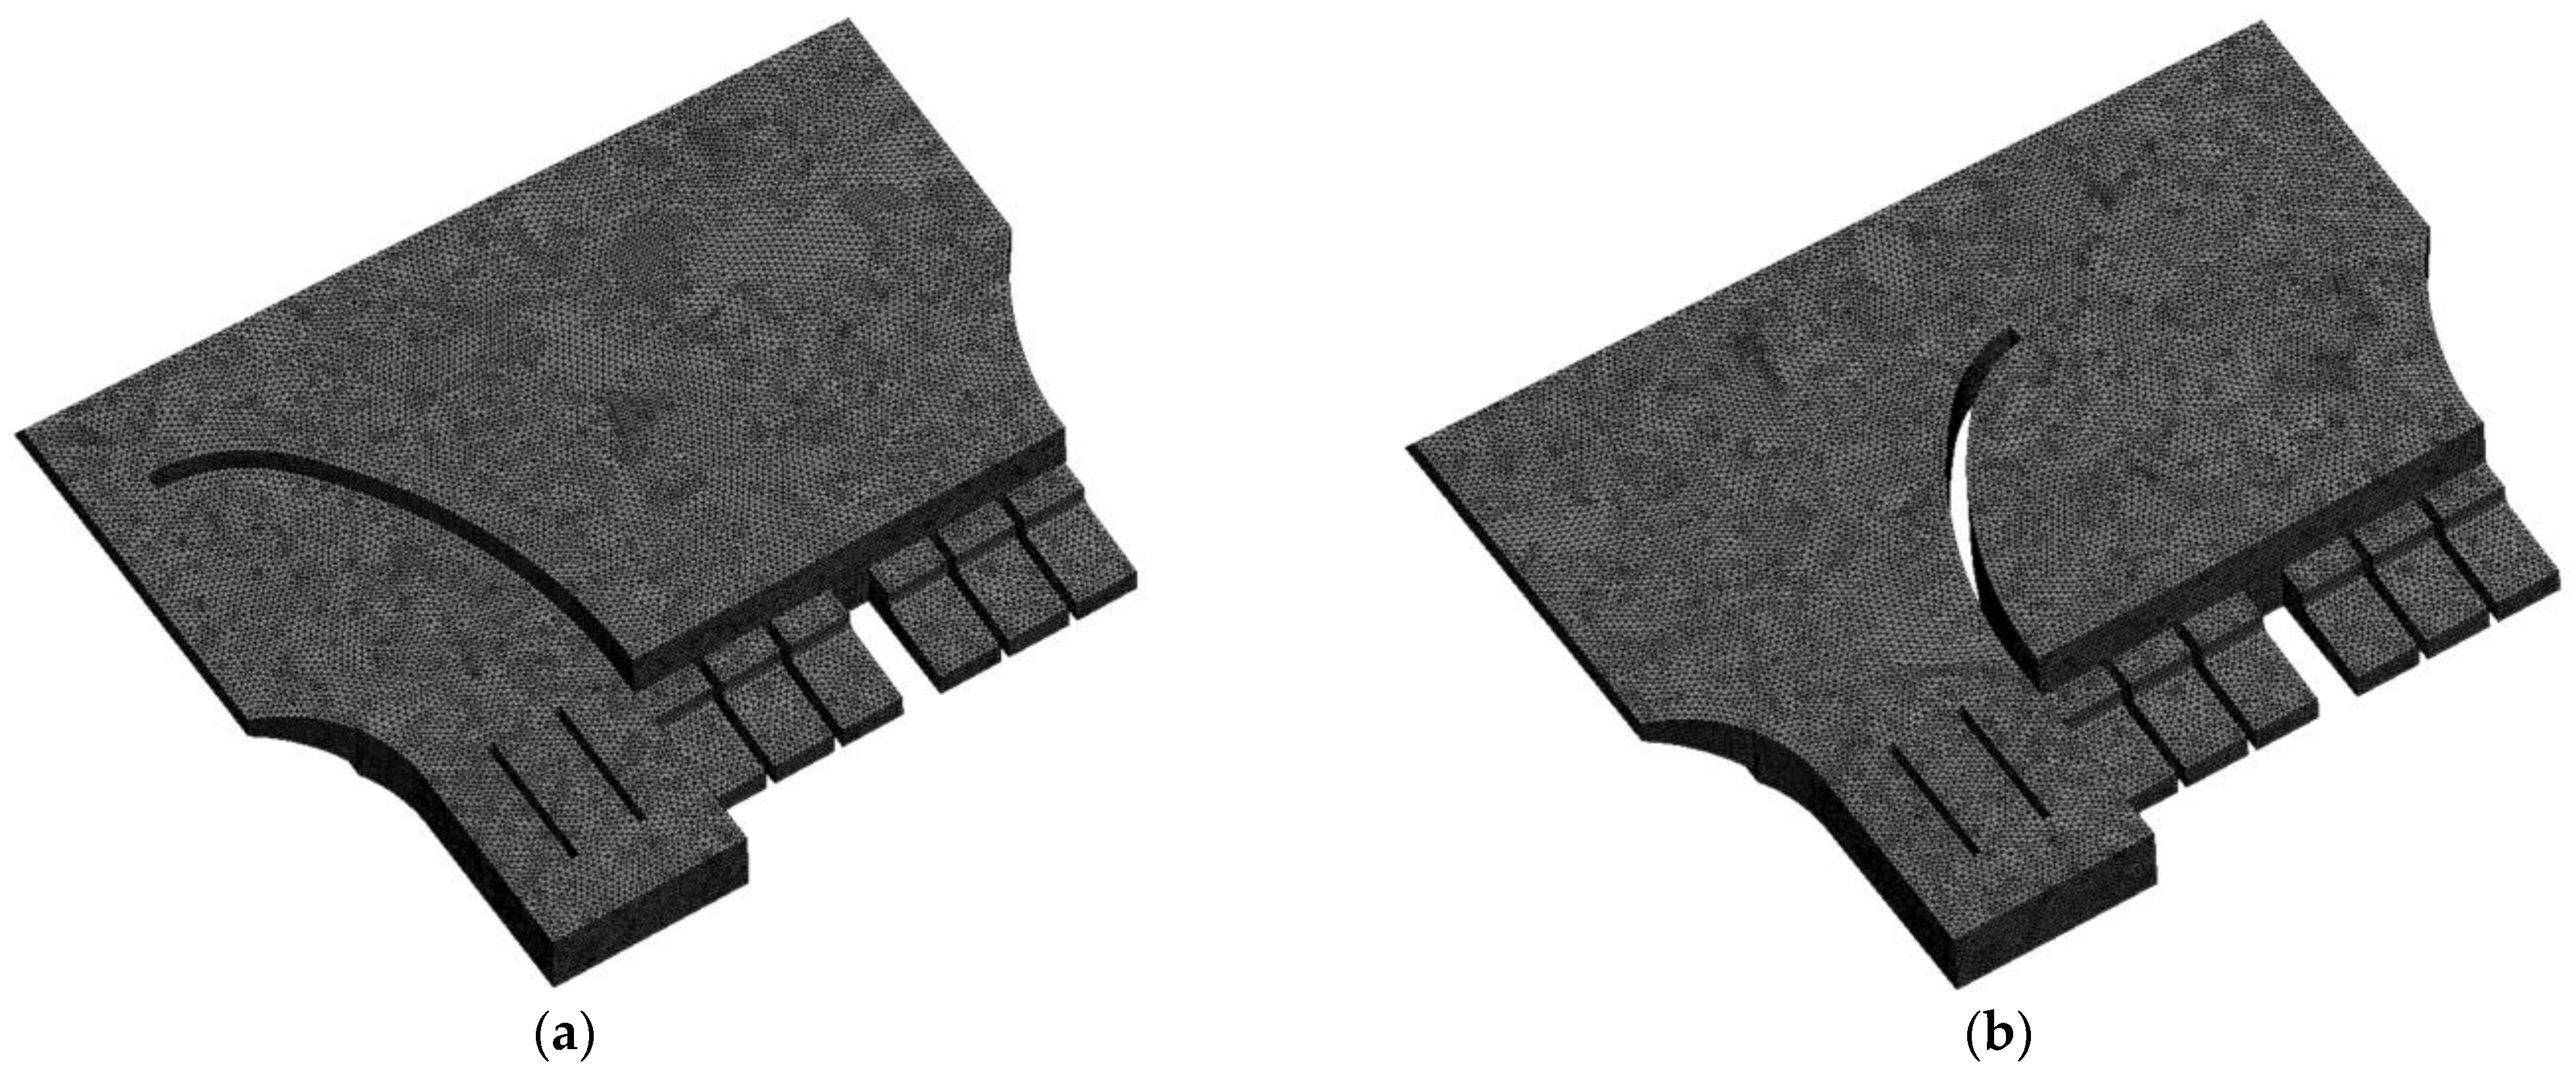
Figure 9.
Flow field diagram of the bottom horizontal section (operational state of pumping).

Figure 10.
Flow field diagram of the superficial horizontal section (operational state of free-draining).
Figure 10.
Flow field diagram of the superficial horizontal section (operational state of free-draining).
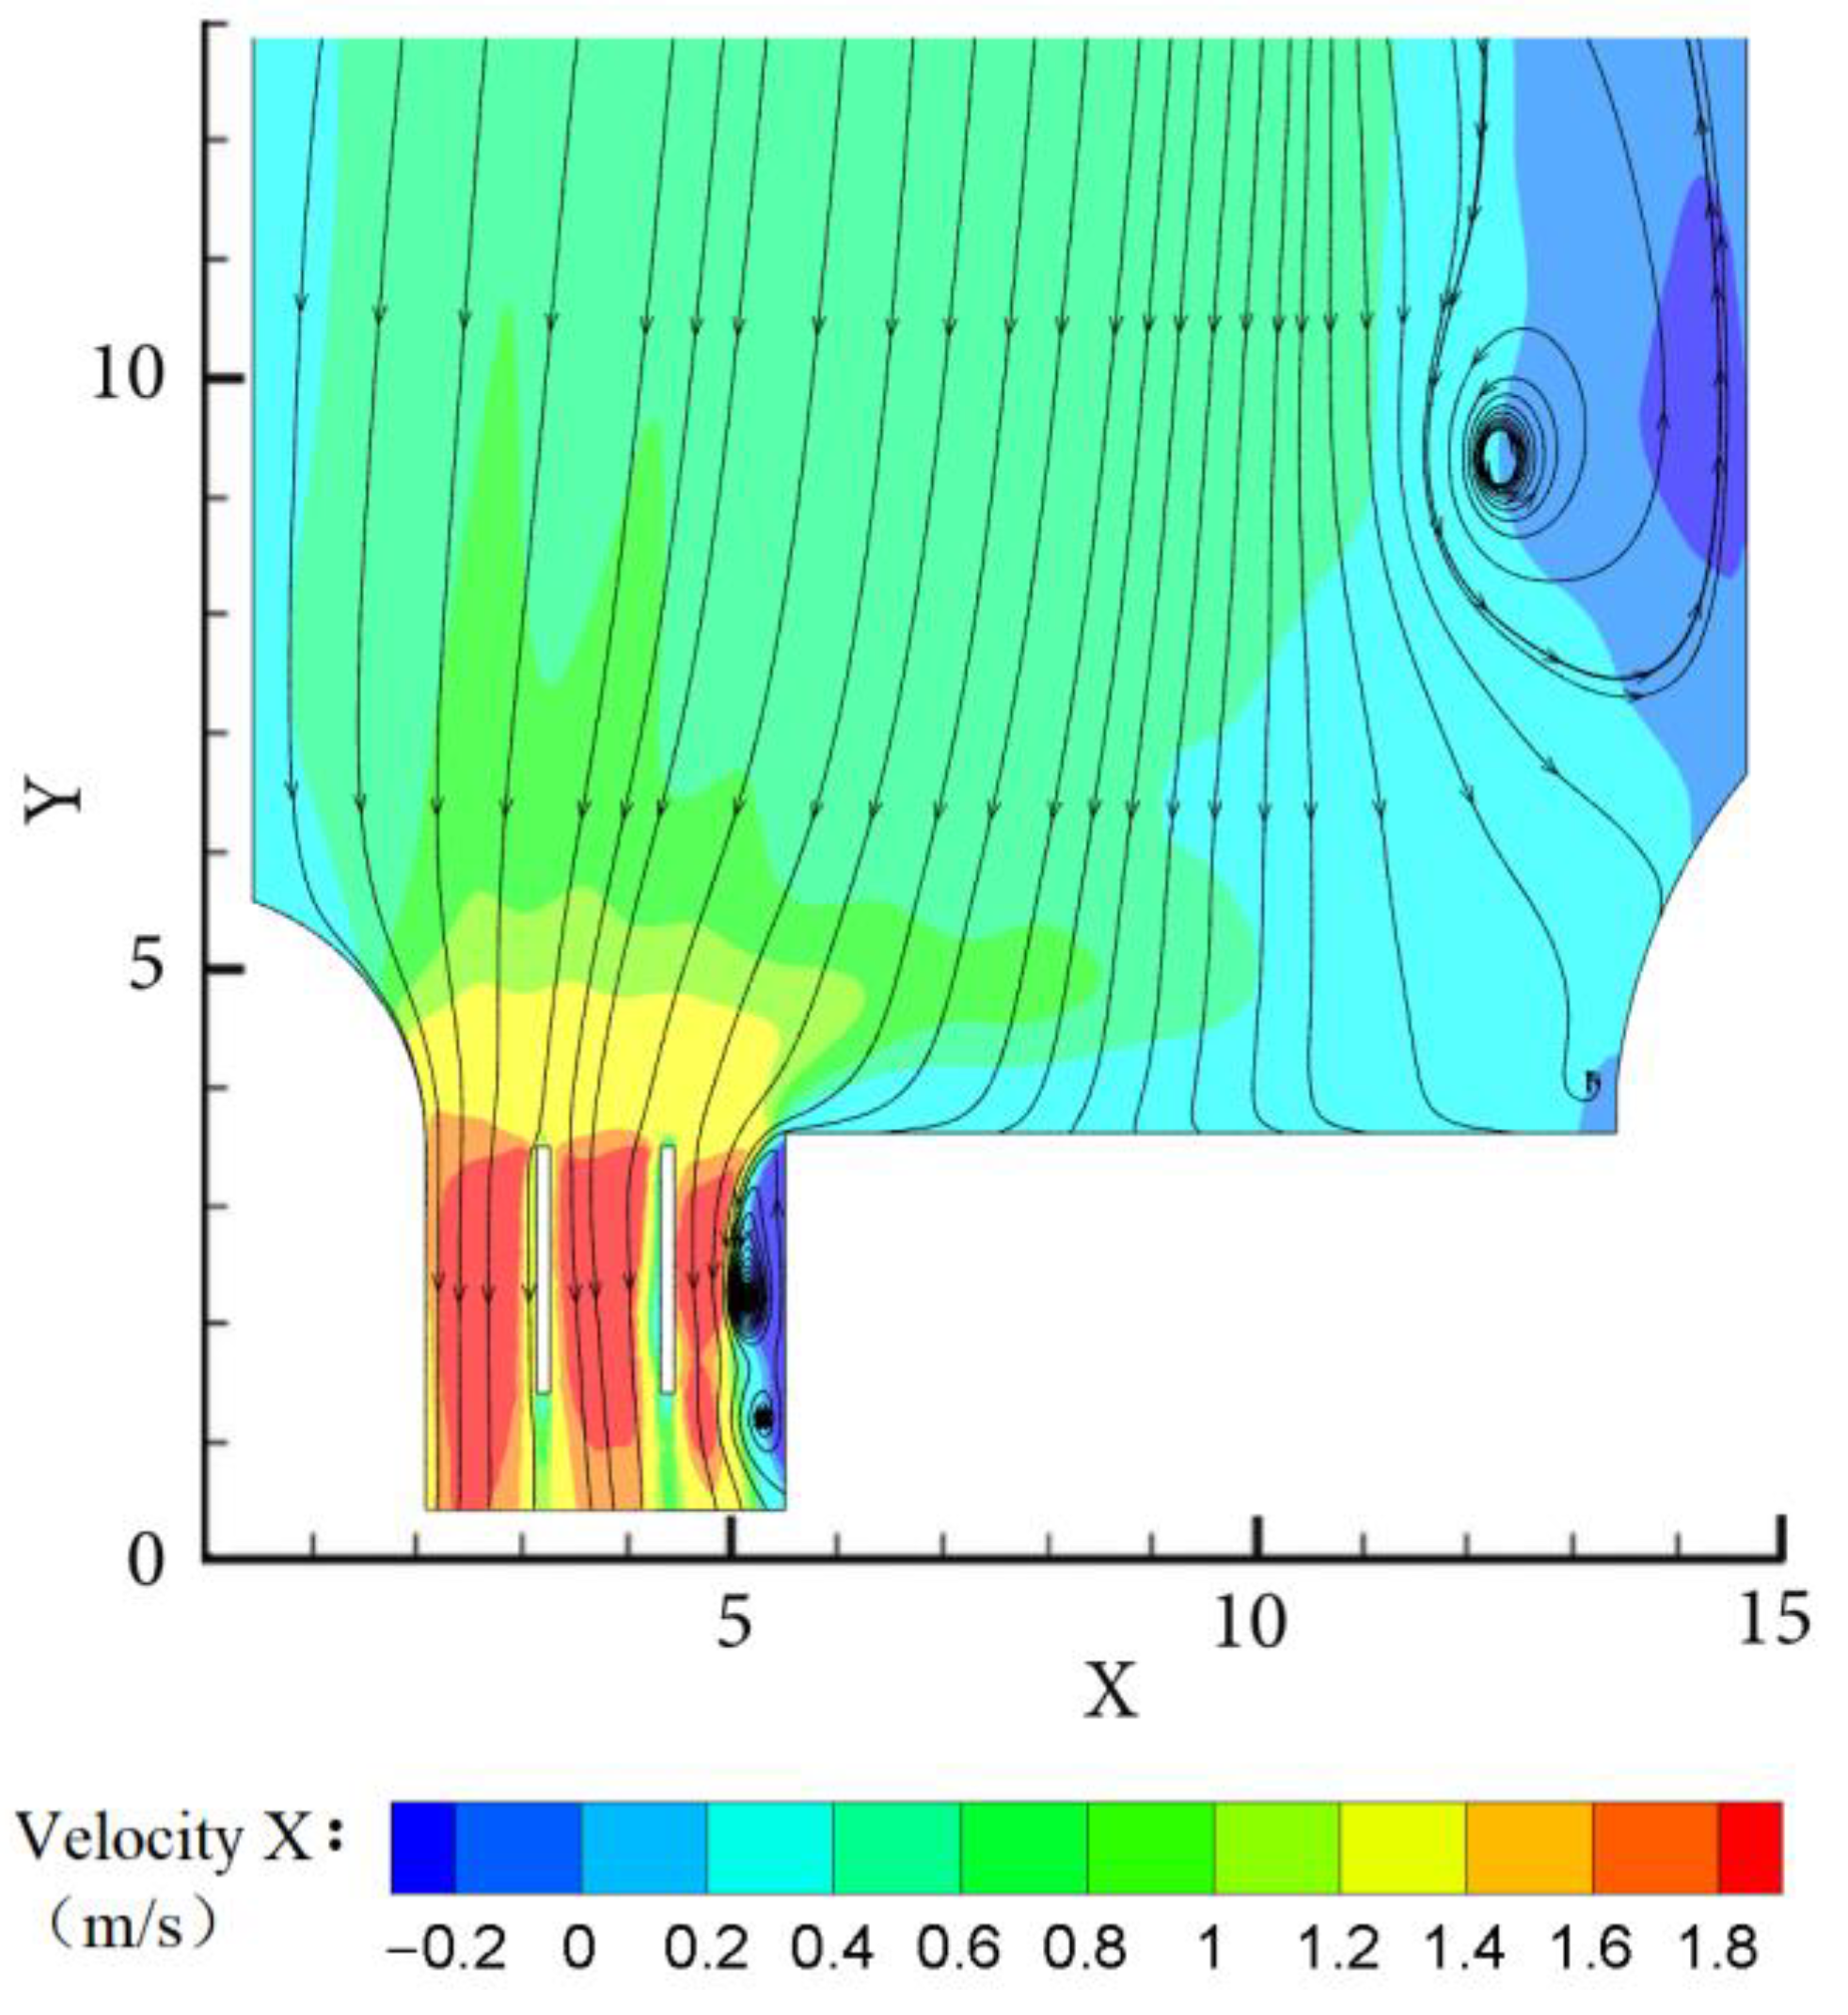
Figure 11.
Three-dimensional effect diagram and contour map (operational state of pumping): (a) three-dimensional effect diagram; (b) three-dimensional contour map.
Figure 11.
Three-dimensional effect diagram and contour map (operational state of pumping): (a) three-dimensional effect diagram; (b) three-dimensional contour map.

Figure 12.
Three-dimensional effect diagram and contour map (operational state of free-draining): (a) three-dimensional effect diagram; (b) three-dimensional contour map.
Figure 12.
Three-dimensional effect diagram and contour map (operational state of free-draining): (a) three-dimensional effect diagram; (b) three-dimensional contour map.

Figure 13.
Diagrammatic sketch of the position of characteristic section under the pumping condition: (a) diagrammatic sketch of the position of characteristic section M-M; (b) sectional profile M-M.
Figure 13.
Diagrammatic sketch of the position of characteristic section under the pumping condition: (a) diagrammatic sketch of the position of characteristic section M-M; (b) sectional profile M-M.
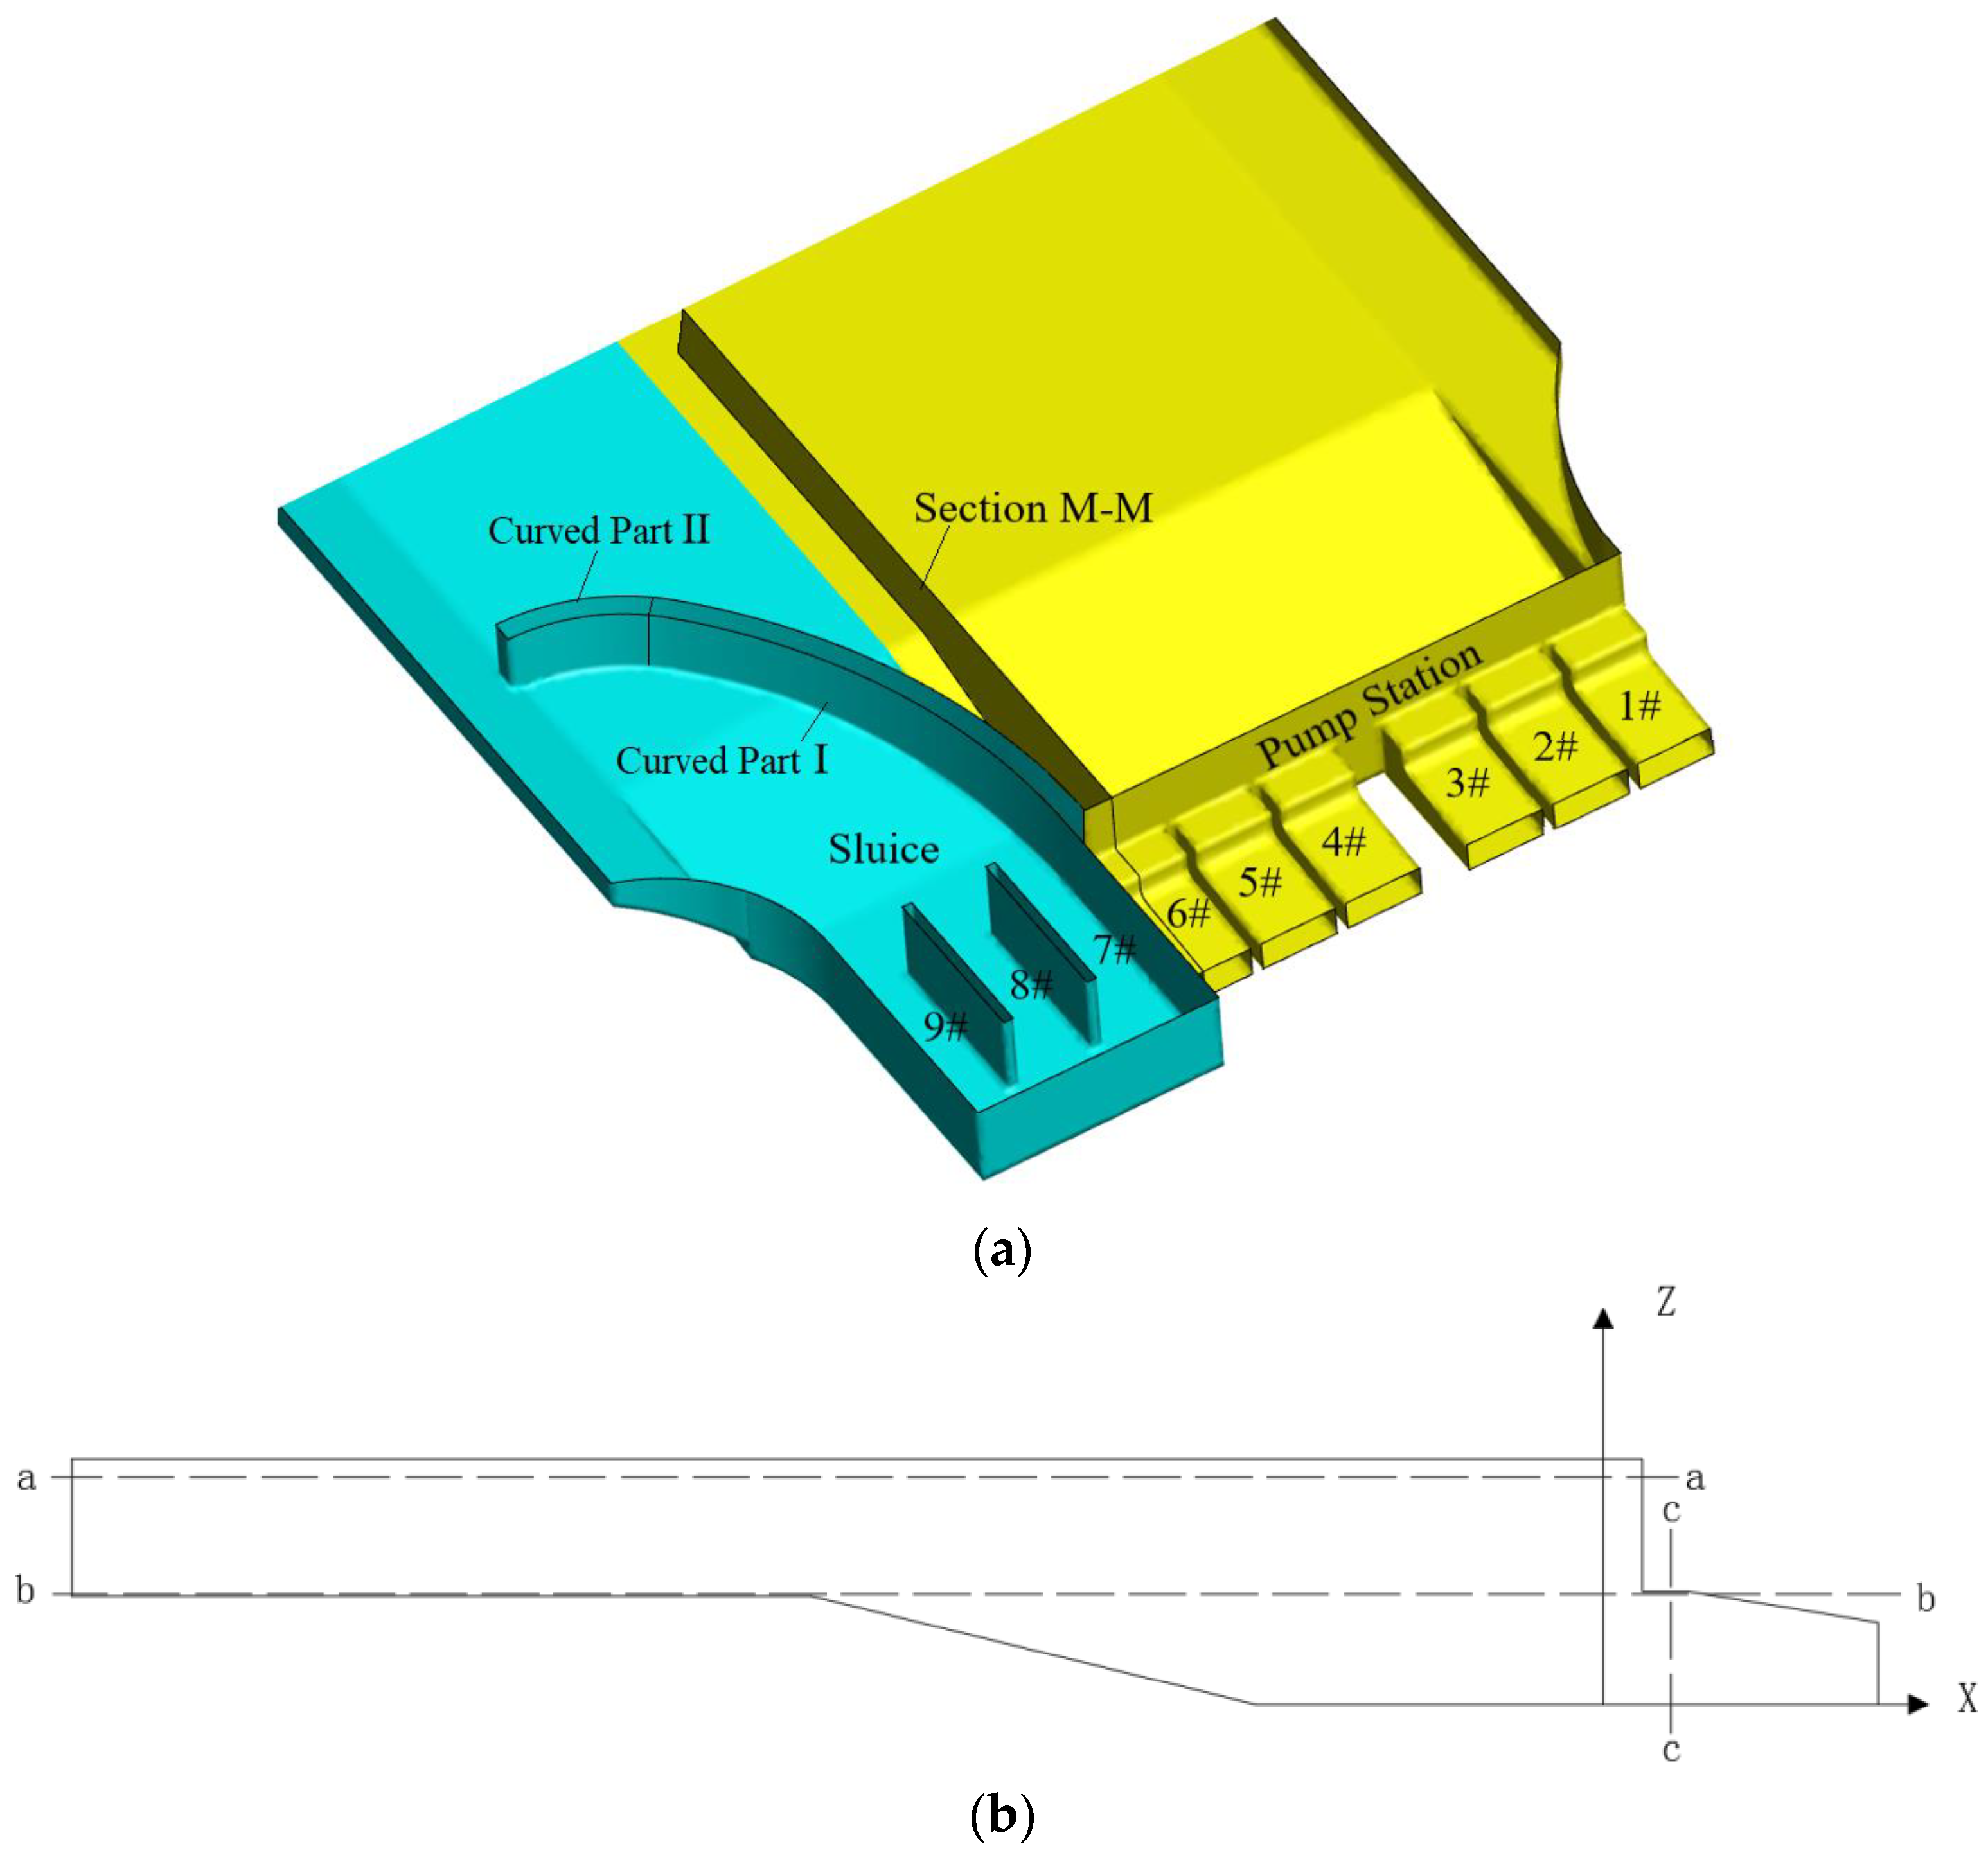
Figure 14.
Diagrammatic sketch of the position of characteristic section under the free-draining condition: (a) diagrammatic sketch of the position of characteristic section N-N; (b) sectional profile N-N.
Figure 14.
Diagrammatic sketch of the position of characteristic section under the free-draining condition: (a) diagrammatic sketch of the position of characteristic section N-N; (b) sectional profile N-N.
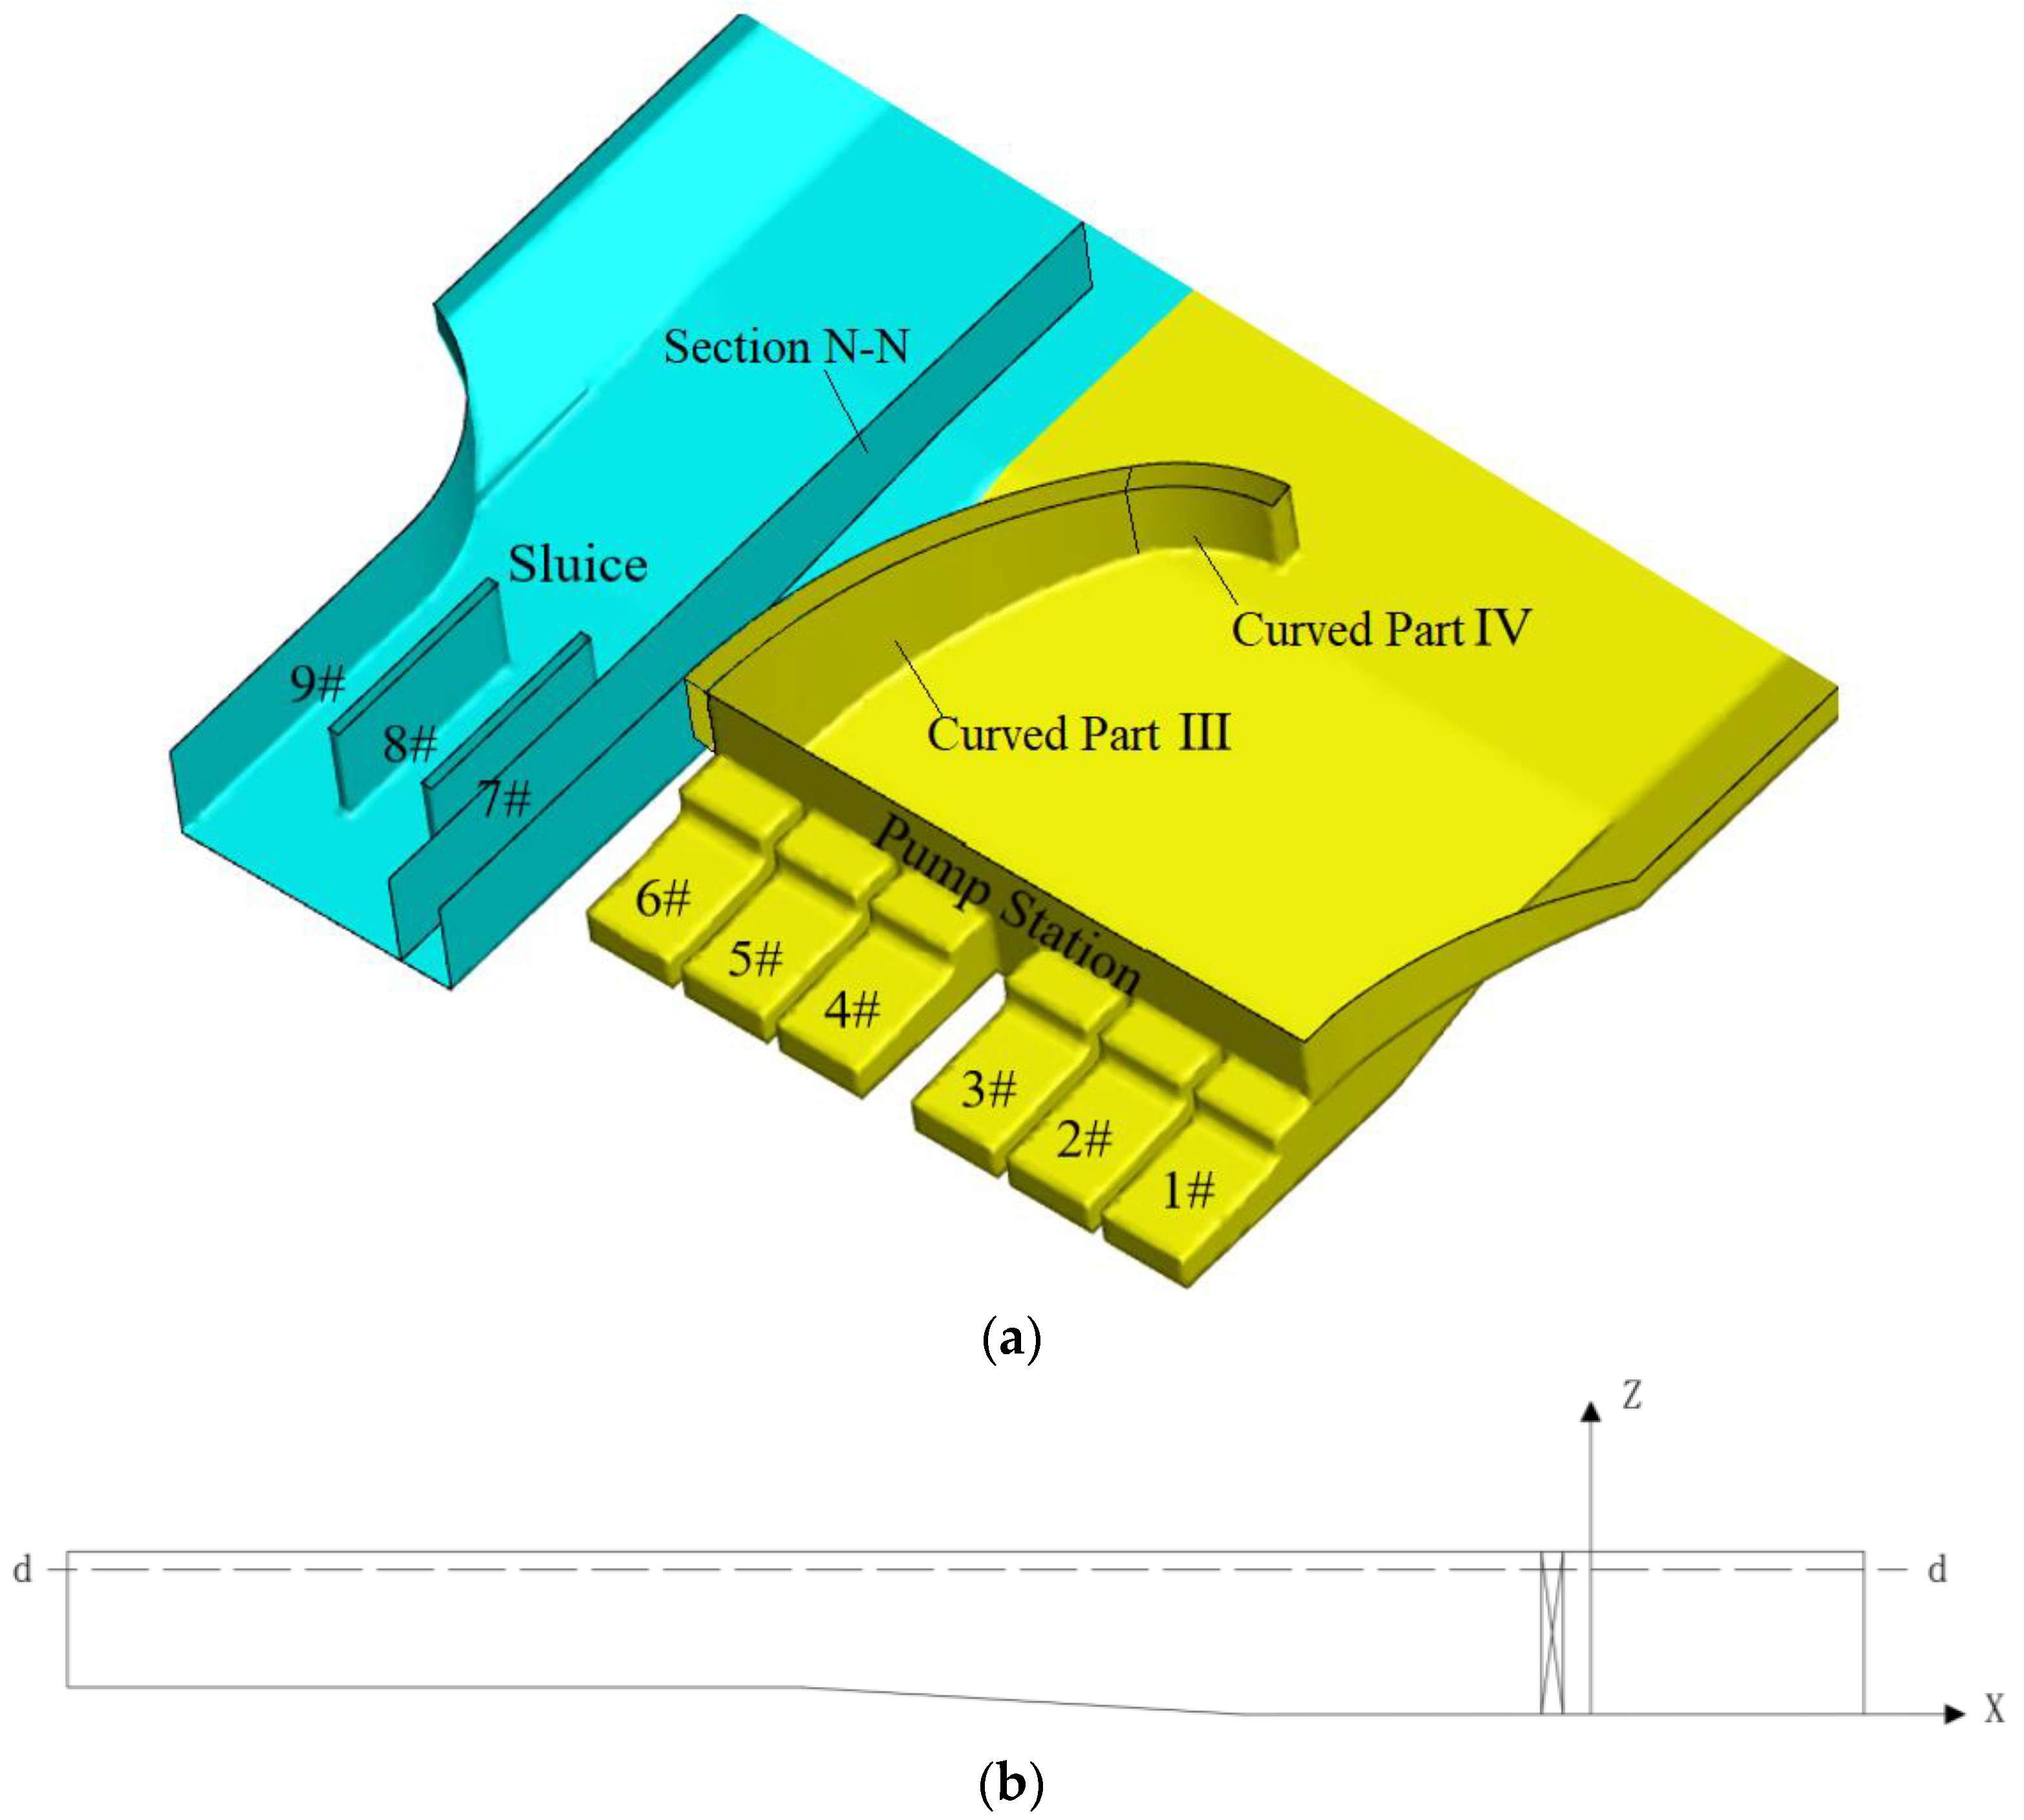
Figure 15.
Flow field diagram of each characteristic section in the operational state of pumping: (a) flow field distribution of section a-a; (b) flow field distribution of section b-b, (c) flow field distribution of c-c vertical section.
Figure 15.
Flow field diagram of each characteristic section in the operational state of pumping: (a) flow field distribution of section a-a; (b) flow field distribution of section b-b, (c) flow field distribution of c-c vertical section.

Figure 16.
Flow field diagram of the surface and velocity cloud diagram under the free-draining condition: (a) transverse velocity cloud diagram, (b) axial velocity cloud diagram.
Figure 16.
Flow field diagram of the surface and velocity cloud diagram under the free-draining condition: (a) transverse velocity cloud diagram, (b) axial velocity cloud diagram.
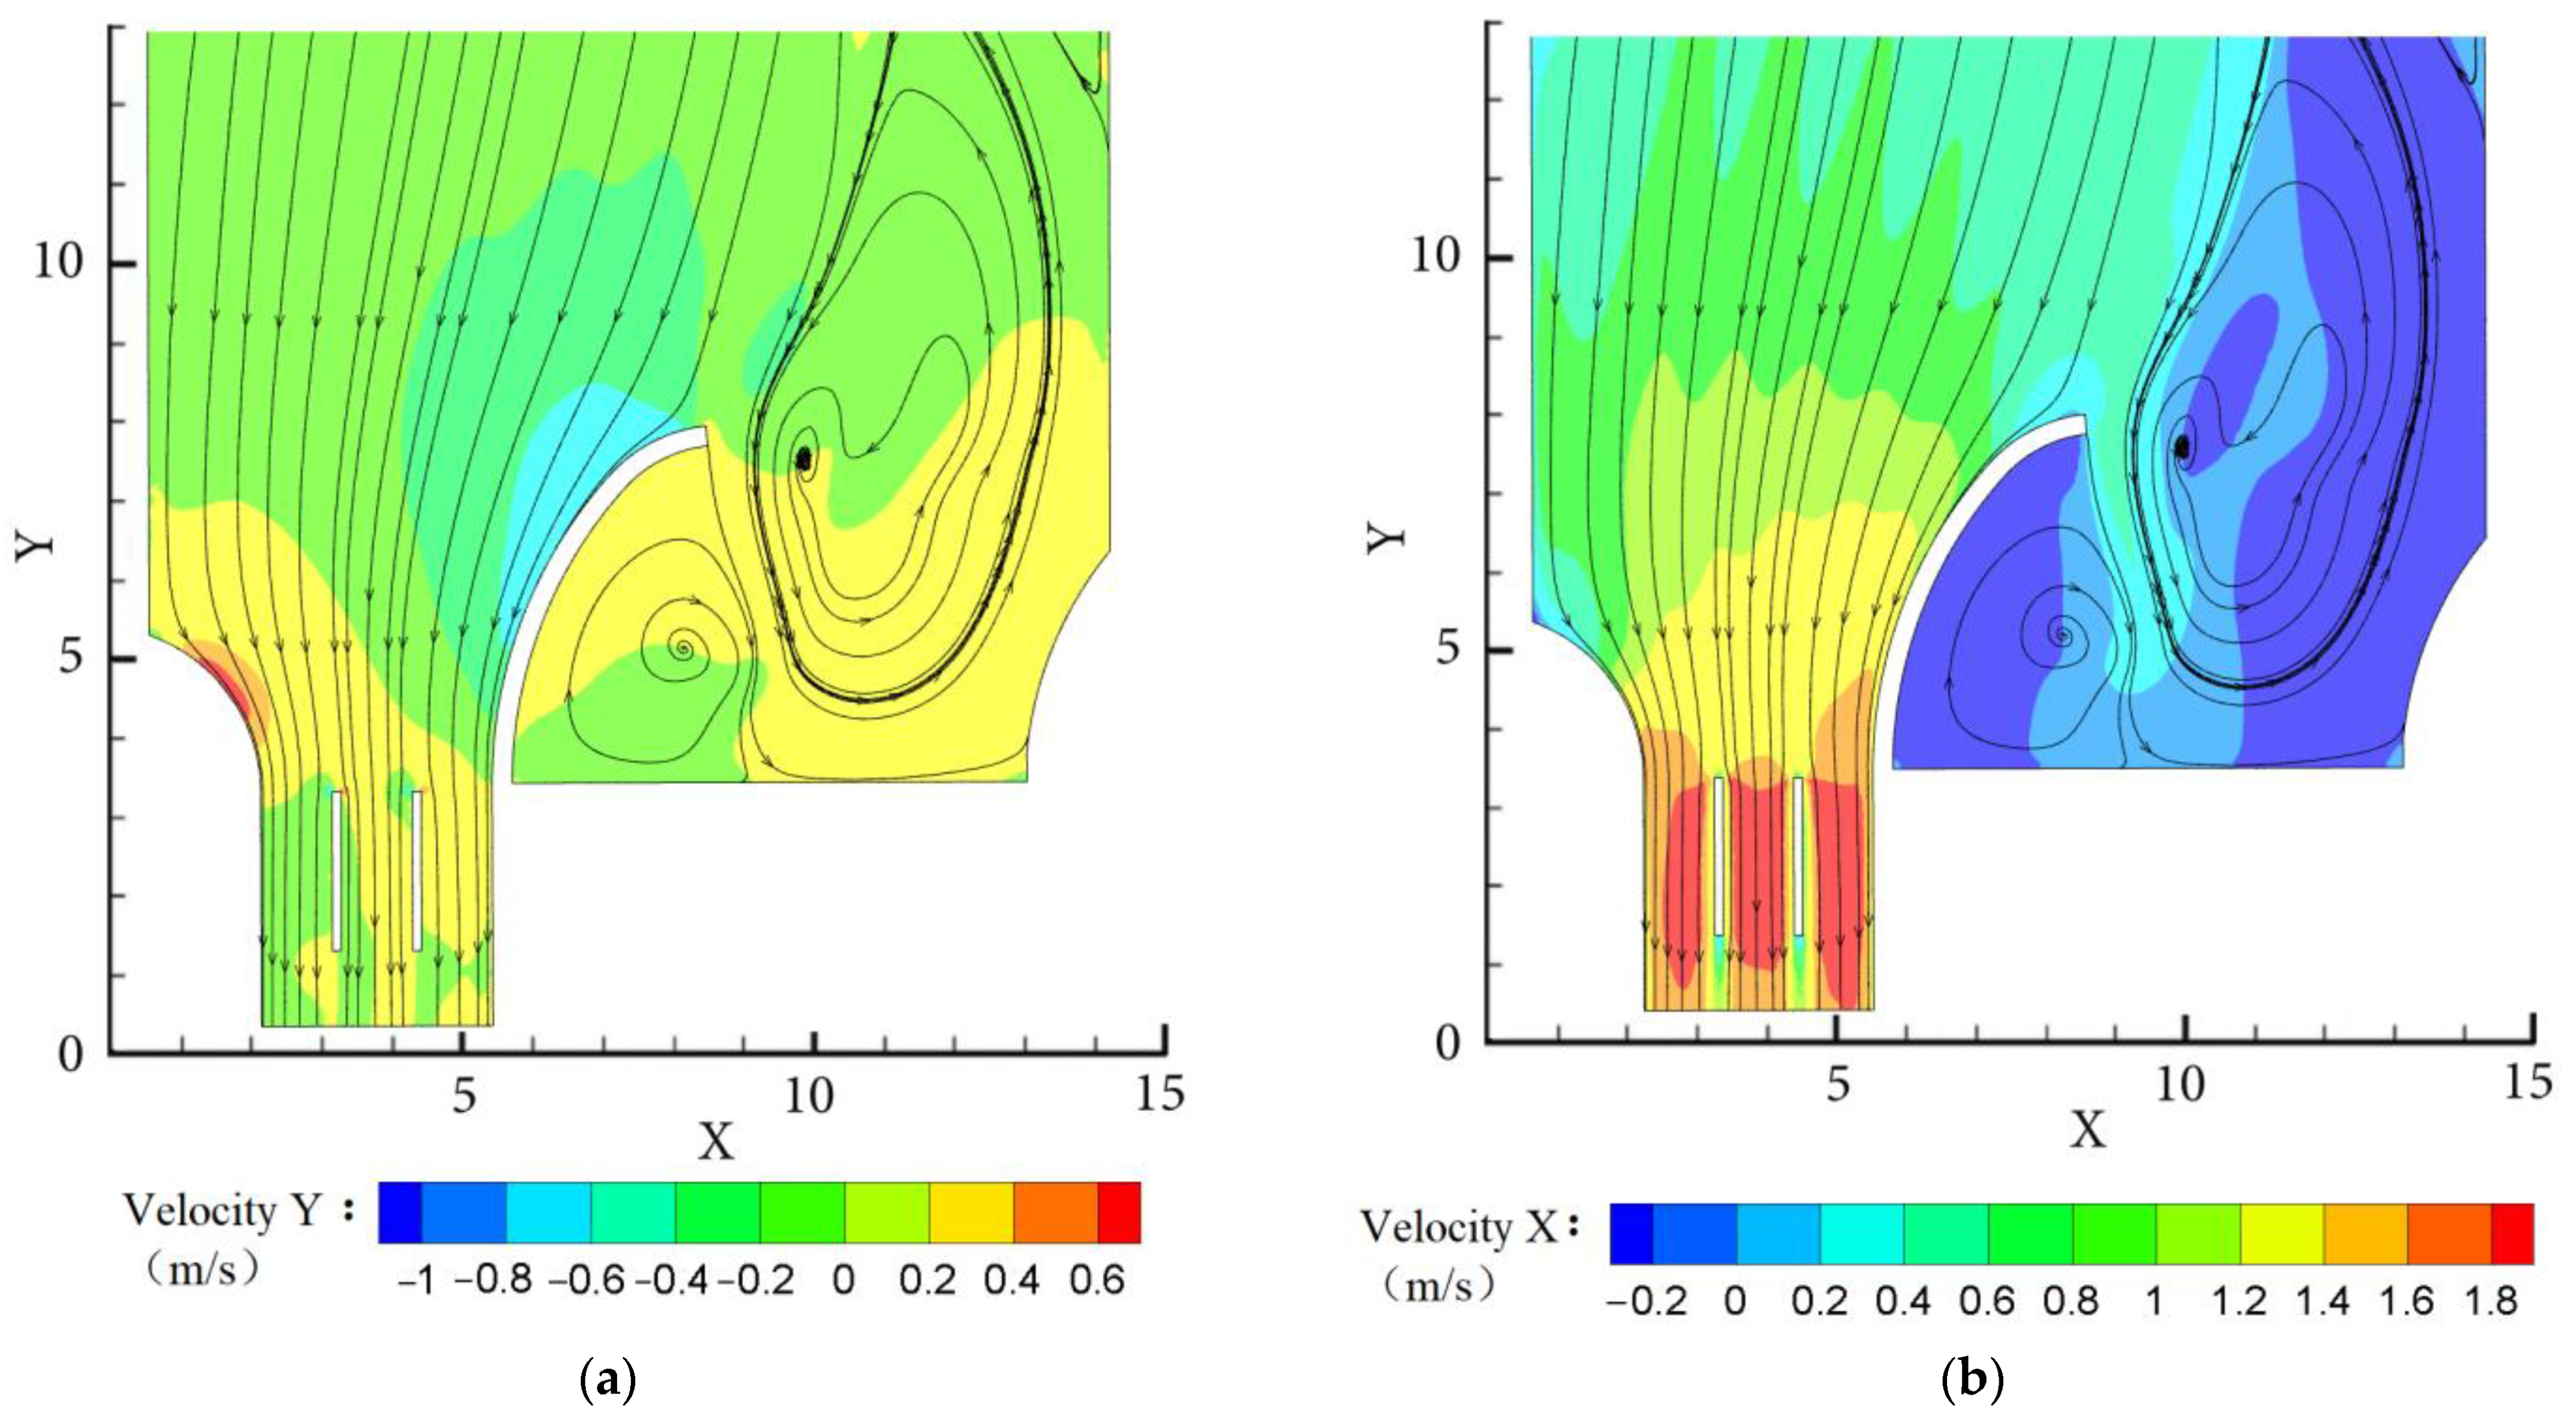
Figure 17.
Comparison of rectification effects of various schemes (operational state of pumping).
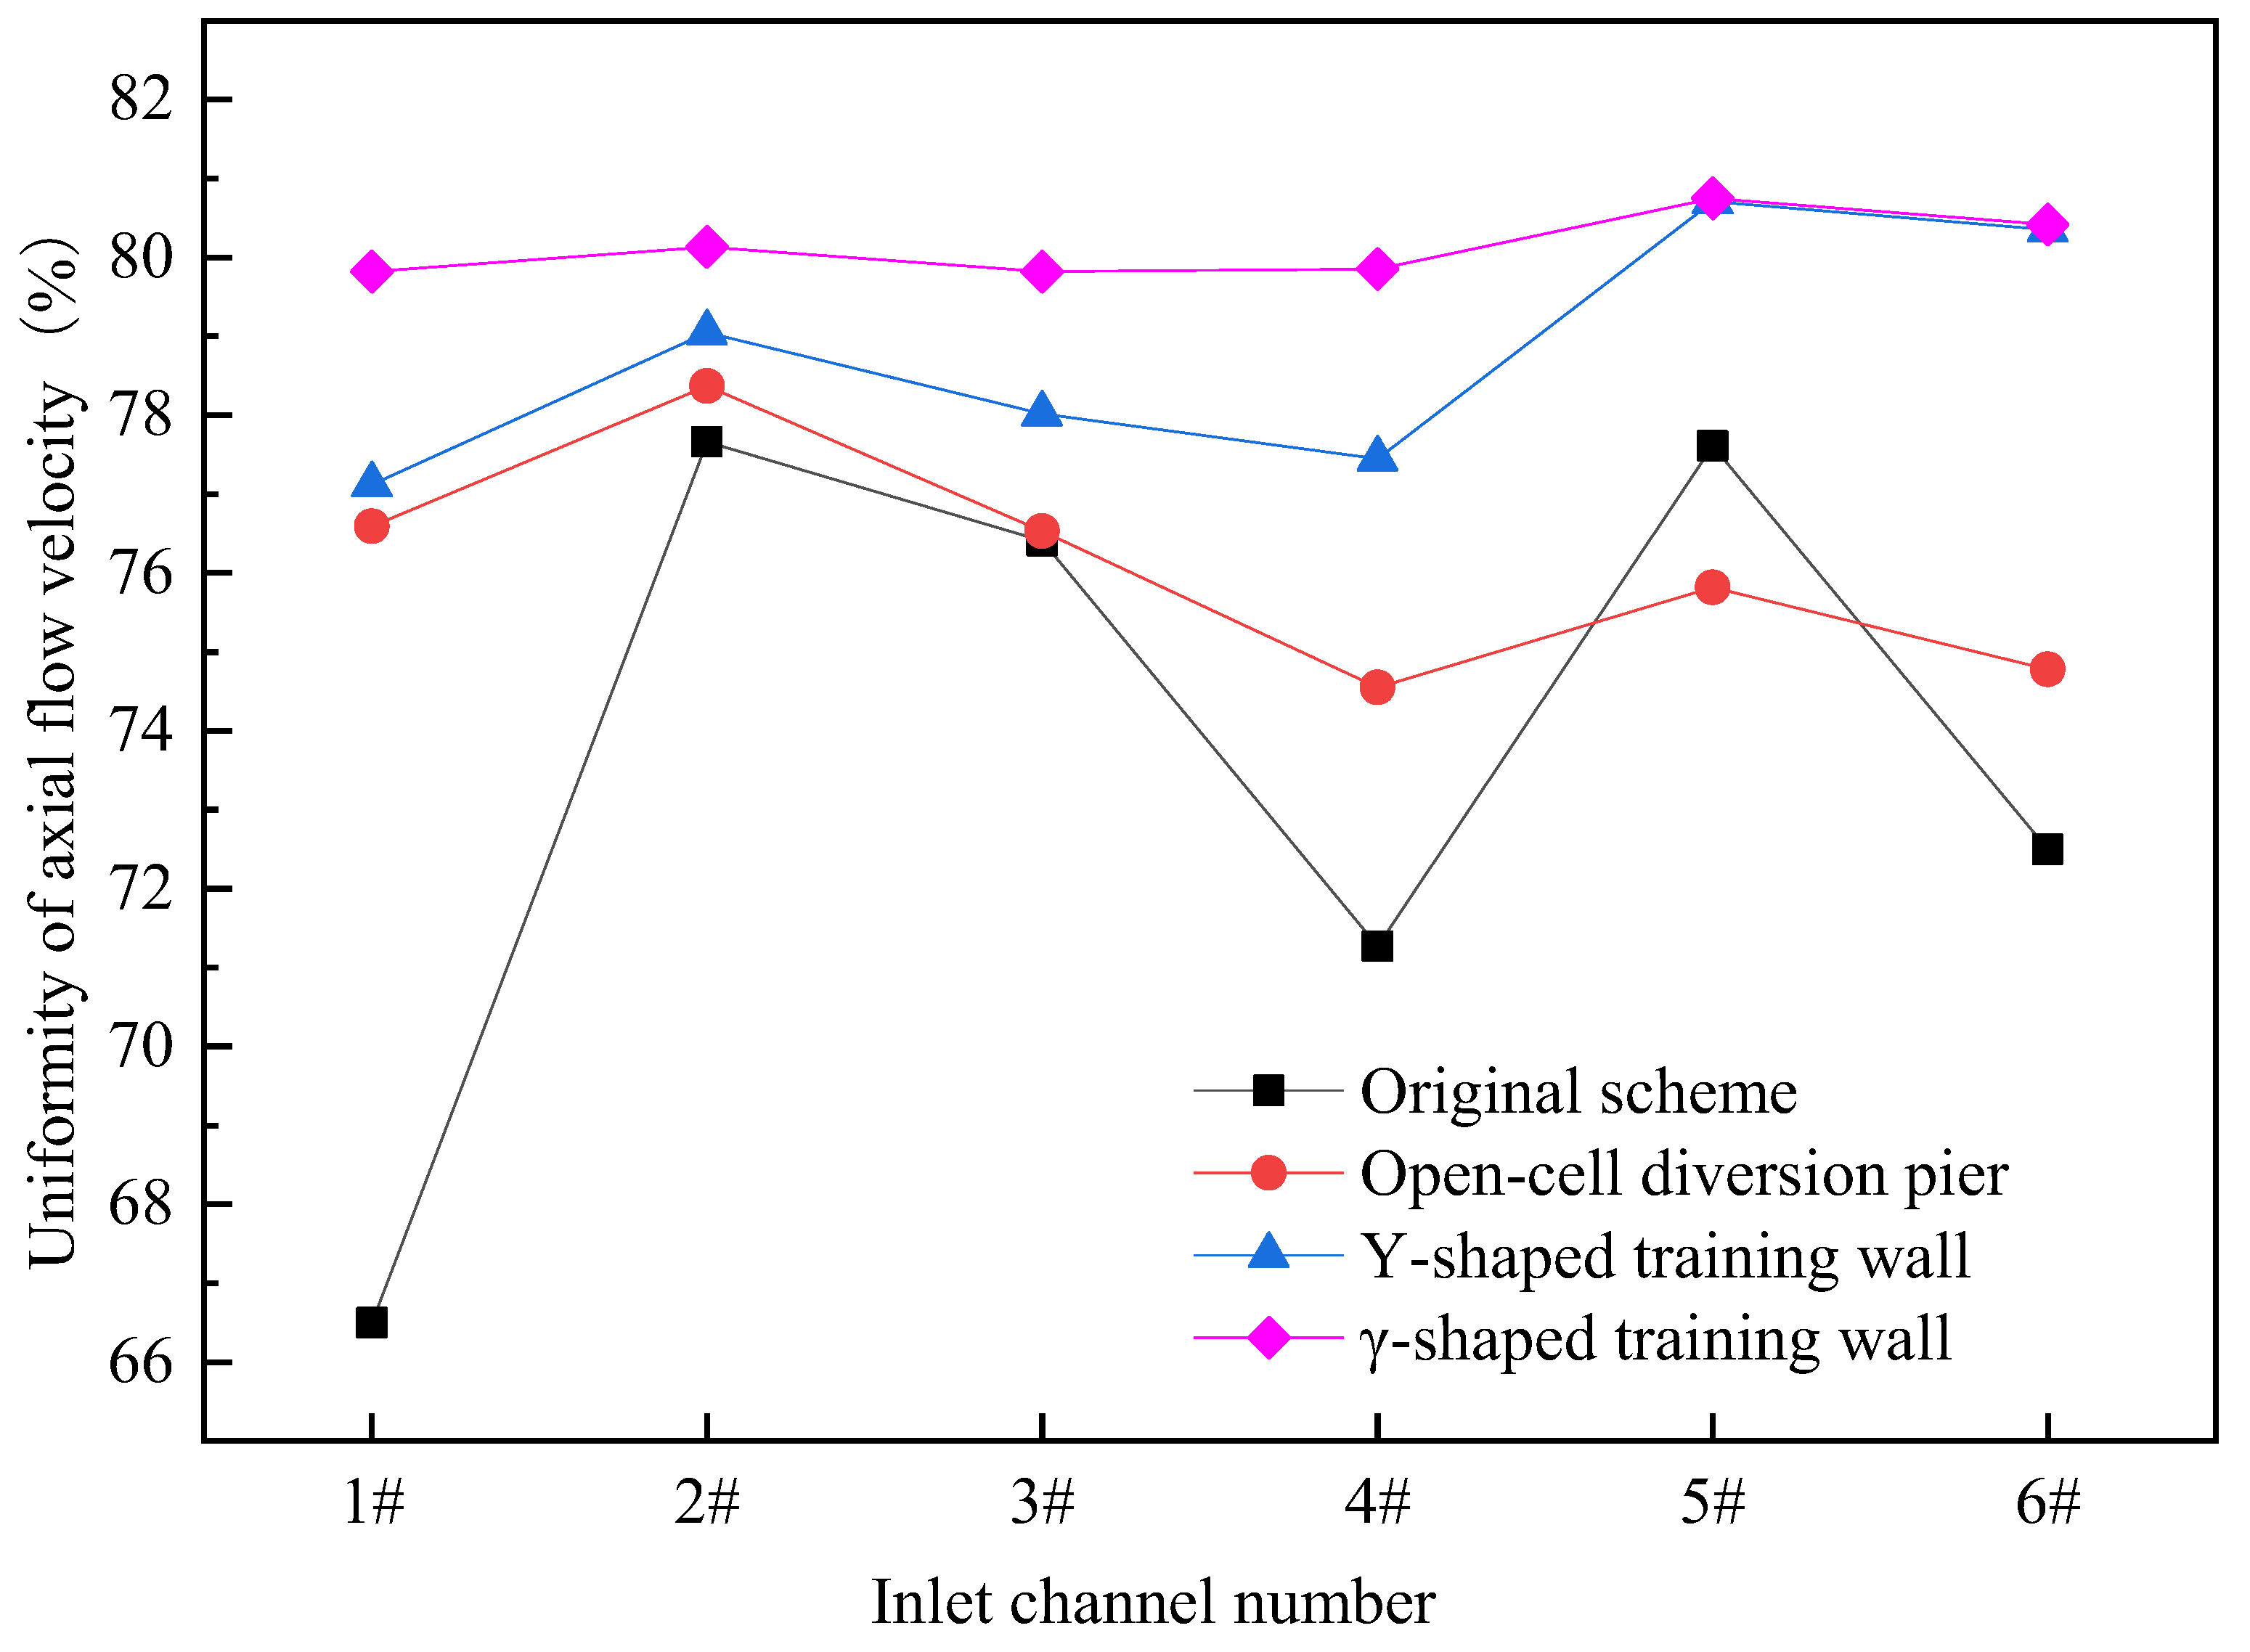
Figure 18.
Comparison of rectification effects of various schemes (operational state of free-draining).
Figure 18.
Comparison of rectification effects of various schemes (operational state of free-draining).


Table 1.
Levels of geometric parameter factors of the training wall (operational state of pumping).
| Level of Code | Factor | |||
|---|---|---|---|---|
| θ1/° | R1 | θ2/° | R2 | |
| −2 | 38 | 4.6t 2 | 44 | 2.2b 1 |
| −1 | 40 | 5.0t 2 | 46 | 2.4b 1 |
| 0 | 42 | 5.4t 2 | 48 | 2.6b 1 |
| 1 | 44 | 5.8t 2 | 50 | 2.8b 1 |
| 2 | 46 | 6.2t 2 | 52 | 3.0b 1 |
1 b denotes the clear width of the 7# sluice. 2 t denotes clear width of the 6# inlet channel.
Table 2.
Levels of geometric parameter factors of the training wall (operational state of free-draining).
Table 2.
Levels of geometric parameter factors of the training wall (operational state of free-draining).
| Level of Code | Factor | |||
|---|---|---|---|---|
| θ3/° | R3 | θ4/° | R4 | |
| −2 | 38 | 5.3b 1 | 38 | 1.0t 2 |
| −1 | 40 | 5.9b 1 | 40 | 1.2t 2 |
| 0 | 42 | 6.5b 1 | 42 | 1.4t 2 |
| 1 | 44 | 7.1b 1 | 44 | 1.6t 2 |
| 2 | 46 | 7.7b 1 | 46 | 1.8t 2 |
1 b denotes the clear width of the 7# sluice. 2 t denotes clear width of the 6# inlet channel.
Table 3.
Results of indicators of the schemes in the CCD-Response Surface Method under the operational state of pumping.
Table 3.
Results of indicators of the schemes in the CCD-Response Surface Method under the operational state of pumping.
| Serial Number of Schemes | θ1/° | R1 | θ2/° | R2 | Uniformity of Flow Velocity Distribution (6# inlet Channel)/(%) |
|---|---|---|---|---|---|
| P1 | −2 | 0 | 0 | 0 | 79.95 |
| P2 | 0 | 0 | 0 | 0 | 80.06 |
| P3 | 0 | 0 | 0 | 2 | 77.06 |
| P4 | 1 | −1 | 1 | −1 | 79.23 |
| P5 | 0 | 0 | 0 | 0 | 80.16 |
| P6 | −1 | 1 | 1 | −1 | 77.13 |
| P7 | −1 | 1 | −1 | −1 | 78.54 |
| P8 | 0 | 0 | 0 | −2 | 77.91 |
| P9 | 1 | 1 | 1 | −1 | 78.40 |
| P10 | 1 | −1 | −1 | −1 | 80.12 |
| P11 | 0 | 2 | 0 | 0 | 78.40 |
| P12 | 2 | 0 | 0 | 0 | 79.34 |
| P13 | 1 | 1 | −1 | −1 | 79.82 |
| P14 | 1 | −1 | −1 | 1 | 79.89 |
| P15 | 1 | −1 | 1 | 1 | 78.72 |
| P16 | 1 | 1 | −1 | 1 | 78.46 |
| P17 | 0 | 0 | 0 | 0 | 79.65 |
| P18 | 0 | 0 | 0 | 0 | 78.56 |
| P19 | 1 | 1 | 1 | 1 | 79.15 |
| P20 | −1 | −1 | 1 | 1 | 79.76 |
| P21 | 0 | 0 | 0 | 0 | 79.85 |
| P22 | −1 | −1 | 1 | −1 | 78.66 |
| P23 | 0 | −2 | 0 | 0 | 78.83 |
| P24 | 0 | 0 | 0 | 0 | 79.85 |
| P25 | −1 | 1 | 1 | 1 | 77.69 |
| P26 | −1 | −1 | −1 | 1 | 78.76 |
| P27 | 0 | 0 | −2 | 0 | 79.81 |
| P28 | −1 | 1 | −1 | 1 | 77.92 |
| P29 | 0 | 0 | 2 | 0 | 79.83 |
| P30 | −1 | −1 | −1 | −1 | 78.69 |
Table 4.
Results of indicators of the schemes in the CCD-Response Surface Method under the operational state of free-draining.
Table 4.
Results of indicators of the schemes in the CCD-Response Surface Method under the operational state of free-draining.
| Serial Number of Schemes | θ3/° | R3 | θ4/° | R4 | Uniformity of Flow Velocity Distribution (7# Sluice)/(%) |
|---|---|---|---|---|---|
| S1 | 0 | 0 | 0 | −2 | 81.41 |
| S2 | −1 | 1 | −1 | 1 | 79.92 |
| S3 | 0 | 0 | 0 | 0 | 84.35 |
| S4 | 2 | 0 | 0 | 0 | 82.34 |
| S5 | 1 | 1 | −1 | 1 | 83.46 |
| S6 | 0 | 0 | 0 | 0 | 84.35 |
| S7 | 0 | 0 | 0 | 2 | 80.06 |
| S8 | 0 | 0 | 2 | 0 | 82.83 |
| S9 | 1 | −1 | 1 | −1 | 82.23 |
| S10 | 0 | 0 | 0 | 0 | 84.35 |
| S11 | 1 | 1 | 1 | 1 | 82.15 |
| S12 | 1 | 1 | −1 | −1 | 82.82 |
| S13 | −1 | −1 | 1 | 1 | 81.76 |
| S14 | 0 | 0 | −2 | 0 | 83.31 |
| S15 | −2 | 0 | 0 | 0 | 81.95 |
| S16 | −1 | −1 | 1 | −1 | 80.66 |
| S17 | −1 | −1 | −1 | 1 | 82.76 |
| S18 | 0 | −2 | 0 | 0 | 82.33 |
| S19 | −1 | −1 | −1 | −1 | 80.69 |
| S20 | 1 | −1 | −1 | −1 | 83.12 |
| S21 | 0 | 0 | 0 | 0 | 84.06 |
| S22 | 0 | 2 | 0 | 0 | 81.38 |
| S23 | 1 | −1 | −1 | 1 | 82.89 |
| S24 | 0 | 0 | 0 | 0 | 84.06 |
| S25 | −1 | 1 | 1 | −1 | 79.13 |
| S26 | −1 | 1 | 1 | 1 | 81.19 |
| S27 | 1 | −1 | 1 | 1 | 81.72 |
| S28 | 0 | 0 | 0 | 0 | 84.06 |
| S29 | −1 | 1 | −1 | −1 | 80.54 |
| S30 | 1 | 1 | 1 | −1 | 81.40 |
Table 5.
Significance test of the regression equation (operational state of pumping).
| Source of Variation | Sum of Deviation | Degree of Freedom | Uniformity of Flow Velocity Distribution of the Admission Section of the 6# Channel | ||
|---|---|---|---|---|---|
| Mean Square Deviation | F | p | |||
| Model | 30.41 | 14 | 2.17 | 4.55 | 0.0031 |
| θ1 | 1.22 | 1 | 1.22 | 2.56 | 0.1304 |
| R1 | 2.39 | 1 | 2.39 | 5.01 | 0.0408 |
| θ2 | 2.29 | 1 | 2.29 | 4.8 | 0.0447 |
| R2 | 0.1768 | 1 | 0.1768 | 0.37 | 0.5521 |
| θ1R1 | 2.61 | 1 | 2.61 | 5.46 | 0.0338 |
| θ1θ2 | 0.2809 | 1 | 0.2809 | 0.5878 | 0.4552 |
| θ1R2 | 0.3782 | 1 | 0.3782 | 0.7914 | 0.3877 |
| R1θ2 | 0.1024 | 1 | 0.1024 | 0.2143 | 0.6501 |
| R1R2 | 0.0756 | 1 | 0.0756 | 0.1582 | 0.6964 |
| θ2R2 | 0.0001 | 1 | 0.0001 | 0.0002 | 0.9886 |
| θ1² | 1.54 | 1 | 1.54 | 3.23 | 0.0926 |
| R1² | 6.71 | 1 | 6.71 | 14.04 | 0.0019 |
| θ2² | 1.03 | 1 | 1.03 | 2.15 | 0.1637 |
| R2² | 16.56 | 1 | 16.56 | 34.66 | <0.0001 |
| Residual | 7.17 | 15 | 0.4779 | ||
| Lack of Fit | 7.04 | 10 | 0.7042 | 27.91 | 0.0009 |
| Pure Error | 0.1261 | 5 | 0.0252 | ||
| Cor Total | 37.58 | 29 | |||
Table 6.
Significance test of the regression equation (operational state of free-draining).
| Source of Variation | Deviation Sum of Squares | Degree of Freedom | Uniformity of Flow Velocity Distribution of the Admission Section in Front of the 7# Sluice | ||
|---|---|---|---|---|---|
| Mean Square Deviation | F | p | |||
| Model | 50.34 | 14 | 3.60 | 5.90 | 0.0008 |
| θ3 | 8.07 | 1 | 8.07 | 13.24 | 0.0024 |
| R3 | 2.09 | 1 | 2.09 | 3.43 | 0.0840 |
| θ4 | 2.00 | 1 | 2.00 | 3.27 | 0.0906 |
| R4 | 0.2731 | 1 | 0.2731 | 0.4478 | 0.5135 |
| θ3R3 | 1.54 | 1 | 1.54 | 2.52 | 0.1332 |
| θ3θ4 | 0.8190 | 1 | 0.8190 | 1.34 | 0.2646 |
| θ3R4 | 0.9801 | 1 | 0.9801 | 1.61 | 0.2242 |
| R3θ4 | 0.0030 | 1 | 0.0030 | 0.0050 | 0.9448 |
| R3R4 | 0.0100 | 1 | 0.0100 | 0.0164 | 0.8998 |
| θ4R4 | 0.1482 | 1 | 0.1482 | 0.2431 | 0.6291 |
| θ3² | 8.76 | 1 | 8.76 | 14.37 | 0.0018 |
| R3² | 11.07 | 1 | 11.07 | 18.15 | 0.0007 |
| θ4² | 3.06 | 1 | 3.06 | 5.02 | 0.0407 |
| R4² | 23.10 | 1 | 23.10 | 37.88 | <0.0001 |
| Residual | 9.15 | 15 | 0.6098 | ||
| Lack of Fit | 9.02 | 10 | 0.9021 | 35.75 | 0.0005 |
| Pure Error | 0.1261 | 5 | 0.0252 | ||
| Cor Total | 59.49 | 29 | |||
Publisher’s Note: MDPI stays neutral with regard to jurisdictional claims in published maps and institutional affiliations. |
© 2022 by the authors. Licensee MDPI, Basel, Switzerland. This article is an open access article distributed under the terms and conditions of the Creative Commons Attribution (CC BY) license (https://creativecommons.org/licenses/by/4.0/).
Share and Cite
MDPI and ACS Style
Xu, B.; Liu, J.; Lu, W.; Xu, L.; Xu, R. Design and Optimization of γ-Shaped Settlement Training Wall Based on Numerical Simulation and CCD-Response Surface Method. Processes 2022, 10, 1201. https://doi.org/10.3390/pr10061201
AMA Style
Xu B, Liu J, Lu W, Xu L, Xu R. Design and Optimization of γ-Shaped Settlement Training Wall Based on Numerical Simulation and CCD-Response Surface Method. Processes. 2022; 10(6):1201. https://doi.org/10.3390/pr10061201
Chicago/Turabian StyleXu, Bo, Jianfeng Liu, Weigang Lu, Lei Xu, and Renyi Xu. 2022. "Design and Optimization of γ-Shaped Settlement Training Wall Based on Numerical Simulation and CCD-Response Surface Method" Processes 10, no. 6: 1201. https://doi.org/10.3390/pr10061201
Note that from the first issue of 2016, this journal uses article numbers instead of page numbers. See further details here.