Article

Pollution Characteristics, Source Apportionment, and Health Risk of Polycyclic Aromatic Hydrocarbons (PAHs) of Fine Street Dust during and after COVID-19 Lockdown in Bangladesh

by
Mominul Haque Rabin
1,2,*,
Qingyue Wang
1,*,
Weiqian Wang
1 and
Christian Ebere Enyoh
1
1
Graduate School of Science and Engineering, Saitama University, Saitama 338-8570, Japan
2
Department of Agricultural Chemistry, Faculty of Agriculture, Sher-e-Bangla Agricultural University, Dhaka 1207, Bangladesh
*
Authors to whom correspondence should be addressed.
Processes 2022, 10(12), 2575; https://doi.org/10.3390/pr10122575
Submission received: 7 November 2022 / Revised: 24 November 2022 / Accepted: 1 December 2022 / Published: 3 December 2022
(This article belongs to the Section Environmental and Green Processes)

Abstract

:
The COVID-19 period has had a significant impact on both the global environment and daily living. The COVID-19 lockdown may provide an opportunity to enhance environmental quality. This study has evaluated the effect of the COVID-19 lockdown on the distribution of polycyclic aromatic hydrocarbons (PAHs) in the street dust (diameter < 20 µm) of different land use areas in Dhaka city, Bangladesh, using gas chromatography–mass spectrometry (GC–MS). The maximum (2114 ng g−1) concentration of ∑16 PAHs was found in the industrial area during without lockdown conditions and the minimum (932 ng g−1) concentration was found in the public facilities area during the complete lockdown. Meanwhile, due to the partial lockdown, a maximum of 30% of the ∑16 PAH concentration decreased from the situation of without lockdown in the industrial area. The highest result of 53% of the ∑16 PAH concentration decreased from the situation without lockdown to the complete lockdown in the commercial area. The 4-ring PAHs had the highest contribution, both during and after the lockdown conditions. PAH ratios, correlation, principal component analysis (PCA), and hierarchical clustering analysis (HCA) were applied in order to evaluate the possible sources. Two major origins of PAHs in the street dust were identified as petroleum and petrogenic sources, as well as biomass and coal combustion. Ingestion and dermal pathways were identified as the major exposure routes to PAHs in the dust. The total incremental lifetime cancer risk (ILCR) due to exposure for adults and children ranged from 8.38 × 10⁻⁸ to 1.16 × 10⁻⁷ and from 5.11 × 10⁻⁸ to 1.70 × 10⁻⁷, respectively. These values were lower than the baseline value of acceptable risk (10–6), indicating no potential carcinogenic risk. This study found that the COVID-19 lockdown reduced the distribution of PAHs in the different sites of Dhaka city, thus providing a unique opportunity for the remarkable improvement of degraded environmental resources.

1. Introduction

The world’s urban cities are rapidly becoming dangerous as a result of air and soil pollution [1]. According to a global study, Bangladesh is the world’s most polluted country, and Dhaka is the second most polluted city [2]. Dhaka has long been plagued by environmental contaminants, most notably by air pollution. The air of Dhaka is becoming increasingly polluted, and the air quality has deteriorated as a result of both human activities and natural phenomena, such as wind-blown dust particles [3]. Re-suspended street dust, which is laden with hazardous chemicals, polycyclic aromatic hydrocarbons (PAHs), black carbon, and other pollutants, is one of the major producers of coarse, fine, and ultrafine particles in the atmosphere [4]. This is particularly true for the urban regions and the industrial locations that have a substantial under-pavement sealed area and a congested road network [5].
Urban street dust mostly comes from vehicle exhausts, pavements and the wear of vehicle tires, soil particles, ash and leftovers from burning biomass, and other sources [6,7,8]. It is created by the forces of wind, water, and gravity on the road surface [6]. Millions of tons of dust particles containing heavy metals or metalloids, as well as persistent organic pollutants, remain in the environment as a result of road construction, mining, and industrial activity [9,10]. Street dust (especially the fine fraction) has been found to be highly mobile in the environment and it is capable of adsorbing both organic and heavy metal pollutants [11,12,13]. In Dhaka, both the number of motor vehicles and the density of road networks have increased quickly [14], resulting in an increase in urban street dust deposition [15].
Many of the commonly occurring chemical molecules that are known as PAHs, which contain two or more benzene rings, are seen as dangerous environmental hazards. [16,17]. They are pervasive pollutants that are created when carbonaceous materials are burned in the environment [18]. About 160 PAHs have been examined in nature overall; however, only 16 of them are listed as priority pollutants in various natural ecosystems by the US Environmental Protection Agency and the European Union [19] and are tightly regulated in many countries across the world. Some PAHs have been connected to health issues such as cataracts, kidney and liver damage, and jaundice and are thought to be mutagenic and/or carcinogenic chemicals [20,21,22]. In Bangladesh, studies on PAHs in dusts are scarce, and few studies have focused on particulate matter 2.5 (PM2.5) [23] and fine coal fraction [24]. The endocrine and reproductive systems can be impacted by PAHs when they are absorbed from the dust by eating, cutaneous contact, and inhalation [25,26]. They also weaken the immune system, can cause major respiratory and cardiovascular diseases, myocardial infarction, asthma, and possibly cancer, and can decrease lung capacity. [27,28,29]. The human exposure pathway is greatly influenced by the size of the dust particles [30,31]. In fact, breathing in dust particles that are smaller than 10 µm can cause damage to the respiratory system. Furthermore, dust particles that are smaller than 250 µm stick to the skin readily and can thus be easily swallowed due to hand-to-mouth action [32].
Coronavirus 2019 (COVID-19) recently forced Bangladesh to halt operations in the fields of industry, public transportation, and other anthropogenic activities. On 7 March 2020, Bangladesh discovered its first COVID-19 case, and from 26 March to 30 May 2020, it carried out its first shutdown. The first stage of the entire lockdown started on 7 April and finished on 28 April. The partial lockdown started on 5 April and ended on 11 April of 2021. Since emissions and air quality are negatively connected, a complete or partial closure is expected to lead to an improvement of air quality. The following conditions were ensured during the partial lockdown: public transportation could not carry more people than 50% of its seating capacity; inter-district vehicular movement was restricted; all educational institutions were closed; all government and non-government offices and institutions were operated with 50% manpower; and unnecessary roaming and gathering was stopped. Whereas during the complete lockdown, all transport services were completely closed; all government of all levels, offices, and institutions were operated with 50% manpower; and all educational institutions were completely closed. It is well recognized that most environmental contamination in a variety of ecosystems is caused by human activities. [33]. According to many studies, natural restoration has been acknowledged as a crucial element of the COVID-19 shutdown [34,35]. According to recent reports, there has been a dramatic decrease in the air and water quality worldwide since the COVID-19 shutdown, which practically totally halted industrial activity and vehicular travel in several nations [36]. Numerous studies that have been carried out all over the world have shown the effects of the COVID-19 lockdown [37,38]. However, none of these studies have attempted to compare the PAH levels in the street dust in Dhaka, Bangladesh, before and after the lockdown. Following the debate above, the following objectives for the current study were established: (i) to examine the dangers that the PAHs in street dust bring to people’s health, (ii) to find the sources of PAHs in street dust, and (iii) to evaluate the three molecular weight categories of PAHs in the street dust in Dhaka city during without, partial and complete lockdown.

2. Materials and Methods

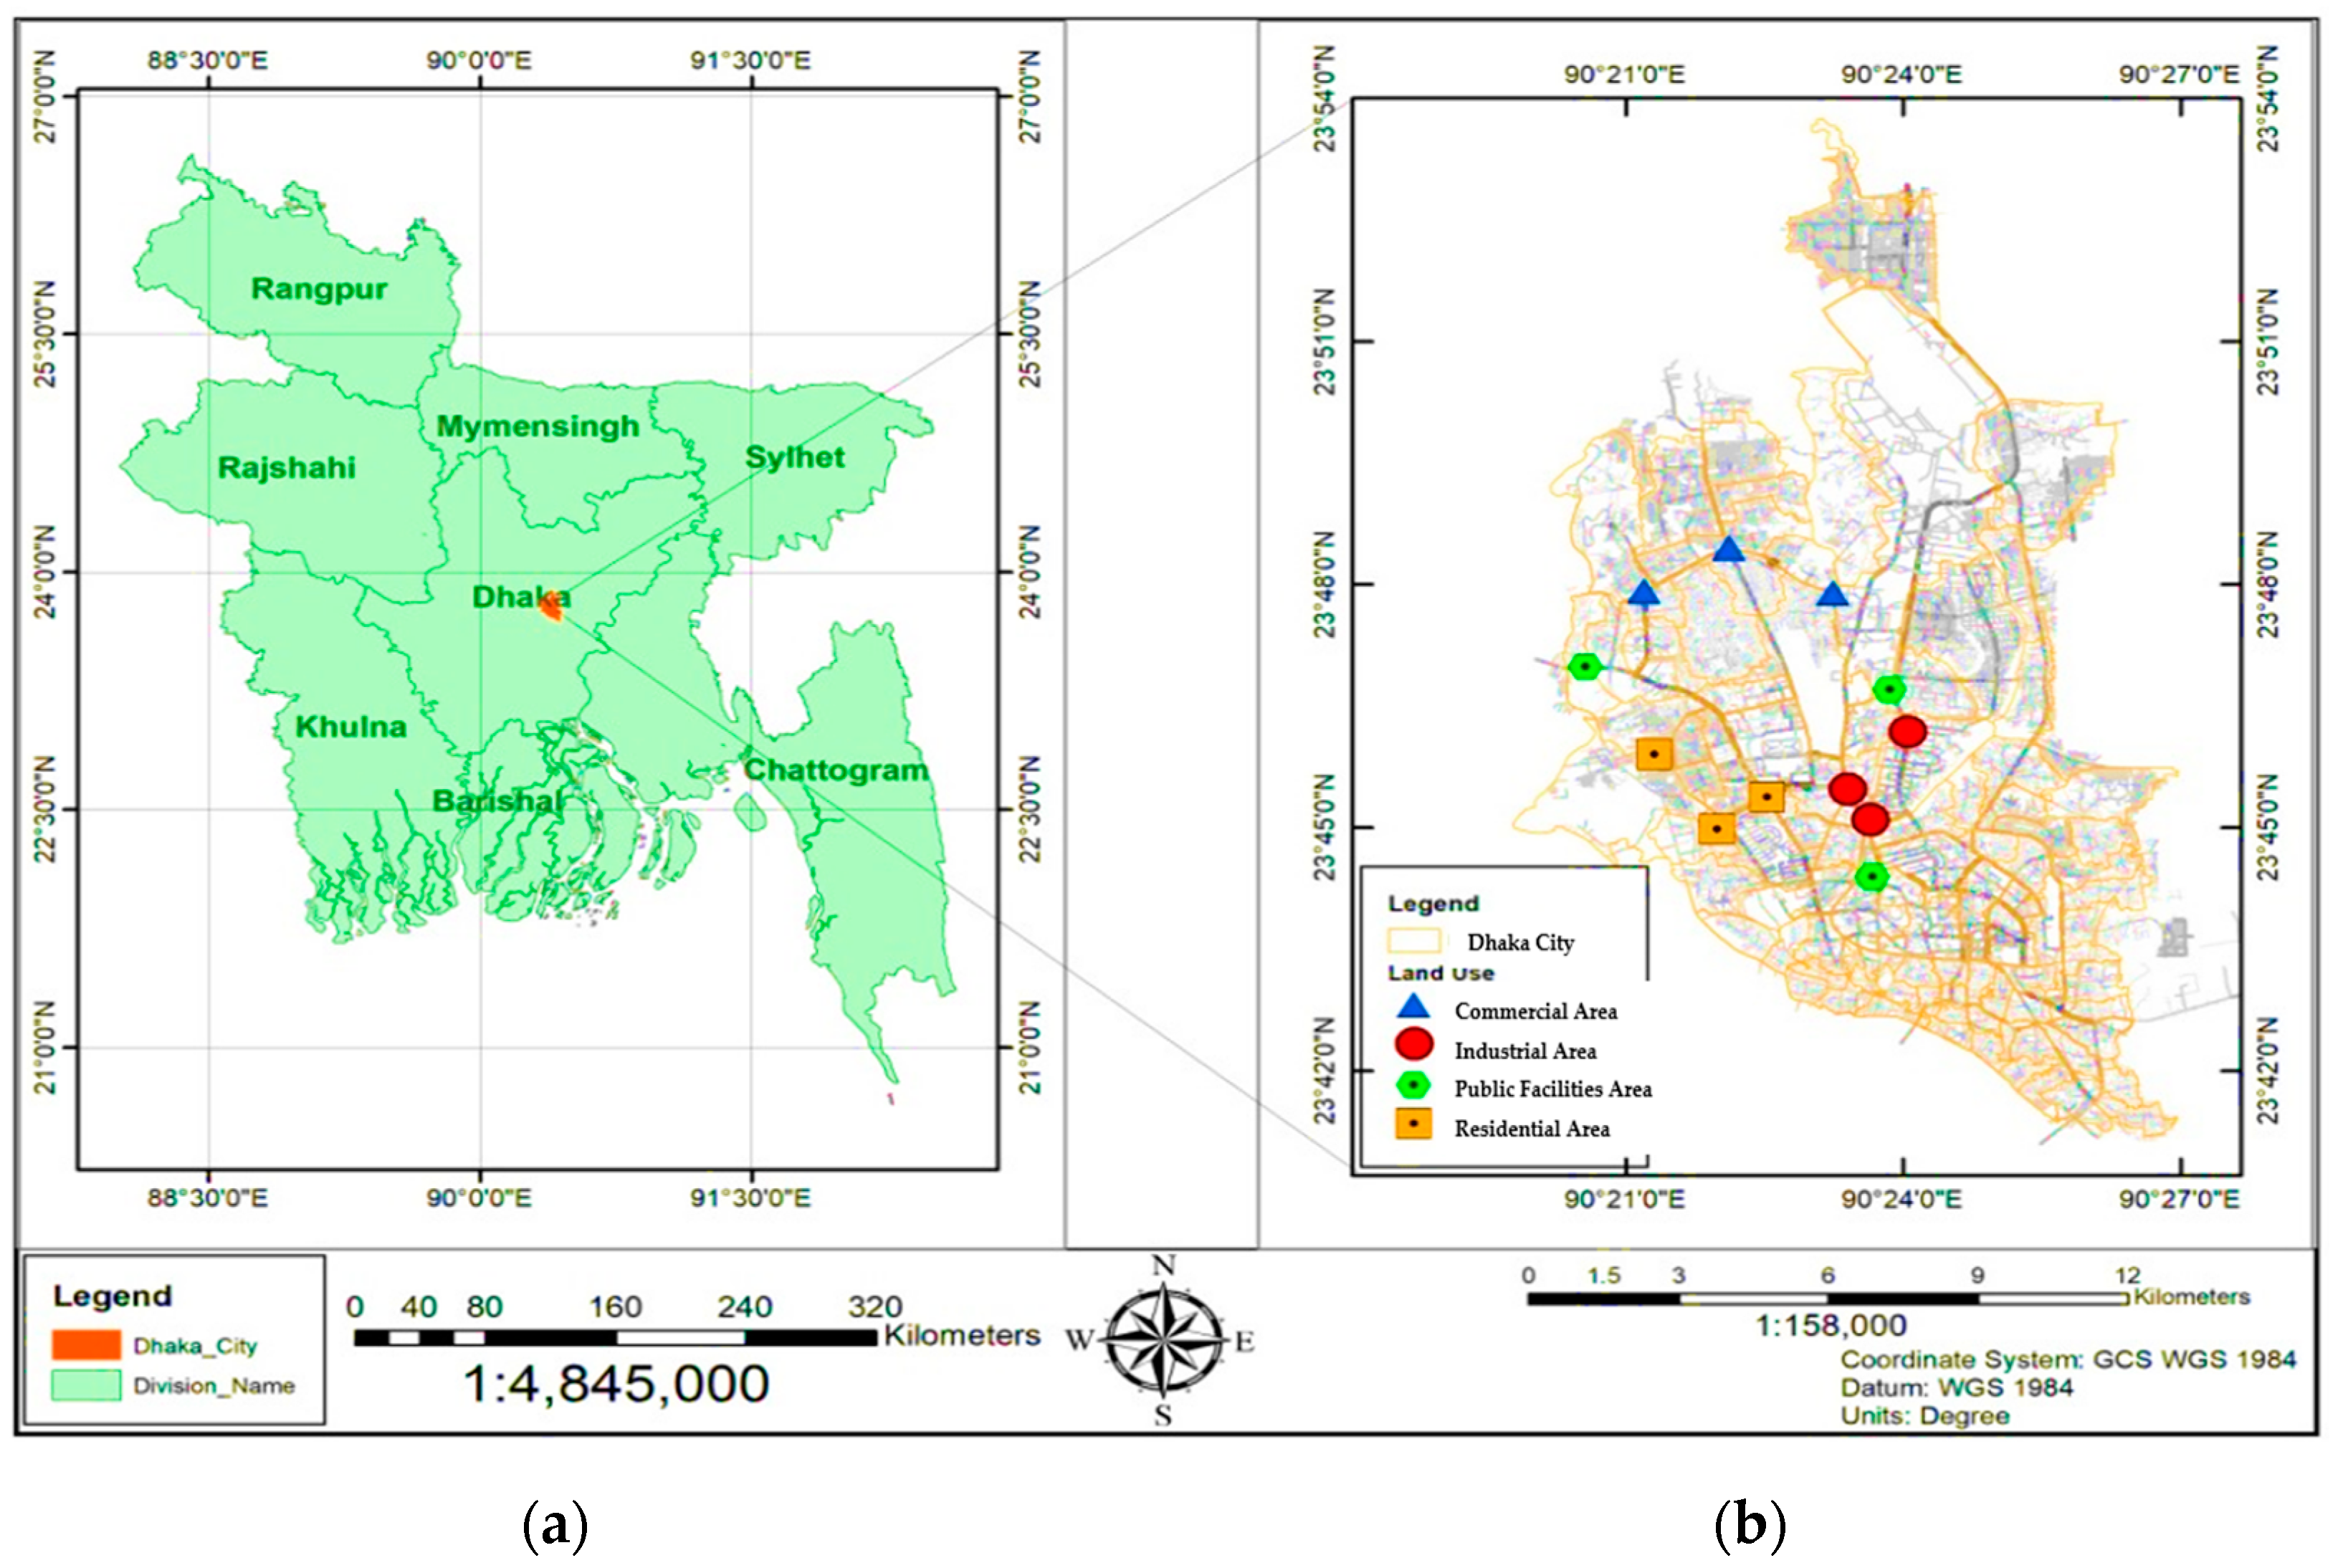
2.1. Study Area and Sampling Sites

The various streets in the Dhaka metropolitan region were used to gather the dust samples. Bangladesh’s main and largest city, Dhaka, has 20 million residents in a 1500 km2 region, with a 7% annual population growth rate [39]. Significant smog is present in the air of Dhaka city due to an increase in the number of people, cars, and industry [40]. Older trucks, minibuses, and two-stroke auto rickshaws, are major sources of air pollution [41]. Additionally, several light and heavy industries have been developed in the Bangladeshi metropolis of Dhaka, including those that process leather, glass, ceramic, batteries, and textiles [42]. All of these human activities generate enormous amounts of garbage, effluents, and air pollutants, which gravely impair Dhaka’s ecology [43]. The Dhaka Urban Transport Network Development Study lists residential areas (44.35%), commercial areas (4.29%), industrial areas (2.01%), public facilities areas (7.97%), urban green areas (1.20%), roads/railways (10.46%), and restricted areas (8.42%) as the main land use categories in Dhaka City (available online at https://openjicareport.jica.go.jp/pdf/1199678203.pdf, accessed on 15 October 2022). The sample sites’ locations in the area are depicted in Figure 1.

2.2. Sample Collection and Processing

The sites that were used for sampling were chosen based on their importance, such as their surrounds, traffic volume, and population density. During the partial and complete lockdowns, and after the lockdown, street dust samples were collected using a pre-clean plastic dustpan and polyethylene brushes [45]. The locations, which included industrial areas (IA), commercial areas (CA), public facilities areas (PFA), and residential areas (RA), were chosen based on the land use. Each test location’s 1 m2 impermeable area, which included the street, pavement, and gutter, was randomly swept to collect around 500 g of street dust [44,46]. A composite representative sample was created by thoroughly combining four sub-dust samples [47]. A total of 144 streetway dust samples were taken during the partial and complete lockdowns and after the lockdown from twelve different sites around the metropolitan area of Dhaka. Before sampling, tobacco buds, rocks, pieces of scrap plastic, and construction debris were gathered and taken out of the sample area. The samples were all thereafter stored in well-marked, tightly sealed plastic bags. The obtained materials were then divided into different particle sizes using a AS 200 digit vibrating sieve shaker (Retsch Haan, Germany). Finally, the samples were kept in Ziploc plastic bags until analysis (Figure 2).

2.3. Analysis of PAHs

Internal PAH standards were introduced to a flask following 50 mg of sieved street dust (<20 µm) to determine the amount of PAHs. The <20 µm size fraction was chosen for this investigation because it is readily absorbed by humans. The materials were then extracted using dichloromethane (DCM) three times, each time for ten minutes. After that, the extract solution was filtered to remove any remaining solids. The rotary evaporator (Buchi Rotavapor R100, Flawil, Switzerland) was used to evaporate the filtrate (at pressure of 600 torr). The remaining material was then dissolved in 30 mL of n-hexane and was dried in a rotary evaporator (at a pressure of 180 torr). A silica gel solid phase (Sep-Pak Silica plus long cartridge 690 mg sorbent per cartridge 55 × 105 mm particle size 50/pk (Waters, MA, USA)) was then used to remove the residue. The extract solution was mixed with n-nonane and evaporated until dry while being sprayed with N2. A gas chromatography–mass spectrometer (GC/MS, Model Agilent 5973N, Agilent Technologies, Inc., Santa Clara, CA, USA, 1999) that was used for PAH analysis was utilized to analyze the extract solution after it had been concentrated to 0.1 mL [48].
Using the GC–MS instrument, the PAH concentrations in the extract solution were measured. A 0.25 mm i.d. × 30 m and 0.25 µm film thickness InertCap 17 column was subjected to GC–MS investigations utilizing an HP6890 GC interfaced with an HP5973 MS detector. The column’s initial temperature was 50 °C, which was maintained for two minutes. The temperature subsequently rose to 185 °C at a rate of 15 °C min−1, then rose to 320 °C at a rate of 8 °C min−1, and remained at that state for 22 min. The chosen ion monitoring mode was used for MS detection. The sample volume was 1 mL, and the injections were splitless, as the carrier gas, which was high-purity helium, was used at a constant flow rate of 1.3 mL min−1. Based on the target ion peak retention periods (within 0.05 min of the calibration standard retention), the different PAHs were identified. The HP Chemstation software, which was installed in the GC–MS of the Agilent 5973N model, was used to control the data gathering and processing. Based on the retention period of the target ion peak (within 0.05 min of the calibration standard’s retention), each unique PAH was identified. Each sample was selected three times, and Microsoft Excel 2022 handled the statistical processing [49]. The analyzed PAHs were as follows: Acenaphthene (Acy), Anthracene (Ace), Benz[a]anthracene (BaA), Benzo[a]pyrene (BaP), Benzo[b]fluorathene (BbF), Benzo[ghi]perylene (BghiP), Benzo[k]- fluoranthene (BkF), Chrysene (Chy), Diben-z[a,h]anthracene (DB[ah]), Fluoranthene (Flu), Fluorene (FLN), Indeno [1,2,3-cd]pyrene (IndP), Naphthalene (NaP), Phenanthrene (Phe), and Pyrene (Pyr).

Quality Assurance/Quality Control

A batch experiment was used to analyze the field samples, one blank sample, and one duplicate sample. The blank samples had no traces of the target PAHs. Naphthalene-d8, acenaphthylene-d10, acenaphthene-d10, fluorene-d10, phenanthrene-d10, anthracene-d10, fluoranthene-d10, pyrene-d10, and benz[a][a][i]ne-d10 are among the 16 types of PAHs. Chrysene-d12, benzo[b], anthracene-d12, Benzo[k] fluoranthene-d12, Benzo[a] fluoranthene-d12, Dibenz [a,h]pyrene-d12, Indeno [1,2,3-cd], anthracene-d14, Benzo[g,h,i] Pyrene-D12, and perylene-d12 standards (CIL, inc., Japan) were added to all of the samples in order to track the effectiveness of the procedure and the impacts of the matrix. The PAH variations in duplication were lower than 15%. The mean recoveries ranged from 53.7% to 119.13%, and the method detection limit was compared to the signal-to-noise ratio at a ratio of 3:1.

2.4. Carcinogenic Risk Assessment

To evaluate the carcinogenic risk presented by the PAHs in the street dust, the toxic equivalent factor (TEF) method was used [50]. BaP was utilized for the TEF technique as a reference component for the other chemicals in the combination due to its very powerful carcinogenic activity. The BaP-equivalent concentration (BaPeq, ng g−1), which may be determined using the formula below, is equivalent to the PAH burden.
B a P e q = i = 1 n C i   × T E F i
where n is the number of PAHs found. The ith PAH’s concentration and TEF value, are Ci and TEFi, respectively, and are shown in Table 1. The following equations [51,52] were used to compute the incremental lifetime cancer risks (ILCRs) for children and adults based on three exposure routes (i.e., ingestion, inhalation, and skin contact) to determine the exposure to PAHs from the road dust:
I L C R i n g e s t i o n = B a P e q × I R i n g × B W 70   3 × E F × E D B W × A T × 10 9 × C S F i n g
I L C R d e r m a l = B a P e q × B W 70   3 × S A × A F × A B S × E F × E D B W × A T × 10 9 × C S F d e r m a l
I L C R i n h a l a t i o n = B a P e q × I R i n h × B W 70   3 × E F × E D B W × A T × P E F × 10 3 × C S F i n h
The variables are described in Table 2.

2.5. Statistical Analysis

Multivariate statistics were utilized, including Pearson correlation analysis (CA), principle component analysis (PCA), hierarchical cluster analysis (HCA), and Ward’s cluster approaches [54], in order to elucidate the likely sources of PAHs in the street dust during partial and complete lockdowns and after lockdown. A two-factor analysis of variance (ANOVA) without replication was used to determine the significance of the differences in PAH concentrations between the land use category and period. All statistical computations were performed using IBM SPSS Version 23.

3. Results and Discussion

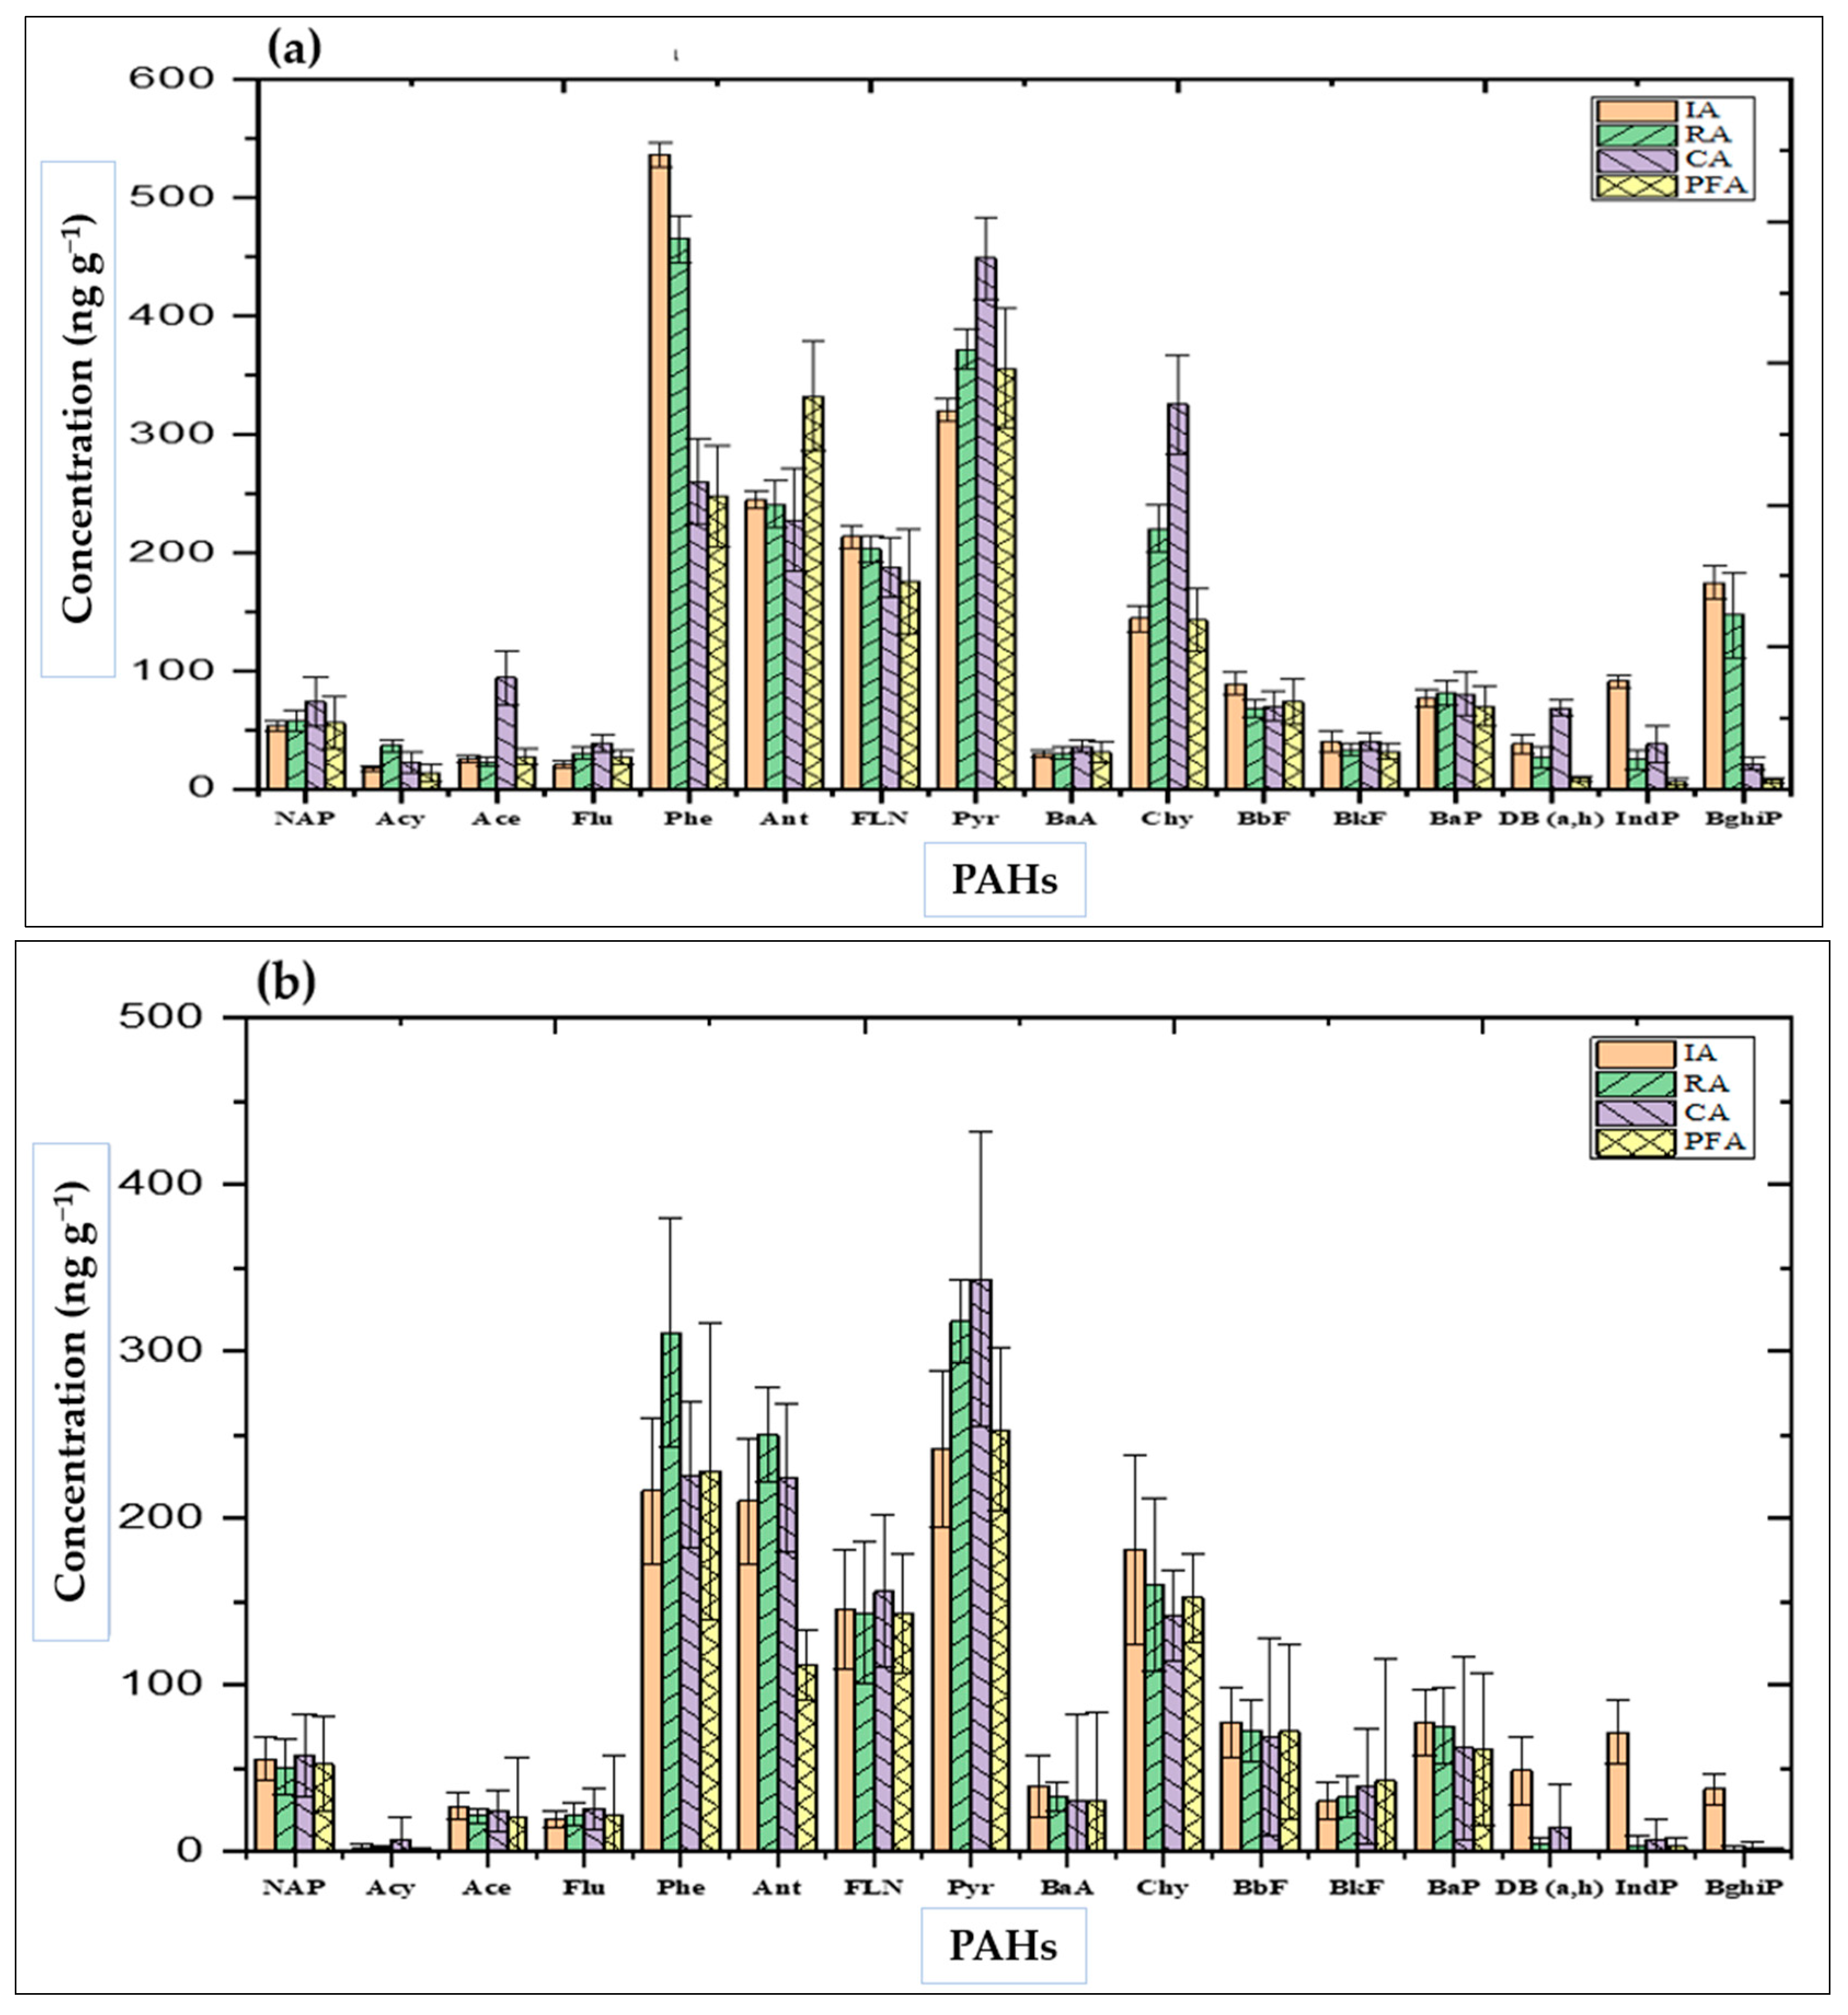
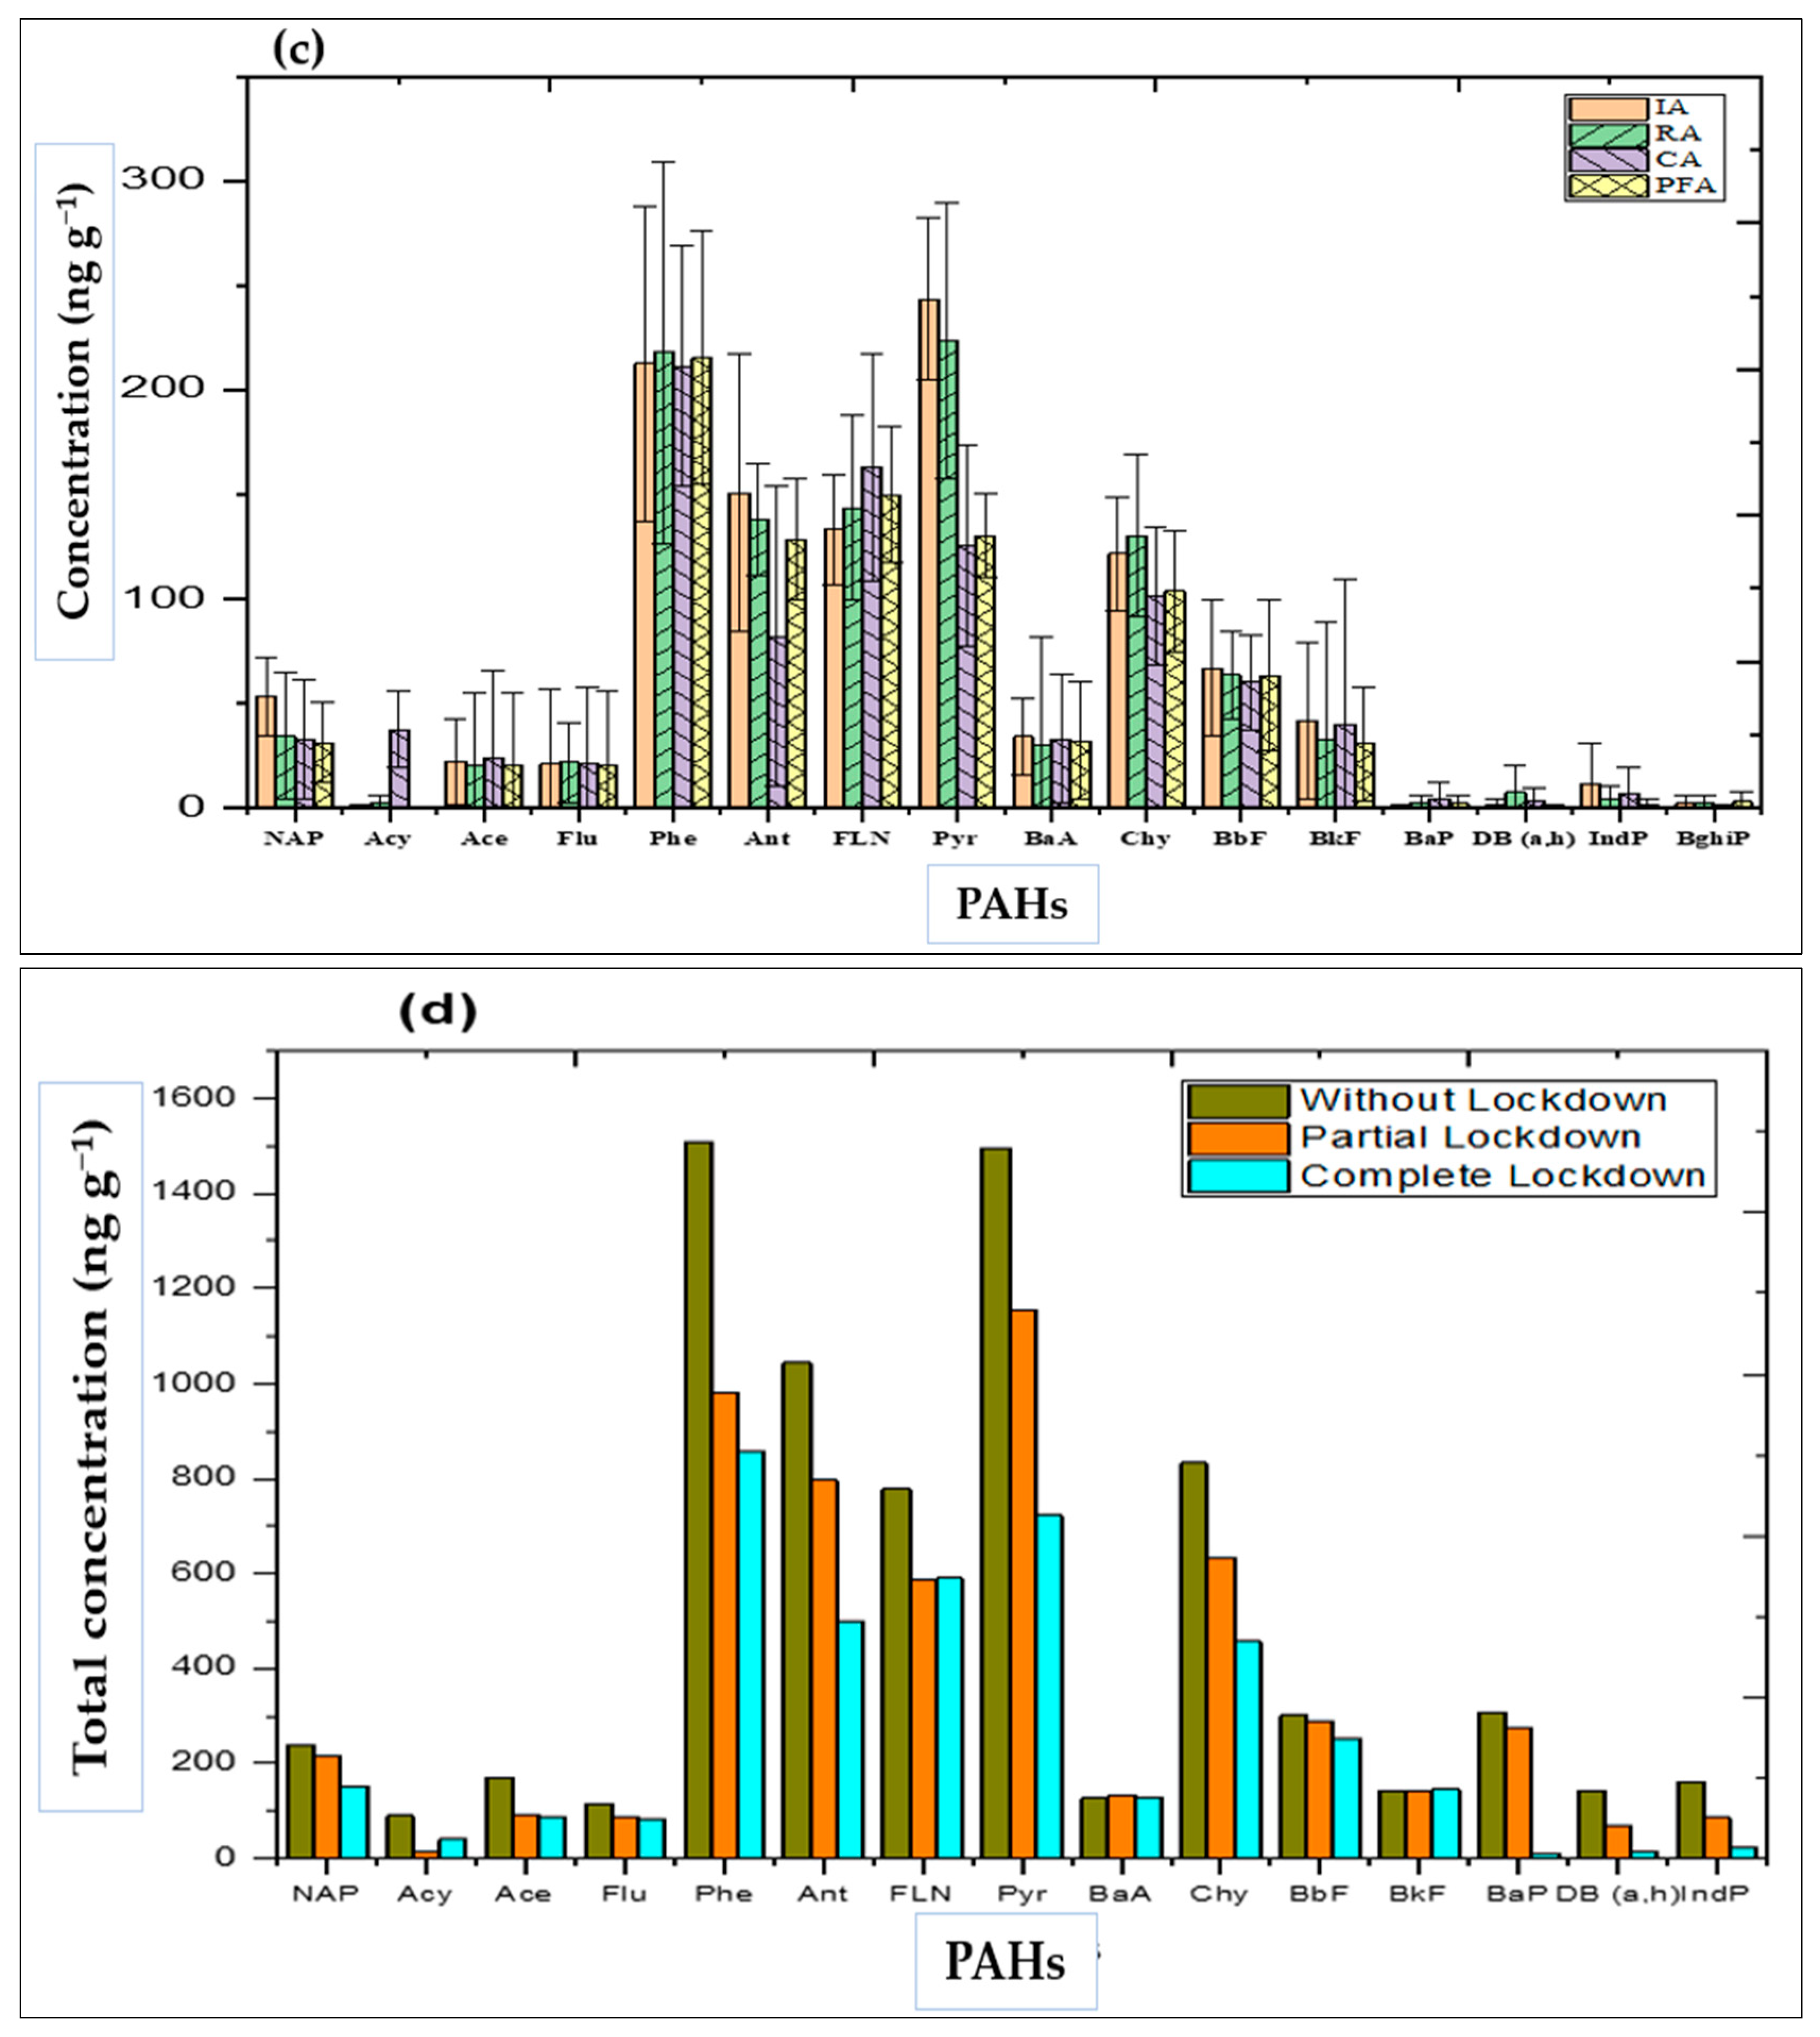
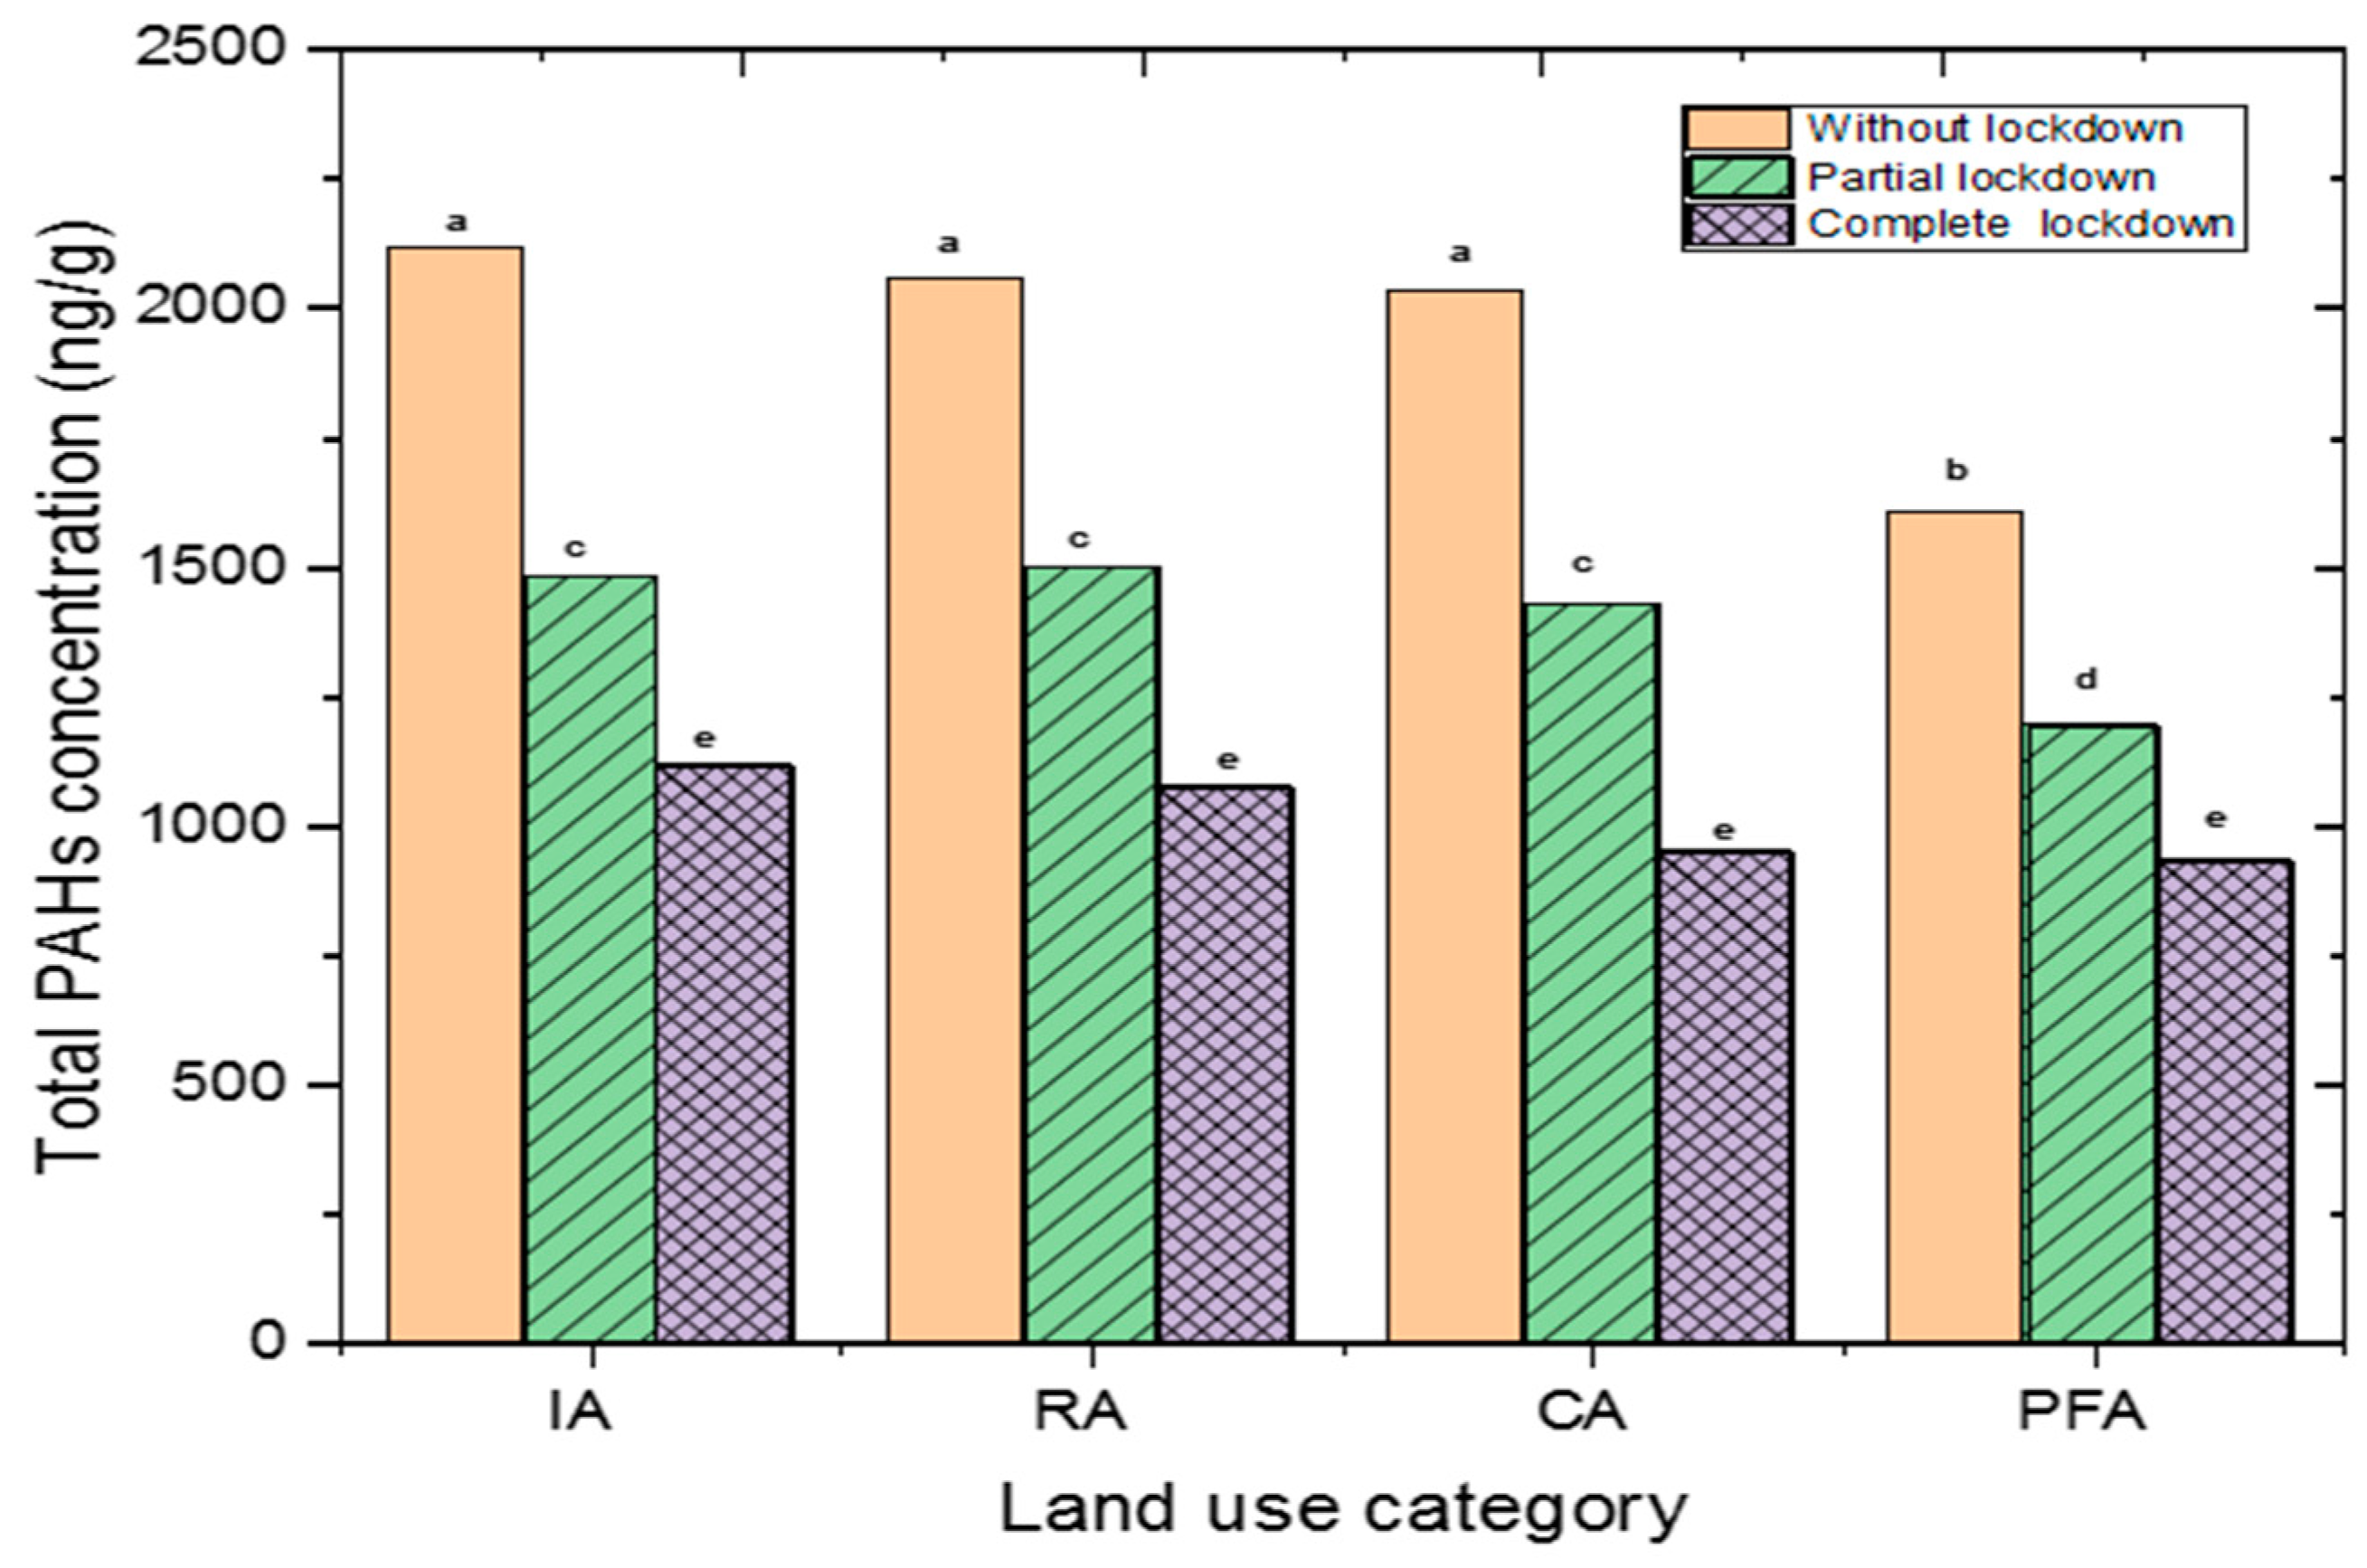
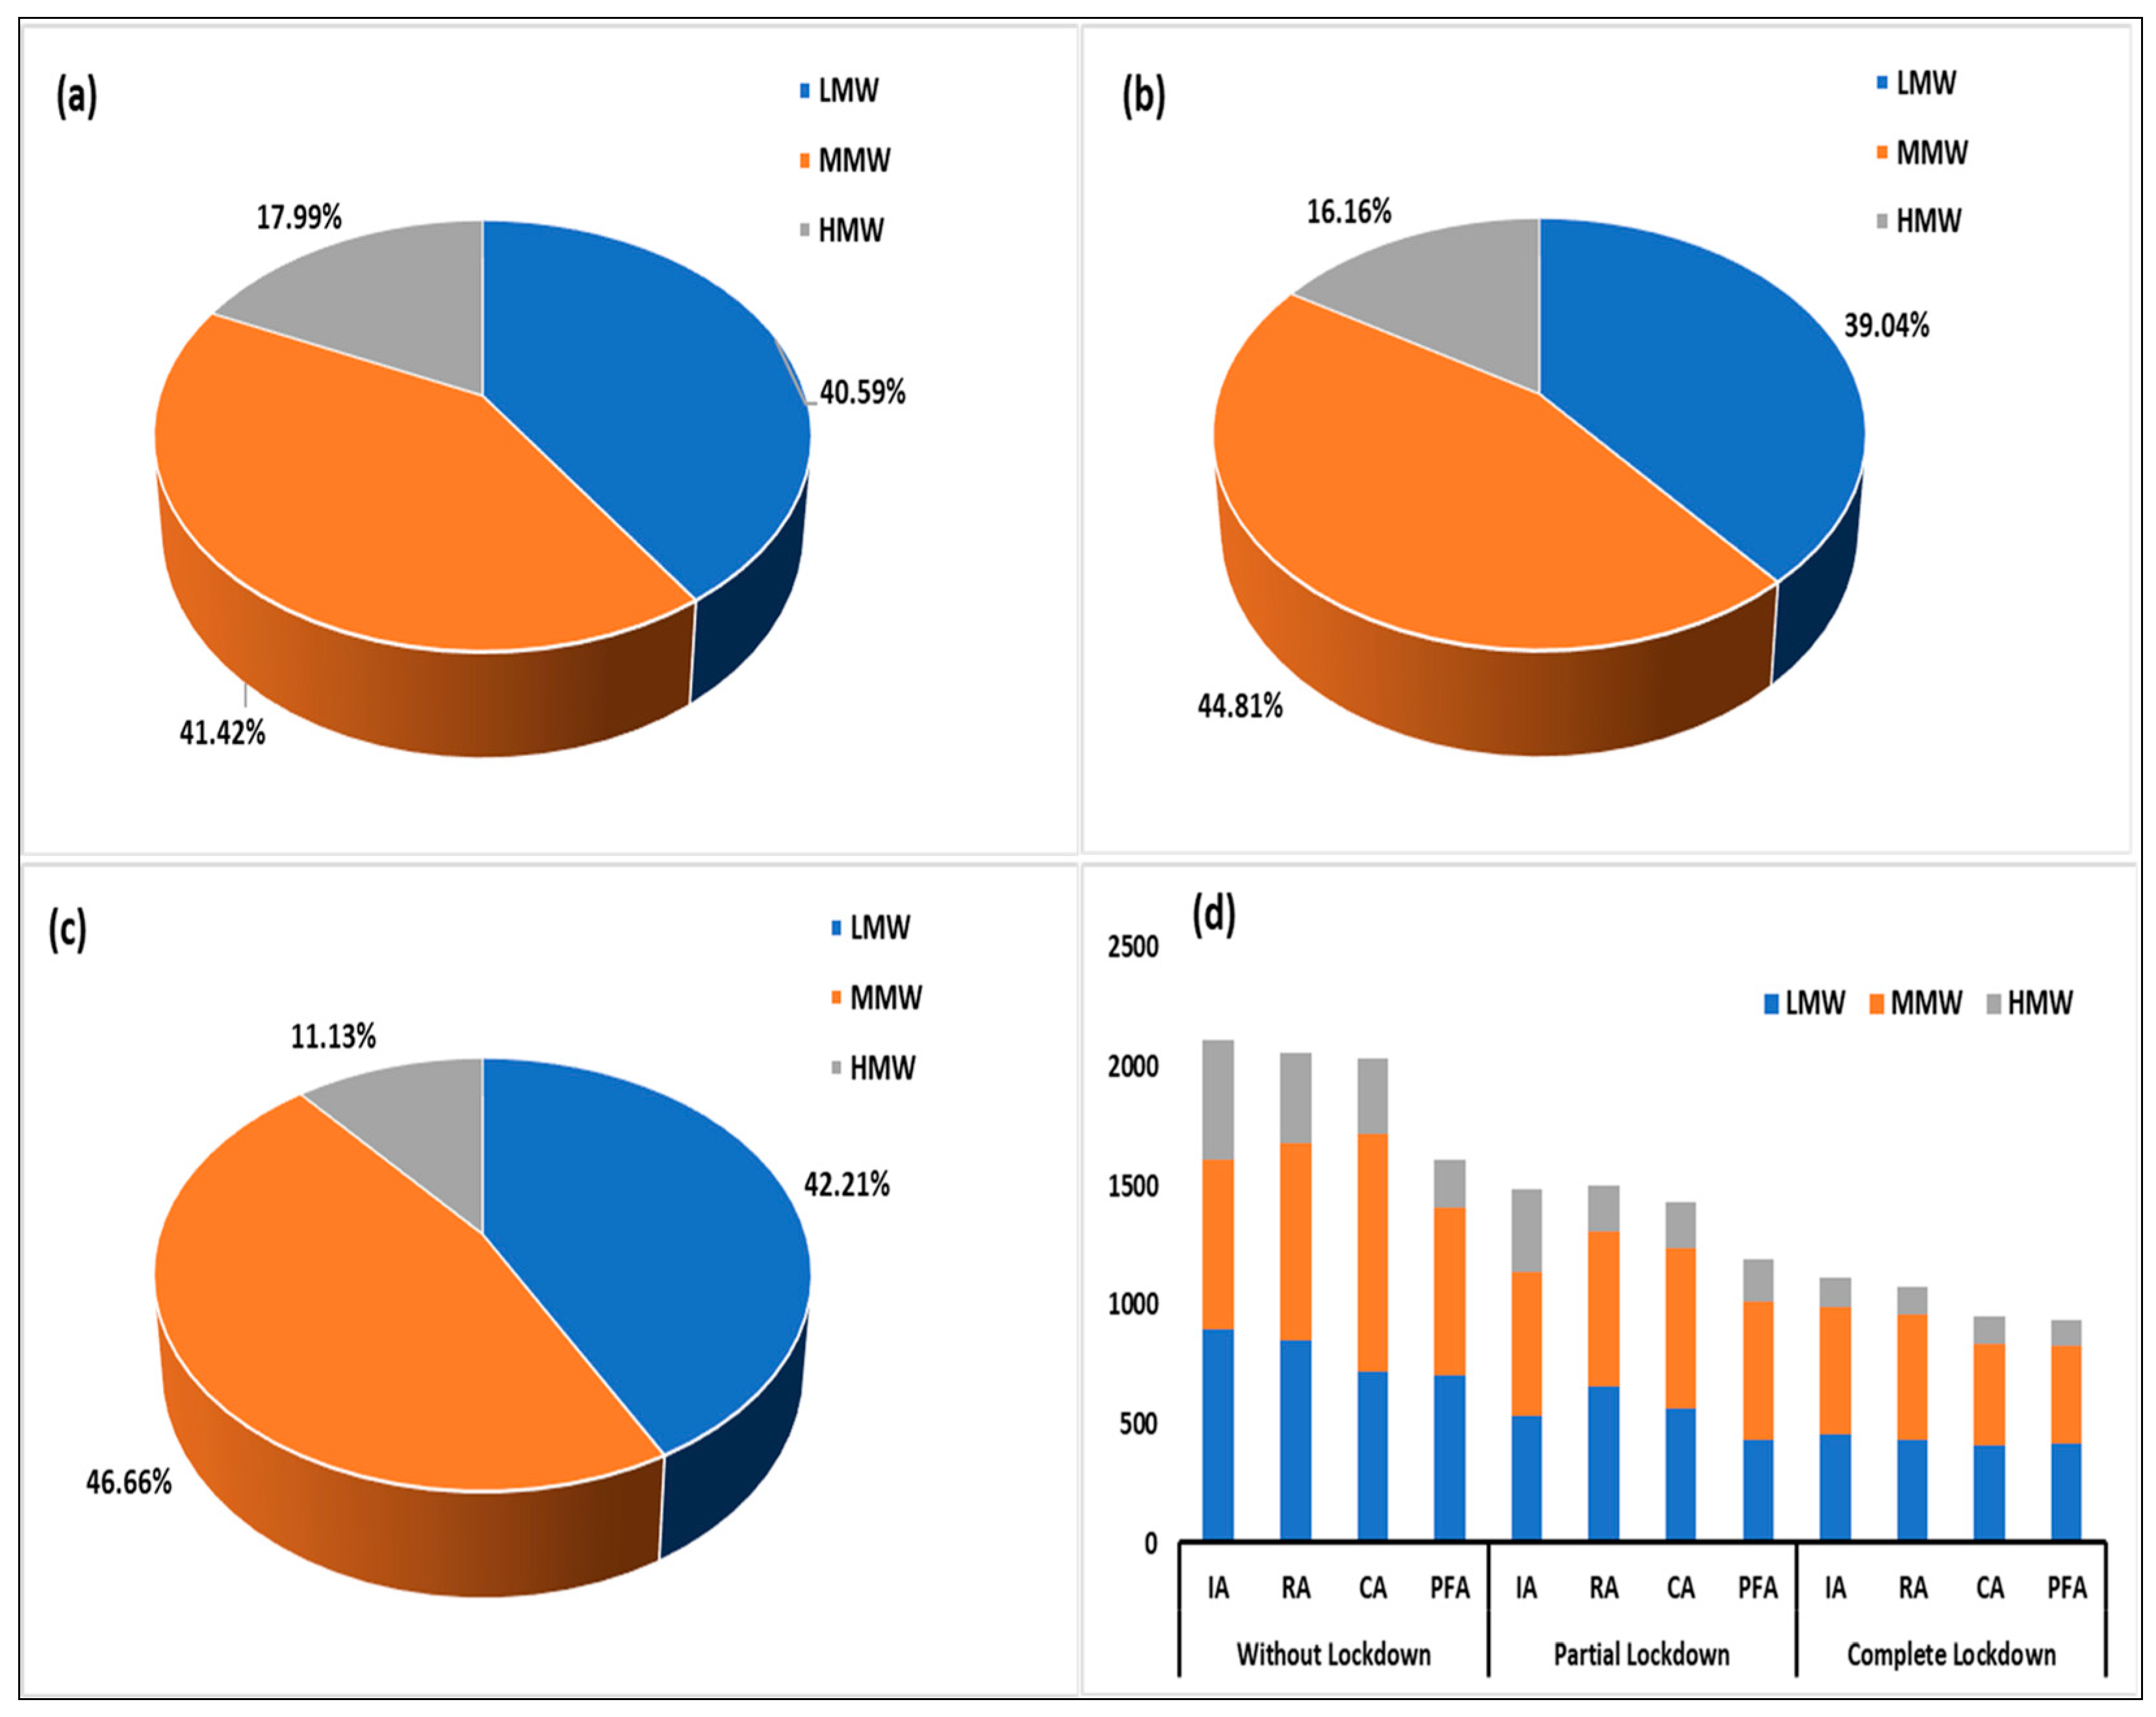
3.1. PAH Concentrations

The concentrations of the individual PAHs in the street dust samples are presented in Figure 3. Without lockdown, among the 16 PAHs, the maximum concentration (536 ng g−1) was recorded from Phenanthrene (Phe) in the industrial area, whereas the minimum concentration (6 ng g−1) was recorded from Indeno [1,2,3-cd] pyrene (IndP) in the public facilities area (Figure 3a). However, due to the partial and complete lockdowns, the concentration of the PAHs decreased in most of the land use categories. During the partial lockdown, the highest concentration (343 ng g−1) was found from Pyrene (Pyr) in the commercial area, whereas the lowest concentration (0 ng g−1) was found from Dibenz[a,h]anthracene [DB (a,h)] in the public facilities area (Figure 3b). During the complete lockdown, the maximum concentration (243 ng g−1) was recorded from Pyrene (Pyr) in the industrial area, and the minimum concentration (0 ng g−1) was recorded from Acenaphthylene (Acy) in the public facilities area (Figure 3c). The distribution of the individual PAHs from the different lockdown conditions generally showed a trend of without lockdown (WL) > partial lockdown (PL) > complete lockdown (CL), except for Acy concentration, which followed without lockdown > complete lockdown > partial lockdown (Figure 3d). Two-factor ANOVA showed that there was a significant difference in the individual PAHs (p = 2.89 × 10⁻⁷) and between the lockdown conditions (p = 0.01). The results indicated that the lockdown situation impacted the distribution of PAHs in Dhaka city. In addition, higher concentrations for WL and PL are attributed to a lower restriction of vehicle usage and anthropogenic activities compared to the complete lockdown [44]. It has been demonstrated in previous studies that anthropogenic activities influence the distribution of PAHs in street dusts [52,55].
The total concentrations of the 16 PAHs in the street dust samples are shown in Figure 4. The maximum (2114 ng g−1) concentration of ∑16 PAHs was found in the industrial area without lockdown and the minimum (932 ng g−1) concentration was found in the public facilities area during the complete lockdown. These values were compared with other studies that were conducted elsewhere, which showed lower concentrations. In Beijing, Northern China, and Asansol India, concentration ranges of 36–7231 ng g−1 and 1708–9688 ng g−1 were reported for the 16 PAHs, respectively, by Zhai et al., 2017 and Gope et al., 2018 [56,57]. In addition, higher concentrations were reported in Bushehr and Mashhad, Iran, ranging from 73 to 8986 ng g−1 [58,59]. In Xi’an, Northwest China, Ulsan, Korea, and Newcastle upon Tyne, England, higher concentration ranges of 7259–18,475 ng g−1, 19,690–154,640 ng g−1, and 500–95,000 ng g−1, respectively, were reported by B. K. Lee and Dong, 2010; Lorenzi et al., 2011; C. Wei et al., 2015 [60,61,62]. Meanwhile, due to the partial lockdown, a maximum of 30% of the ∑16 PAH concentration decreased from the situation without lockdown in the industrial area. The highest result of 53% of the ∑16 PAH concentration decreased from the situation without lockdown to the complete lockdown in the commercial area. This may be due to the restriction of anthropogenic activities [44]. The distribution of total PAH showed significant differences during the different lockdown scenarios (p < 0.05). However, across the land use categories, the effect of the lockdown situation was not significantly different (p > 0.05), except at PFA (Figure 4).
The recorded PAHs could be categorized into three classes according to their molecular weights and their distributions, as presented in Figure 5. At all of the lockdown conditions, the medium molecular weight (MMW) PAHs were the most averagely distributed, followed by those of low molecular weight (LMW). The LMW PAHs include Nap, Ace, Acy, Phe, Flu, and Ant with 2- and 3-ring PAHs; the MMW PAHs include FLN, Pyr, Chy, and BaA with 4-ring PAHs; and the high molecular weight (HMW) PAHs include BbF, BkF, BaP, IndP, DB (a,h), and BghiP with 5- and 6-ring PAHs. The LMW PAHs are typically thought to have developed through low temperature processes (such as burning biomass), whereas the HMW PAHs are released during substantial megathermal reactions, such as burning fuel, which react to produce stable PAHs during pyrosynthesis. As shown in Figure 5d, in almost all of the land use categories without lockdown and during the partial and complete lockdowns, the MMW PAHs comprise the maximum total PAH concentration.

3.2. Source Appraisal

The results for CA, PCA, and HCA in source appraisal are presented and discussed in this section.

3.2.1. Correlation Analysis

The similarity and interrelationship of the PAHs that were evaluated during the partial and complete lockdowns and without lockdown were measured using the Pearson’s correlation coefficient between the PAHs in the street dust, which was computed in the form of matrices. Table 3 displays the correlation matrix. A significant association between certain PAHs and dust during the partial and complete lockdowns and after the lockdown was observed. A positive correlation suggests comparable or frequent sources of these PAHs in the street dust, whereas a negative correlation suggests different or unusual sources [63]. After lockdown, the following PAHs showed strong correlations (r ≥ 0.7): Nap/Ace/Flu/Pyr/BaA/Chy/DB (a,h); Acy/BaP; Ace/Flu/Pyr/BaA/Chy/BkF/DB (a,h); Flu/Pyr/BaA/Chy/DB (a,h); Phe/FLN/BbF/IndP/BghiP; FLN/BbF/BaP/IndP/BghiP; Pyr/BaA/Chy/DB (a,h); BaA/Chy/BkF/DB (a,h); Chy/BaP/DB (a,h); BbF/IndP/BghiP; BkF/DB (a,h); BaP/DB (a,h); and Indp/BghiP. During the partial and complete lockdowns, there were some changes in the matrix, such as with BkF/DB (a,h), which did not show a significant correlation. However, some PAHs still showed strong correlations, notably Flu/Acy; FLN/Nap/Acy/Flu; Pyr/Flu; Chy/BaA; BbF/Chy; BaP/BaA/Chy; DB (a,h)/ Ace; IndP/Ace/BaA/Chy/DB (a,h); and Bghip/Ace/BaA/Chy/BbF/BaP/DB (a,h)/IndP during the partial lockdown, and Ace/Acy; FLN/Acy; Chy/Pyr; BbF/Nap/Ant; BaP/Acy/FLN; DB (a,h)/Flu; IndP/Nap/BkF; and BghiP/Ant during the complete lockdown. The sources of these group of PAHs are attributed to combustion [64]. In order to properly identify the sources, the PCA and HCA were conducted.

3.2.2. Principal Component Analysis (PCA)

The origins of PAH contamination in the dust were identified using PCA. Using varimax rotation and Kaiser normalization, PCA was performed on the PAH data by maximizing the sum of the variances of the component coefficients. This method uses eigenvalues that are bigger than one to split down the variables into their component pieces. The PCA for the different lockdown periods is presented in Figure 6. After the lockdown (Figure 6a), there were basically three component groups describing the source(s) of the different PAHs. One group was composed of Chy, Ace, Nap, BaA, Pyr, and Flu, with their source attributed to petrogenic and pyrolytic sources; the second group includes BaP, BkF, and Acy, with their source attributed to combustion sources [55]; and the third group includes FLN, IndP, Phe, BghiP, and BbF, with their source attributed to biomass burning and vehicular emission. However, other PAHs, such as DB (a,h) and Ant, did not show strong correlations with any of the aforementioned groups, suggesting that their presence could be from multiple anthropogenic sources. During the partial lockdown (Figure 6b), Ace, DB (a,h), IndP, Nap, BaA, BaP, Chy, and BbF were in a single component that was attributed to combustion and petroleum sources, while other PAHs showed variable sources. During the complete lockdown (Figure 6c), BkF/BaA/IndP, FLN/BaP, and Flu/DB (a,h)/Phe showed grouping with three different sources, which was followed by the situation without lockdown. The other PAHs shared different sources.

3.2.3. Hierarchical Cluster Analysis (HCA)

The HCA was used to determine the similarities and differences between the source of PAHs in the street dust after the lockdown and during the partial and complete lockdowns. The HCA was based on square Euclidian distance between observations while the cluster method was Ward. The research findings are presented as dendrograms, as shown in Figure 5. A dendrogram is a branch diagram that resembles a tree and shows how closely two parameters are related (Verla et al. 2020). The HCA differentiated the analyzed PAHs into three major clusters after the lockdown (Figure 6d). Within this cluster, there were PAHs that showed sources that were very similar, based on the distance between them. However, Nap, Ace, BaA, Flu, Pyr, Chy, BghiP, FLN, and Phe were in a cluster; BkF, DB (a,h), Acy, BaP, BbF, and IndP were in another cluster; while Ant was alone in another cluster. During the partial lockdown (Figure 6e), three major clusters were also obtained. The first cluster contained Nap, Acy, FLN, Flu, Pyr, and BkF. The second cluster contained Ace, DB (a,h), IndP, BghiP, BaA, Chy, BbF, and BaP, while Phe and Ant were in the third cluster. In the complete lockdown (Figure 6f), the number of clusters reduced to two, indicating reduced source(s) of the PAHs. Nap, BkF, IndP, BaA, Acy, Ace, FLN, and BaP were in one cluster, while Flu, DB (a,h), Phe, Ant, BbF, BghiP, Pyr, and Chy were in another cluster. The sources of the first cluster could be attributed to biomass and combustion sources [64], while the second cluster may be from petroleum combustion sources [24,55].

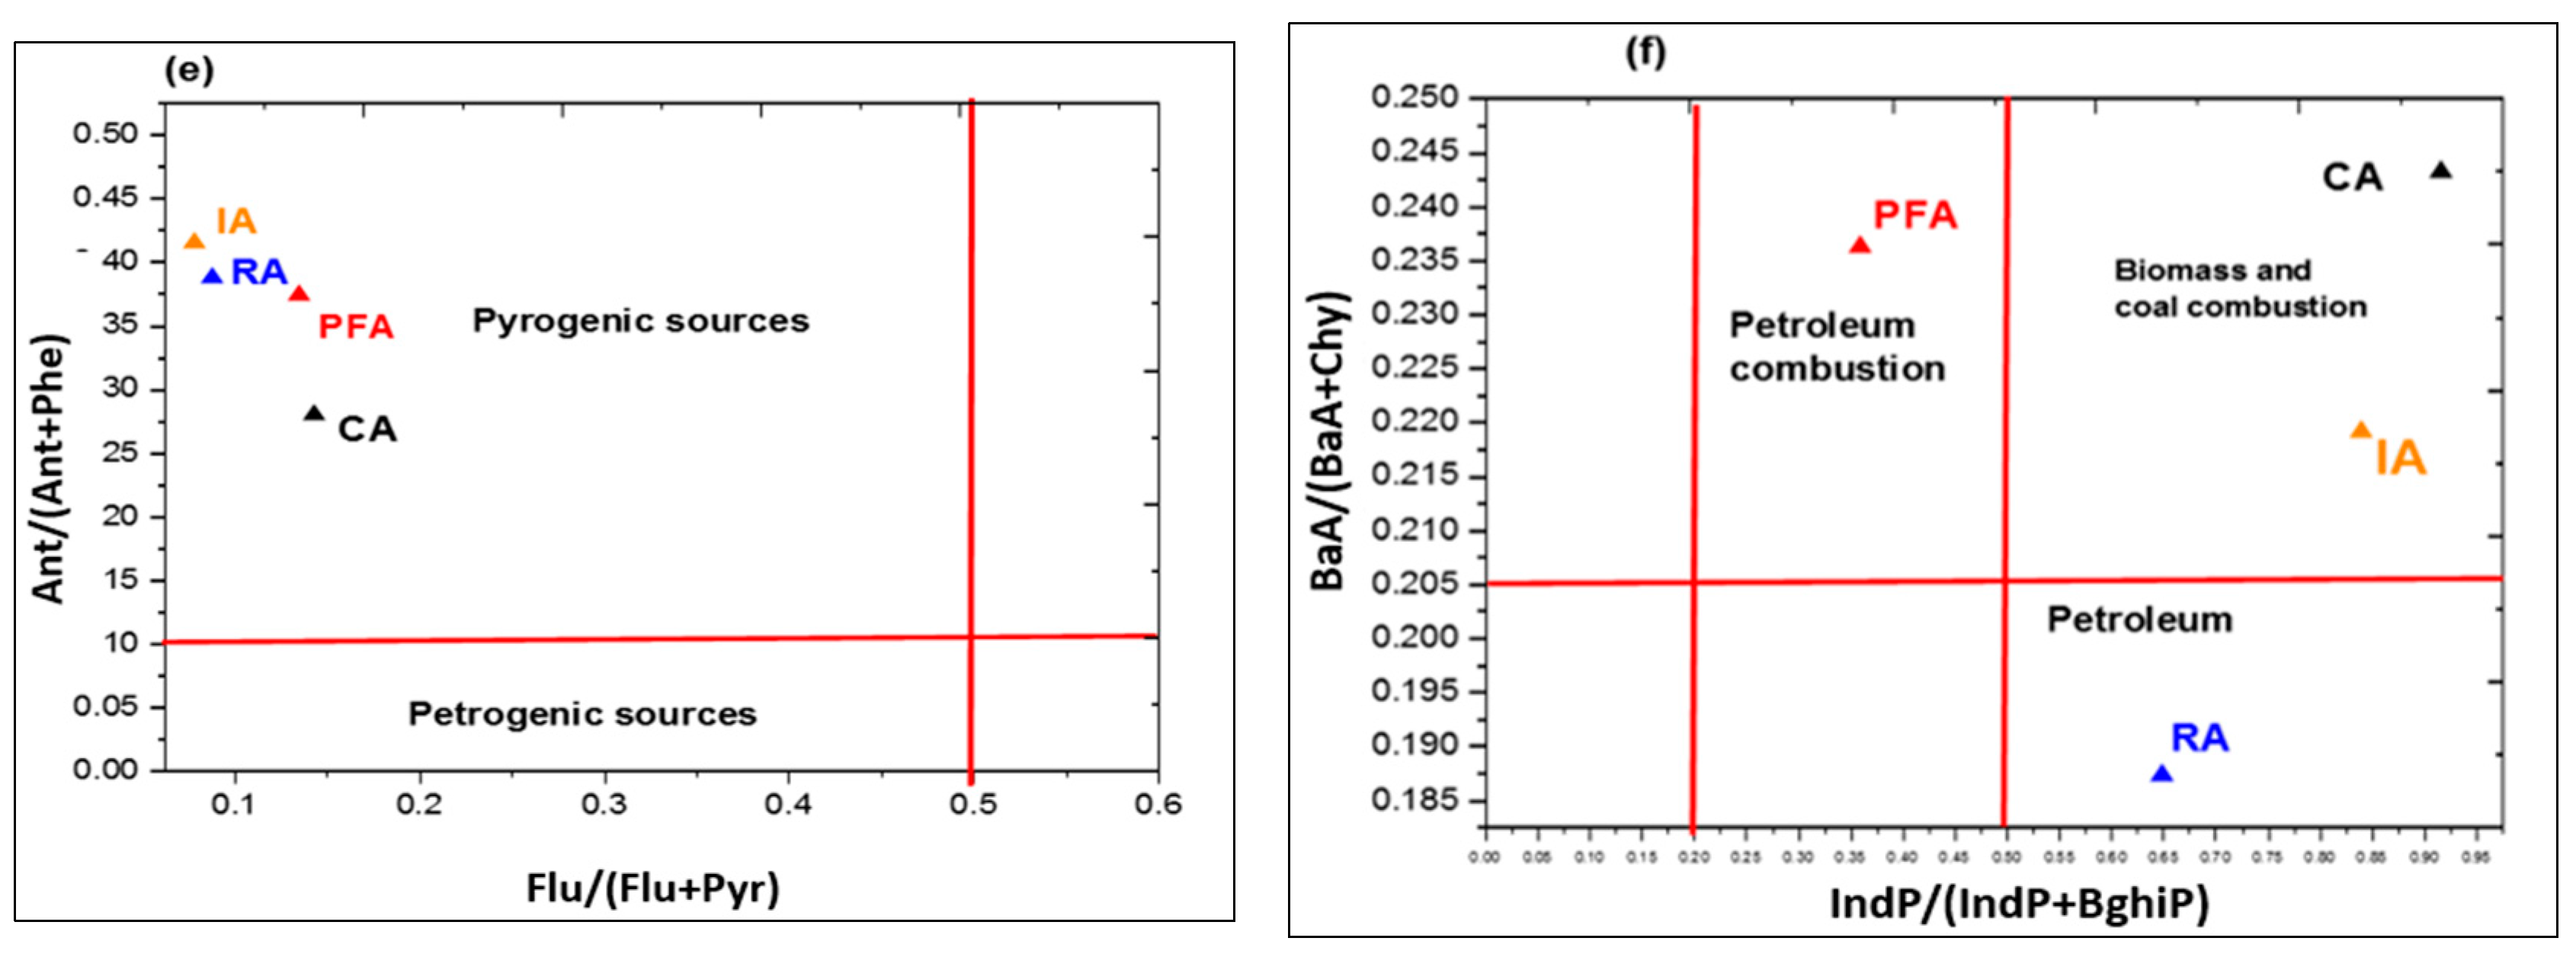
3.3. Isomeric Ratios

Understanding the fate and the transit of PAHs in the environment depends on locating the potential sources of these chemicals. The different sources that contribute PAHs to ambient samples have been identified using various PAH isomeric ratios [27]. Some examples of isomeric ratios that have been used to discriminate between petrogenic and pyrogenic sources are Ant/(Ant + Phe), BaA/(BaA + Chy), Flu/(Flu + Pyr), and IndP/(IndP + BghiP) [55]. The classification for these ratios has been described in a prior study [55]. Succinctly, based on the ratio, sources are categorized as combustion, including biomass and coal, as well as petroleum, including liquid fossil fuel, vehicles, and crude oil. For example, PAHs are mostly produced by the burning of petroleum when BaA/(BaA + Chy) increases between 0.2 and 0.35 and IndP/(IndP + BghiP) increases between 0.2 and 0.5 (e.g., liquid fossil fuel, vehicles, and crude oil). Furthermore, the presence of coal and biomass is strongly suggested by ratios of BaA/(BaA + Chy) and IndP/(IndP + BghiP) that are greater than 0.35 and 0.5, respectively [55].
After the lockdown (Figure 7a), based on the Ant/(Ant + Phe) and Flu/(Flu + Pyr) ratio, the PAHs in the dusts from the different land use categories were from pyrogenic sources. Burning fossil fuels, such as coal, oil, and wood, as well as biomass, releases the majority of the pyrogenic PAHs, which are the byproducts of combustion, into the atmosphere (forest, grassland, or agricultural) [65]. However, based on the IndP/(IndP + BghiP) and BaA/(BaA + Chy) ratio (Figure 7b), the source of PAHs in the dusts from RA was petroleum and petrogenic; IA and PFA was petroleum combustion; while CA was biomass and coal combustion. Similarly, in all of the land use categories during the partial and complete lockdowns, the PAH sources were pyrogenic, based on the Ant/(Ant + Phe) and Flu/(Flu + Pyr) ratio (Figure 7c,e). However, the based on the IndP/(IndP + BghiP) and BaA/(BaA + Chy) ratio (Figure 7d), their sources indicated biomass and coal combustion during the partial lockdown, while in the complete lockdown (Figure 7f) petroleum combustion was seen for PFA; CA and IA from biomass and coal combustion; and RA from petroleum sources. These results agreed with previous studies on PAH sources in Bangladesh [24].

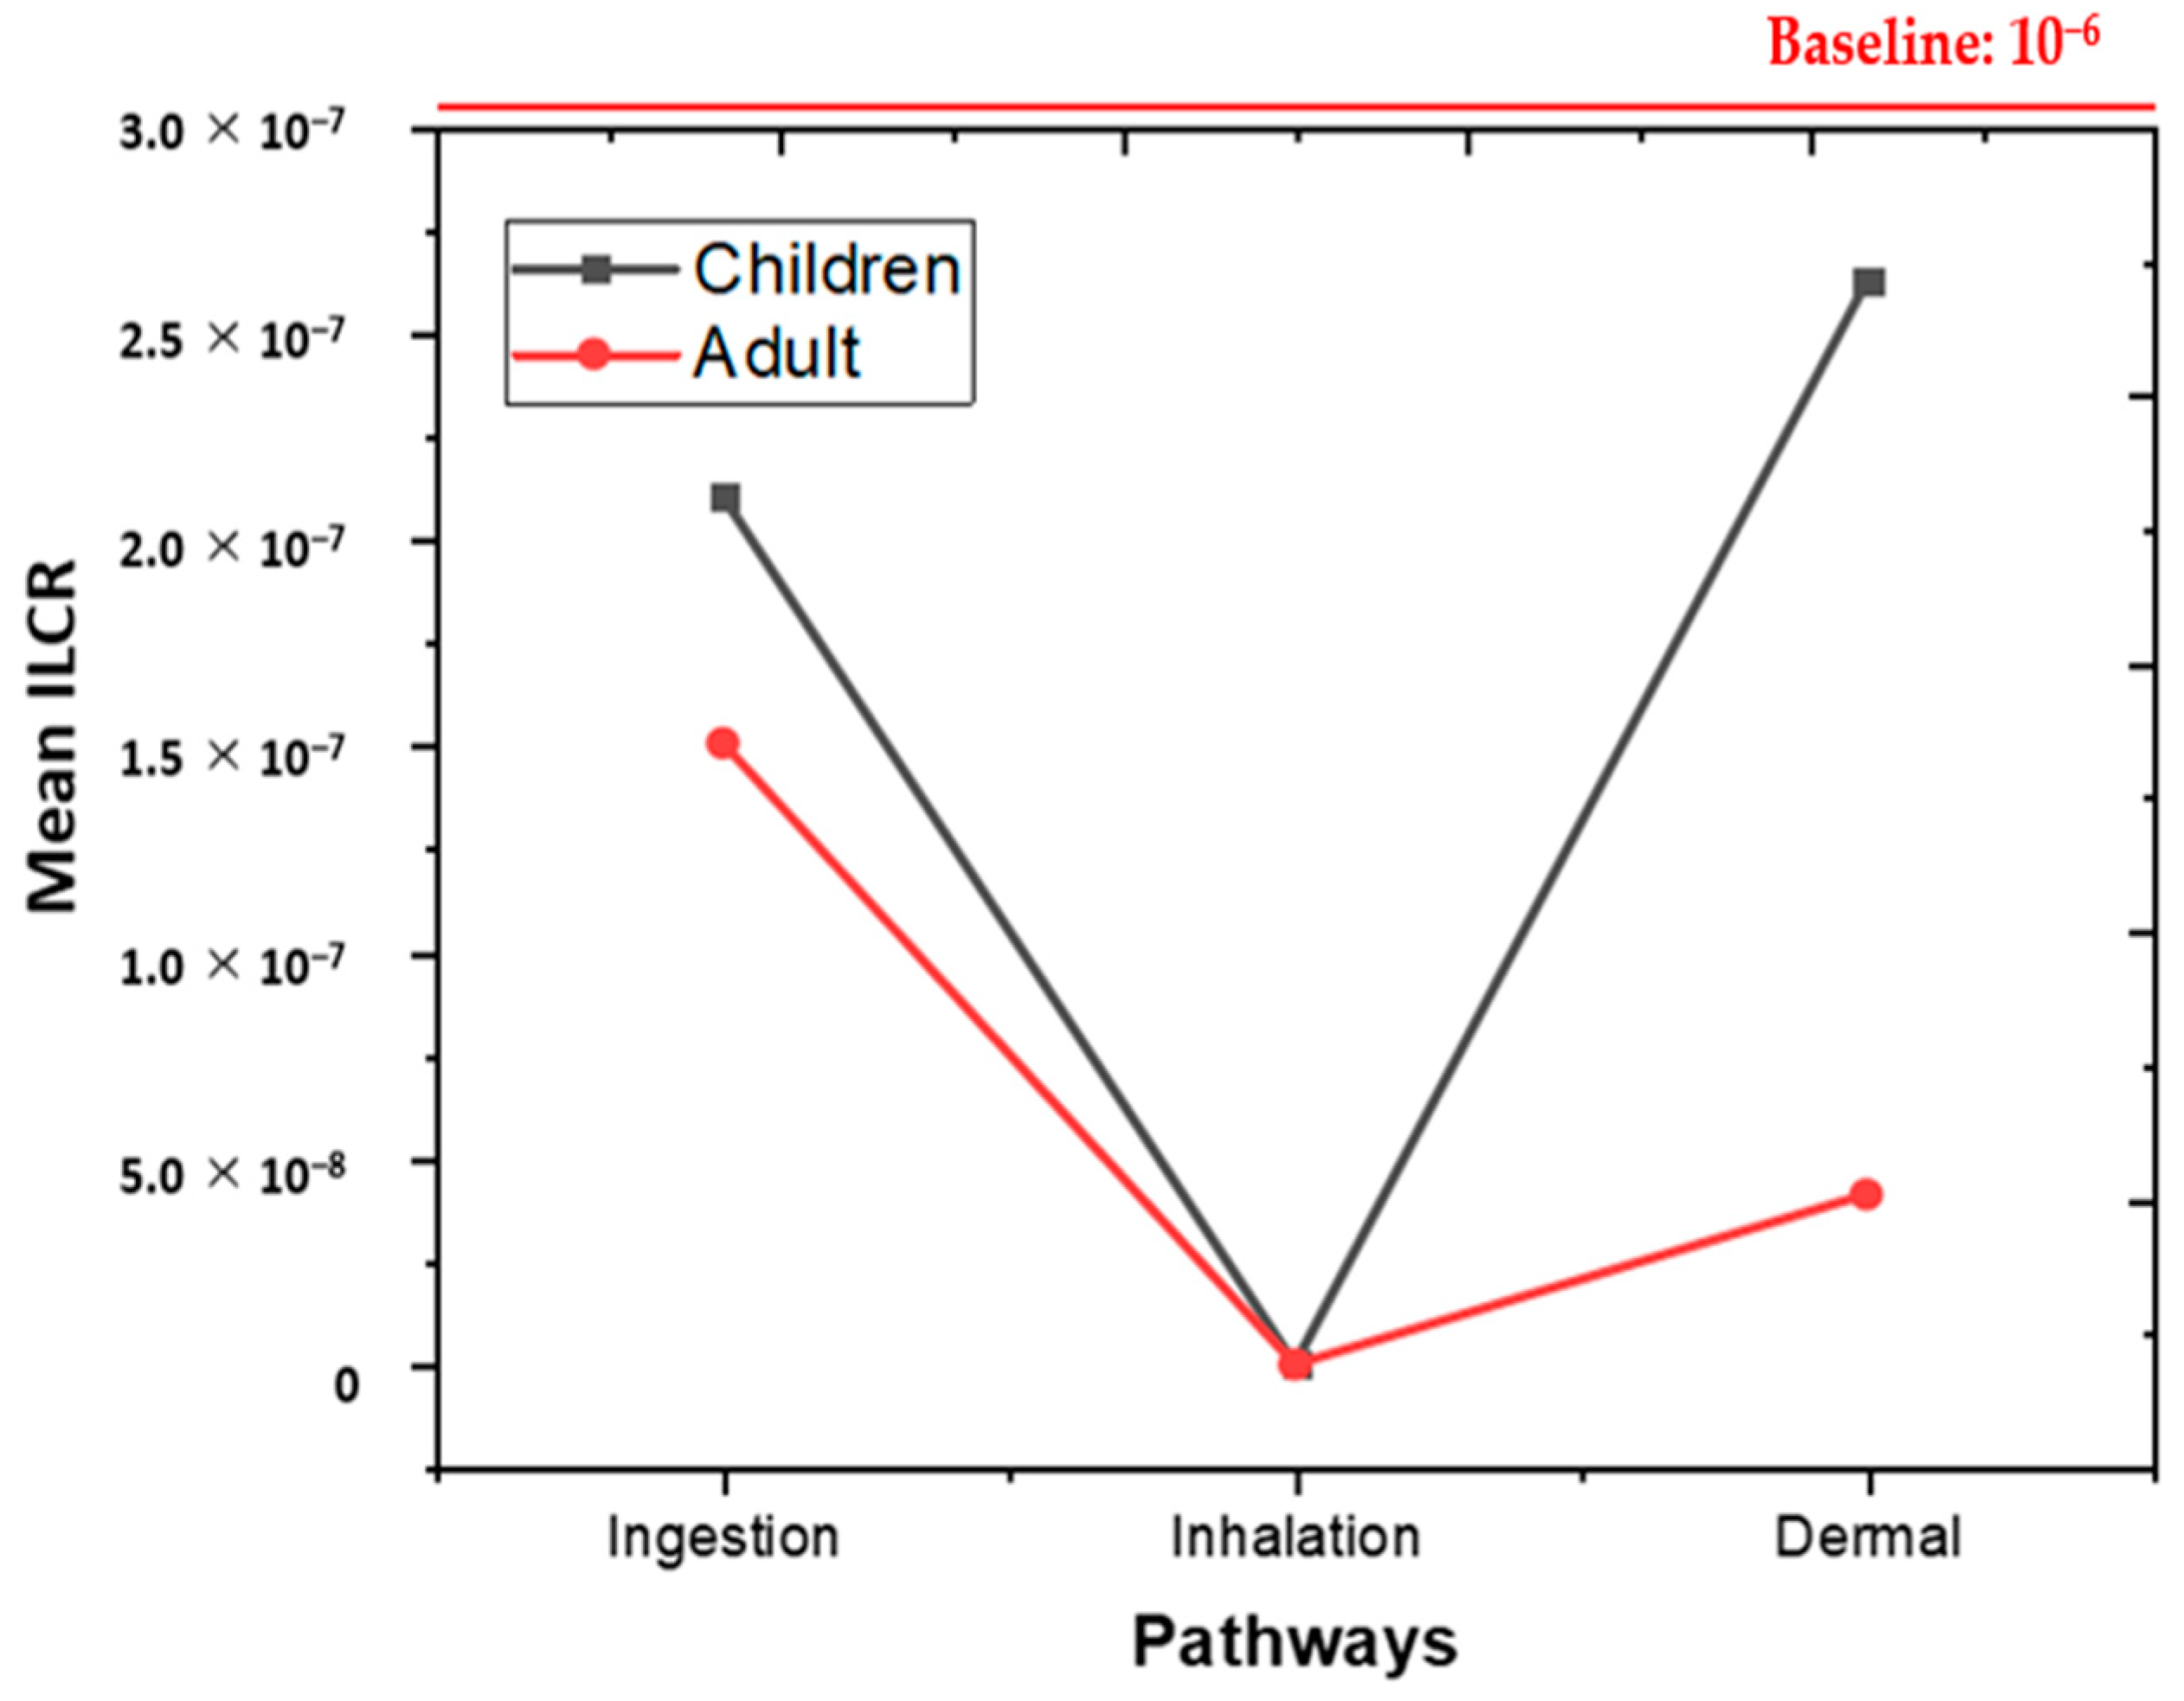
3.4. Carcinogenic Risk Assessment for Human Health

The outer body is used as an external barrier to regulate the process by which substances enter the human body. The skin, the openings into the body, such as the mouth and nose, punctures, and skin sores, are the main points of entry. The ILCR model is frequently used to estimate the population’s long-term carcinogenic risk. It is based on the following five variables: (1) the exposure pathways; (2) the environmental media; (3) the contaminant concentration; (4) the exposure time, frequency, and duration; and (5) the population exposed to the different chemicals for absorption via body barriers [66]. The three primary exposure routes—oral, respiratory, and dermal—are really divided into the following three categories: ingestion, inhalation, and skin contact. Additionally, the (four) assessment criteria include empirical estimates of values depending on the number of experiments (Table 2).
According to human exposure through all modes of exposure (i.e., ingestion, inhalation, and dermal exposure), the human carcinogenic hazards of PAHs were calculated and presented in this work (Table 4). Children were more at risk of developing cancer from the PAHs in roadway dust than adults. The USEPA standard states that ILCR readings between 10 × 10−6 and 10 × 10−4 and 10 × 10−6 indicate a high, possible, and minimal danger, respectively [51]. No carcinogenic risk for both adults and children surpassing the threshold value (10 × 10−6) was observed when all of the sample locations were taken into account. The values of ILCRtotal for adults and children ranged from 8.38 × 10 × 10−8 to 1.16 × 10 × 10−7 and from 5.11 × 10 × 10−8 to 1.70 × 10 × 10−7, respectively. Children were more at risk of developing cancer from the PAHs in roadway dust than adults were (Table 4). The highest carcinogenic risk for children and adults was recorded in the commercial area, but this risk was reduced by different lockdown conditions. In X. Wei et al., (2021b), higher risks were recorded for adults through ingestion and inhalation, while only the dermal pathway showed higher risks for children. The ingestion and dermal pathways for both children and adults have greater ILCRs than the inhalation of the PAHs in street dust (Figure 8). Previous studies also estimated that dermal contact and ingestion were the main pathways for PAHs in street dust exposure to humans [8,22,52,55].

4. Conclusions

In order to determine the source and the probable health risk of pollution in these locations, the current study evaluated the concentration of PAHs in street dust samples that were taken from four distinct sites in the metropolitan area of Dhaka city in Bangladesh. This study found that the concentration of PAHs in the street dust samples from all of the sites showed higher concentrations after the lockdown compared with the partial and complete lockdowns. The complete lockdown reduced the distribution of PAHs in the area by as much as 53%, showing that the COVID-19 lockdown in Dhaka reduced the distribution of PAHs and helped the environment to undergo self-cleaning. However, during the lockdown periods, the city was dominated by 4-ring middle molecular weight PAHs. Multivariate statistical approaches identified petrogenic and pyrogenic sources for the PAHs in the dust samples. Fortunately, considering all of the sampling sites, no carcinogenic risk exceeding the threshold value (10−6) for either adults or children was recorded. This assessment of the PAHs in dusts from Dhaka city after the lockdown and during the partial lockdown and the complete lockdown periods clearly shows that the major factor of concern for each area is the rate of emissions from anthropogenic activities, which was reduced during the lockdown. Hence, it can be concluded that the COVID-19 lockdown did act completely as a ventilator for the revival of Dhaka dusts in terms of PAHs. Further study should consider evaluating the dusts of the areas considering seasonal variation and other areas of Bangladesh.

Author Contributions

Conceptualization: M.H.R.; methodology: Q.W. and W.W.; software, validation, data curation, and formal analysis: C.E.E., W.W. and M.H.R.; writing—original draft preparation: M.H.R.; writing—review and editing: Q.W., W.W. and C.E.E.; supervision: Q.W. and W.W.; project administration and funding acquisition: Q.W. All authors have read and agreed to the published version of the manuscript.

Funding

This study was partially supported by the Special Funds for Innovative Area Research (No. 20120015, FY 2008-FY2012) and Basic Research (B) (No. 24310005, FY2012-FY2014; No. 18H03384, FY2017 FY2020; No. 22H03747, FY2022-FY2024) of Grant-in-Aid for Scientific Research of Japanese Ministry of Education, Culture, Sports, Science and Technology (MEXT).

Data Availability Statement

All data generated or analyzed during this study are included in this published article.

Acknowledgments

Initial processing of street dust was conducted in the Department of Agricultural Chemistry of Sher-e-Bangla Agricultural University, Dhaka, Bangladesh.

Conflicts of Interest

The authors declare no competing interests.

References

  1. Lee, K.; Grennstone, M. Air Quality Life Index Annual Update; Energy Policy Institute at the University of Chicago: Chicago, IL, USA, 2021; pp. 1–15. [Google Scholar]
  2. Ali, M.; Devnath, B. Air Pollution in Bangladesh: Bangladesh Air World’s Worst in 2019. Available online: https://www.tbsnews.net/environment/bangladesh-air-worlds-worst-2019-47959 (accessed on 4 January 2022).
  3. Islam, M.S. Air Pollution in Dhaka City: A Burning Issue. J. Sci. Found. 2014, 12, 20–21. [Google Scholar] [CrossRef] [Green Version]
  4. Semerjian, L.; Okaiyeto, K.; Ojemaye, M.O.; Ekundayo, T.C.; Igwaran, A.; Okoh, A.I. Global Systematic Mapping of Road Dust Research from 1906 to 2020: Research Gaps and Future Direction. Sustainability 2021, 13, 11516. [Google Scholar] [CrossRef]
  5. Vlasov, D.; Ramírez, O.; Luhar, A. Road Dust in Urban and Industrial Environments: Sources, Pollutants, Impacts, and Management. Atmosphere 2022, 13, 607. [Google Scholar] [CrossRef]
  6. Cao, Z.; Zhao, L.; Kuang, J.; Chen, Q.; Zhu, G.; Zhang, K.; Wang, S.; Wu, P.; Zhang, X.; Wang, X.; et al. Vehicles as Outdoor BFR Sources: Evidence from an Investigation of BFR Occurrence in Road Dust. Chemosphere 2017, 179, 29–36. [Google Scholar] [CrossRef] [PubMed]
  7. Franco, C.F.J.; de Resende, M.F.; de Almeida Furtado, L.; Brasil, T.F.; Eberlin, M.N.; Netto, A.D.P. Polycyclic Aromatic Hydrocarbons (PAHs) in Street Dust of Rio de Janeiro and Niterói, Brazil: Particle Size Distribution, Sources and Cancer Risk Assessment. Sci. Total Environ. 2017, 599, 305–313. [Google Scholar] [CrossRef]
  8. Li, B.; Ma, L.-X.; Sun, S.-J.; Thapa, S.; Lu, L.; Wang, K.; Qi, H. Polycyclic Aromatic Hydrocarbons and Their Nitro-Derivatives in Urban Road Dust across China: Spatial Variation, Source Apportionment, and Health Risk. Sci. Total Environ. 2020, 747, 141194. [Google Scholar] [CrossRef] [PubMed]
  9. Li, Z.; Feng, X.; Li, G.; Bi, X.; Zhu, J.; Qin, H.; Dai, Z.; Liu, J.; Li, Q.; Sun, G. Distributions, Sources and Pollution Status of 17 Trace Metal/Metalloids in the Street Dust of a Heavily Industrialized City of Central China. Environ. Pollut. 2013, 182, 408–416. [Google Scholar] [CrossRef]
  10. Zhang, Y.; Cai, J.; Wang, S.; He, K.; Zheng, M. Review of Receptor-Based Source Apportionment Research of Fine Particulate Matter and Its Challenges in China. Sci. Total Environ. 2017, 586, 917–929. [Google Scholar] [CrossRef]
  11. Loganathan, P.; Vigneswaran, S.; Kandasamy, J. Road-Deposited Sediment Pollutants: A Critical Review of Their Characteristics, Source Apportionment, and Management. Crit. Rev. Environ. Sci. Technol. 2013, 43, 1315–1348. [Google Scholar] [CrossRef]
  12. Hwang, H.-M.; Fiala, M.J.; Park, D.; Wade, T.L. Review of Pollutants in Urban Road Dust and Stormwater Runoff: Part 1. Heavy Metals Released from Vehicles. Int. J. Urban Sci. 2016, 20, 334–360. [Google Scholar] [CrossRef]
  13. Hwang, H.M.; Fiala, M.J.; Wade, T.L.; Park, D. Review of Pollutants in Urban Road Dust: Part II. Organic Contaminants from Vehicles and Road Management. Int. J. Urban Sci. 2018, 23, 445–463. [Google Scholar] [CrossRef]
  14. Fattah, M.A.; Esraz-Ul-Zannat, M.; Morshed, S.R.; Roni, A.T. Modeling the Impact of Motorized Vehicles’ Activities on Emissions and Economic Losses in a Fast-Growing Developing City, Dhaka, Bangladesh. J. Transp. Health 2022, 25, 101377. [Google Scholar] [CrossRef]
  15. Harrison, R.M.; Jones, A.M.; Gietl, J.; Yin, J.; Green, D.C. Estimation of the Contributions of Brake Dust, Tire Wear, and Resuspension to Nonexhaust Traffic Particles Derived from Atmospheric Measurements. Environ. Sci. Technol. 2012, 46, 6523–6529. [Google Scholar] [CrossRef] [PubMed]
  16. Ravindra, K.; Sokhi, R.; van Grieken, R. Atmospheric Polycyclic Aromatic Hydrocarbons: Source Attribution, Emission Factors and Regulation. Atmos. Environ. 2008, 42, 2895–2921. [Google Scholar] [CrossRef] [Green Version]
  17. Lawal, A.T. Polycyclic Aromatic Hydrocarbons. A Review. Cogent Environ. Sci. 2017, 3, 1339841. [Google Scholar] [CrossRef]
  18. Kavouras, I.G.; Koutrakis, P.; Tsapakis, M.; Lagoudaki, E.; Stephanou, E.G.; von Baer, D.; Oyola, P. Source Apportionment of Urban Particulate Aliphatic and Polynuclear Aromatic Hydrocarbons (PAHs) Using Multivariate Methods. Environ. Sci. Technol. 2001, 35, 2288–2294. [Google Scholar] [CrossRef]
  19. Yan, J.; Wang, L.; Fu, P.P.; Yu, H. Photomutagenicity of 16 Polycyclic Aromatic Hydrocarbons from the US EPA Priority Pollutant List. Mutat. Res. Genet. Toxicol. Environ. Mutagen. 2004, 557, 99–108. [Google Scholar] [CrossRef] [Green Version]
  20. Hassanien, M.A.; Abdel-Latif, N.M. Polycyclic Aromatic Hydrocarbons in Road Dust over Greater Cairo, Egypt. J. Hazard. Mater. 2008, 151, 247–254. [Google Scholar] [CrossRef]
  21. Larsen, R.K.; Baker, J.E. Source Apportionment of Polycyclic Aromatic Hydrocarbons in the Urban Atmosphere: A Comparison of Three Methods. Environ. Sci. Technol. 2003, 37, 1873–1881. [Google Scholar] [CrossRef]
  22. Khpalwak, W.; Jadoon, W.A.; Abdel-dayem, S.M.; Sakugawa, H. Polycyclic Aromatic Hydrocarbons in Urban Road Dust, Afghanistan: Implications for Human Health. Chemosphere 2019, 218, 517–526. [Google Scholar] [CrossRef]
  23. Jolly, Y.; Tabassum, A.; Rahman, M.A.; Rahman, M.S.; Rana, S.; Akter, S.; Begum, B. Contamination Status of Polycyclic Aromatic Hydrocarbons (PAH s) In Atmospheric Particulate Matter PM 2.5 Samples of a Semi-Residential Area of Dhaka, Bangladesh. Glob. J. Nutr. Food Sci. 2020, 3, 1–10. [Google Scholar] [CrossRef]
  24. Hossain, H.; Hossain, Q. Polycyclic Aromatic Hydrocarbons (PAHs) in Fine Fractions of Barapukuria Coal in Bangladesh. Bangladesh J. Sci. Ind. Res. 2019, 54, 203–214. [Google Scholar] [CrossRef] [Green Version]
  25. Maertens, R.M.; Bailey, J.; White, P.A. The Mutagenic Hazards of Settled House Dust: A Review. Mutat. Res. Rev. Mutat. Res. 2004, 567, 401–425. [Google Scholar] [CrossRef] [PubMed]
  26. Szabová, E.; Zeljenková, D.; Nesčáková, E.; Šimko, M.; Turecký, L. Polycyclic Aromatic Hydrocarbons and Occupational Risk Factor. Reprod. Toxicol. 2008, 26, 74. [Google Scholar] [CrossRef]
  27. Hamid, N.; Syed, J.H.; Junaid, M.; Mahmood, A.; Li, J.; Zhang, G.; Malik, R.N. Elucidating the Urban Levels, Sources and Health Risks of Polycyclic Aromatic Hydrocarbons (PAHs) in Pakistan: Implications for Changing Energy Demand. Sci. Total Environ. 2018, 619, 165–175. [Google Scholar] [CrossRef] [PubMed]
  28. Ma, Y.; Harrad, S. Spatiotemporal Analysis and Human Exposure Assessment on Polycyclic Aromatic Hydrocarbons in Indoor Air, Settled House Dust, and Diet: A Review. Environ. Int. 2015, 84, 7–16. [Google Scholar] [CrossRef]
  29. Kamal, A.; Qamar, K.; Gulfraz, M.; Anwar, M.A.; Malik, R.N. PAH Exposure and Oxidative Stress Indicators of Human Cohorts Exposed to Traffic Pollution in Lahore City (Pakistan). Chemosphere 2015, 120, 59–67. [Google Scholar] [CrossRef]
  30. Cao, Z.-G.; Yu, G.; Chen, Y.-S.; Cao, Q.-M.; Fiedler, H.; Deng, S.-B.; Huang, J.; Wang, B. Particle Size: A Missing Factor in Risk Assessment of Human Exposure to Toxic Chemicals in Settled Indoor Dust. Environ. Int. 2012, 49, 24–30. [Google Scholar] [CrossRef]
  31. Ermolin, M.S.; Fedotov, P.S.; Ivaneev, A.I.; Karandashev, V.K.; Burmistrov, A.A.; Tatsy, Y.G. Assessment of Elemental Composition and Properties of Copper Smelter-Affected Dust and Its Nano- and Micron Size Fractions. Environ. Sci. Pollut. Res. 2016, 23, 23781–23790. [Google Scholar] [CrossRef]
  32. Jadoon, W.A.; Khpalwak, W.; Chidya, R.C.G.; Abdel-Dayem, S.M.M.A.; Takeda, K.; Makhdoom, M.A.; Sakugawa, H. Evaluation of Levels, Sources and Health Hazards of Road-Dust Associated Toxic Metals in Jalalabad and Kabul Cities, Afghanistan. Arch. Environ. Contam. Toxicol. 2018, 74, 32–45. [Google Scholar] [CrossRef]
  33. Enyoh, C.E.; Ohiagu, F.O.; Verla, A.W.; Wang, Q.; Shafea, L.; Verla, E.N.; Isiuku, B.O.; Chowdhury, T.; Ibe, F.C.; Chowdhury, M.A.H. “Plasti-Remediation”: Advances in the Potential Use of Environmental Plastics for Pollutant Removal. Environ. Technol. Innov. 2021, 23, 101791. [Google Scholar] [CrossRef]
  34. Aravinthasamy, P.; Karunanidhi, D.; Shankar, K.; Subramani, T.; Setia, R.; Bhattacharya, P.; Das, S. COVID-19 Lockdown Impacts on Heavy Metals and Microbes in Shallow Groundwater and Expected Health Risks in an Industrial City of South India. Environ. Nanotechnol. Monit. Manag. 2021, 16, 100472. [Google Scholar] [CrossRef]
  35. Karunanidhi, D.; Aravinthasamy, P.; Subramani, T.; Setia, R. Effects of COVID-19 Pandemic Lockdown on Microbial and Metals Contaminations in a Part of Thirumanimuthar River, South India: A Comparative Health Hazard Perspective. J. Hazard. Mater. 2021, 416, 125909. [Google Scholar] [CrossRef] [PubMed]
  36. Khan, R.; Saxena, A.; Shukla, S. Assessment of the Impact of COVID-19 Lockdown on the Heavy Metal Pollution in the River Gomti, Lucknow City, Uttar Pradesh, India. Environ. Qual. Manag. 2021, 31, 41–49. [Google Scholar] [CrossRef]
  37. Arora, S.; Bhaukhandi, K.D.; Mishra, P.K. Coronavirus Lockdown Helped the Environment to Bounce Back. Sci. Total Environ. 2020, 742, 140573. [Google Scholar] [CrossRef]
  38. Kumar, M.; Mazumder, P.; Mohapatra, S.; Thakur, A.K.; Dhangar, K.; Taki, K.; Mukherjee, S.; Patel, A.K.; Bhattacharya, P.; Mohapatra, P.; et al. A Chronicle of SARS-CoV-2: Seasonality, Environmental Fate, Transport, Inactivation, and Antiviral Drug Resistance. J. Hazard. Mater. 2021, 405, 124043. [Google Scholar] [CrossRef]
  39. Saha, N.; Bodrud-Doza, M.; Islam, A.R.M.T.; Begum, B.A.; Rahman, M.S. Hydrogeochemical Evolution of Shallow and Deeper Aquifers in Central Bangladesh: Arsenic Mobilization Process and Health Risk Implications from the Potable Use of Groundwater. Environ. Earth Sci. 2020, 79, 477. [Google Scholar] [CrossRef]
  40. Air Pollution Reduction Strategy for Bangladesh Air Pollution Reduction Strategy for Bangladesh; DoE, Government of Bangladesh: Dhaka, Bangladesh, 2012.
  41. Bhuiyan, M.S.I. Public Transport and Environmental Pollution: A Case Study of Dhaka City World Vision. World Vis. Res. J. 2018, 12, 96–108. [Google Scholar]
  42. Rahman, M.; Khan, M.D.H.; Jolly, Y.N.; Kabir, J.; Akter, S.; Salam, A. Assessing Risk to Human Health for Heavy Metal Contamination through Street Dust in the Southeast Asian Megacity: Dhaka, Bangladesh. Sci. Total Environ. 2019, 660, 1610–1622. [Google Scholar] [CrossRef]
  43. Kormoker, T.; Proshad, R.; Islam, S.; Ahmed, S.; Chandra, K.; Uddin, M.; Rahman, M. Toxic Metals in Agricultural Soils near the Industrial Areas of Bangladesh: Ecological and Human Health Risk Assessment. Toxin Rev. 2019, 40, 1135–1154. [Google Scholar] [CrossRef]
  44. Rabin, M.H.; Wang, Q.; Kabir, M.H.; Wang, W. Pollution Characteristics and Risk Assessment of Potentially Toxic Elements of Fine Street Dust during COVID-19 Lockdown in Bangladesh. Environ. Sci. Pollut. Res. 2022. [Google Scholar] [CrossRef] [PubMed]
  45. Trojanowska, M.; Świetlik, R. Investigations of the Chemical Distribution of Heavy Metals in Street Dust and Its Impact on Risk Assessment for Human Health, Case Study of Radom (Poland). Hum. Ecol. Risk Assess. Int. J. 2019, 26, 1907–1926. [Google Scholar] [CrossRef]
  46. Delibašić, Š.; Đokić-Kahvedžić, N.; Karić, M.; Keskin, I.; Velispahić, A.; Huremović, J.; Herceg, K.; Selimović, A.; Silajdžić, S.; Žero, S.; et al. Health Risk Assessment of Heavy Metal Contamination in Street Dust of Federation of Bosnia and Herzegovina. Hum. Ecol. Risk Assess. Int. J. 2020, 27, 1296–1308. [Google Scholar] [CrossRef]
  47. Jiang, X.; Lu, W.X.; Zhao, H.Q.; Yang, Q.C.; Yang, Z.P. undefined Potential Ecological Risk Assessment and Prediction of Soil Heavy-Metal Pollution around Coal Gangue Dump. Nat. Hazards Earth Syst. Sci. 2014, 14, 1599–1610. [Google Scholar] [CrossRef] [Green Version]
  48. Wang, Q.; Kobayashi, K.; Lu, S.; Nakajima, D.; Wang, W.; Zhang, W.; Sekiguchi, K.; Terasaki, M. Studies on Size Distribution and Health Risk of 37 Species of Polycyclic Aromatic Hydrocarbons Associated with Fine Particulate Matter Collected in the Atmosphere of a Suburban Area of Shanghai City, China. Environ. Pollut. 2016, 214, 149–160. [Google Scholar] [CrossRef]
  49. Wang, W.; Wang, Q.; Nakajima, D.; Lu, S.; Xiao, K.; Chowdhury, T.; Suzuki, M.; Liu, F. Industrial Source Contributions and Health Risk Assessment of Fine Particle-Bound Polycyclic Aromatic Hydrocarbons (Pahs) during Spring and Late Summer in the Baoshan Area, Shanghai. Processes 2021, 9, 2016. [Google Scholar] [CrossRef]
  50. Ma, Y.; Liu, A.; Egodawatta, P.; McGree, J.; Goonetilleke, A. Quantitative Assessment of Human Health Risk Posed by Polycyclic Aromatic Hydrocarbons in Urban Road Dust. Sci. Total Environ. 2017, 575, 895–904. [Google Scholar] [CrossRef]
  51. USEPA. Risk Assessment Guidance for Superfund. Volume I Human Health Evaluation Manual (Part A); Office of Solid Waste and Emergency Response, Environmental Protection Agency: Washington, DC, USA, 1989; Volume 1, p. 289.
  52. Wei, X.; Ding, C.; Chen, C.; Zhu, L.; Zhang, G.; Sun, Y. Environment Impact and Probabilistic Health Risks of PAHs in Dusts Surrounding an Iron and Steel Enterprise. Sci. Rep. 2021, 11, 6749. [Google Scholar] [CrossRef]
  53. He, M.; Yang, S.; Zhao, J.; Collins, C.; Xu, J.; Liu, X. Reduction in the Exposure Risk of Farmer from E-Waste Recycling Site Following Environmental Policy Adjustment: A Regional Scale View of PAHs in Paddy Fields. Environ. Int. 2019, 133, 105136. [Google Scholar] [CrossRef]
  54. Verla, E.N.; Verla, A.W.; Enyoh, C.E. Finding a Relationship between Physicochemical Characteristics and Ionic Composition of River Nworie, Imo State, Nigeria. PeerJ Anal. Chem. 2020, 2, e5. [Google Scholar] [CrossRef] [Green Version]
  55. Liu, J.; Zhang, J.; Zhan, C.; Liu, H.; Zhang, L.; Hu, T.; Xing, X.; Qu, C. Polycyclic Aromatic Hydrocarbons (PAHs) in Urban Street Dust of Huanggang, Central China: Status, Sources and Human Health Risk Assessment. Aerosol Air Qual. Res. 2019, 19, 221–233. [Google Scholar] [CrossRef]
  56. Zhai, Y.; Yin, Z.; Zhao, X.; Zhang, J.; Zuo, R.; Wu, J.; Yang, J.; Teng, Y.; Wang, J. Polycyclic Aromatic Hydrocarbons (PAHs) in the Environment of Beijing, China: Levels, Distribution, Trends and Sources. Hum. Ecol. Risk Assess. Int. J. 2017, 24, 137–157. [Google Scholar] [CrossRef]
  57. Gope, M.; Masto, R.E.; George, J.; Balachandran, S. Exposure and Cancer Risk Assessment of Polycyclic Aromatic Hydrocarbons (PAHs) in the Street Dust of Asansol City, India. Sustain. Cities Soc. 2018, 38, 616–626. [Google Scholar] [CrossRef]
  58. Keshavarzi, B.; Abbasi, S.H.; Moore, F.; Delshab, H.; Soltani, N. Polycyclic Aromatic Hydrocarbons in Street Dust of Bushehr City, Iran: Status, Source, and Human Health Risk Assessment. Polycycl. Aromat. Compd. 2017, 40, 61–75. [Google Scholar] [CrossRef]
  59. Najmeddin, A.; Moore, F.; Keshavarzi, B.; Sadegh, Z. Pollution, Source Apportionment and Health Risk of Potentially Toxic Elements (PTEs) and Polycyclic Aromatic Hydrocarbons (PAHs) in Urban Street Dust of Mashhad, the Second Largest City of Iran. J. Geochem. Explor. 2018, 190, 154–169. [Google Scholar] [CrossRef]
  60. Wei, C.; Bandowe, B.A.M.; Han, Y.; Cao, J.; Zhan, C.; Wilcke, W. Polycyclic Aromatic Hydrocarbons (PAHs) and Their Derivatives (Alkyl-PAHs, Oxygenated-PAHs, Nitrated-PAHs and Azaarenes) in Urban Road Dusts from Xi’an, Central China. Chemosphere 2015, 134, 512–520. [Google Scholar] [CrossRef]
  61. Lee, B.-K.; Dong, T.T.T. Effects of Road Characteristics on Distribution and Toxicity of Polycyclic Aromatic Hydrocarbons in Urban Road Dust of Ulsan, Korea. J. Hazard. Mater. 2010, 175, 540–550. [Google Scholar] [CrossRef]
  62. Lorenzi, D.; Entwistle, J.A.; Cave, M.; Dean, J.R. Determination of Polycyclic Aromatic Hydrocarbons in Urban Street Dust: Implications for Human Health. Chemosphere 2011, 83, 970–977. [Google Scholar] [CrossRef]
  63. Enyoh, C.E.; Ohiagu, F.O.; Verla, A.W.; Verla, E.N. A Chemometric Review of Heavy Metals (Zn, Cd, Pb, Fe, Cu, Ni and Mn) in Top Soils of Imo State, Southeastern Nigeria. Int. J. Environ. Anal. Chem. 2020. [Google Scholar] [CrossRef]
  64. Jia, C.; Batterman, S. A Critical Review of Naphthalene Sources and Exposures Relevant to Indoor and Outdoor Air. Int. J. Environ. Res. Public Health 2010, 7, 2903–2939. [Google Scholar] [CrossRef]
  65. Balmer, J.E.; Hung, H.; Yu, Y.; Letcher, R.J.; Muir, D.C.G. Sources and Environmental Fate of Pyrogenic Polycyclic Aromatic Hydrocarbons (PAHs) in the Arctic. Emerg. Contam. 2019, 5, 128–142. [Google Scholar] [CrossRef]
  66. USEPA. Exposure Factors Handbook (1997, Final Report); U.S. Environmental Protection Agency: Washington, DC, USA, 1997.
Figure 1. Maps showing the sampling area and study sites [44]. (a) The location of the study site (the metropolitan area of Dhaka city; red marked area) in Bangladesh map and (b) four different land use categories sampling sites in Dhaka metropolitan area.
Processes 10 02575 g001
Figure 2. Collection and processing of street dust samples.
Processes 10 02575 g002
Figure 3. Distribution of different PAHs in different land use categories of street dust during: (a) without lockdown, (b) partial lockdown, and (c) complete lockdown, and (d) trends of total individual PAH concentration across the entire lockdown. The bars represent standard deviation from triplicate analysis.
Processes 10 02575 g003aProcesses 10 02575 g003b
Figure 4. Total PAH distribution in various land use categories of roadway dust during lockdown and without lockdown. Significant differences are shown by bars with different letters when p < 0.05.
Processes 10 02575 g004
Figure 5. Average distribution of PAHs by molecular weights during: (a) without lockdown, (b) partial lockdown, and (c) complete lockdown; and (d) Concentration and proportion of total PAHs with three molecular weight groups in different land use categories of street dust during without, partial and complete lockdown.
Processes 10 02575 g005
Figure 6. Principal component (PC) plots for PAHs in street dust during: (a) without lockdown, (b) partial lockdown, and (c) complete lockdown; and hierarchical cluster (HC) plots for PAHs in street dust during: (d) without lockdown, (e) partial lockdown, and (f) complete lockdown.
Processes 10 02575 g006aProcesses 10 02575 g006b
Figure 7. Scatterplot of isomer ratios of Ant/(Ant + Phe) versus Flu/(Flu + Pyr), and BaA/(BaA + Chy) versus IndP/(IndP + BghiP) for PAHs sources before lockdown (a,b); during partial lockdown (c,d); and during complete lockdown (e,f).
Processes 10 02575 g007aProcesses 10 02575 g007b
Figure 8. The estimated mean ILCRs that PAHs in street dust pose to children and adults.
Processes 10 02575 g008
Table 1. TEF values for 16 PAHs [53].
CompoundsTEFs
Nap0.001
Acy0.001
Ace0.001
Flu0.001
Phe0.001
Ant0.01
FLN0.001
Pyr0.001
BaA0.1
Chy0.01
BbF0.1
BkF0.1
BaP1
IndP0.1
DB (a.h)1
BghiP0.01
Table 2. The values of ILCR parameters to children and adults in street dust, modified from [8].
Exposure VariableUnitChildren
(0–6 Years Old)
Adults
(7–31 Years Old)
Inhalation rate (IRinh)m3/d1020
Ingestion rate (IRing)mg/d200100
Body weight (BW)kg1570
Exposure frequency (EF)d/yr180180
Exposure duration (ED)yr624
Average time during exposure (AT)d25,55025,550
Dermal exposure area (SA)cm228005700
Dermal adherence factor (AF)mg/(cm2 d)0.20.07
Adsorption factor of BaP (ABS)Unitless0.130.13
Particle emission factor (PEF)m3/kg1.36 × 1091.36 × 109
Carcinogenic slope factor for ingestion (CSFing)(kg d)/mg7.3 7.3
Carcinogenic slope factor for dermal contact (CSFdermal)(kg d)/mg25 25
Carcinogenic slope factor for inhalation (CSFinh)(kg d)/mg3.85 3.85
Table 3. Correlation matrix for PAHs in street dust without lockdown and during the partial and complete lockdowns.
NAPAcyAceFluPheAntFLNPyrBaAChyBbFBkFBaPDB (a,h)IndPBghiP
Without Lockdown
NAP1
Acy0.1191
Ace0.976 *−0.0521
Flu0.930 *0.3290.831 *1
Phe−0.5910.373−0.565−0.6481
Ant−0.435−0.59−0.427−0.313−0.4671
FLN−0.3850.382−0.341−0.5020.967*−0.6521
Pyr0.976 *0.2440.909 *0.987 *−0.634−0.372−0.4591
BaA0.977 *−0.0880.995 *0.851 *−0.642−0.343−0.4310.920 *1
Chy0.951 *0.4110.886 *0.931 *−0.384−0.624−0.1830.957 *0.870 *1
BbF−0.534−0.516−0.35−0.8070.589 *−0.030.589 *−0.702−0.398−0.5981
BkF0.463−0.1460.601 *0.1330.213−0.7110.4370.2790.531 *0.4370.4571
BaP0.4060.824 *0.3250.410.426−0.9410.566 *0.4160.2550.652 *−0.2360.4371
DB (a,h)0.808 *0.1330.860 *0.587 *−0.067−0.7930.1830.694 *0.807 *0.819 *−0.0310.873 *0.635 *1
IndP−0.199−0.142−0.045−0.4970.716 *−0.5460.818 *−0.376−0.128−0.1610.853 *0.770.2850.4051
BghiP−0.5590.444−0.548−0.5980.996 *−0.5020.967 *−0.591−0.626−0.3350.526 *0.1960.482−0.0520.681 *1
Partial Lockdown
NAP1
Acy0.799 *1
Ace0.763 *0.3871
Flu0.350.815 *−0.2141
Phe− 0.742− 0.278−0.5410.0891
Ant0.1540.4310.3760.2690.504 *1
FLN0.842 *0.992 *0.3960.795 *−0.3860.3221
Pyr0.1630.720 *−0.1920.908 *0.4310.602 *0.650 *1
BaA0.121−0.3070.727 *−0.766−0.1410.289−0.324−0.5781
Chy−0.088−0.5290.554 *−0.894−0.0680.136−0.54−0.7070.970 *1
BbF−0.119−0.5980.501 *− 0.94−0.1290.004−0.595−0.7950.938 *0.991 *1
BkF0.0430.162−0.5620.483−0.326−0.7090.2410.13−0.849−0.791−0.7041
BaP−0.2−0.3390.451−0.6020.3790.604 *−0.415−0.2440.856 *0.842 *0.772 *−0.9831
DB (a,h)0.568 *0.1050.957 *−0.485−0.4850.2820.115−0.4270.884 *0.765 *0.729 *−0.6670.602 *1
IndP0.405−0.1170.869 *−0.668−0.4610.145−0.099−0.6080.940 *0.872 *0.856 *−0.6680.644 *0.974 *1
BghiP0.377−0.1450.855 *−0.689−0.4420.142−0.129−0.6210.948 *0.887 *0.872 *−0.6790.660 *0.967 *0.999 *1
Complete Lockdown
NAP1
Acy−0.3341
Ace0.1530.875 *1
Flu−0.1030.1940.051
Phe−0.338−0.633−0.8830.3961
Ant0.585 *−0.949−0.71−0.0650.503 *1
FLN−0.780.829*0.490.019−0.298−0.9611
Pyr0.746 *− 0.574−0.2820.4210.3080.788 *−0.8851
BaA0.680 *0.1350.547*−0.615−0.8520.006−0.1940.021
Chy0.436−0.575−0.460.637*0.606* 0.723 *−0.7450.924 *−0.3611
BbF0.827 *−0.805-0.421−0.2130.1470.928 *−0.9770.791 *0.3670.591 *1
BkF0.698 *0.440.810 *0.042−0.807−0.163−0.1120.2720.755 *−0.0250.1761
BaP−0.7660.859 *0.505 *0.241−0.219−0.9530.974 *−0.761−0.309−0.584−0.994−0.0791
DB (a,h)−0.2590.074−0.1510.970*0.587*−0.0120.0330.359−0.7830.641 *− 0.24−0.1970.2431
IndP0.869 *0.1710.608 *0.055−0.6510.125−0.3920.516*0.741 *0.2050.4410.957 *−0.349−0.1711
BghiP0.134−0.941−0.885−0.4480.567*0.801*−0.6310.268−0.1010.2760.653 *−0.584−0.726−0.291−0.3671
* Correlation is significant at the 0.05 level.
Table 4. Values of ILCRs of PAHs in different land use categories of street dust during partial and complete lockdowns and after the lockdown.
Industrial AreaResidential AreaCommercial AreaPublic Facilities Area
WLPLCLWLPLCLWLPLCLWLPLCL
Children
ILCRigestion3.54 × 10−73.69 × 10−74.30 × 10−83.13 × 10−72.35 × 10−75.60 × 10−84.20 × 10−72.28 × 10−75.15 × 10−82.34 × 10−71.86 × 10−73.73 × 10⁻⁸
ILCRinhalation6.86 × 10−127.16 × 10−128.34 × 10−136.08 × 10−124.55 × 10−121.09 × 10−128.14 × 10−124.41 × 10−129.98 × 10−134.54 × 10−123.61 × 10−127.23 × 10⁻¹³
ILCRdermal4.41 × 10−74.60 × 10−75.36 × 10−83.91 × 10−72.93 × 10−76.98 × 10−85.23 × 10−72.84 × 10−76.41 × 10−82.92 × 10−72.32 × 10−74.65 × 10⁻⁸
ILCRtotal7.95 × 10−78.29 × 10−79.66 × 10−87.04 × 10−75.28 × 10−71.26 × 10−79.43 × 10−75.12 × 10−71.16 × 10−75.26 × 10−74.18 × 10−78.38 × 10⁻⁸
Adults
ILCRigestion2.53 × 10−72.64 × 10−73.08 × 10−82.24 × 10−71.68 × 10−74.01 × 10−83.01 × 10−71.63 × 10−73.68 × 10−81.68 × 10−71.33 × 10−72.67 × 10⁻⁸
ILCRinhalation9.83 × 10−121.03 × 10−111.19 × 10−128.70 × 10−126.52 × 10−121.56 × 10−121.17 × 10−116.32 × 10−121.43 × 10−126.51 × 10−125.17 × 10−121.04 × 10⁻¹²
ILCRdermal6.93 × 10−87.23 × 10−88.43 × 10−96.14 × 10−84.60 × 10−81.10 × 10−88.22 × 10−84.46 × 10−81.01 × 10−84.59 × 10−83.65 × 10−87.30 × 10⁻⁹
ILCRtotal3.22 × 10−73.36 × 10−73.92 × 10−82.85 × 10−72.14 × 10−75.11 × 10−83.83 × 10−72.08 × 10−74.69 × 10−82.14 × 10−71.70 × 10−73.40 × 10⁻⁸
Note: Baseline concentration is 10−6 to 10−4 [51].
Publisher’s Note: MDPI stays neutral with regard to jurisdictional claims in published maps and institutional affiliations.

