
Prediction and Control of Input and Output for Industry–University–Research Collaboration Network in Construction Industry

1
School of Information Science and Technology, Guangdong University of Foreign Studies, Guangzhou 510006, China
2
School of Management, Jinan University, Guangzhou 510632, China
3
School of Management, Guangzhou University, Guangzhou 510006, China
4
School of Management, Shenzhen University, Shenzhen 518060, China
*
Author to whom correspondence should be addressed.
Processes 2022, 10(10), 2037; https://doi.org/10.3390/pr10102037
Submission received: 22 September 2022
/
Revised: 29 September 2022
/
Accepted: 3 October 2022
/
Published: 9 October 2022
(This article belongs to the Special Issue Numerical Simulation of Nonlinear Dynamical Systems)
Abstract
:An unreasonable allocation of resources has led to a low rate of output in the industry–university–research collaboration network. A solution to this problem is to control and predict the input and output. However, the network has the characteristics of strong nonlinearity and insufficient samples. It is difficult for the existing control methods to migrate to collaboration networks because the traditional control methods, including Proportional–Integral–Derivative (PID) control and Model Predictive Control (MPC), are usually not applied to the system with strong nonlinearity and the controlled system needs to have specific parameters, while the modern control methods, including feedforward control and feedback control, have their limitations in both parameters and other aspects. In addition, there is a lack of research on the control and output prediction of collaboration networks, and there is no effective and applicable scheme for the control and prediction. Considering the nonlinearity and insufficient samples of the collaboration network, a Feedforward Control–Feedback Control Model based on the Multi-Layer Perceptron (FCFCM-MLP) is proposed in this paper. Adopting the controller structure of the Grid Search-Multilayer Perceptron (GS-MLP), a control block diagram, a feedforward controller, a feedback controller, and prediction methods such as Harris Hawk Optimization-Support Vector Regression (HHO-SVR) are designed for the FCFCM-MLP, which effectively realizes the feedforward control, feedback control, and prediction of inputs and outputs. In this paper, simulation tests on output-feedback tracking control are conducted with real statistics of papers jointly produced by the industry–university–research collaboration network in the construction industry. The results show that the proposed model has obvious effectiveness. Specifically, compared with the model composed of other controller structures and prediction methods, the optimal model Particle Dynamic Multiple Perturbation_Butterfly Optimization Algorithm-Support Vector Regression_Grid Search-Multi-Layer Perceptron (PDM_BOA-SVR_GS-MLP) obtained in this paper can minimize the predictive control error and effectively improve the control accuracy.
1. Introduction
Since the beginning of the 21st century, the industry–university–research cooperation and innovation have sparked heated scientific competitions, which have promoted the development of the global scientific revolution and greatly changed the global industry patterns. The industry–university–research collaboration means that the universities, the enterprises, and the scientific research institutes work together based on principles of risk sharing, advantage complementing, mutual benefit, and mutual development during innovation [1]. It is now faced with challenges such as the unreasonable allocation of resources, a lack of collaboration motivation, and a small number of innovation achievements [2,3,4], falling into a paradox that the output in terms of patent achievements and market share does not correspond to its investment of talents and capital [5]. Meanwhile, the unreasonable allocation of resources has become a major obstacle of the in-depth development of the collaboration network [6,7]. To solve these problems and improve the performance of the network, predicting the input to control the output is a way out.
The industry–university–research collaboration in the construction industry means that several construction enterprises, universities, and institutes with different strengths pool their human, material, and financial resources together and build long-term cooperation in technology for the purpose of making technology breakthroughs in a short time, reducing redundant research, and achieving continuous innovation. However, some negative factors, such as information asymmetry, information flow barriers, and low output ratio, have hindered the innovation and lowered the distribution efficiency of resources of the construction enterprises in the long run.
The birth of cybernetics has given rise to theories such as PID control, MPC control, and feedback control, which developed rapidly and were soon applied to many fields other than engineering technology such as economy, management, and society. However, the linear combination of PID control variables including the proportional, integral, and derivative of errors is not optimal, and when the system is free from interference, the integral feedback of errors in PID would reduce the dynamic performance of the closed-loop system [8,9,10]. As for the MPC controller, it is limited by the accuracy of the controlled object model. When the controlled system is strongly nonlinear, the MPC controller often fails to work due to the low accuracy of the model [11]. In addition, PID and MPC controllers are usually used in systems with fixed parameters, while some other existing equations are only applicable to particular nonlinear systems [12,13,14,15].
However, the traditional PID control and MPC control cannot be simply applied to the industry–university–research collaboration network, as it is dynamic and nonlinear and has no existing formula or fixed parameters. With the rise of machine learning, researchers have gradually turned their attention away from traditional control and toward feedforward control, feedback control, and machine learning, which provides another way to optimize resource allocation. According to feedback control theory, feedback changes the system input based on the observation of the output. Nevertheless, the feedback controller cannot generate the first output without the feedforward controller, and the output prediction is usually hindered by insufficient test samples and missing data. Therefore, no existing theory model that could be directly applied to the prediction and control of the industry–university–research network has been found so far.
Inspired by feedforward control, feedback control, PID control, machine learning, and error learning based on feedback, a model of multilayer-perceptron-based feedforward control–feedback control is proposed in this paper and the three main contributions made by this paper are as follows: (1) a model of feedforward control–feedback control is proposed that could be used to predict the output and control the input of the industry–university–research collaboration network accurately; (2) a grid-search-based multilayer perceptron is originally used as the structure of the feedforward and feedback controllers; (3) the applicability and practicability of the model are validated by empirical tests.
The remaining parts of this paper are organized as follows. Section 2 introduces the existing research related to control. Section 3 proposes the feedforward control–feedback control model, including the theory, design, and control process of the model. Section 4 displays the empirical tests and analyzes the test results, and Section 5 concludes the paper.
2. Related Work
As the model of the feedforward control–feedback control mainly refers to the design of the feedforward controller, the feedback controller, the structure of the controllers, and the prediction model, this section introduces research work related to the four aspects.
2.1. Feedback Control and Feedforward Control
Some scholars have designed feedback controllers in fields such as high-speed motors of electromagnetic bearings [16], tires [17], and a tracking system for upper limb rehabilitation [18]. Some other scholars have applied the feedforward control strategy in the stack power demand [19] and joint-space robot [20]. Although the feedback control model is simple to design and performs well in controlling, it fails to work when the control system is affected by latency, which would degrade the control performance of the system and lead to instability [21,22]. Unlike the feedback controller, the feedforward controller could detect the change in reference signal beforehand and tell the control system how to work. As there is no need for a feedback signal, the feedforward controller would not suffer from instability. However, the design of the feedforward controller relies on an accurate inverse model, which is particularly difficult to build when the system is complex and nonlinear. Error learning based on feedback can be applied to control the loading frequency of a reconstructed power system [23,24]. As for the feedback controller designed by a mixed sensibility approach, it relies on linear control technology, and is, hence, not applicable to complicated and nonlinear systems. Considering that all of the existing control approaches have their disadvantages that may affect the accuracy of systems, it is significant to build a control model that is applicable to the industry–university–research network.
2.2. Innovation Output Prediction
There are two approaches for output prediction with a small number of samples: patent prediction based on SVR [25] and scientific output prediction based on the BP neural network [26]. However, the prediction accuracy by SVR with only 77.27% is not high. The BP neural network tends to overfit, converge slowly, easily fall into a local extremum, and adjust its parameters, which is complicated [27]. In addition, it is difficult to determine the number of hidden layers for the single BP neural network. As there have been no suitable prediction approaches to innovation output, this paper aims to design an applicable prediction approach based on the sample and output characteristics of the industry–university–research network and apply it in the control model [28,29,30].
2.3. Controller Structure
As an important intelligent computing technology, the artificial neural network is usually used for solving various recognition and control problems. Therefore, neural networks, such as BPNN, RBF, Hopfield, CNN, GNN, WNN, and MLP, can be used as the structure of the feedforward and feedback controllers. The multi-layer perceptron, abbreviated MLP, is widely used for processing nonlinear objects with multiple inputs and complicated coupling due to its good performance in processing nonlinear data and good fitness in nonlinear systems. Nevertheless, the MLP tends to overfit and is difficult to explain, and its computing complicity rises in complicated systems.
3. FCFCM-MLP
Resource-based theory emphasizes the ability to control and manage resources because high-quality resources are necessary for good performance [31,32,33]. Feedback changes the system input based on the observation of the output. According to control theory, the control system needs the output or error to make responses.
There has been no research focusing on the study of feedback control of an industry–university–research collaboration and innovation network. The existing research has ignored the dynamic and nonlinear feature of the collaborative network and, hence, has failed to make an accurate prediction and control of the input of human and capital resources. However, the feedforward–feedback control model proposed in this paper is able to predict the future output and then adjust the actual input according to the predicted result, which provides new theoretical support for optimizing the redistribution of innovation resources.
Thus, in this paper, a model that takes advantage of the feedforward controller, feedback controller, and prediction approach is proposed to predict the output and control the input of the collaborative network. The main ideas of this model include: (1) prediction of future output of innovation; (2) iteration in the feedforward–feedback control system to generate the smallest error according to the output; (3) output of the innovation input value when the error reaches the minimum.
The feedforward–feedback control model and its control process are illustrated as follows.
3.1. FCFCM-MLP and Its Components
Notations used in this paper are defined in Table 1 before the structure of the feedforward–feedback control is proposed.
The control block diagram of FCFCM-MLP is shown in Figure 1.
As shown in Figure 1, FCFCM-MLP is composed of a feedforward controller, a feedback controller, and a prediction model, and the structure of the controllers is a GS-MLP. “+” means to simply add the input, and “−”means to add the negative signal to form an output signal. As the MLP is applied in both the FFC and the FBC, the following part first gives a brief introduction to the MLP, and then details the prediction model, the FFC, and the FBC.
- (1)
- Structure of the controllers—GS-MLP
The MLP supports multiple inputs and multiple outputs while general machine learning approaches only allow a single input and single output, which is not applicable to the sample data of the industry–university–research collaboration network. On account of the number of samples, inputs, and outputs, the MLP is adopted as the structure of the controllers instead of other complicated models in this paper. The input and output of the FFC and the FBC are illustrated in their parts. The number of hidden layers of MLP should be determined by the data structure. More layers need more network parameters and the demand of training data increases correspondingly. Otherwise, insufficient layers may result in bad fitness between the network and the target function. Considering the number of inputs, outputs, and samples, an MLP control structure with four layers is designed, including an input layer, two hidden layers, and an output layer.
As a hyper-parameter optimization technology, grid search, abbreviated GS, is usually used for optimizing hyper-parameters with fewer than three values. In this paper, the GS is used for optimizing the number of layers and the structure of the MLP and searching the number of nodes of every hidden layer to make the MLP optimal and reduce overfitting.
- (2)
- Prediction model
Future output is predicted based on the existing human and capital input, as well as the existing output. The data used for prediction are derived from the previous n years, while the input data are from the previous m years. In addition, the m may differ from the n.
where is the innovation output of the th year, is the predicted output of the ()th year, is the output of the controller, is a nonlinear function, refers to the prediction based on the samples of the first years, and indicates the control based on the samples of the first m years.
Support vector regression, abbreviated SVR, is an important application of support vector machine. It performs well in processing a small amount of sample data and is able to make nonlinear predictions, which is applicable to the innovation output prediction. In this paper, algorithms such as HHO-SVR, BOA-SVR, ALO-SVR, and ELM are used for prediction.
The Root-Mean-Square Error equation, abbreviated RMSE, is shown as follows:
where is the real value anI is the prediction value generated by the prediction model.
- (3)
- Feedforward controller
The is generated by the feedforward controller with the , which is computed based on the existing and . Parameters of functions are determined by algorithms and data characteristics.
The FFC relies on an accurate reverse model. Its control output is shown as the following equation:
where is a reverse nonlinear function.
The MLP optimized with GS is used as the structure of the FFC. When training the FFC, parameters of MLP are adjusted to minimize the RMSE.
- (4)
- Feedback controller
The FBC is used for generating the control error signal between the expected output and the real output of the system. The action of the control error is determined by the FBC to make the system output in line with the expected output. The signals of the control error , the above-mentioned , and all of the existing are put into the GS-MLP to generate the output of the FBC.
The control output of the FBC is shown as the following equation:
where is the error between the real and the predicted .
Therefore, the input of the FCFCM-MLP includes the current, previous , and previous , while the output of the model is when the error is stable. In later empirical tests, the input can be either a composite of investment of capital and personnel, or the composite of capital investment, personnel investment, network connection density, and network centrality, which depends on the actual needs.
3.2. Control Process
The control process of the FCFC mainly includes the following steps:
- (1)
- Feedforward control, to generate , namely, the , according to Equation (3);
- (2)
- Predict, to generate according to Equation (1);
- (3)
- Calculate the control error , put it into the FCFC, and then repeat the following procedures:
- Put into the FFC to generate the ;
- Put the and the into the FBC to generate the ;
- and take the as the input of the prediction model.
In detail, the feedforward–feedback control goes through a training process and a predict-control process. The training process aims to determine the relationship between the and the , while the predict-control process aims to make the predicted output close to the expected output. To begin with, the test data are made dimensionless. Then, the processed data are divided into a training set and a test set, and the data of the test set are from the last two years. The control procedures of the FCFC based on Figure 1 are shown as follows:
Part I Training Process—to train the model and the controllers:
- (1)
- Train the prediction model:
- Input X into the prediction model to generate the output Y;
- Optimize and train the prediction models (HHO-SVR, ELM, etc.);
- Calculate the training error of the prediction model.
- (2)
- Train the FFC:
- Input X into the FFC to generate the output Y;
- Optimize and train the FFC (GS-MLP).
- (3)
- Train the FBC:
- Input X into the FBC to generate the output Y;
- Optimize and train the FBC (GS-MLP).
Part II Predict Control Process—to predict and control with the trained model and controllers:
- (1)
- Predict X with the trained FFC;
- (2)
- Predict Y with the trained prediction model;
- (3)
- Compute the error between the real Y and the predicted Y;
- (4)
- Put the error into the FCFC to predict X;
- (5)
- Compute the mean value of the output generated in Step (1) and Step (4) and take it as the input of the prediction model in the next step;
- (6)
- Input the control signal obtained in the previous step to generate a new output Y;
Repeat steps (4), (5), and (6) until the predicted error remains stable.
4. Tests and Analysis
4.1. Datasets and the Index System
The statistics of papers jointly produced by universities, enterprises, and scientific research institutes are from the core library of Web of Science. As the SCI paper is a reflection of the fundamental scientific research ability of a country, the test of this paper was based on SCI papers jointly produced by 45 American universities and 30 enterprises and institutes researching subjects such as civil engineering, architecture, interior architecture, urban planning, and landscape design during the period between 2008 and 2016 from the core library of Web of Science. With seven properties of the papers, including publishing time, publishing address (from which the collaboration institutes as nodes of the collaboration network were extracted), research field, number of citations (core libraries), number of citations (all libraries), and journal influence factors as the major fields, a total of 82,744 records were derived from the core database. Generated by year, the industry–university–research collaboration network was composed of nodes represented by universities, enterprises, and scientific research institutes and edges represented by the numbers of collaboration. The closeness centrality, betweenness centrality, degree centrality, and network connection density of the collaboration network could be extracted with the help of big data processing techniques. Meanwhile, the government capital input, R&D expenditures, and the number of postgraduates of universities could be obtained from the US government’s official website. Excluding non-U.S. colleges and universities, the number of samples reached 405.
With innovation input, network connection density, and network centrality as independent variables and the quality and quantity of papers jointly published by different institutes as dependent variables, the index system built for the feedforward–feedback control model is shown in Table 2.
The innovation performances could be divided into two types, namely, quantity-driven performance and quality-driven performance, which emphasizes the quantity and quality of the innovation output, respectively. When selecting the innovation output, both quantity and quality should be taken into consideration because the value of a high-quality academic paper is much higher than the total value of a large number of low-quality academic papers. Therefore, journals on which the papers were jointly published by different institutes and the influence factors were used to evaluate the quantity and quality of the papers in order to produce the index of innovation output and improve the accuracy of the test results.
4.2. Tests of Output—Track Control Performance
Based on the design of the feedforward–feedback controller that adopted the structure of the MLP and the GS-MLP, the simulation tests of models in this paper combined the extreme learning machine (ELM), support vector regression (SVR), Harris-Eagle-based support vector regression (HHO-SVR), Butterfly-optimization-algorithm-based support vector regression (BOA-SVR), and prediction models such as PSO_BOA-SVR and PDM_BOA-SVR to track the output in real time and obtain the corresponding input value. The composite value of influence factors (IFs) of jointly produced papers was taken as the innovation output.
The training samples and test samples were selected from two periods, 2008–2014 and 2015–2016. The output of this year was predicted from the data of the first three years. The predicted output y of year 2015–2016 and the predicted control value of innovation input x of year 2014–2015 were generated according to Figure 2 and Equations (1)–(4). Several combinations of prediction models and controllers were tested, and the control result of PDM_BOA-SVR_GS-MLP is shown below.
- (1)
- The prediction performance of the prediction-control model on the test set.
Figure 2 displays the fitting curve between the predicted values and the real values of innovation output of 90 samples from 45 universities in 2015 and 2016.
Figure 2 shows the fitting result of predicted values and real values of the innovation output of the INPM prediction model. The predicted values are close to the real values except for those of the 20th, 43rd, and 44th samples.
By training the prediction model, feedforward controller, and feedback controller, the relationship between innovation input and innovation output was acquired. The performance of feedback prediction based on PDM_BOA-SVR and GS-MLP on the test set is shown in Figure 3, Figure 4 and Figure 5, and the prediction control results of the feedforward–feedback controller are displayed in Figure 6, Figure 7 and Figure 8.
- (2)
- The prediction performance of the feedback controller on the test set.
The feedback prediction performance of variables x1, x2, and x3 generated in Step (4) of the predict-control process (namely, input the error into the FCFC to predict the control variables x1, x2, and x3, respectively) is shown in Figure 3, Figure 4 and Figure 5.
Figure 3 shows the fitting result between the predicted values and the real values of government capital input (x1) in 2014 and 2015 generated by the feedforward–feedback controller (FCFC) designed in this paper. The predicted values are very close to the true values except for that of the 74th sample.
Figure 4 shows the fitting result between the predicted values and the real values of the R&D expenditures (x2) generated by the FCFC designed in this paper. The predicted values are very close to the true values except for those of the 15th, 24th, and 75th samples.
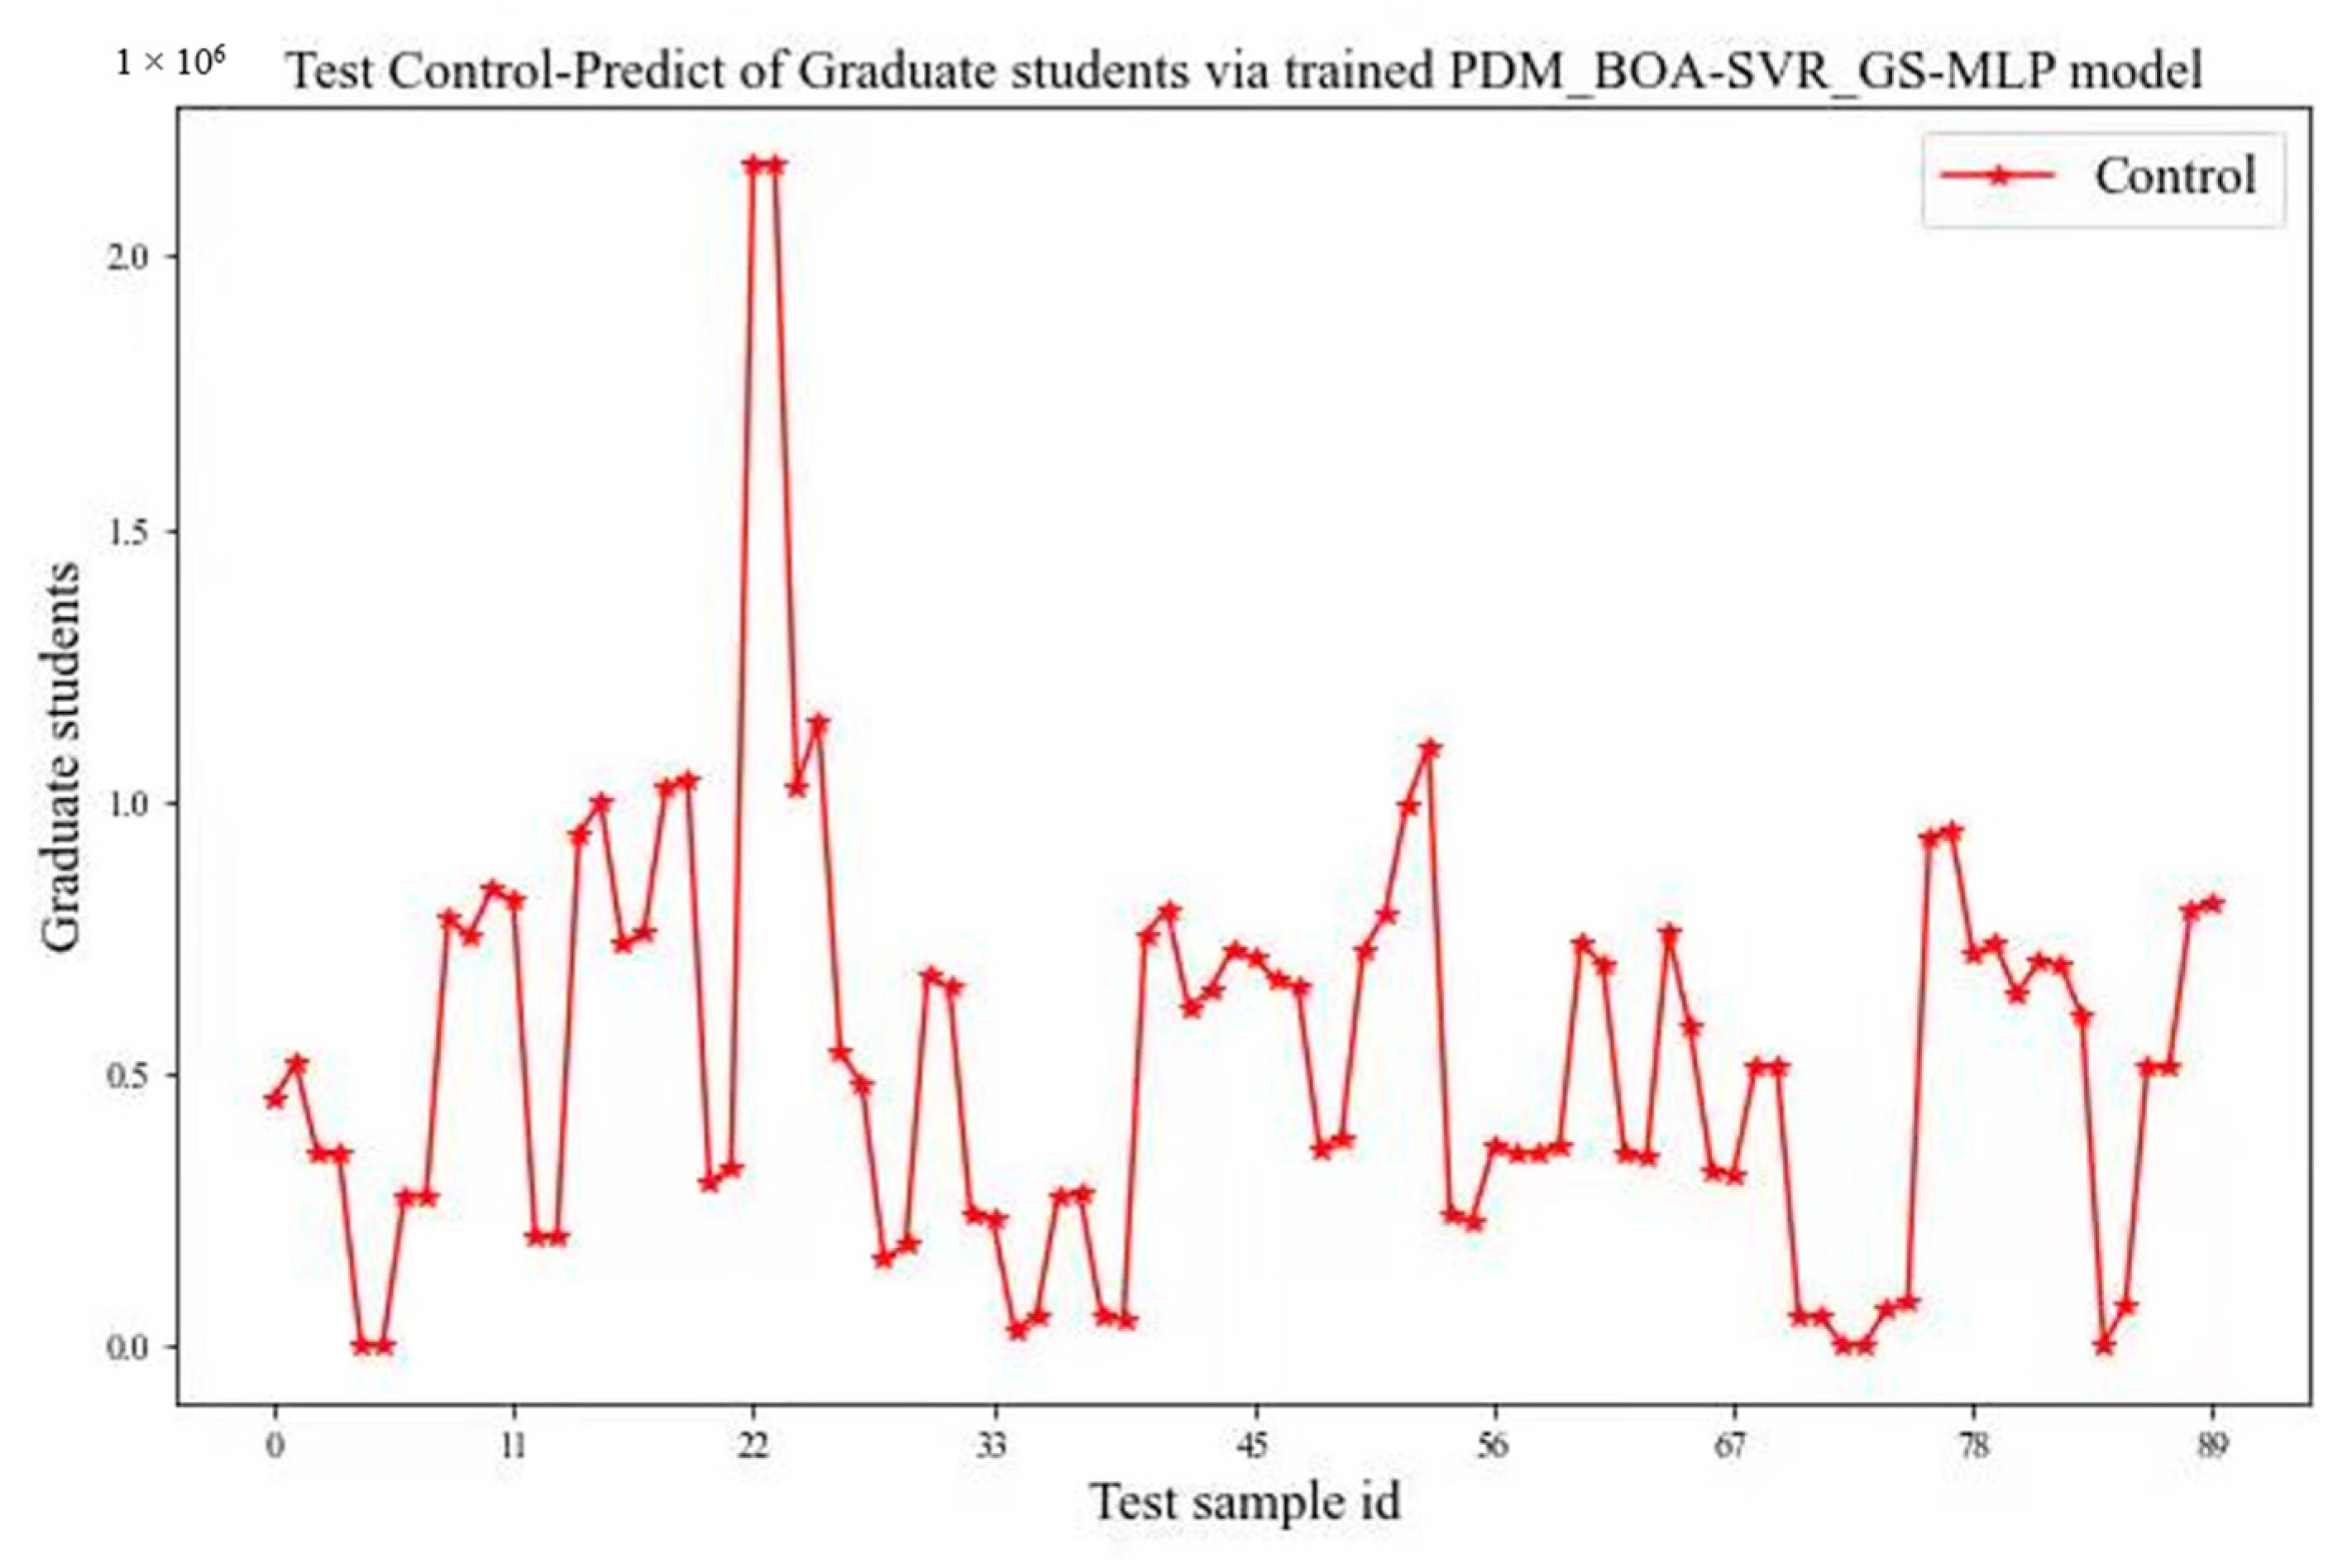
Figure 5 shows the fitting result between the predicted values and the real values of the number of postgraduates (x3) generated by the FCFC designed in this paper. The predicted values are very close to the true values except for those of the 22nd, 40th, and 41st samples.
- (3)
- The control performance of the prediction-control model on the test set.
- (i)
- Feedback control with capital input and personnel input as independent variables.
Figure 6 is a comparison of the real value and the control value of the government capital input of 45 universities from 2014 to 2015. The control value is the innovation input x1 generated by the FCFC. Adjusting the government capital input of different universities according to the control value could not only cut unnecessary expenditures, but also reserve capital for the universities in need, which makes contributions to improve the collaboration innovation performance of the industry–university–research collaboration network and produce high-quality papers collaborated by different institutes.
Figure 7 shows a comparison of the real value and the control value of the R&D expenditures of 45 universities from 2014 to 2015. The control value is the innovation input x2 generated by the FCFC.
Figure 8 shows a comparison of the true value and the control value of the number of postgraduates of 45 universities from 2014 to 2015. The control value is the innovation input x3 generated by the FCFC.
As shown in Figure 9, the error remains stable after 100 iterations, at which the value of innovation input x was needed in the test.
- (ii)
- Feedback control with network connection density.
Adding the independent variable of network connection density, the performance of the control system is shown as follows:
Figure 10 shows a comparison of the real value and the control value of the network connection density from 2014 to 2015. The control value is the network structure x7 of 45 universities generated by the FCFC.
The result of the control test shows that the FCFCM-MLP performs well in prediction and control on real datasets. Applying the proposed model to more nonlinear systems with a small number of data samples is an ongoing research issue.
Figure 11, Figure 12 and Figure 13, respectively, show the simulation value of the government capital input, R&D expenditures, and the number of postgraduates that are needed to increase future output by 5%.
Figure 11 shows the simulation value of capital input after increasing the innovation output by 5%. The ordinate indicates the government capital input of each institute. That is to say, adjusting the input could achieve the purpose of increasing the future output by 5%.
As shown in Figure 12, by adjusting the R&D expenditures, the future output would be increased by 5% according to the FCFC.
As shown in Figure 13, by adjusting the personnel input represented by the number of postgraduates, the future output would be increased by 5% according to the FCFC.
- (4)
- Comparison results of performance of models.
As shown in Table 3, seven algorithms were used in prediction models, including ELM, SVR, ALO-SVR, HHO-SVR, BOA-SVR, PSO_BOA-SVR, and PDM_BOA-SVR. Two structures, multi-layer perceptron (MLP) and multi-layer perceptron optimized with grid search (GS-MLP), were built for the feedforward and feedback controllers, respectively. The errors (RMSE) of prediction and control of different feedforward–feedback control models are shown in Table 3.
It is shown in Table 3 that the error of the GS-MLP model is smaller than that of the MLP according to the RMSE. The control models with different prediction methods sorted by errors in ascending order are as follows: PDM_BOA-SVR, PSO_BOA-SVR, HHO-SVR, BOA-SVR, ALO-SVR, SVR, and ELM. The error of the feedforward–feedback model built by PDM_BOA-SVR and GS-MLP is smallest, followed by the model composed of PSO_BOA-SVR and GS-MLP. The HHO was not further optimized, but the model composed of HHO-SVR and GS-MLP performed well in prediction and control. Thus, the GS-MLP controller combining the PDM_BOA-SVR prediction model would make the optimal control model.
5. Conclusions
There is no domestic research focusing on the study of feedback control of the industry–university–research collaboration and innovation network, yet this paper initiated the feedforward–feedback control model based on the dynamic and nonlinear feature of the collaborative network. The model, which is based on the feedforward controller, the feedback controller, and the multi-layer perceptron learning, has been proven universal and practical. It can be applied in accurate prediction and control on the collaboration and innovation network, helping with decision making about the network. Supposing that the model would be practiced in the collaborative network, it may not only contribute to the improvement of input–output rate, but bring actual benefits to society.
A FCFCM-MLP model composed of a feedforward controller FFC, feedback controller FBC, and a prediction model is proposed in this paper, which effectively alleviates the problem of unreasonable resource allocation of the industry–university–research collaboration network and improves innovation performance. The proposed control model has the following advantages: (i) it performs well in real-time tracking; (ii) the inverse function and controller are suitable for collaboration networks with strong nonlinearity; (iii) the optimal model PDM_BOA-SVR_GS-MLP can minimize the prediction and control error and effectively improve the control accuracy.
To highlight the orientation and purpose of the research, this paper takes innovation input, centrality, and connection density of the network as the major affected factors of the innovation output mechanism while ignoring the influence of the trust mechanism, culture of organizations, culture of societies, and communication mechanism, which is the limitation of the paper. In the future, the authors will adopt more measuring tools and methodologies to ensure the accuracy and validity of the research. On the other hand, because prediction and control have a certain predictive ability for the development trend of the system state, the model presented in this paper does not consider the operation state of the innovation network. Thus, in the future, we can consider combining the operation state monitoring and fault diagnosis of an innovation network with the prediction and control of the system model, as well as using intelligent model prediction and a control method to diagnose and control the fault tolerance and malfunction state of the innovation network, to improve the stable operation level of the cooperative innovation network. In addition, the result of the control test shows that the FCFCM-MLP performs well in prediction and control on real datasets. Applying the proposed model to more nonlinear systems with a small number of data samples is also an ongoing research issue.
The resource allocation efficiency of the industry–university–research cooperation innovation network has been continuously improved, and there is still great development potential. Optimizing the distribution of innovation resources means achieving the most of resources by provoking the initiative and creativity of universities, enterprises, and scientific research institutes, maximizing their innovation potentials, strengthening the leading position of the government, and improving the resource availability and input–output ratio.
The feedforward–feedback control theoretical model lays a foundation for policy-making of reasonable resource allocation. On the one hand, innovation resources, which have been estimated by regular procedures and a scientific mechanism based on future output prediction, can be invested directly and efficiently to R&D activities, aiming for the most scientific output with limited resource input. On the other hand, the model provides a reference for the government on deciding resource input control to improve output in the future.
Author Contributions
Conceptualization, R.Z.; methodology, R.Z. and D.W. and C.H..; validation, Y.L.; formal analysis, D.W. and C.H.; investigation, R.Z., C.H. and G.F.; resources, R.Z.; data curation, D.W. and Y.L.; writing—original draft preparation, R.Z.; writing—review and editing, R.Z., D.W., C.H. and G.F.; visualization, Y.L.; supervision, G.F.; project administration, Y.L.; funding acquisition, D.W., C.H. and R.Z. All authors have read and agreed to the published version of the manuscript.
Funding
This research was funded by National Natural Science Foundation of China, grant number 62202111 and 71801059; Pandeng Project of Guangdong Province, grant number pdjh2022b0417; Philosophy and Social Science Foundation of Guangdong Province, grant number GD22CGL22; Guangdong Basic and Applied Basic Research Foundation, grant number 2021A1515011939.
Institutional Review Board Statement
Not applicable.
Informed Consent Statement
Not applicable.
Data Availability Statement
The datasets used and/or analyzed during the current study are available from the corresponding author on reasonable request.
Conflicts of Interest
It is declared by the authors that this article is free of conflicts of interest.
References
- Li, H.Y. Research on Coordinated Development of Technological Innovation Ecosystem; Central South University: Changsha, China, 2014. [Google Scholar]
- Cao, X.; Liu, G.W. Collaborative evolution path of industry university research cooperative innovation network under the guidance of resource allocation. J. Syst. Manag. 2015, 24, 769–777. [Google Scholar]
- Chen, F.; Jin, Z.; Wang, E.; Wang, L.; Jiang, Y.; Guo, P.; Guo, X.; He, X. Relationship model between surface strain of concrete and expansion force of reinforcement rust. Sci. Rep. 2021, 11, 4208. [Google Scholar] [CrossRef] [PubMed]
- Chen, F.X.; Zhong, Y.C.; Gao, X.Y.; Jin, Z.Q.; Wang, E.D.; Zhu, F.P.; Shao, X.X.; He, X.Y. Non-uniform Model of Relationship Between Surface Strain and Rust Expansion Force of Reinforced Concrete. Sci. Rep. 2020, 11, 8741. [Google Scholar] [CrossRef] [PubMed]
- Cao, Q.W.; Duan, W.C. Paradox of scale economies and multi-dimensional performance analysis in scientific research. Sci. Res. 2021, 3, 1–19. [Google Scholar]
- Yang, X.J. Analysis on the allocation optimization of resources for the integration of industry, university and research in universities. Cult. Educ. Mater. 2008, 24, 129–131. [Google Scholar]
- Wu, M.; Zhang, B.; Zhou, Y.; Huang, K. A Double-Fold 7×8 Butler Matrix-Fed Multibeam Antenna with a Boresight Beam for 5G Applications. IEEE Antennas Wirel. Propag. Lett. 2022, 21, 516–520. [Google Scholar] [CrossRef]
- Cao, J.H. ADRC of Ship Course and its Parameter Optimization; Dalian Maritime University: Dalian, China, 2020. [Google Scholar]
- Jiang, Y.; Li, X. Broadband cancellation method in an adaptive co-site interference cancellation system. Int. J. Electron. 2022, 109, 854–874. [Google Scholar] [CrossRef]
- Meng, Q.; Ma, Q.; Zhou, G. Adaptive Output Feedback Control for Stochastic Uncertain Nonlinear Time-delay Systems. IEEE Trans. Circuits Syst. II Express Briefs 2022, 69, 3289–3293. [Google Scholar] [CrossRef]
- Zheng, Y. Research on Prediction-Control Model of Hydropower Unit Regulation System; Huazhong University of Science and Technology: Wuhan, China, 2018. [Google Scholar]
- Sahoo, H.K.; Dash, P.K.; Rath, N.P. NARX model based nonlinear dynamic system identification using low complexity neural networks and robust H∞ Filter. Appl. Soft Comput. 2013, 13, 3324–3334. [Google Scholar] [CrossRef]
- Xi, Y.; Jiang, W.; Wei, K.; Hong, T.; Cheng, T.; Gong, S. Wideband RCS Reduction of Microstrip Antenna Array Using Coding Metasurface with Low Q Resonators and Fast Optimization Method. IEEE Antennas Wirel. Propag. Lett. 2022, 21, 656–660. [Google Scholar] [CrossRef]
- Hong, T.; Guo, S.; Jiang, W.; Gong, S. Highly Selective Frequency Selective Surface with Ultrawideband Rejection. IEEE Trans. Antennas Propag. 2022, 70, 3459–3468. [Google Scholar] [CrossRef]
- Xu, K.; Weng, X.; Li, J.; Guo, Y.; Wu, R.; Cui, J.; Chen, Q. 60-GHz third-order on-chip bandpass filter using GaAs pHEMT technology. Semicond. Sci. Technol. 2022, 37, 055004. [Google Scholar] [CrossRef]
- Zhou, T.H.; Zhu, C.S. Design of Robust Output Controller for an Active Magnetic Bearing High-speed Motor Rigid Rotor System Based on Eigenstructure Assignment. Proc. CSEE 2022, 42, 3775–3785. [Google Scholar]
- Mao, Y.Z.; Feng, Z.Y.; Guo, H.R. Static output feedback control of vehicle’s active front wheel steering considering multi-performance constraints. J. Shanghai Jiaotong Univ. 2022, 2, 156–164. [Google Scholar] [CrossRef]
- Wu, Z.L.; Huo, B.Y.; Qin, Y.H.; Liu, Y.H.; Li, D.H. Conditional feedback control of limb rehabilitation system based on functional electricity stimulation. Control. Theory Appl. 2022, 39, 1079–1087. [Google Scholar]
- Zuo, Y.; Dai, C.H.; Guo, A.; Chen, W.R. PEMFC air supply regulation system based on improved EKF algorithm and stack power demand. Proc. CSEE 2021, 41, 6550–6560. [Google Scholar]
- Pizarro-Lerma, A.; Santibañez, V.; Garcia-Hernandez, R.; Villalobos-Chin, J. Sectorial fuzzy controller plus feedforward for the trajectory tracking of robotic arms in joint space. Mathematics 2021, 9, 616. [Google Scholar] [CrossRef]
- Niu, Z.; Zhang, B.; Dai, B.; Zhang, J.; Shen, F.; Hu, Y.; Zhang, Y. 220 GHz Multi Circuit Integrated Front End Based on Solid-State Circuits for High Speed Communication System. Chin. J. Electron. 2022, 31, 569–580. [Google Scholar] [CrossRef]
- Cao, Z.; Wang, Y.; Zheng, W.; Yin, L.; Tang, Y.; Miao, W.; Yang, B. The algorithm of stereo vision and shape from shading based on endoscope imaging. Biomed. Signal Process. Control. 2022, 76, 103658. [Google Scholar] [CrossRef]
- Sabahi, K.; Ghaemi, S.; Pezeshki, S. Application of type-2 fuzzy logic system for load frequency control using feedback error learning approaches. Appl. Soft Comput. 2014, 21, 1–11. [Google Scholar] [CrossRef]
- Xie, Y.; Alleyne, A. Robust, Two Degree-of-freedom control for MIMO System with both model and signal uncertainties. IFAC Proc. Vol. 2014, 47, 9313–9320. [Google Scholar] [CrossRef]
- Wei, X.Y. Research on Core Patent Prediction from the Perspective of Technology Field Segmentation; Shanxi University: Taiyuan, China, 2018. [Google Scholar]
- Hu, Z.W.; Wu, Y.S. Analysis and prediction of influence factors of scientific and technological output—An approach based on multiple regression and BP neural network. Sci. Res. 2012, 30, 992–1004. [Google Scholar]
- Ma, C.; Zhou, D.Q.; Zhang, Y. BP neural network based on improved whale algorithm for water demand prediction. Comput. Sci. 2020, 47, 32–36. [Google Scholar]
- Zheng, W.; Zhou, Y.; Liu, S.; Tian, J.; Yang, B.; Yin, L. A Deep Fusion Matching Network Semantic Reasoning Model. Appl. Sci. 2022, 12, 3416. [Google Scholar] [CrossRef]
- Wang, J.; Tian, J.; Zhang, X.; Yang, B.; Liu, S.; Yin, L.; Zheng, W. Control of Time Delay Force Feedback Teleoperation System with Finite Time Convergence. Front. Neurorobot. 2022, 16, 877069. [Google Scholar] [CrossRef]
- Yang, J.; Liu, H.; Ma, K.; Yang, B.; Guerrero, M.J. An Optimization Strategy of Price and Conversion Factor Considering the Coupling of Electricity and Gas Based on Three-Stage Game. IEEE Trans. Autom. Sci. Eng. 2022, 1–14. [Google Scholar] [CrossRef]
- Ndofor, H.A.; Sirmon, D.G.; He, X.M. Firm resources, competitive actions and performance: Investigation a mediated model with evidence from the in-vitro diagnostics industry. Strateg. Manag. J. 2011, 23, 640–657. [Google Scholar] [CrossRef]
- Li, J.; Xu, K.; Chaudhuri, S.; Yumer, E.; Zhang, H.; Guibas, L. GRASS: Generative recursive autoencoders for shape structures. ACM Trans. Graph. 2017, 36, 1–14. [Google Scholar] [CrossRef]
- Lin, Y.; Song, H.; Ke, F.; Yan, W.; Liu, Z.; Cai, F. Optimal caching scheme in D2D networks with multiple robot helpers. Comput. Commun. 2022, 181, 132–142. [Google Scholar] [CrossRef]
Figure 1.
FCFCM-MLP control block diagram.
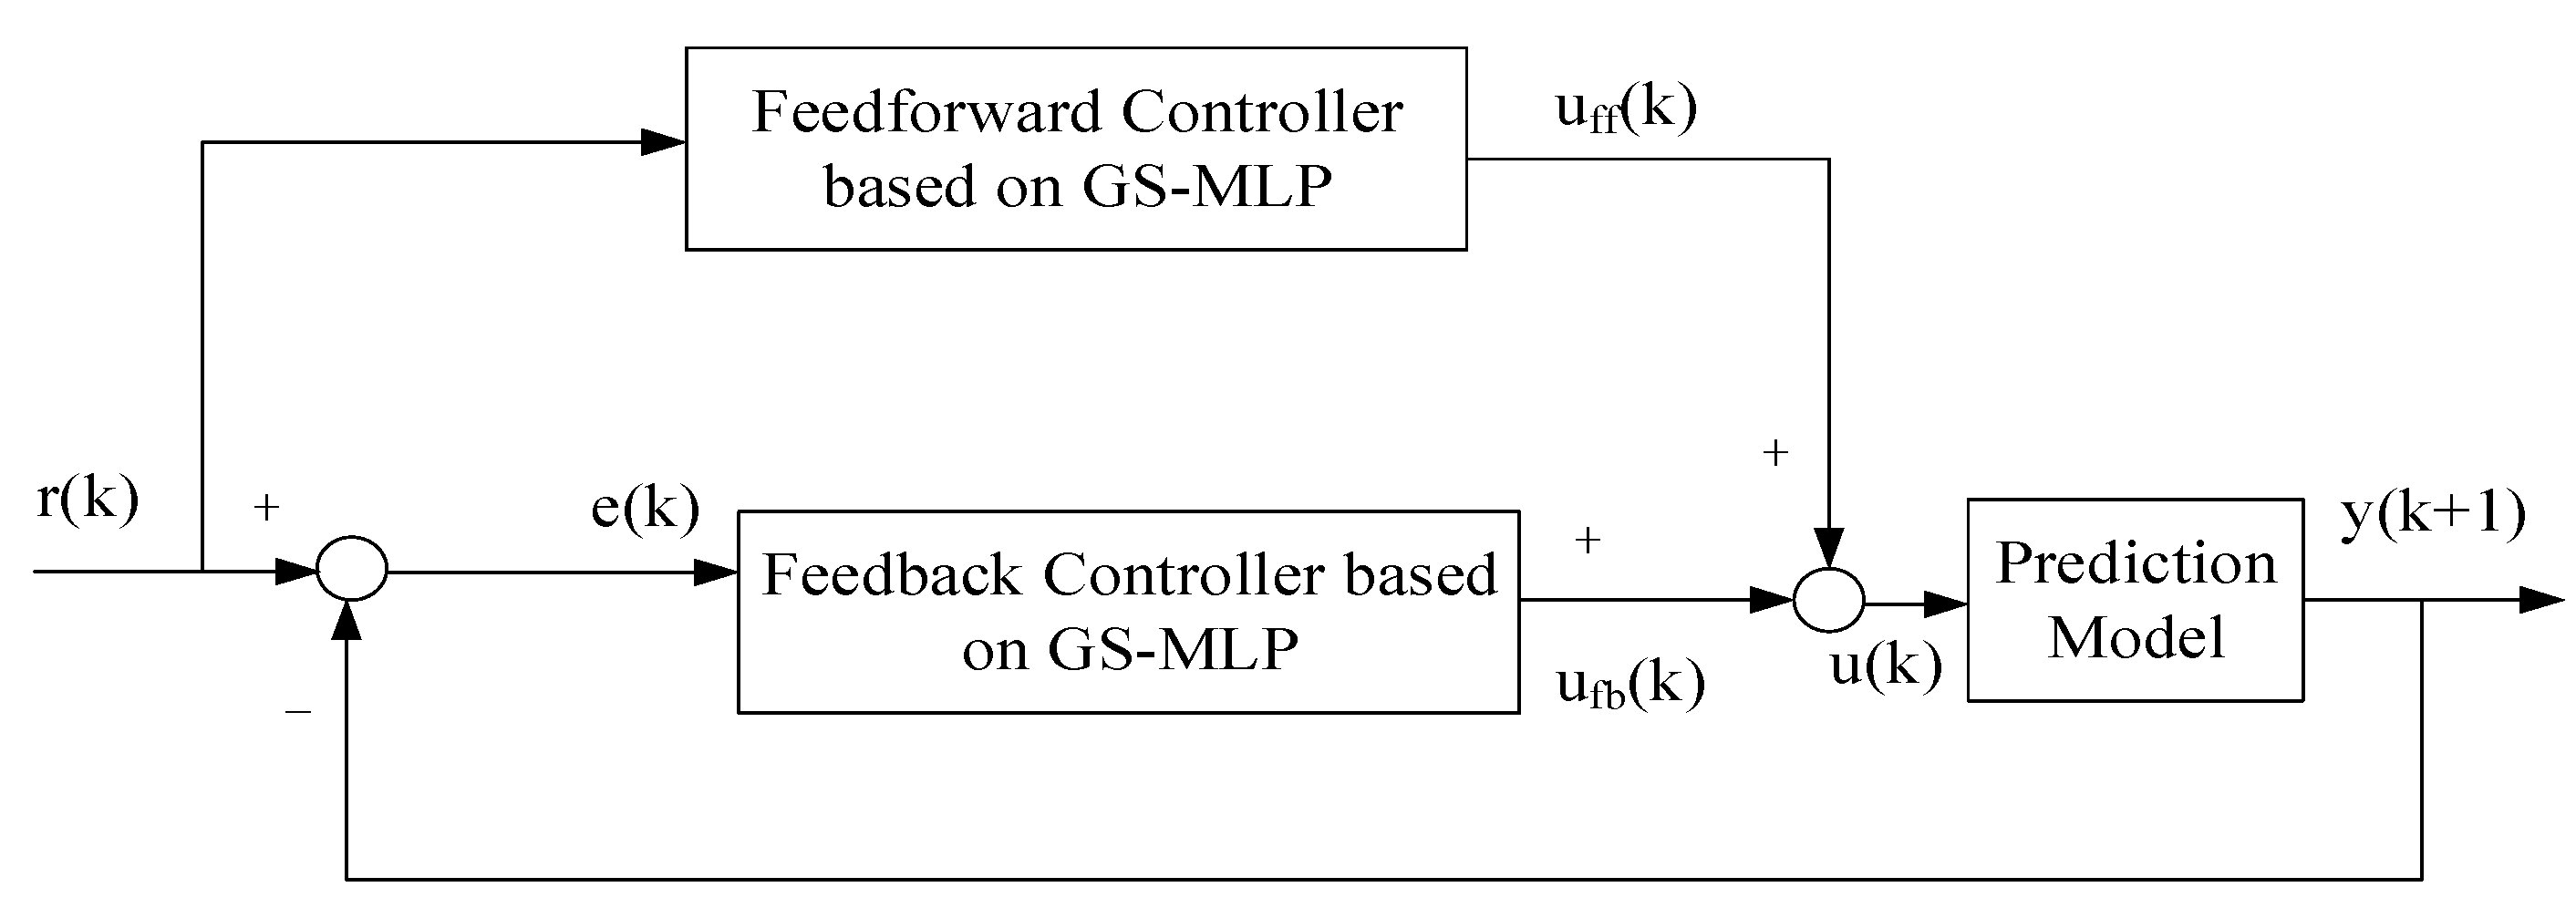
Figure 2.
A comparison of predicted values and real values of innovation output.
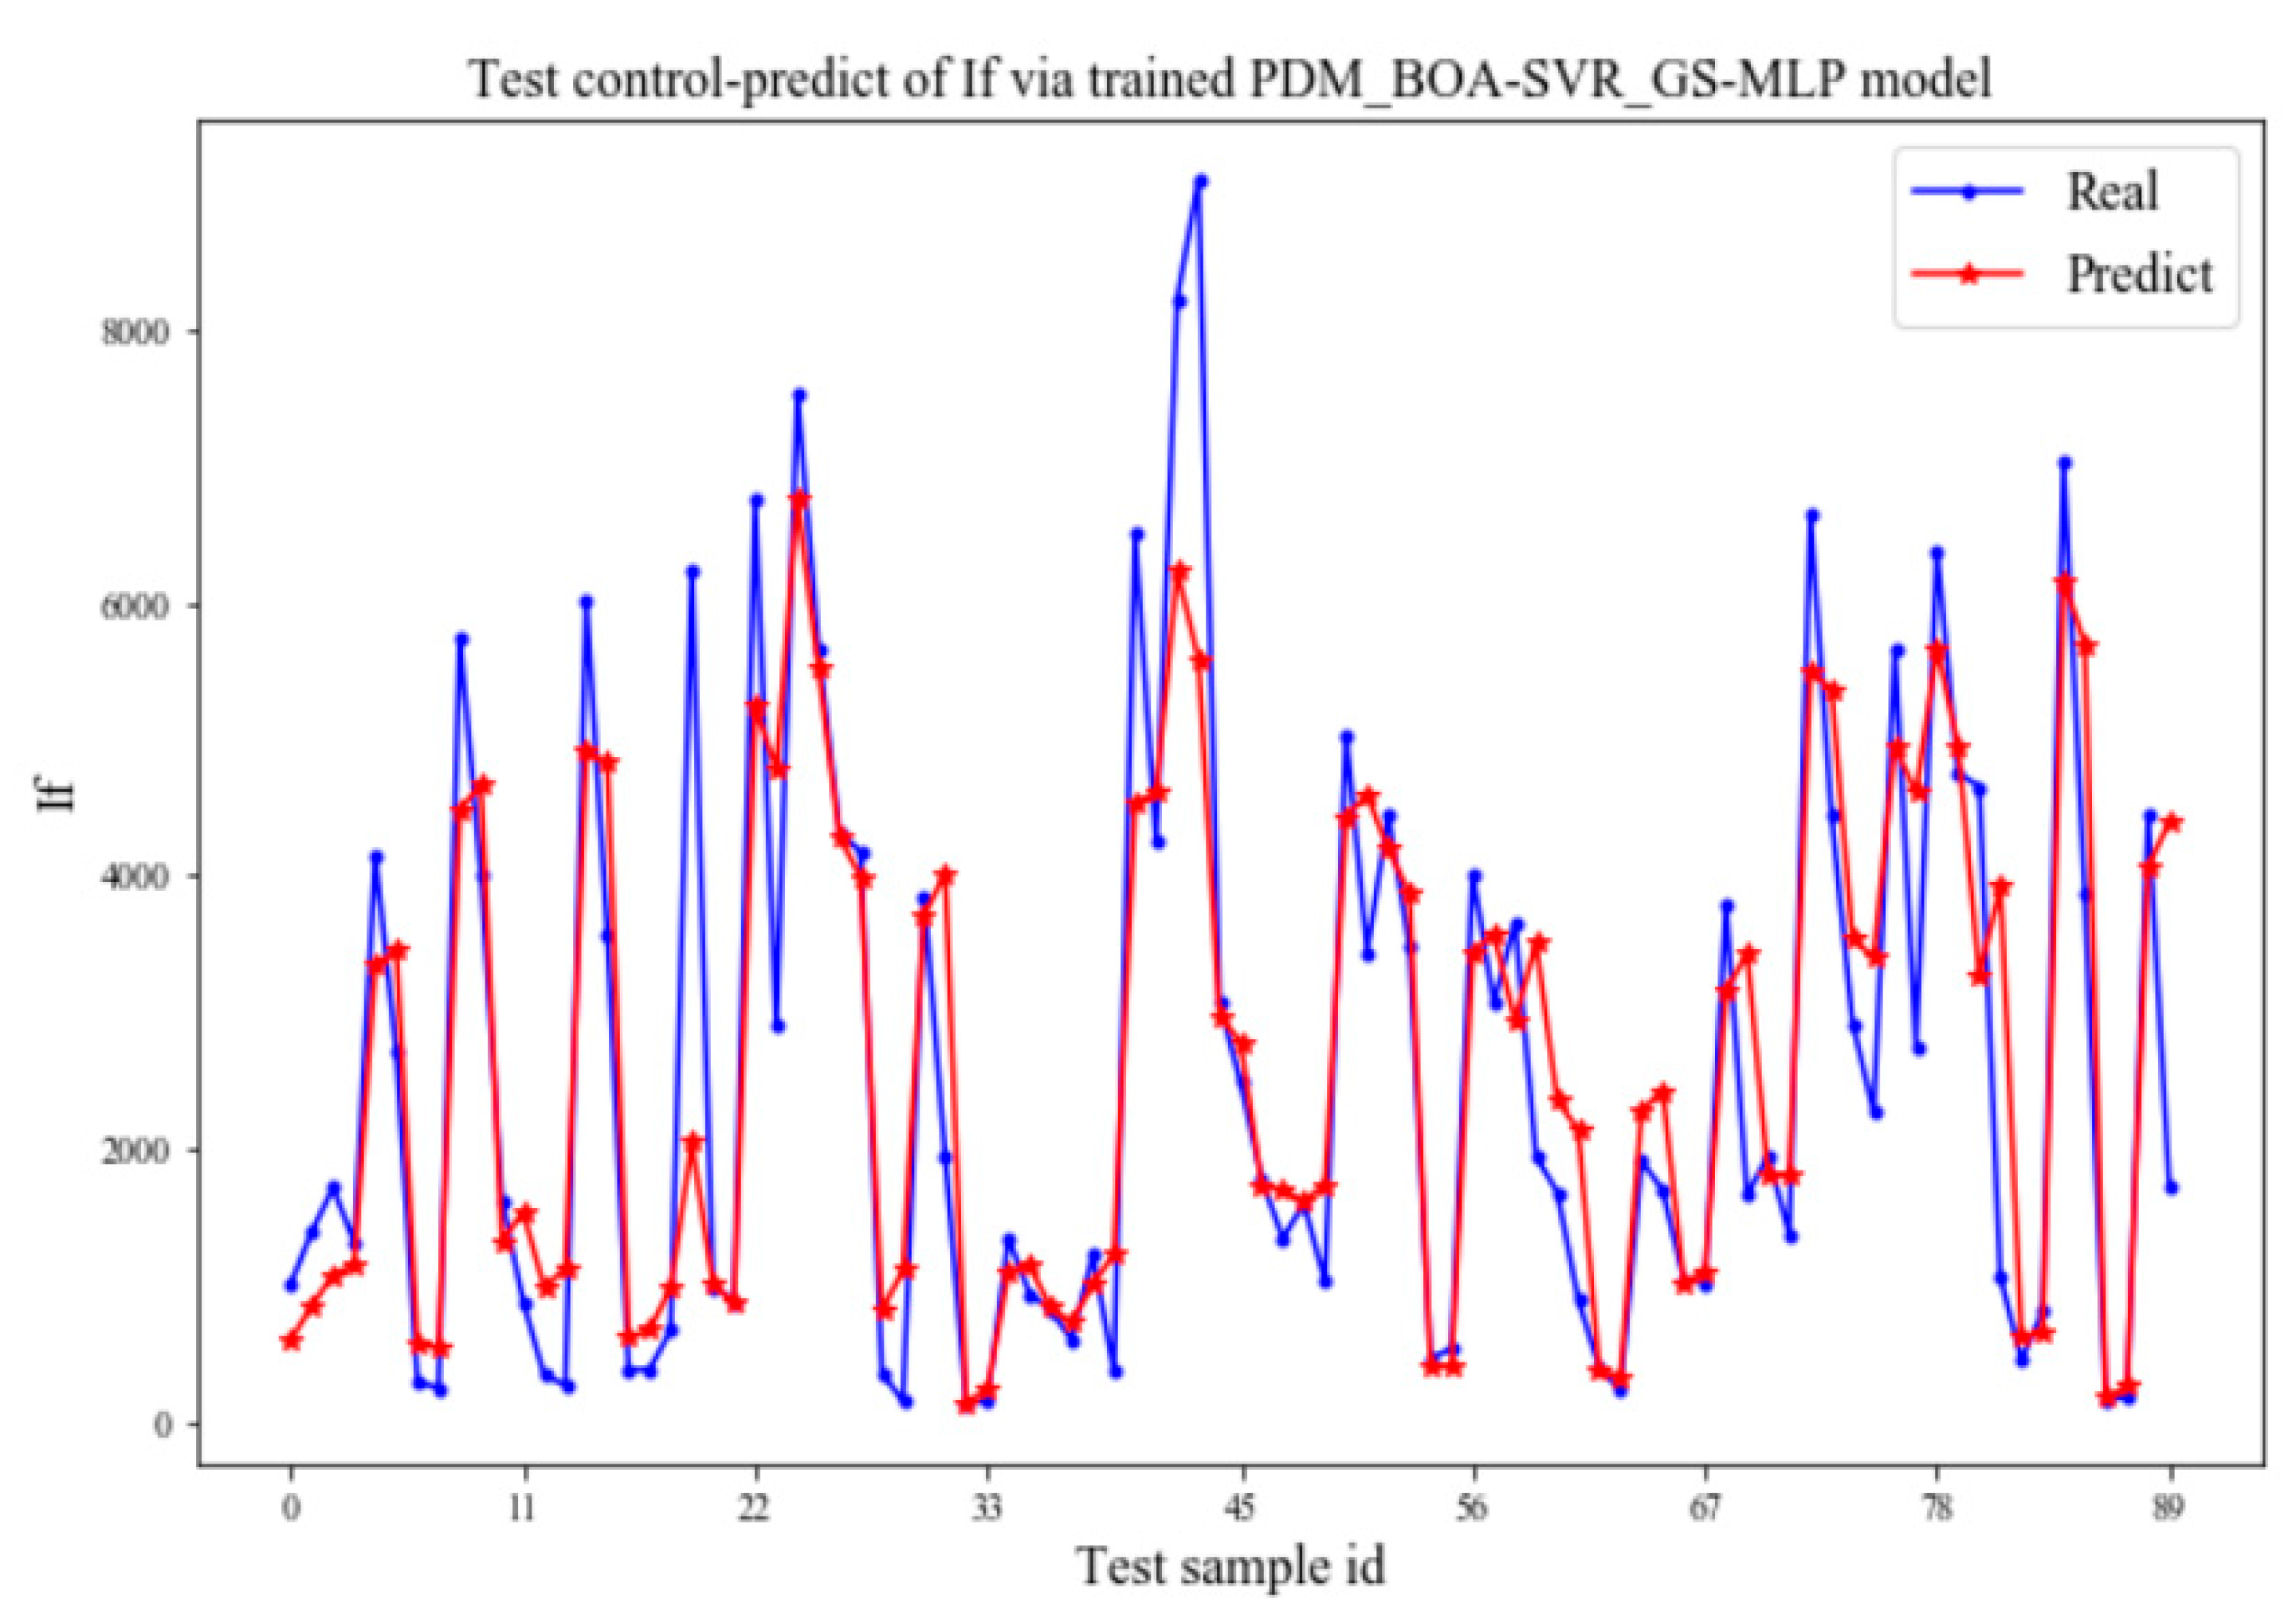
Figure 3.
Prediction performance of trained FBC of government capital input on the test set.
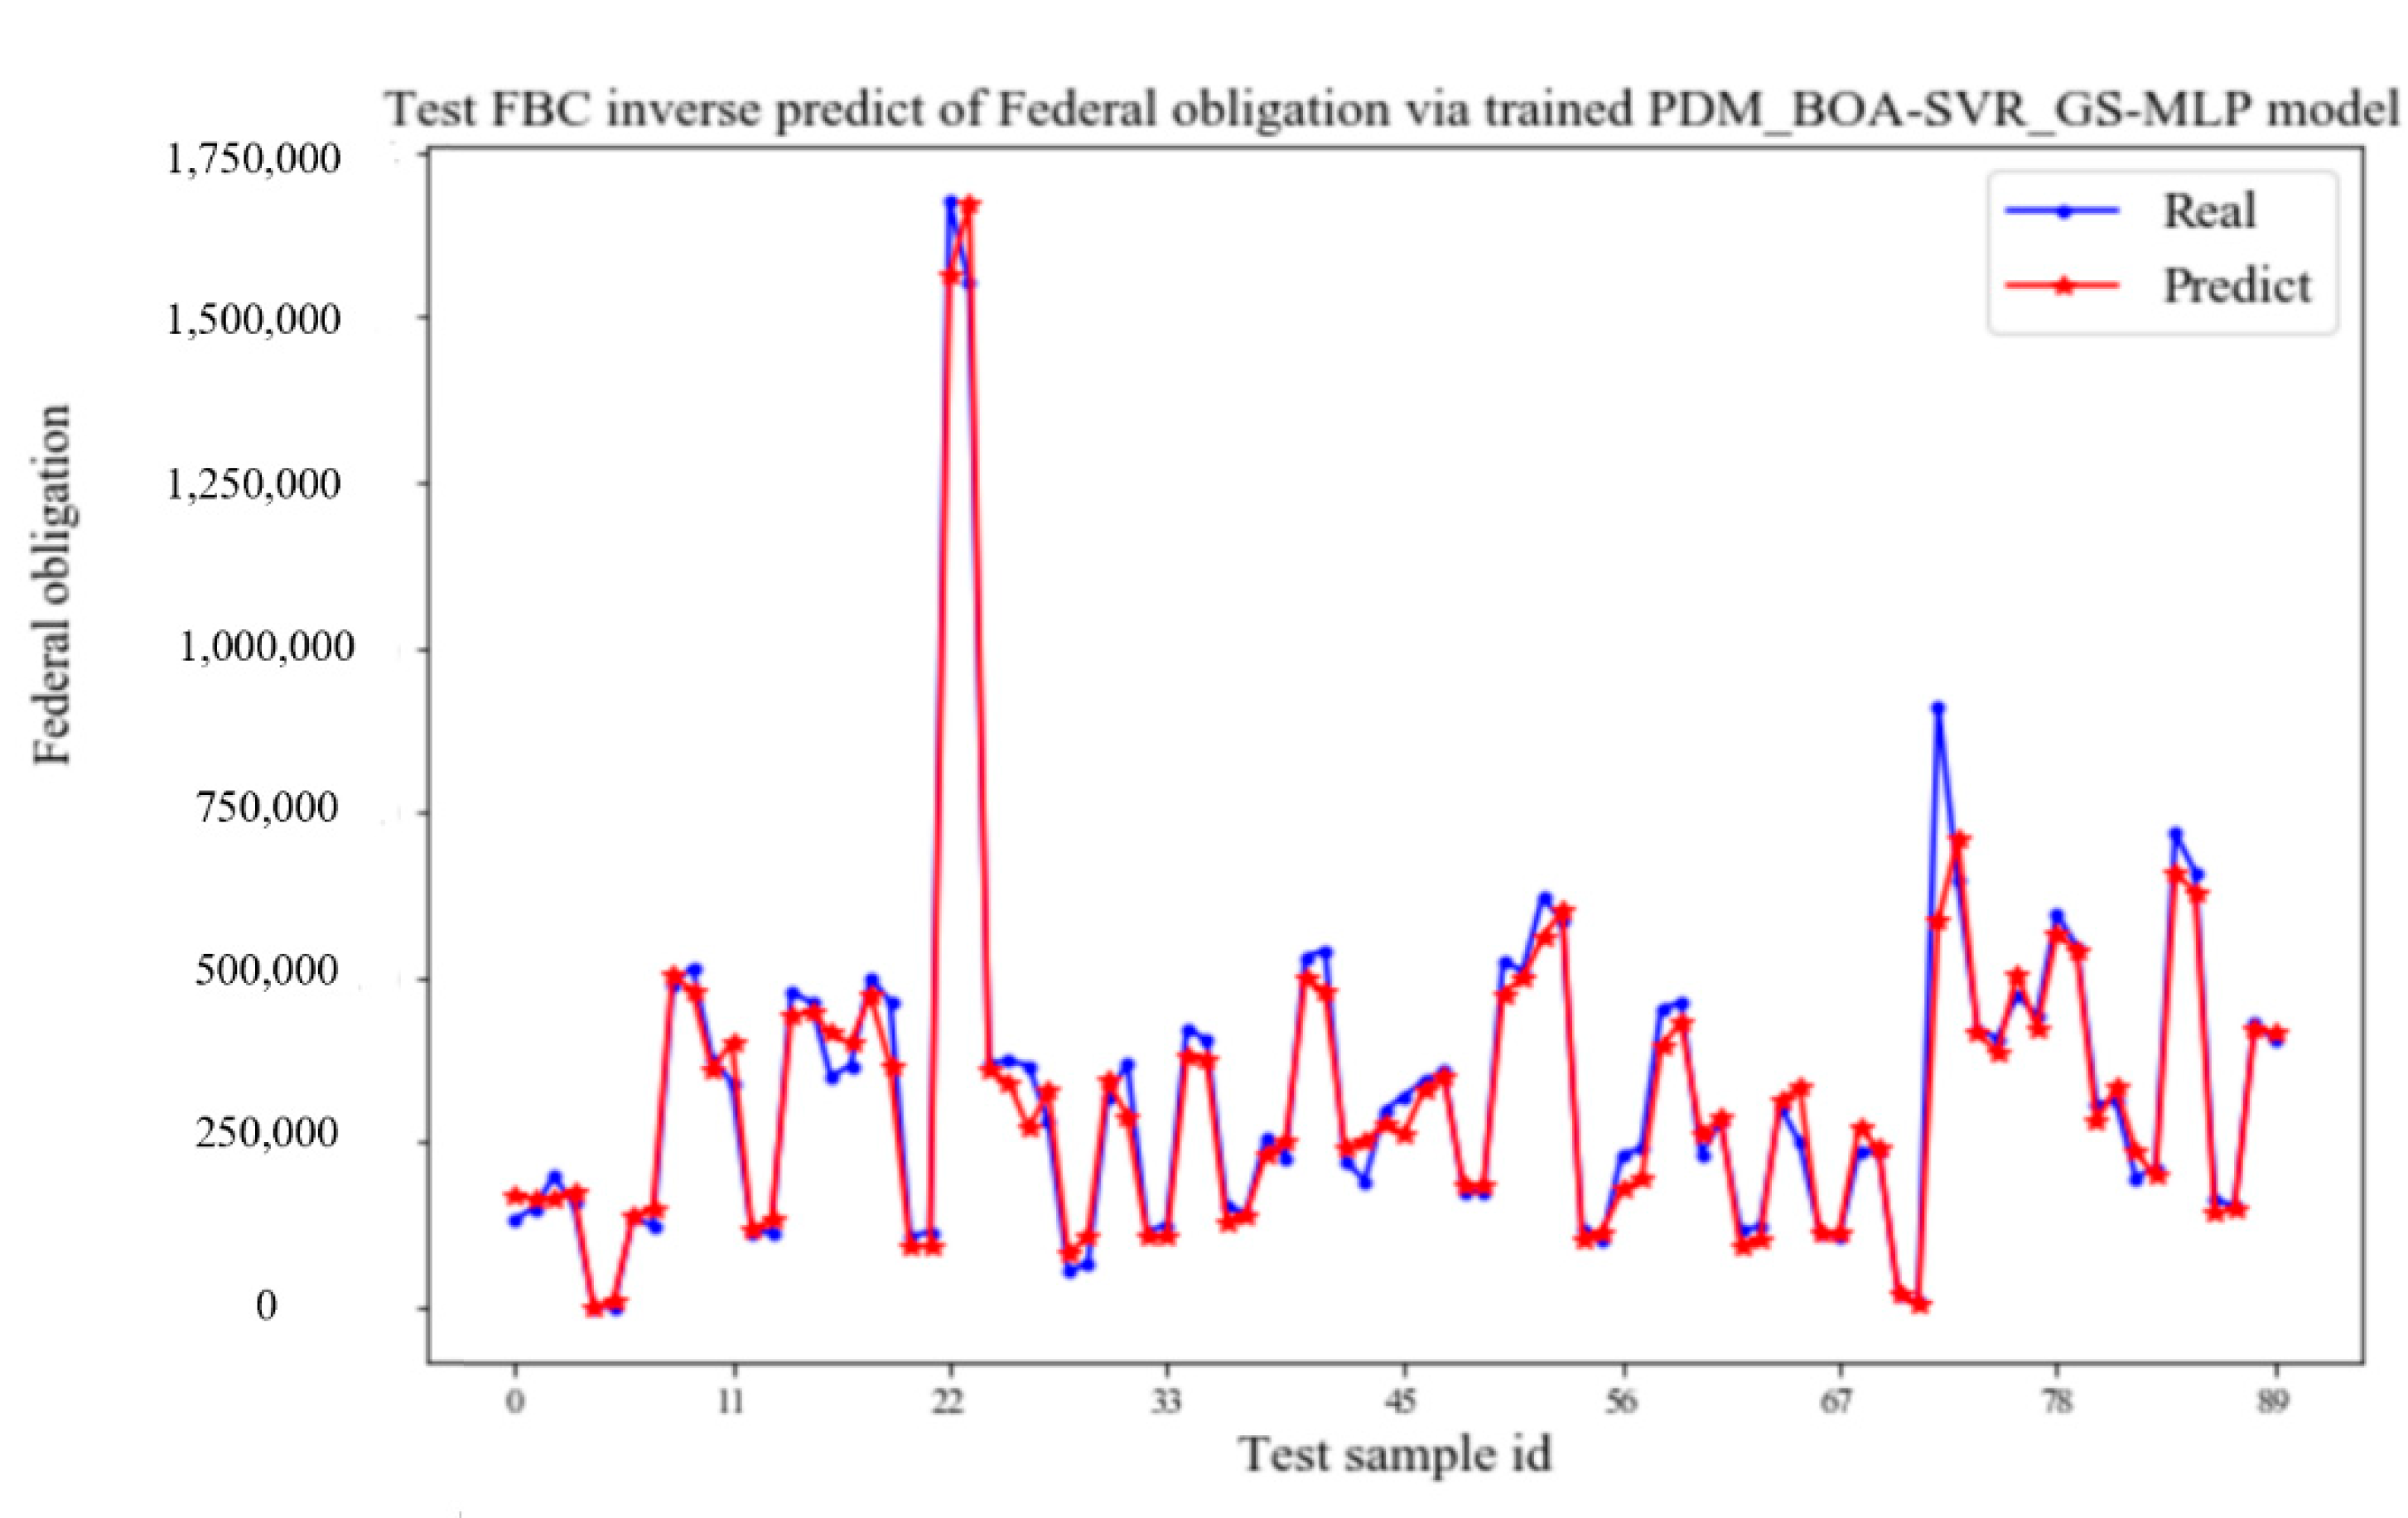
Figure 4.
Prediction performance of trained FBC of R&D expenditures on the test set.
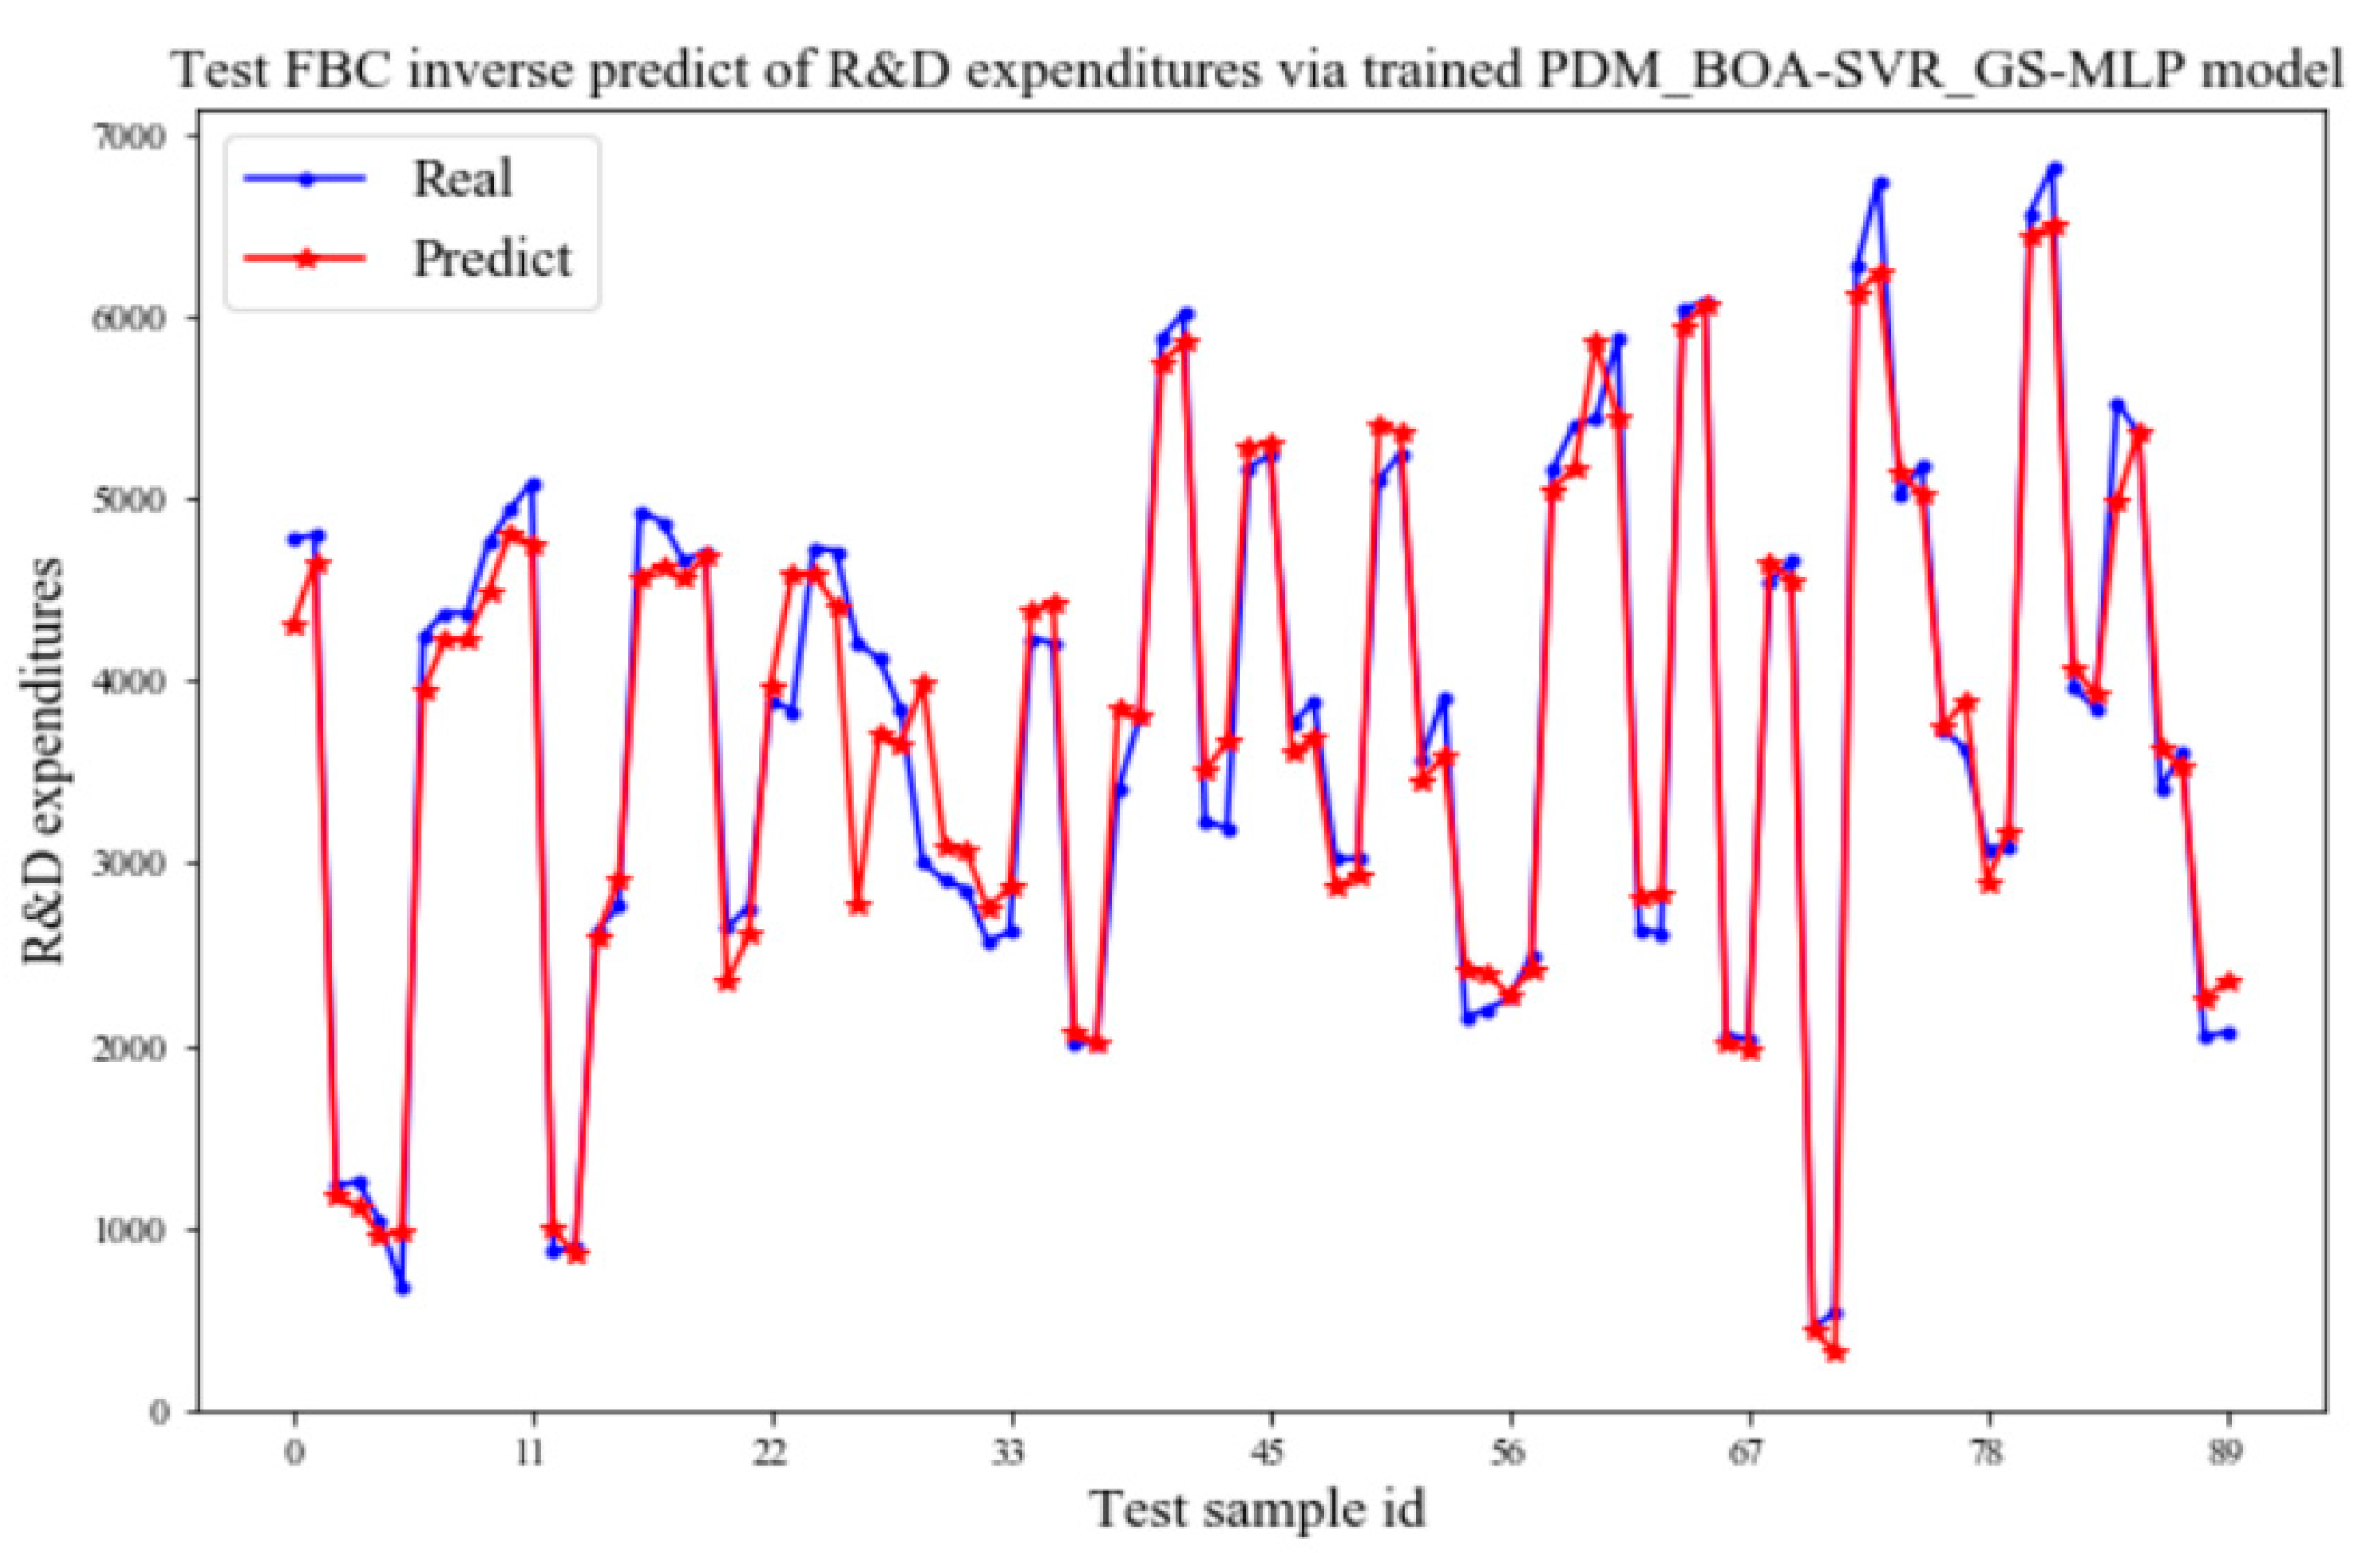
Figure 5.
Prediction performance of trained FBC of the number of postgraduates on the test set.
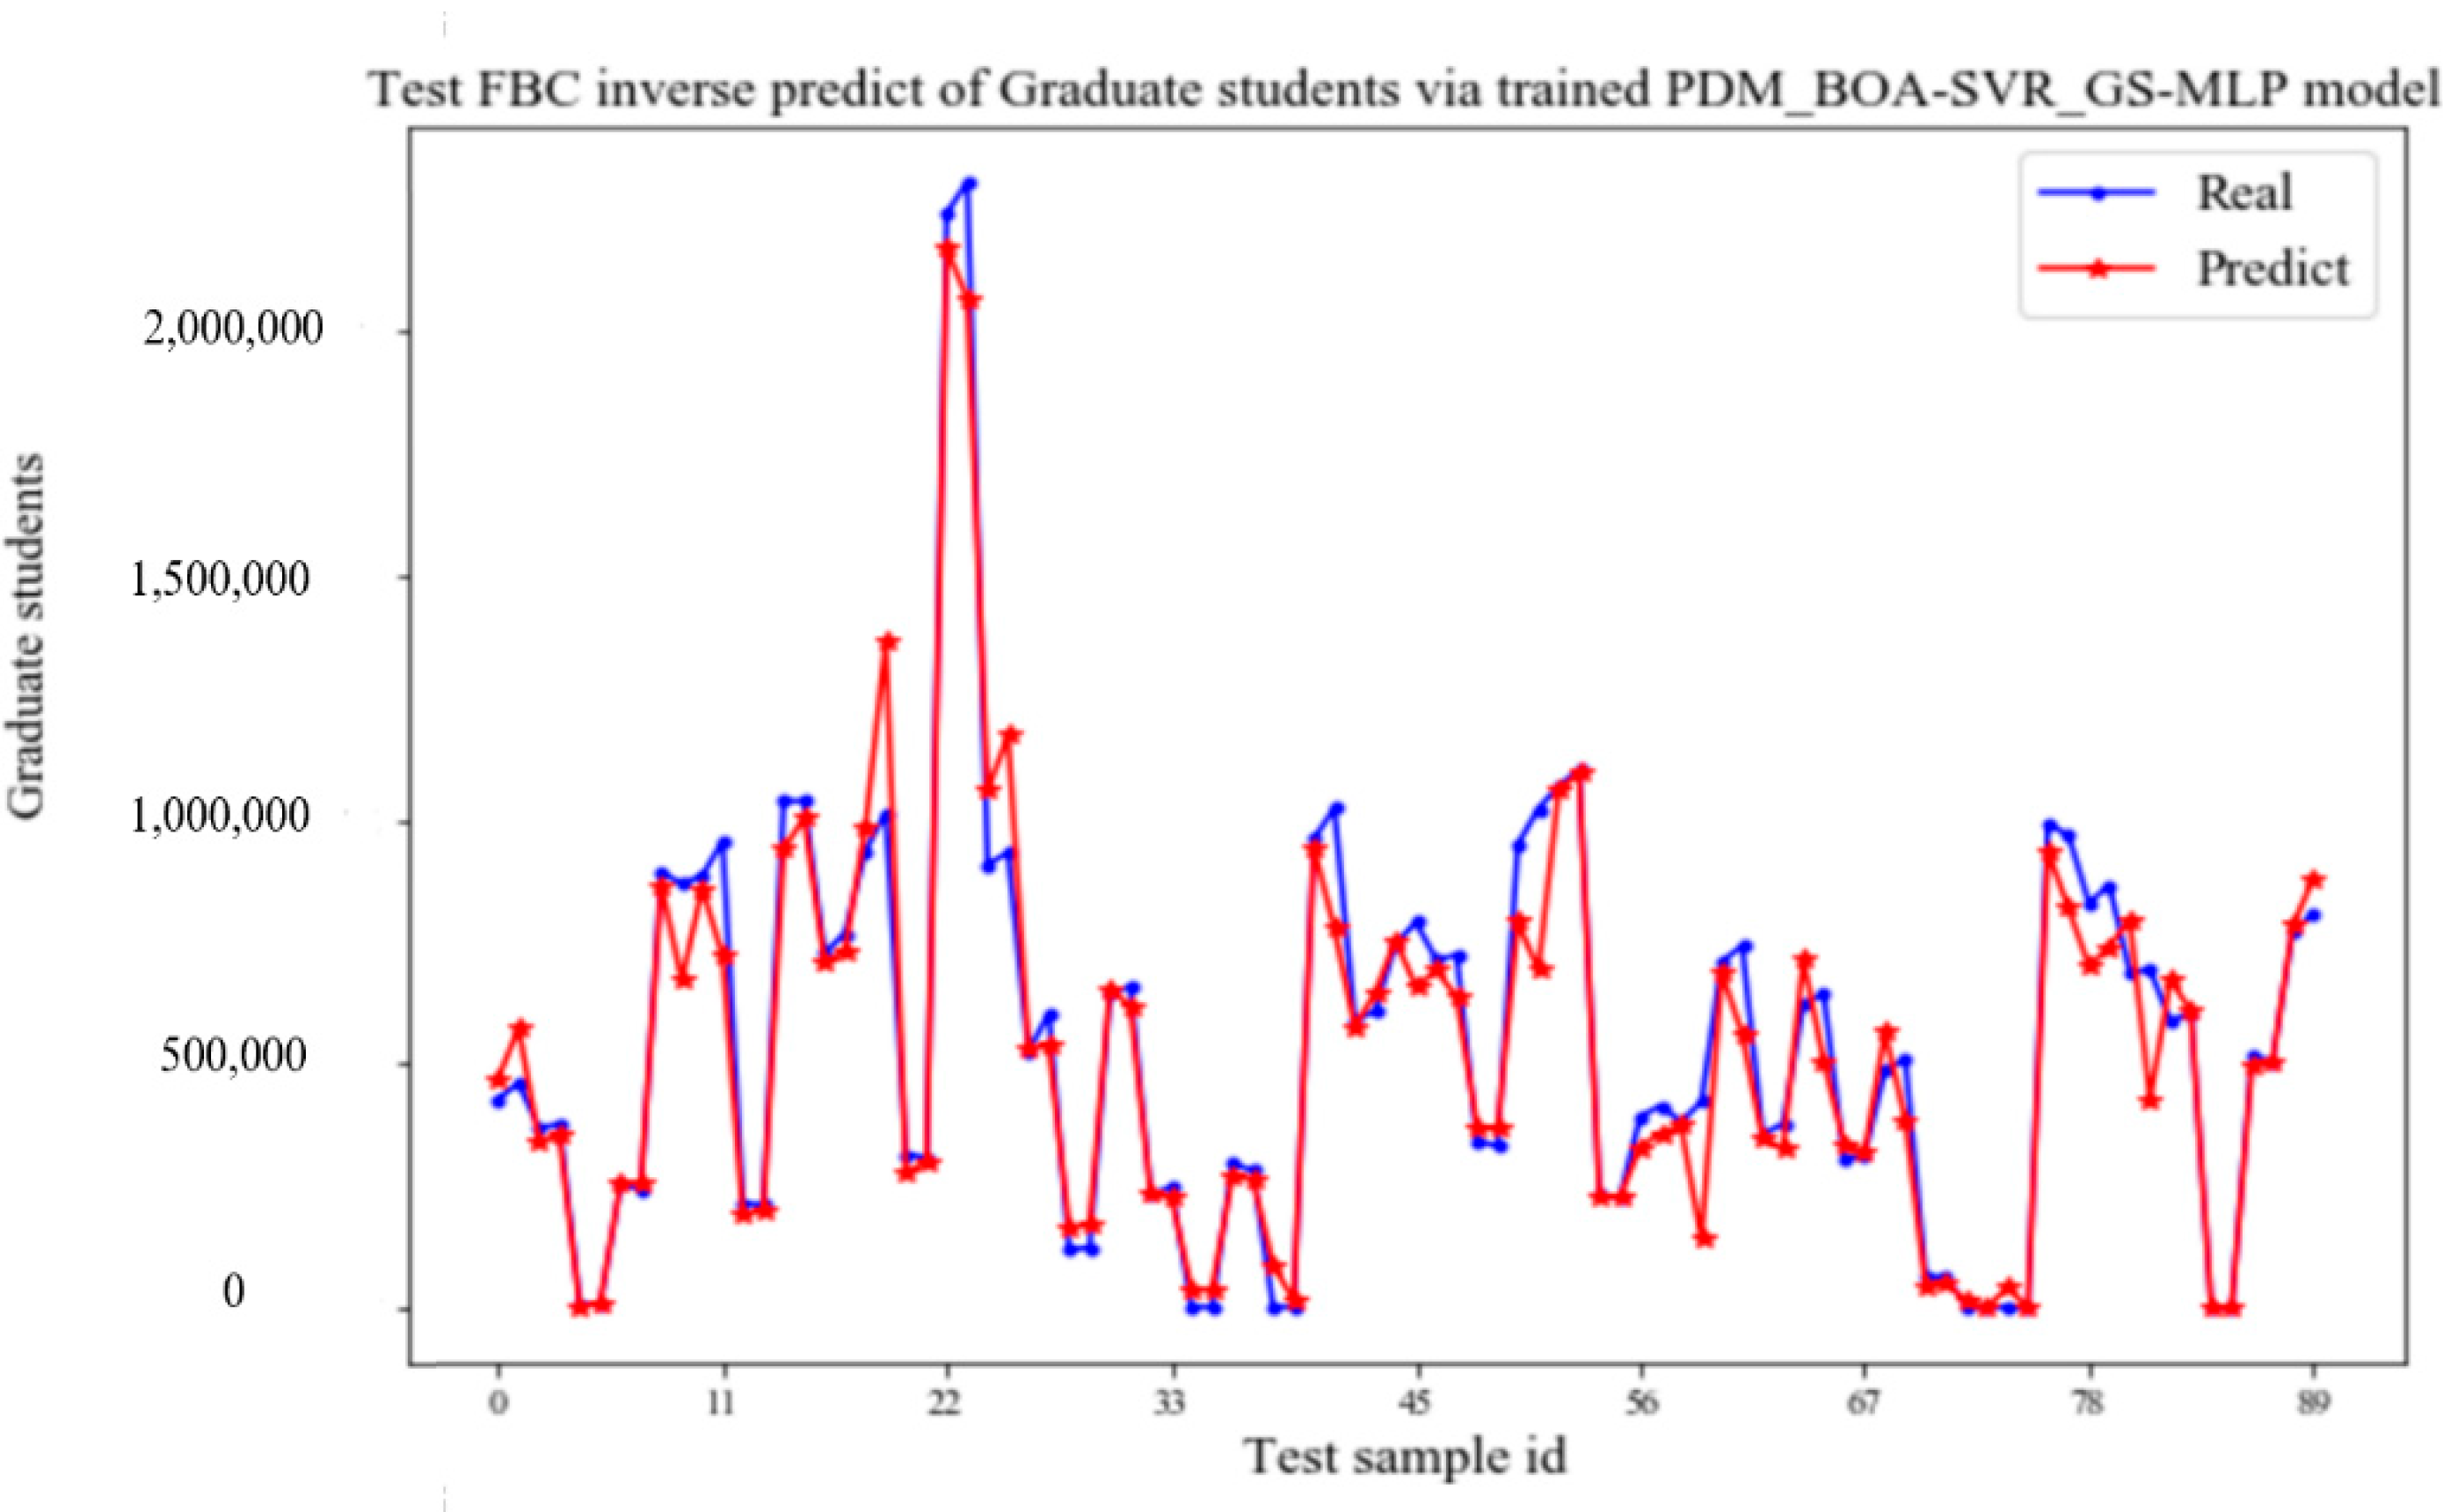
Figure 6.
Control performance of government capital input.
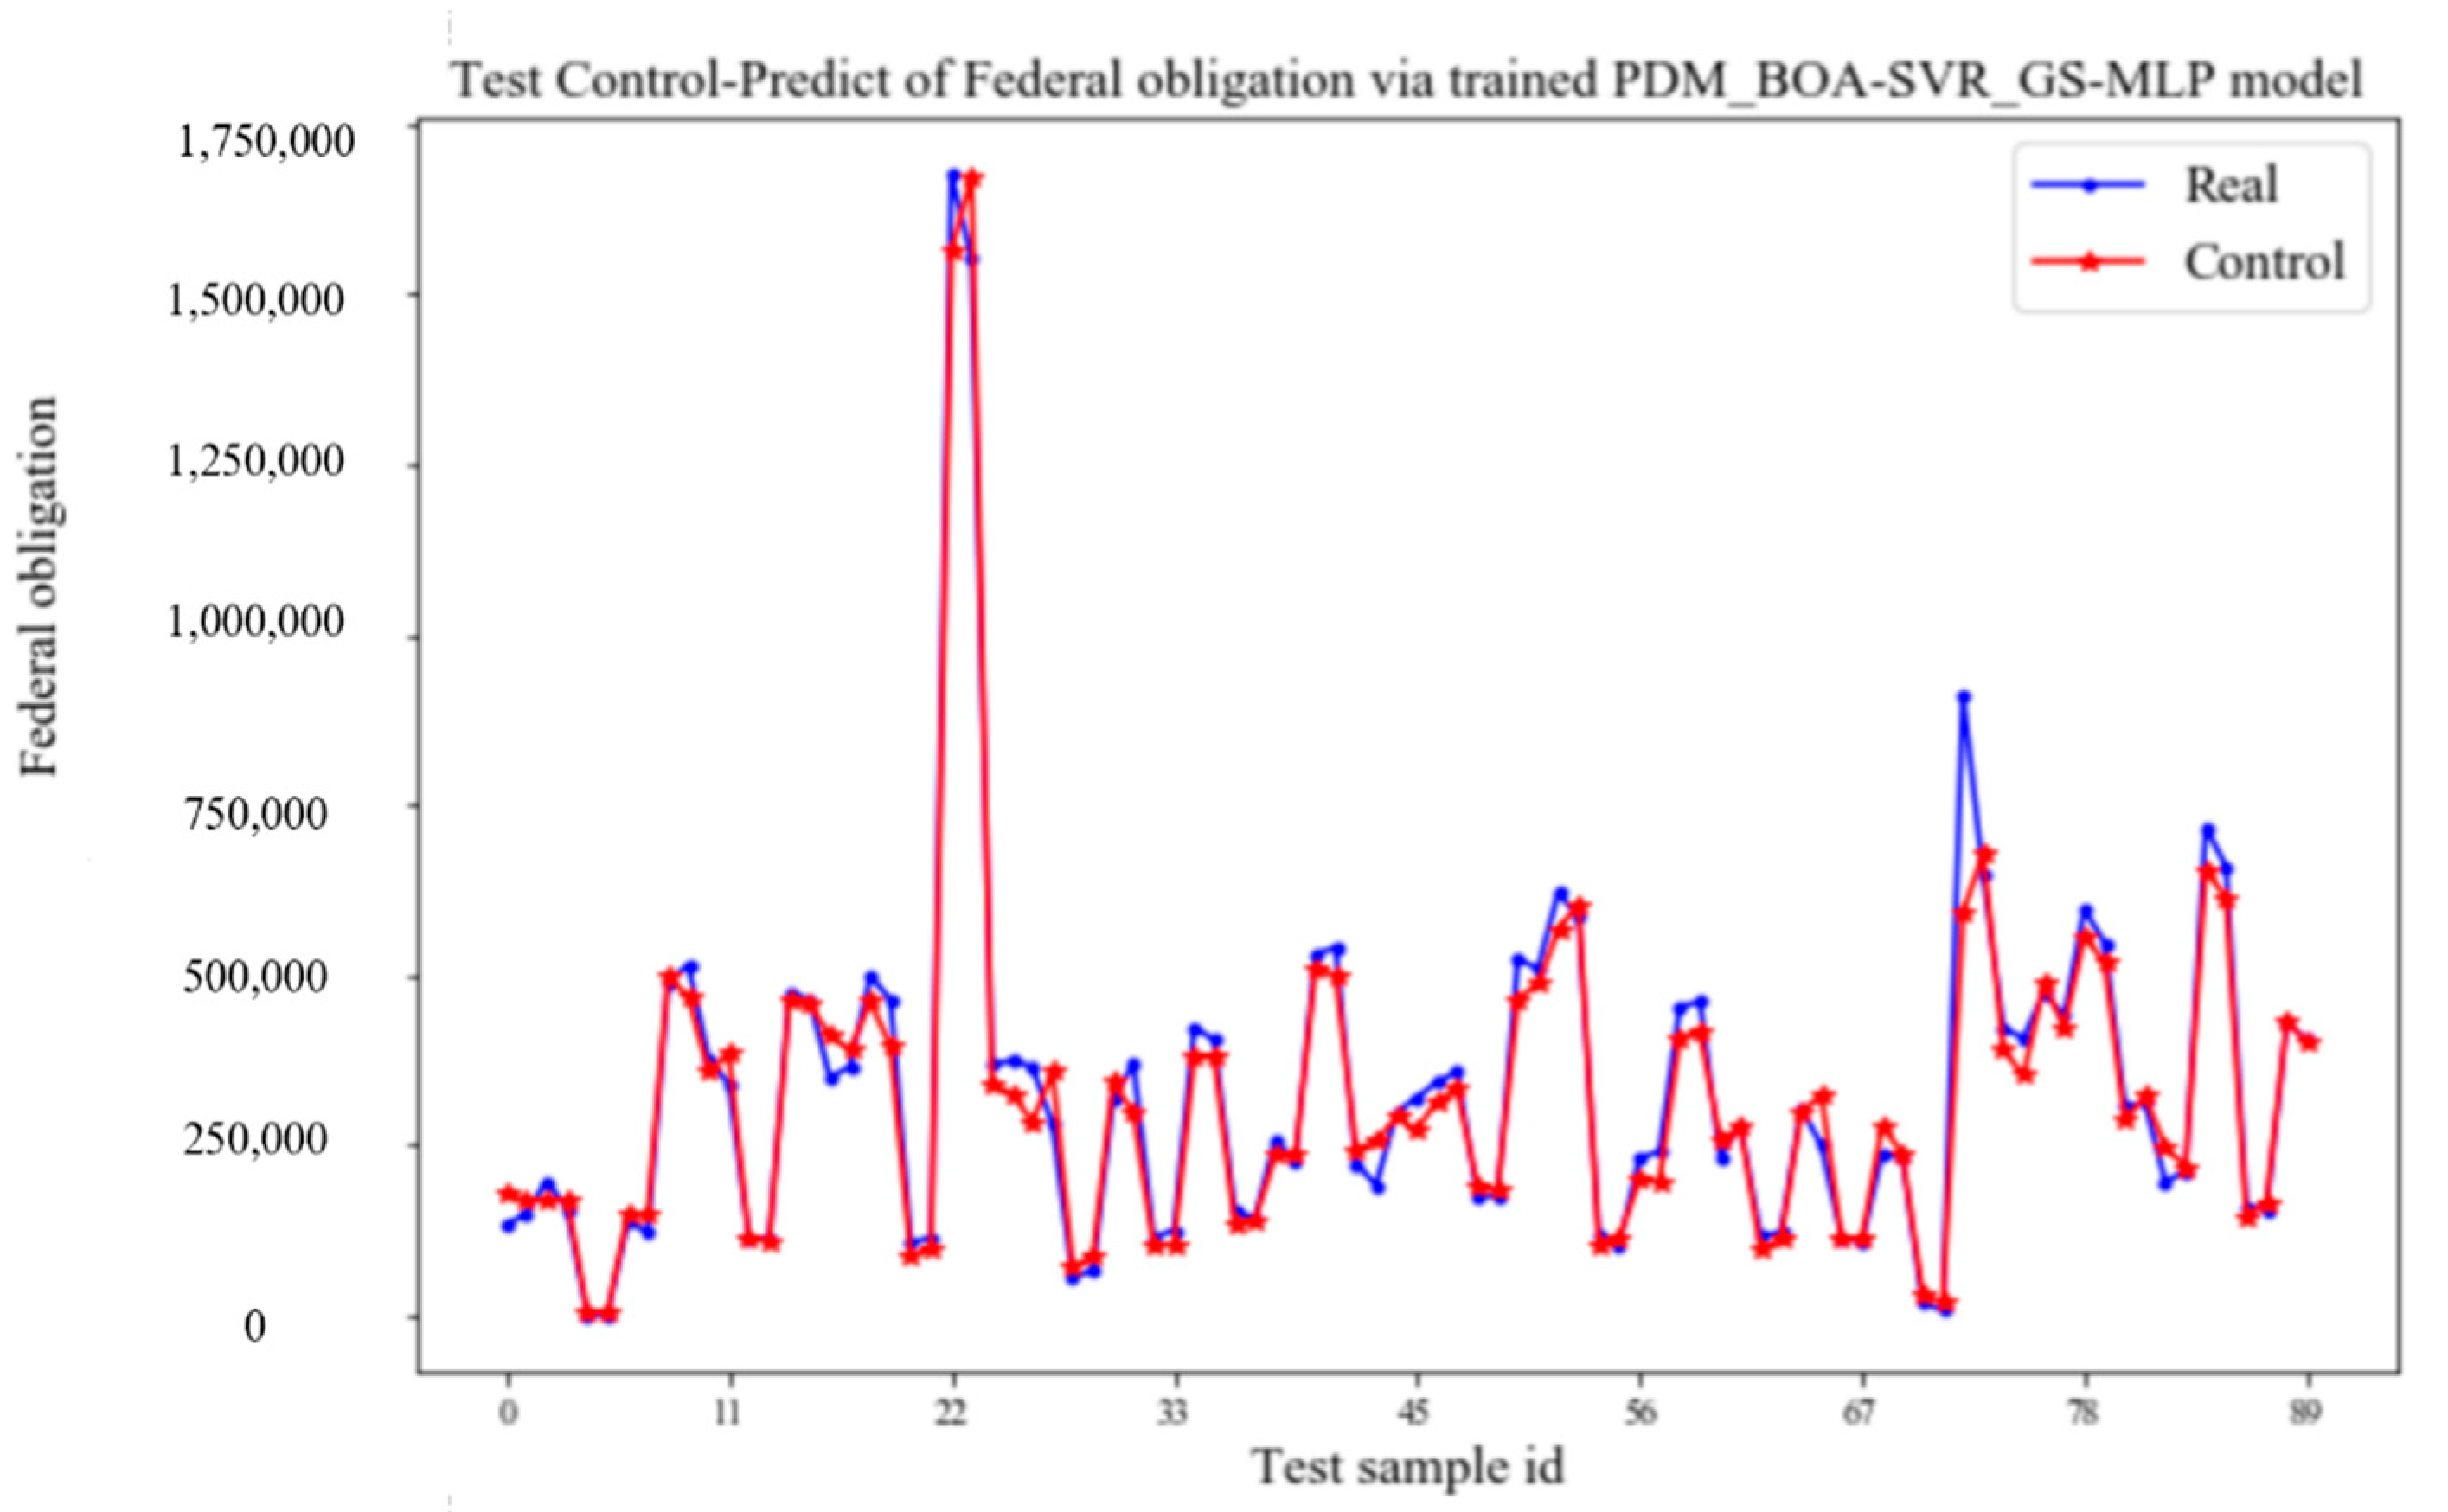
Figure 7.
Control performance of R&D expenditures.

Figure 8.
Control performance of the number of postgraduates.
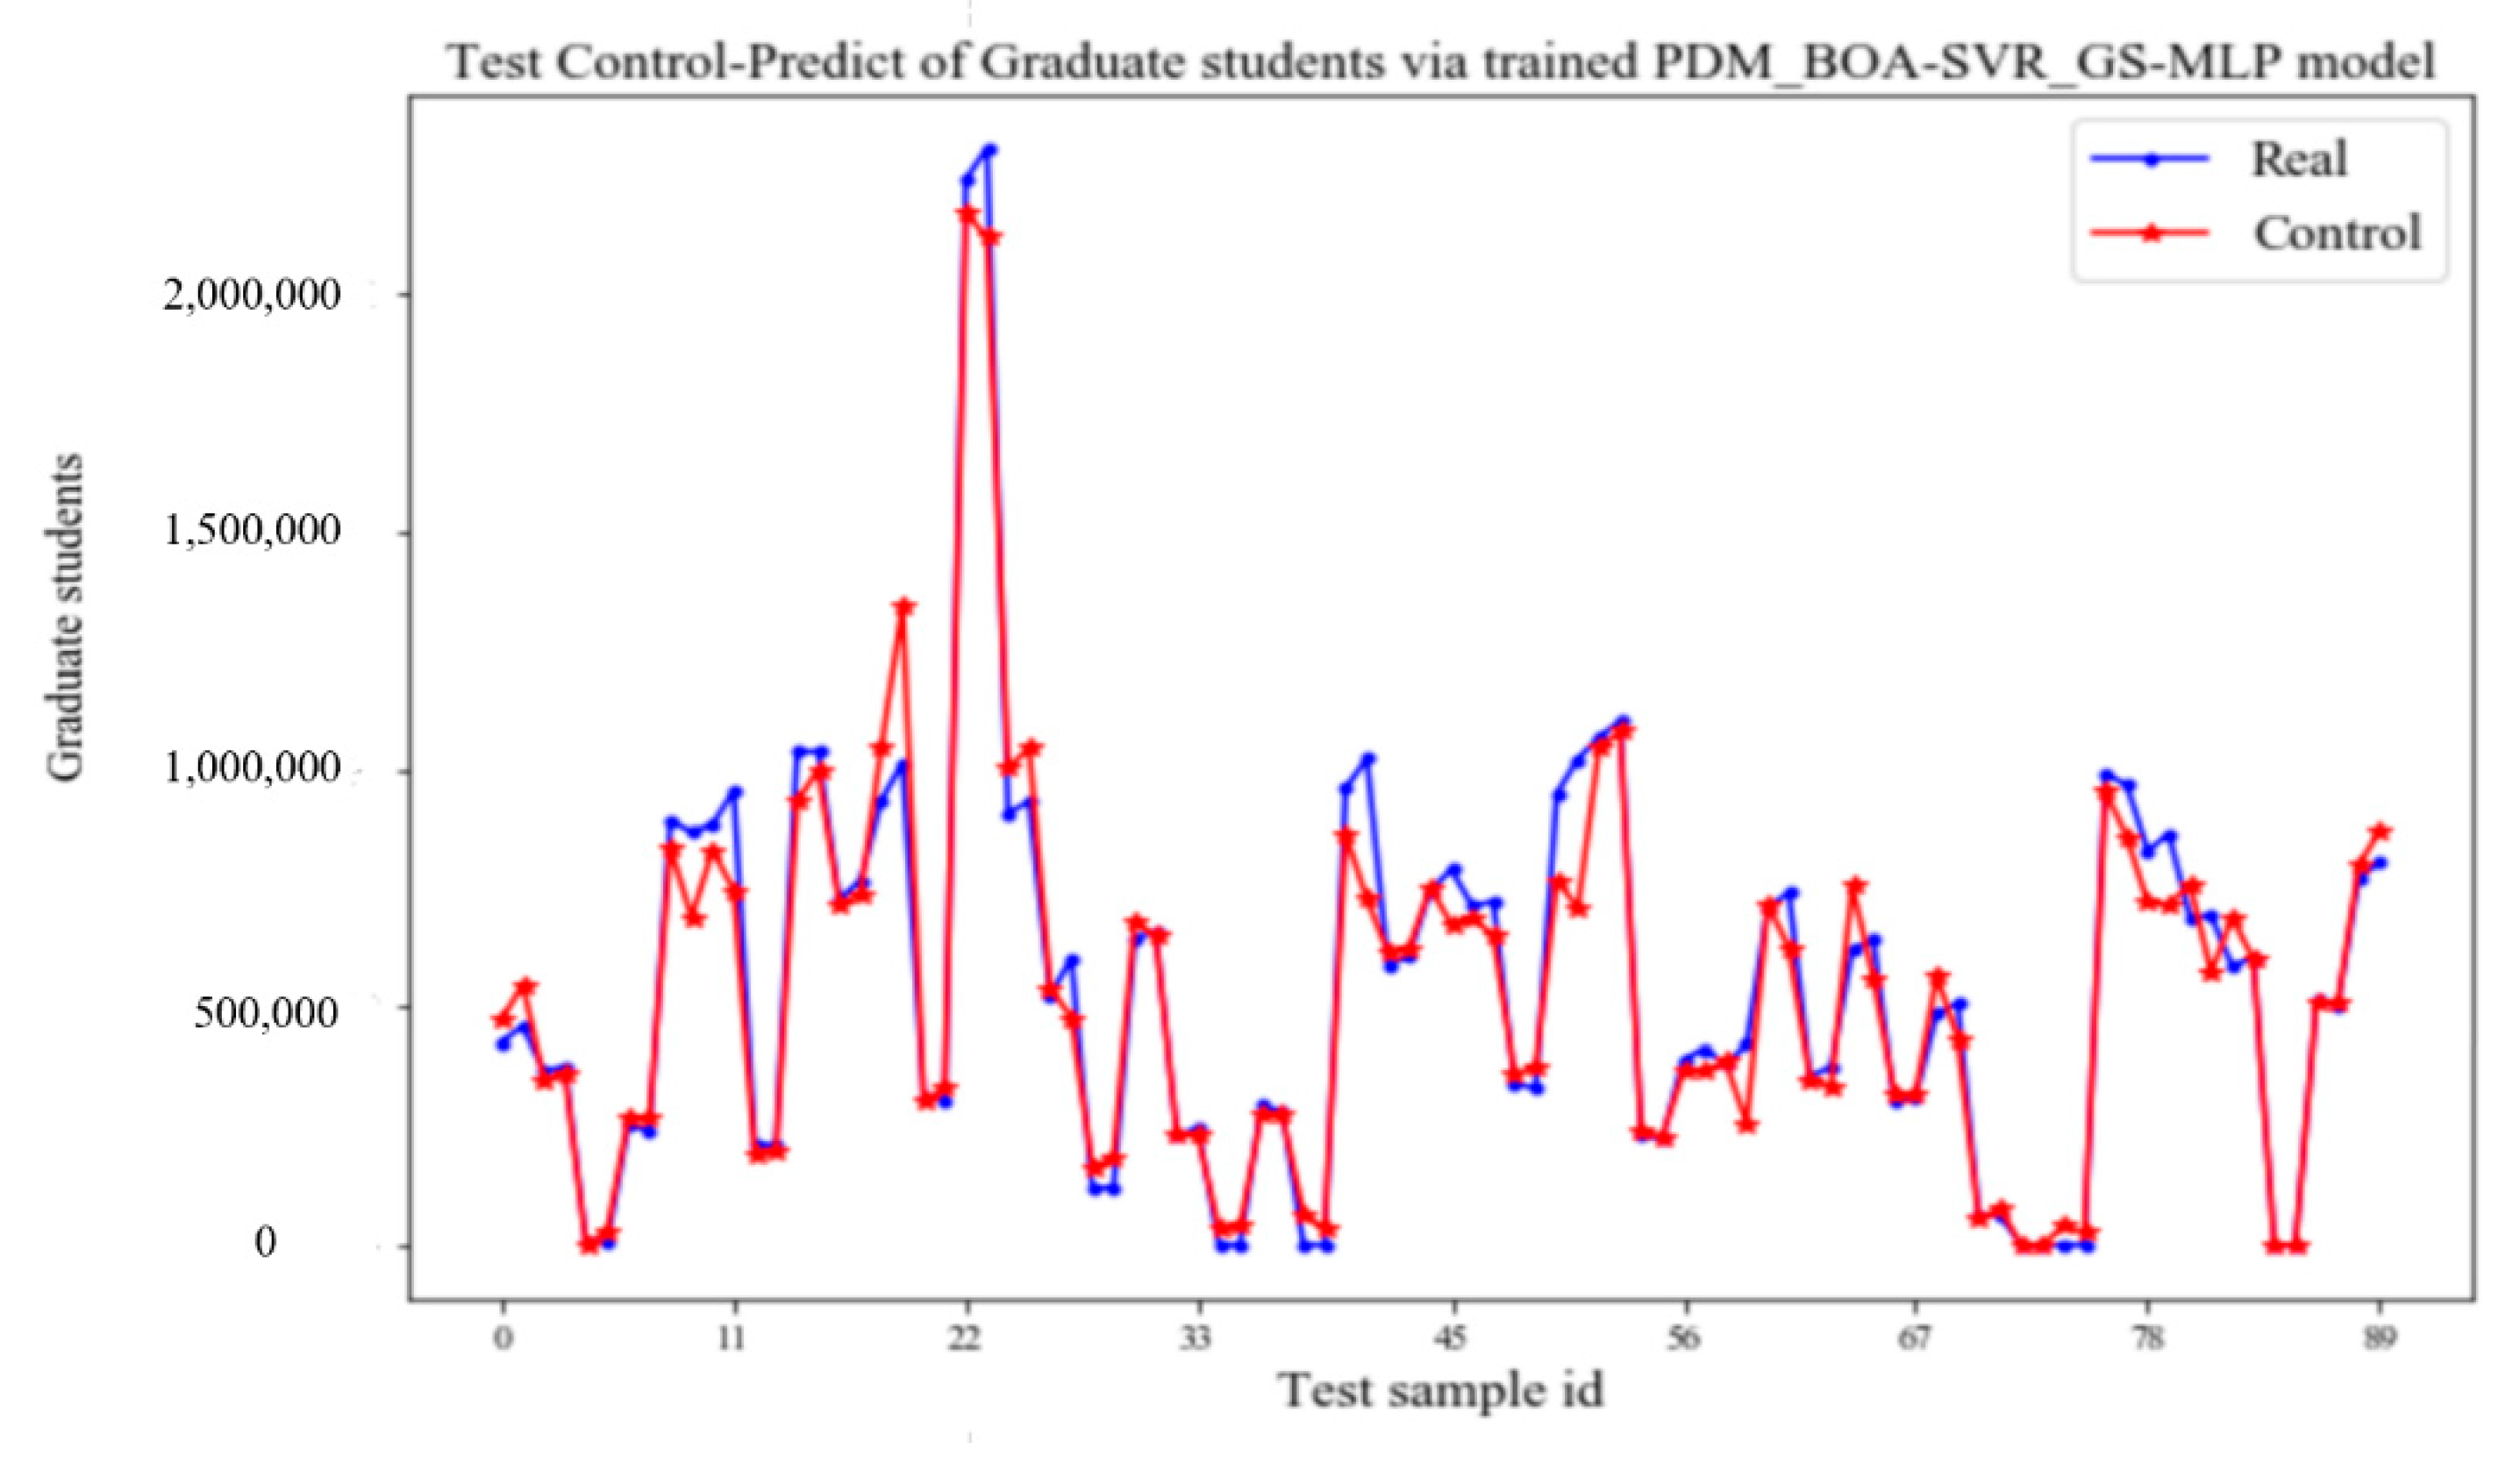
Figure 9.
Error changes of prediction-control.
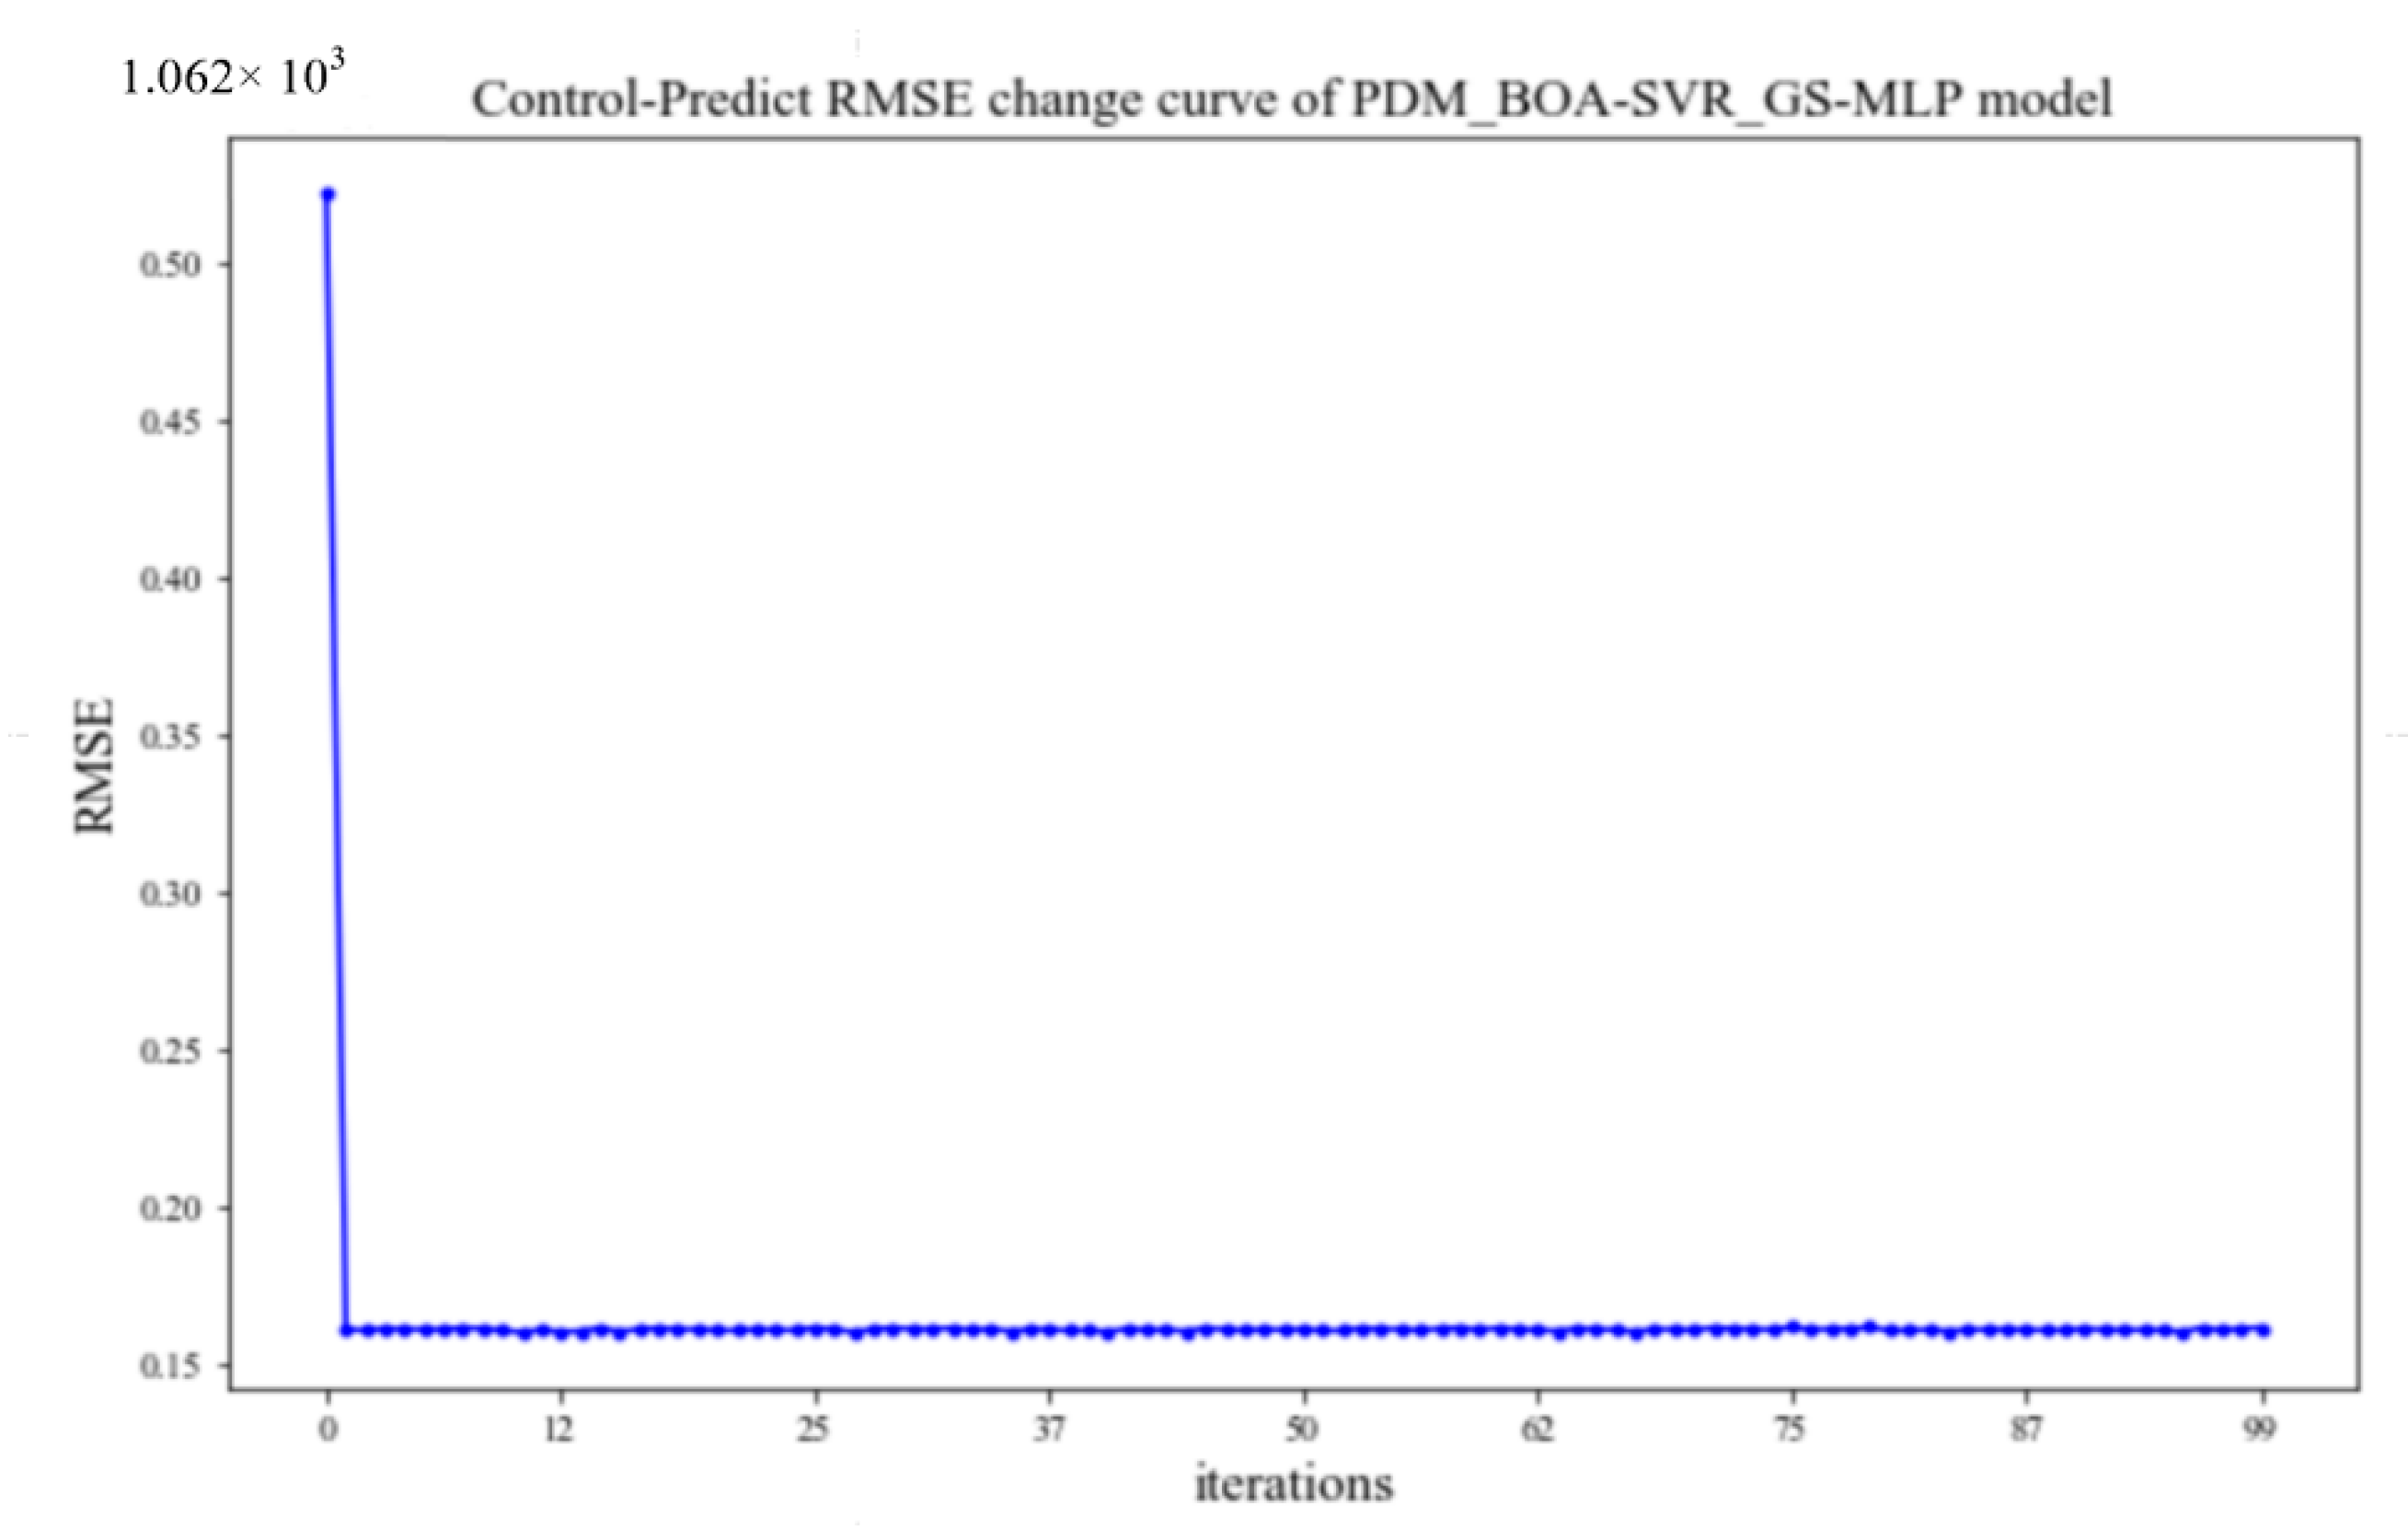
Figure 10.
Control performance of the network connection density.
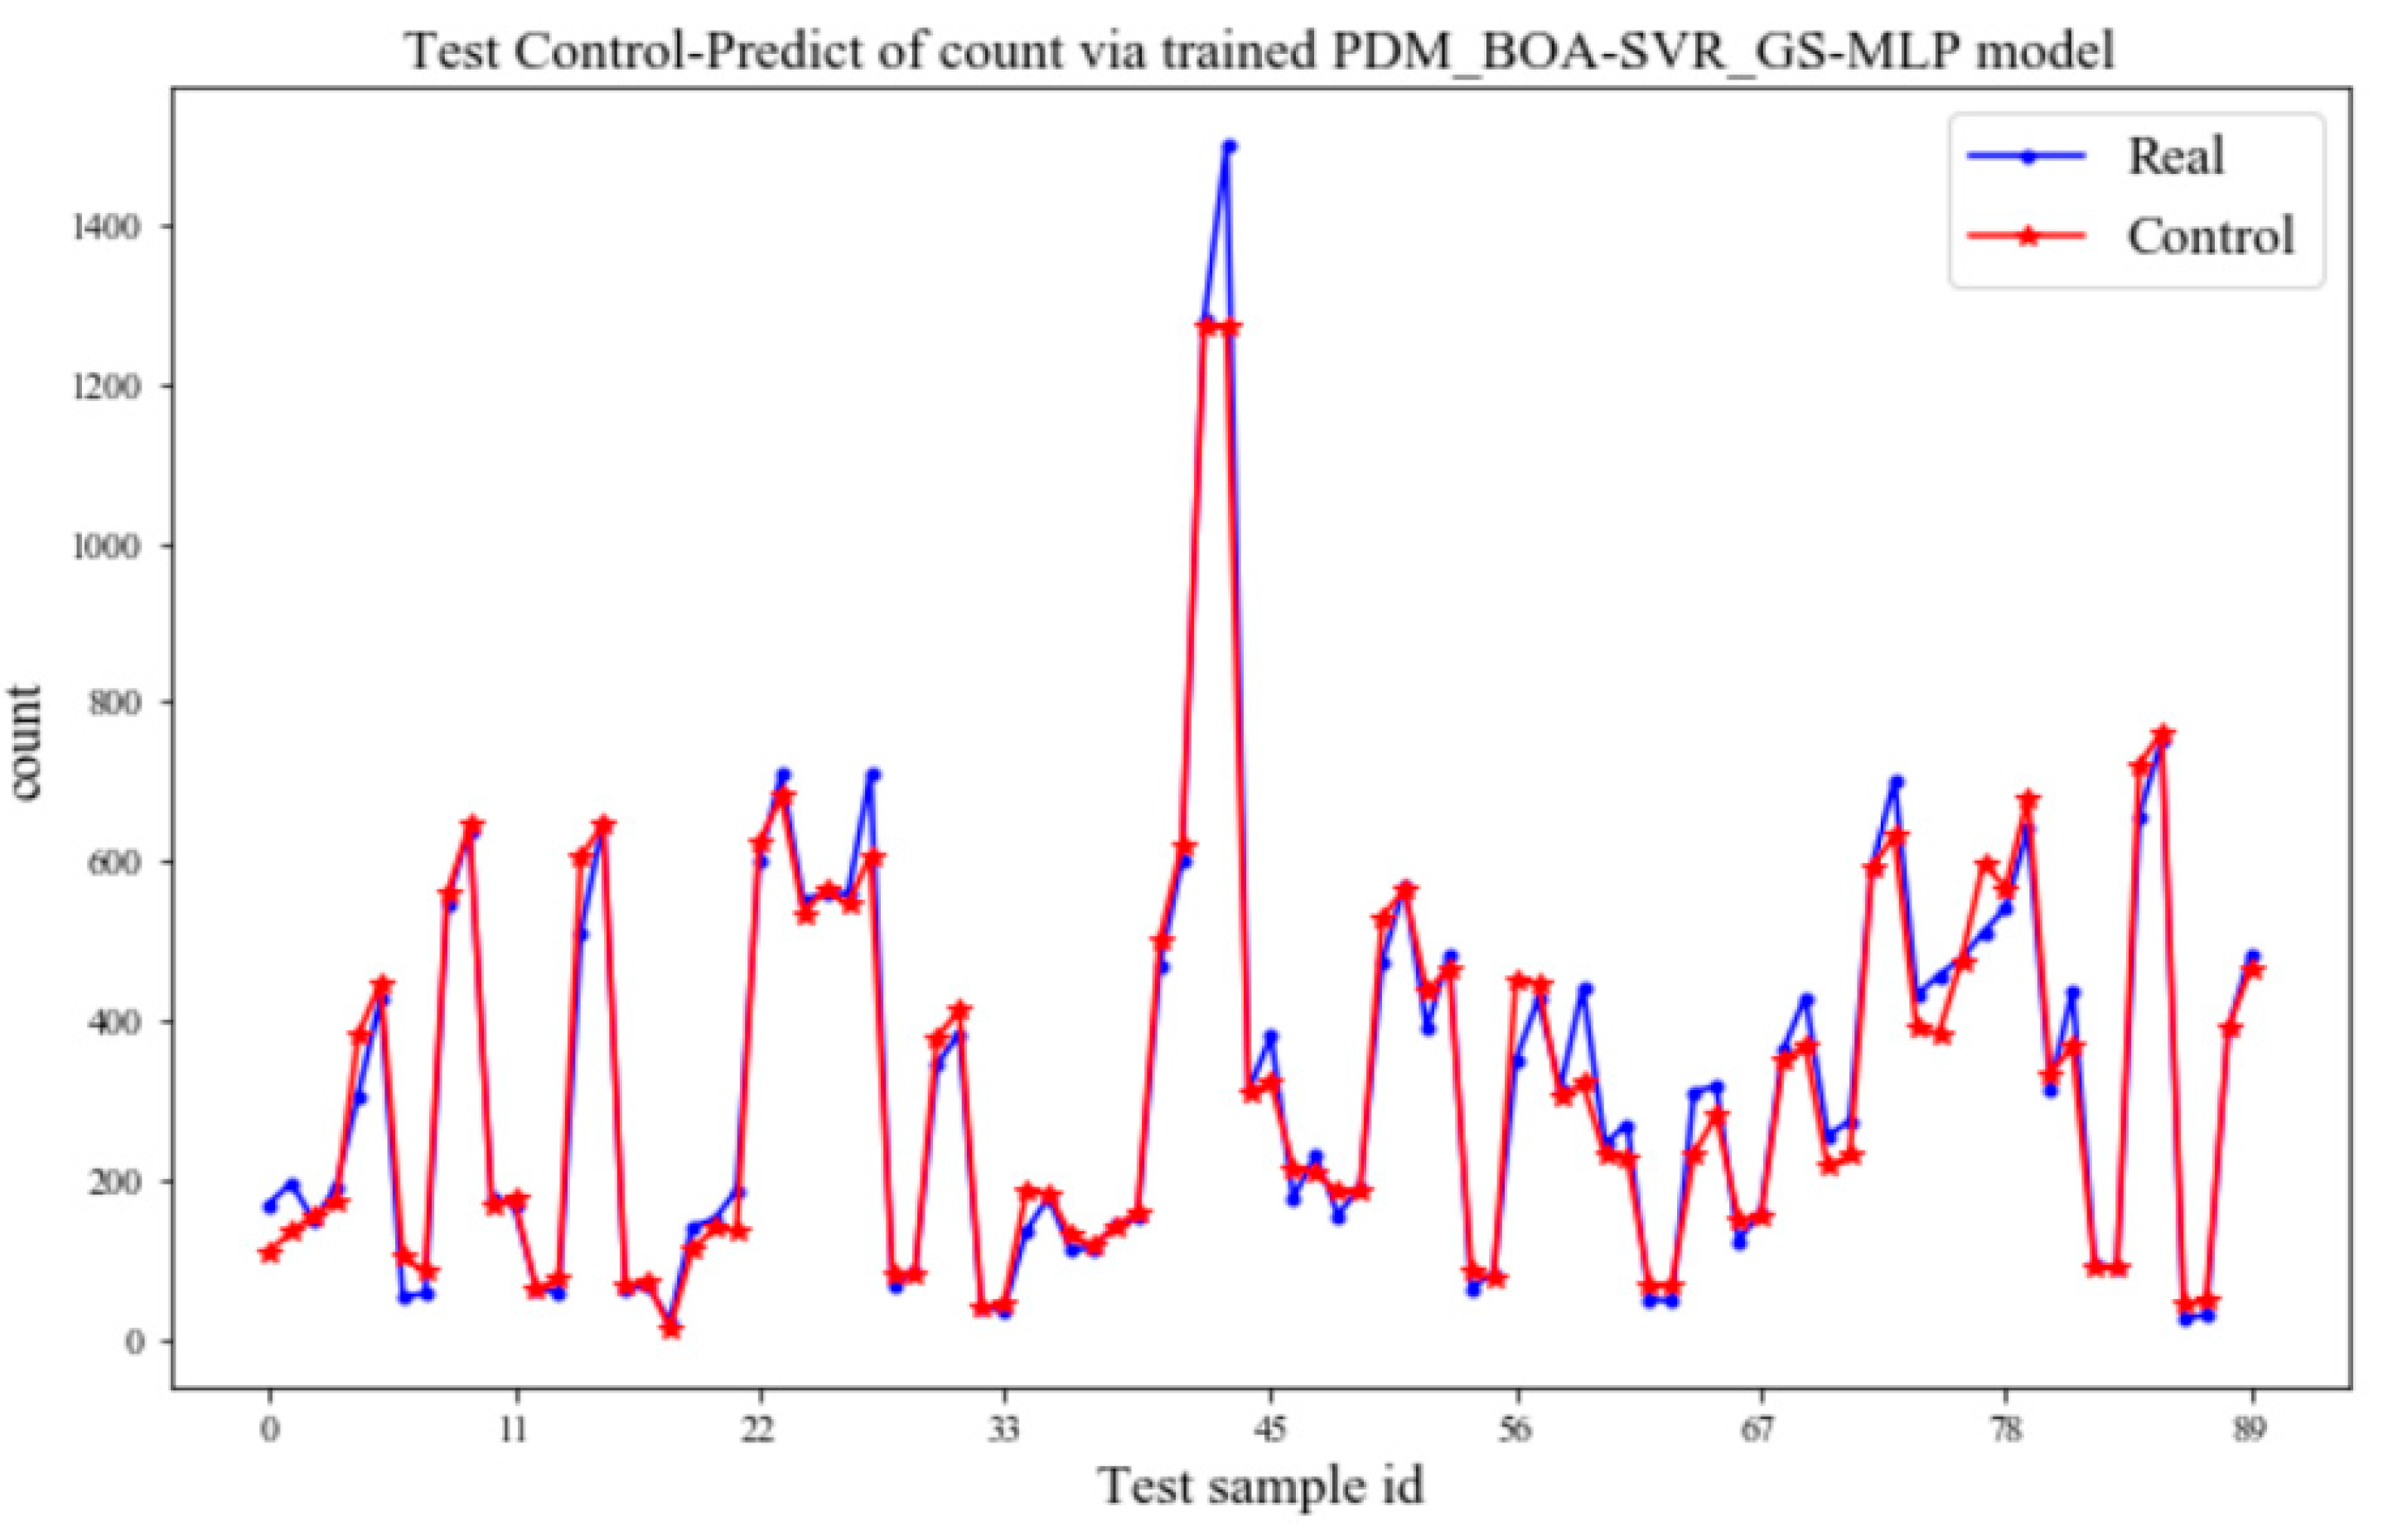
Figure 11.
Performance of government capital input needed to increase future output by 5%.
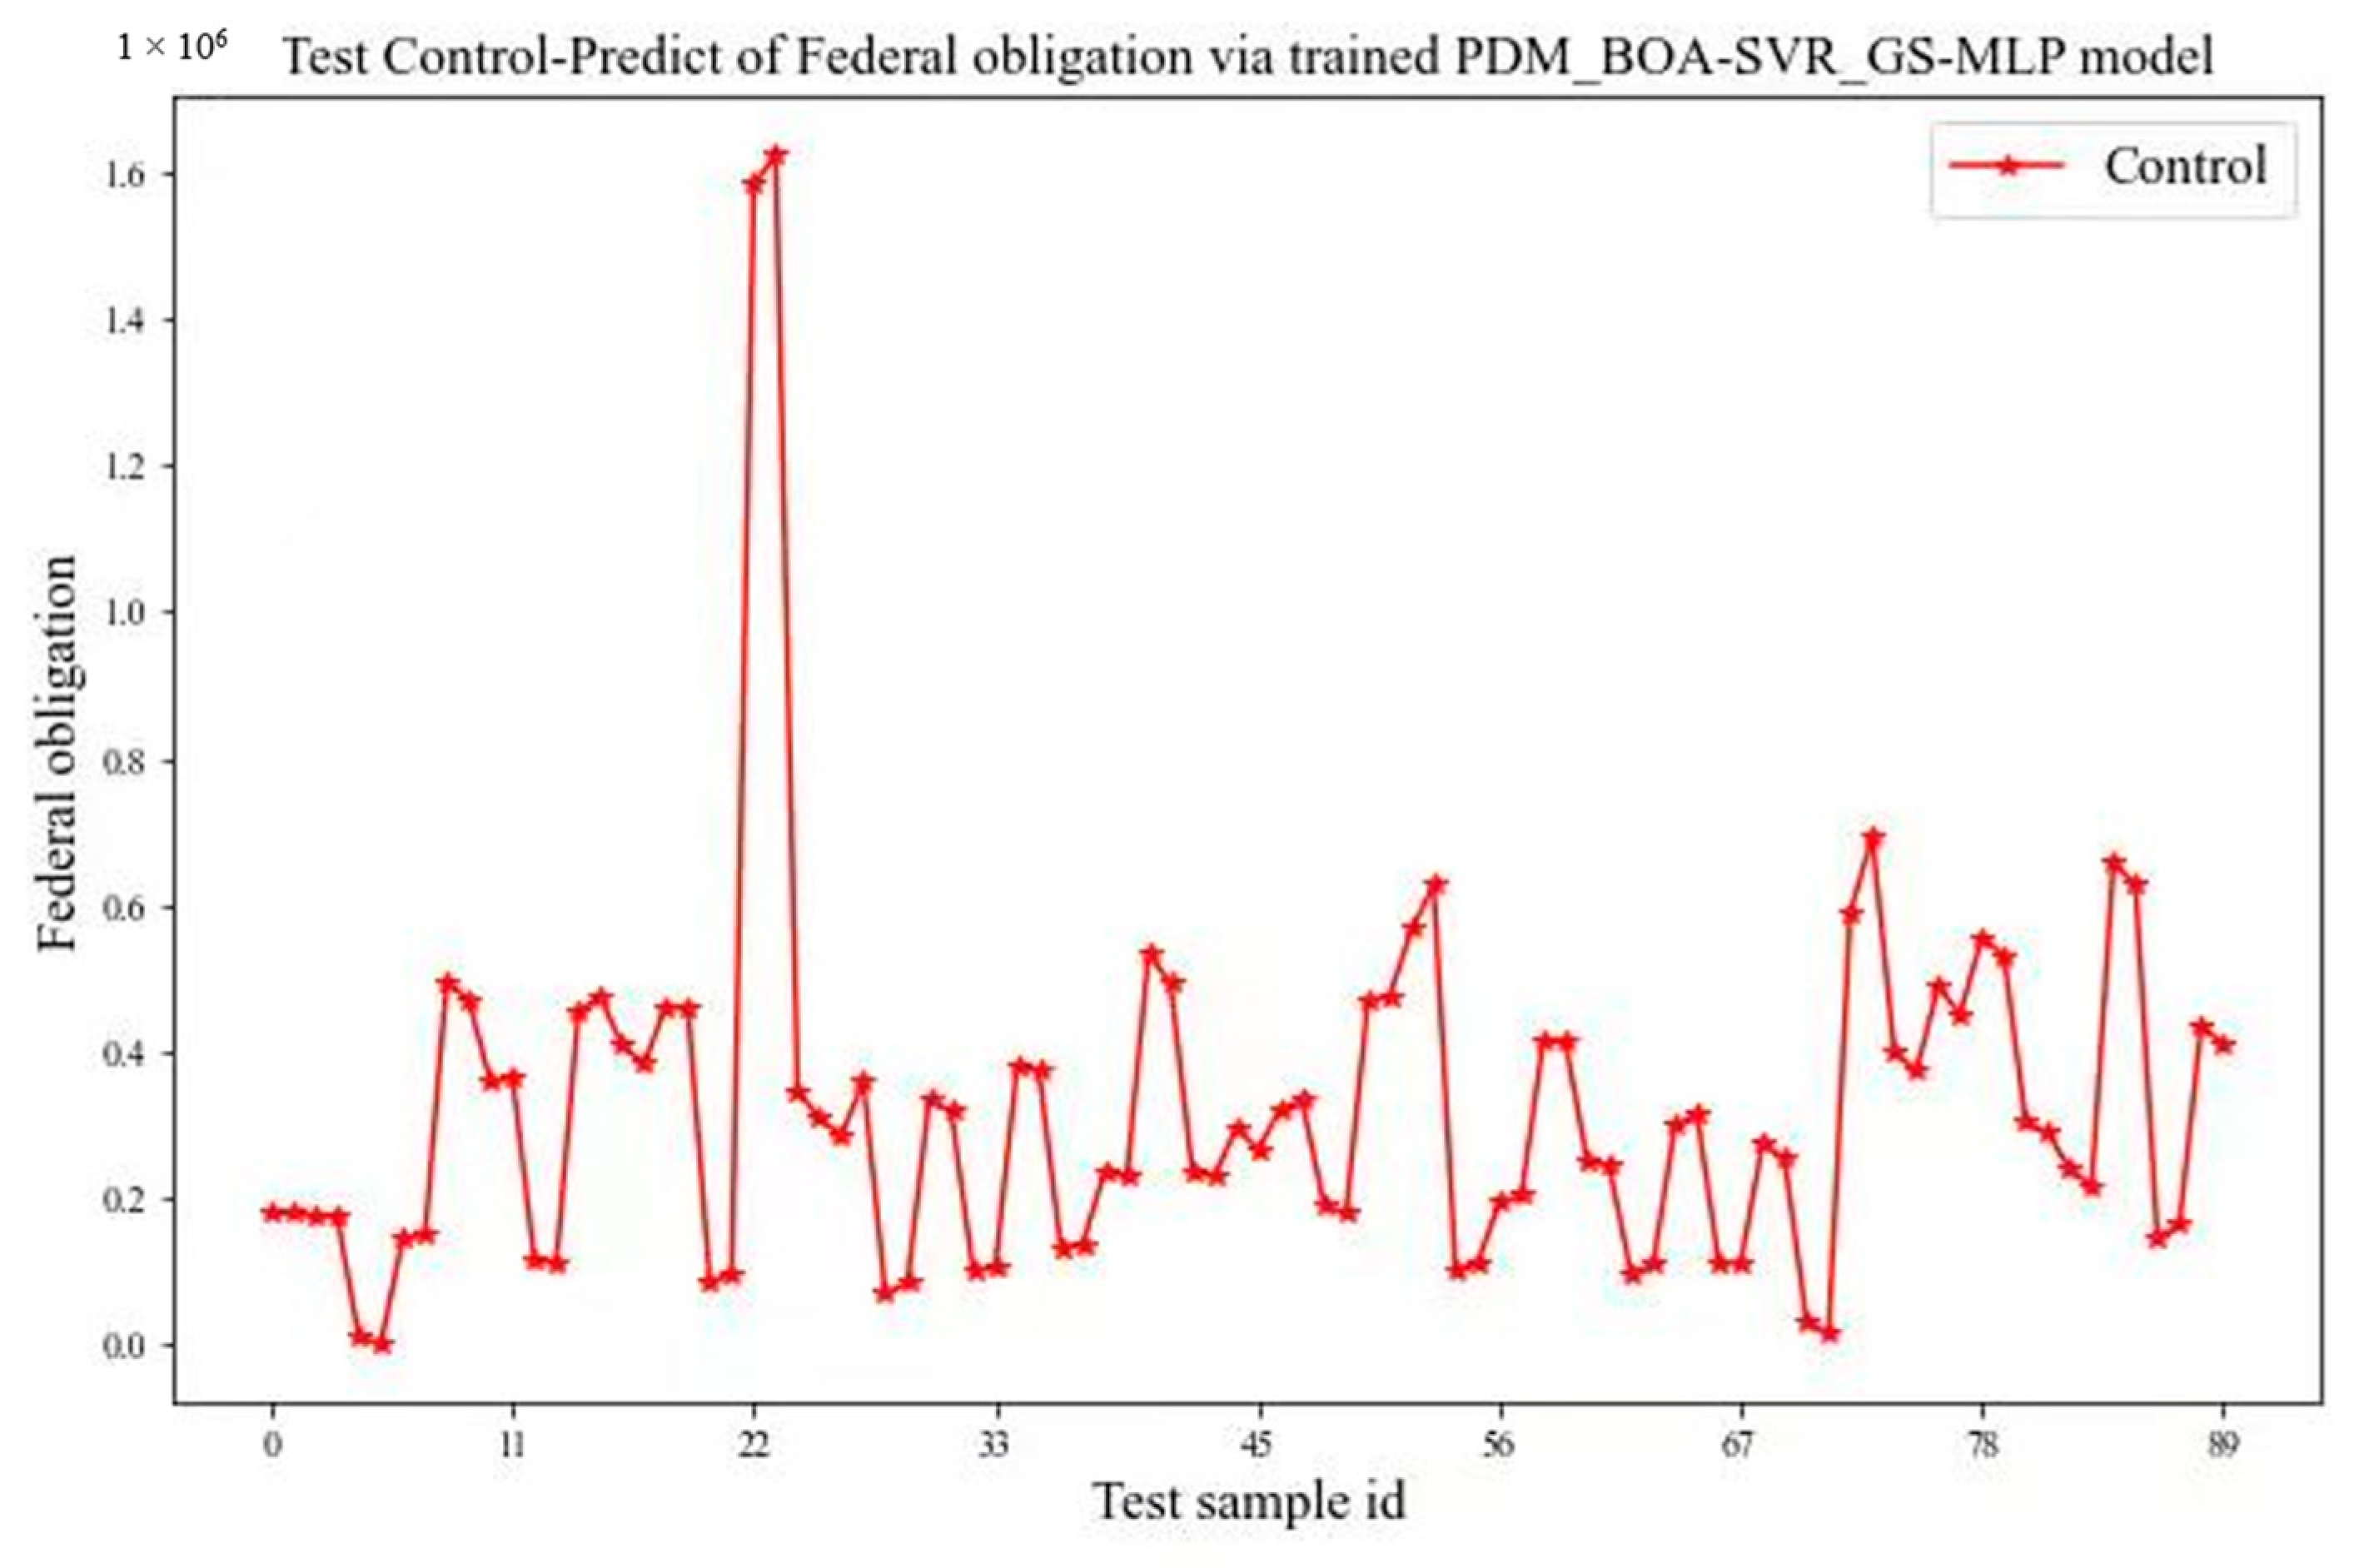
Figure 12.
Performance of R&D expenditures needed to increase future output by 5%.
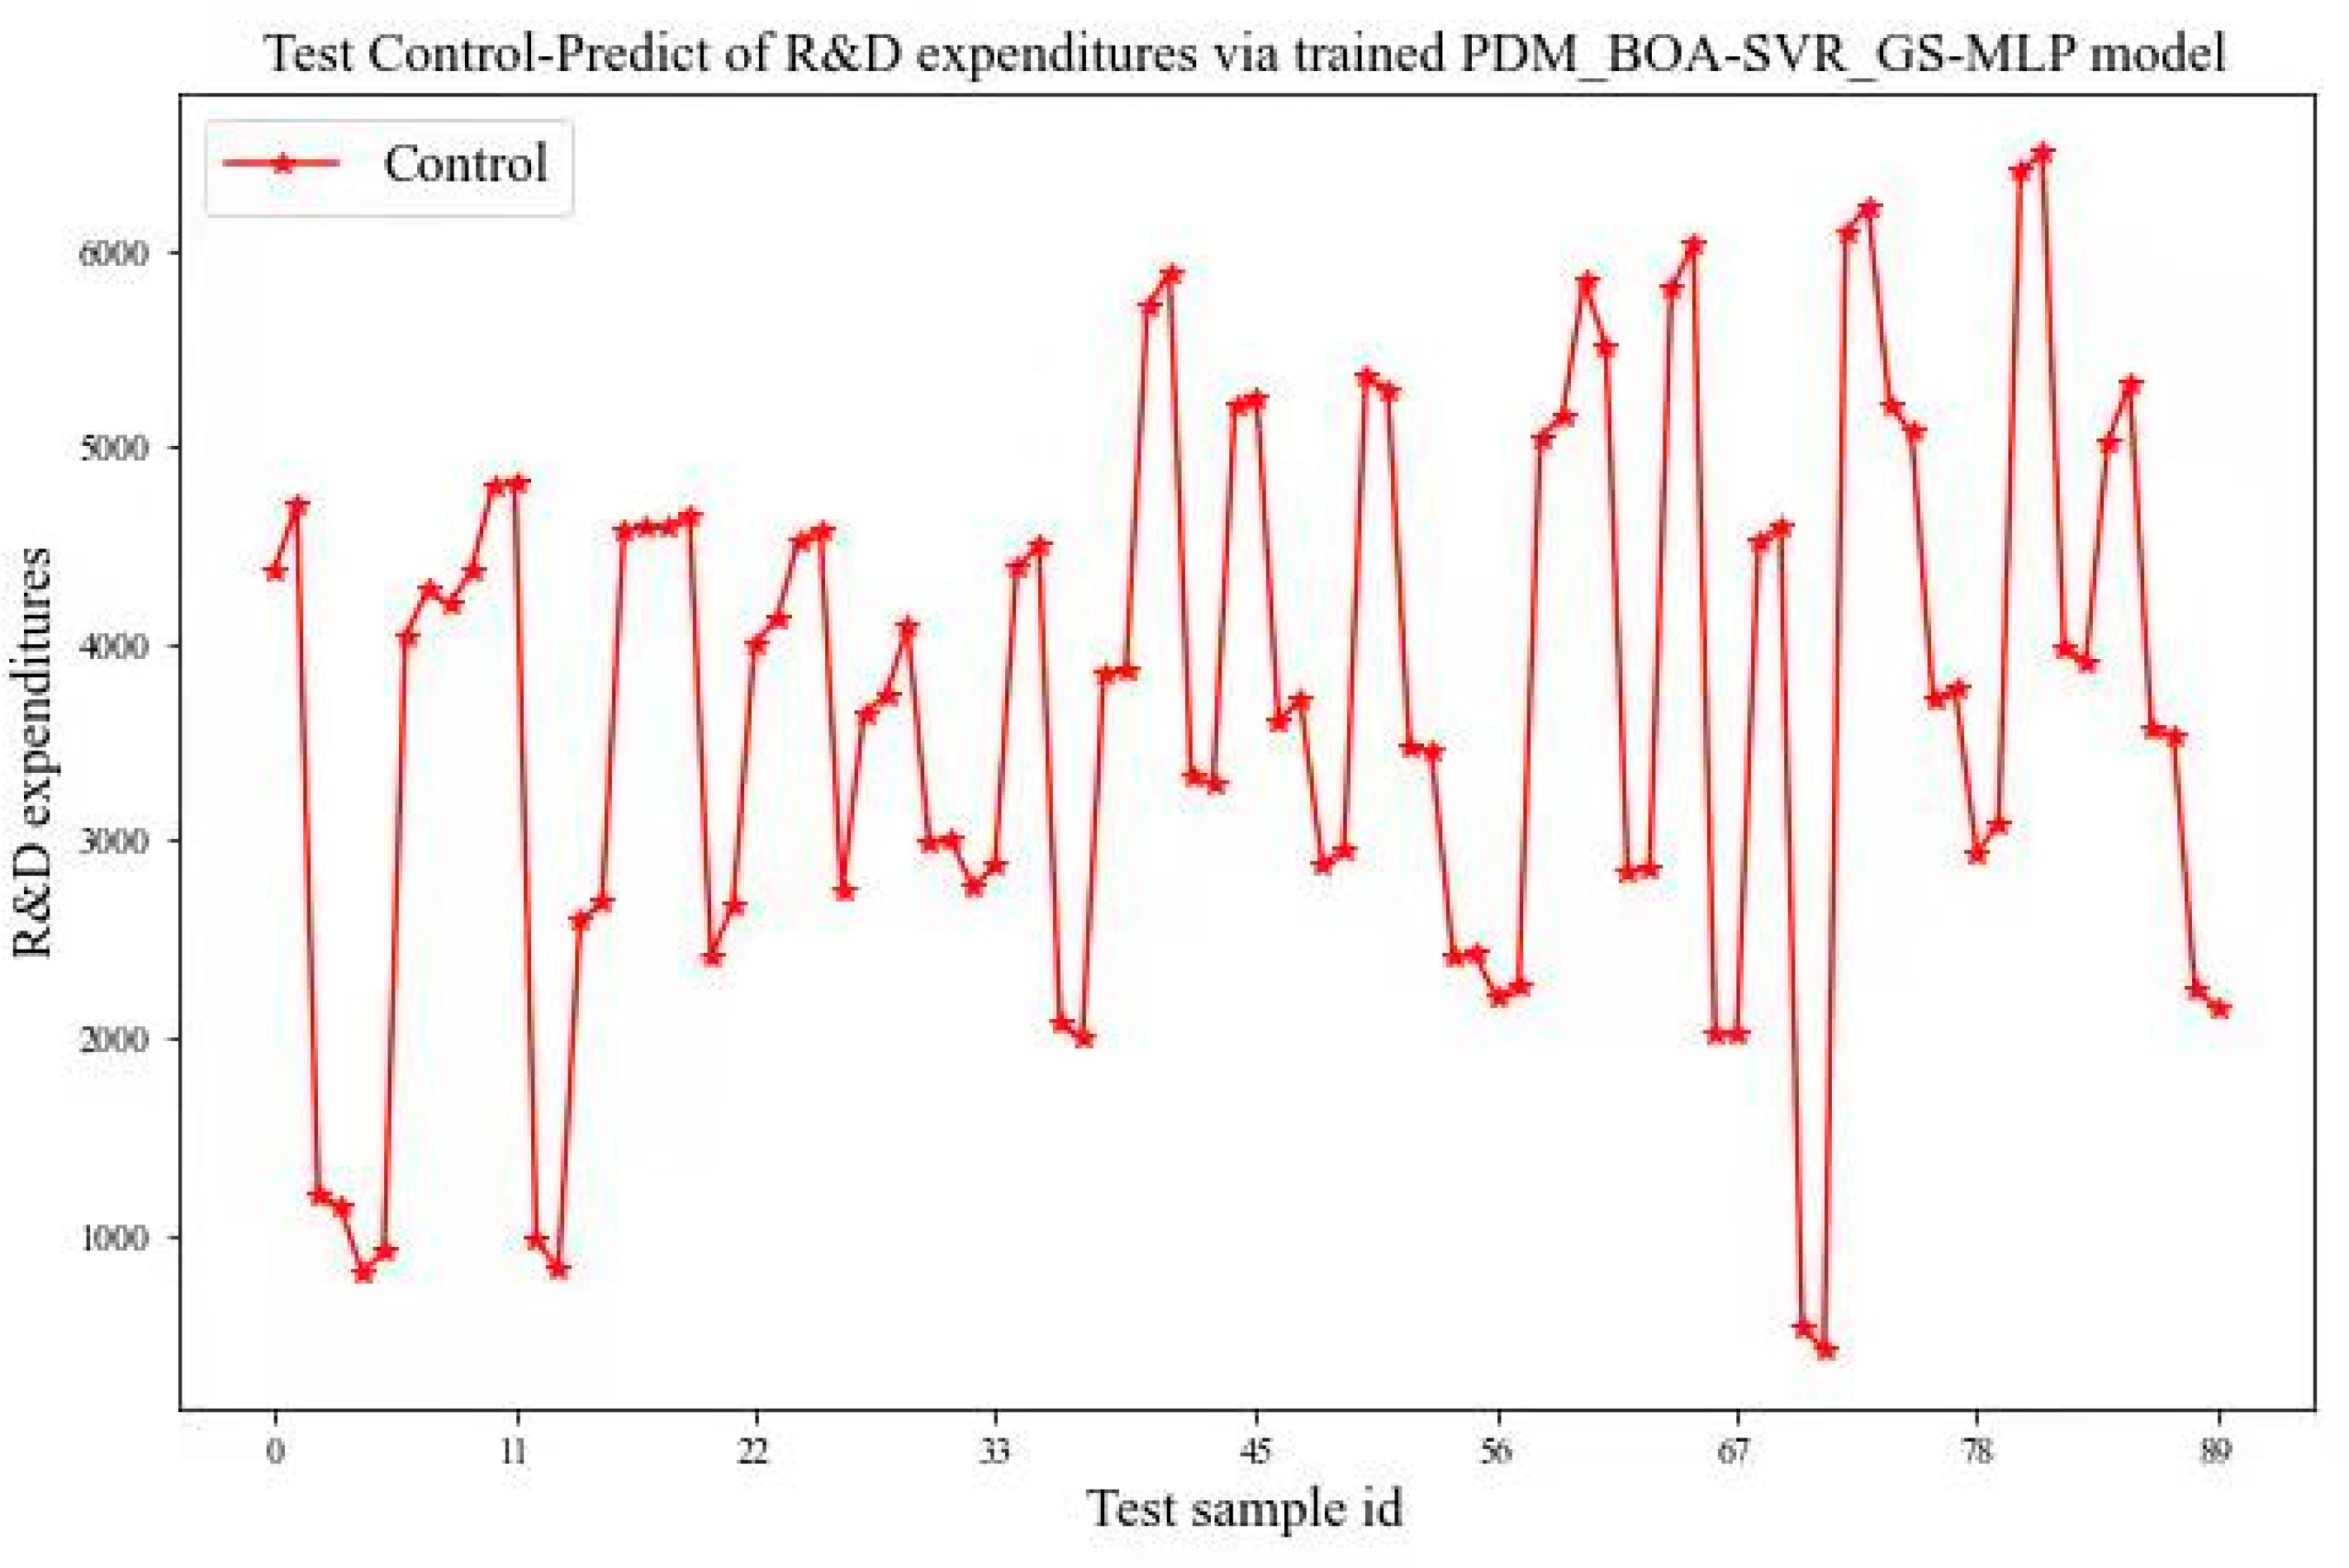
Figure 13.
Performance of the number of postgraduates needed to increase future output by 5%.

Table 1.
Notations of Control Model.
| Symbols | Definitions |
|---|---|
| Output value, namely, the composite value of papers jointly produced by universities, enterprises, and scientific research institutes; k indicates which year | |
| Expected output value | |
| Control error, namely, the error between the expected output and the real output; k indicates which year | |
| Output of the feedforward controller; ff means feedforward control; k indicates which year | |
| Output of the feedback controller; fb means feedback control; k indicates which year | |
| , total output of the controller, and part of inputs of the prediction model Grid Search Multilayer Perceptron | |
| Structure of the feedforward controller and the feedback controller based on MLP, and GS is used to improve control accuracy | |
| Feedforward Controller | |
| Feedback Controller | |
X Y | Feedforward Controller–Feedback Controller: a controller based on FFC and FBC Feedforward-Control–Feedback-Control-Model-based Multilayer Perceptron, namely, the name of the control model Innovation input value including x1, x2, and x3; according to actual needs, the network structure value x4–x7 can also be includedInnovation output representing a y (k) |
Table 2.
Index system of feedforward–feedback structure.
| Variables | Indexes | Sources |
|---|---|---|
| Innovation input | x1: capital input | Government capital |
| x2: capital input | R&D expenditures | |
| x3: personnel input | Number of postgraduates | |
| Network centrality | x4: closeness centrality | Processed collaboration network built by year with Python |
| x5: betweenness centrality | ||
| x6: degree centrality | ||
| Network connection density | x7: connection density | Processed with Python |
| Innovation output | y: composite value of papers jointly produced by different institutes | Composite value of influence factors |
Table 3.
A comparison of final errors of different models.
| Model | RMSE | Model | RMSE |
|---|---|---|---|
| ELM_MLP | 1408.991751 | HHO-SVR_GS-MLP | 1092.937662 |
| ELM_GS-MLP | 1383.816101 | BOA-SVR_GS-MLP | 1106.277331 |
| SVR_MLP | 1169.163554 | PSO_BOA-SVR_GS-MLP | 1084.636205 |
| SVR_GS-MLP | 1160.010254 | PDM_BOA-SVR_GS-MLP | 1075.364392 |
| ALO-SVR_GS-MLP | 1113.07555 |
Publisher’s Note: MDPI stays neutral with regard to jurisdictional claims in published maps and institutional affiliations. |
© 2022 by the authors. Licensee MDPI, Basel, Switzerland. This article is an open access article distributed under the terms and conditions of the Creative Commons Attribution (CC BY) license (https://creativecommons.org/licenses/by/4.0/).
Share and Cite
MDPI and ACS Style
Zhong, R.; Wang, D.; Hu, C.; Li, Y.; Feng, G. Prediction and Control of Input and Output for Industry–University–Research Collaboration Network in Construction Industry. Processes 2022, 10, 2037. https://doi.org/10.3390/pr10102037
AMA Style
Zhong R, Wang D, Hu C, Li Y, Feng G. Prediction and Control of Input and Output for Industry–University–Research Collaboration Network in Construction Industry. Processes. 2022; 10(10):2037. https://doi.org/10.3390/pr10102037
Chicago/Turabian StyleZhong, Ruiqiong, Dong Wang, Cheng Hu, Yuxin Li, and Gege Feng. 2022. "Prediction and Control of Input and Output for Industry–University–Research Collaboration Network in Construction Industry" Processes 10, no. 10: 2037. https://doi.org/10.3390/pr10102037
Note that from the first issue of 2016, this journal uses article numbers instead of page numbers. See further details here.