1. Introduction
Whole body activity recognition, especially targeting sports exercise, was introduced by Anderson et al. in the project YouMove [
1] and by Velloso et al. in the project MotionMA [
2]. However, both works are based on Microsoft Kinect device to gather visual input data for processing. Cameras are usually not accepted, especially in the domestic environment [
3], due to privacy issues. People are more likely to feel the invasion of privacy by using a camera system in their living environment. Therefore, we are more interested in using a non-optical system to perform activity recognition. There are already a few systems that follow this approach. One example of such a system uses a backscattered signal based on RFID to recognize up to 10 free-weight activities, introduced by Ding et al. [
4]. Another system uses smartphone accelerometers to recognize sports activities, as introduced by E. Mitchell [
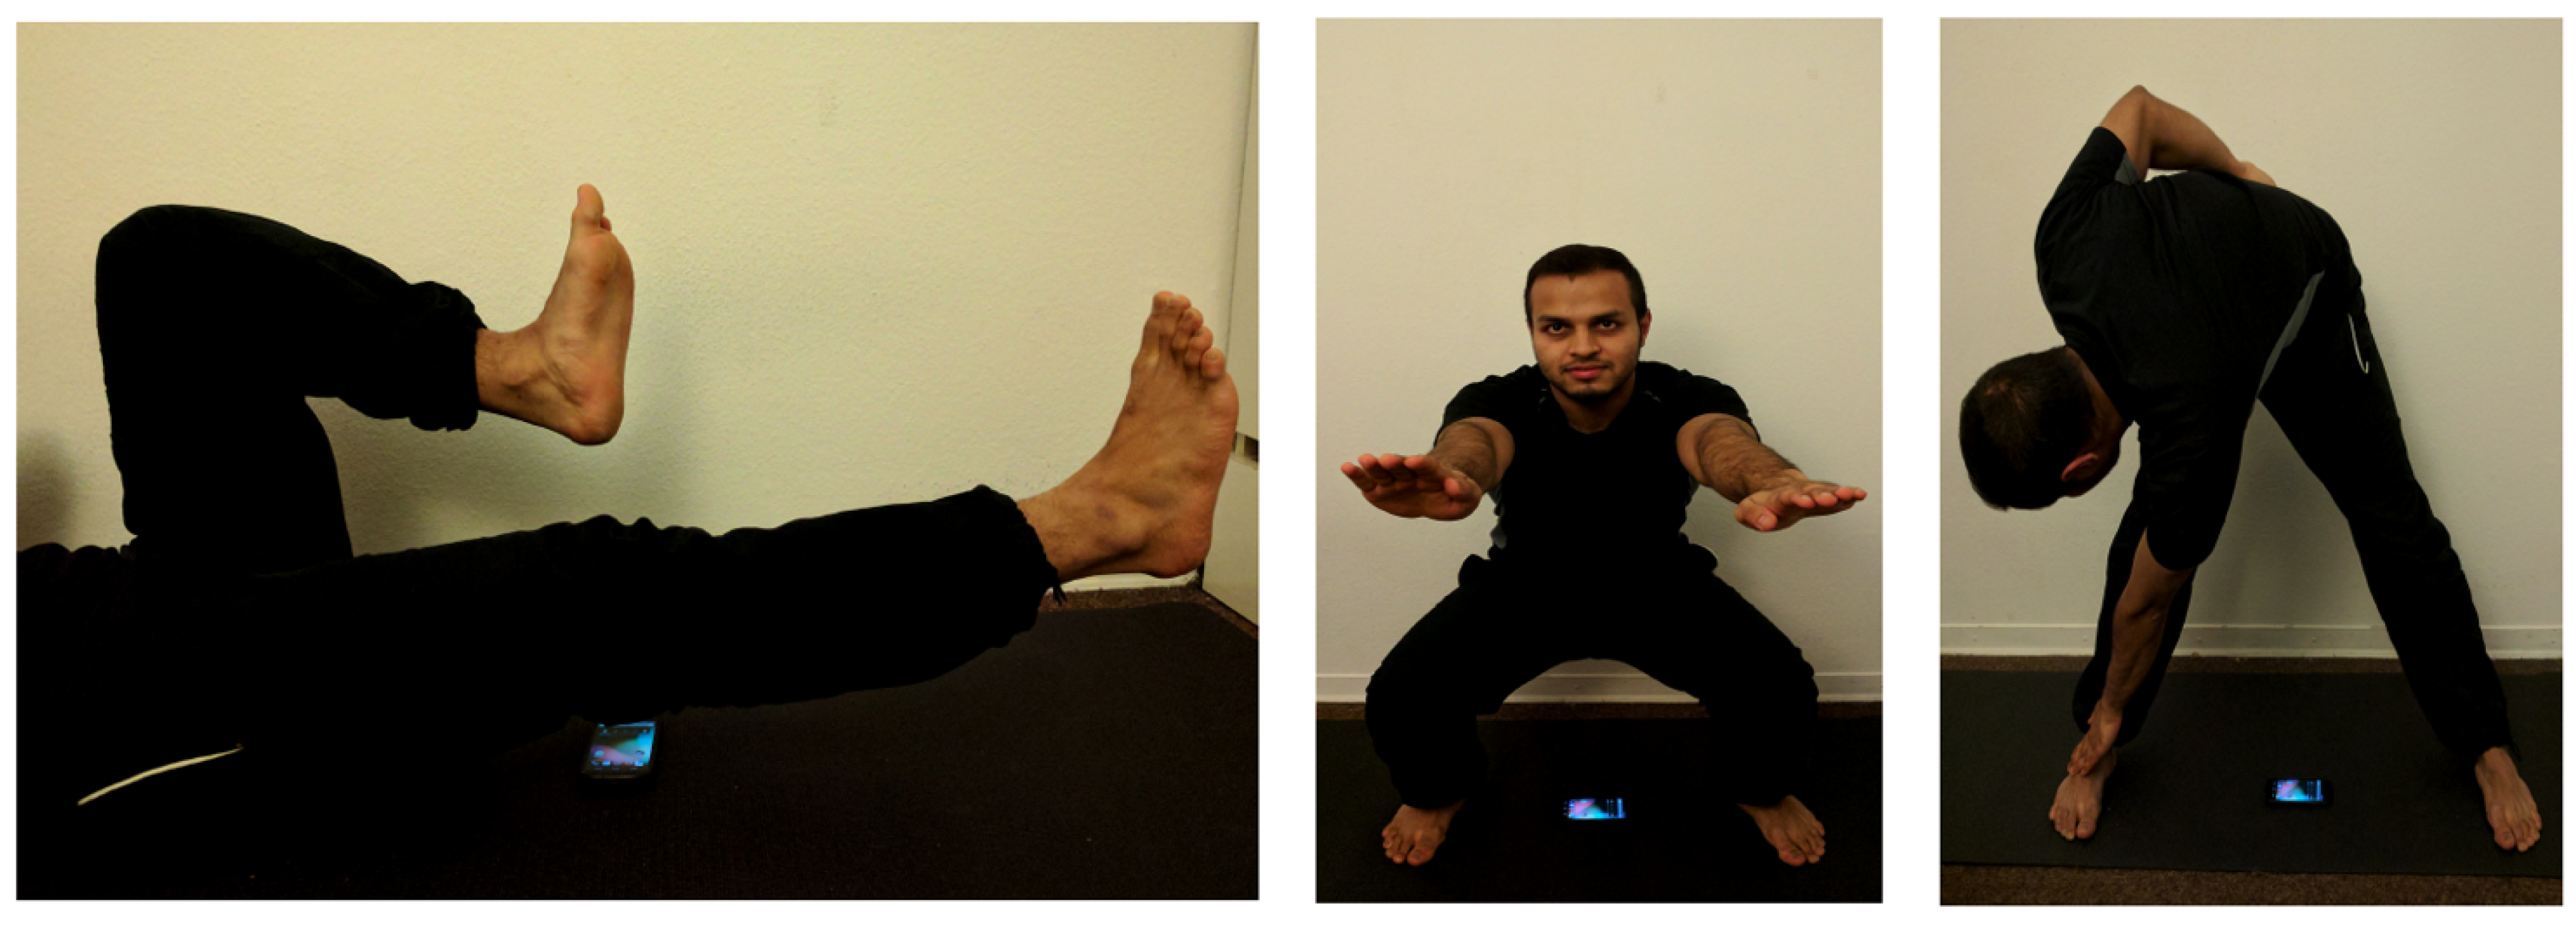
5]. They are able to recognize sports activities without any external hardware component but a smartphone integrated into a vest on the back. We went a step further to reduce any kind of additional setup and tried to remotely sense the activity using only a smartphone. In this work, we tested different processing methods on the recognition performance of three selected sports activities: bicycle exercise, body-weight squats and toe touch exercises. Examples of the activities are shown in
Figure 1.
Human activity recognition using embedded sensors is one of the top research topics of the last decade. Ubiquitous and remote sensing have become one of the most important aspects of human–machine interaction. Especially with the surge of consumer smartphones, the possibilities of low-cost and ubiquitous sensing hardware seem to be infinite. The fact that phones nowadays come equipped with a variety of sensors make them an excellent platform to infer the context and activities of the respective user [
6].
Applying the microphone of a mobile phone as a sensor device is nothing new and can be coarsely separated into passive and active sensing. While the first listens to the environment and pays attention to the disturbance produced by a present user (e.g., Lu et al. [
7], Schweizer et al. [
8], Popescu et al. [
9], and Fu et al. [
10]), the latter approach actively samples the vicinity by sending out signals and waiting for their response, making it a prime candidate for gesture detection and localization. One of the first gesture classification algorithms using ultrasound sensing was presented by Gupta et al. in SoundWave [
11]. Albeit employing a laptop speaker at first, their vision soon led to the first implementations on smartphones, leveraging multidevice interaction (DopLink [
12] and Spartacus [
13]) and gesture detection (Dolphin [
14] and Ruan et al. [
15]). Even minuscule motion such as breathing movements can be detected via ultrasound sensing, as shown by Nandakumar et al. [
16]. In their followup work, FingerIO [
17], they tracked fine-grained finger movements enabling interactive surfaces around the off-the-shelf smartphones. WIFI signals can also be used as activity recognition system, as introduced in the work of Xi et al. [
18]. Device-free activity recognition using WiFi signal is interesting, but not practicable in our target application domain. Since it covers a large area, the problem of occlusion might happen for multiple person performing exercises in the same room. It would receive accumulated actions from multiple person and hence have difficulty decomposing the echo signal. The proposed application using smartphone only solution covers a small range only around the sensing device. It is more dedicated and restricted and thus reduce the problem of occlusion due to multiple person.
The following paper is an extended version of our contribution to the iWOAR 2017—4th international Workshop on Sensor-based Activity Recognition and Interaction, titled “Exercise Monitoring On Consumer smartphones Using Ultrasonic Sensing” [
19], where we investigated new classification methods for remote and non-visual based recognition of three sports activities using an off-the-shelf unmodified consumer smartphone without any external hardware setup.
We chose these activities because they are all periodical movements and can be performed on the same spot, without changing the physical setup. The extensions here include a new evaluation of the classification results, based on simplified pre-processing step. We further appended the concept of using a convolutional neural network (CNN) to improve the recognition performance compared to the classic machine learning approaches such as support vector machines (SVM). The CNN is especially useful on time series because it considers the temporal relationship due to its local dependencies. Due to its scale invariance, it can further adapt to different performance speeds.
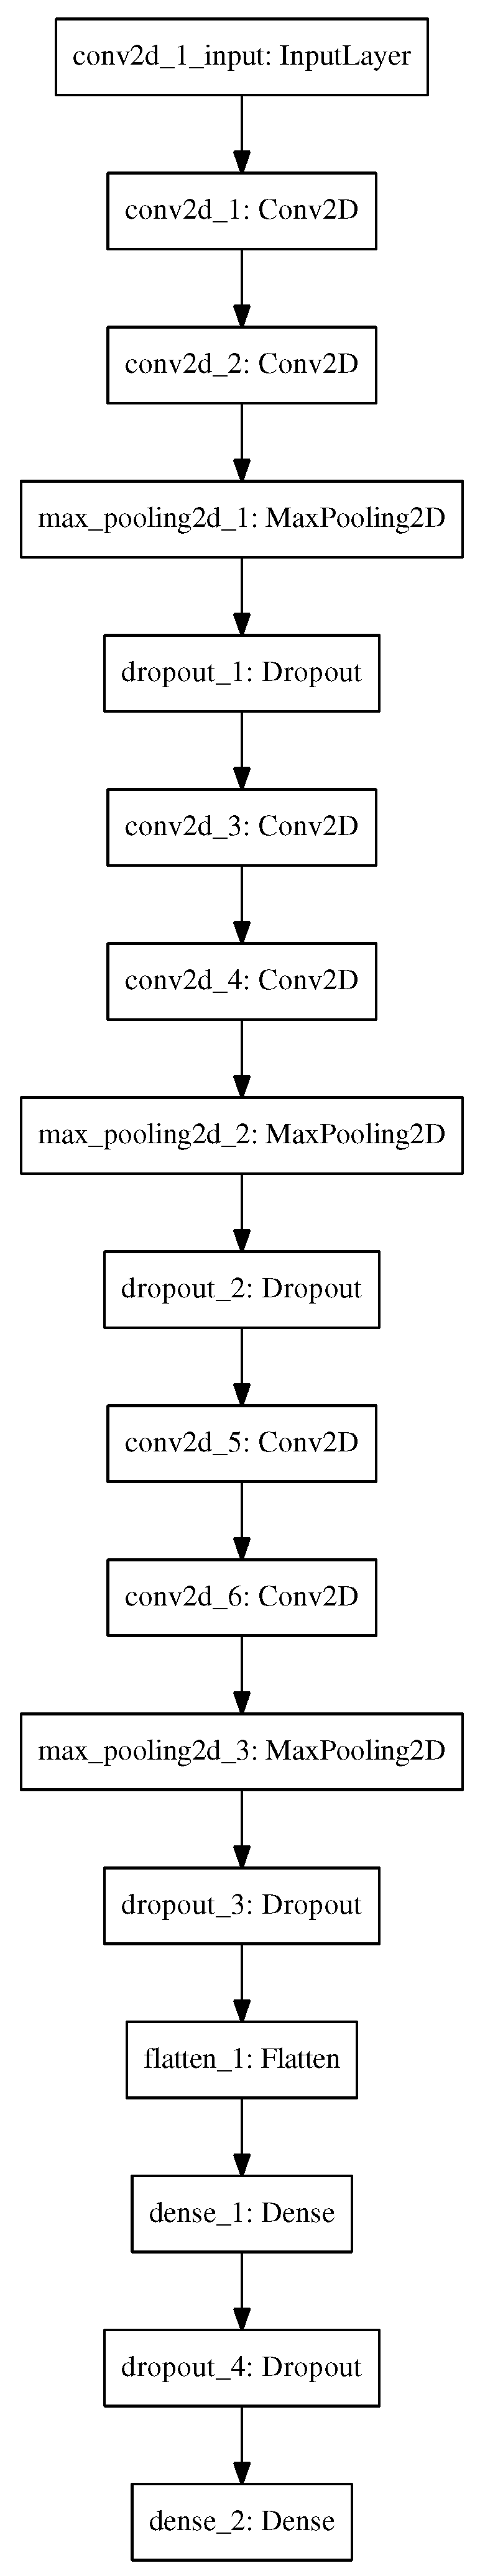
4. Classification Methods and Evaluation
We conducted a small field study to collect exercises data to test the different classification methods for our targeted application. We invited 14 participants ranging 25–28 years old to perform the three given sports activities. The 14 participants are grouped into 12 males and 2 females, with a weight ranging of 60–80 kg for males and 50–55 kg for females and a body height ranging 150–180 cm and 155–160 cm, respectively. We asked each participant to perform each activity fifteen times, which makes in total 45 samples per participant. The device we used to collect the activity data is a Google Nexus 5X. To condition the measurement setup, all exercises are performed in the same location. The exact placement can be seen in
Figure 1.
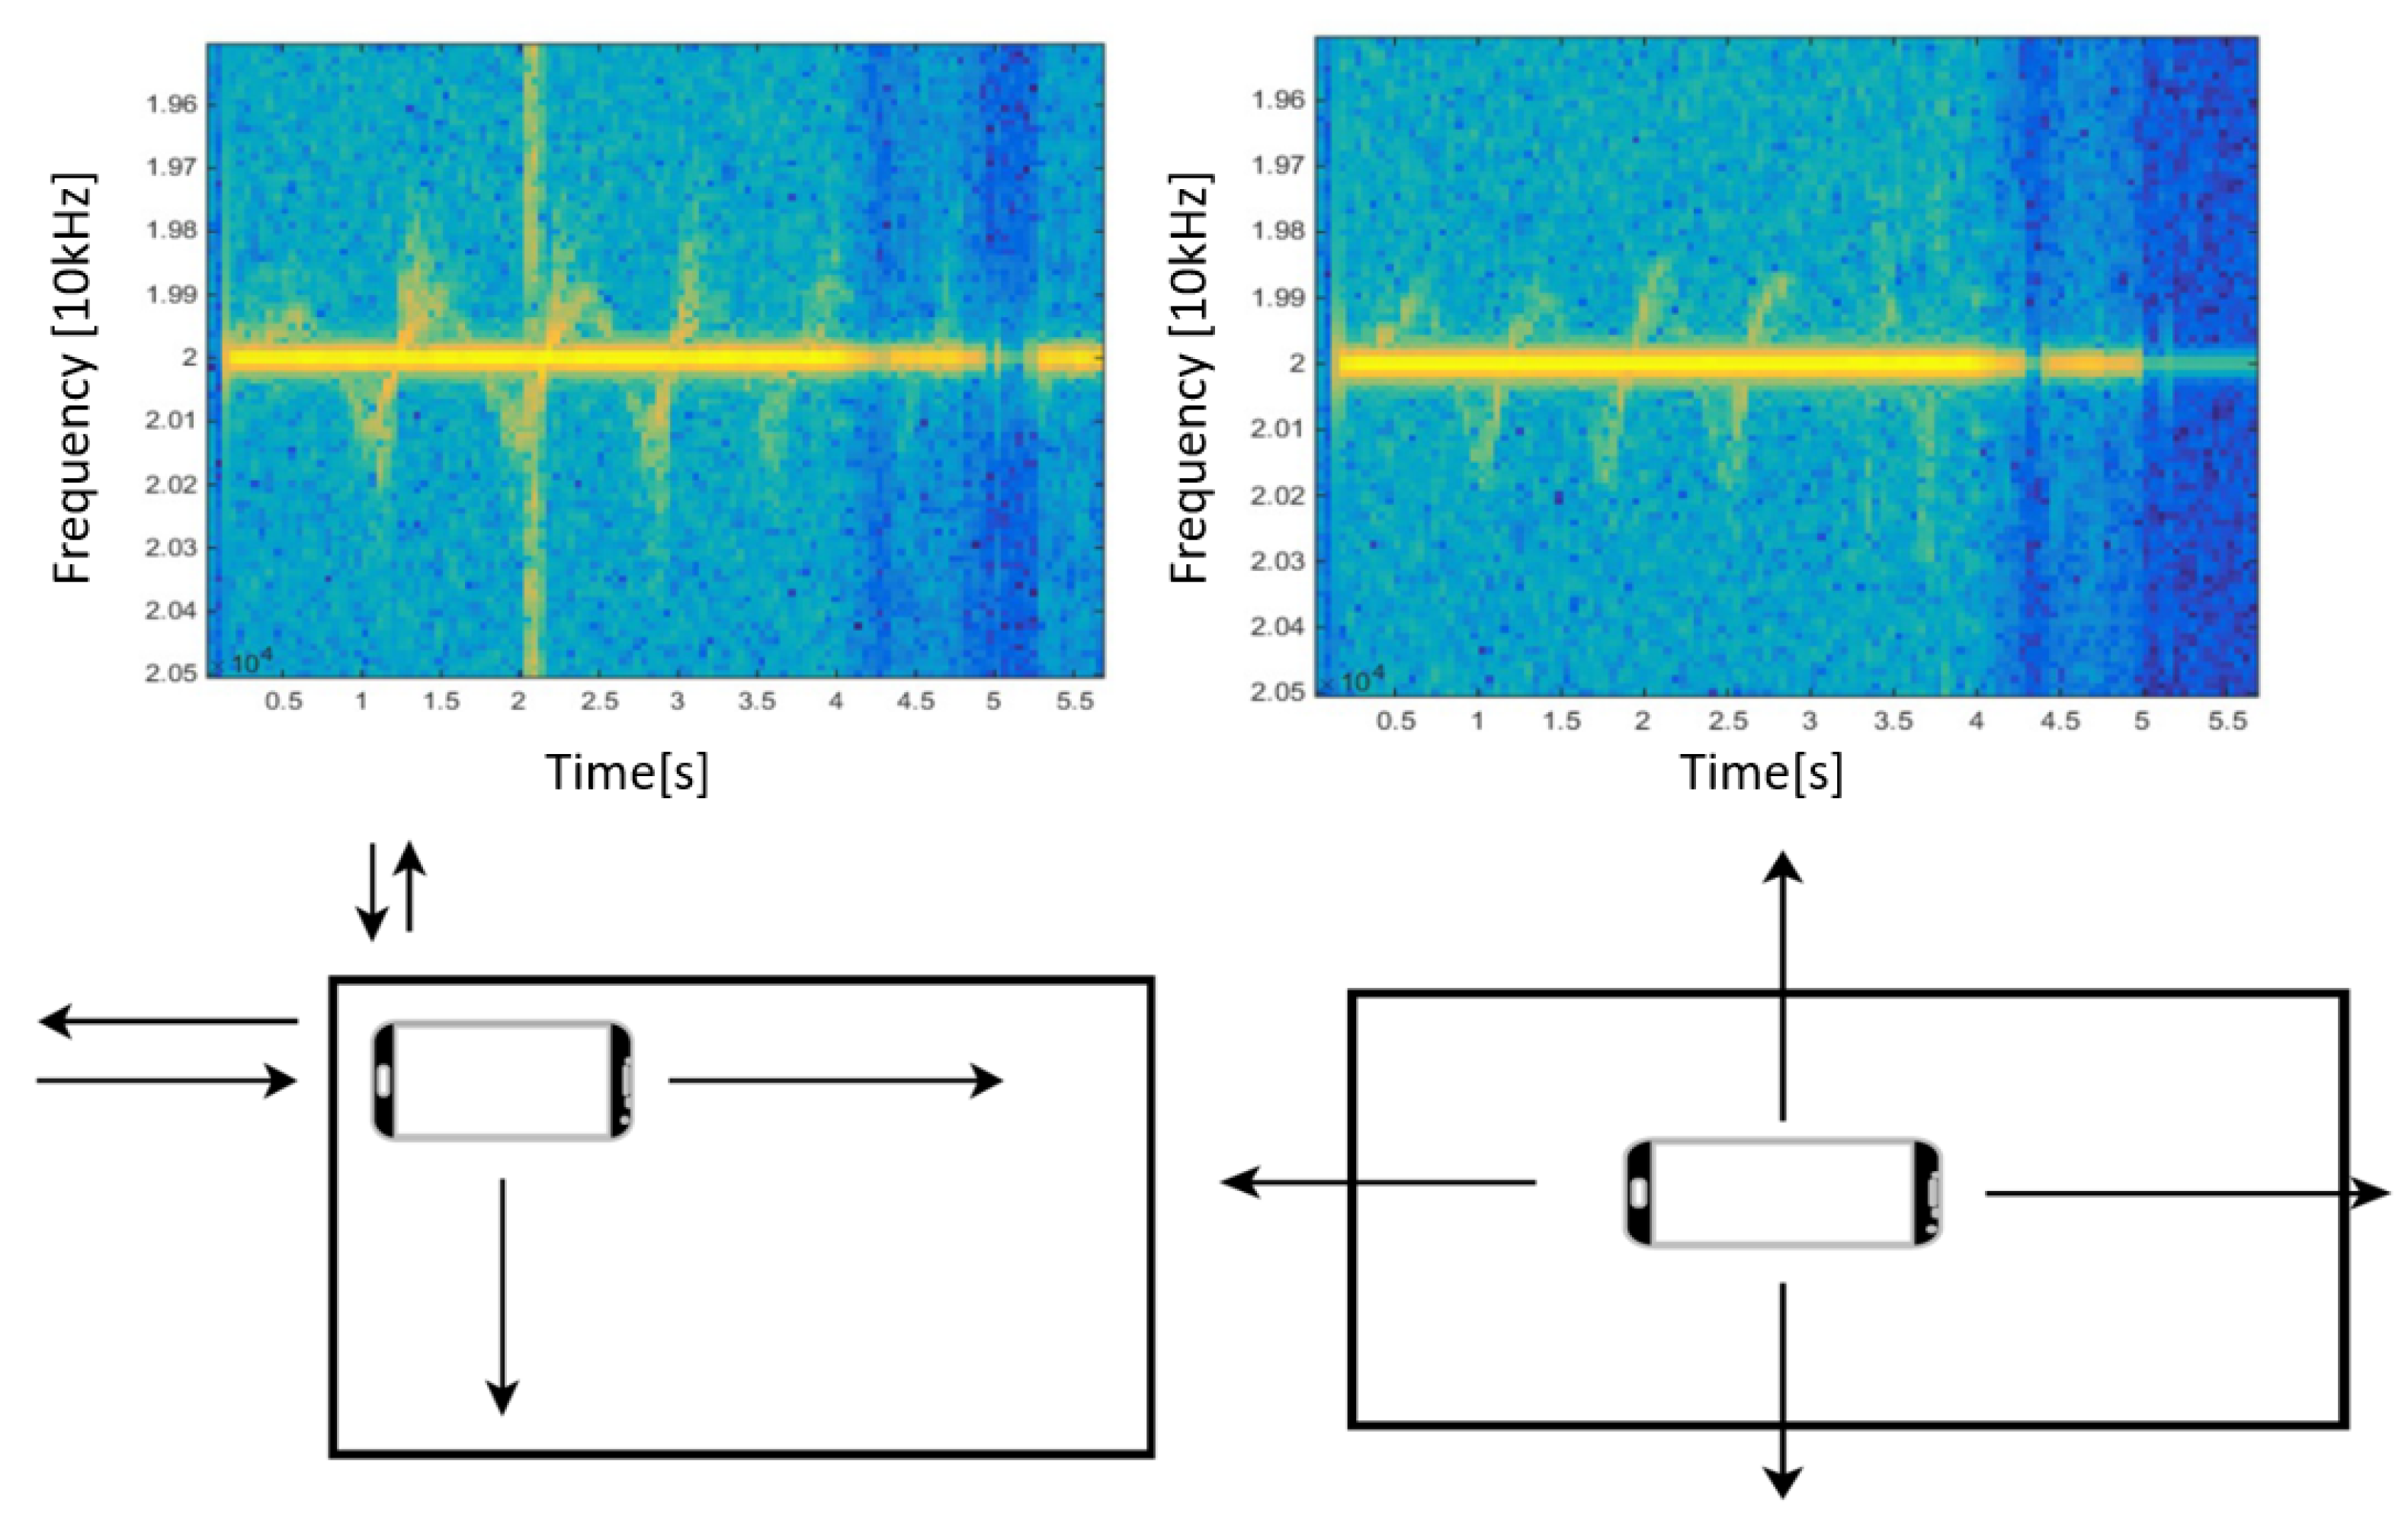
For now, we implemented a mobile application to remotely annotate and collect the exercises data. The same application will be installed on two smartphones. This module can discover the peers registered under the same WiFi and connect them together. One device is used as a slave device to collect the data while users are performing sports activities close to it. The second device is used as a master device to remotely and manually label the activities performed. As for installation, there is no need for any external hardware. The data collection app has to be installed and running on the smartphone. It then can be placed on the ground and start to collect the echo of performed activities in the vicinity of the device. Since the backscattered signal is strongly dependent on the power emitted by the device itself, we have turned the device volume to the maximum level to assure enough signal back propagated by the reflection of the body. The signal strength should survive the two-way-paths.
For testing various classification schemes, we evaluated the data from the field test based on post-processing using Python and the scikit-learn library from Python [
21] on a normal Desktop PC. We first pre-processed our data using the algorithm described in
Section 2. We kept the preprocessing step simple, which only includes normalization and frequency band extraction. We then conditioned the collected data to compare these three different activities with each other. In
Table 1, we can see the time duration of the fastest and slowest speeds of the performed activities.
We chose the average time performing each activity and thus have to inter- or extrapolate the collected data to make them into comparable data formats to feed them to the common classifiers. A simple linear interpolation scheme is used to condition the data. Therefore, the input data have the dimension of 186 × 40, ranging from frequency to time domain. The 186 frequency bins represent the frequency range of 19 kHz to 21 kHz and 40 time samples represent a duration of 1.85 s. For the current evaluation, the start and end markers are labeled manually. For later online application, the sliding window approach should be used to classify different sports exercises.
We then tested different classification schemes including Naive Bayes (NB), support vector machines (SVM), random forest (RF) and AdaBoost to evaluate the classification results. To perform the classification, we further divided all collected samples into 80% training samples and 20% test samples. This makes sure that the classifier has not seen the test samples before during the training phase. In this way, we can generalize the outcome of our classifier for unknown inputs. We also use the 10-fold cross-validation to show the macro-precision and the macro-recall to the different classification schemes. In the following section, we describe the evaluation results for all the different classifiers tested and try to offer the best suitable classifier for our intended application.
4.2. Evaluation and Comparison
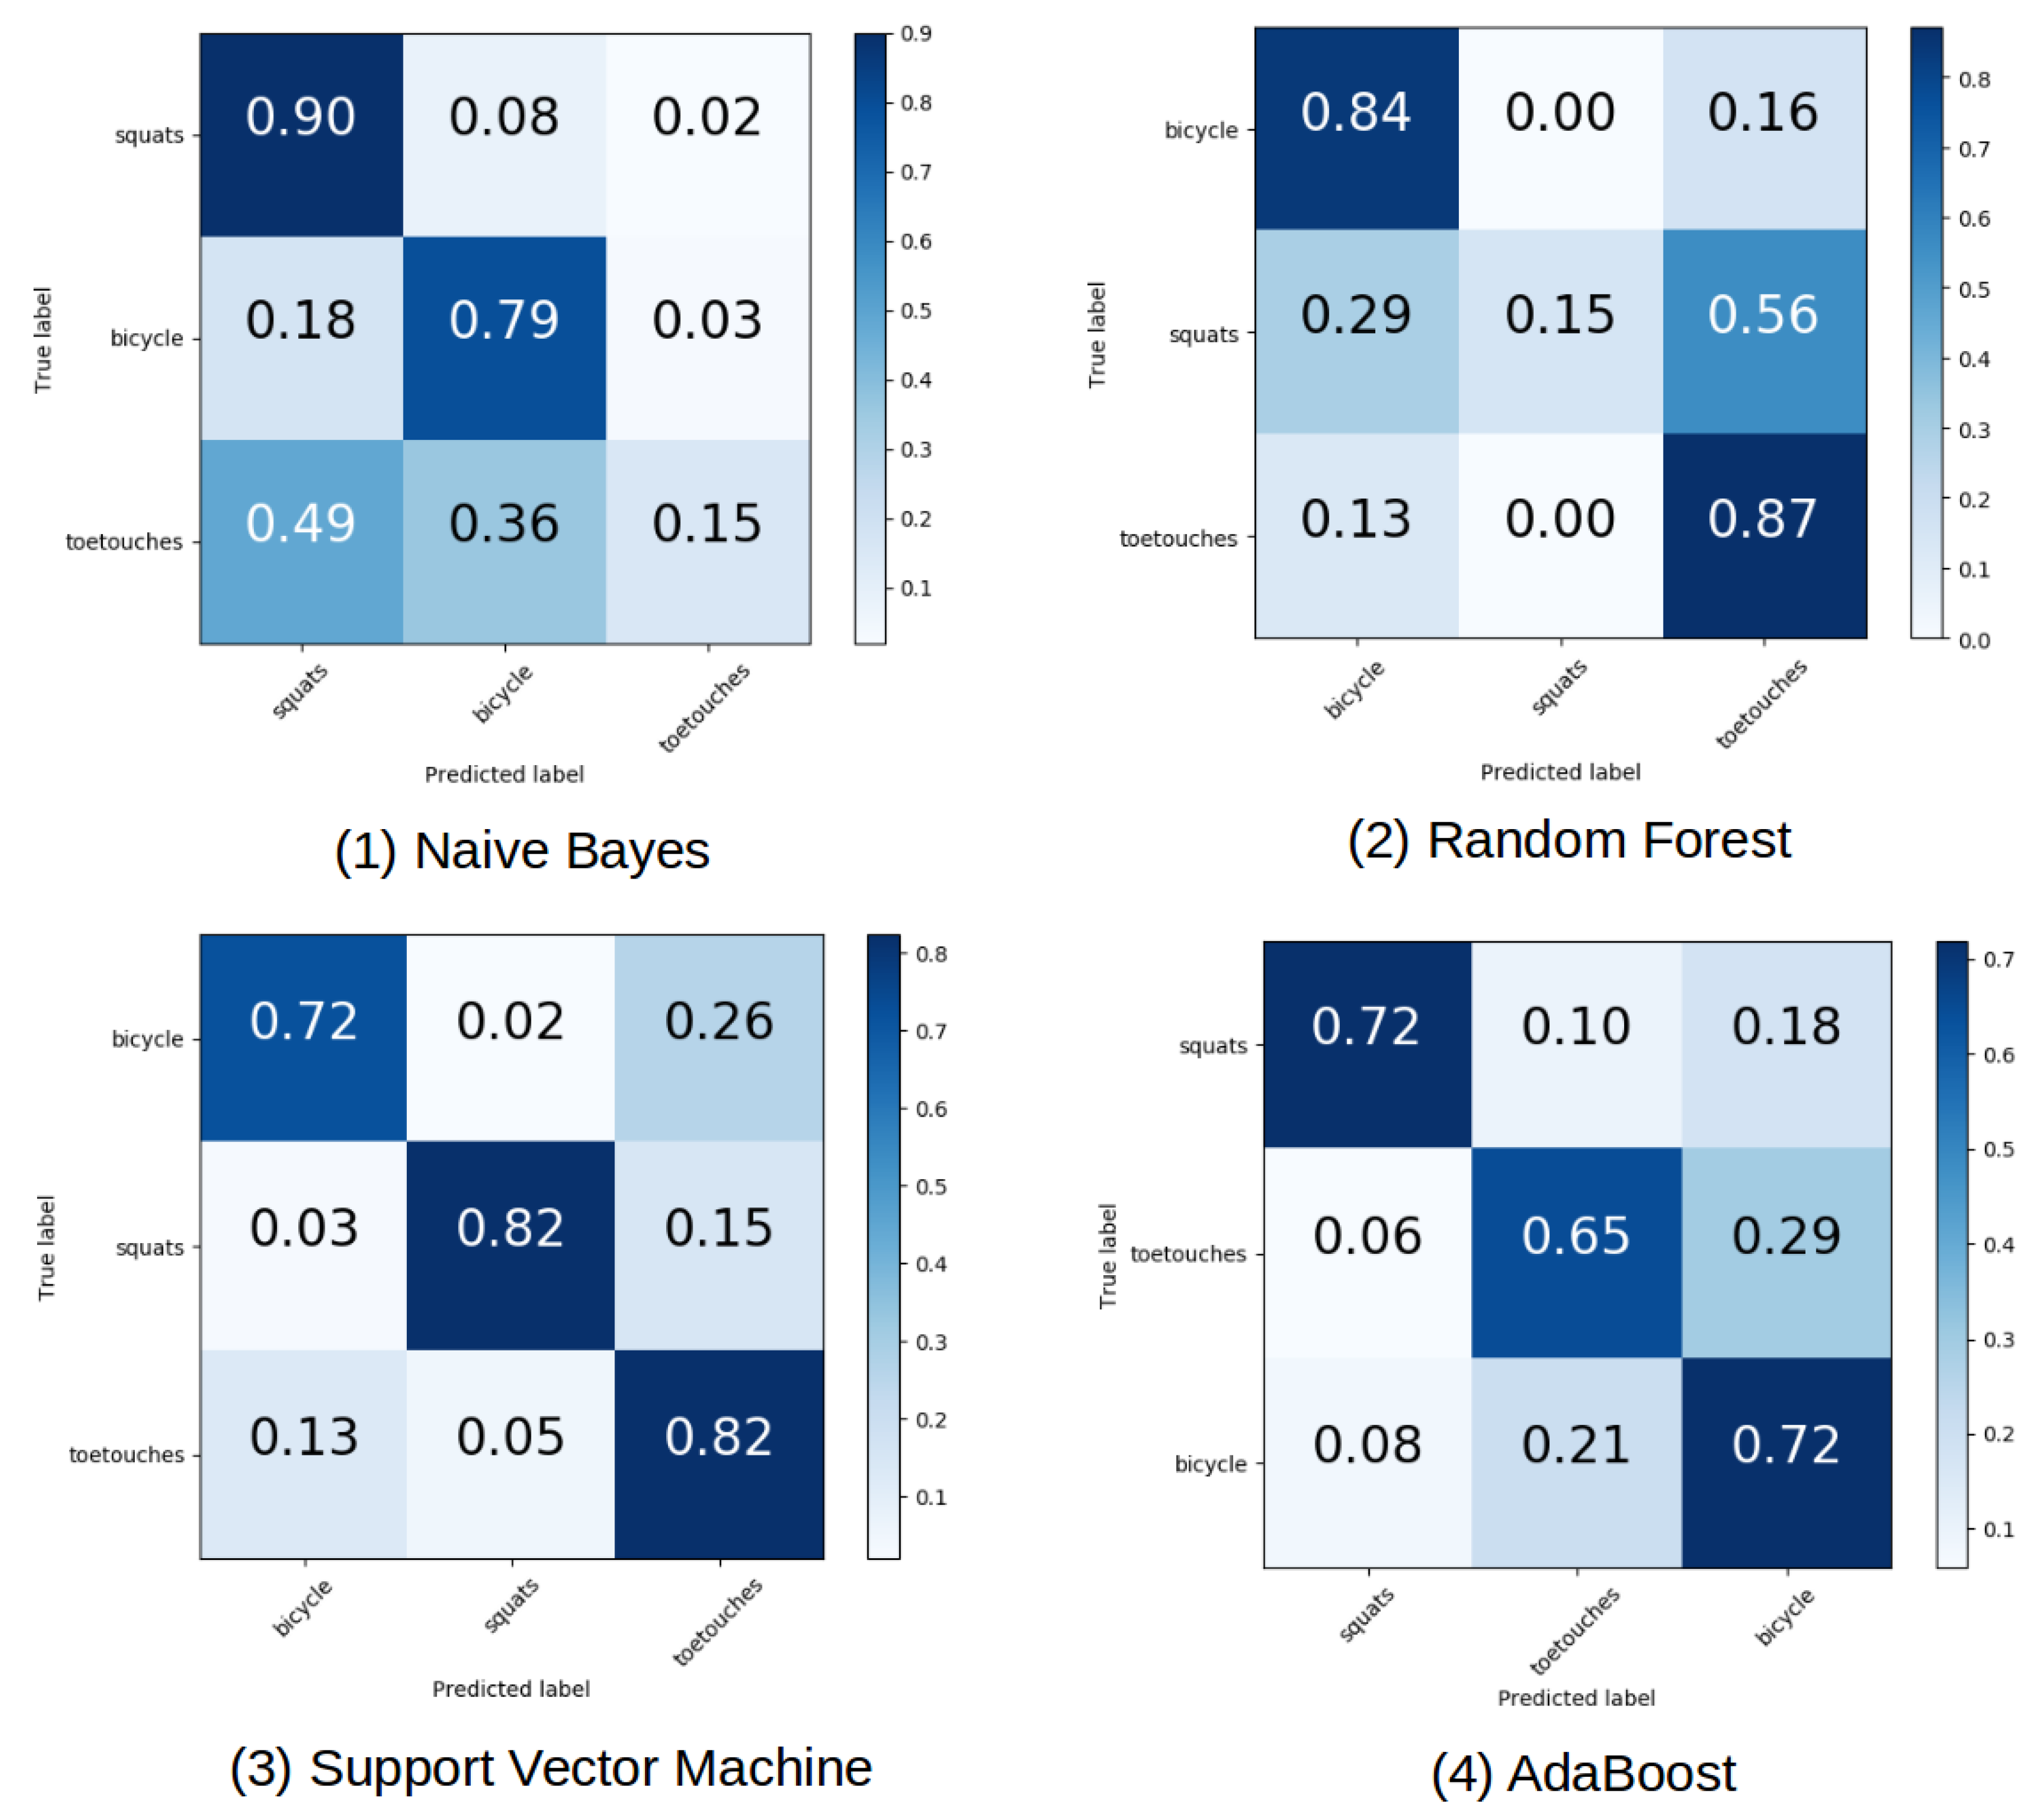
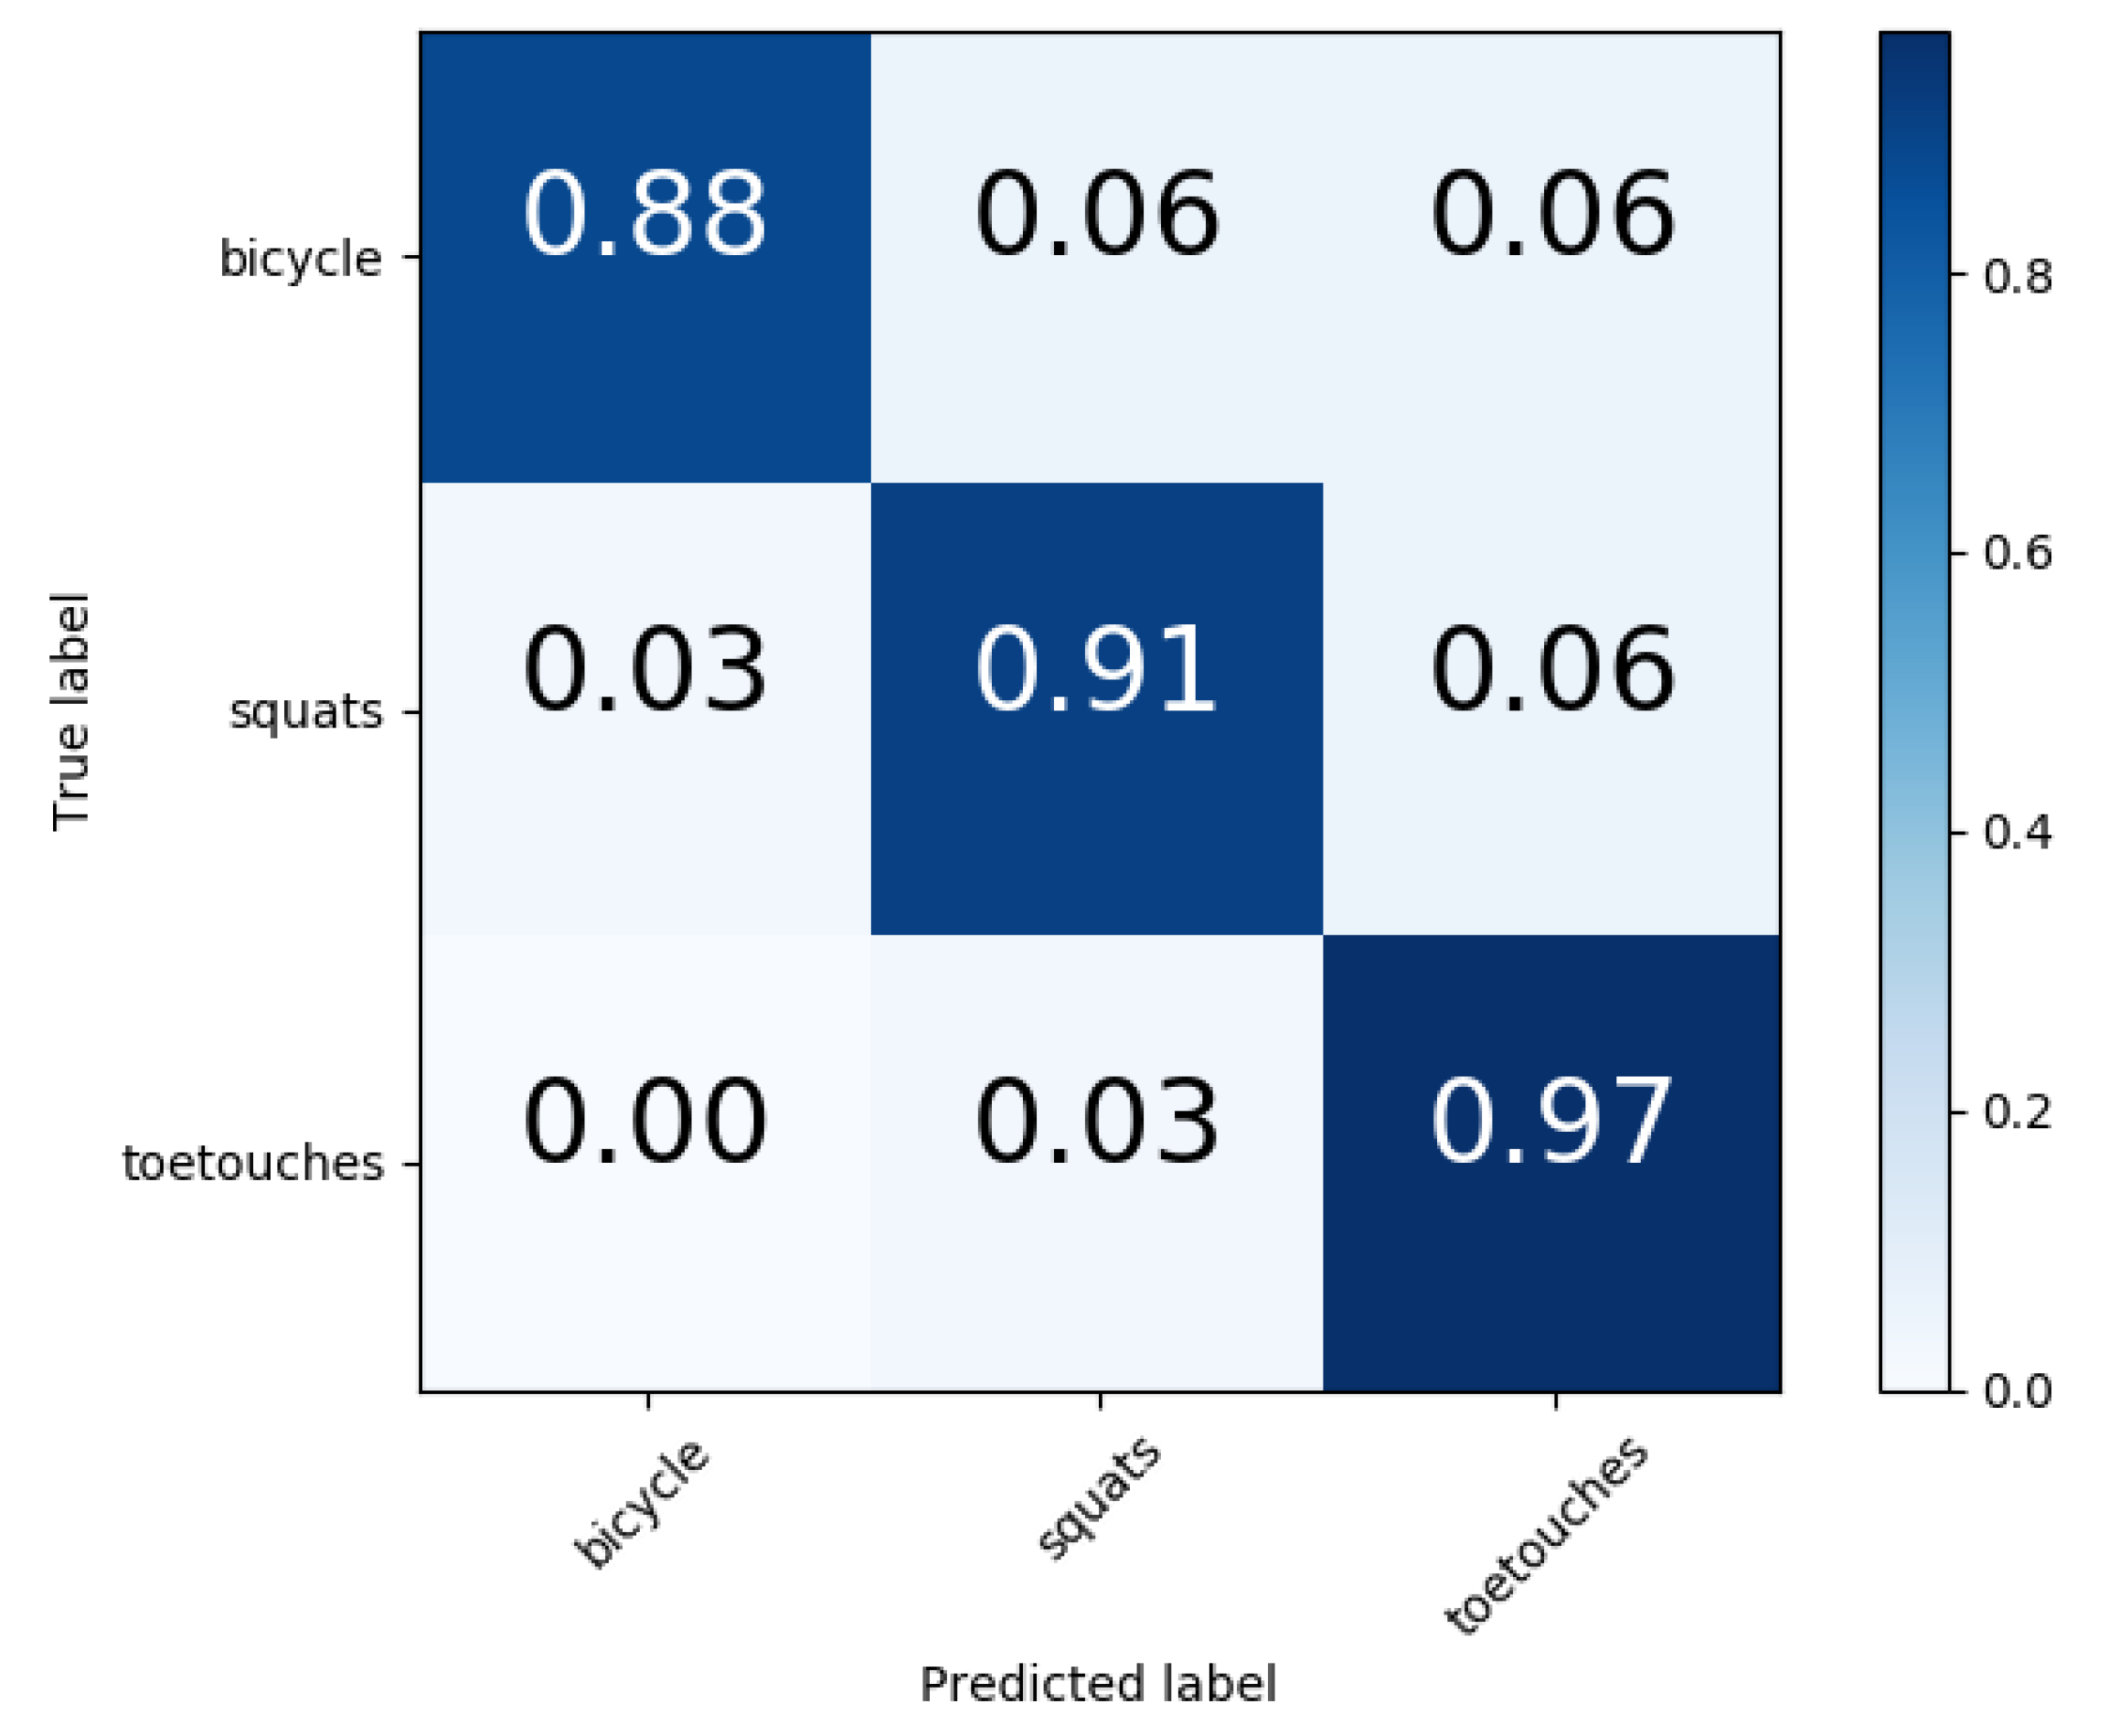
The confusion matrix for different classifiers is given in
Figure 3 using the same split on training and test data. Naive Bayes classifier has a very high misclassification rate for the class toe touches compared to the class bicycle and squats. It often got the class toe touches confused with the other two classes. The class squat has the highest classification accuracy of 90%, while the class bicycle follows with an accuracy of 79%. Although the confusion matrix for Random Forest shows a relatively high accuracy of 84% for the class of bicycle and 87% for the toe touch class, it still works poorly on the class of squat. The Hyperparameters for Random Forest are shown in
Table 2. We use 300 different single estimators with the maximum tree depth of 100 to setup our classifiers.
The confusion matrix for Multi-classes SVM using the one-versus-rest classification shows clearly better results. In our case, we used a linear kernel and a regularization parameter to prevent our classifier from overfitting. The Hyperparameters to setup the support vector machine can be observed in
Table 3. In this scenario, the misclassification problems between squats versus bicycle or toe-touches or the misclassification between toe touch versus squats or bicycle have been drastically reduced. We obtain an accuracy of 72% for bicycles, 82% for toe-touches and 82% for squats. The overall performance is more stable and the results are much better than the Naive Bayes classifier or the Random Forest. Despite the slightly higher accuracy for the class of toe touch in the Random Forest classifier, we still cannot expect the RF classifier to outperform the support vector machine.
For AdaBoost classifiers, we used 300 weak estimators to setup the hyper classifier. AdaBoost proves to be the better classifier compared to Random forest, as the confusion matrix is more balanced. The main diagonal shows relatively good results for all the three classes. The same accuracy of 72% was achieved for the classes squats and bicycle and an accuracy of 65% was achieved for the class toe touches. However, of all classifiers observed thus far, the AdaBoost shows superior performance to Random Forest and Naive Bayes. However, compared to the Support Vector Machine, this classifier showed worse results with a considerably higher computational load.
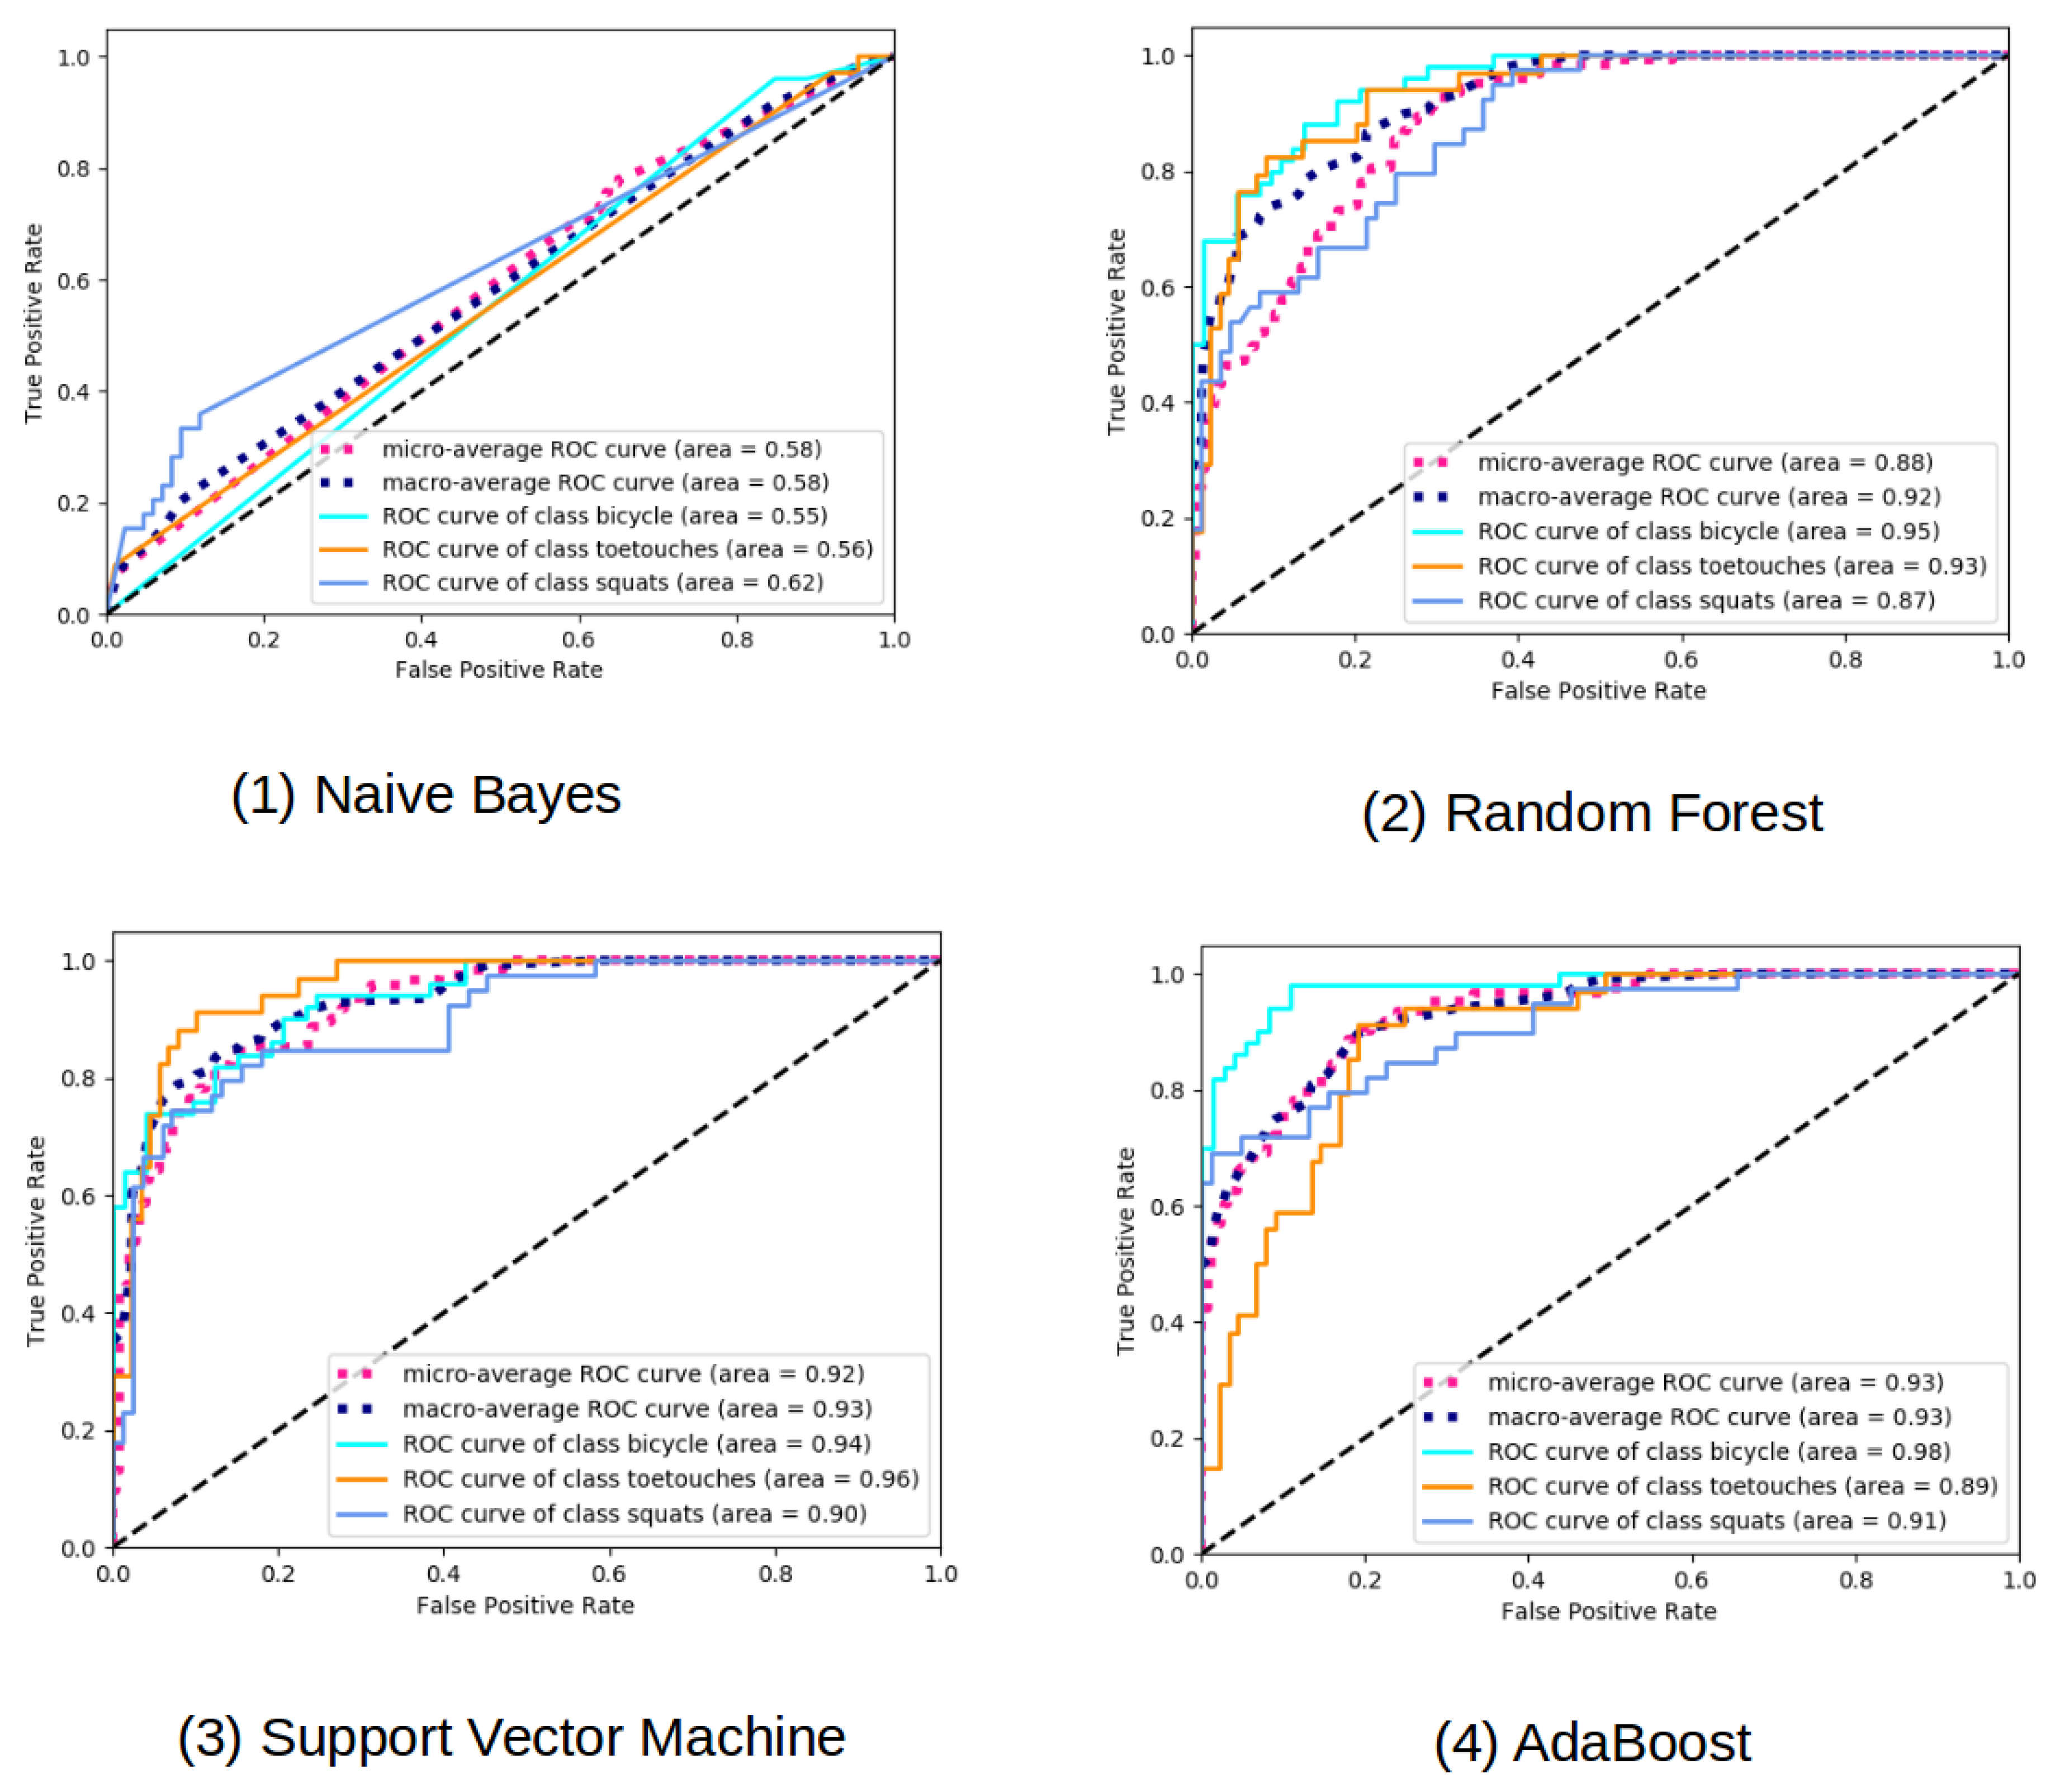
In statistics, a receiver operating characteristic curve (ROC curve) is used as a graphical plot to illustrate the diagnostic ability of a binary classifier system with varied decision thresholds. The ROC gives the relationship between the true positive rate and the false positive rate. The definition of true positive and false positive rate are given in Equations (
4) and (
5), respectively.
The representation of the terms true positive, false negative, false positive and true negative in Equations (
4) and (
5) can be viewed in
Table 4.
The area under the ROC curve (AUC) further indicates the performance of the classifier. If there is no classifier that has an AUC under 0.5, then the closer the AUC is to 1, the better the classifier works.
It is clearly shown that the Naive Bayes classifier is a bad classifier for this kind of data as the classifier is only slightly better than random decisions. The ROC curve for the Random Forest classifier can be see in
Figure 4. The curves are steeper than the ROC curve of the NB classifier, which again indicates that the Naive Bayes classifier works poorly. The same behaves for the area under curve, which intends that the RF is a better suited classifier than Naive Bayes for our data set. The performance of toe touch class and the bicycle class are quite similar and better than the class squats, as the area under curve is larger. The ROC curve for the Support Vector Machine shows the best result over all classifiers tested so far. The performance of all the three classes are quite similar, as the area under curve are nearly identical. This is a good sign for choosing Support Vector Machine as a robust classifier for our application. The ROC curve for the AdaBoost classifier can also be seen in
Figure 4. The class bicycle performs the best, while the class toe touch and the class squats behave similarly. These classifiers are steeper than in the case for the Random Forest, but not equally good as in the case of the support vector machine.
To give a more generalized score for all the classifiers tested, we give the macro precision score and the macro recall score for the 10-fold cross-validation case in
Table 5. The equation for precision and recall are given in Equations (
6) and (
7), respectively.
The macro-precision and the macro-recall are the average precision and recall for all the 10-fold cross-validation.
The macro-precision and macro-recall of the different classification results using leave one subject out cross-validation is depicted in
Table 6. The leave one subject out cross-validation can further show the person-dependency characteristic of the classification methods and hence is more generalized.

 ,
, 
