
A Generalized Linear Model and Machine Learning Approach for Predicting the Frequency and Severity of Cargo Insurance in Thailand’s Border Trade Context


Abstract
:1. Introduction
2. Literature Review
Machine Learning vs. Generalized Linear Models (GLMs)
3. Study Design
3.1. Machine Learning
3.1.1. Extreme Gradient Boosting (XGBoost)
3.1.2. Gradient Boosting Machines (GBMs)
3.2. Generalized Linear Models (GLMs)
3.3. Mathematical Formulation for Claim Frequency and Severity Prediction Models
3.3.1. Claim Frequency Prediction Problem Formulation
- represents the feature matrix, with each row containing the mentioned features.
- : Status of Goods
- : Cargo Type
- : Packaging Type
- : Start Country
- : Destination Country
- : Sum Insured Amount
- : Number of Claims
- represents the predicted claim frequency .
3.3.2. Claim Severity Prediction Problem Formulation
- represents the feature matrix, with each row containing the mentioned features.
- : Status of Goods
- : Cargo Type
- : Packaging Type
- : Start Country
- : Destination Country
- : Sum Insured Amount
- : Incurred Claims
- represents the predicted claim severity .
3.4. Hyperparameter Tunning
3.5. Outlier Detection
3.6. Z-Score Method
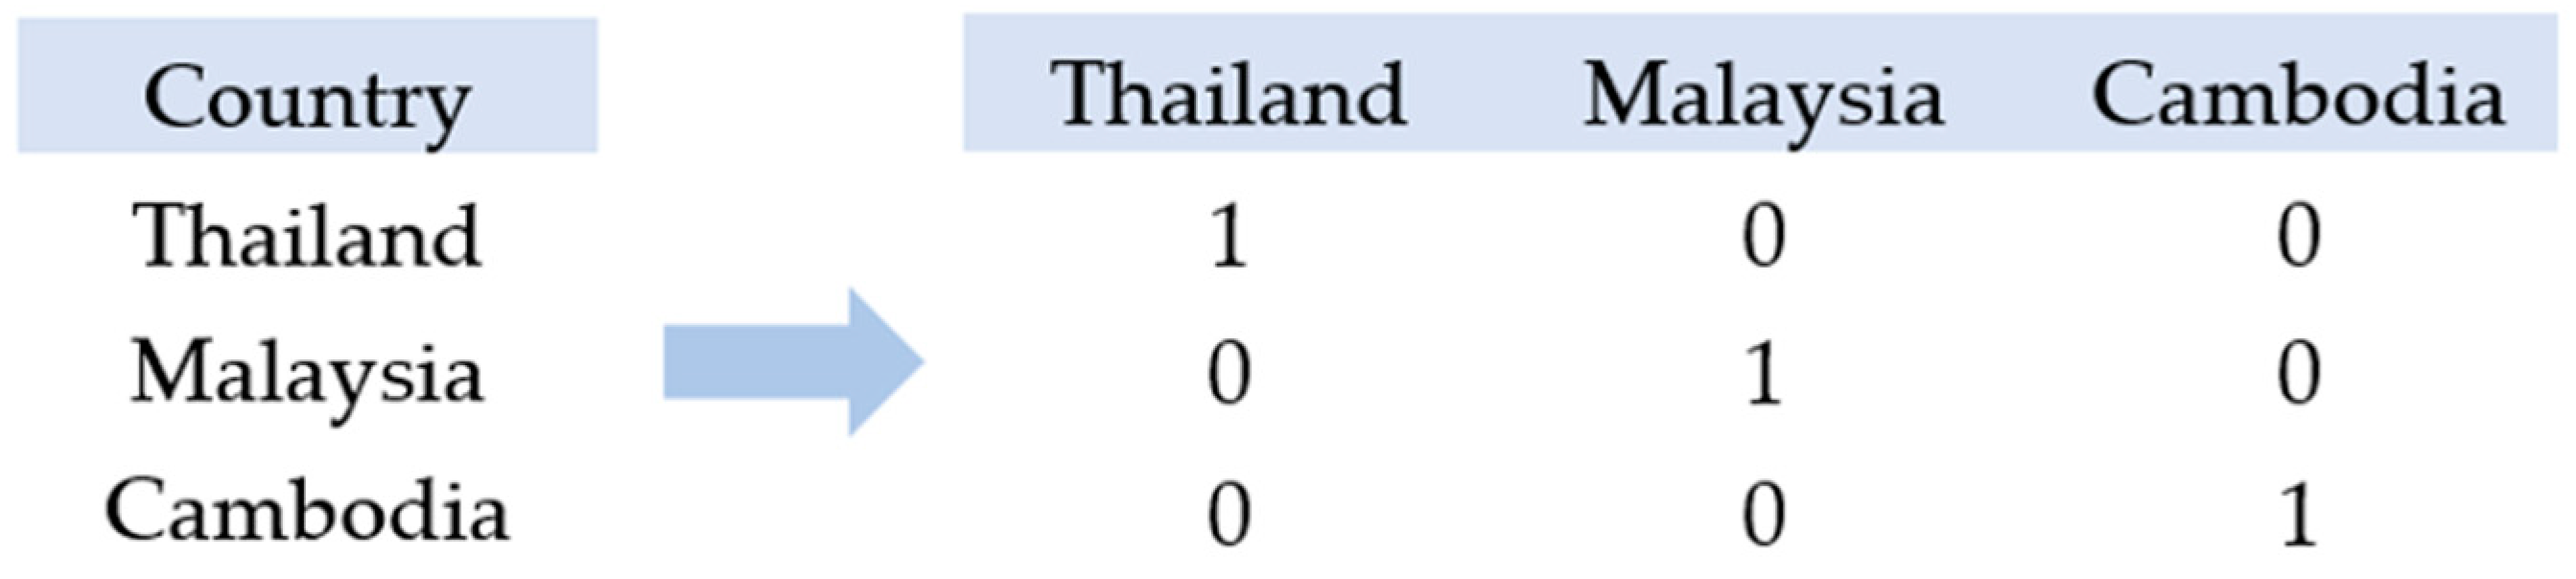
3.7. Data Encoding
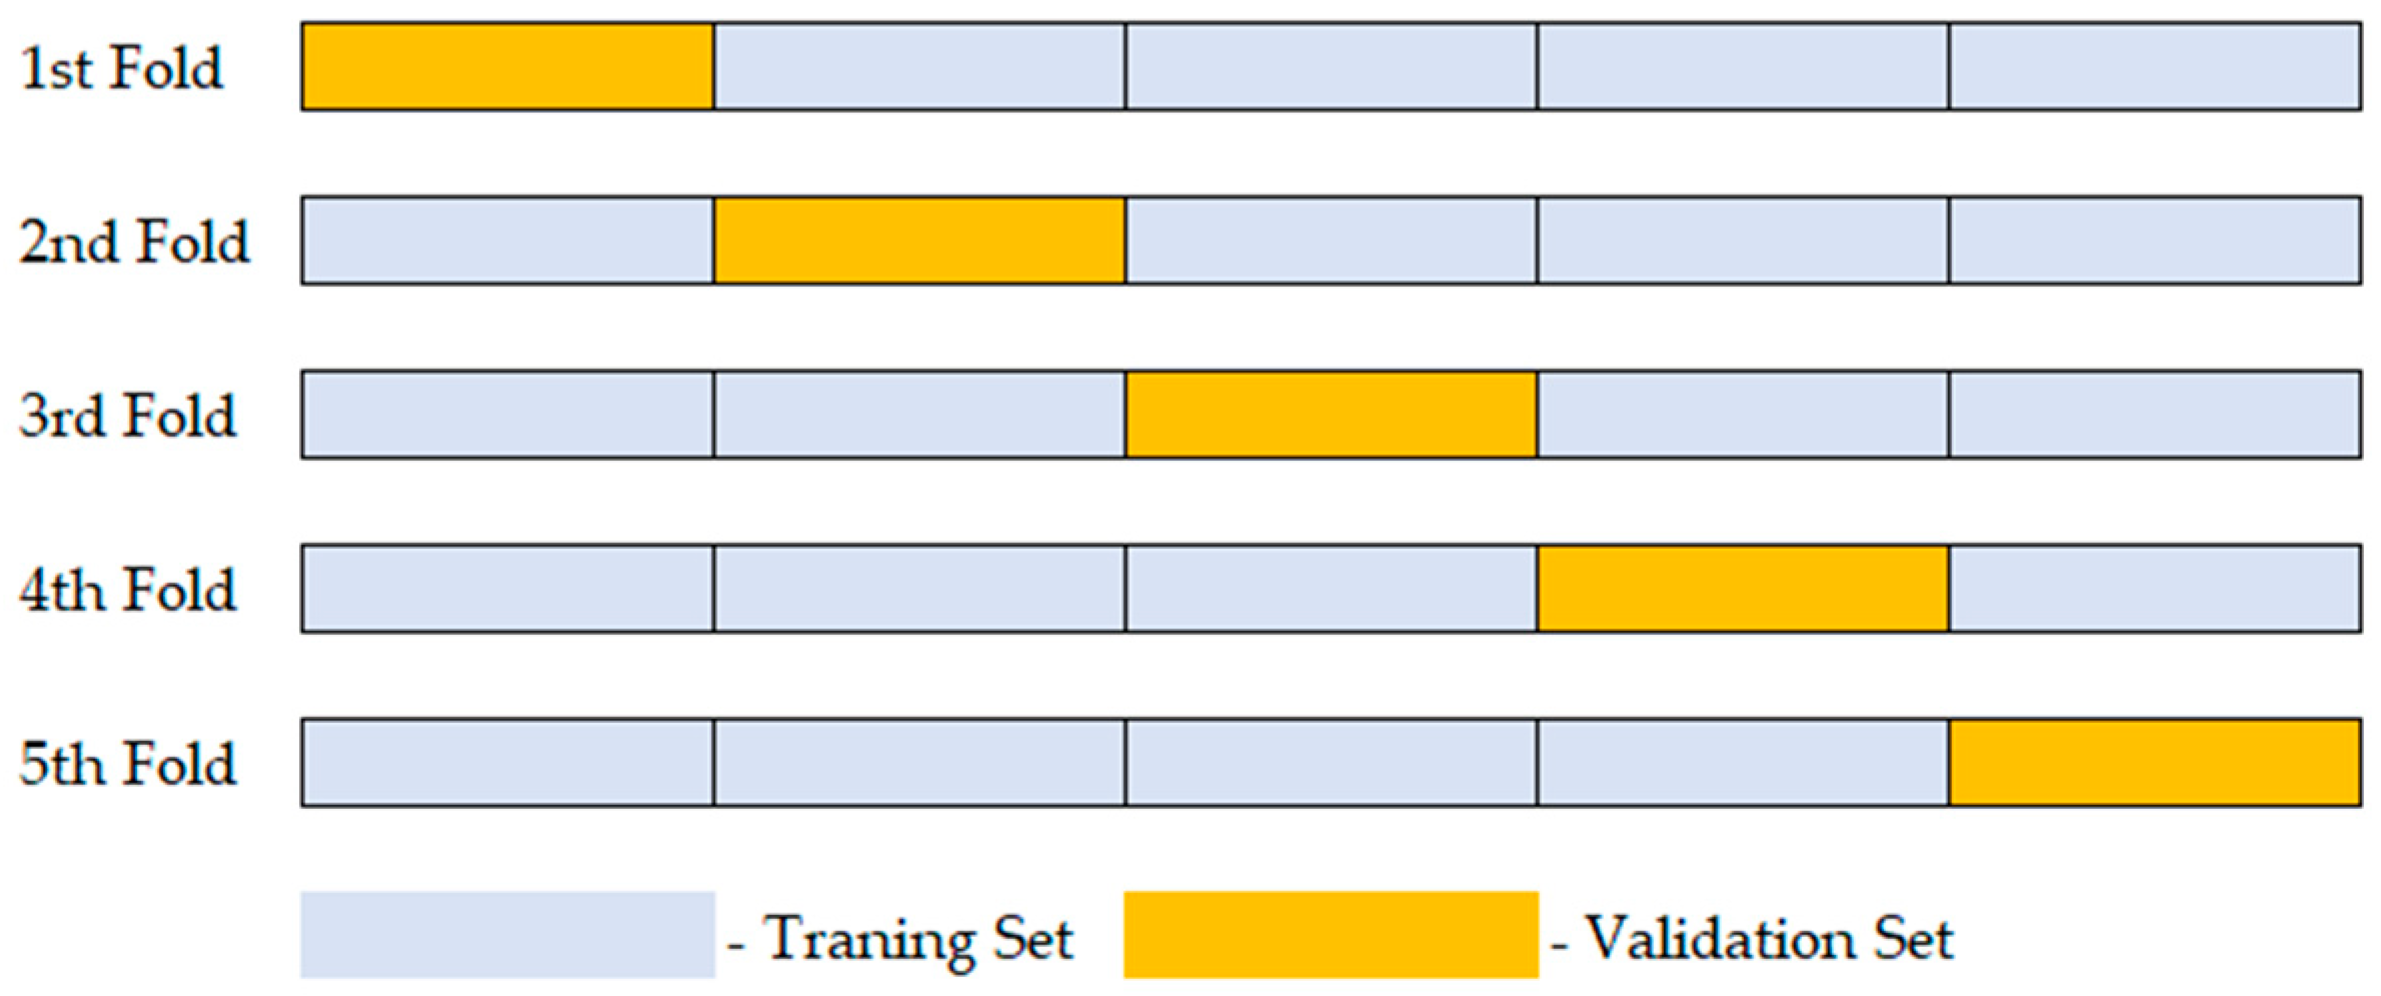
3.8. K-Fold Cross-Validation
3.9. Model Comparison
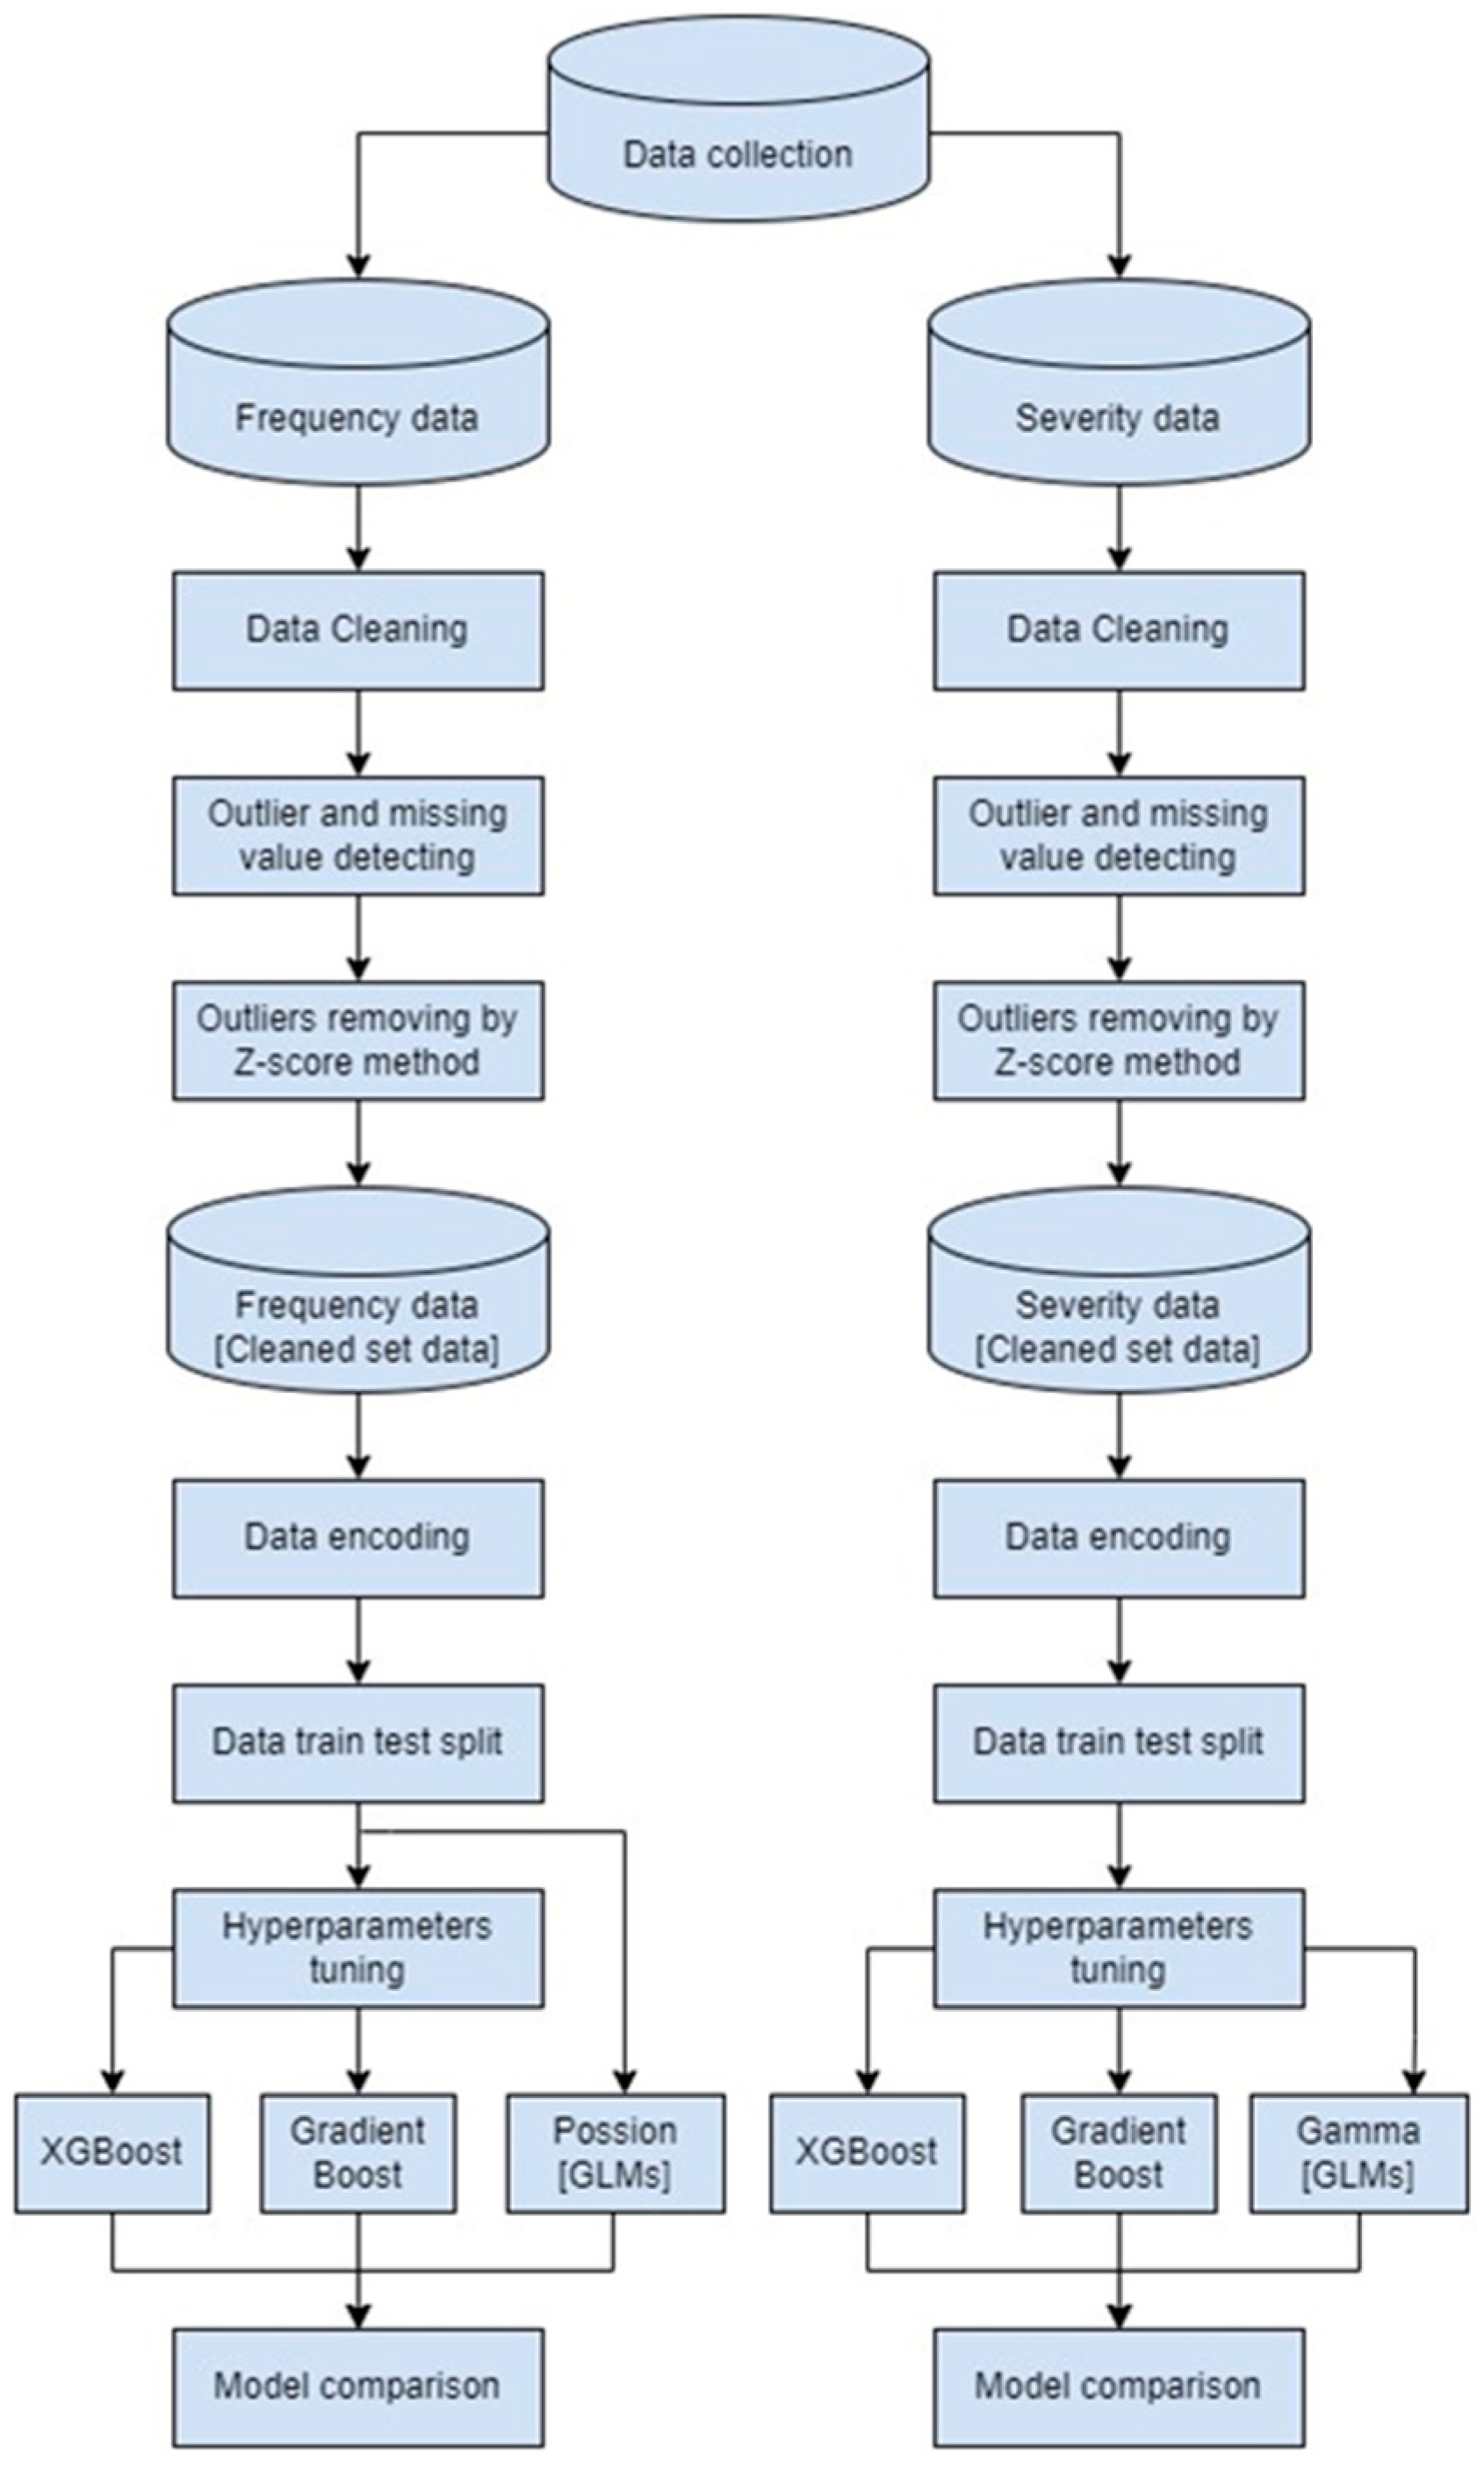
4. Research Methodology
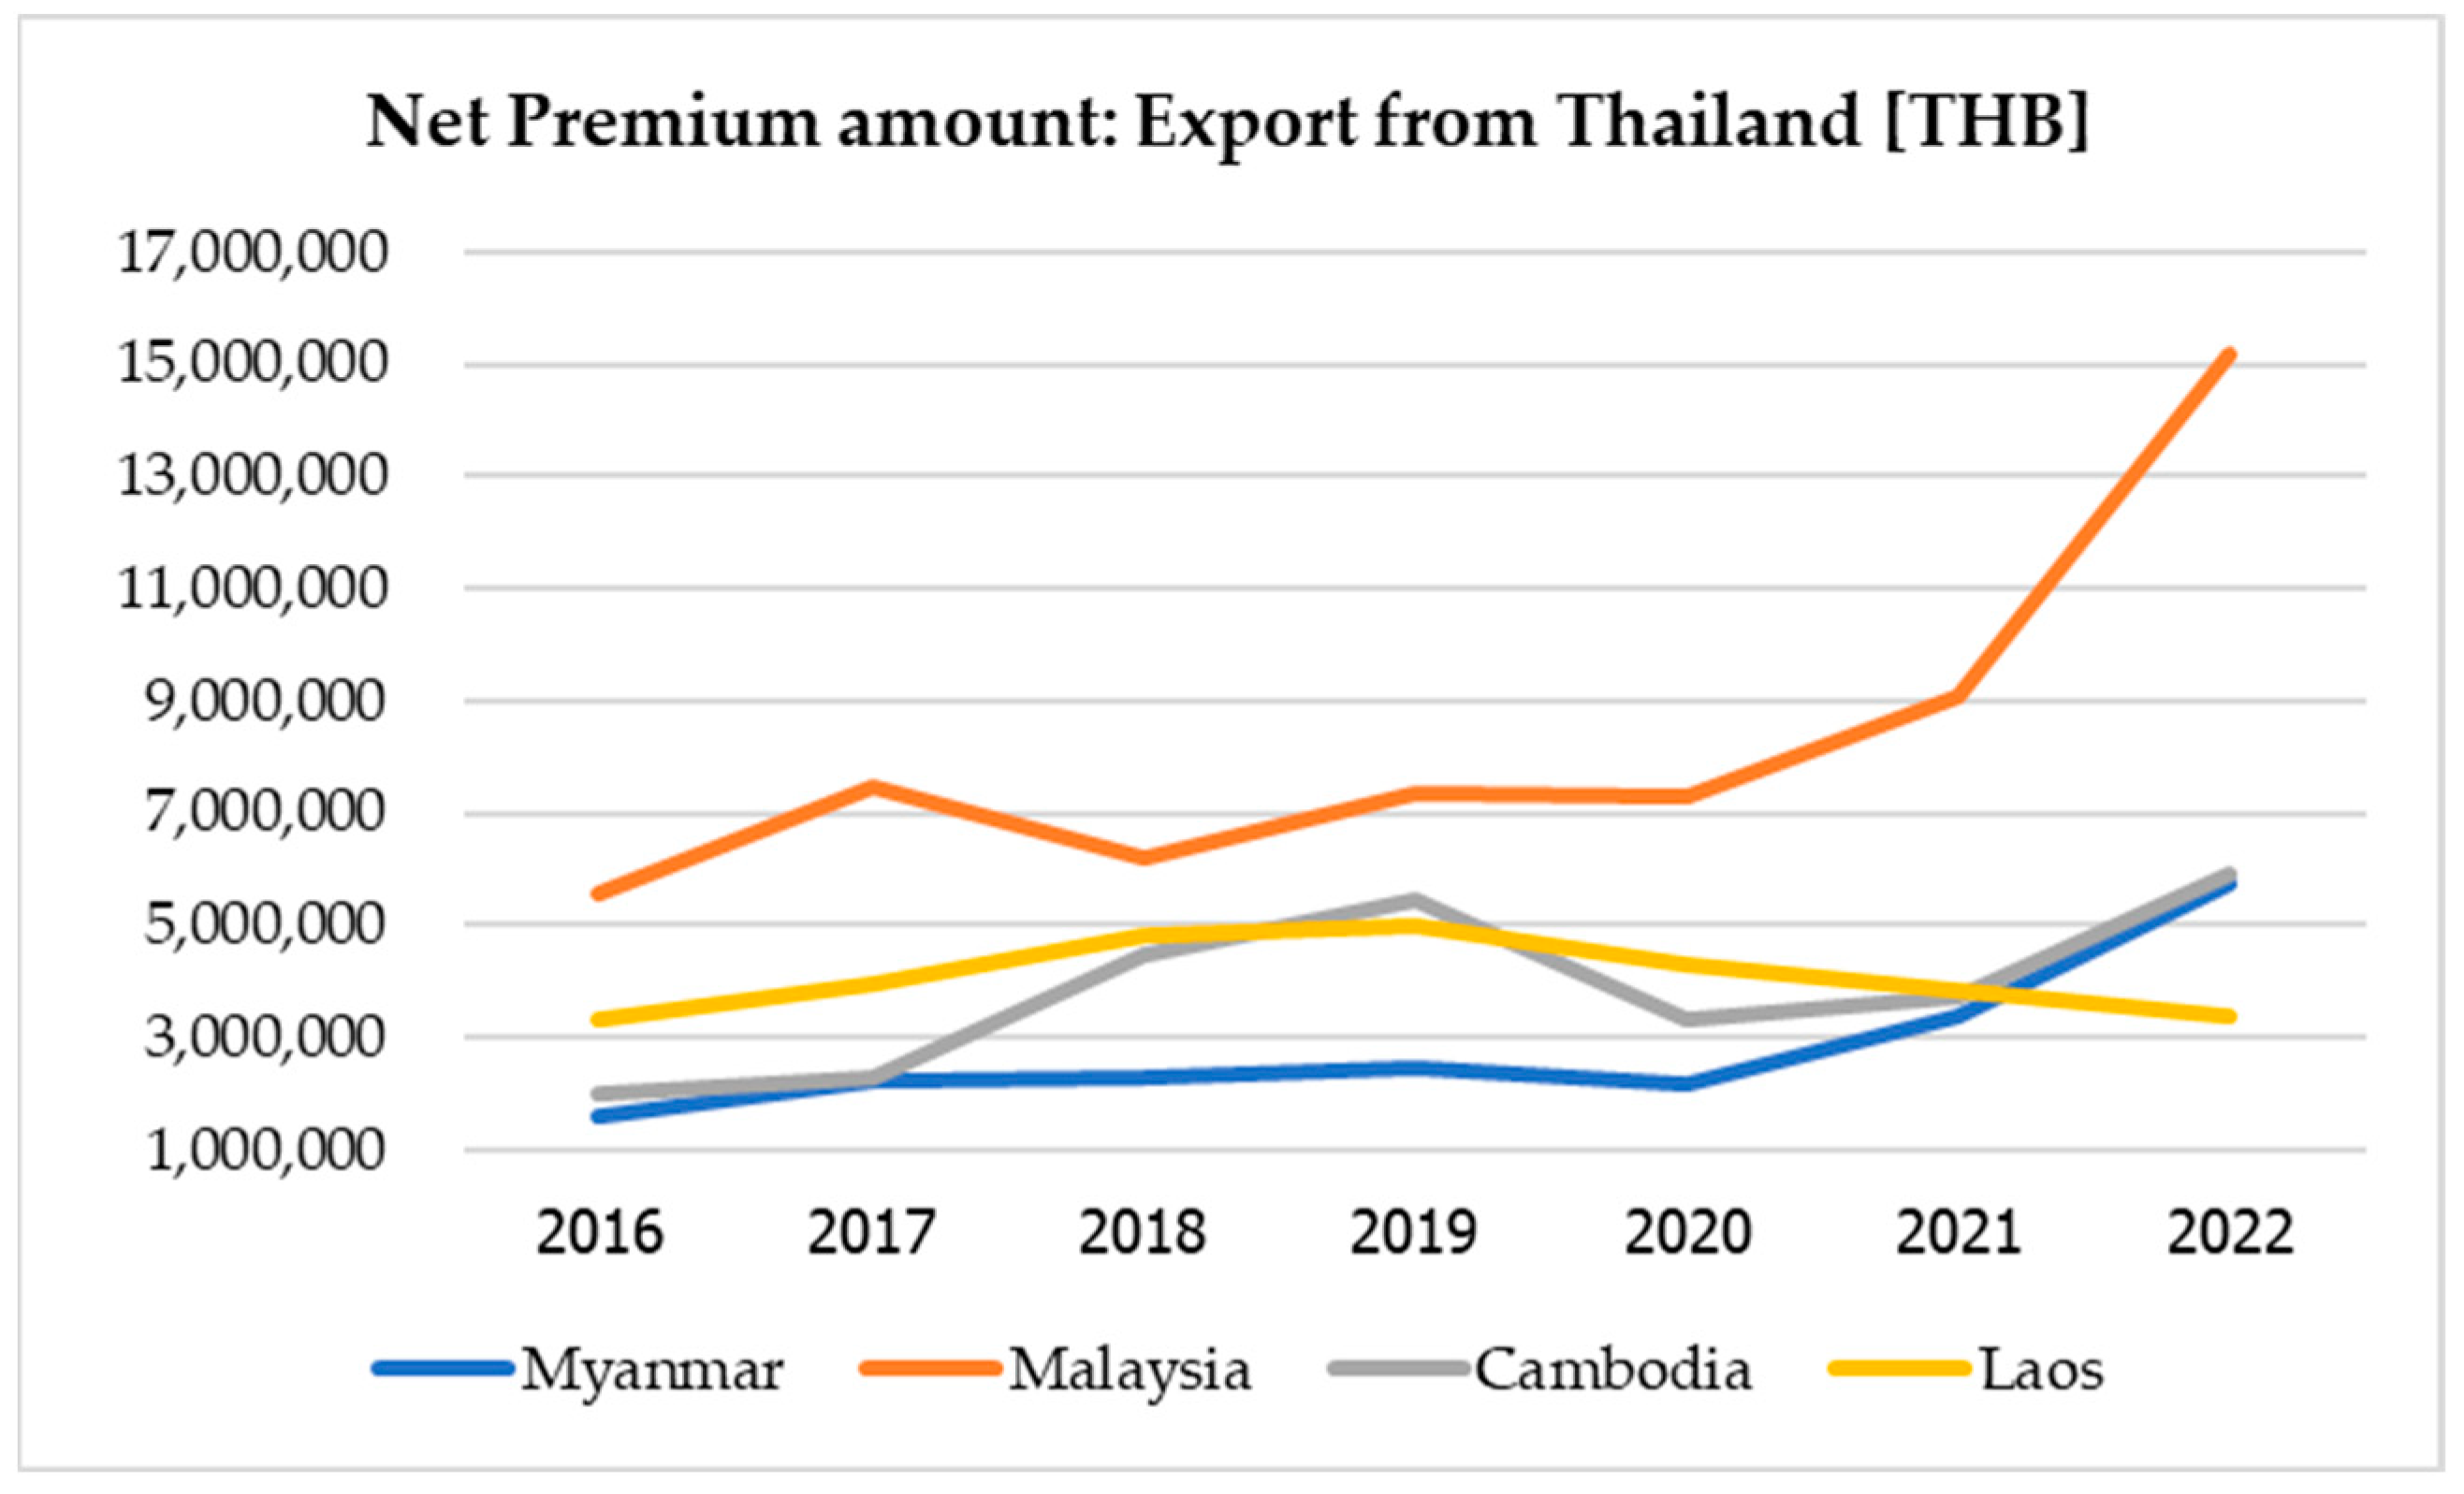
4.1. Data Collection
4.2. Dataset Size
4.3. Dataset Description
4.4. Research Tools
4.5. Research Methods
5. Result
Metrics Performance Comparison
6. Discussion
6.1. Frequency Predictive Performance
6.1.1. Extreme Gradient Boosting (XGBoost) in Predicting Claim Frequency
Application and Considerations:
6.1.2. Gradient Boosting Machines (GBMs) in Predicting Claim Frequency
Application and Considerations:
6.1.3. Generalized Linear Model (Poisson) in Predicting Claim Frequency
Application and Considerations:
6.2. Severity Predictive Performance
6.2.1. Extreme Gradient Boosting (XGBoost) in Predicting Claim Severity
Application and Considerations:
6.2.2. Gradient Boosting Machines (GBMs) in Predicting Claim Severity
Application and Considerations:
6.2.3. Generalized Linear Model (Gamma) in Predicting Claim Severity
Application and Considerations:
6.3. Model Performance Evaluation
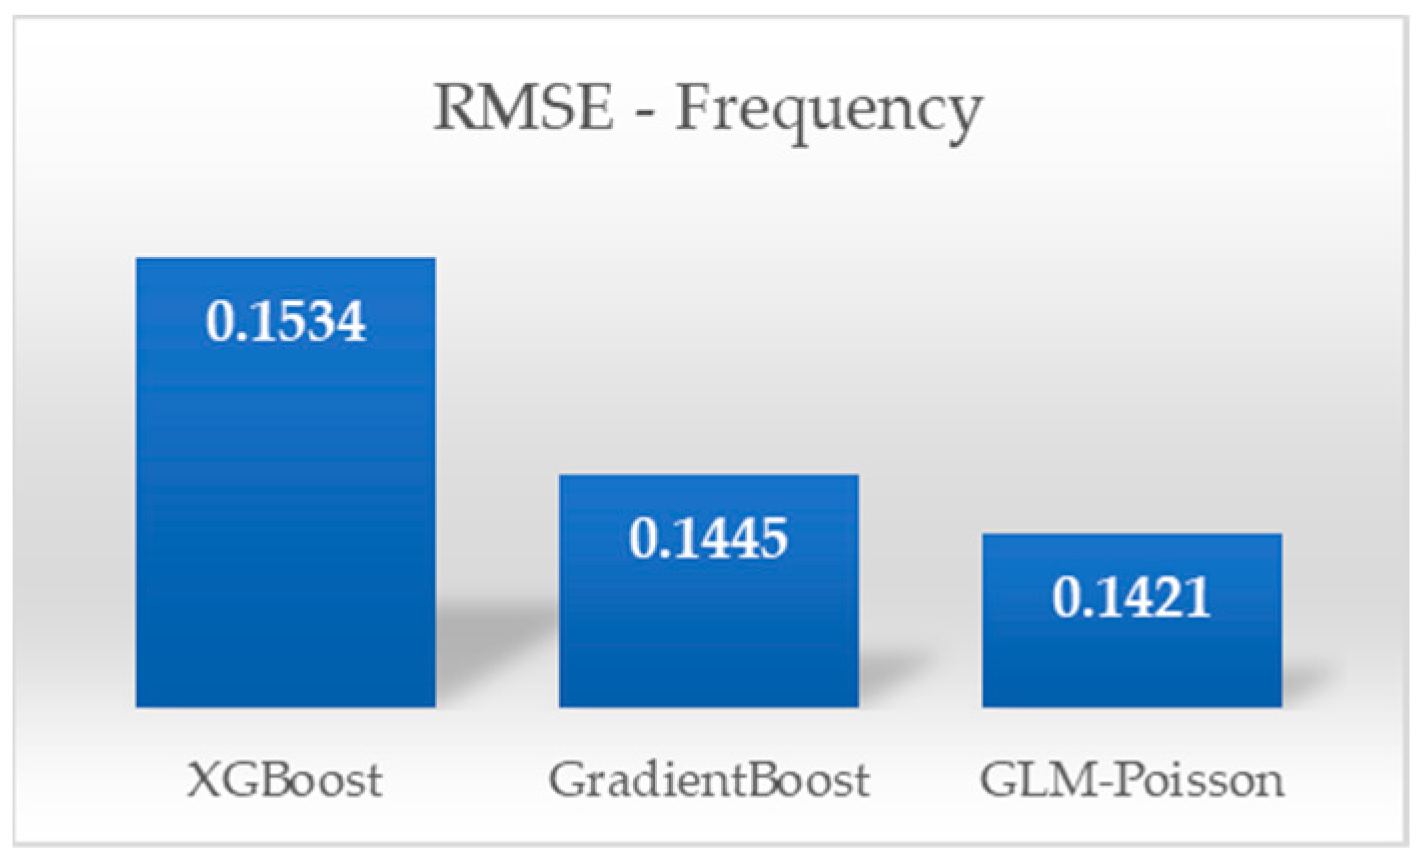
6.3.1. Frequency Predictive Performance Comparison
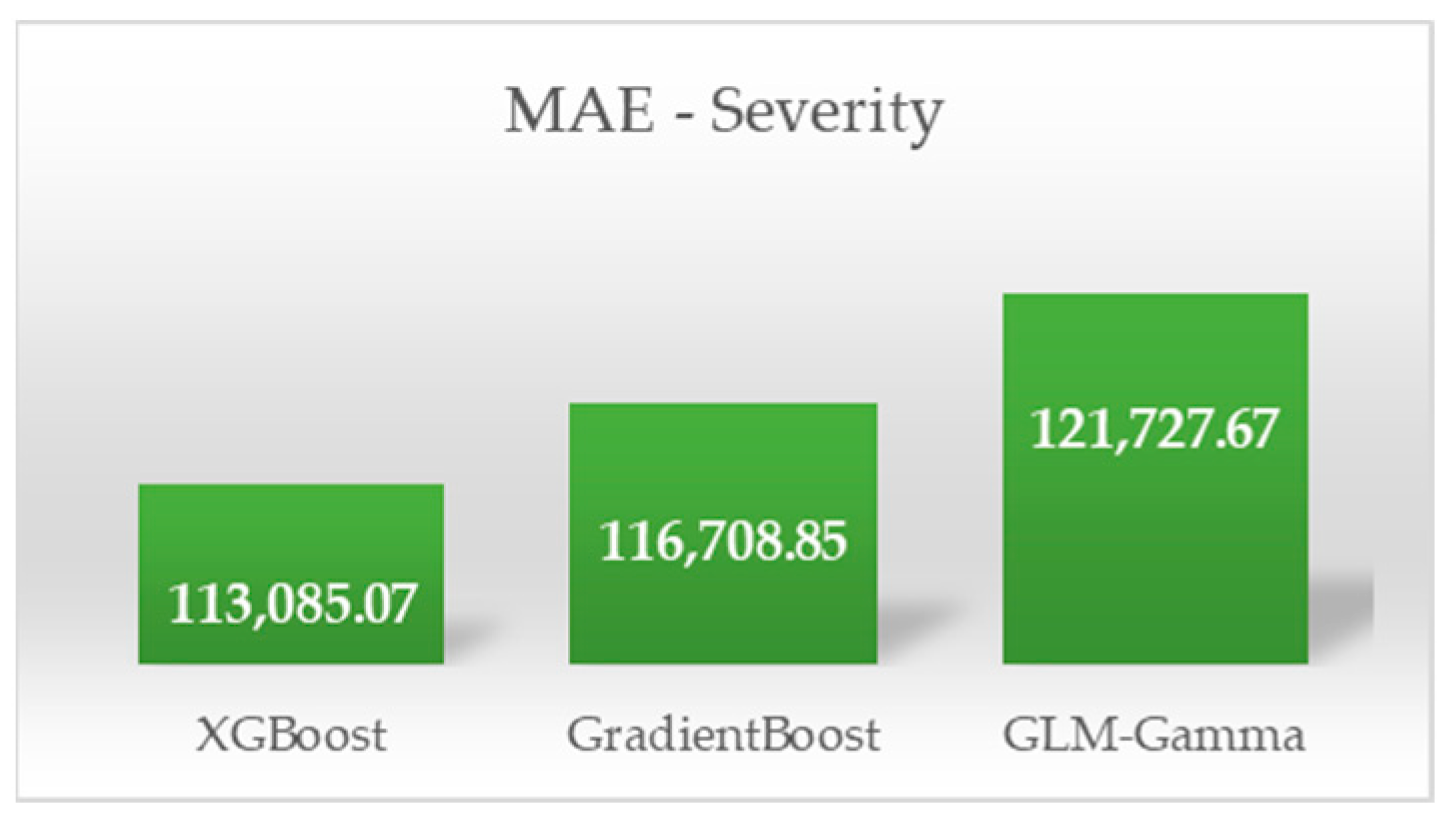
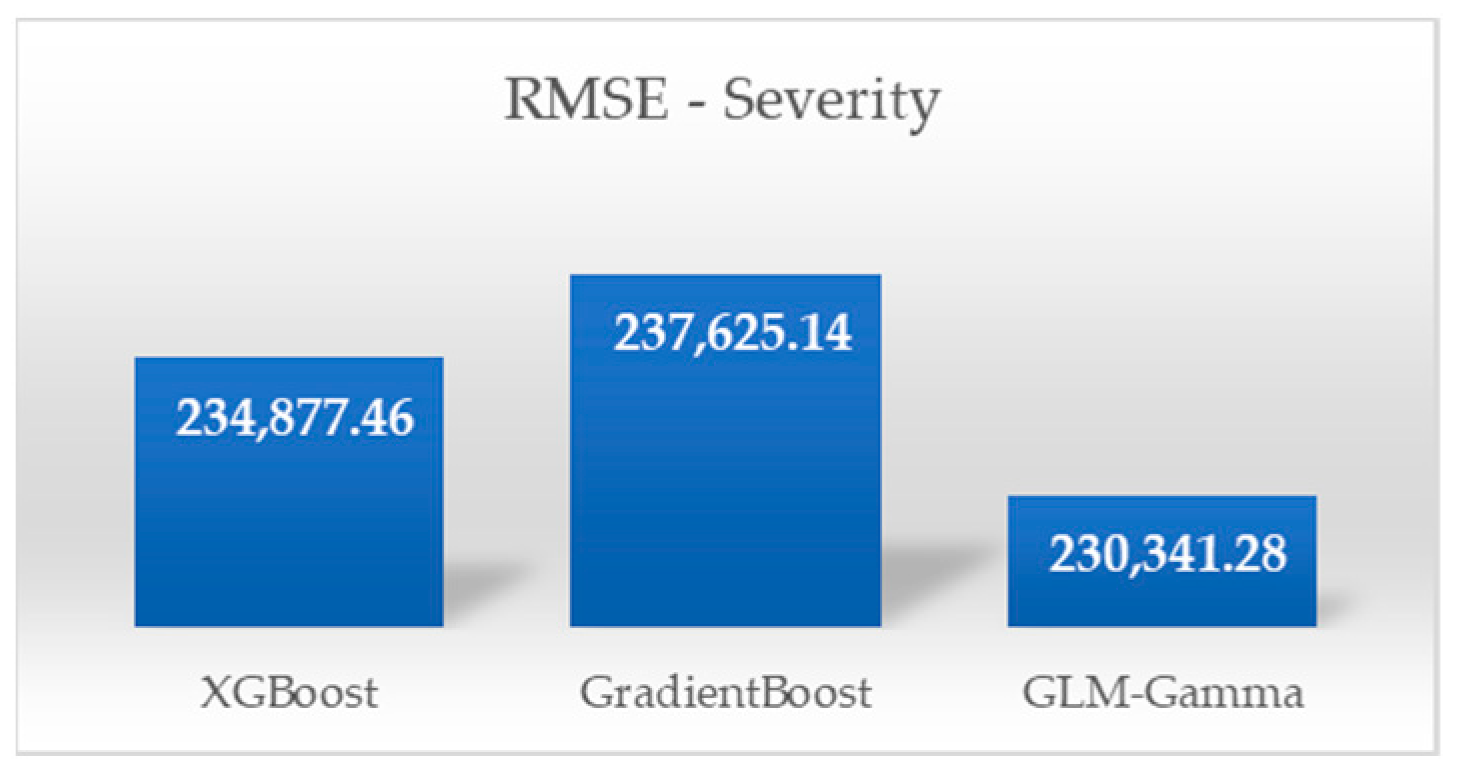
6.3.2. Severity Predictive Performance Comparison
6.3.3. Choice of Model
6.4. Potential Beneficiaries of Predictive Model Performance in Insurance: Leveraging Insights for Risk Assessment and Decision-Making
6.4.1. Insurance Companies
6.4.2. Government and Regulatory Bodies
6.4.3. Cross-Border Trade Entities (Trucking Companies, Shippers, and Consignees)
7. Conclusions
7.1. Contribution
7.1.1. Comparison of Predictive Modeling Approaches
- Conducts a comprehensive comparison between generalized linear models (GLMs) and advanced machine learning techniques.
- Focuses specifically on claim frequency and severity in the cross-border cargo insurance sector.
7.1.2. Optimal Model Approach Identification
- Aims to identify the optimal modeling approach by evaluating model performance based on mean absolute error (MAE) and root mean squared error (RMSE) metrics.
7.1.3. Insights on Predictive Accuracy and Error Metrics
- Extreme gradient boosting (XGBoost) demonstrates higher predictive accuracy, as indicated by the lowest MAE.
- XGBoost shows higher RMSE values, suggesting a broader error spread compared to the generalized linear model (Poisson).
- The generalized linear model (Poisson) showcases the best RMSE values, indicating tighter error clustering and smaller error magnitudes.
- XGBoost exhibits the lowest MAE, implying superior accuracy.
- However, it also presents a higher RMSE, indicating wider error dispersion compared to the generalized linear model (Gamma).
- The generalized linear model (Gamma) demonstrates the lowest RMSE, portraying tighter error clustering and smaller error magnitudes, despite a slightly higher MAE.
7.1.4. Strategic Implications for Insurance Companies
- Findings enable insurers to refine risk assessment processes, set appropriate premiums, manage reserves, and accurately forecast claim occurrences.
- Contributes to competitive pricing strategies for clients while ensuring profitability for insurers.
7.1.5. Benefits for Cross-Border Trade Entities
- Insights aid trucking companies and cargo owners in improved risk management and potential cost savings.
- Enables more reasonable insurance premium settings based on accurate predictive claim models from insurance companies.
8. Limitations and Future Research Directions
8.1. Limitations
8.2. Future Research Directions
Author Contributions
Funding
Data Availability Statement
Acknowledgments
Conflicts of Interest
References
- Abdelhadi, Shady, Khaled Elbahnasy, and Mohamed Abdelsalam. 2020. A Proposed Model to Predict Auto Insurance Claims using Machine Learning Techniques. Journal of Theoretical and Applied Information Technology 98: 3428–37. [Google Scholar]
- Abhishek. 2023. Generalized Linear Models (GLMs). Medium. Available online: https://abhic159.medium.com/generalized-linear-models-glms-7b6e6c475d82 (accessed on 27 November 2023).
- Ahlgren, Marcus. 2018. Claims Reserving Using Gradient Boosting and Generalized Linear Models. Stockholm: KTH Royal Institute of Technology. [Google Scholar]
- Alimohammadi, Hamzeh, and Shengnan Nancy Chen. 2022. Performance Evaluation of Outlier Detection Techniques in Production Time Series: A Systematic Review and Meta-Analysis. Expert Systems with Applications 191: 116371. [Google Scholar] [CrossRef]
- Alzubi, Jafar, Anand Nayyar, and Akshi Kumar. 2018. Machine Learning from Theory to Algorithms: An Overview. Journal of Physics Conference Series 1142: 012012. [Google Scholar] [CrossRef]
- Avanijaa, Jangaraj. 2021. Prediction of House Price Using XGBoost Regression Algorithm. Turkish Journal of Computer and Mathematics Education (TURCOMAT) 12: 2151–55. [Google Scholar]
- Bianco, Michael J., Peter Gerstoft, James Traer, Emma Ozanich, Marie A. Roch, Sharon Gannot, and Charles-Alban Deledalle. 2019. Machine Learning in Acoustics: Theory and Applications. The Journal of the Acoustical Society of America 146: 3590–628. [Google Scholar] [CrossRef] [PubMed]
- Blier-Wong, Christopher, Hélène Cossette, Luc Lamontagne, and Etienne Marceau. 2020. Machine Learning in P&C Insurance: A Review for Pricing and Reserving. Risks 9: 4. [Google Scholar]
- Chai, Tianfeng, and Roland R. Draxler. 2014. Root Mean Square Error (RMSE) or Mean Absolute Error (MAE)?—Arguments Against Avoiding RMSE in the Literature. Geoscientific Model Development 7: 1247–50. [Google Scholar] [CrossRef]
- Chandola, Varun, Arindam Banerjee, and Vipin Kumar. 2009. Anomaly Detection: A Survey. ACM Computing Surveys (CSUR) 41: 1–58. [Google Scholar] [CrossRef]
- Chasseray, Paul, Gauthier Eldin, and Aurégann Lefebvre. 2017. P&C Reinsurance Modelling: Pure Premium Estimation and Creation of a Reinsurance Program. Euro-Institut d’Actuariat AXA Global P&C. Brest: Université de Bretagne Occidentale, pp. 1–88. [Google Scholar]
- Chen, Tianqi, and Carlos Guestrin. 2016. Xgboost: A Scalable Tree Boosting System. Paper presented at the 22nd ACM SIGKDD International Conference on Knowledge Discovery and Data Mining, San Francisco, CA, USA, August 13–17; pp. 785–94. [Google Scholar]
- Chirathivat, Suthiphand, and Kornkarun Cheewatrakoolpong. 2015. Thailand’s Economic Integration with Neighboring Countries and Possible Connectivity with South Asia. Tokyo: Asian Development Bank Institute. [Google Scholar]
- Clemente, Carina, Gracinda R. Guerreiro, and Jorge M. Bravo. 2023. Modelling Motor Insurance Claim Frequency and Severity Using Gradient Boosting. Risks 11: 163. [Google Scholar] [CrossRef]
- Cordeiro, Miguel Filipe Martins. 2023. A Machine Learning Approach to Predict Health Insurance Claims. Lisbon: Universidade Nova de Lisboa. [Google Scholar]
- Dalal, Surjeet, Bijeta Seth, Magdalena Radulescu, Carmen Secara, and Claudia Tolea. 2022. Predicting Fraud in Financial Payment Services Through Optimized Hyper-Parameter-Tuned XGBoost Model. Mathematics 10: 4679. [Google Scholar] [CrossRef]
- Deputy Prime Minister and Minister of Foreign Affairs of Thailand. 2023. Intervention Delivered at the 8th Mekong-Lancang Cooperation Foreign Ministers’ Meeting; Bangkok: Ministry of Foreign Affairs, Kingdom of Thailand, December 8. Available online: https://www.mfa.go.th/en/content/mlcfmm2023-intervention-as-delivered-by-dpm-fm-2?page=5d5bd3dd15e39c306002ab20&menu=5f72d46f81ae194a461ef512 (accessed on 10 December 2023).
- Dhieb, Najmeddine, Hakim Ghazzai, Hichem Besbes, and Yehia Massoud. 2019. Extreme Gradient Boosting Machine Learning Algorithm for Safe Auto Insurance Operations. Paper presented at the 2019 IEEE International Conference on Vehicular Electronics and Safety (ICVES), Cairo, Egypt, September 4–6; pp. 1–5. [Google Scholar]
- Elith, Jane, John R. Leathwick, and Trevor Hastie. 2008. A working guide to boosted regression trees. Journal of Animal Ecology 77: 802–13. [Google Scholar] [CrossRef]
- Fauzan, Muhammad Arief, and Hendri Murfi. 2018. The Accuracy of XGBoost for Insurance Claim Prediction. International Journal of Advances in Soft Computing and Its Applications 10: 159–71. [Google Scholar]
- Freichel, Stephan L. K., Johannes K. Wö, Arthur Haas, and Lars ter Veer. 2022. Cargo Accumulation Risks in Maritime Supply Chains: A new perspective towards Risk Management for Theory, and Recommendations for the Insurance Industry and Cargo Shippers. Logistics Research 15: 4. [Google Scholar]
- Friedman, Jerome H. 2001. Greedy Function Approximation: A Gradient Boosting Machine. Annals of Statistics 29: 1189–232. [Google Scholar] [CrossRef]
- Ge, Jiankun, Linfeng Zhao, Zihui Yu, Huanhuan Liu, Lei Zhang, Xuewen Gong, and Huaiwei Sun. 2022. Prediction of Greenhouse Tomato Crop Evapotranspiration Using XGBoost Machine Learning Model. Plants 11: 1923. [Google Scholar] [CrossRef] [PubMed]
- Hellestol, Tonje, and Petter Eriksen. 2022. The Impact of Machine Learning and Aggregated Data on Corporate Insurance Modelling: An Empirical Study on the Prospective Gains of Machine Learning Techniques Using New Data Sources in the Insurance Industry. Master’s thesis, Norwegian School of Economics (NHH), Bergen, Norway. [Google Scholar]
- Henckaerts, Roel, Marie-Pier Côté, Katrien Antonio, and Roel Verbelen. 2021. Boosting Insights in Insurance Tariff Plans with Tree-Based Machine Learning Methods. North American Actuarial Journal 25: 255–85. [Google Scholar] [CrossRef]
- Hodson, Timothy O. 2022. Root-mean-square error (RMSE) or mean absolute error (MAE): When to use them or not. Geoscientific Model Development 15: 5481–7. [Google Scholar] [CrossRef]
- Jha, H. S., A. Khanal, H. M. D. Seikh, and W. J. Lee. 2022. A Comparative Study on Outlier Detection Techniques for Noisy Production Data from Unconventional Shale Reservoirs. Journal of Natural Gas Science and Engineering 105: 104720. [Google Scholar] [CrossRef]
- Kankanamge, Kusal D., Yasiru R. Witharanage, Chanaka S. Withanage, Malsha Hansini, Damindu Lakmal, and Uthayasanker Thayasivam. 2019. Taxi Trip Travel Time Prediction with Isolated XGBoost Regression. Paper presented at the 2019 Moratuwa Engineering Research Conference (MERCon), Moratuwa, Sri Lanka, July 3–5; pp. 54–59. [Google Scholar]
- Ke, Guolin, Qi Meng, Thomas Finley, Taifeng Wang, Wei Chen, Weidong Ma, Qiwei Ye, and Tie-Yan Liu. 2017. LightGBM: A Highly Efficient Gradient Boosting Decision Tree. Paper presented at the Advances in Neural Information Processing Systems 30 (NIPS 2017), Long Beach, CA, USA, December 4–9. [Google Scholar]
- Krungsri Research. 2022. Road Freight Transportation 2022–2024. Available online: https://www.krungsri.com/en/research/industry/industry-outlook/logistics/road-freight-transportation/io/road-freight-transportation-2022–2024 (accessed on 2 December 2023).
- Monemar, Magnus, and Erik Wallin. 2015. Premium Allocation for the Electrolux Cargo Insurance Program Using Generalized Linear Models. Available online: https://urn.kb.se/resolve?urn=urn:nbn:se:umu:diva-106904 (accessed on 18 October 2023).
- Murekatete, Delphine. 2022. Predicting Motor Insurance Claims—XGBoost versus Logistic Regression. Kigali: African Institute for Mathematical Sciences (AIMS). [Google Scholar]
- Nelder, John Ashworth, and Robert W. M. Wedderburn. 1972. Generalized Linear Models. Journal of the Royal Statistical Society Series A: Statistics in Society 135: 370–84. [Google Scholar] [CrossRef]
- Poufinas, Thomas, Periklis Gogas, Theophilos Papadimitriou, and Emmanouil Zaganidis. 2023. Machine Learning in Forecasting Motor Insurance Claims. Risks 11: 164. [Google Scholar] [CrossRef]
- Pugliese, Raffaele, Stefano Regondi, and Riccardo Marini. 2021. Machine Learning-based Approach: Global Trends, Research Directions, and Regulatory Standpoints. Data Science and Management 4: 19–29. [Google Scholar] [CrossRef]
- Ridgeway, Greg. 2007. Generalized Boosted Models: A Guide to the GBM Package. Update 1: 2007. [Google Scholar]
- Ritonga, Ali Imran, Kundori Kundori, Karolus G. Sengadji, and Hilda Emeraldo Ahmad. 2021. Optimizing the Process of Management of Marine Cargo Insurance Claims at PT. ABC. Jurnal Logistik Indonesia 5: 166–73. [Google Scholar] [CrossRef]
- Socorro, Trujillo, and María Karina. 2019. International Marine Cargo Insurance: Building generic and thematic competences in commercial translation. Journal of Specialised Translation 32: 262–79. [Google Scholar]
- Thai General Insurance Association. 2016. Manual for Practitioners in Actuarial Mathematics. Available online: https://www.tgia.org/upload/file_group/3/download_861.pdf (accessed on 18 July 2023).
- Tuininga, Frits. 2022. A Machine Learning Approach for Modeling Frequency and Severity. Master’s thesis, University of Twente, Enschede, UK. [Google Scholar]
- Yang, Li, and Shami Abdallah. 2020. On hyperparameter optimization of machine learning algorithms: Theory and practice. Neurocomputing 415: 295–316. [Google Scholar] [CrossRef]
- Yaro, Abdulmalik Shehu, Filip Maly, and Pavel Prazak. 2023. Outlier Detection in Time-Series Receive Signal Strength Observation Using Z-Score Method with S n Scale Estimator for Indoor Localization. Applied Sciences 13: 3900. [Google Scholar] [CrossRef]
- Yousif, Jan Mikael. 2023. A Comparative Analysis between Various Machine Learning Models and Generalized Linear Models. Master’s thesis, Stockholm University, Stockholm, Sweden. [Google Scholar]
- Zhao, Xin, Qiushuang Li, Wanlei Xue, Yihang Zhao, Huiru Zhao, and Sen Guo. 2022. Research on ultra-short-term load forecasting based on real-time electricity price and window-based XGBoost model. Energies 15: 7367. [Google Scholar] [CrossRef]
- Zhu, Ruijin, Weilin Guo, and Xuejiao Gong. 2019. Short-Term Photovoltaic Power Output Prediction Based on k-Fold Cross-Validation and an Ensemble Model. Energies 12: 1220. [Google Scholar] [CrossRef]


| Claim Cause Category | Loss Year | ||||||
|---|---|---|---|---|---|---|---|
| 2016 | 2017 | 2018 | 2019 | 2020 | 2021 | 2022 | |
| Breakage | × | × | × | × | × | × | × |
| Bend/Dent/Scratch | × | × | × | × | × | × | × |
| Tear/Cut | × | × | × | × | × | × | × |
| Rainwater Damage | × | × | × | × | × | ||
| Overturning | × | × | × | ||||
| Shortage/Leakage | × | × | |||||
| Contamination | × | × | × | × | |||
| Theft/Pilferage/Missing | × | × | × | ||||
| Stain | × | × | |||||
| Rust/Oxidation/Corrosion | × | ||||||
| Others | × | × | × | × | × | × | × |
| Article | Year | Methodologies/Approaches | The Best Model |
|---|---|---|---|
| Modelling Motor Insurance Claim Frequency and Severity Using Gradient Boosting (Clemente et al. 2023) | 2023 | Gradient Boosting Machines, Generalized Linear Models | Gradient Boosting Machines [Frequency] and Generalized Linear Models [Severity] |
| Machine Learning in Forecasting Motor Insurance Claims (Poufinas et al. 2023) | 2023 | Support Vector Machines, Decision Trees, Random Forests, Extreme Gradient Boosting | Random Forests Limited Depth and Extreme Gradient Boosting |
| Predicting Motor Insurance Claims—XGBoost versus Logistic Regression (Murekatete 2022) | 2022 | Logistic Regression and Extreme Gradient Boosting | Extreme Gradient Boosting |
| The Impact of Machine Learning and Aggregated Data on Corporate Insurance Modelling (Hellestol and Eriksen 2022) | 2022 | CART, Random Forest, Extreme Gradient Boosting, Neural Network, Generalized Linear Model | Extreme Gradient Boosting |
| Boosting insights in insurance tariff plans with tree-based machine learning methods (Henckaerts et al. 2021) | 2021 | Generalized Linear Models, Regression Trees, Random Forests, Gradient Boosting Machines | Gradient Boosting Machines |
| A proposed model to predict auto insurance claims using machine learning techniques (Blier-Wong et al. 2020) | 2020 | Artificial Neural Network, Decision Tree, Naïve Bayes, Extreme Gradient Boosting | Extreme Gradient Boosting |
| Extreme Gradient Boosting Machine Learning Algorithm for Safe Auto Insurance Operations (Dhieb et al. 2019) | 2019 | Extreme Gradient Boosting, Naïve Bayes, Nearest Neighbor, Decision Tree | Extreme Gradient Boosting |
| Claims Reserving using Gradient Boosting and Generalized Linear Model (Ahlgren 2018) | 2018 | Generalized Linear Models, Gradient Boosting | Generalized Linear Models |
| The Accuracy of XGBoost for Insurance Claim Prediction (Fauzan and Murfi 2018) | 2018 | Extreme Gradient Boosting, Stochastic Gradient Boosting (Stochastic GB), AdaBoost, Random Forest, Neural Network | Extreme Gradient Boosting |
| P&C Reinsurance Modeling Pure Premium Estimation and Creation of a Reinsurance Program (Chasseray et al. 2017) | 2017 | Random Forests, Generalized Linear Models, Support Vector Machines, Gradient Boosting Machines, Extreme Gradient Boosting | Extreme Gradient Boosting |
| Variable | Sub-Variable | Features |
|---|---|---|
| Status of Goods | Import, Export | Categorical |
| Cargo Type | Cargo Type Group 1, Cargo Type Group 2, Cargo Type Group 3, Cargo Type Group 4, Cargo Type Group 5, Cargo Type Group 6 | Categorical |
| Packaging Type | In bulk, Carton/Box, Case/Crate, Tin/Drum, Bag/Sack, Pallet/Skid, Bundle/Bale, Roll/Coil, Others | Categorical |
| Start Country | Thailand, Laos, Myanmar, Cambodia, Malaysia | Categorical |
| Destination Country | Thailand, Laos, Myanmar, Cambodia, Malaysia | Categorical |
| Sum Insured Amount | 0,…,∞ | Continuous numerical |
| Number of Claims | 0,…,∞ | Continuous numerical |
| Variable | Sub-Variable | Features |
|---|---|---|
| Status of Goods | Import, Export | Categorical |
| Cargo Type | Cargo Type Group 1, Cargo Type Group 2, Cargo Type Group 3, Cargo Type Group 4, Cargo Type Group 5, Cargo Type Group 6 | Categorical |
| Packaging Type | In bulk, Carton/Box, Case/Crate, Tin/Drum, Bag/Sack, Pallet/Skid, Bundle/Bale, Roll/Coil, Others | Categorical |
| Start Country | Thailand, Laos, Myanmar, Cambodia, Malaysia | Categorical |
| Destination Country | Thailand, Laos, Myanmar, Cambodia, Malaysia | Categorical |
| Sum Insured Amount | 0,…,∞ | Continuous numerical |
| Incurred Claims | 0,…,∞ | Continuous numerical |
| Parameter | Description |
|---|---|
| learning_rate | Initial learning rate |
| n_estimators | Number of decision trees |
| max_depth | Maximum tree depth |
| alpha_value | Controls the shape of the distribution |
| Variable | Sub-Variable (Categorical) | Description |
|---|---|---|
| Status of Goods | Import, Export | Represents the classification of goods based on their intended importation or exportation. |
| Cargo Type | Cargo Type Group 1, Cargo Type Group 2, Cargo Type Group 3, Cargo Type Group 4, Cargo Type Group 5, Cargo Type Group 6 | Represents the different groups categorizing the type of cargo being transported. |
| Packaging Type | In bulk, Carton/Box, Case/Crate, Tin/Drum, Bag/Sack, Pallet/Skid, Bundle/Bale, Roll/Coil, Others | Represents the various forms or methods of packaging used for the transported goods. |
| Start Country | Thailand, Laos, Myanmar, Cambodia, Malaysia | Represents the countries from which the cargo shipments originate. |
| Destination Country | Thailand, Laos, Myanmar, Cambodia, Malaysia | Represents the countries to which the cargo shipments are destined. |
| Variable | Value (Continuous Numerical) | Description |
|---|---|---|
| Sum Insured Amount | 0,…,∞ | Represents the maximum amount an insurance company agrees to pay in the event of a covered loss or damage. |
| Number of Claims | 0,…,∞ | Represents the count or frequency of claims. |
| Incurred Claims | 0,…,∞ | Represents the total value or amount of all claims that an insurer anticipates paying or has already paid during a specific period. |
| Variables | Frequency Dataset | Severity Dataset | |||
|---|---|---|---|---|---|
| Total Number of Data (Original Dataset) | Total Number of Data (Cleaned Dataset) | Total Number of Data (Original Dataset) | Total Number of Data (Cleaned Dataset) | ||
| Status of Goods | Import | 2714 | 2670 | 56 | 55 |
| Export | 7089 | 6961 | 94 | 92 | |
| Cargo Type Group | Group 1 | 3118 | 3013 | 66 | 65 |
| Group 2 | 26 | 26 | 2 | 2 | |
| Group 3 | 1122 | 1109 | 21 | 20 | |
| Group 4 | 90 | 90 | - | - | |
| Group 5 | 399 | 395 | 12 | 12 | |
| Group 6 | 5048 | 4998 | 49 | 48 | |
| Packaging Type | In bulk | 33 | 33 | - | - |
| Carton/Box | 2514 | 2477 | 49 | 48 | |
| Case/Crate | 667 | 666 | 5 | 5 | |
| Tin/Drum | 108 | 108 | 5 | 5 | |
| Bag/Sack | 369 | 365 | 12 | 12 | |
| Pallet/Skid | 836 | 811 | 28 | 28 | |
| Bundle/Bale | 695 | 694 | - | - | |
| Roll/Coil | 133 | 133 | 2 | 2 | |
| Others | 4448 | 4344 | 49 | 47 | |
| Start Country | Thailand | 7080 | 6952 | 95 | 93 |
| Laos | 144 | 140 | 1 | 1 | |
| Myanmar | 84 | 83 | 2 | 2 | |
| Cambodia | 105 | 83 | 5 | 4 | |
| Malaysia | 2390 | 2373 | 47 | 47 | |
| Destination Country | Thailand | 2714 | 2670 | 55 | 54 |
| Laos | 2008 | 1971 | 41 | 41 | |
| Myanmar | 2403 | 2398 | 11 | 11 | |
| Cambodia | 1045 | 1027 | 20 | 19 | |
| Malaysia | 1633 | 1565 | 23 | 22 | |
| Average Sum Insured Amount | 9.88 million THB | 10.98 million THB | |||
| Average Number of Claims | 0.017 | - | |||
| Average Incurred Claims | - | 86,791.40 THB | |||
| Total Number of Data | 9803 (100%) | 9631 (100%) | 150 (100%) | 147 (100%) | |
| Model Approach | Frequency | Severity | ||
|---|---|---|---|---|
| Range Hyperparameters | Best Hyperparameters | Range Hyperparameters | Best Hyperparameters | |
| Extreme Gradient Boosting | learning_rate = [0.01, 0.02, 0.03, 0.04, 0.05], n_estimators = [39, 40, 41, 42, 43], max_depth = [17, 18, 19, 20, 21] | learning_rate = [0.03], n_estimators = [41], max_depth = [19] | learning_rate = [0.05, 0.06, 0.07, 0.08, 0.09] n_estimators = [6, 7, 8, 9, 10] max_depth = [5, 6, 7, 8, 9] | learning_rate = [0.07], n_estimators = [8], max_depth = [7] |
| Gradient Boosting Machines | learning_rate = [0.12, 0.13, 0.14, 0.15, 0.16] n_estimators = [12, 13, 14, 15, 16] max_depth = [5, 6, 7, 8, 9] | learning_rate = [0.14], n_estimators = [12], max_depth = [7] | learning_rate = [0.14, 0.15, 0.16, 0.17, 0.18] n_estimators = [8, 9, 10, 11, 12] max_depth = [1, 2, 3, 4, 5] | learning_rate = [0.16], n_estimators = [10], max_depth = [3] |
| Generalized Linear Models [Poisson–Gamma] | - | - | alpha_values = [1000000000000000000, 11000000000000000000, 1200000000000000000] | alpha_values = [11000000000000000000] |
| Model Approach | Metrics Performance | Frequency | Severity |
|---|---|---|---|
| Extreme Gradient Boosting | MAE | 0.0309 | 113,085.07 |
| RMSE | 0.1534 | 234,877.46 | |
| Gradient Boosting Machines | MAE | 0.0328 | 116,708.85 |
| RMSE | 0.1445 | 237,625.14 | |
| Generalized Linear Models [Poisson–Gamma] | MAE | 0.0338 | 121,727.67 |
| RMSE | 0.1421 | 230,341.28 |
Disclaimer/Publisher’s Note: The statements, opinions and data contained in all publications are solely those of the individual author(s) and contributor(s) and not of MDPI and/or the editor(s). MDPI and/or the editor(s) disclaim responsibility for any injury to people or property resulting from any ideas, methods, instructions or products referred to in the content. |
© 2024 by the authors. Licensee MDPI, Basel, Switzerland. This article is an open access article distributed under the terms and conditions of the Creative Commons Attribution (CC BY) license (https://creativecommons.org/licenses/by/4.0/).
Share and Cite
Panjee, P.; Amornsawadwatana, S. A Generalized Linear Model and Machine Learning Approach for Predicting the Frequency and Severity of Cargo Insurance in Thailand’s Border Trade Context. Risks 2024, 12, 25. https://doi.org/10.3390/risks12020025
Panjee P, Amornsawadwatana S. A Generalized Linear Model and Machine Learning Approach for Predicting the Frequency and Severity of Cargo Insurance in Thailand’s Border Trade Context. Risks. 2024; 12(2):25. https://doi.org/10.3390/risks12020025
Chicago/Turabian StylePanjee, Praiya, and Sataporn Amornsawadwatana. 2024. "A Generalized Linear Model and Machine Learning Approach for Predicting the Frequency and Severity of Cargo Insurance in Thailand’s Border Trade Context" Risks 12, no. 2: 25. https://doi.org/10.3390/risks12020025