1. Introduction
Given its strategic goal of digital transformation, the commercial banking industry faces unprecedented opportunities for IT development. With rapid technological advancements and changes in user demand, commercial banks are compelled to accelerate the transformation and upgrading of their service models, business structures, and financial ecosystems to maintain competitiveness and meet increasingly diverse customer needs. However, with the rapid development of IT in commercial banks, IT risk incidents have occasionally occurred.
For example, in April 2018, the TSB Bank in the UK made errors when moving data to a new system because of insufficient testing and operational management mistakes, leading to errors in 1.3 billion customer accounts. This catastrophic IT upgrade costs GBP 330 million (
Daily Headlines 2023). In December 2021, Santander Bank in London incidentally transferred extra money to 75,000 bank accounts owing to an IT system error, with an excess of approximately GBP 130 million (
NetEase 2023). In June 2022, HSBC and Hang Seng Bank, both in the same group, suffered network failures, causing their online banking, financial management APP, and ATMs to ‘crash’. The incident originated from a technical failure, with some experts estimating that it may have involved system upgrades or maintenance errors (
Dagong 2023). In 2023, the DBS Bank’s banking services suffered five major interruptions on 29 March, 5 May, 26 September, 14 October, and 20 October, including an inability to log into digital banking and delayed payment transactions. On 3 November 2023, the Monetary Authority of Singapore instructed the DBS Bank to suspend all changes to its IT system for six months to ensure that the bank committed the necessary resources and efforts to strengthen its technology risk management system and controls (
STCN 2023).
These cases highlight the importance of technological risk management in digital transformation. Commercial banks face numerous potential technological risks, including data leaks, cyberattacks, and system failures. These risks can lead to serious consequences such as interruption of the bank’s operations, theft of customer information, and damage to reputation, causing significant losses to the bank and its customers. Bank resources are extremely limited; concentrating limited resources to address core technology risks, implementing effective and targeted rectification, and significantly reducing the occurrence of major technology incidents are critical issues.
Numerous factors influence IT risk, and they are characterised by suddenness, complexity, and unpredictability, making risk assessment difficult. Existing research from various theoretical perspectives explores the levels of risk management, establishes various risk impact factor indicator systems, computes the indicator weights of impact factors, assesses unsafe behaviour risks according to various theories, proposes various risk assessment models, and uses various methods to calculate commercial bank technology risk values. This study provides a good reference point for future studies.
2. Literature Review
Over the past decade, risk assessment models have become indispensable tools in finance, engineering, and other fields. This literature review aimed to explore the main stages of the development of risk assessment models and showcase the research progress at each stage with reference to academic articles from relevant fields.
The first phase primarily involved the application of traditional risk assessment models, including Fault Tree Analysis (FTA) and Event Tree Analysis. These traditional methods qualitatively identify potential risks and possibilities of failure and establish a structured framework for risk assessment. For instance,
La et al. (
2008) studied the application of fault-tree analysis based on a fuzzy logic system for risk analysis of construction quality. They proposed a method that represents the probability of basic events as fuzzy numbers and employed a fuzzy reasoning system to handle the uncertainty of cause-and-effect relationships in FTA. Similarly,
Zhang et al. (
2009) emphasised the importance of the fault tree model in the risk management of software projects and established a corresponding mathematical model to analyse and control the risks of software projects.
Wang et al. (
2012) proposed an insulator safety risk analysis method based on FTA and established a mathematical model for hierarchical safety risk analysis of power transmission line insulator accidents.
In the second phase, there was a shift towards quantitative risk assessment models, such as Value at Risk (VaR), which provide an assessment of the financial impact of risks. However, VaR may face limitations when measuring technological risks because it often includes complex interdependencies and nonlinear characteristics.
Li and Xia (
2011) applied extreme value theory to an empirical analysis of VaR for the Chinese stock market, suggesting that extreme value theory can effectively assess tail risks in financial series under market volatility as it better captures the tail behaviour of distributions.
Thim et al. (
2012) compared the risk performances of VaR and Conditional VaR (CVaR) for selected industry indices in Malaysia and found that the technology sector had the highest risk, whereas the consumer goods sector had the lowest.
Jiang et al. (
2015) proposed a model aimed at minimising VaR to describe and quantify project delay risks and demonstrated the effectiveness of this approach in measuring delay risks through comparison with Monte Carlo simulations.
In the evolution of modern risk assessment models, the third and fourth stages represent the application of risk matrix methods and machine-learning models, respectively. The risk matrix of the third stage is a simplified assessment method that combines the likelihood and impact of the risk events.
Wang et al. (
2018) used a risk matrix approach to assess the risk security of electric power information and proposed an assessment model processed by an expert two-dimensional matrix, the Poisson counting method, and an analytic hierarchy process. They demonstrated the overall risk level and major risk factors through case applications, validating the model’s effectiveness and rationality.
Qi et al. (
2020) improved the Preliminary Hazard Analysis method and combined it with a risk matrix in the assessment of occupational disease risks. They proposed a semi-quantitative method for occupational disease risk assessment, whose application in a sintering project showed its simplicity, feasibility, and effectiveness.
Hu et al. (
2021) constructed an indicator system for risk identification in the electricity spot market and used an expert panel to establish a risk assessment matrix and the Poisson method to rank various risks, effectively identifying the risks in the electricity spot market.
In the fourth stage, the introduction of machine-learning models marks a technological leap in the field of risk assessment.
Darandale and Mehta (
2022) explored the application of various machine learning classifiers in software risk assessment, providing a comparative analysis and direction for future research.
Johri et al. (
2022) demonstrated the importance of applying machine learning techniques to financial risk management in the banking industry.
Prakash et al. (
2023) developed a cardiovascular disease risk assessment system using a logistic regression algorithm, whose high accuracy and interpretability make it suitable for use in clinical settings.
Qi (
2023) established a cold-chain logistics risk assessment model for aquatic products based on the PSO-BP neural network, with results showing the highest transportation risk in refrigerated trucks within cold-chain logistics.
However, existing research still has the following shortcomings: (1) Current studies rarely involve IT risk in commercial banks. (2) IT risk assessment is a complex, non-linear system. The existing methods for calculating the weights of risk assessment indicators mostly use the Analytic Hierarchy Process (AHP), Technique for Order Preference by Similarity to Ideal Solution, and entropy methods. However, a learning mechanism for the indicator weights has not yet been established. (3) The assessment process is prone to subjective influences, and the precision of risk assessment requires further improvement.
With the development of artificial intelligence, the Back Propagation (BP) neural network has a strong non-linear mapping function; possesses self-organisation, self-learning, and adaptive attributes; can imitate human thinking patterns; and can effectively handle non-linear prediction problems. It has been widely applied for evaluation and assessment.
Recent scholarly studies have employed BP neural networks across diverse risk assessments and early warning systems, each with unique implementations, optimisation techniques, and fields of application.
Cao et al. (
2009) delved into a commercial bank operational risk early warning model facilitated by BP neural network analysis, primarily focusing on deciphering and addressing the nonlinear relationship between operational risks and risk consequences in commercial banking.
Bai and Li (
2013) devised a software project risk assessment model using a BP neural network, effectively surmounting the complexities involved in mathematically articulating a risk assessment model.
Zhou et al. (
2019) introduced a significant method for big data mining, leveraging Particle Swarm Optimisation (PSO) and BP neural networks to manage financial risks in commercial banks under Internet of Things (IoT) conditions. This pioneering method establishes a nonlinear parallel optimisation model, noted for its swift convergence, robust predictive capacity, and optimal efficiency in identifying default behaviours. In a different vein,
Jiang et al. (
2019) explored the use of BP neural networks refined by genetic algorithms for risk assessment in power grid investments. This innovative approach capitalises on the local search potential of BP neural networks and the global search prowess of genetic algorithms, displaying commendable precision in managing multidimensional impact factors.
Chen et al. (
2020) proposed a tiered investment risk assessment technique based on BP neural networks, considering the intertwining of uncertainty and risk in power grids. This method processes historical risk factor data with BP neural networks and scrutinises the patterns of risk loss and occurrence probability distribution, thereby proving effective for precise investment scheme evaluations.
Ge et al. (
2022) investigated real-time evaluation methods for electric vehicle charging risks by employing an enhanced broad BP-AHP assessment technique. This novel approach offers a more precise estimation of the safety risks associated with the real-time charging of electric vehicles.
The application areas of the BP neural networks also include network security, disaster risk prediction, and malicious software detection. Various researchers have optimised it to improve its performance. In the field of network security,
Wang et al. (
2023) studied the effectiveness of a BP neural network optimised using a Whale Optimisation Algorithm (WOA). They introduced a binary classification model for anomaly detection and a multi-category classification model for various types of network attacks. They also compared a variety of machine learning algorithms, including Naive Bayes, Random Forest (RF), and BP neural network security models. They found that the WOA-BP neural network has a certain effectiveness in network anomaly detection.
Han and He (
2022) studied the risk prediction of rainstorms and flood disasters based on a BP neural network optimised using a Genetic Algorithm (GA). They found that the prediction accuracy of the BP model optimised by the GA was significantly higher than that of the single BP neural network model, with a prediction accuracy of 71.43%, thus playing an important guiding role in the risk management of rainstorms and flood disasters. In the field of malicious software detection,
Al-Andoli et al. (
2023) proposed a parallel deep learning classifier based on PSO-BP. They used five deep learning-based models and one neural network as the meta-model, and trained and optimised it using a hybrid optimisation method of BP and PSO algorithms. The use of a parallel-computing framework improved the scalability and efficiency of this integrated method, and its performance in malicious software detection was better than that of many other comparative methods.
Generally, the BP neural network has a wide range of applications in various fields. To address the research gap in ‘banking technology risk’, we attempt to use different regression prediction models and BP neural network models optimised with different algorithms to capture the complex nonlinear characteristics of banking technology risks, following the evolution of risk-modelling approaches.
Therefore, this study combines the characteristics of IT risk in commercial banks. To establish an IT risk assessment indicator system, we propose to optimise the BP neural network using the PSO, WOA, and GA, compare it with typical regression prediction models of RF and Support Vector Regression (SVR), and construct an IT risk assessment model. The model was then tested and simulated with examples to verify its effectiveness and calculate the weights of the risk assessment indicators. The goal is to provide a reference for commercial banks to prevent and control IT risks. The differences from previous papers lie in three aspects: (1) the subject of study is novel, as previous papers have not focused on ‘banking technology risk’; (2) the integration of regression prediction models and BP neural networks in banking technology risk assessment is considered novel; (3) the novelty of this paper also comes from having used different algorithms for optimisation comparison.
4. Regression Prediction Models and BP Neural Network Risk Assessment Model Optimised by Different Algorithms
Based on the above literature review, typical regression prediction models include RF and SVR. The advantage of RF is that it can determine the importance of features and the interaction between different features while maintaining accuracy even when a large number of the features are missing. The advantage of SVR is that it can avoid overfitting during the solving process and balance the complexity of the model and its generalisation ability by adjusting the regularisation parameter.
Additionally, BP neural networks have been widely applied to process control, fault diagnosis, forecasting, and non-linear simulation problems. However, BP neural networks have certain drawbacks. For instance, a BP neural network uses gradient descent, and its error-training function is not strictly convex. This leads to the BP algorithm easily falling into local minima when searching for optimal connection weights and thresholds and being unable to obtain a global optimal solution, which affects the accuracy of the BP algorithm predictions. Therefore, it is necessary to identify optimised algorithms to compensate for the shortcomings of BP neural networks. Through literature research, it was found that PSO is suitable for solving the problem of finding global optimal solutions, the WOA can help the BP neural network avoid falling into local optimal solutions and improve the model’s generalisation ability, and the GA can avoid the problem of the BP network falling into local optima when optimising weights and thresholds. Therefore, the algorithms tested in this study mainly include the PSO, WOA, and GA. They have good capabilities in terms of global search, convergence speed, balance between exploration and exploitation, parallel search, and adaptability, making them suitable for solving many optimisation problems. These three algorithms are typical and commonly used and have demonstrated good performance and predictive ability in past research.
4.1. BP Neural Network Improved by PSO
The PSO algorithm simulates the behaviour of a flock of birds searching for a habitat, reaching the optimum by searching for the optimal solutions for each particle and using these optimal solutions (
Sun et al. 2019;
Liu et al. 2021). The optimisation of the BP neural network by PSO is mainly achieved by replacing the gradient descent of the BP neural network with an iteration of the particle swarm. The main steps for optimising the BP neural network based on PSO are as follows:
Initialise parameters. We determined the topology of the BP neural network, initialised its connection weights and thresholds, determined the dimension D of the particle swarm according to the number of weights and thresholds, set the population size M, set the number of iterations N, encoded the weights and thresholds of the neural network into real numbers, and obtained the initial population.
The mean squared error obtained in each iteration of the neural network was used as the fitness function of the particles.
According to steps (2)–(4) of the particle swarm algorithm, we solved for the global optimal position of the particles.
Check whether the iterative termination condition is satisfied. If satisfied, stop, output the optimal particle, and decode it to obtain the optimal weights and thresholds.
Train and predict according to the BP neural network.
4.2. BP Neural Network Improved by WOA
The workflow of the WOA comprises the following three steps, refer to
Liang et al. (
2022):
- (1)
Encircling prey phase. The WOA first considers the whale closest to the prey as the local optimum. The remaining whales calculated their distances from the optimum and gradually moved towards it, gradually encircling the prey. The mathematical model for this phase is as follows:
In the formula, and are coefficient vectors; —local optimal solution; —position vector.
The mathematical expression is
where
is a vector that decreases linearly from 2 to 0;
is a random vector [0,1]; and
is a distance coefficient, whose change is affected by
.
- (2)
After narrowing the range of the prey, the whales will blow bubbles towards the prey, forming a ‘bubble net’, which traps the prey and achieves the goal of seeking the optimal solution in this area.
- (3)
After encircling and compressing the prey, when the distance coefficient A < 1, the whale individuals gradually approach the optimum. Under the premise that A < 1, the larger the A, the more whale individuals can swim in a larger space, making the whale algorithm more capable of global optimisation. The smaller A, the more whale individuals can walk in a smaller space, carefully searching for prey, making the whale algorithm more capable of local exploration.
4.3. BP Neural Network Improved by GA
The GA is an optimisation technique that adopts the principles of biological evolution and emulates the processes of natural selection, inheritance, and mutation to navigate towards an optimal solution. The GA can unleash its distinctive advantages in synergy with a BP neural network. With its global search capability, the GA retains multiple solutions simultaneously, enabling a broad exploration of the search space, which is particularly beneficial for optimising parameters such as weights and thresholds within a BP neural network. Furthermore, the GA can adaptively refine its search strategy and continuously enhance and optimise solutions via genetic operations such as selection, crossover, and mutation. This amalgamation of GA and BP neural networks can bolster the neural network’s performance and convergence speed, enabling the improved handling of complex problems. This effectively addresses problems with vast search spaces and intricate nonlinear relationships, offering an efficacious optimisation method for more precise function approximation, pattern recognition, and classification tasks.
The GA optimises the BP in three ways: network structure, learning rules, and weights (
Yu et al. 2023). Weight optimisation was employed in this study. The GA is essentially used to optimise the connection weights of the neural network, followed by standard training with the BP network. Weight optimisation encompasses three steps: initial population generation by encoding connection weights into individuals represented by real number codes; decoding these codes to form a neural network; facilitating learning and training via the standard BP algorithm; and using a trained network for simulation and prediction.
Considering the theories related to the GA and BP neural networks, we employed the network error from the BP neural network programme as the fitness function, used the GA to optimise the network weight threshold, and incorporated the optimised weight threshold into the network for subsequent operations. Parameters such as the iteration times and population size of the GA, input and output samples of the BP neural network, structure, and initial weight threshold were designed. The Shemeld genetic algorithm toolbox was used for computation, realising the GA optimisation function and BP neural network classification prediction function.
(1) Evaluation indicators. Define the set of primary evaluation indicators and their subsets, and let experts evaluate each risk level based on their standards. The scores from the evaluation of each indicator were used for training to obtain a model with the required precision.
(2) Evaluation language set. Several evaluation statuses were determined based on the actual evaluation decision-making needs.
(3) Initial network values’ determination. Stakeholders are the evaluators of IT risk. First, external experts and internal stakeholders, primarily technology executives and technology department heads, determine the weights of their evaluation indicators. The average weight provided by multiple evaluators is generally used to mitigate individual subjectivity, and neural networks can effectively rectify this subjectivity. The BP network is the core part of the feedforward network and the most refined and perfect part of the neural network. The basic elements of the GA include the chromosome encoding method, fitness function, genetic operation, and operation parameters. The Shemeld genetic algorithm toolbox was used for computation. The implementation idea includes using binary encoding for individual encoding, where each individual is a binary string, which is connected by the input and hidden layer connection weights, binary encoding, and all weights. Thresholds encoding are connected to form an individual’s encoding; the encoding length is 10; and the network is transformed from the original 14-29-5 network structure to an individual length of 5850 binary encoding. In the choice of the fitness function, the norm of the error matrix of the expert evaluation results and the expected value are used as the outputs of the objective function. The fitness function selects the ranking fitness distribution function, the selection operator uses a random operator, the crossover operator uses a single-point operator, and the mutations are generated randomly. The final genetic algorithm operational parameters are listed in
Table 2.
(4) BP Network Structure Algorithm. The transfer function of the neurones in the hidden layer of the neural network adopts a sigmoid function, and the transfer function of the neurones in the output layer adopts a sigmoid logarithmic function owing to the 0–1 output mode, which aligns with the network output requirements. Network training is a process of continuously adjusting the weights and thresholds, which progressively diminishes the output error of the network.
5. Risk Assessment Model Case Analysis
5.1. Data Collection and Processing
Based on the analysis of internal data and reference literature (
Yang et al. 2010;
Gong et al. 2010;
Sardjono and Cholik 2018), a risk assessment questionnaire was compiled using a risk assessment index system. The questionnaire was divided into three parts. The first part was designed to obtain personal information from the participants. The second part of the questionnaire lists the six primary indicators and their 17 corresponding secondary indicators (X1–X17), as shown in
Table 3. In the third part of the questionnaire, respondents were asked to fill in the degree of preventive measures taken against the risk indicators based on their understanding of the system (scored from 1 to 10, with 1 indicating the lowest degree of preventive measures and 10 indicating the highest degree). The risk level (Y) represents the average number of technological incidents that occurred in the corresponding system per year over the past two years (
Kang and Cheung 2023).
Taking the bank as an example, the survey was initiated in July 2023 and ended in October 2023. A total of 280 questionnaires were distributed online to IT department staff, and 250 valid questionnaires were collected. The reliability and validity of the questionnaire satisfy these criteria. After organising the survey data, the distribution of information such as age, education, and positions of the survey subjects was found to be consistent with the actual situation in the bank’s IT department.
Note that the initial data collection yielded poor training results because of the presence of outliers. This was mainly caused by bank employees’ inconsistent interpretations of the metrics or data entry errors. For example, within the same bank, the scores assigned by a minority of employees for a particular metric deviated significantly from those assigned by the majority. We communicated with these employees to resolve any misunderstanding. After rescoring, the deviation of their scores from the majority scores decreased. We eliminated individual data entry errors and outliers that could not be adjusted through communication from the dataset, effectively excluding feedback from bank employees from the statistical results.
5.2. Determination of Weights for Risk Assessment Indicators
The collected 250 sample data points were divided into 170 training and 80 test samples. Several typical regression prediction models were compared using MATLAB software, including the RF, SVR, BP neural network, PSO-BP, WOA-BP, and GA-BP. To compare the effectiveness of the different models, we used the following three metrics:
R-squared (R2): This metric is used to measure the degree of fit of the regression model to the data, with values ranging from 0 to 1. A value close to 1 indicates that the model can adequately explain the variation in the data.
Mean absolute error (MAE): This indicates the average difference between the predicted values of the model and the true values calculated as absolute values. A smaller value indicates a smaller prediction error in the model.
Mean squared error (MSE): This calculates the average of the squared differences between the predicted and true values. Squaring can amplify the errors; therefore, it is more sensitive to large errors. The smaller the value, the better the model’s predictive performance.
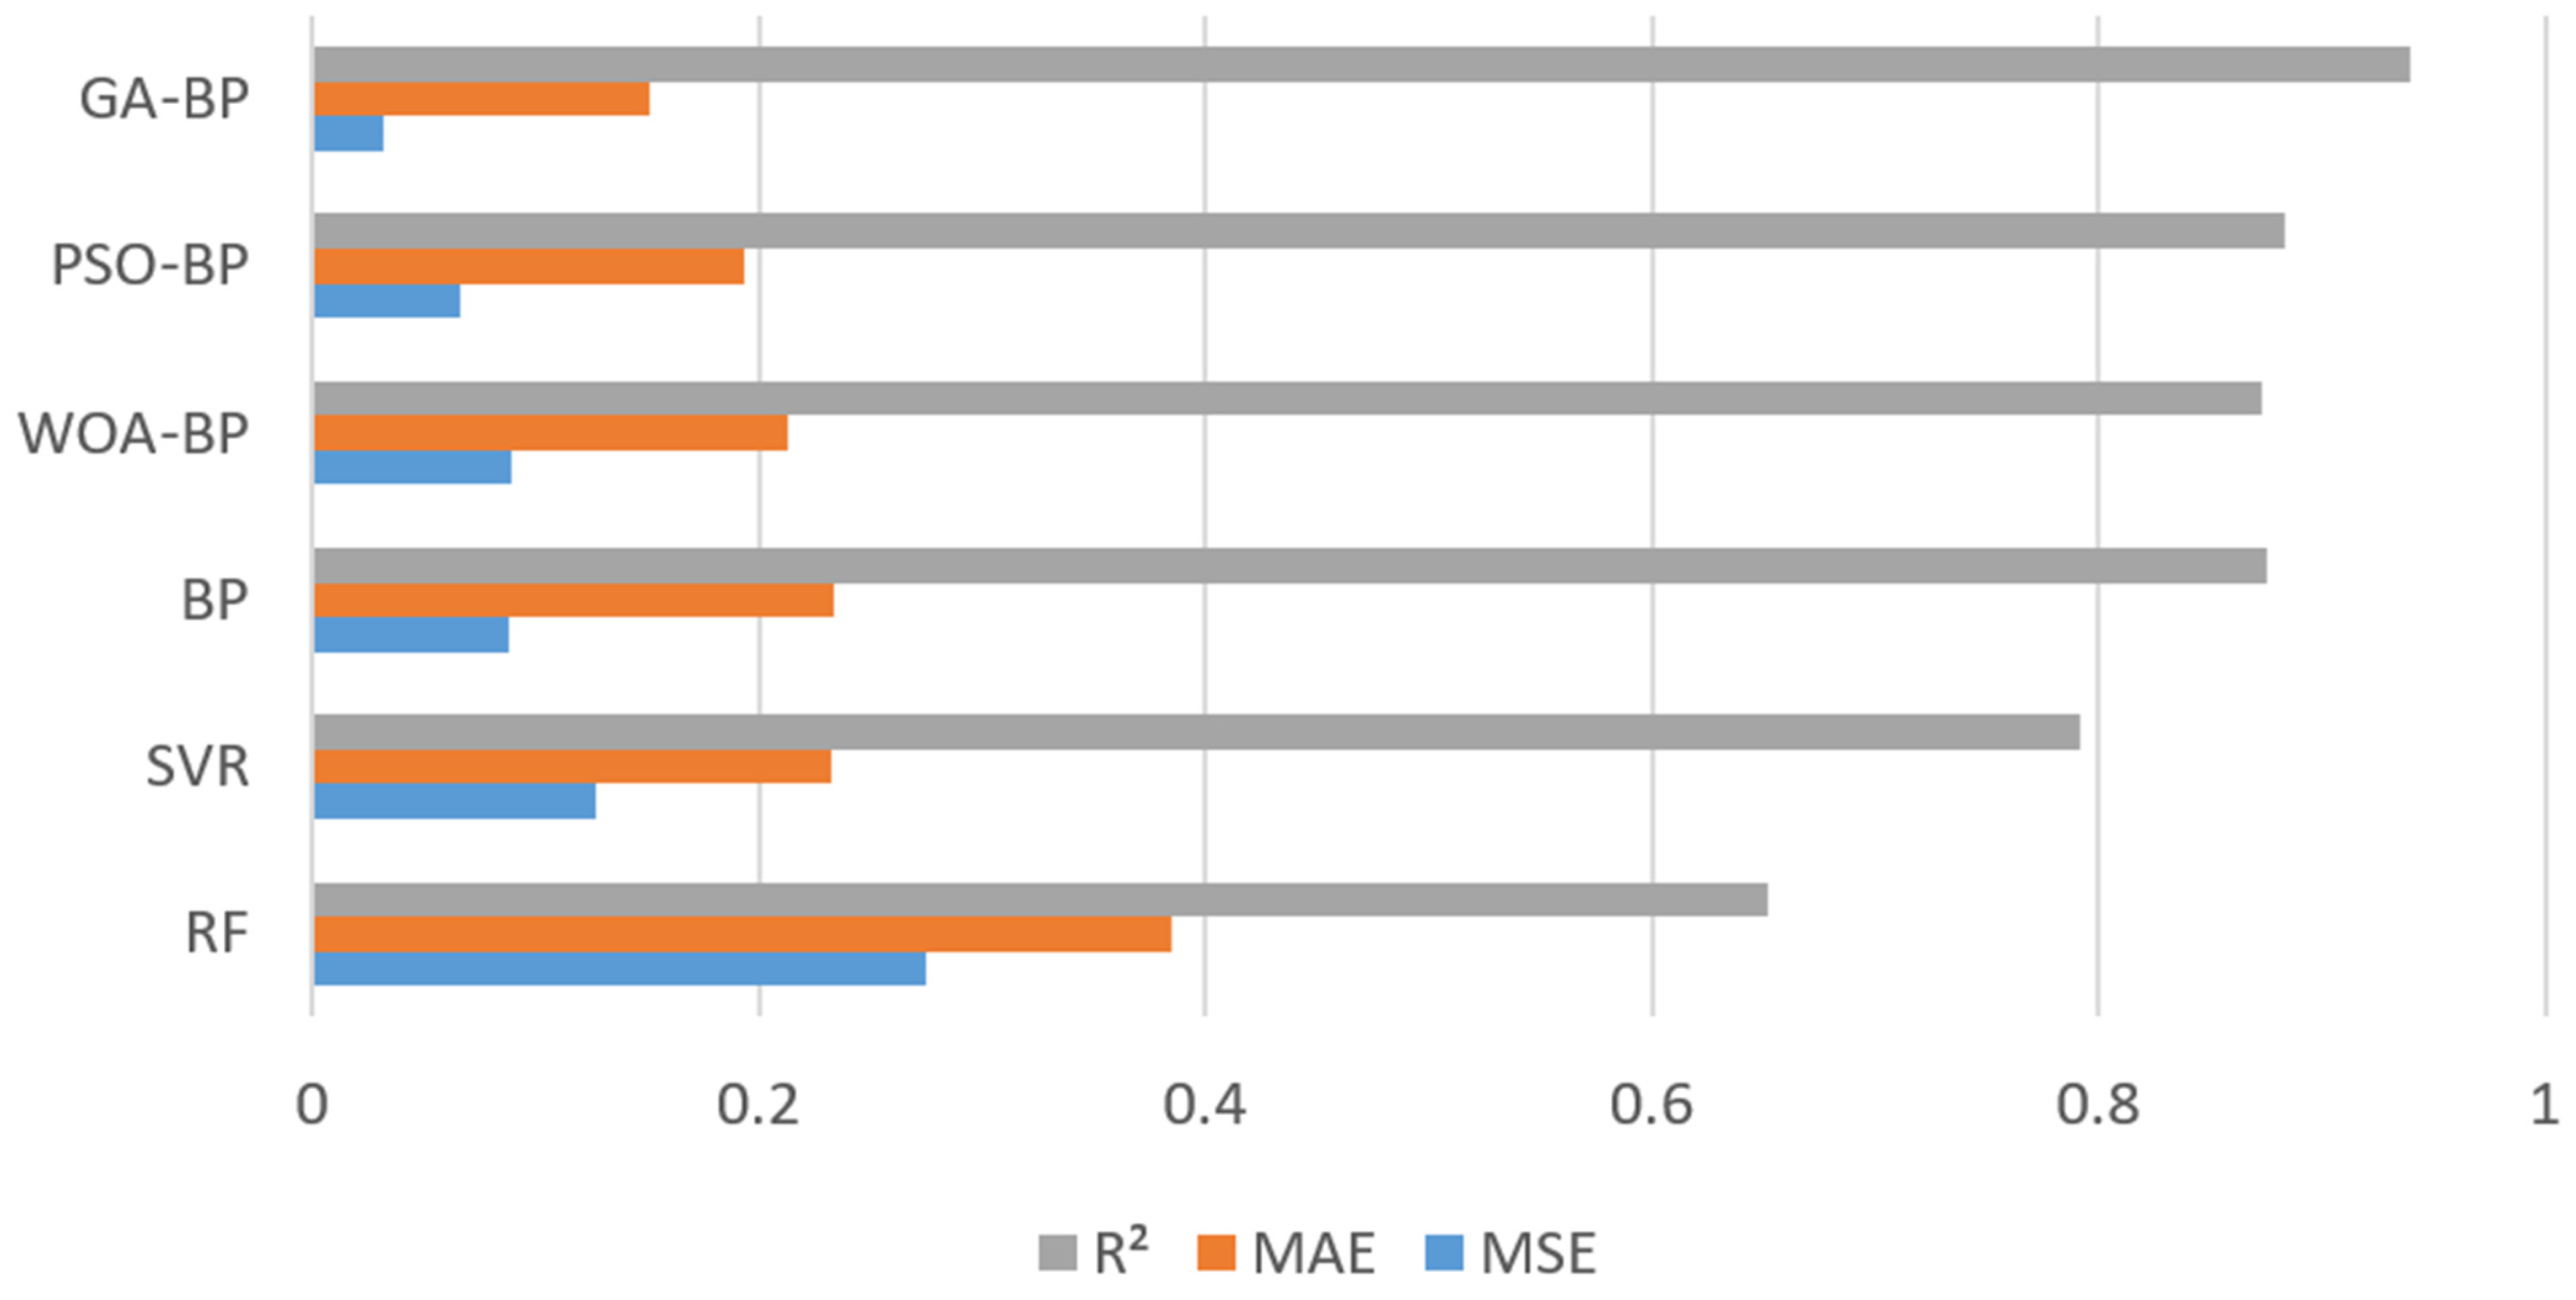
According to these metrics, as shown in
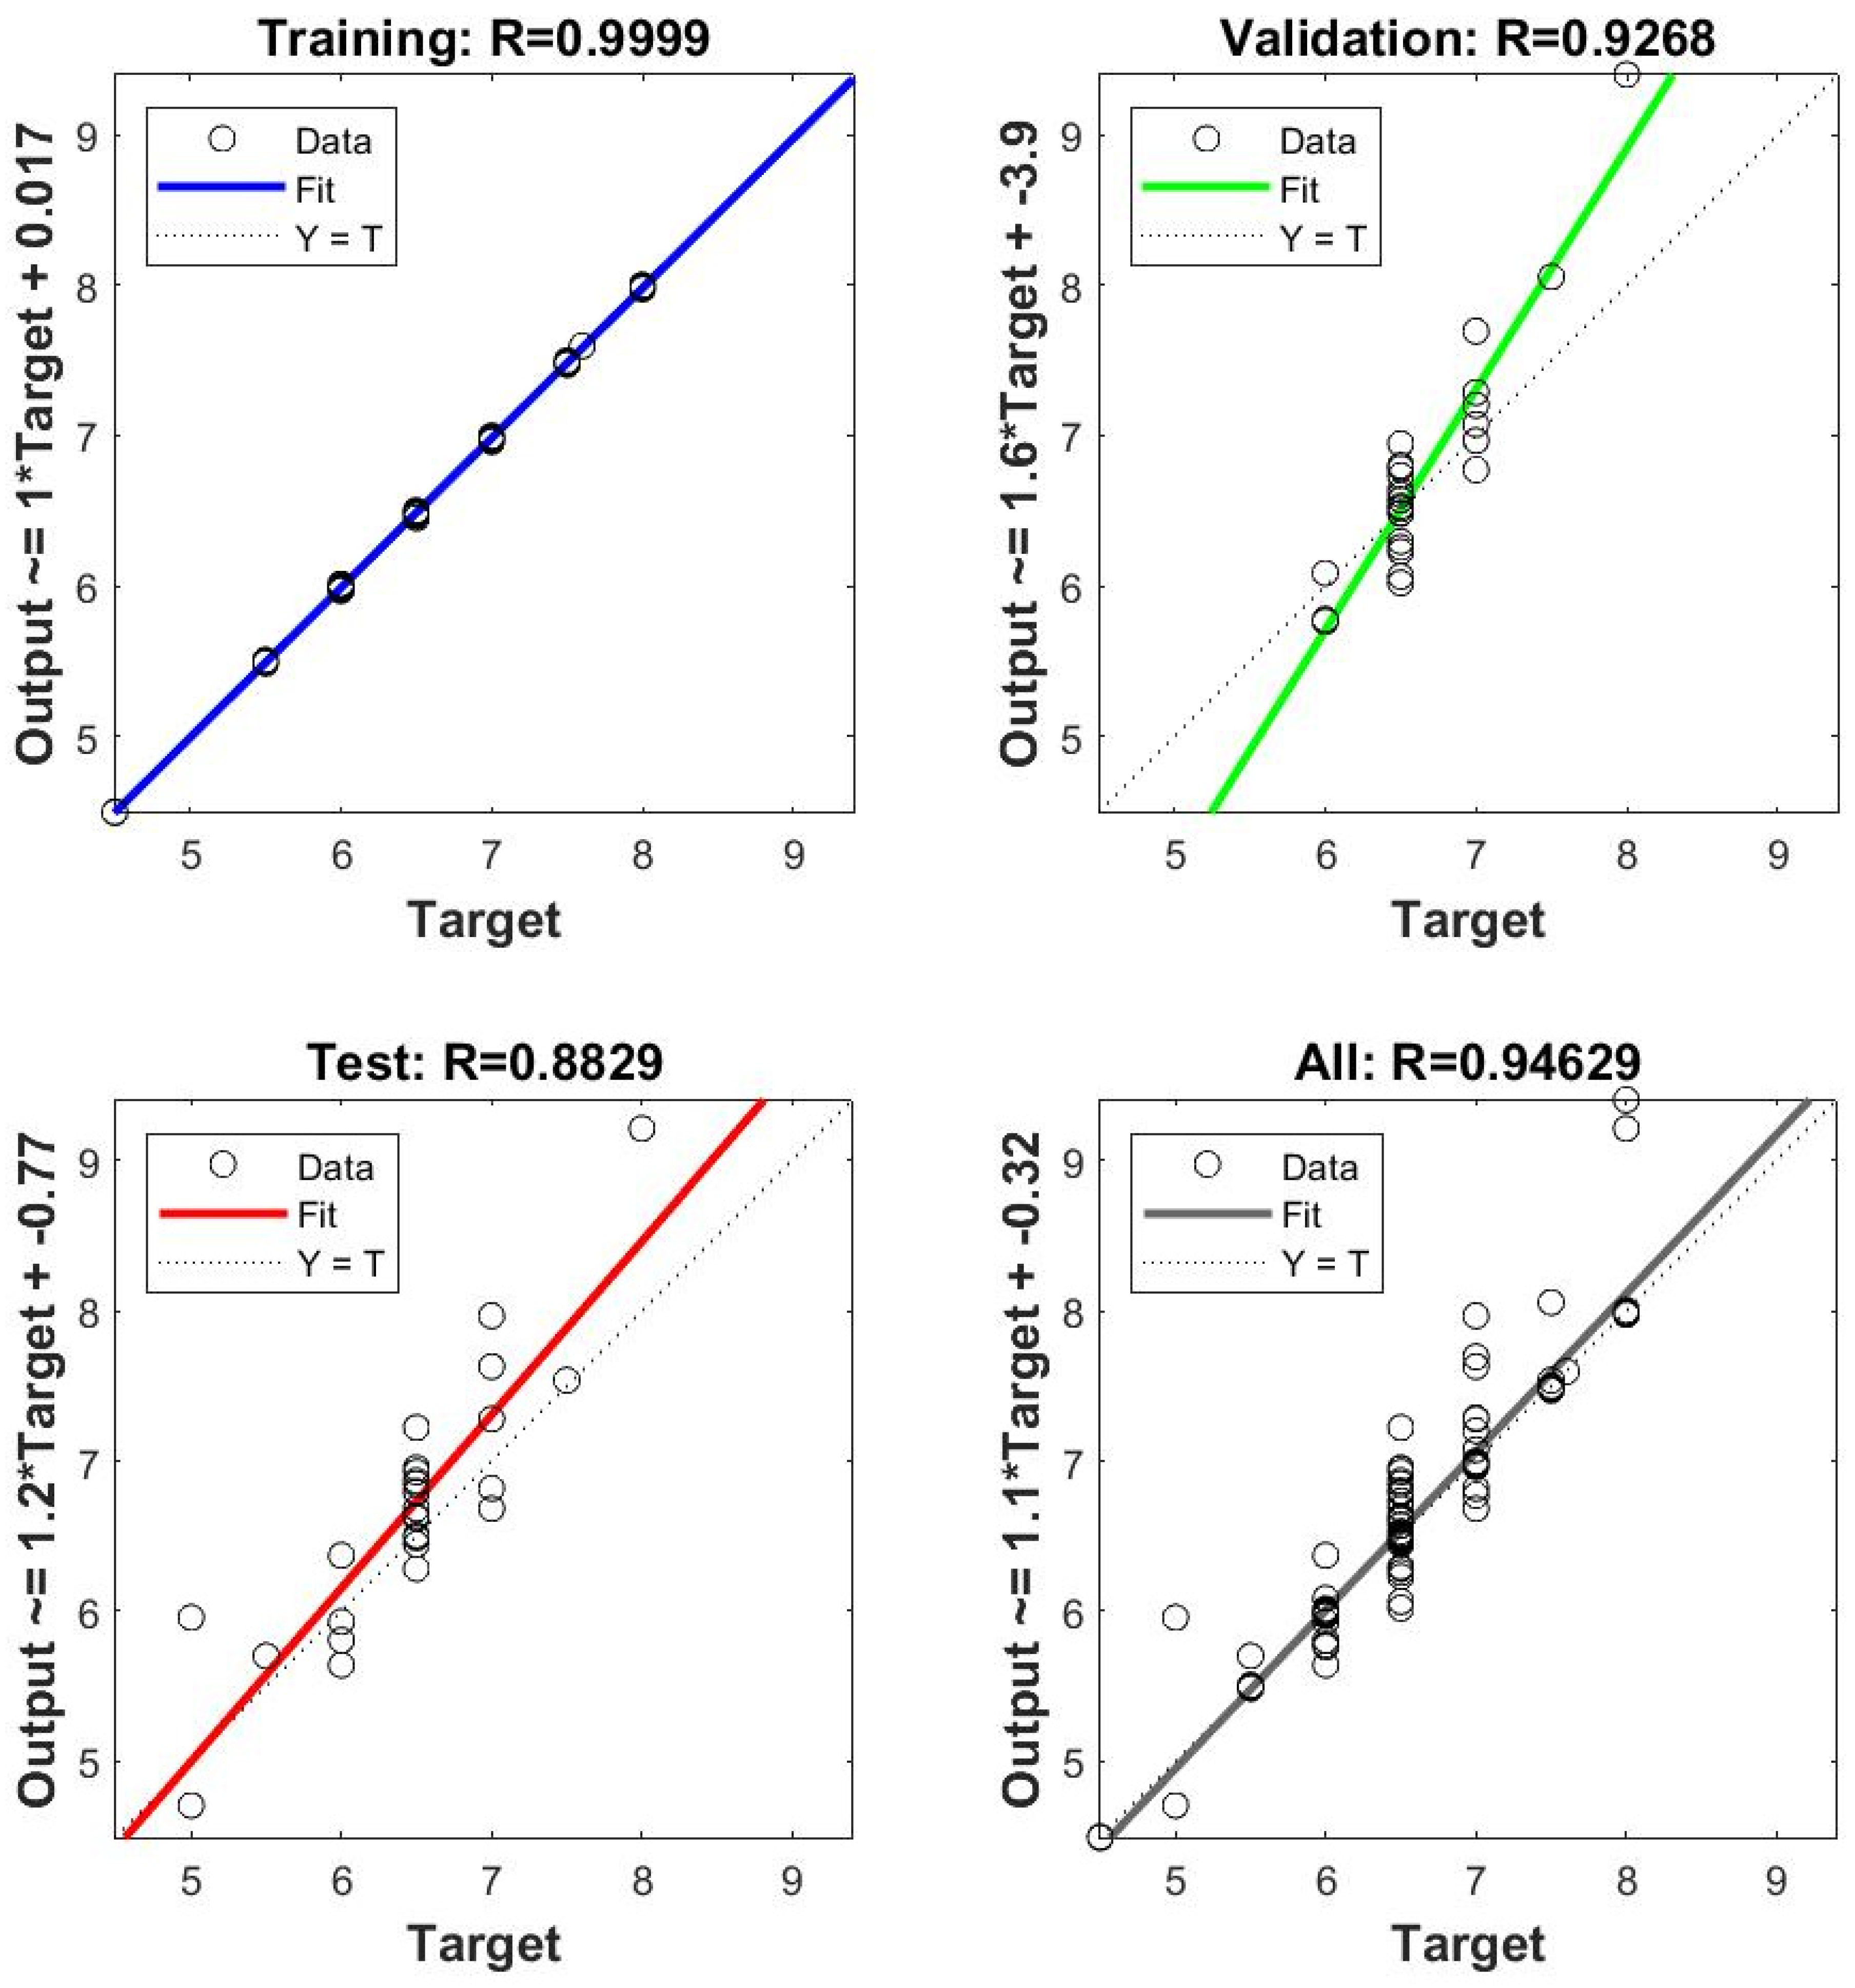
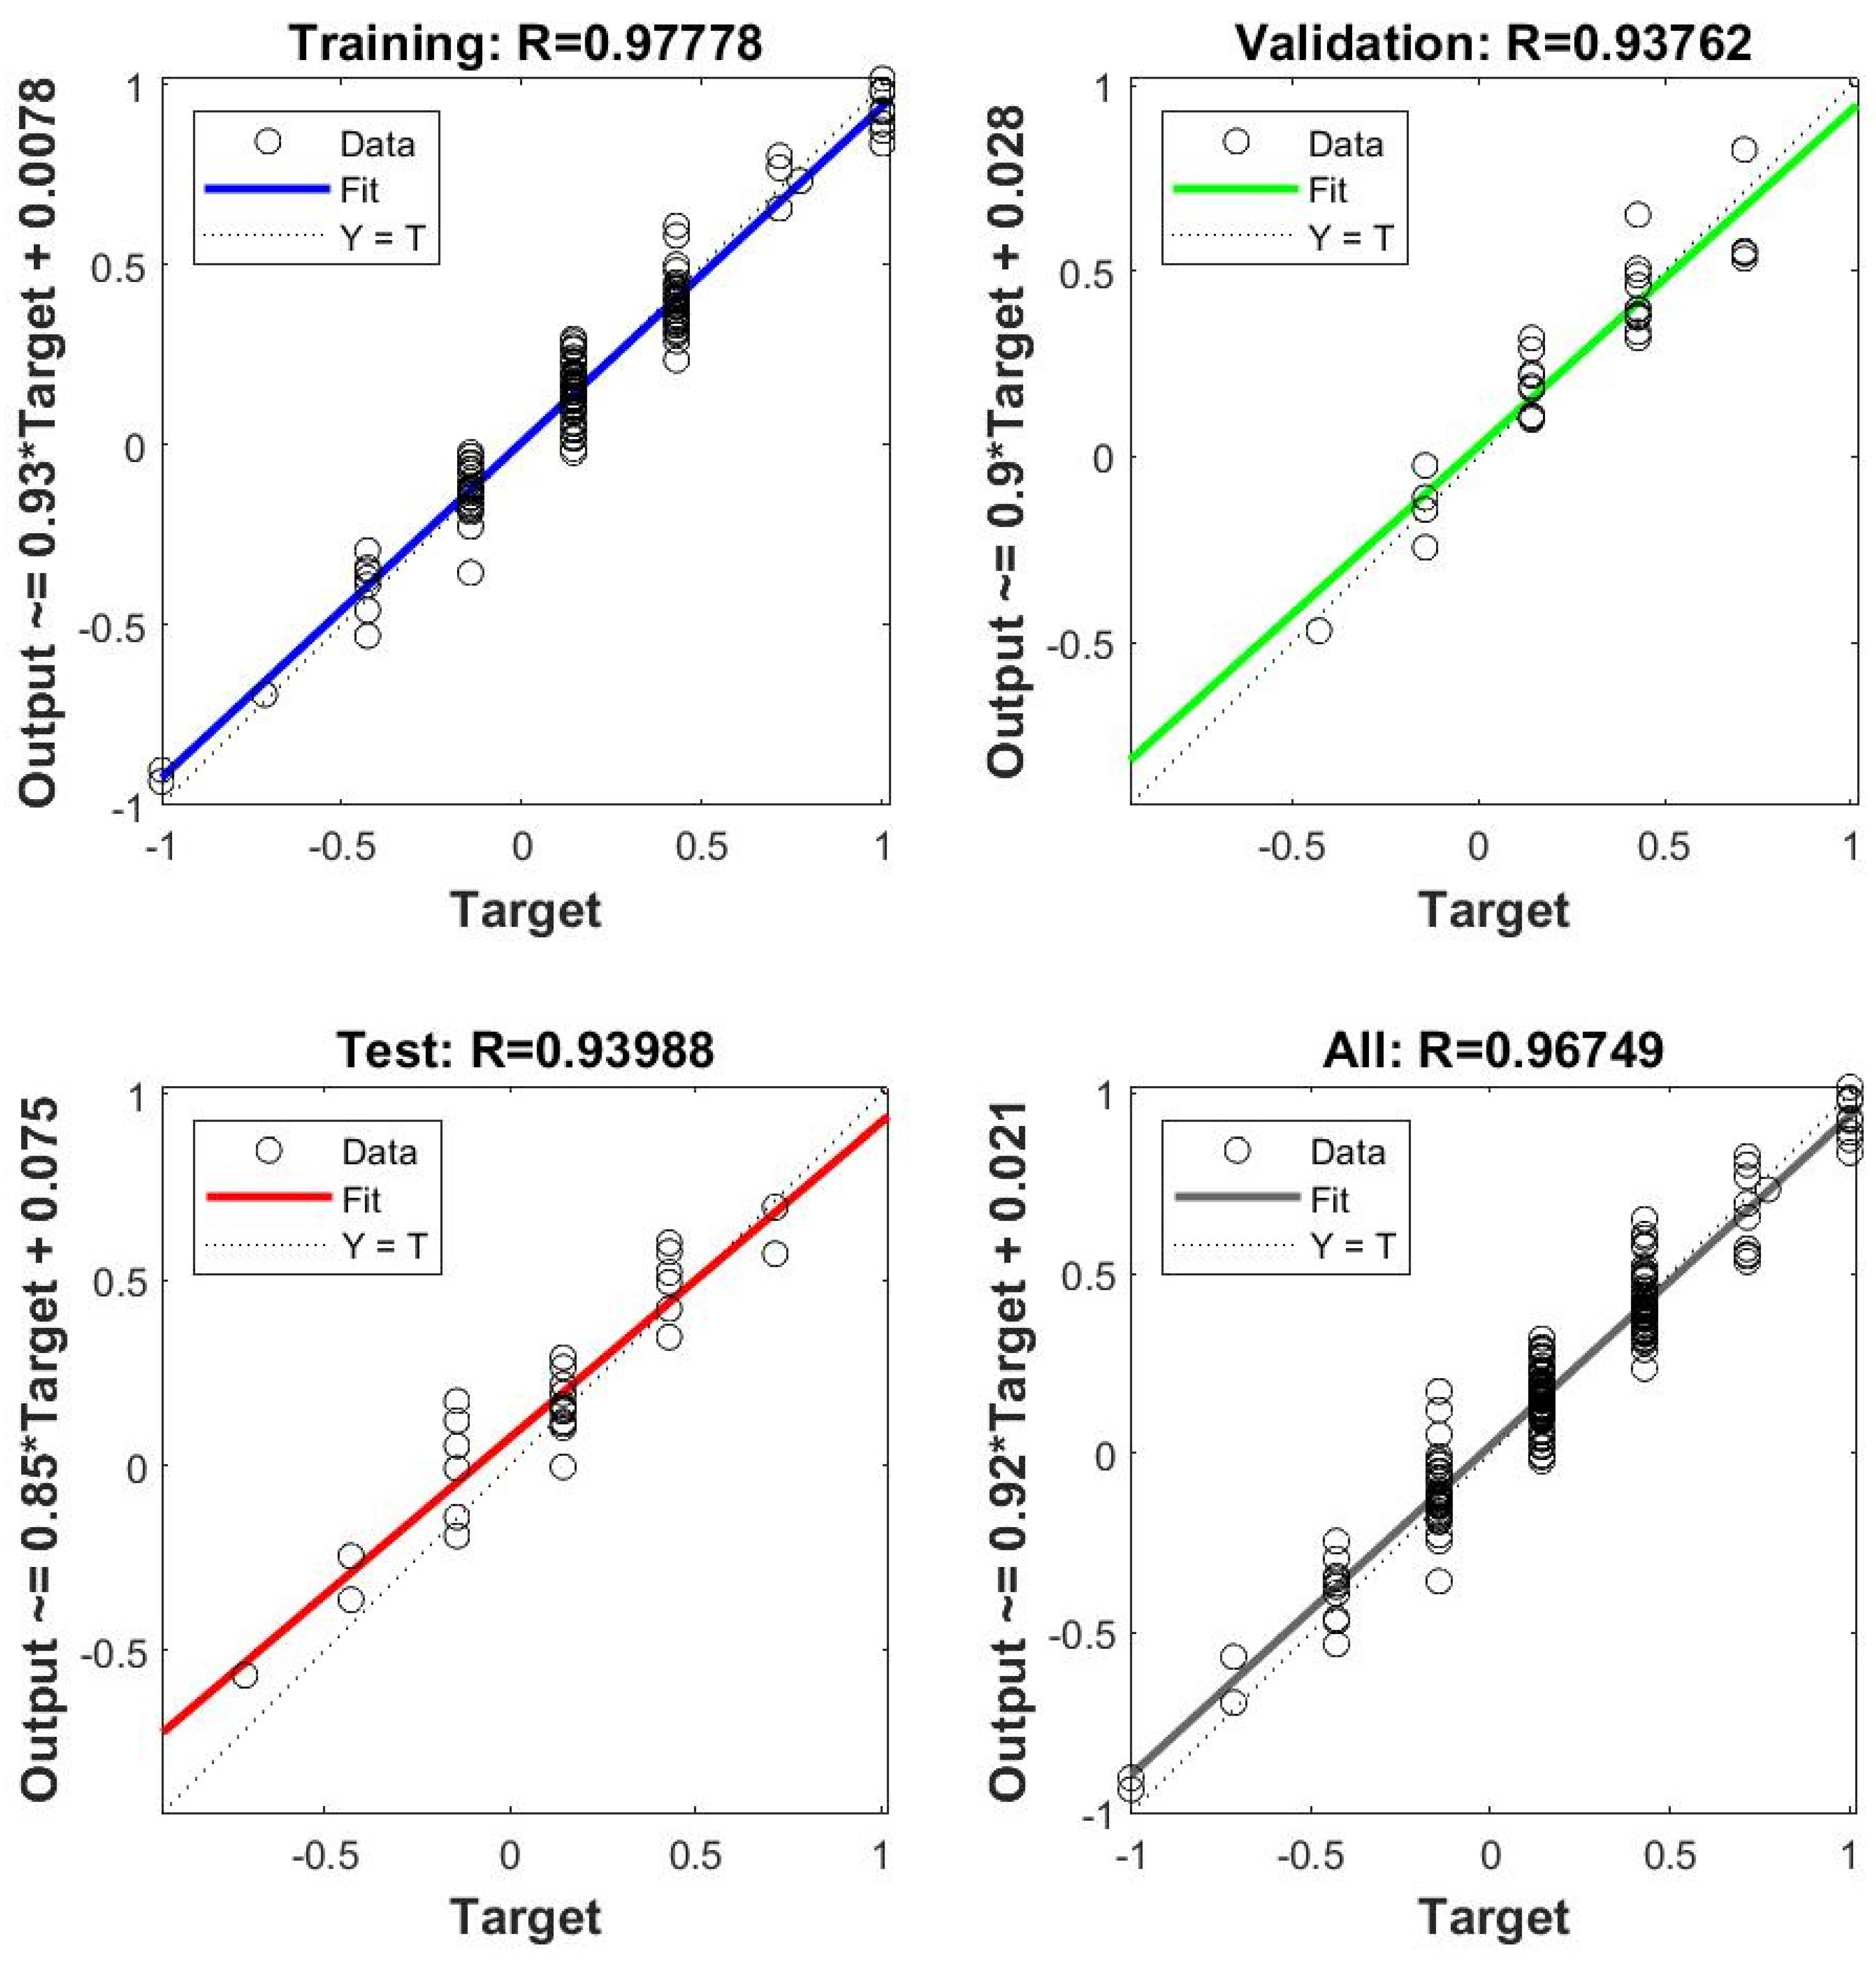
Figure 1, the BP model was superior to the SVR and RF models. Moreover, the BP model optimised using different algorithms was superior to the original BP model, with GA-BP being the best. To confirm this, we compared the three BP optimisation algorithms using correlation coefficient R values. Three algorithms (PSO, WOA, and GA) were used to optimise the BP neural network, and the results are shown in
Figure 2,
Figure 3 and
Figure 4. When training a BP neural network, it is typically desired that the R-value (correlation coefficient) be as close to 1 as possible, indicating a strong linear relationship between the model’s predicted values and the actual values, thus demonstrating the good predictive performance of the model. Therefore, this study also compares based on the R value; the closer the R value is to 1, the better the performance. In the results optimised by the PSO and WOA, the correlation coefficient R value of the test set was less than 0.9. However, when the weights and thresholds optimised by the GA were input into the BP neural network for simulation, the mean square error of the network training was better, and the R values of the training, test, validation, and full sample sets were all greater than 0.93, indicating a better fit of the model. The GA was set to an initial scale (20) and a maximum number of iterations (90). The BP was set to a training error (0.001), maximum number of training times (1500), learning rate (0.2), training function (trainlm), and MSE.
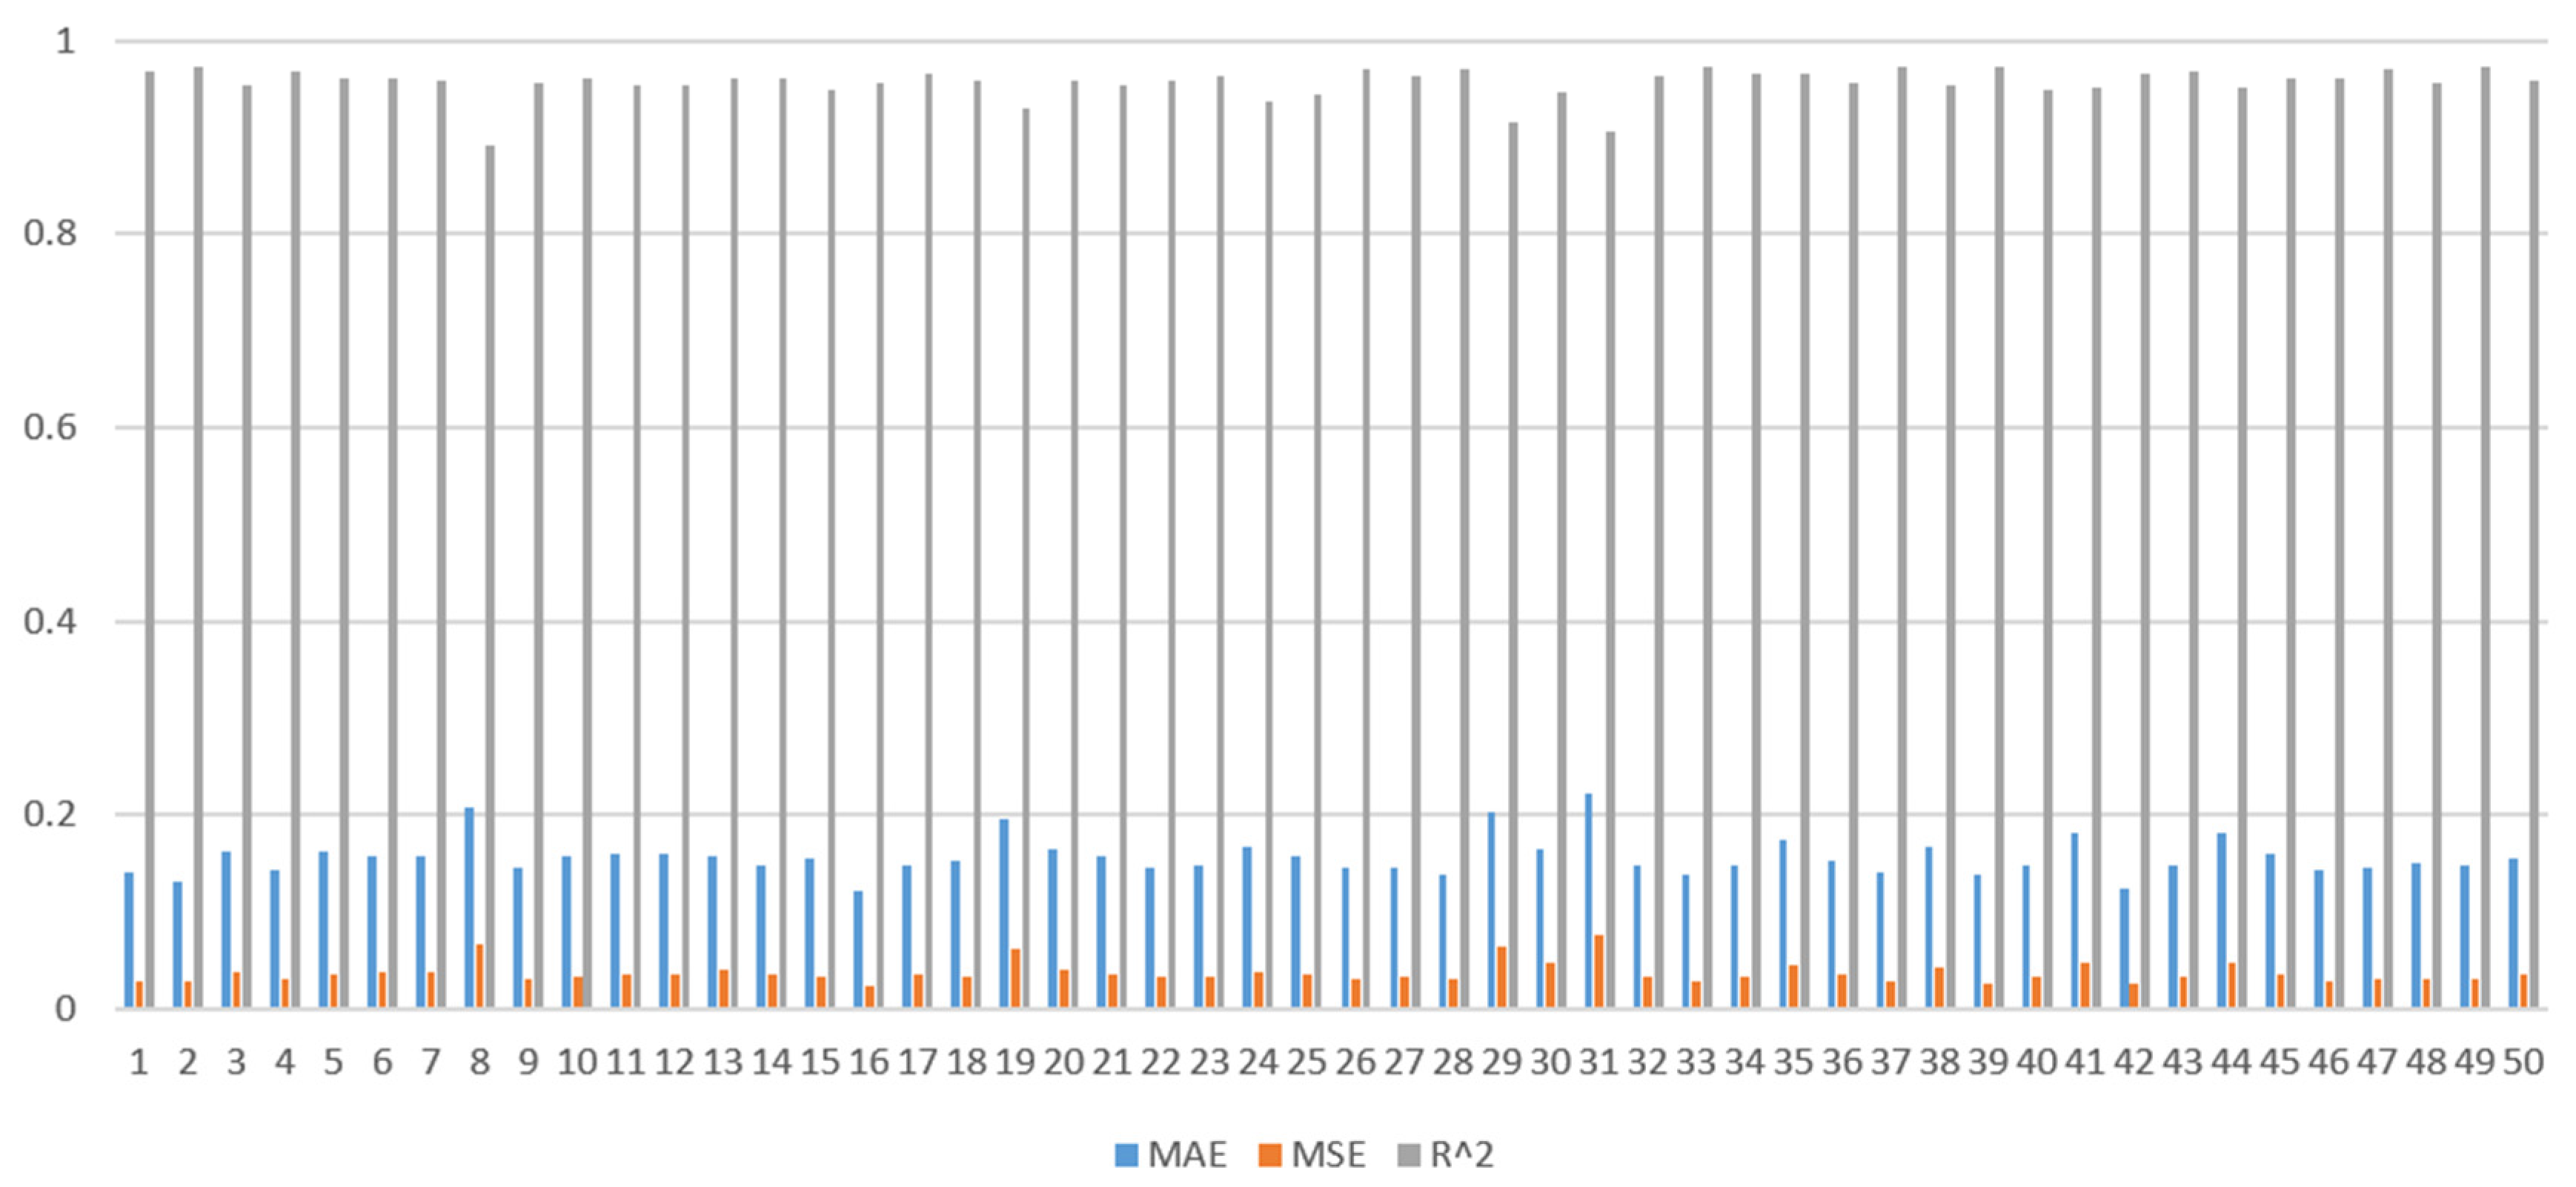
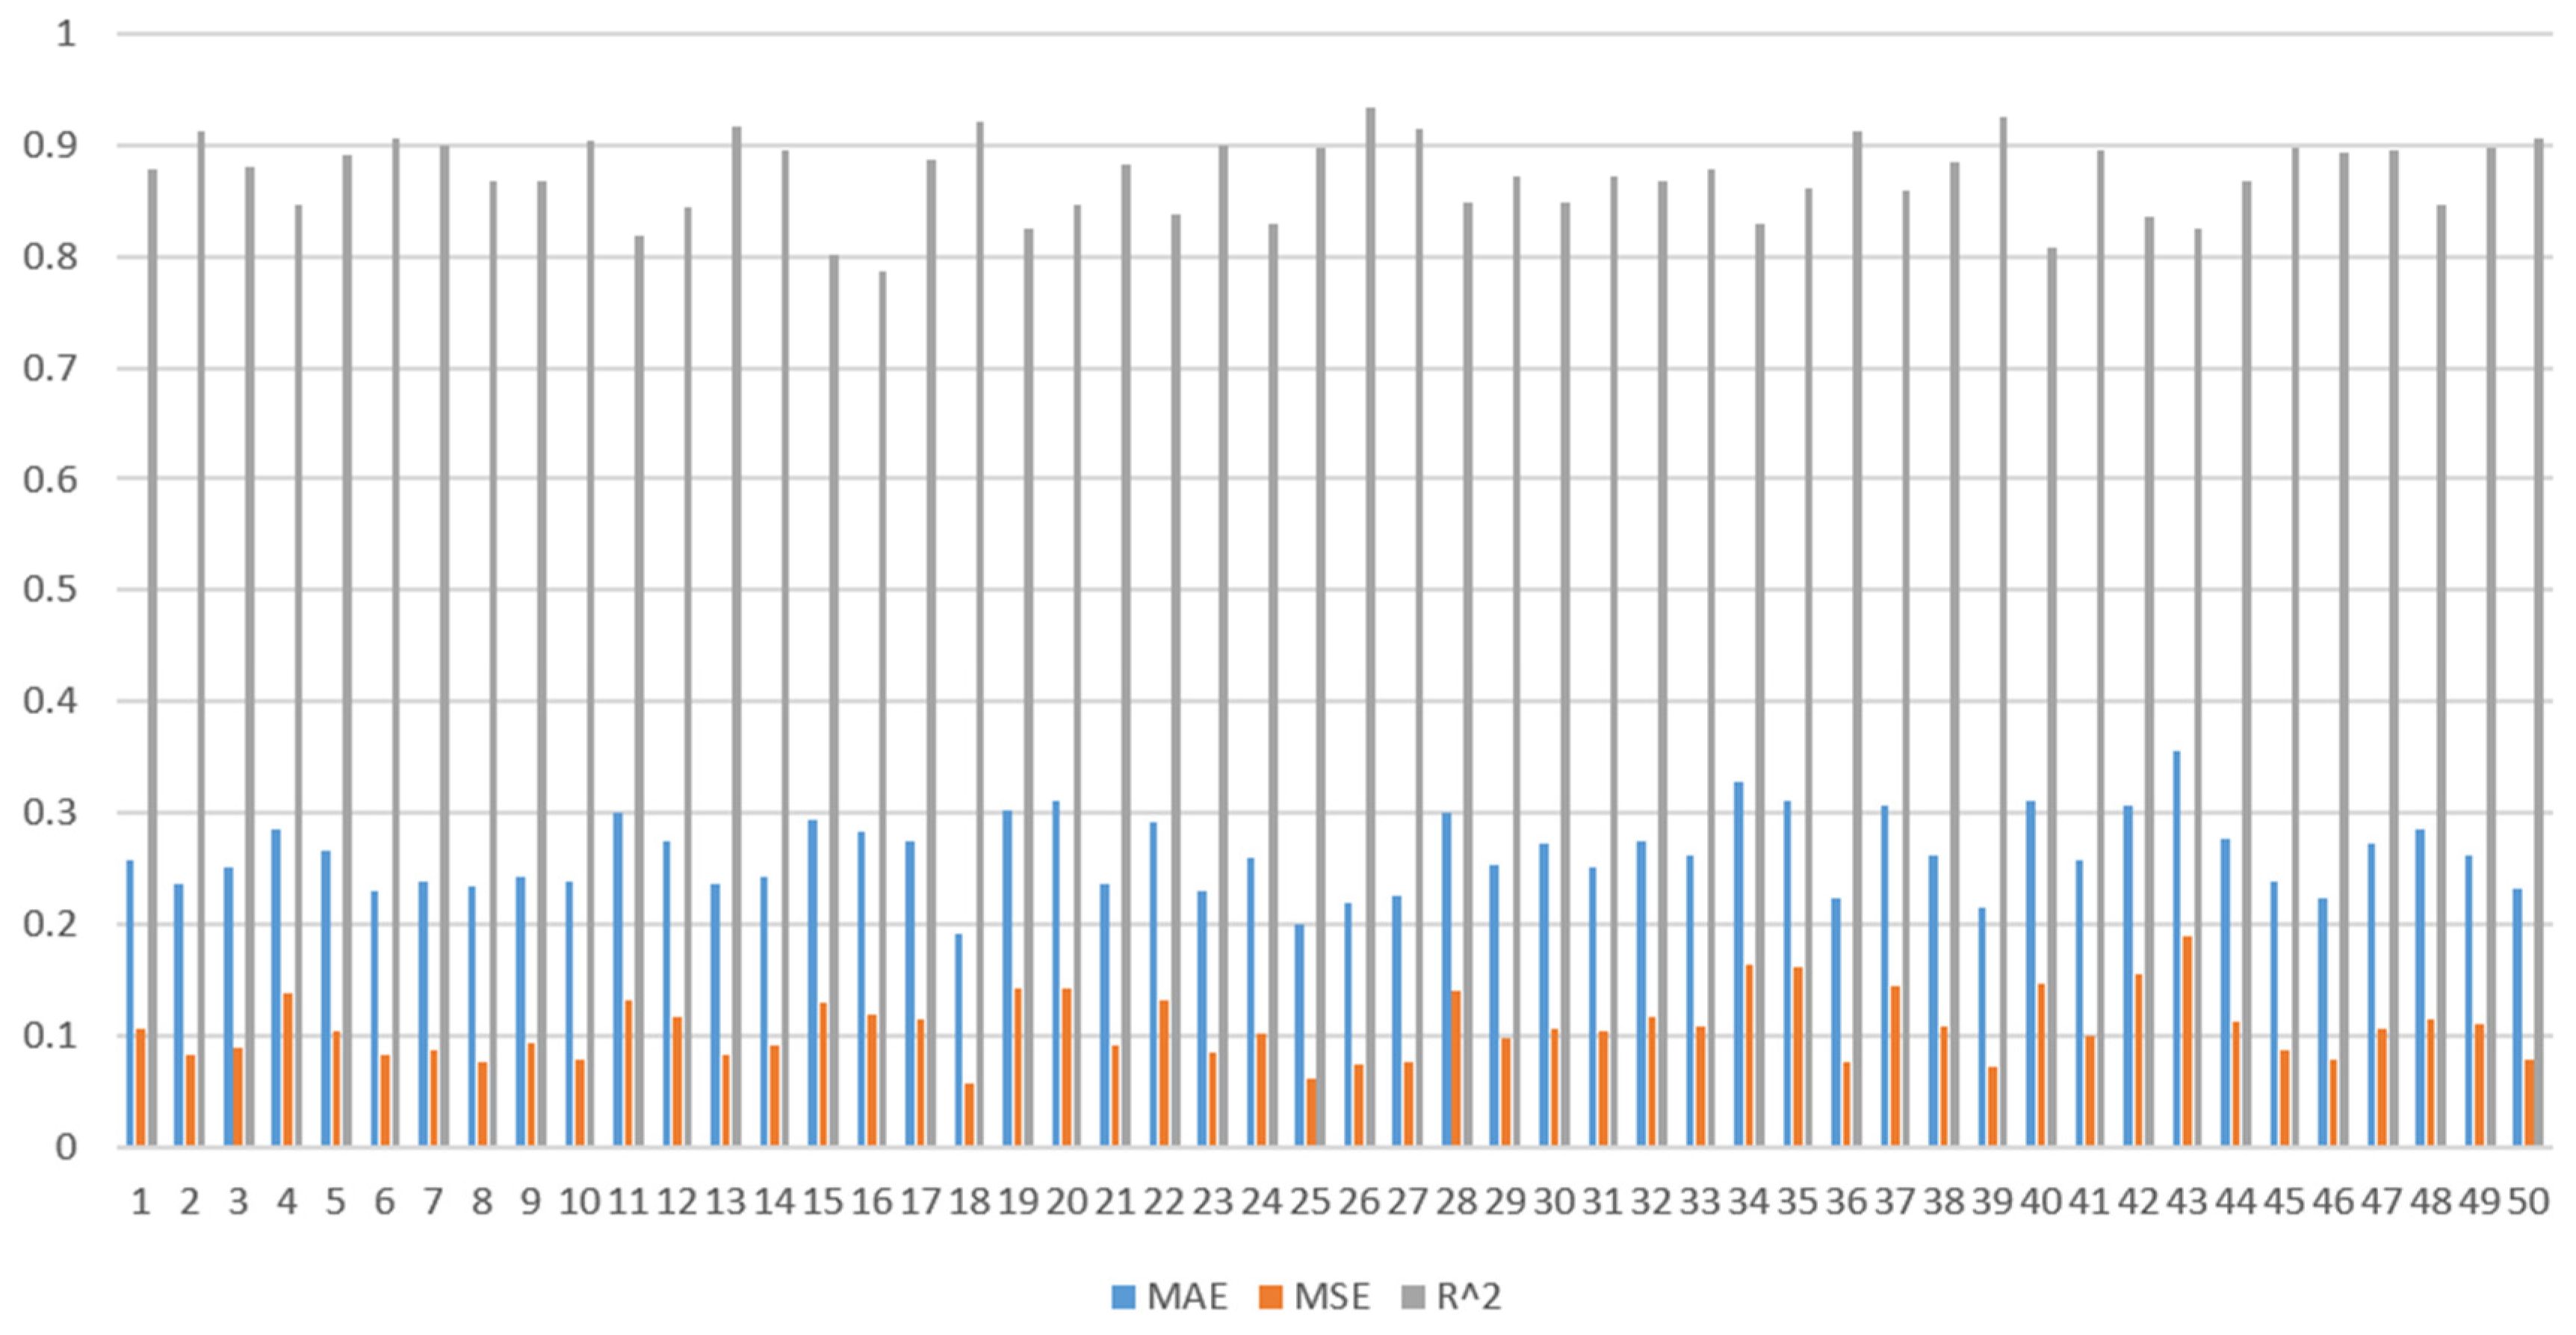
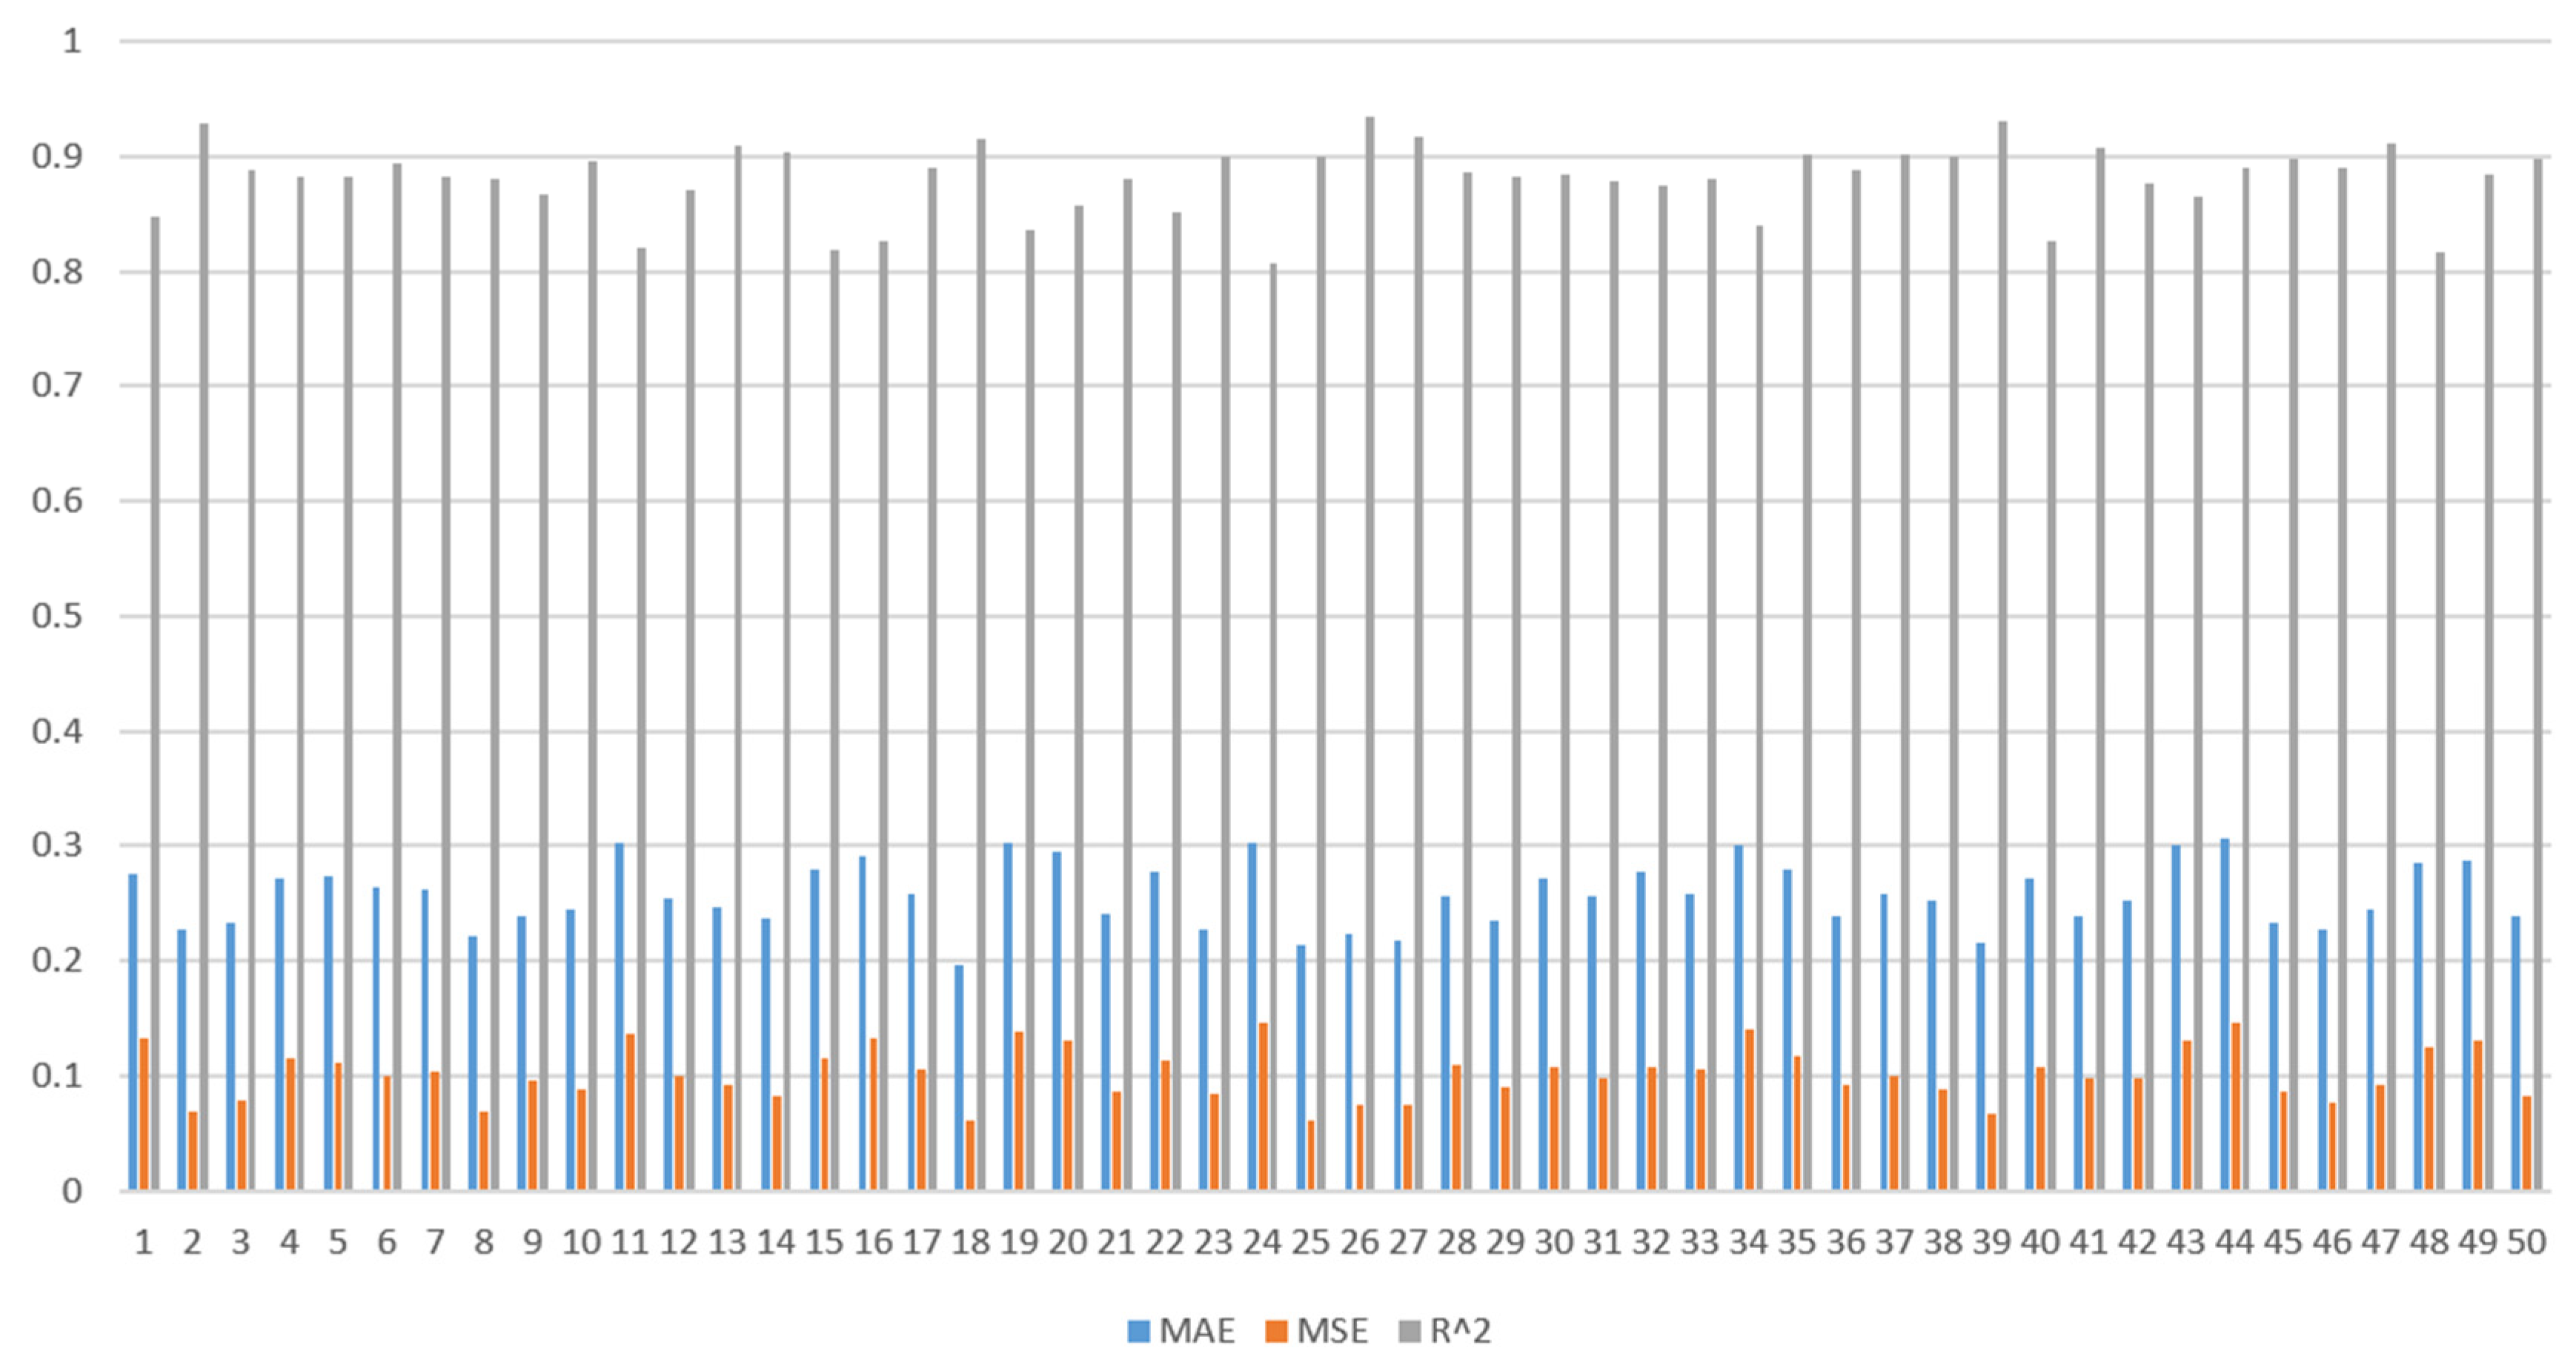
To better assess the stability and reliability of the models, and to minimize performance fluctuations due to the randomness of data partitioning, we further subject the three models (GA-BP, PSO-BP, WOA-BP) to repeated k-fold cross-validation. Given the modest size of our dataset, we set the value of k to 5. After adjusting the program code, we divide the dataset into five non-overlapping subsets. In each iteration, one subset is designated as the test set, while the remaining four serve as the training set. We then calculate the model’s error on the test set. This process is repeated 50 times, the average of these 50 values is taken as the performance metric for the three models, allowing for a more accurate determination of the optimal model. Based on the principle, R-squared (R
2) closer to 1 indicates that the model can explain the variation in the data well while the smaller mean absolute error (MAE) and mean squared error (MSE) values are, the better the model’s predictive performance. From the results of the experiment,
Figure 5,
Figure 6 and
Figure 7 represent the results of three models across three different metric dimensions, respectively, while
Figure 8 is a comparison of the three models based on the mean values of the model performance, which indicate that the GA-BP model has the lowest average error value across the five iterations. Therefore, consistent with different comparative methods, the GA-BP model is superior to the others and is more suitable for analysis in the domain and dataset discussed in this paper.
For the well-trained GA-BP neural network, further testing with 20 test samples revealed that the model testing effect was relatively optimal. Subsequent follow-up surveys were conducted on ten of these test sample systems, and the results showed that the risk level (average number of technological incidents per year) predicted by the GA-BP model did not differ significantly from the actual level. For example, in the case of test sample 12, the system was categorised as having a significant risk (with an average annual incident count of seven). Subsequent inspections revealed that the system was managed by a small IT supplier and had not yet migrated to a private cloud or a local bank deployment. The supplier’s staff had a weak sense of risk, low levels of knowledge and skills, and a tendency towards risk-taking and, hence, high risk. This is consistent with the predictions of the GA-BP model.
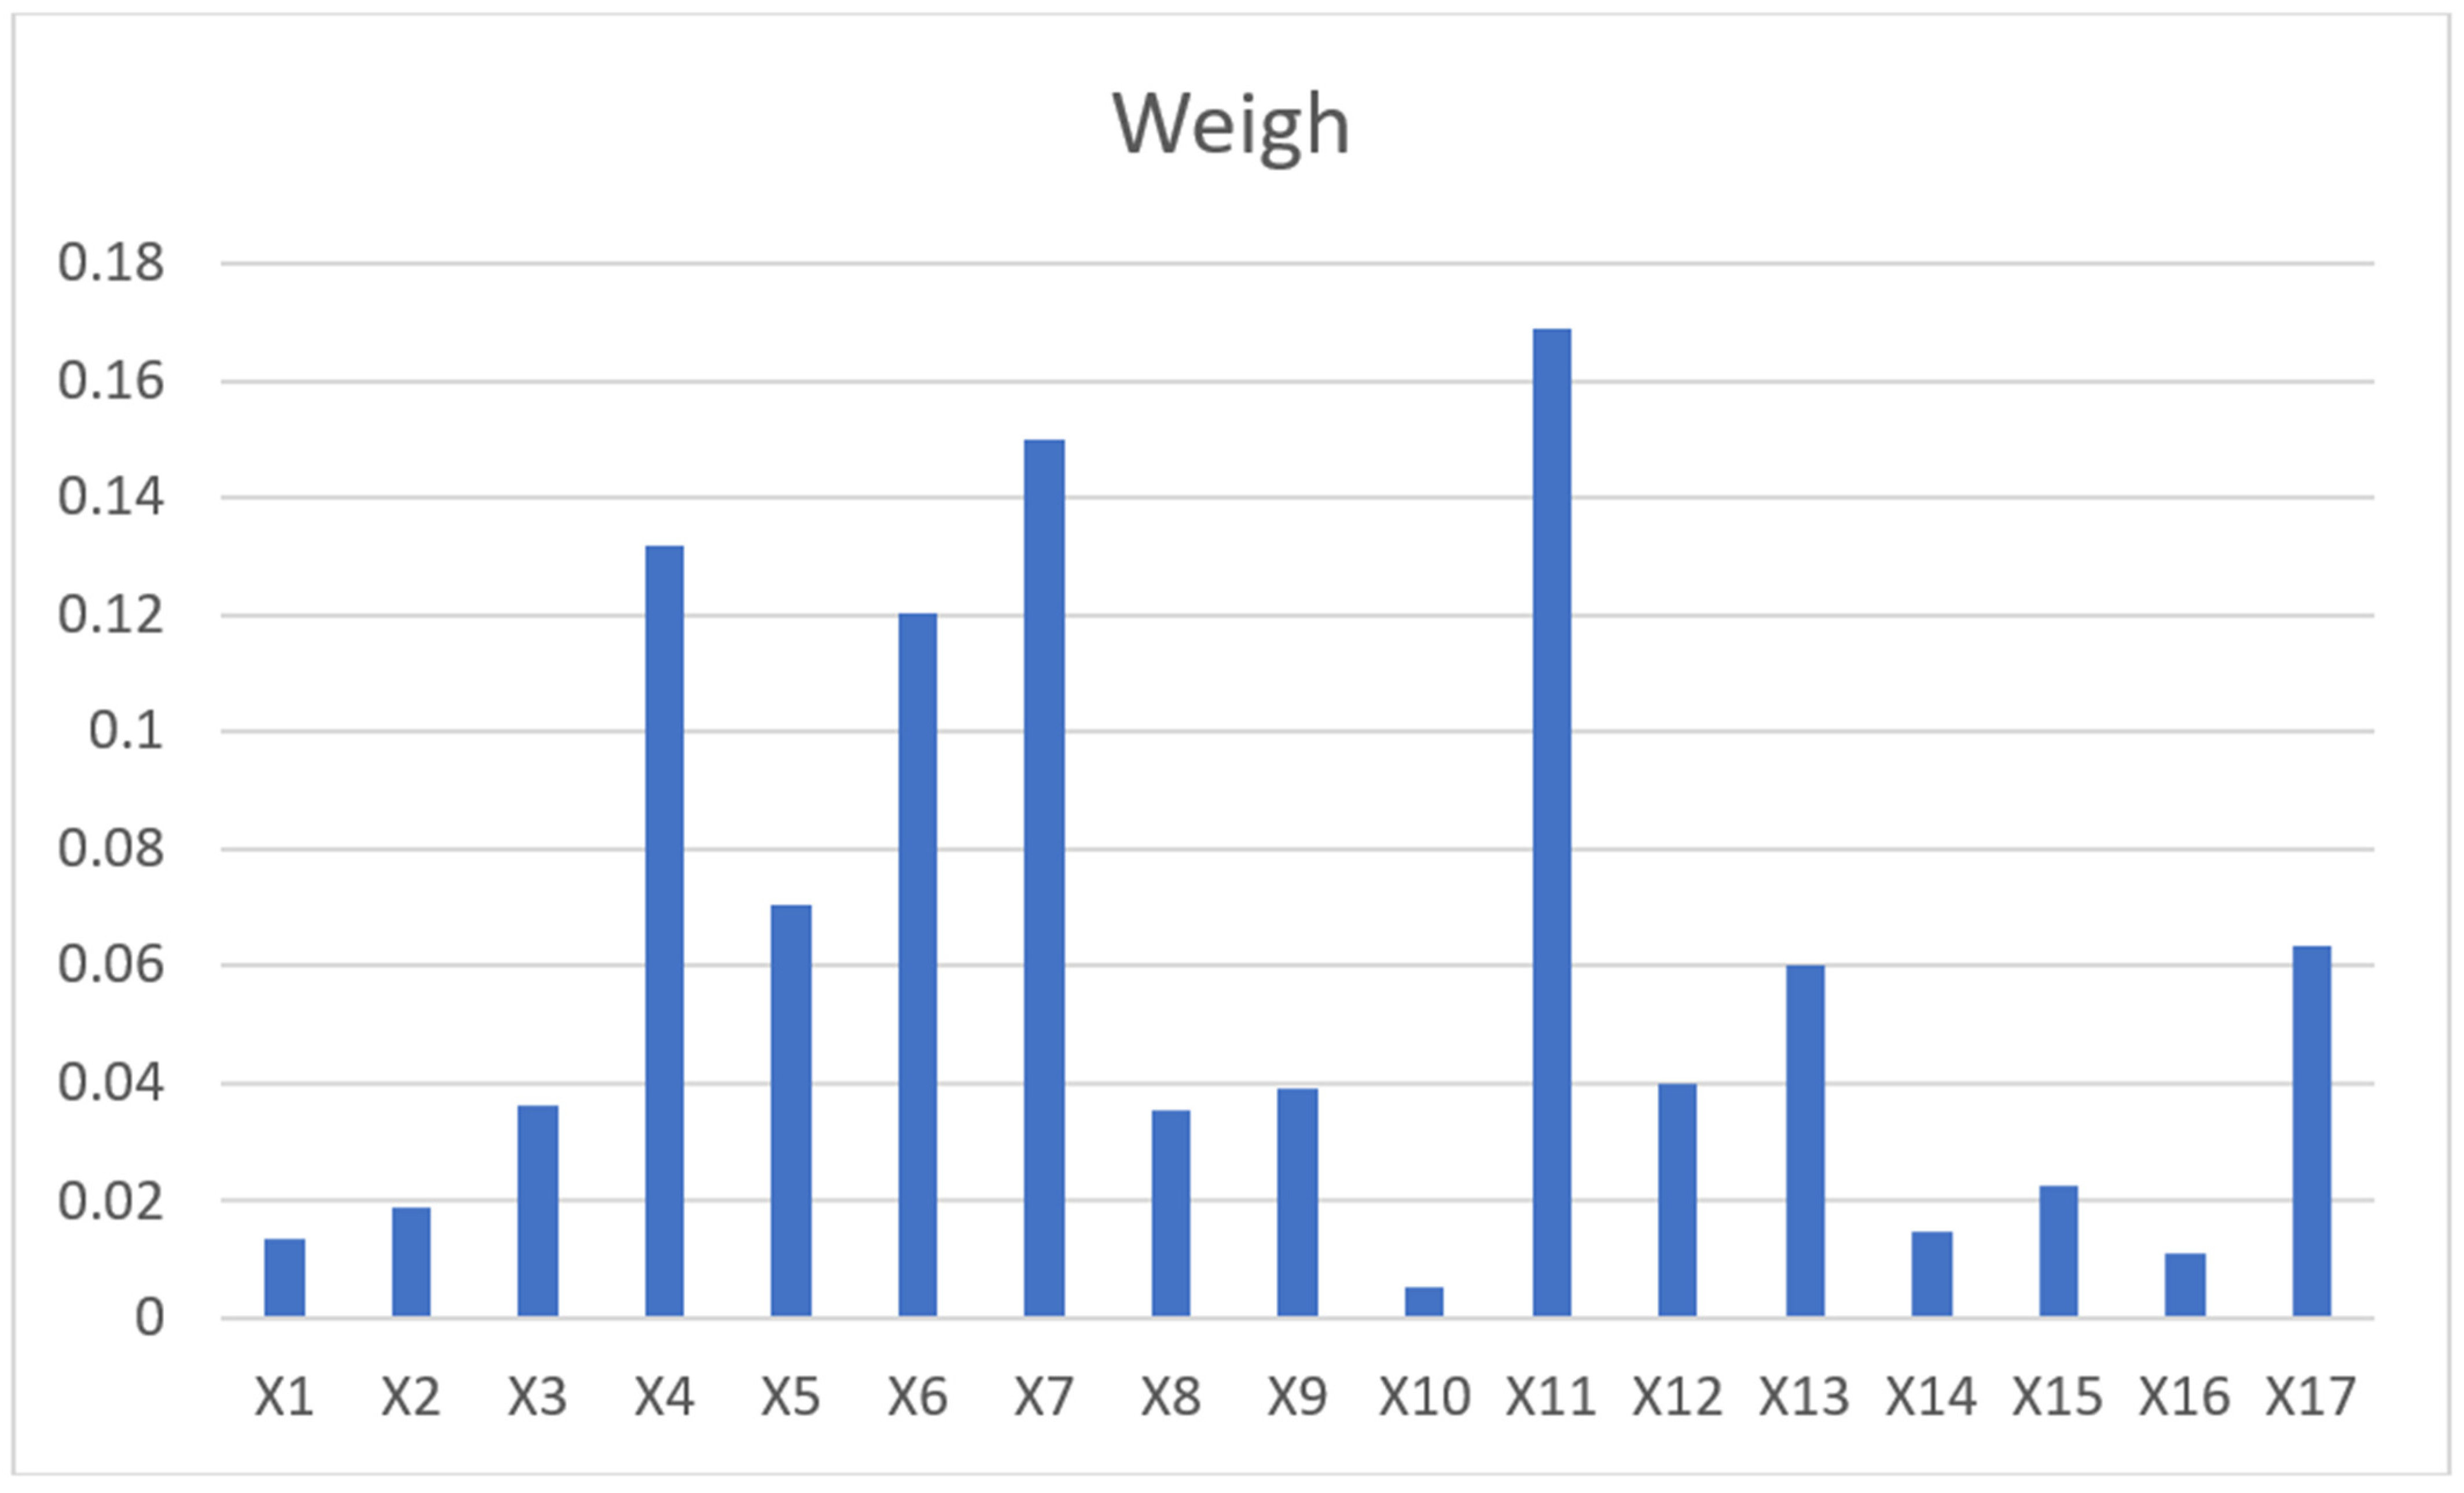
A bank was selected as the pilot for applying the GA-BP model in this study to further test its effectiveness. Based on the risk assessment questionnaire compiled in this study, a panel of experts composed of five system administrators conducted risk assessments on ten bank systems. The evaluated systems included front-end, middle, and back-end systems. The average score from the five experts was used as the final score of the risk assessment indicators, and this final score was input into the trained GA-BP neural network model for simulation testing to predict the risk value of the rated system. Records of the evaluated system were consulted based on the risk value. The results indicated that the risk values predicted by the GA-BP model were consistent with the actual situation and had certain ‘diagnostic evaluation’ capabilities. The constructed risk assessment indicators are reasonable. After network training and testing, the model performance was good, the connection weights and thresholds between the various network layers met the accuracy requirements, and a weight-learning mechanism was established. The connection weights from the input layer to the hidden layer of the well-trained network were retrieved using MATLAB software, as shown in
Table 4. Based on the following formula, the weights of the 17 secondary risk assessment indicators were calculated, and the results are shown in
Figure 5:
where
is the weight of the
jth node in the input layer,
m is the number of nodes in the input layer,
n is the number of nodes in the hidden layer,
is the connection weight between the
jth node in the input layer and the
ith node in the hidden layer,
is the connection weight between the
ith node in the input layer and the
ith node in the hidden layer.
As shown in
Figure 9, the weights of all the indicators are greater than zero, indicating that these 17 indicators have varying degrees of impact on the risk rating. According to the weight values, employee negligence (X11) has the highest weight, suggesting that employee negligence is currently the largest risk point in banking IT. This is due to employees’ lack of understanding of or non-compliance with IT regulations and procedures. It is necessary to strengthen IT training and education for employees, reinforce the execution of IT regulations, and effectively avoid employee negligence through measures such as multiple defence lines. The next highest risks are outdated or incompatible technology (X7) and upgrade impact (X4), whereas the least significant is unauthorised access (X10). The risk index for outdated or incompatible technology (X7) is the second highest, suggesting that the technology currently in use by banks may be outdated or have compatibility issues with other systems. This can lead to low system efficiency and even larger security and operational issues. The upgrade impact (X4) risk index also scored high, indicating that during system upgrades, the evaluation and testing of system-related impacts were insufficient, and more scientific impact assessments and comprehensive testing are required. The risk index of unauthorised access (X10) was the lowest, suggesting that banks’ measures against illegal access were relatively effective. However, continuous attention is still required to maintain and upgrade the security measures. Overall, these results indicate that banks’ IT risks are mainly concentrated on employee behaviour and outdated technology. Therefore, improving employees’ IT knowledge and skills, as well as upgrading and updating IT systems and technology, may be key to improving a bank’s IT risk situation.
For instance, the results of this model evaluation indicate that ‘employee negligence’ accounts for a significant proportion, suggesting that IT risk incidents in banks are largely due to this reason. Therefore, targeted interventions can be implemented, including but not limited to introducing additional review roles, organising regular staff training and skill assessments, and periodically revising the operational manual to provide correct guidance.
6. Discussion
The overall objective of this study was to assist commercial banks in concentrating their limited resources on the most important and urgent remediation items. The survey questionnaire covered 15 key systems, with feedback from the principal personnel in each system, which can accurately reflect the actual situation within the bank rather than a one-sided or subjective view.
With the increasing depth of ‘digital transformation’, the scale and complexity of commercial bank IT systems are rapidly increasing, which puts higher requirements on IT risk management. In the face of various risks such as data leakage, system crashes, and cyberattacks, as well as the increasingly complex IT environment, commercial bank IT personnel may make mistakes and omissions while performing a large amount of mental labour. Therefore, performing a risk assessment of commercial banks’ IT systems is of great significance in preventing these problems.
The main contributions of this study are as follows:
This study enriches the research related to commercial bank IT risk management, clarifies the definition of IT system risk indicators, and constructs an IT risk assessment indicator system that includes six aspects, such as ‘equipment technology personnel security management environment’.
Through an empirical comparison of three different algorithm optimisations, we found that the genetic-algorithm-optimised BP neural network outperformed the PSO and WOA. Additionally, we quantified the relationship between the test indicator data and IT system risk and empirically tested the feasibility of the GA-BP model in an IT system risk assessment of a commercial bank.
We established a weight-learning mechanism based on neural network theory and used a well-trained GABP model to calculate the weights of IT system risk assessment indicators, providing theoretical support for risk behaviour intervention measures. Overall, this study provides commercial banks with an effective IT system risk assessment tool and useful suggestions for reducing IT system risks.
However, this model has some limitations and is not applicable to all scenarios. For example, if there is a large variance in the scoring results for the same indicator, the resulting R-value will be lower, indicating poor performance. A limitation lies in the fact that the study subjects were from the same bank and within the same region. If there was a significant disparity in the same risk factors, the model would not be applicable.
7. Conclusions
For the IT system risk assessment of commercial banks, we established a risk assessment indicator system consisting of six primary and seventeen secondary indicators. This system comprehensively considers various IT system risk factors, reflecting the comprehensiveness of risk assessment. To further improve the accuracy of risk prediction, we found through an empirical comparison of three different algorithm optimisations that the model based on the GA-BP theory has high accuracy in predicting IT system risk levels. Practical applications demonstrate that this model can accurately reflect the nonlinear complex relationship between evaluation indicators and IT system risk, thereby achieving an accurate risk assessment. Based on this, corresponding preventive strategies can be implemented to prevent the occurrence of risky incidents.
According to our model, factors such as employee negligence, outdated or incompatible technology, and system upgrades have a greater impact on IT system risks. Therefore, we suggest implementing corresponding intervention measures for these high-risk factors to reduce the risk levels in IT systems. Based on the recommendations of internal banking experts, the threshold value for the metric weights is set at 0.20 as a critical level. For instance, if ‘employee negligence’ reaches a weight of 0.20, this indicates that the issue is not isolated or minor but rather points to multiple underlying problems, such as a lack of staff training, insufficient handover when changing positions, or outdated operational manuals. Immediate and effective measures must be taken to prevent major information system incidents that could lead to substantial financial losses or severe damage to a bank’s reputation. Overall, our research provides commercial banks with a comprehensive and accurate IT system risk-assessment tool that helps improve the security and stability of IT systems. After conversing with bank employees, we learned that this risk model, when applied to actual work, provides very good quantitative results. This enables banks to quickly identify key indicators from a multitude of metrics and perform targeted rectifications, rather than relying on subjective judgement based on experience, as in the past.


