Article

Sugars’ Quantifications Using a Potentiometric Electronic Tongue with Cross-Selective Sensors: Influence of an Ionic Background

by
Vinicius da Costa Arca
1,2,
António M. Peres
1,3,
Adélio A. S. C. Machado
4,
Evandro Bona
5 and
Luís G. Dias
1,*,†
1
Centro de Investigação de Montanha (CIMO), Instituto Politécnico de Bragança, Campus Sta Apolónia, 5300-253 Bragança, Portugal
2
UTFPR—Universidade Tecnológica Federal do Paraná, Departamento de Alimentos, Campo Mourão 87301-89, Brazil
3
Laboratory of Separation and Reaction Engineering—Laboratory of Catalysis and Materials (LSRE-LCM), ESA, Instituto Politécnico de Bragança, Campus Santa Apolónia, 5300-253 Bragança, Portugal
4
Departamento de Quiímica e Bioquímica, Faculdade de Ciências, Universidade do Porto, R. do Campo Alegre, 687, 4169-007 Porto, Portugal
5
PPGTA—Programa de Pós-Graduação em Tecnologia de Alimentos, Universidade Tecnológica Federal do Paraná, Campo Mourão 87301-899, Brazil
*
Author to whom correspondence should be addressed.
Current address: Escola Superior Agrária, Instituto Politécnico de Bragança, Campus de Santa Apolónia, 5300-253 Bragança, Portugal.
Chemosensors 2019, 7(3), 43; https://doi.org/10.3390/chemosensors7030043
Submission received: 19 June 2019 / Revised: 12 August 2019 / Accepted: 29 August 2019 / Published: 4 September 2019
(This article belongs to the Special Issue Advanced Electronic Noses and Chemical Detection Systems)

Abstract

:
Glucose, fructose and sucrose are sugars with known physiological effects, and their consumption has impact on the human health, also having an important effect on food sensory attributes. The analytical methods routinely used for identification and quantification of sugars in foods, like liquid chromatography and visible spectrophotometry have several disadvantages, like longer analysis times, high consumption of chemicals and the need for pretreatments of samples. To overcome these drawbacks, in this work, a potentiometric electronic tongue built with two identical multi-sensor systems of 20 cross-selectivity polymeric sensors, coupled with multivariate calibration with feature selection (a simulated annealing algorithm) was applied to quantify glucose, fructose and sucrose, and the total content of sugars as well. Standard solutions of ternary mixtures of the three sugars were used for multivariate calibration purposes, according to an orthogonal experimental design (multilevel fractional factorial design) with or without ionic background (KCl solution). The quantitative models’ predictive performance was evaluated by cross-validation with K-folds (internal validation) using selected data for training (selected with the K-means algorithm) and by external validation using test data. Overall, satisfactory predictive quantifications were achieved for all sugars and total sugar content based on subsets comprising 16 or 17 sensors. The test data allowed us to compare models’ predictions values and the respective sugar experimental values, showing slopes varying between 0.95 and 1.03, intercept values statistically equal to zero (p-value ≥ 0.05) and determination coefficients equal to or greater than 0.986. No significant differences were found between the predictive performances for the quantification of sugars using synthetic solutions with or without KCl (1 mol L−1), although the adjustment of the ionic background allowed a better homogenization of the solution’s matrix and probably contributed to an enhanced confidence in the analytical work across all of the calibration working range.

1. Introduction

The quantification of glucose, fructose and sucrose in foods allows evaluating health indices, like the glycemic load, the intolerance ratio due to free fructose and total fructose content (considering that a sucrose molecule can generate one molecule of glucose and fructose each) [1,2]. These indices can provide a better understanding of the relationship between the physiological effects of foods rich in carbohydrates and human health [1]. For instance, rich diets in fructose may induce obesity, diabetes, dyslipidemia and insulin resistance, [3] but these effects can be minimized by the simultaneous ingestion of glucose in an equal or higher proportion [4]. The glycemic index is a measure of how quickly there is an increase in blood sugar (glucose) after eating a food or a specific product. The determination of the fructose intolerance index (FI) is of major relevance for people suffering from fructose malabsorption. Indeed, only foods with a ratio of glucose to fructose (concentrations in g/L) greater than one are tolerable for people sensitive to fructose [4].
On the other hand, the knowledge of the concentrations of the main sugars in foods enables evaluation of their sensory impact. Indeed, sugars can enhance human perception of some flavors, and the sweet taste is associated with the relative proportion of individual monosaccharides and the ratio between sucrose content to the total sugar content [2,5]. The sweetness perception is directly related to the total sugar content and may be quantified through the sweetness index concept. The impact of the content of each individual sugar on the overall sweetness perception can be measured by assessing the ration between the concentration of each sugar in the sample and its respective sensory detection threshold (dose-over-threshold, DOT) in water, which can be obtained in the literature. By definition, DOT values greater than 1 indicate a significant influence on the overall food taste [6].
Moreover, the analytical information is also used in quality and authenticity control of the food, to ensure that consumers are not victims of fraud. The determination of total sugars and reducing sugars is usually done through instrumental methods capable of providing the total sugar content or the specific concentration of carbohydrates, such as gas chromatography (GC), high-performance liquid chromatography (HPLC), enzyme analysis and electrochemical or spectroscopic methods [7,8]. However, most of these methods have various disadvantages, such as slowness of the analysis, high chemical reagent consumption and the need for sample pre-treatments, typically by destructive methods. These factors, combined with the growing appeal of green analytical chemistry, drive the development of new analytical methodologies for the reliable quantification of sugars in food [9], giving relevance to rapid, simple and low-cost analytical techniques [10]. In this context, electronic tongues are alternative analytical tools, consisting of sensor arrays with low-selective and nonspecific sensors coupled with chemometric techniques for signal processing. The cross-sensitivity is the typical ability of a low-selective sensor to respond reproducibly to a number of different analytes in solution [11]. The most common electronic tongue design is a sensor array composed of a selective lipid/polymer membrane, chalcogenide glass and porphyrin derivatives or conducting polymer using varying signal transduction (electrochemical, spectroscopic, or gravimetric), that allows the discrimination of taste standard substances [12]. New architectures of electronic tongues using cross-reactive receptors can be found; for example: An artificial taste sensor based on conducting polymers using a combination of both supra-molecular thin films of conducting polymers with a lipid-like material and impedance spectroscopy [13]; a sensor array based on fluorescence response sensing of proteins by using different functionalized poly(p-phenyleneethynylene)s, highly fluorescent polymers, which possess various charge characteristics and molecular scales [14]; an electronic tongue based on molecularly imprinted polymers (highly crosslinked polymer matrices formed with a shaped cavity and a functional group complementary to the target analyte molecules) giving a unique pattern using several transduction platforms, from spectroscopic to electrochemical [15]; an electronic tongue by coupling surface plasmon resonance imaging with an array of non-specific and cross-reactive receptors, by mixing in different proportions two hydrophilic compounds, disulfide with lactose (neutral) and sulfated lactose (highly negatively charged), for food analysis [16].
Often, electronic tongue (E-tongue) devices allow the discrimination of the five basic tastes (acid, sweet, bitter, salty and umami) [17], showing sensitivity to the presence of sugars, which is corroborated by some studies on the application of E-tongues for the simultaneous analysis of several sugars. A potentiometric E-tongue with 15 sensors was applied for sugar (glucose, fructose and sucrose) analysis in tomato samples, whose performance was checked by comparing the results with the contents found with HPLC [18], showing that the E-tongue had low sensitivities towards sugars’ determinations. In a later study, the same researchers [19] showed that an E-tongue with 18 sensors could be used to predict, satisfactorily, the concentration of glucose and fructose in tomato cultivars, using an enzymatic reference method and partial least square (PLS) regression (prediction performance of the model tested by cross-validation). Dias et al. [20] analyzed soft drinks (non-alcoholic beverages) with an E-tongue with 36 cross-sensibility lipo/polymeric membranes, showing that it was possible to satisfactorily predict the concentrations of glucose and fructose using multiple linear regression (MLR) and PLS calibration models, based on the potentiometric signal profiles generated by 16 selected polymeric membranes, using HPLC analysis as the reference method (prediction performance of the model tested by cross-validation). Voltammetric E-tongues have also been used in the analysis of sugars. Cardoso de Sa et al. [21] evaluated the concentrations of glucose, xylose, galactose and mannose in sugarcane using a voltammetric E-tongue with five carbon electrodes, modified with multi-walled carbon nanotubes, containing metal oxy-hydroxide nanoparticles. For that, an artificial neural network (ANN) calibration model was established and its prediction performance tested using a test data group. Wei and Wang [22] used a voltammetric E-tongue with six metal working electrodes, with multi-frequency large amplitude pulse voltammetry (MLAPV), for assessing the sugar contents in pears from 5 cultivars from different geographical origins. Three regression models (principal component regression; partial least squares; and least squares support vector machine) were evaluated by comparing the E-tongue predicted contents (test data group), and those obtained using a refractometer. More recently, a novel bio-E-tongue system, using different cellobiose dehydrogenases, coupled with ANN, was used to resolve mixtures of sugars (glucose and lactose) and interfering analytes (Ca2+) with an overall satisfactory performance (0.852, 0.987 and 0.972, respectively) [23].
In summary, these studies show that E-tongues are an accurate and practical analytical tool for the analysis of sugars. In this context, the present study aimed to evaluate the capability of a potentiometric E-tongue, with lipidic polymeric membrane sensors, to simultaneously quantify three sugars (glucose, fructose and sucrose) present in standard solutions. The purpose was to ensure that this methodology, in a direct analysis of samples with high concentration variability and matrix composition, would allow us to obtain acceptable analytical results.

2. Materials and Methods

2.1. Reagents

All solutions were prepared with deionized water (type II) and the analytical reagents used in the preparation of the standard solutions had pro analysis quality. Sucrose and potassium chloride were from Panreac (Barcelona, Spain), while the other compounds were from Fluka (Steinheim, Germany): Glucose, fructose, octadecylamine, oleyl alcohol, oleic acid and methyltrioctylammonium chloride, bis(1-butylpentyl) adipate, dibutyl sebacate, 2-nitrophenyl-octyl ether, tris(2-ethylhexyl) phosphate, bis(2-ethylhexyl) phthalate and high molecular weight polyvinyl chloride (PVC). The tetrahydrofuran solvent was from Sigma-Aldrich (St. Louis, MO, USA).

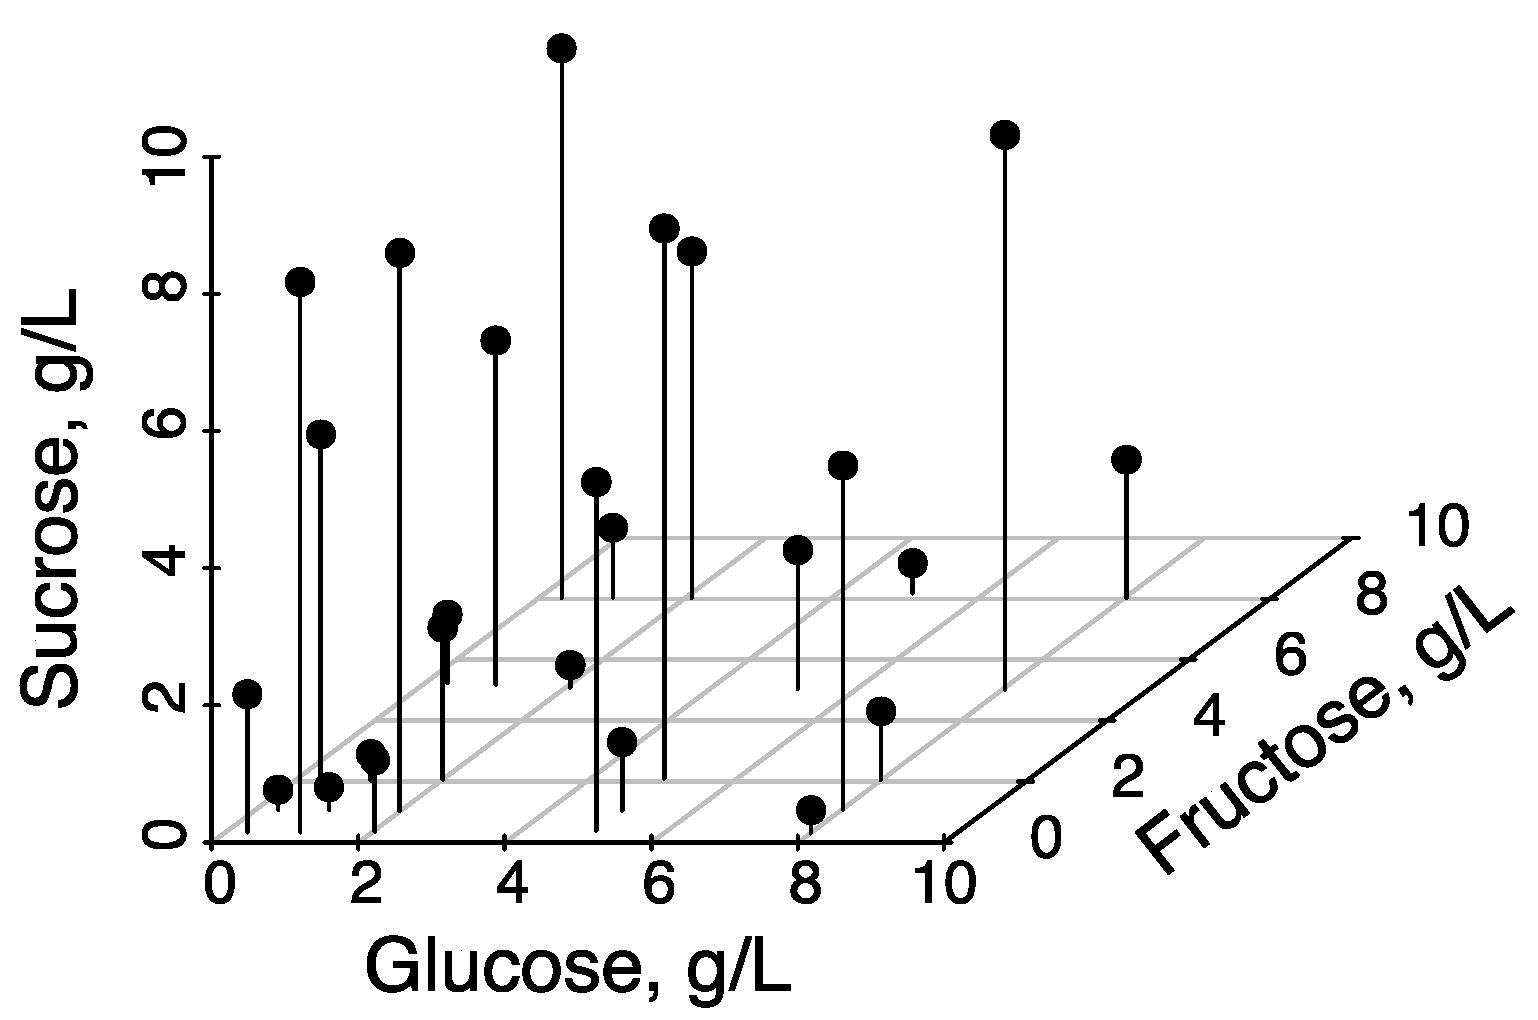
2.2. Standard Solutions
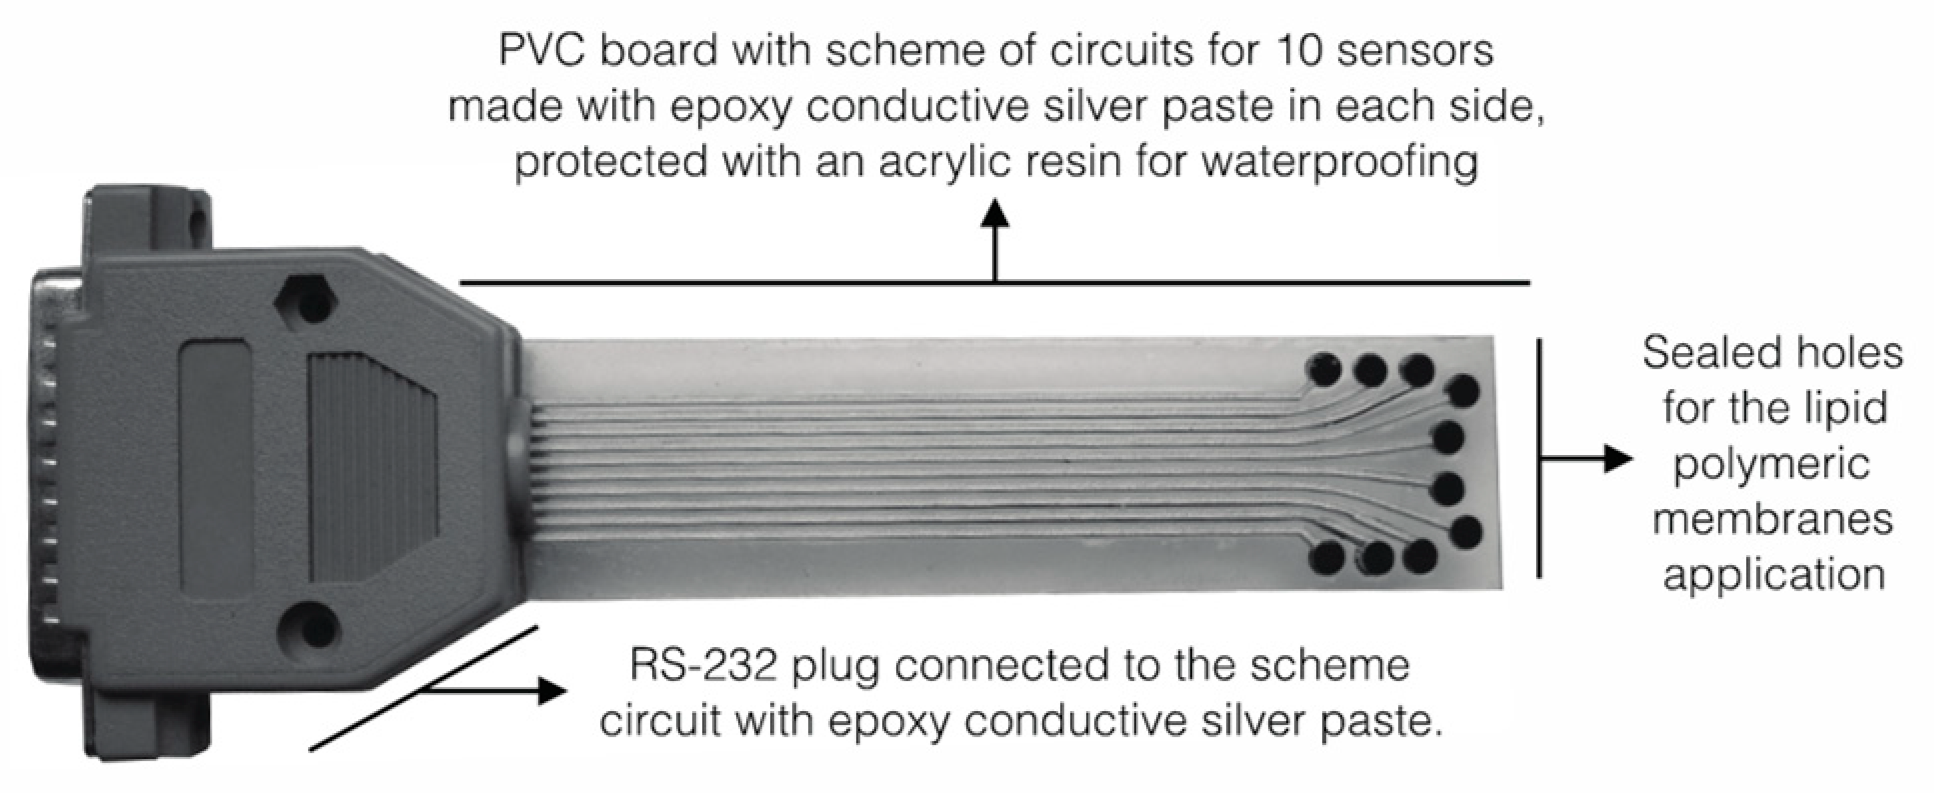
Calibration multivariate models were obtained for the quantification of each sugar concentration using the potentiometric E-tongue signal profiles. For this purpose, standard solutions were prepared by weighting pre-established masses of each sugar following an orthogonal experimental design (a fractional factorial design) [24]. The experimental design used 25 experimental points corresponding to 25 standard solutions of the 3 sugars at 5 concentration levels for each sugar (0.3, 1, 2, 5 and 8 g/L). The individual sugar concentrations were within the dynamic range of concentration of a HPLC method validated in a previous work for soft drinks analysis [20].
The standard solutions were prepared by weighing (analytical balance model AAA 160L, Adam Equipment Co., Ltd., Oxford, CT, USA) the masses of the sugars directly to 100 mL volumetric flasks, the volume being subsequently adjusted with deionized water. In experiments for evaluating the possible effect of the ionic background, 50 mL of a KCl aqueous solution were added to all standard sugar solutions (to set an ionic background of 1 mol L−1), before adjusting the final volume. Table 1 shows the orthogonal experimental design used and the intended sugar concentrations of the standard solutions. The same procedure was used to prepare standard solutions of the 3 sugars with the above-mentioned ionic background.

2.3. Sensor Array

Each sensor array was applied on both sides of a PVC semi-flexible transparent board with 1.5 mm thickness. On each side, a scheme of circuits for 10 sensors was printed by screen-print technique using epoxy conductive silver mixture (EPO-TEK E4110 Kit, Epoxy Technology Inc., Billerica, MA, USA). After drying at 40 °C for 8 h (overnight) and circuit cleaning, an acrylic resin (PLASTIK 70, Kontakt Chemie, Segovia, Spain) was sprayed, in several layers, for coating and waterproofing the printed circuit, after sealing the holes for the chemical sensors’ application (lower end); at the opposite end of the holes, connection was made to a RS-232 plug. The system was tested with a millivoltameter to verify the integrity of the circuits and the absence of overlapping contacts. Finally, the board was connected to a 25-pin RS-232 plug, allowing the subsequent connection to a Data Logger. The schematic illustration of the assembly of the sensor array was described previously in [25], showing in Figure 1, a more simplified scheme. Finally, after removing the protective seals, the lipid polymer membranes were applied to the holes.

2.4. Chemical Sensors

The chemical sensors were cross-sensitivity lipidic polymeric membranes prepared from different combinations of plasticizers (65%) and chemical additives (3%), using PVC (32%) as the polymer basis. The additives were: Octadecylamine, oleyl alcohol, oleic acid and methyltrioctylammonium chloride. The plasticizers were: Bis(1-butylpentyl) adipate, dibutyl sebacate, 2-nitrophenyl-octyl ether, Tris(2-ethylhexyl) phosphate and Bis(2-ethylhexyl) phthalate. Those compounds were selected because of their satisfactory quantitative response towards sugars in soft drinks [20]. The selected lipid polymeric membranes promote different interactions with substances via electrostatic or hydrophobic interactions [26], due to the different compositions of the polymer membranes. Indeed, the lipid additive substances used had different properties depending on the solution pH, showing hydrophobic and hydrophilic interactions towards the target molecules; and, the plasticizers increase the solute absorption by softening the PVC membrane, and contribute to the interaction mechanisms through the polar and non-polar components. Each sensor was prepared by weighting the masses of the three components, which were and dissolved in tetrahydrofuran, to obtain a homogeneous viscous solution. The polymeric membranes were formed on the sensor array using the drop-by-drop technique, wherein successive drop additions of the solution (volumes of 18 μL) were made directly on the points of contact of the sensor array, at 3–5 min intervals for complete evaporation of the solvent, allowing the formation of a crystalline polymer membrane. Table 2 shows the codes assigned to each polymeric membranes of the sensor array.

2.5. Potentiometric Multi-Sensor Device

The E-tongue consisted of two identical sensor arrays with the same 20 sensors comprising it (Table 2), and a reference electrode Ag/AgCl, with a double junction (Metrohm, reference 6.0726.100). The potentiometric device was connected to a data acquisition system, a Data Logger (Agilent 34970, Santa Rosa, CA, USA), which allowed recording the signal profile of each sensor via a PC, using the Agilent BenchLink Data Logger 3 software (version 3.0.4, Agilent Technologies, Santa Rosa, CA, USA).
All readings were made after inserting the sensor array, together with the reference electrode, in the sugar standard aqueous solutions, which were previously stirred with a magnetic stir-bar (VELP Scientifica ARE, magnetic stirrer), for 5 min at room temperature. Between determinations (within a period of 1–2 min), the analytical system was flushed thoroughly with deionized water, lightly dried with absorbent paper, inserted into a new solution for analysis, and, after those procedures, the data from the previous analysis was saved. All solutions were measured twice to ensure that the signal profile obtained was correct. Between inter-day analysis, the multi-sensor system was inserted in an HCl solution (0.1 mol/L).

2.6. Statistical Analysis

The experimental potentiometric data collected with the E-tongue were statistically analyzed using the statistics program R, version 3.2.0 (The R Foundation for Statistical Computing, Vienna, Austria), a free software environment for statistical computing and graphics [27]. The R statistical packages Subselect [28,29], ggplot2 [30], MASS [31] and prospectr [32] were used.
The work aimed to establish a data processing procedure to quantify each sugar concentration in standard sugar solutions (mixture of 3 sugars) using the potentiometric signals of low selectivity and cross-sensitivity sensors using multiple linear regression (MLR) models.
First, an exploratory analysis of the data set was carried out by the construction of the boxplot (extremes and quartiles) graphs, to verify if sensor variability in responses could pose great weight in the construction of regression models.
Then, to obtain and test the quantification models, the following steps were performed:
The potentiometric signals were centered and scaled to minimize the possible effects of magnitude differences in signal strength (by subtracting the mean and dividing by the standard deviation of the variable, resulting in a variable with mean of 0 and a standard deviation of 1).
The standard solutions were split into training group, for MLR model building, and test group (independent external evaluation set), considered as unknown samples for testing externally, the predictive performance of the obtained model. This division was carried out by the K-means sampling algorithm [33,34], where a K-means clustering was applied on the number of principal components that were allowed to explain 99% of the data variance; and after choosing the number of clusters (equal to the number of desired calibration solutions), one sample from each cluster was selected (sample closest to the cluster centers). The overall data set was divided into a modeling set (80% of the overall set) and an external evaluation set (20% of the overall set).
To establish the best MLR model for sugar quantification, the most relevant sub-set of low selectivity and cross-sensitivity sensors was selected. For this purpose, the meta-heuristic simulated annealing (SA) algorithm was applied for sensory features [28,35]. This algorithm allows one to find a good solution (within several possible good solutions present in the data) to an optimization problem, but not necessarily the global optimum. The basis of the algorithm is related to the annealing physical process, which exploits the best conditions for a heated solid to gradually cool and freeze, leading to a crystalline structure with the minimum energy (the annealing process), since the structural properties of the solid depend on the rate of cooling. The algorithm simulates this cooling process by gradually lowering the “temperature” that allows one to improve a fitting criterion of the system until it converges to a frozen state (steady state or good solution). Moreover, it introduces a random search which accepts changes that decrease the fitting criterion (assuming a minimization problem), and also changes that increase it, allowing to escape from a local minimum with a good solution, when a better solution is nearby. In the present work, the changes in “temperature” are related to changes in the sub-set of sensors and the fitting criteria is tau2 (measures of goodness fitting corresponding to the standard coefficient of determination in a univariate MLR, implicating a maximization problem) that represents the adjustment between the concentrations of a sugar and the signals of a sub-set of sensors, using the MLR function. The algorithm was applied to select the best sub-set of sensors in the range of 2 to 20 sensors, through 10,000 attempts, to further select the model with the lowest number of sensors, which could possibly avoid the effects of over-adjustment, and improve prediction models.
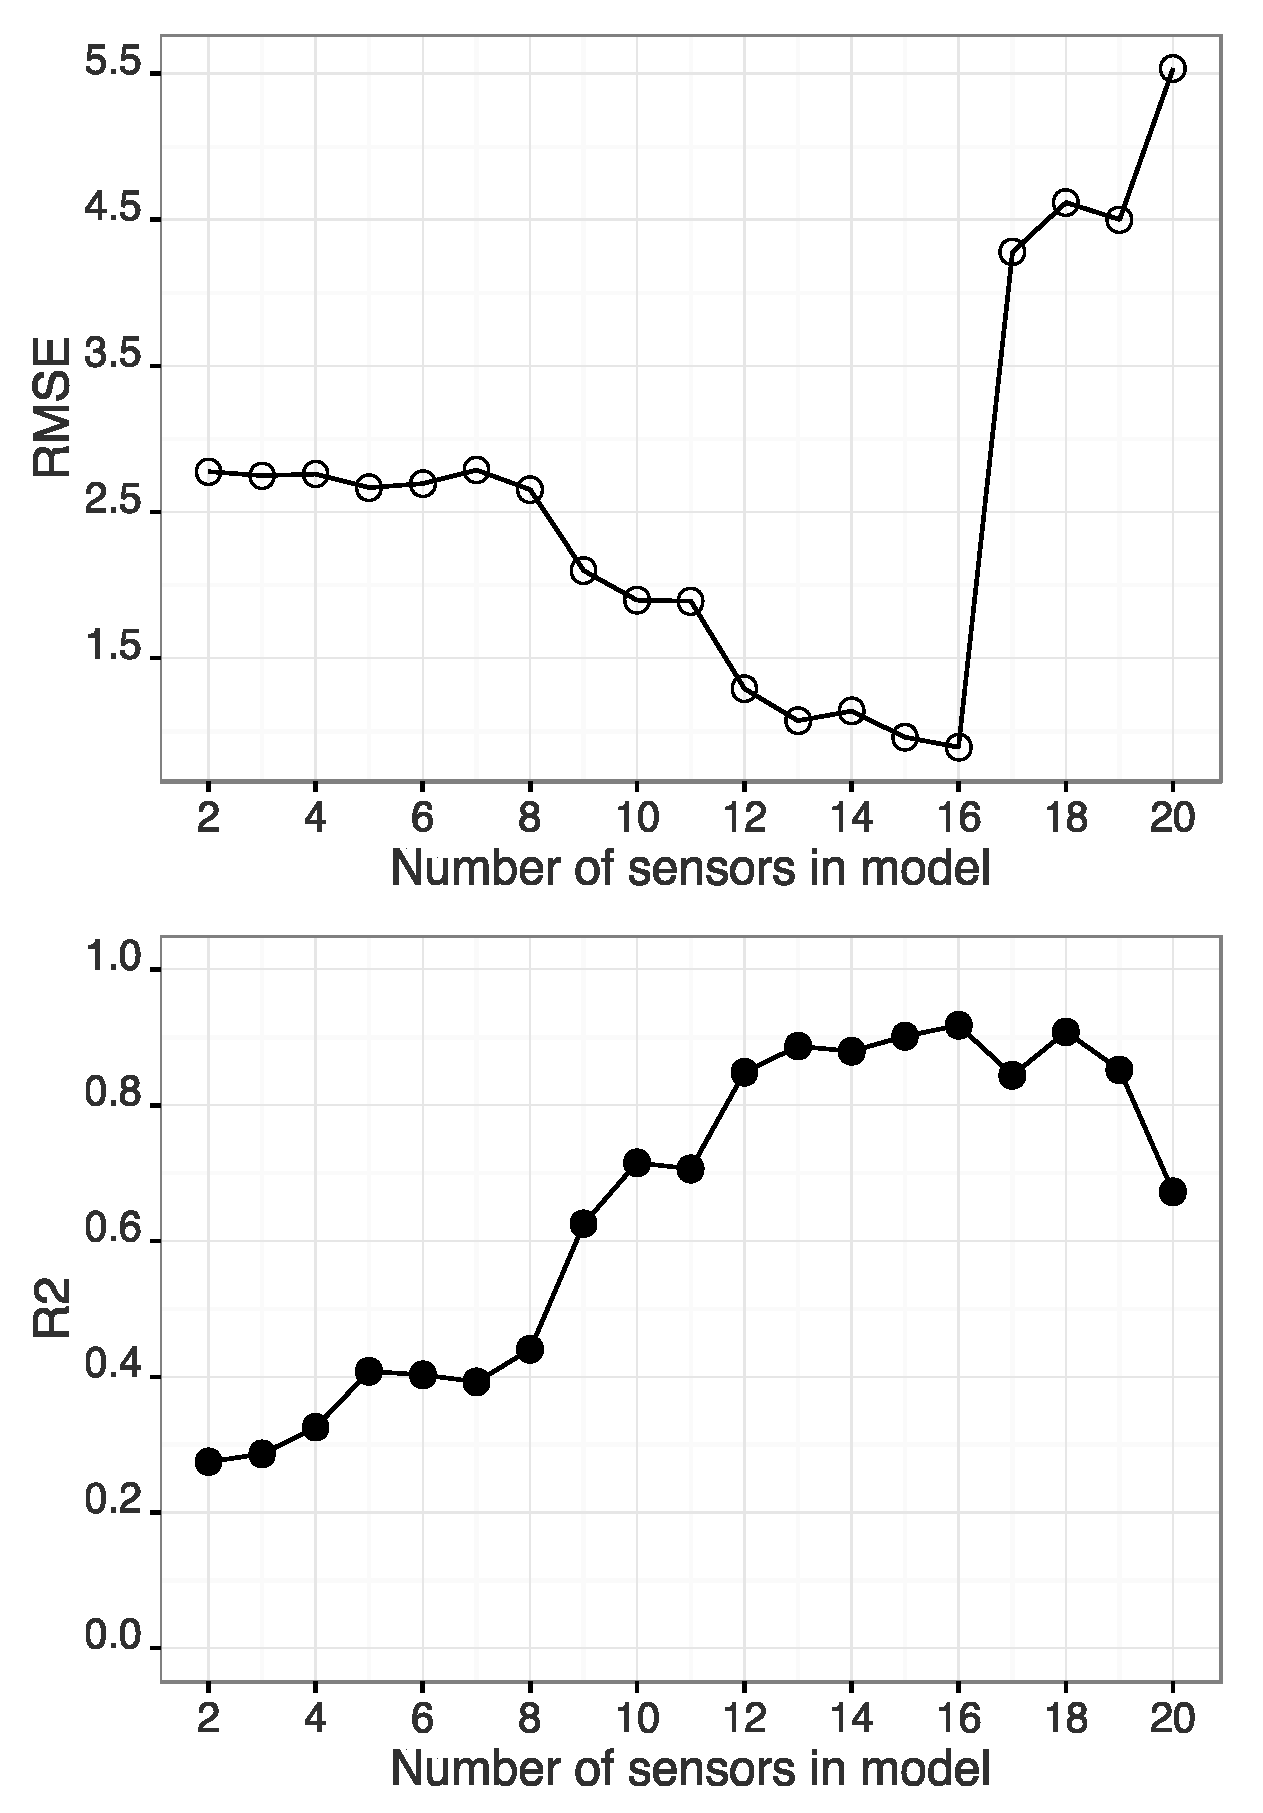
  • To test the predictive capacity of the MLR-SA models, the K-fold cross-validation with repetitive (K = 5-fold with n = 10 repetitions) technique was used to evaluate the predictive ability of the analytical data [36]. The 5-fold implies a random split of 20% of the training data into each fold. The K-fold cross-validation allows one to obtain information about how well a model generalizes to new data by internal validation. The procedure involves randomly dividing the data into K sub-sets and using each sub-set for internal group cross-validation by the model obtained by using the respective K-1 sub-sets as the training group. Considering that this procedure gives results for 5 model attempts, and if n = 10 repetitions are employed, this validation method is repeated 10 times. That provides results from 50 model attempts. To evaluate the overall results, the average of root mean square error (RMSE) and determination coefficient (R2), with the respective errors, were considered for each sub-set of sensors. The best sub-set was selected considering the RMSE and R2 values variation with the number of sensors in the sub-sets. The selected sensors sub-set was further evaluated considering only the results from the best MLR model obtained with K-fold cross-validation, using the RMSE and R2. With this procedure, it is expected to have produced a good fit model to the calibration data that should be tested if it presents satisfactory performance in the prediction of sugars’ concentrations in data sets that were not present in the calibration.
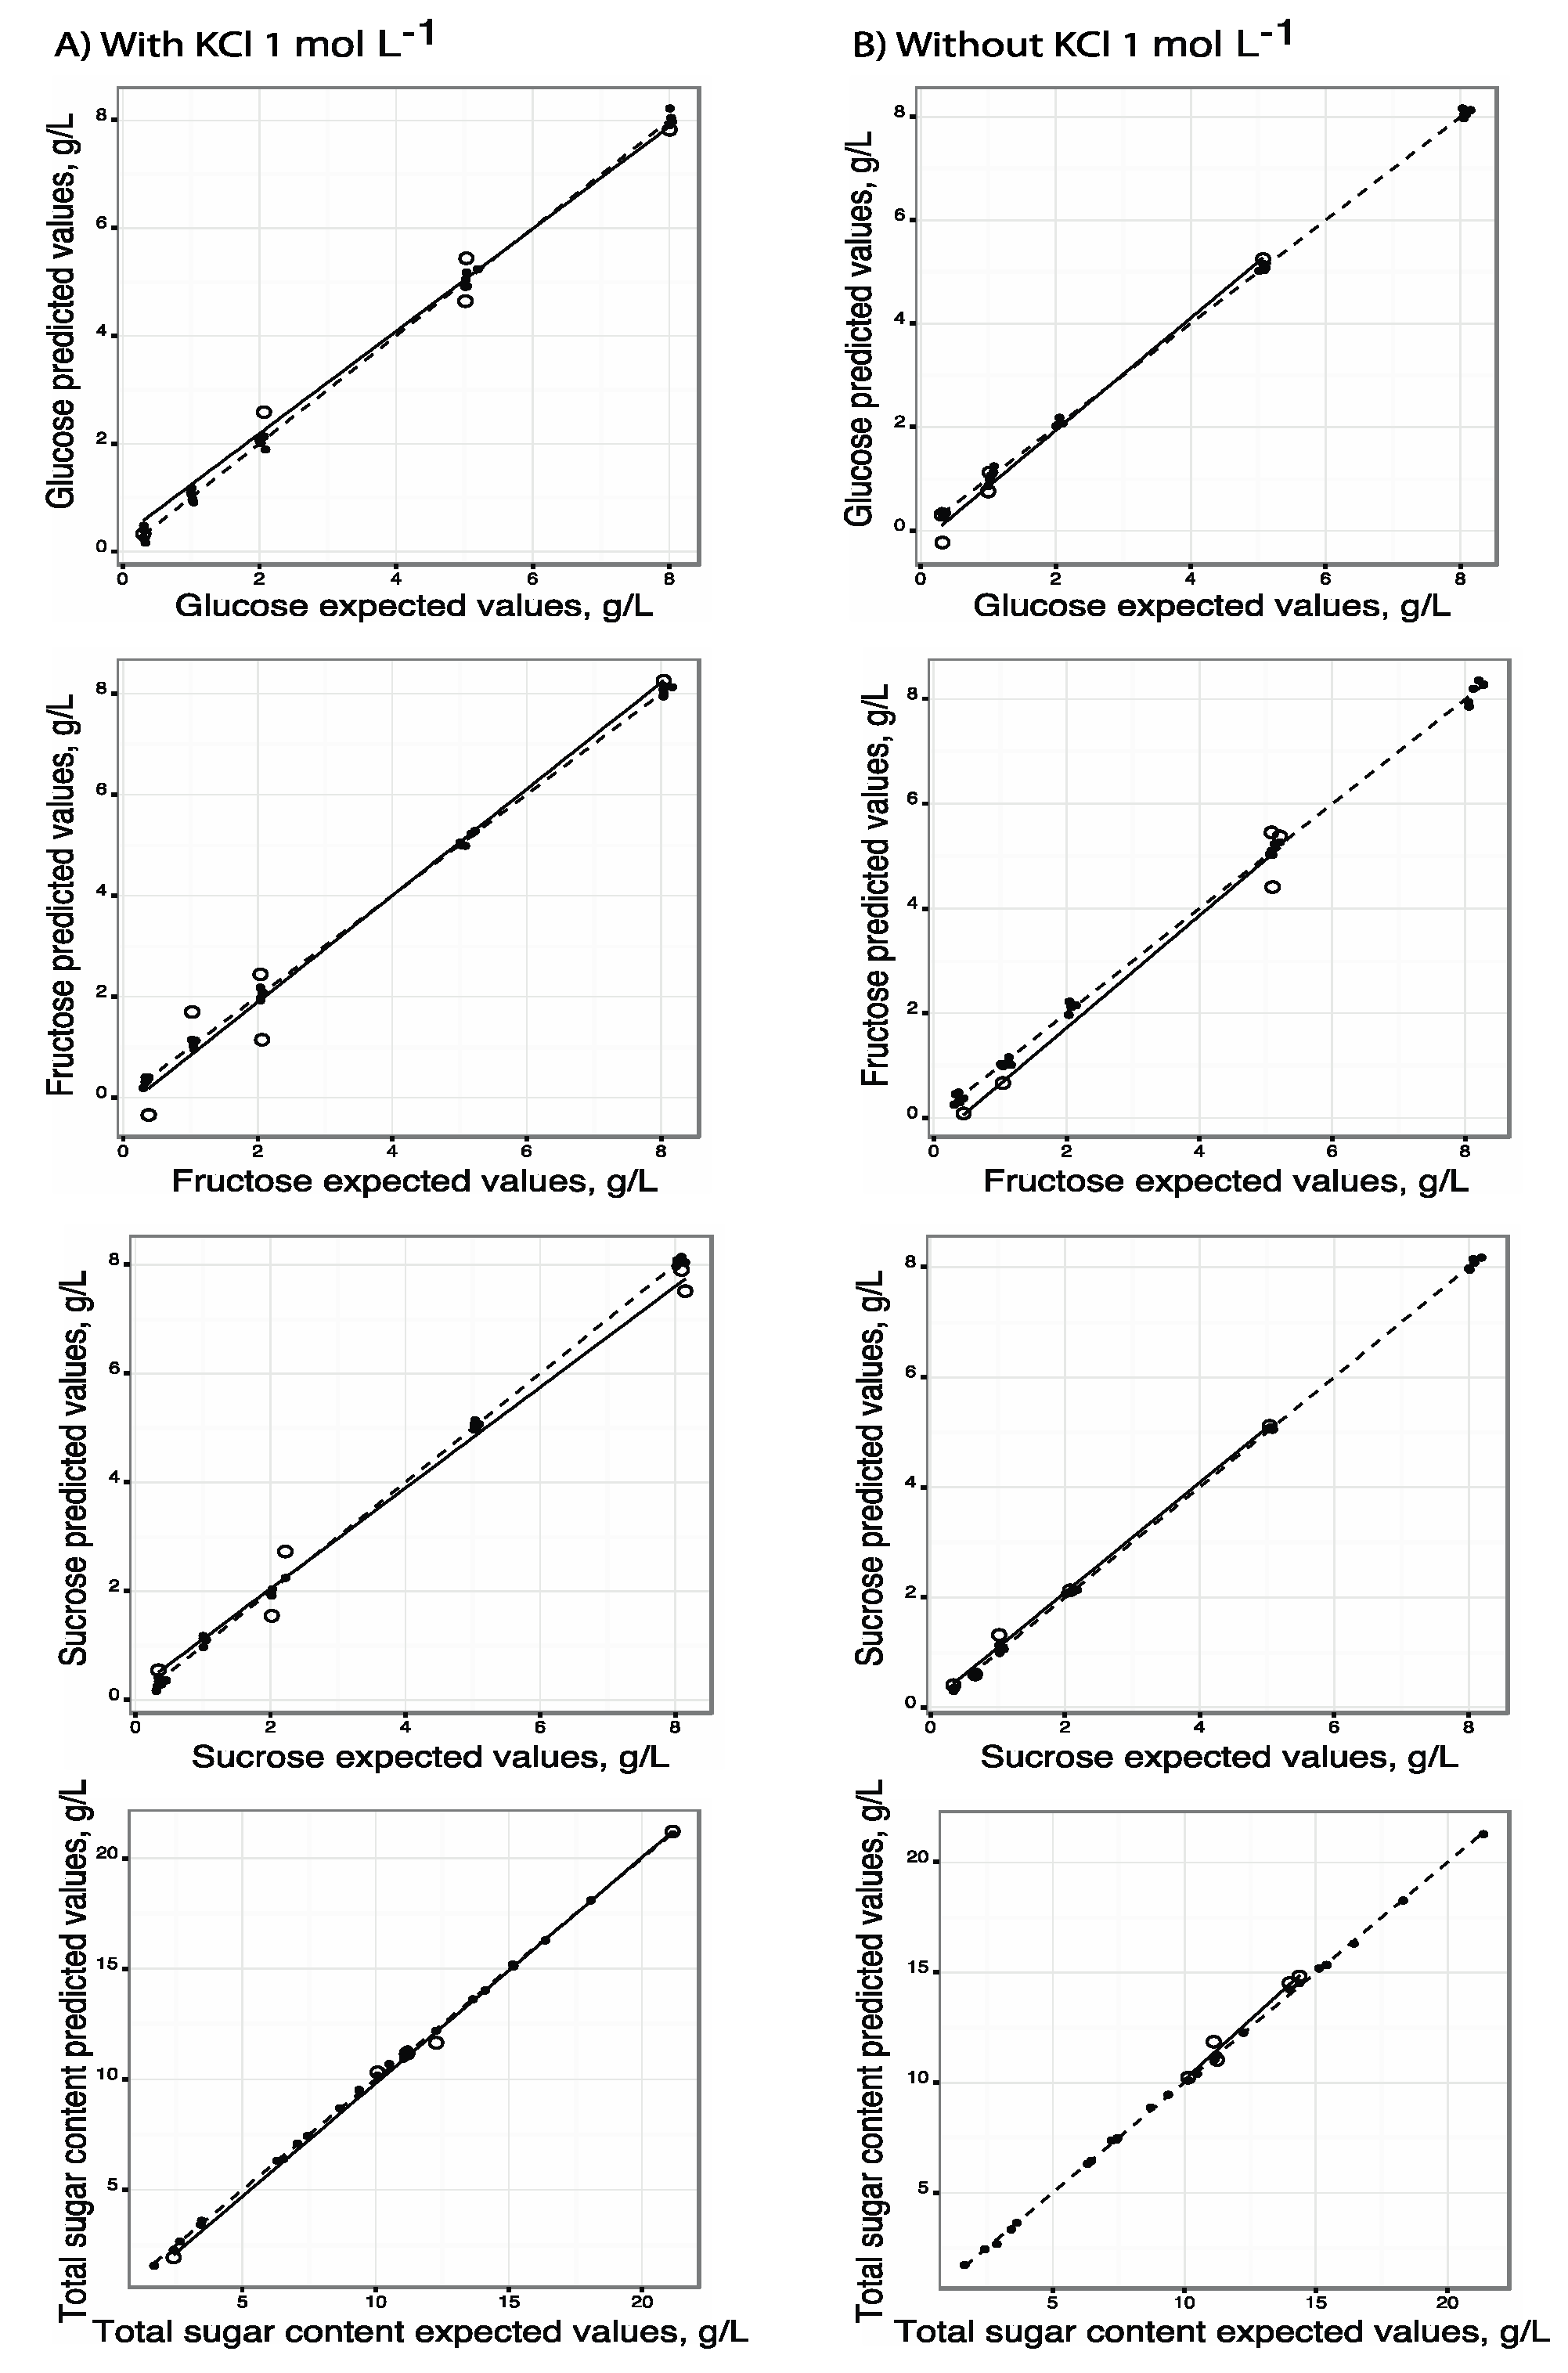
  • To evaluate the E-tongue capability to determine the concentration of a sugar, a simple linear regression model was established between the predicted concentration values by the final MLR model and the expected concentrations, both for the training group (model’s estimation capability) and the test group (external validation to evaluate model’s prediction capability). The results were considered satisfactory if the single linear regression parameters were close to the theoretical values: RMSE—0, slope group—1, the intercept—0 and the adjusted determination coefficient—1. Moreover, the confidence interval at 95% of the slope and intercept can be used to confirm that statistically they could be regarded as the theoretic values of “one” and “zero”, respectively [37,38].

3. Results and Discussion

3.1. Standard Solutions’ Correlation Coefficients

Standard solutions of three sugars (glucose, fructose and sucrose) were prepared by weighting, at five concentration levels (approximately to 0.3, 1, 2, 5 and 8 g/L). The experimental design selected (fractional factorial design) for this work also allowed quantifying the content of total sugar, which ranged between 1.6 and 21 g/L. Figure 2 represents, graphically, the orthogonal experimental design for the 25 ternary sugar solutions, at the five different concentration levels. As expected, the concentrations of the three sugars showed orthogonality between them, since the linear correlation coefficients were lower than 0.02. Also, the linear correlations between the concentrations of each sugar and total sugar content were weak, with correlation coefficients of 0.58 or 0.60, guaranteeing the independence to the other variables in its quantification study.

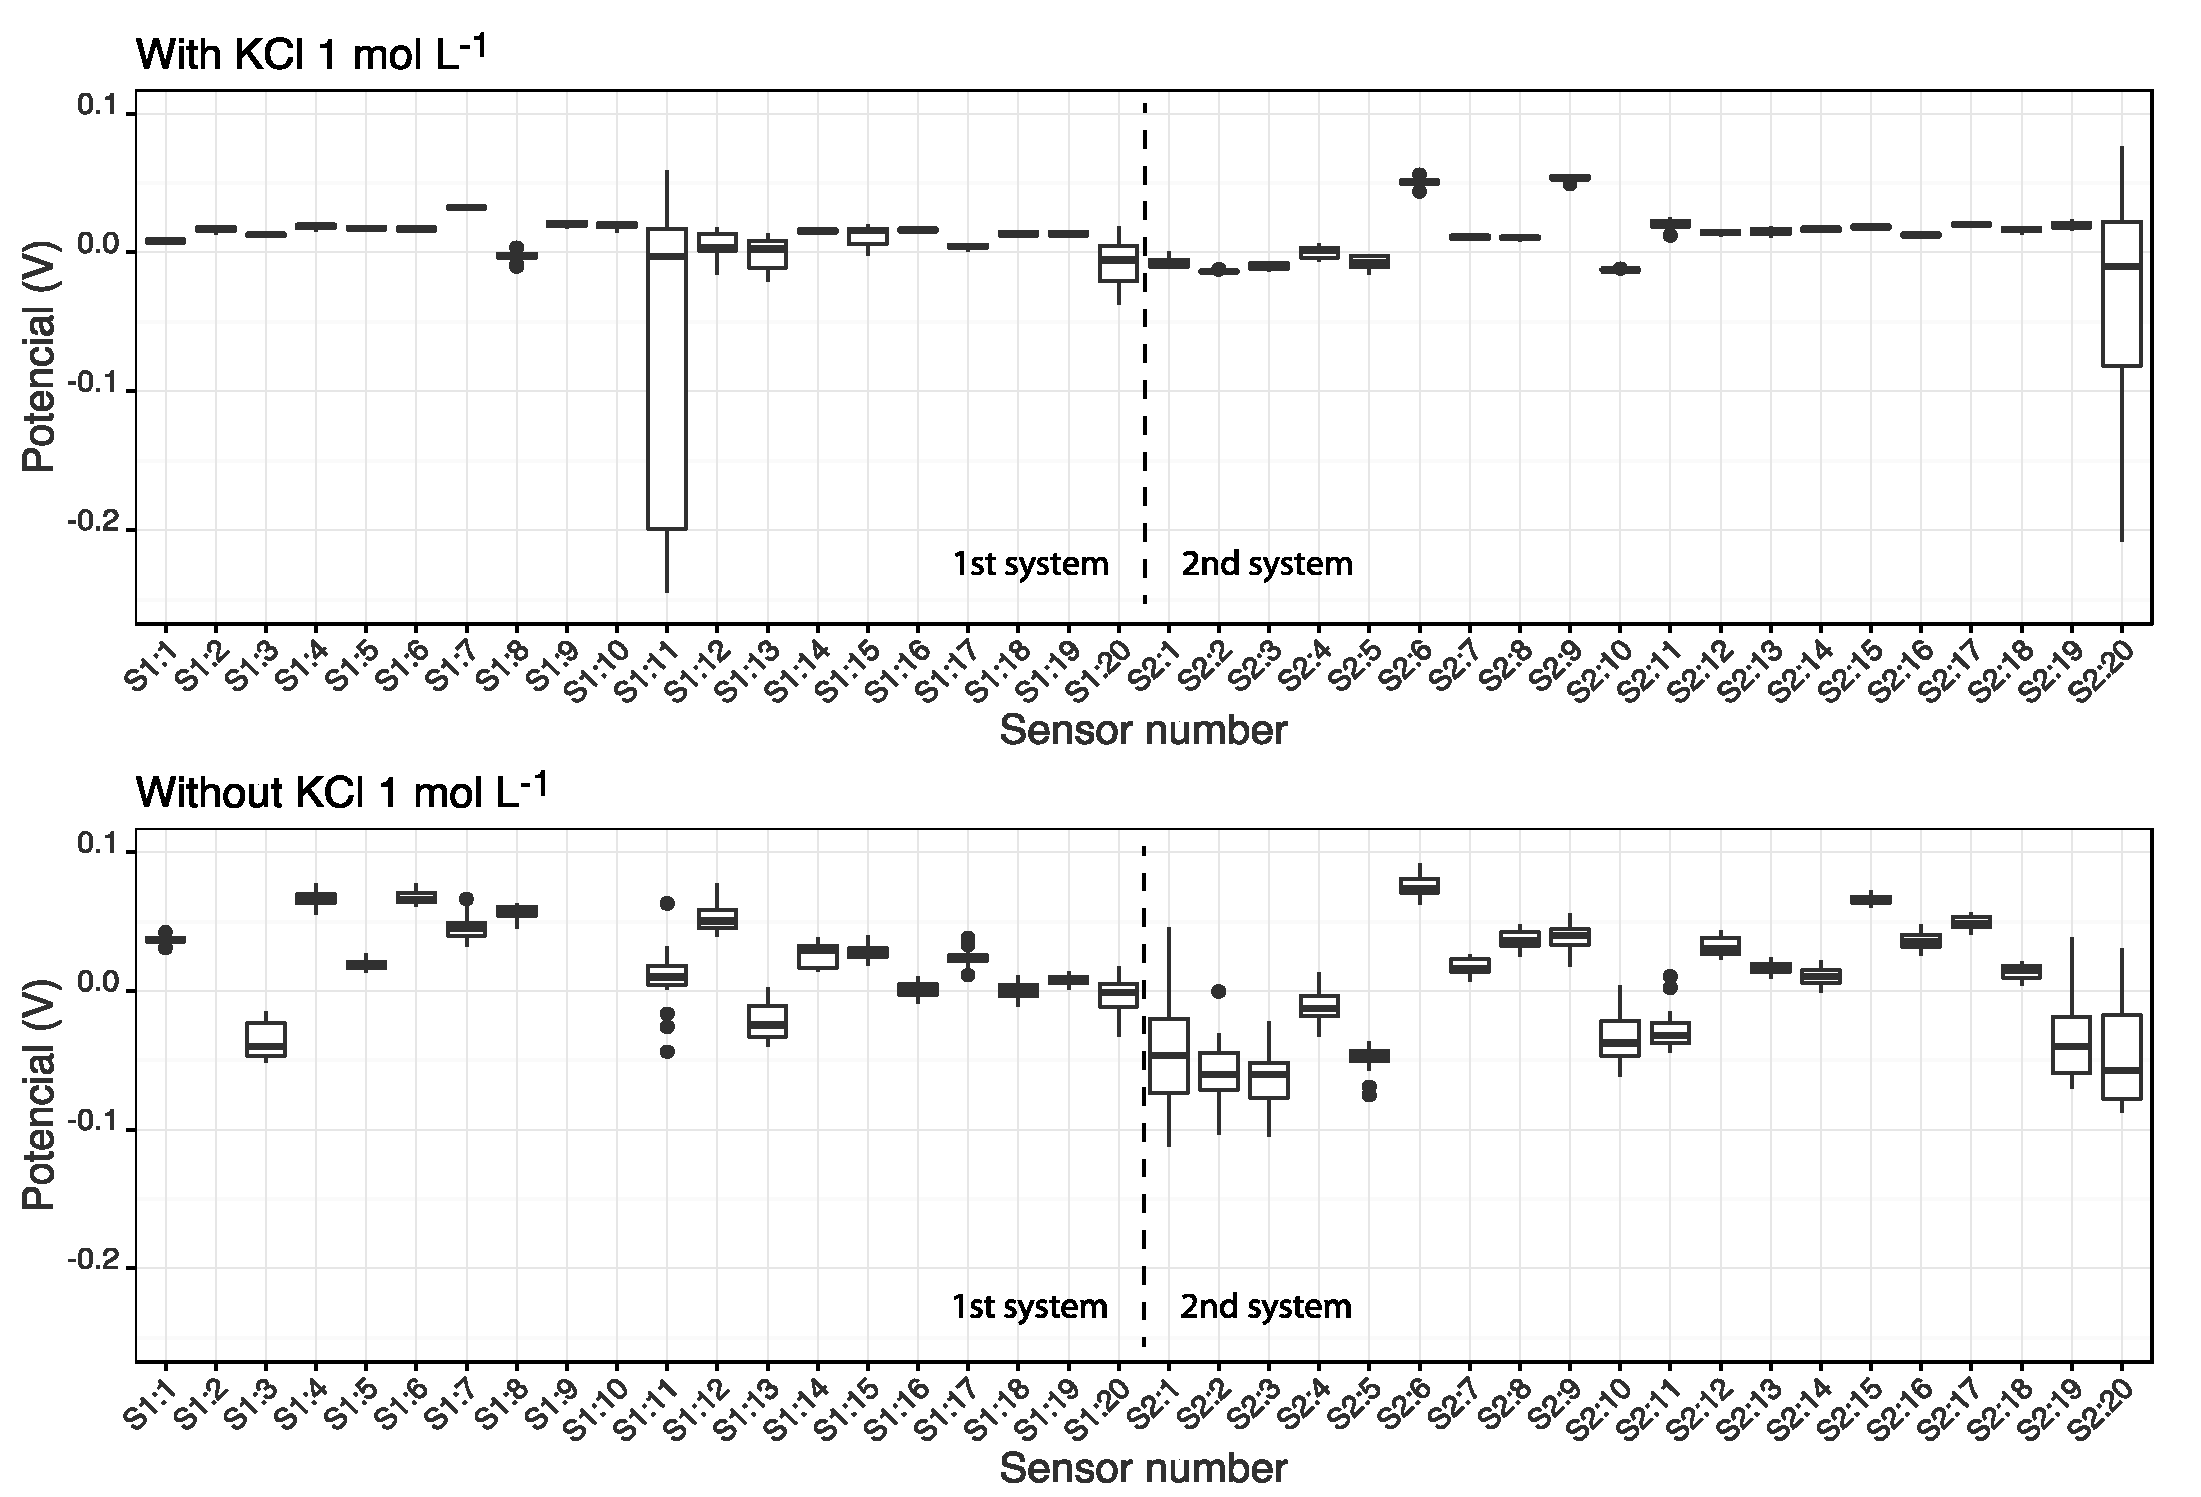
3.2. Analysis with the E-Tongue

An E-tongue with two duplicate sensor arrays (identified as S1: and S2:), with cross-sensitivity sensors, was used to quantify, simultaneously, glucose, fructose and sucrose in standard mixed solutions containing the three sugars, and the total sugar content as well. Overall, the lipid polymeric membranes on the sensor arrays showed satisfactory signal stability over time in the analysis (during 5 min of signal record), with relative standard deviations (%RSD) lower than 3.5%, and repeatability with %RSD values between 0.5% and 12%. Moreover, assays concerning signals’ time stabilities during a 3-h continuous sample analysis showed that the maximum percentage signal variation, between the initial signal (after the 5 min of signal stabilization) and that recorded after 3 h, was lower than 4.8%, corresponding to a potential variation of 4 mV. These overall results confirmed that the signal drift was not significant in intra-day analyzes. The E-tongue sensitivity to the three sugars may be related to the nature (e.g., functional groups) of the plasticizer/additive present in each polymeric membrane of the sensor array; the full mechanism behind this potentiometric behavior of lipid/polymer membranes is not well known [39]. The lipid polymeric membranes used contain hydrophobic and hydrophilic groups, allowing interactions with electrolytes and nonelectrolyte chemical compounds via hydrophobic or electrostatic interactions [26,39,40], with hydrogen bonding being possible as well [41]. For example, the sugars’ detection could be attributed to the establishment of possible electrostatic interactions between hydroxyl groups of sugars’ molecules and the functional groups (e.g., between carboxyl or phosphate groups) by means of hydrogen bonds.
The measurement of each standard solution provided 40 potentiometric signals (duplicate sensors: S1:1–S1:20 and S2:1–S2:20). Figure 3 shows the box plots for the potentiometric signals (potential, V) of each sensor for both arrays, for the measurement of the all standard solutions with and without KCl 1 mol L−1.
As shown in Figure 3, the signal intensities are different between the two arrays (S1: and S2:), but more markedly for the analyses of standard solutions without KCl. Those differences can be attributed to slight differences in the lipid polymeric membranes’ formations, which may occur by using the drop-by drop technique, due to variations in the membrane mixture solutions’ viscosity and its solvent’s evaporation temperature, contributing to changes in the physical properties of the membrane (e.g., membrane thickness, transparency degree and porosity). The presence of KCl (1 mol L−1) in the standard solutions was to homogenize the matrix solution, minimizing possible noise effects due to the different sugar levels. In those solutions, the signals had an average amplitude of 0.0093 V (ranging from 0.0017 to 0.057 V), without considering the sensors S1:11 and S2:20, which presents a high signal variability. As can be seen in Figure 3, fixing the ionic background (KCl 1 mol L−1) affects the signals profile, since its variability decreased considerably when compared with those obtained for the standard solutions without KCl, whose signals’ variability were higher (average amplitude of 0.043 V, ranging between 0.0070 and 0.24 V). As the data logger was configured to use six digit (resolution at μV) slow mode for further noise reduction, even in the small signal variations obtained for standard solutions with KCL 1 mol L−1 were expected to have relevant analytical information. However, the sensors showing greater variability in response may have greater influence in the MLR models for quantification of sugars. To avoid this, sensor signals were centered and scaled. Moreover, the signal profile of each standard solution was comprised of 40 potentiometric signals, where some may have redundant information, and therefore, reduce the predictive capability of the calibration models established for sugar quantification. This reinforces the idea that the selection of variables (sensors, in this case) is an important task in multivariate modeling, not only to reduce the number of variables required, but also to prevent the use of variables that do not contain relevant information. Both plots in Figure 3 also show the presence of extremes in some sensors, but they are considered casual analytical results, because there was no trend in signals from other sensors in the analysis of the same standard solution, justifying keeping the solution in the data matrix.

3.3. Multiple Linear Regression Coupled to Sensor Sub-Set Selection

To quantify the individual sugar and total sugar contents (dependent variables), MLR models were established, based on potentiometric signals collected from the selected sensor sub-sets of the E-tongue, using the training group data (80% of the standard solution selected by the K-means sampling algorithm). For this, the SA algorithm, coupled with MLR, allowed us to identify the best sub-sets of sensors (independent variables), in the range of two to 20 sensors, which facilitated obtaining the best fitting results. Next, by applying the repeated K-fold cross-validation procedure (K = 5-fold with n = 10 repetitions), the model performance using each of the 19 selected sensor sub-sets was evaluated, considering the predictive capability. The MLR model was chosen, given its lowest number of sensors and satisfactory predictive results (maximum average R2 and minimum RMSE for K-fold cross-validation values) regarding the quantification of each sugar concentration. Figure 4 shows a typical example of these results, which were obtained in the evaluation of all sub-sets of sensors (from two to 20) for glucose standard solutions with KCl (1 mol L−1). The results showed that the MLR model with the best predictive performance was based on a sub-set of 16 sensors, which allowed the minimum RMSE value and the highest value of R2.
In Table 3, the selected sensor sub-sets and the quality parameters (RMSE and R2) of the respective MLR models for each dependent variable, obtained with the repeated K-fold cross-validation procedure, are shown for the assays, using standard solutions both with and without KCl (1 mol L−1). There is no evident difference between the results obtained by the selected MLR models for each dependent variable, in the both types of assays. The overall average values of RMSE and R2 on the cross-validation study varied between 0.24 to 0.70 g/L and 0.95 to 0.99, respectively. These results are satisfactory mainly because they were obtained from 50 models, and used data folds of standard solution selected randomly, reflecting the consistency of the experimental design. As expected, the best models achieved within each cross-validation study showed low RMSE values, between 0.08 and 0.19 g/L, and high R2 values, greater or equal to 0.998. Moreover, adjusting the ionic strength in the standard solutions did not show any obvious difference in the results of MLR models, either in the K-fold cross validation procedure or for the best models.
The MLR models were built with 16 or 17 sensors, selected by the SA algorithm, showing that all dependent variables had the same analytical complexity. Additionally, there were no similar models with respect to selected sensors, but it should be noticed that it would be possible to select a sub-set with less sensors that would lead to satisfactory results. All MLR models had duplicate sensors included, which means that their signals may have contained relevant or complementary information regarding the analyzed samples. Those sensors are considered as independent variables or false replicas by the multivariate model, since they were not highly correlated, as a true replicate should be. Finally, all sensors comprised in the two sensor arrays were used in several of the models established, except the polymeric membrane identified with the number 1 (system 1 and 2), that was used in only one model (quantification model of sucrose in standard solutions with KCl 1 mol L−1).

3.4. Multiple Linear Regression Performance Using External Validation

To evaluate the E-tongue capability to determine the concentration of a sugar and total sugar content, a simple linear regression model was established between the predicted concentration values by the final MLR model and the expected concentrations, for training and test groups. Table 4 summarizes these results for the standard solutions, with and without KCl (1 mol L−1).
The MLR models obtained using training group data showed low residual standard error (RSE, values between 0.04 and 0.22) and high R2 values (between 0.9991 and 0.9999), indicative of good adjustments. In accordance with these results, all the linear relations between the predicted concentration values by the final MLR model and the expected concentrations for training data showed slopes of 0.999, intercepts equal to zero (statistically, both were not significant at the level of 5%) and R2 values higher than 0.9994.
For the test group data, the results for all the linear relations between the predicted concentrations and expected concentrations were satisfactory (Table 4)—an important outcome considering that all standard solutions selected for the test group had sugar concentration levels that were orthogonal regarding the solutions used in calibration set. All linear equations obtained had no significant intercepts at level of 5%, and were set to zero; slopes varied between 0.95 and 1.03, being the theoretical values (unity) included in all of the confidence intervals (at level of 95%); RSE values were equal to or less than 0.71 and R2 values were equal to or greater than 0.986. As expected, all models had good linear fit quality, since their residues followed a random distribution, presented normality and did not show presence of influential data in the estimation of the regression coefficients (data not shown). Again, there was no evidence of differences in predictive results between the two assays. Figure 5 shows these linear comparisons between the predicted values by the multiple regression analysis versus actual values of the concentration of each sugar and total sugar content, for the training and testing group, of the standard solutions with or without ionic background.
As expected, all plots showed satisfactory linear fits for test group data superimposed to those obtained from the training data set. It was also found that the concentration range of the solutions selected for the test group of all sugars and total sugar content in the assay with standard solutions with KCl 1 mol L−1 always corresponded to the dynamic range used for the calibration. In contrast, the test groups for the assay using the standard solutions without KCl, had a lower concentration range. Therefore, the adjustment of the ionic background allows homogenization of the solutions matrix and possibly contributes to a greater confidence in analytical work across all the calibration working range.
These results demonstrate that it was possible to quantify the analyzed sugars and sugar total content in solutions that did not belong to the training group with the potentiometric sensor array containing cross-selectivity lipidic polymeric sensors, and using multiple linear calibration, coupled with a feature selection (SA) algorithm. Moreover, the pre-selected sensors for building the sensor array were suitable for the analysis of sugars in accordance with the sensors selected by Dias et al. [20] for the semi-quantitative analyses of glucose and fructose, using PLS and MLR for juice beverages. Since the standard solution preparation followed an orthogonal experimental design, variability in sugars’ concentrations was guaranteed, and together with the complexity of conditions of the present study, contributed to a greater degree of confidence in the results. It may have contributed to the achievement of good results, when compared to results presented in other studies that used real samples in the calibration, and other types of E-tongues [18,19,20,21,22]. These issues show the importance of ensuring, in direct studies on synthetic or real samples, a high number of samples with variability of concentrations and matrix composition, and a reference analytical method with low analytical errors, to guarantee a small source of error.

4. Conclusions

This study successfully applied a potentiometric E-tongue with cross-selectivity lipidic polymeric membranes in the quantification of glucose, fructose and sucrose, and sugar total content in standard solutions. The fractional factorial design used to establish the preparation of these standard solutions, chosen to attain variability and complexity, was important to ensure confidence in the overall results. The analytical data treatment was adequate to obtain MLR models with satisfactory predictive performance in data from test groups (external validation).
The overall results confirm the E-tongue as a practical tool for the analysis of solutions, with advantages over other reference methods, such as flexibility and efficiency in multi-parameter analysis, minimum sample preparation and simple and totally safe operation; therefore, supporting green analysis (green analytical chemistry). Moreover, upon possible miniaturization, the device may be used for in situ analysis.

Author Contributions

V.d.C.A. was responsible for the experimental laboratory work, integrity of the analytical data, data statistical analysis and manuscript preparation. A.M.P. and A.A.S.C.M. contributed to the data interpretation and final manuscript revision. E.B. was envolved in the research experimental design, data statistical analysis and final manuscript revision. L.G.D. was envolved in the research experimental design, experimental laboratory work, data statistical analysis and manuscript preparation.

Funding

This research work was funded by strategic project CIMO–PEst-OE/AGR/UI0690/2014 and Associate Laboratory LSRE-LCM–UID/EQU/50020/2019, financially supported by the FEDER—Fundo Europeu de Desenvolvimento Regional through COMPETE2020—Programa Operacional Competitividade e Internacionalização (POCI); and by national funds through FCT—Fundação para a Ciência e a Tecnologia, Portugal.

Conflicts of Interest

All authors declare that they have no conflict of interest.

References

  1. Dias, L.G.; Sequeira, C.; Veloso, A.C.A.; Sousa, M.E.B.C.; Peres, A.M. Evaluation of healthy and sensory indexes of sweetened beverages using an electronic tongue. Anal. Chim. Acta 2014, 848, 32–42. [Google Scholar] [CrossRef] [PubMed] [Green Version]
  2. Latulippe, M.E.; Skoog, S.M. Fructose malabsorption and intolerance: Effects of fructose with and without simultaneous glucose ingestion. Crit. Rev. Food Sci. Nutr. 2011, 51, 583–592. [Google Scholar] [CrossRef] [PubMed]
  3. Hu, F.B.; Malik, V.S. Sugar-sweetened beverages and risk of obesity and type 2 diabetes: Epidemiologic evidence. Physiol. Behav. 2010, 100, 47–54. [Google Scholar] [CrossRef] [PubMed] [Green Version]
  4. Riby, J.E.; Fujisawa, T.; Kretchmer, N. Fructose absorption. Am. J. Clin. Nutr. 1993, 58, 748–753. [Google Scholar] [CrossRef] [PubMed]
  5. Dias, L.G.; Sequeira, C.; Veloso, A.; Morais, J.; Sousa, M.; Peres, A. A Size Exclusion HPLC Method for Evaluating the Individual Impacts of Sugars and Organic Acids on Beverage Global Taste by Means of Calculated Dose-Over-Threshold Values. Chromatography 2014, 1, 141–158. [Google Scholar] [CrossRef] [Green Version]
  6. Scharbert, S.; Hofmann, T. Molecular Definition of Black Tea Taste by Means of Quantitative Studies, Taste Reconst, and Omission Experiments. J. Agric. Food Chem. 2005, 53, 5377–5384. [Google Scholar] [CrossRef] [PubMed]
  7. Giannoccaro, E.; Wang, Y.J.; Chen, P. Comparison of two HPLC systems and an enzymatic method for quantification of soybean sugars. Food Chem. 2008, 106, 324–330. [Google Scholar] [CrossRef]
  8. Rambla, F.J.; Garrigues, S.; de la Guardia, M. PLS-NIR determination of total sugar, glucose, fructose and sucrose in aqueous solutions of fruit juices. Anal. Chim. Acta 1997, 344, 41–53. [Google Scholar] [CrossRef]
  9. Xie, L.; Ye, X.; Liu, D.; Ying, Y. Quantification of glucose, fructose and sucrose in bayberry juice by NIR and PLS. Food Chem. 2009, 114, 1135–1140. [Google Scholar] [CrossRef]
  10. Sakata, T.; Faceli, K.; Almeida, T.; Júnior, A.; Steluti, W. The Assessment of the Quality of Sugar using Electronic Tongue and Machine Learning Algorithms. In Proceedings of the 11th International Conference on Machine Learning and Applications, Boca Raton, FL, USA, 12–15 December 2012; pp. 538–541. [Google Scholar]
  11. Vlasov, Y.; Legin, A.; Rudnitskaya, A.; di Natale, C.; D’Amico, A. Nonspecific sensor arrays (“electronic tongue”) for chemical analysis of liquids (IUPAC Technical Report). Pure Appl. Chem. 2005, 77, 1965–1983. [Google Scholar] [CrossRef]
  12. Toko, K. A taste sensor. Meas. Sci. Technol. 1998, 9, 1919–1936. [Google Scholar] [CrossRef]
  13. Riul, A., Jr.; Malmegrim, R.R.; Fonseca, F.J.; Mattoso, L.H.C. An artificial taste sensor based on conducting polymers. Biosens. Bioelectron. 2003, 18, 1365–1369. [Google Scholar] [CrossRef]
  14. Miranda, O.R.; You, C.-C.; Phillips, R.; Kim, I.-B.; Ghosh, P.S.; Bunz, U.H.F.; Rotello, V.M. Array-Based Sensing of Proteins Using Conjugated Polymers. J. Am. Chem. Soc. 2007, 129, 9856–9857. [Google Scholar] [CrossRef] [PubMed] [Green Version]
  15. Huynh, T.-P.; Kutner, W. Molecularly imprinted polymers as recognition materials for electronic tongues. Biosens. Bioelectron. 2015, 74, 856–864. [Google Scholar] [CrossRef] [PubMed]
  16. Genua, M.; Garçon, L.-A.; Mounier, V.; Wehry, H.; Buhot, A.; Billon, M.; Calemczuk, R.; Bonnaffeé, D.; Hou, Y.; Livache, T. SPR imaging based electronic tongue via landscape images for complex mixture analysis. Talanta 2014, 130, 49–54. [Google Scholar] [CrossRef] [PubMed]
  17. Ciosek, P.; Wroóblewski, W. Sensor arrays for liquid sensing – electronic tongue systems. Analyst 2007, 132, 963–978. [Google Scholar] [CrossRef] [PubMed]
  18. Beullens, K.; Kirsanov, D.; Irudayaraj, J.; Rudnitskaya, A.; Legin, A.; Nicolai, B.M.; Lammertyn, J. The electronic tongue and ATR–FTIR for rapid detection of sugars and acids in tomatoes. Sens. Actuators B Chem. 2006, 116, 107–115. [Google Scholar] [CrossRef]
  19. Beullens, K.; Mészáros, P.; Vermeir, S.; Kirsanov, D.; Legin, A.; Buysens, S.; Cap, N.; Nicolai, B.M.; Lammertyn, J. Analysis of tomato taste using two types of electronic tongues. Sens. Actuators B Chem. 2008, 131, 10–17. [Google Scholar] [CrossRef]
  20. Dias, L.G.; Peres, A.M.; Barcelos, T.P.; Morais, J.S.; Machado, A.A.S.C. Semi-quantitative and quantitative analysis of soft drinks using an electronic tongue. Sens. Actuators B Chem. 2011, 154, 111–118. [Google Scholar] [CrossRef]
  21. de Sá, A.C.; Cipri, A.; González-Calabuig, A.; Stradiotto, N.R.; del Valle, M. Resolution of galactose, glucose, xylose and mannose in sugarcane bagasse employing a voltammetric electronic tongue formed by metals oxy-hydroxide/MWCNT modified electrodes. Sens. Actuators B Chem. 2016, 222, 645–653. [Google Scholar] [CrossRef] [Green Version]
  22. Wei, Z.; Wang, J. The evaluation of sugar content and firmness of non-climacteric pears based on voltammetric electronic tongue. J. Food Eng. 2013, 117, 158–164. [Google Scholar] [CrossRef]
  23. Cipri, A.; Schulz, C.; Ludwig, R.; Gorton, L.; del Valle, M. A novel bio-electronic tongue using different cellobiose dehydrogenases to resolve mixtures of various sugars and interfering analytes. Biosens. Bioelectron. 2016, 79, 515–521. [Google Scholar] [CrossRef]
  24. Brereton, R.G. Applied Chemometrics for Scientists; John Wiley & Sons Ltd.: West Sussex, UK, 2007. [Google Scholar]
  25. Dias, L.G.; Veloso, A.C.A.; Sousa, M.E.B.C.; Estevinho, L.; Machado, A.A.S.C.; Peres, A.M. A novel approach for honey pollen profile assessment using an electronic tongue and chemometric tools. Anal. Chim. Acta 2015, 900, 36–45. [Google Scholar] [CrossRef] [PubMed] [Green Version]
  26. Kobayashi, Y.; Habara, M.; Ikezazki, H.; Chen, R.; Naito, Y.; Toko, K. Advanced taste sensors based on artificial lipids with global selectivity to basic taste qualities and high correlation to sensory scores. Sensors 2010, 10, 3411–3443. [Google Scholar] [CrossRef] [PubMed]
  27. R Core Team. R: A Language and Environment for Statistical Computing; R Foundation for Statistical Computing: Vienna, Austria, 2013; ISBN 3-900051-07-0. Available online: http://www.R-project.org/ (accessed on 10 February 2019).
  28. Cadima, J.; Cerdeira, J.O.; Minhoto, M. Computational aspects of algorithms for variable selection in the 410 context of principal components. Comput. Stat. Data Anal. 2014, 47, 225–236. [Google Scholar] [CrossRef]
  29. Cadima, J.; Cerdeira, J.O.; Silva, P.D.; Minhoto, M. The Subselect R Package. 2012. Available online: https://cran.r-project.org/web/packages/subselect/subselect.pdf (accessed on 10 February 2019).
  30. Wickham, H. ggplot2: Elegant Graphics for Data Analysis; Springer: New York, NY, USA, 2009. [Google Scholar]
  31. Venables, W.N.; Ripley, B.D. Modern Applied Statistics with S, 4th ed.; Springer: New York, NY, USA, 2002. [Google Scholar]
  32. Stevens, A.; Ramirez-Lopez, L. An Introduction to the Prospectr Package; R Package Vignette: Vienna, Austria, 2013. [Google Scholar]
  33. Naes, T. The design of calibration in near infra-red reflectance analysis by clustering. J. Chemom. 1987, 1, 121–134. [Google Scholar] [CrossRef]
  34. Naes, T.; Isaksson, T.; Fearn, T.; Davies, T. A User Friendly Guide to Multivariate Calibration and Classification; NIR Publications: Chichester, UK, 2002. [Google Scholar]
  35. Osman, I.H.; Kelly, J.P. Meta-Heuristics: Theory & Applications; Kluwer Academic Publishers: Hingham, MA, USA, 1996. [Google Scholar]
  36. Kuhn, M.; Johnson, K. Applied Predictive Modeling; Springer: New York, NY, USA, 2013. [Google Scholar]
  37. Roig, B.; Thomas, O. Rapid estimation of global sugars by UV photodegradation and UV spectrophotometry. Anal. Chim. Acta 2003, 477, 325–329. [Google Scholar] [CrossRef]
  38. Roig, B.; Thomas, O. UV monitoring of sugars during wine making. Carbohydr. Res. 2003, 38, 79–83. [Google Scholar] [CrossRef]
  39. Toyota, K.; Cui, H.; Abe, K.; Habara, M.; Toko, K.; Ikeazaki, H. Sweetness sensor with lipid/polymer membranes: Sweet-responsive substances. Sens. Mater. 2011, 23, 465–474. [Google Scholar]
  40. Yasuura, M.; Okazaki, H.; Tahara, Y.; Ikezaki, H.; Toko, K. Development of sweetness sensor with selectivity to negatively charged high-potency sweeteners. Sens. Actuator B Chem. 2014, 201, 329–335. [Google Scholar] [CrossRef]
  41. Toyota, K.; Cui, H.; Abe, K.; Habara, M.; Toko, K.; Ikeazaki, H. Sweetness sensor with lipid/polymer membranes: Response to various sugars. Sens. Mater. 2011, 23, 475–482. [Google Scholar]
Figure 1. Sensor schematics of the electronic tongue.
Chemosensors 07 00043 g001
Figure 2. 3D plot of the three sugars’ concentrations, established by the fractional factorial design.
Chemosensors 07 00043 g002
Figure 3. Extremes and quartiles of the potentiometric signals of all standard solutions with and without ionic background of KCl (1 mol L−1).
Chemosensors 07 00043 g003
Figure 4. Evaluation of all sub-set of sensors (from two to 20) for glucose in the standard solutions with KCl (1 mol L−1).
Chemosensors 07 00043 g004
Figure 5. Linear relations between the predicted concentrations of sugars (glucose, fructose and sucrose) and total sugar content by the MLR models, using the sensors selected by the simulated annealing algorithm, and expected concentrations for the training (dotted line and solid marker) and test data (solid line and circle marker): (A) Standard solutions with KCl 1 mol L−1; (B) standard solutions without KCl 1 mol L−1.
Chemosensors 07 00043 g005
Table 1. Experimental design levels and concentrations of sugars in the standard solutions.
Experimental Design LevelsConcentrations (g/L)
SolutionGlucoseFructoseSucroseGlucoseFructoseSucrose
1000222
20−2−120.31
3−2−1−20.310.3
4−1−2210.38
5−2220.388
6220882
720−1821
80−12218
9−12−1181
102−11815
11−111155
12110552
13102528
14021285
15212858
1612−2580.3
172−2−280.30.3
18−2−200.30.32
19−2010.325
2001−2250.3
211−2150.35
22−21−10.351
231−1−1511
24−1−10110.3
25−10−2120.3
Table 2. Numeration assigned to each polymeric membrane position in the sensor array.
Order NumberPlasticizer (65%)Additive (3%)
12-nitrophenyl-octyl etherOctadecylamine
2Oleyl alcohol
3Methyltrioctylammonium chloride
4Oleic acid
5Tris(2-ethylhexyl) phosphateOctadecylamine
6Oleyl alcohol
7Methyltrioctylammonium chloride
8Oleic acid
9Bis(1-butylpentyl) adipateOctadecylamine
10Oleyl alcohol
11Methyltrioctylammonium chloride
12Oleic acid
13Dibutyl sebacateOctadecylamine
14Oleyl alcohol
15Methyltrioctylammonium chloride
16Oleic acid
17Bis(2-ethylhexyl) phthalateOctadecylamine
18Oleyl alcohol
19Methyltrioctylammonium chloride
20Oleic acid
Table 3. The sub-set of sensors selected and results for the multiple linear regression (MLR) model of each dependent variable.
ParameterN *1Sensors SelectedMean Results of the K-Folds Cross-ValidationResults of the Best MLR Model
RMSE *2 R2 *3RSE *4R2 *3
Standard Solutions with KCl 1 mol L−1
Glucose16S1:3 S1:6 S1:11 S1:13 S1:15 S1:16 S1:18 S1:19 S2:2 S2:3 S2:6 S2:7 S2:15 S2:16 S2:17 S2:180.58 (±0.37)0.96 (±0.07)0.190.998
Fructose16S1:4 S1:8 S1:12 S1:14 S1:15 S1:16 S2:2 S2:3 S2:8 S2:14 S2:15 S2:16 S2:17 S2:18 S2:19 S2:200.36 (±0.23)0.98 (±0.02)0.120.9994
Sucrose16S1:1 S1:6 S1:11 S1:12 S1:14 S1:16 S1:20 S2:4 S2:6 S2:8 S2:13 S2:14 S2:15 S2:17 S2:18 S2:200.70 (±1.88)0.96 (±0.14)0.140.9992
Total sugars14S1:3 S1:4 S1:10 S1:11 S1:13 S1:14 S1:15 S1:16 S2:4 S2:7 S2:9 S2:13 S2:14 S2:16 S2:19 S2:200.61 (±0.85)0.97 (±0.11)0.160.9997
Standard Solutions Without KCl 1 mol L−1
Glucose17S1:2 S1:3 S1:4 S1:6 S1:8 S1:9 S1:12 S1:14 S1:17 S1:18 S2:4 S2:8 S2:13 S2:14 S2:17 S2:18 S2:200.60 (±0.64)0.95 (±0.10)0.130.9994
Fructose16S1:2 S1:7 S1:8 S1:9 S1:10 S1:12 S1:13 S1:15 S1:17 S1:18 S1:20 S2:4 S2:5 S2:11 S2:12 S2:160.47 (±0.24)0.98 (±0.02)0.160.9990
Sucrose16S1:2 S1:10 S1:12 S1:14 S1:16 S1:18 S1:19 S1:20 S2:5 S2:6 S2:9 S2:12 S2:14 S2:15 S2:18 S2:190.24 (±0.18)0.99 (±0.01)0.080.9998
Total sugars16S1:2 S1:3 S1:6 S1:7 S1:8 S1:10 S1:16 S1:20 S2:2 S2:3 S2:4 S2:5 S2:6 S2:11 S2:12 S2:190.50 (±0.49)0.98 (±0.05)0.170.9996
*1 Number of sensors; *2 root mean square error; *3 determination coefficient; *4 residual standard error of the regression model.
Table 4. Results from the quantifications of sugars (glucose, fructose and sucrose) and total sugars’ contents in the standard solutions, with and without KCl 1 mol L−1, using potentiometric multi-sensor data through MLR models for the training and test group data.
CompoundN SensorsBest ModelTrain Group PredictionTest Group Prediction
RSE *1R2 *2SlopeRSE *1R2 *2SlopeRSE *1R2 *2
Standard solutions with KCl 1 mol L−1
Glucose160.220.99910.999 (±0.005)0.110.99941.00 (±0.04)0.390.995
Fructose160.100.99980.999 (±0.003)0.070.99971.01 (±0.08)0.710.974
Sucrose160.120.99970.999 (±0.003)0.080.99960.95 (±0.03)0.410.995
Total sugars160.170.99980.999 (±0.002)0.090.99990.99 (±0.01)0.400.999
Standard solutions without KCl 1 mol L−1
Glucose170.120.99980.999 (±0.003)0.070.99981.02 (±0.06)0.320.986
Fructose160.170.99950.999 (±0.004)0.090.99960.98 (±0.05)0.470.989
Sucrose160.040.99990.999 (±0.002)0.040.99991.02 (±0.03)0.150.997
Total sugars160.120.99990.999 (±0.002)0.0990.99991.03 (±0.01)0.360.999
*1 Residual standard error; *2 determination coefficient.

