Stability and Safety Assessment of Phosphorescent Oxygen Sensors for Use in Food Packaging Applications


1
School of Biochemistry and Cell Biology, University College Cork, Cavanagh Pharmacy Building, College Road, Cork T12 K8AF, Ireland
2
Department of Food Science and Nutrition, University College Cork, College Road, Cork T12 K8AF, Ireland
*
Author to whom correspondence should be addressed.
Chemosensors 2018, 6(3), 38; https://doi.org/10.3390/chemosensors6030038
Submission received: 27 July 2018
/
Revised: 31 August 2018
/
Accepted: 5 September 2018
/
Published: 6 September 2018
(This article belongs to the Collection Optical Chemosensors and Biosensors)
Abstract
:Five types of new solid-state oxygen sensors, four based on microporous polypropylene fabric materials and one on polyphenylene sulphide films impregnated with phosphorescent platinum(II)-benzoporphyrin dye, were tested for their stability and safety in food packaging applications. All these sensors exhibit useful optical signals (phosphorescence lifetime readout) and working characteristics and are simpler and cheaper to produce and integrate into standard packaging materials than existing commercial sensors. When exposed to a panel of standard food simulants and upon direct contact with raw beef and chicken meat and cheddar cheese samples packaged under modified atmosphere, the sensors based on ungrafted polypropylene fabric, impregnated with PtBP dye by the swelling method, outperformed the other sensors. The sensors are also stable upon storage under normal atmospheric conditions for at least 12 months, without any significant changes in calibration.
1. Introduction
Residual oxygen (O2) is an important parameter reflecting the quality and safety of packaged foods, and also a shelf-life limiting factor [1]. Elevated O2 levels in packs, due to inadequate packaging material or process, improper storage, handling, accidental damage of packaged products, can lead to premature deterioration and spoilage of the food by oxidation, chemical degradation, microbial growth or their products [2,3,4]. Oxidation also changes the sensory properties (taste, texture and aroma) of certain foods and decreases their nutritional value (e.g., potato snacks). All this negatively impacts the perceptions of both the consumers and producers of such products [5].
To increase the quality and prolong shelf-life of food products, active packaging is used. The main concepts of active packaging include freezing, chilling, acidification, vacuum and modified atmosphere packaging (MAP), and the use of scavengers, moisture absorbents, antimicrobial and antioxidant releasing components [1]. MAP is one of the most widely used concepts, which involves the tailoring of gas composition inside packages to optimal levels, which effectively maintain the quality and appearance of the food product, inhibit microbial growth and prevent contamination [6]. The majority of MAP products are packaged under low O2 atmosphere (<0.5%), except for fresh red meats for which high O2 levels (>40%) help ensure good appearance and red colour [7,8].
Due to the above reasons, control or residual O2 in packaged foods is of major importance, and ideally has to be implemented for every pack and throughout the whole production and distribution chain. Traditionally, quality control of residual O2 in MAP foods was conducted by sampling and destructive methods. Thus, headspace analysis with DansensorTM analyser entails the removal of packages at random from the product line, puncturing the package through a septum with a thin needle, withdrawing a small volume of headspace gas and measuring its O2 and CO2 content with O2 and CO2 sensors located inside the instrument [9]. Such methods are essentially destructive (although measurements can be repeated several times), create wastage, and provide only snapshot readings at a time of analysis in the selected packs. This approach is inefficient to detect all below quality packages with incorrect gas levels, which have been shown to be frequent [2], and it has relatively low sample throughput. The performance of MAP apparatus can also be controlled with an on-line gas analyser to ensure the correct levels of gas are being fed into the packages, however this strategy does not account for all faults in packaging such as poor sealing or damage to packaging during processing or transport allowing ingress of oxygen.
Phosphorescence based O2 sensor systems have the ability to implement efficient non-destructive monitoring of residual O2 in packaged food products (and ultimately in every pack), and they can perform a number of different analytical tasks at different stages of package lifespan [1]. Sensor active element consists of an O2-sensitive dye embedded in a polymeric matrix, so that its emission intensity and lifetime are quenched by O2. Such sensors provide reversible and quantitative optical response to O2 concentration (partial pressure) in the surrounding medium, gaseous or liquid [10,11]. Solid-state O2 sensors are usually fabricated using solution based processes such as drying from a cocktail in an organic solvent [1]. Conventional sensor materials and fabrication methods include the casting of polymeric cocktails on planar support (polyester film), polymerization or curing of liquid precursors (e.g., silicones and sol-gels [12]), dye incorporation into host matrices by adsorption [13], covalent attachment [14], etc. [15,16]. Although efficient in some applications, existing O2 sensor systems are not very suitable for large-scale applications such as food packaging due to their complex composition and fabrication processes, which make them rather expensive, variable and inflexible. Very few sensor types are characterised to a sufficient degree with respect to their stability in contact with food products and safety for food producers and consumers.
To be usable and viable in large scale applications such as food packaging, O2 sensors should be simple, scalable, reproducible, stable and cost less than 1 cent each [17]. We have recently reported that non-woven polyolefin fabric materials (polypropylene (PP) and polyethylene (PE) based), as well as poly(phenylene sulphide) films (PPS) can be used as simple polymer host and support materials, which allow fabrication of simple and robust O2 sensors by solvent crazing [18,19] and polymer swelling [20] methods. These food-compatible polymer materials possess many desirable qualities, such as gas permeability, process ability, simple composition and uniformity, storage stability and low cost. However, they have not been characterised or assessed in sufficient detail for food packaging applications.
In this study, we conducted a comparative evaluation of several types of such O2 sensor materials, particularly analysing migration of their components and stability of optical characteristics and O2 calibration upon prolonged exposure to various food simulants, as well as in MAP meat and cheese products.
2. Materials and Methods
Pt (II)-benzoporphyrin dye (PtBP) was from Luxcel Biosciences (Cork, Ireland). Analytical grade tetrahydrofuran (THF), ethyl acetate (EtAc), 2-butanone, 96% ethanol, acetic acid, L-lactic acid, NaCl, NaHCO3 and sucrose were from Sigma-Aldrich (Dublin, Ireland).
2.1. O2 Sensor Materials
Five different types of O2-sensitive materials were investigated, as well as one commercial sensor (Optech® Platinum sensor stickers, Mocon, MN, USA) which was used as a reference. Their names (Types 1–5), material composition, and fabrication method are described in Table 1, while detailed fabrication procedures can be found in the references provided. All these sensors were produced in small batches as strips or sheets, then cut into individual sensors (typically 5–10 mm in diameter), and then stored at room temperature and used as required.
2.2. Sensor Exposure to Food Simulants
Sensors of approximately 6–9 mm in diameter were cut out from the sheets and placed individually in 2 mL glass HPLC vials. Two millilitres of simulant solution (SS) were added to each vial: 95% EtOH (SS1, positive control), 10% EtOH (SS2), 5% Acetic Acid (SS3), 3% Lactic Acid (SS4), 3% NaHCO3 (SS5), H2O (SS6), 3% NaCl (SS7) and 20% Sucrose (SS8). The vials were sealed, incubated, shaken at 40 °C over a 21-day period and assayed periodically.
The leakage of PtBP dye from the sensors was analysed on an 1100 Series HPLC system (Agilent, Santa Clara, CA, USA) consisting of a quaternary pump, diode array photometric detector, an auto-sampler and an Eclipse XDB-C18 reverse phase column (150 × 4.6 mm, 5 µm, Agilent, Santa Clara, CA, USA). Ten microlitres of the simulant sample were injected into a Mobile phase A (H2O, 0.1% TFA) and eluted with an ascending gradient of THF (0–70% over 22 min). A calibration curve was generated with PtBP standards in THF (quantified on an 8453 UV-Vis spectrophotometer, Agilent, Santa Clara, CA, USA).
2.3. Sensor Exposure to Fresh Meat and Cheese Samples
Pieces of fresh beef steak and chicken breast obtained from commercial source (Lidl, Cork, Ireland) were placed in standard MAP trays (EVOH/PE, O2 permeability 8–12 cm3 m−2 day−1 at STP). The O2 sensors were adhered in duplicate with a piece of Scotch tape to the inner side of a packaging laminate consisting of a 20 µm oriented polypropylene (OPP) and a 50 µm co-extruded PE/EVOH/PE (O2 permeability 3 cm3 m−2 day−1 at STP, Cryovac/WR Grace, Kriens, Switzerland). The laminate film with sensors was then used to heat-seal the trays with or without meat samples on a VS 100 BS packaging system (Gustav Muller and Co., Bad Homburg, Germany). MAP was performed under 55% O2 for beef samples and under 0% O2 for chicken samples.
The trays with packaged meat and sensors were stored at 4 °C in both upright (sensor exposed to headspace gas) and inverted (sensor in direct contact with meat and meat juice) position. The sensors were measured with OptechTM reader (Mocon, MN, USA) every second day over six days (a typical shelf-life for these products). At the end of the study, packs were opened, sensors removed, washed thoroughly with water and then analysed for changes in their O2 calibration. For the upright samples, sensors of several different types were inserted in duplicates in headspace area of each pack. For the inverted samples, two sensors were inserted in each pack, which was then flipped over and handled such that the sensors remained in constant contact with meat sample.
Confirmatory analysis of headspace O2 and CO2 levels in the packs with meat and sensors and also in control empty packs was performed at the beginning and end of this study. A special septum was applied on the sealing laminate and then pierced with a needle probe of the DansensorTM Checkmate 3 headspace analyser (Mocon, MN, USA), which extracted and analysed headspace gas for O2 and CO2 levels. Readings can be taken three times before package failure; the sample volume taken is 6 mL; and the accuracy is ±0.01% O2 and ±0.08% CO2.
Similarly, trays with cheese samples were prepared and tested. Cheddar cheese (Lidl, Cork, Ireland) was sliced and divided between two MAP containers with an additional MAP container left empty as control. The sensors were adhered to the sealing film with tape and sealed in an atmosphere of 32% CO2 and 68% N2. Blank containers were also included for testing the MAP process efficiency. The containers were then stored at 3 °C in both upright and inverted orientation and tested intermittently over a 32-day shelf life span.
2.4. Changes in Sensor Characteristics after Exposure to Simulants and MAP Meat
Changes in phosphorescence intensity and lifetime signals after sensor exposure to food simulants were assessed by placing the sensors in a clear 20 mL polystyrene vial (Sarstedt, Drinagh, Ireland) with controlled temperature and gas composition (0 kPa or 21 kPa O2), and measuring each sensors five times in different positions with an OptechTM handheld reader (Mocon) or with an optical fibre reader FirestingTM (PyroScience, Aachen, Germany). Average values and standard deviations were calculated and compared to those of the control sensors.
For the sensors exposed to meat in MAP trays, full O2 calibrations in dry and humid gases were also examined and compared with untreated sensors. The sensor was placed in a flow-through cell which had a window for optical contact with the OptechTM instrument. The flow cell was submerged in a Refrigerated Circulator, Model 911 (Polysciences, Hirschberg, Germany) equilibrated at 20 °C and flushed sequentially with different O2/N2 gas mixtures produced by a precision gas mixer LN Industries SA (Champagne, Switzerland). At each O2 concentration (0–100 kPa range), phosphorescence lifetime signals were measured, mean values calculated and used to plot O2 calibrations and assess the changes induced by contact with food.
3. Results and Discussion
Phosphorescent O2 sensors are designed to record small deviations in O2 concentration within packages in a contactless non-destructive manner. However, potential interactions with food products and variability between individual sensors (usually batch or factory calibrated) can compromise system performance, stability of measurements and also raise safety concerns of the consumer, if significant leaching of sensor components and food contamination are likely to occur. Type 1–5 O2 sensors analysed in this study had simple chemical composition and contained only the carrier polymer and the reporter dye, PtBP. However, the dye was embedded in the polymer matrix by physical means rather than chemical (covalently bound), therefore there is a possibility for the dye to leak from the polymer upon contact with food.
3.1. Effects of Sensor Exposure to Food Simulants
The initial testing of the different sensor types was carried out with a standard set of food simulants, which mimic a variety of food substances (see experimental), as well as 95% ethanol as positive control [23]. Sensors were submerged in the simulants and incubated for 21 days at 40 °C while shaking. Periodic sampling and HPLC analysis of supernatants occurred every seven days. For all the simulants, no measurable dye leeching was observed, except in the Type 1 sensor which showed some leaching (1.47 μg/mL) in 10% EtOH. We attributed this to the residual aggregated dye left on the surface after the impregnation and aqueous washing.
After the exposure to the food simulants, changes in sensor O2 calibration were analysed by measuring their phosphorescence lifetime signals at 0 and 21 kPa O2. It is worth noting that changes in these lifetimes signify a change in the quenching constant and/or unquenched lifetime, which could be attributed to polymer swelling and partial dissolution and redistribution of the dye molecules within host matrix. Some variation of lifetime readings for the different samples could be due to variation of their temperature, which was not tightly controlled or compensated for.
As we expected from the low rates of dye leaching, changes were relatively minor or none. Type 2 sensor showed best stability with practically no notable drift in the lifetime signal at 21 kPa and 0 kPa O2 in all the simulants. The Type 1 sensor showed a minor rise in lifetime signal (<0.5 μs) in some simulants at 21 kPa, but not at 0 kPa. Type 3 and 4 sensors show similar minor lifetime changes both in air and nitrogen, which we can attribute to washing out of residual surfactant retained in these sensors after their fabrication [21]. Type 5 sensors also showed no dye leaching in any of the simulants indicating that the dye is firmly embedded in PPS. However, Type 5 sensors showed higher heterogeneity and variability of lifetime readings, both within one sensor and between different sensors.
At the same time, in the positive control (95% EtOH) was observed significant dye leaching for all the sensors, except for the Type 5 (Table 2). After seven days immersed in the 95% EtOH, the Type 1, 3 and 4 sensors became unusable: their phosphorescence lifetime could not be measured due to low intensity signals. Based on the results of these tests, the Type 1, 2 and 5 sensors were chosen for further studies involving exposure to meat products.
3.2. Effects of Sensor Contact with MAP Meats
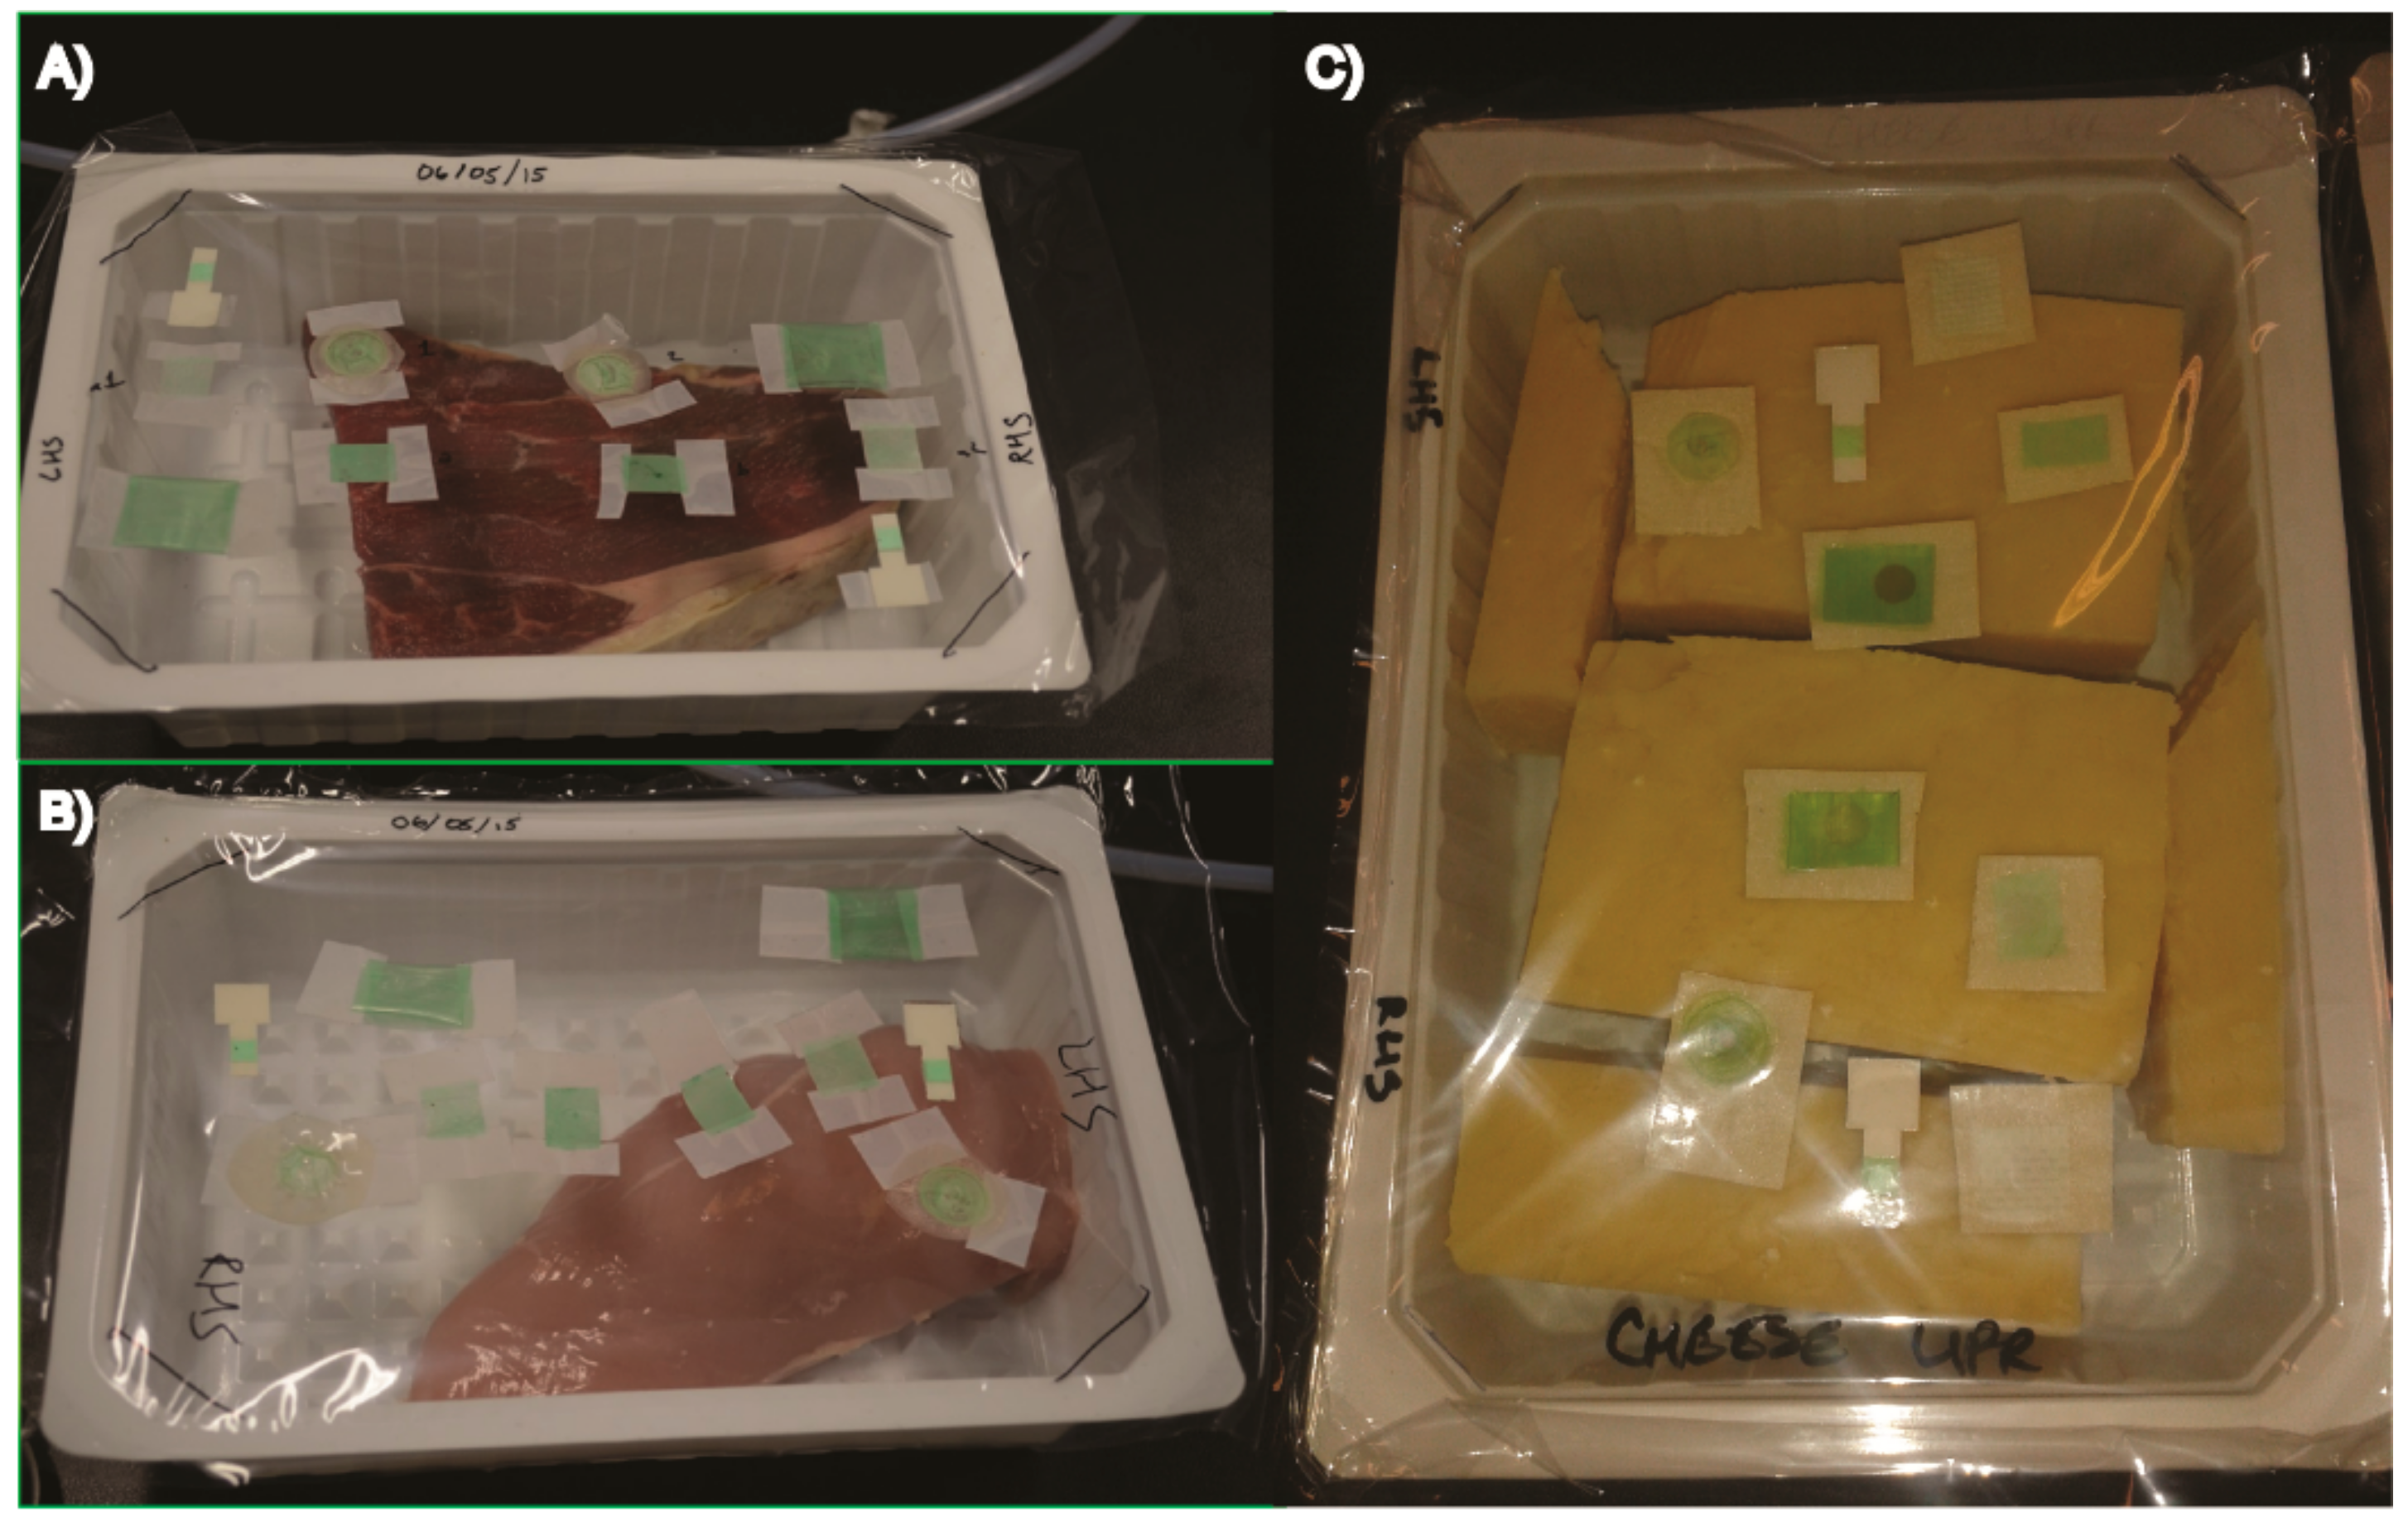
The selected sensor types were attached in duplicates to the inner side of the sealing laminate film using Scotch tape, and then the packages with food products were flushed and sealed under suitable MA. OptechTM-Platinum stickers were also included in each pack. Photographs of the trays with sensors and food samples are shown in Figure 1. Once sealed, the meat packages were transferred to a cold room and one of each was stored upright and inverted at 4 °C.
Measurements of residual O2 and CO2 content in headspace gas taken by DansensorTM Checkmate 3 instrument, revealed that O2 and CO2 levels in meat and chicken packs remained stable and in the required range, reducing slightly over the seven-day storage period.
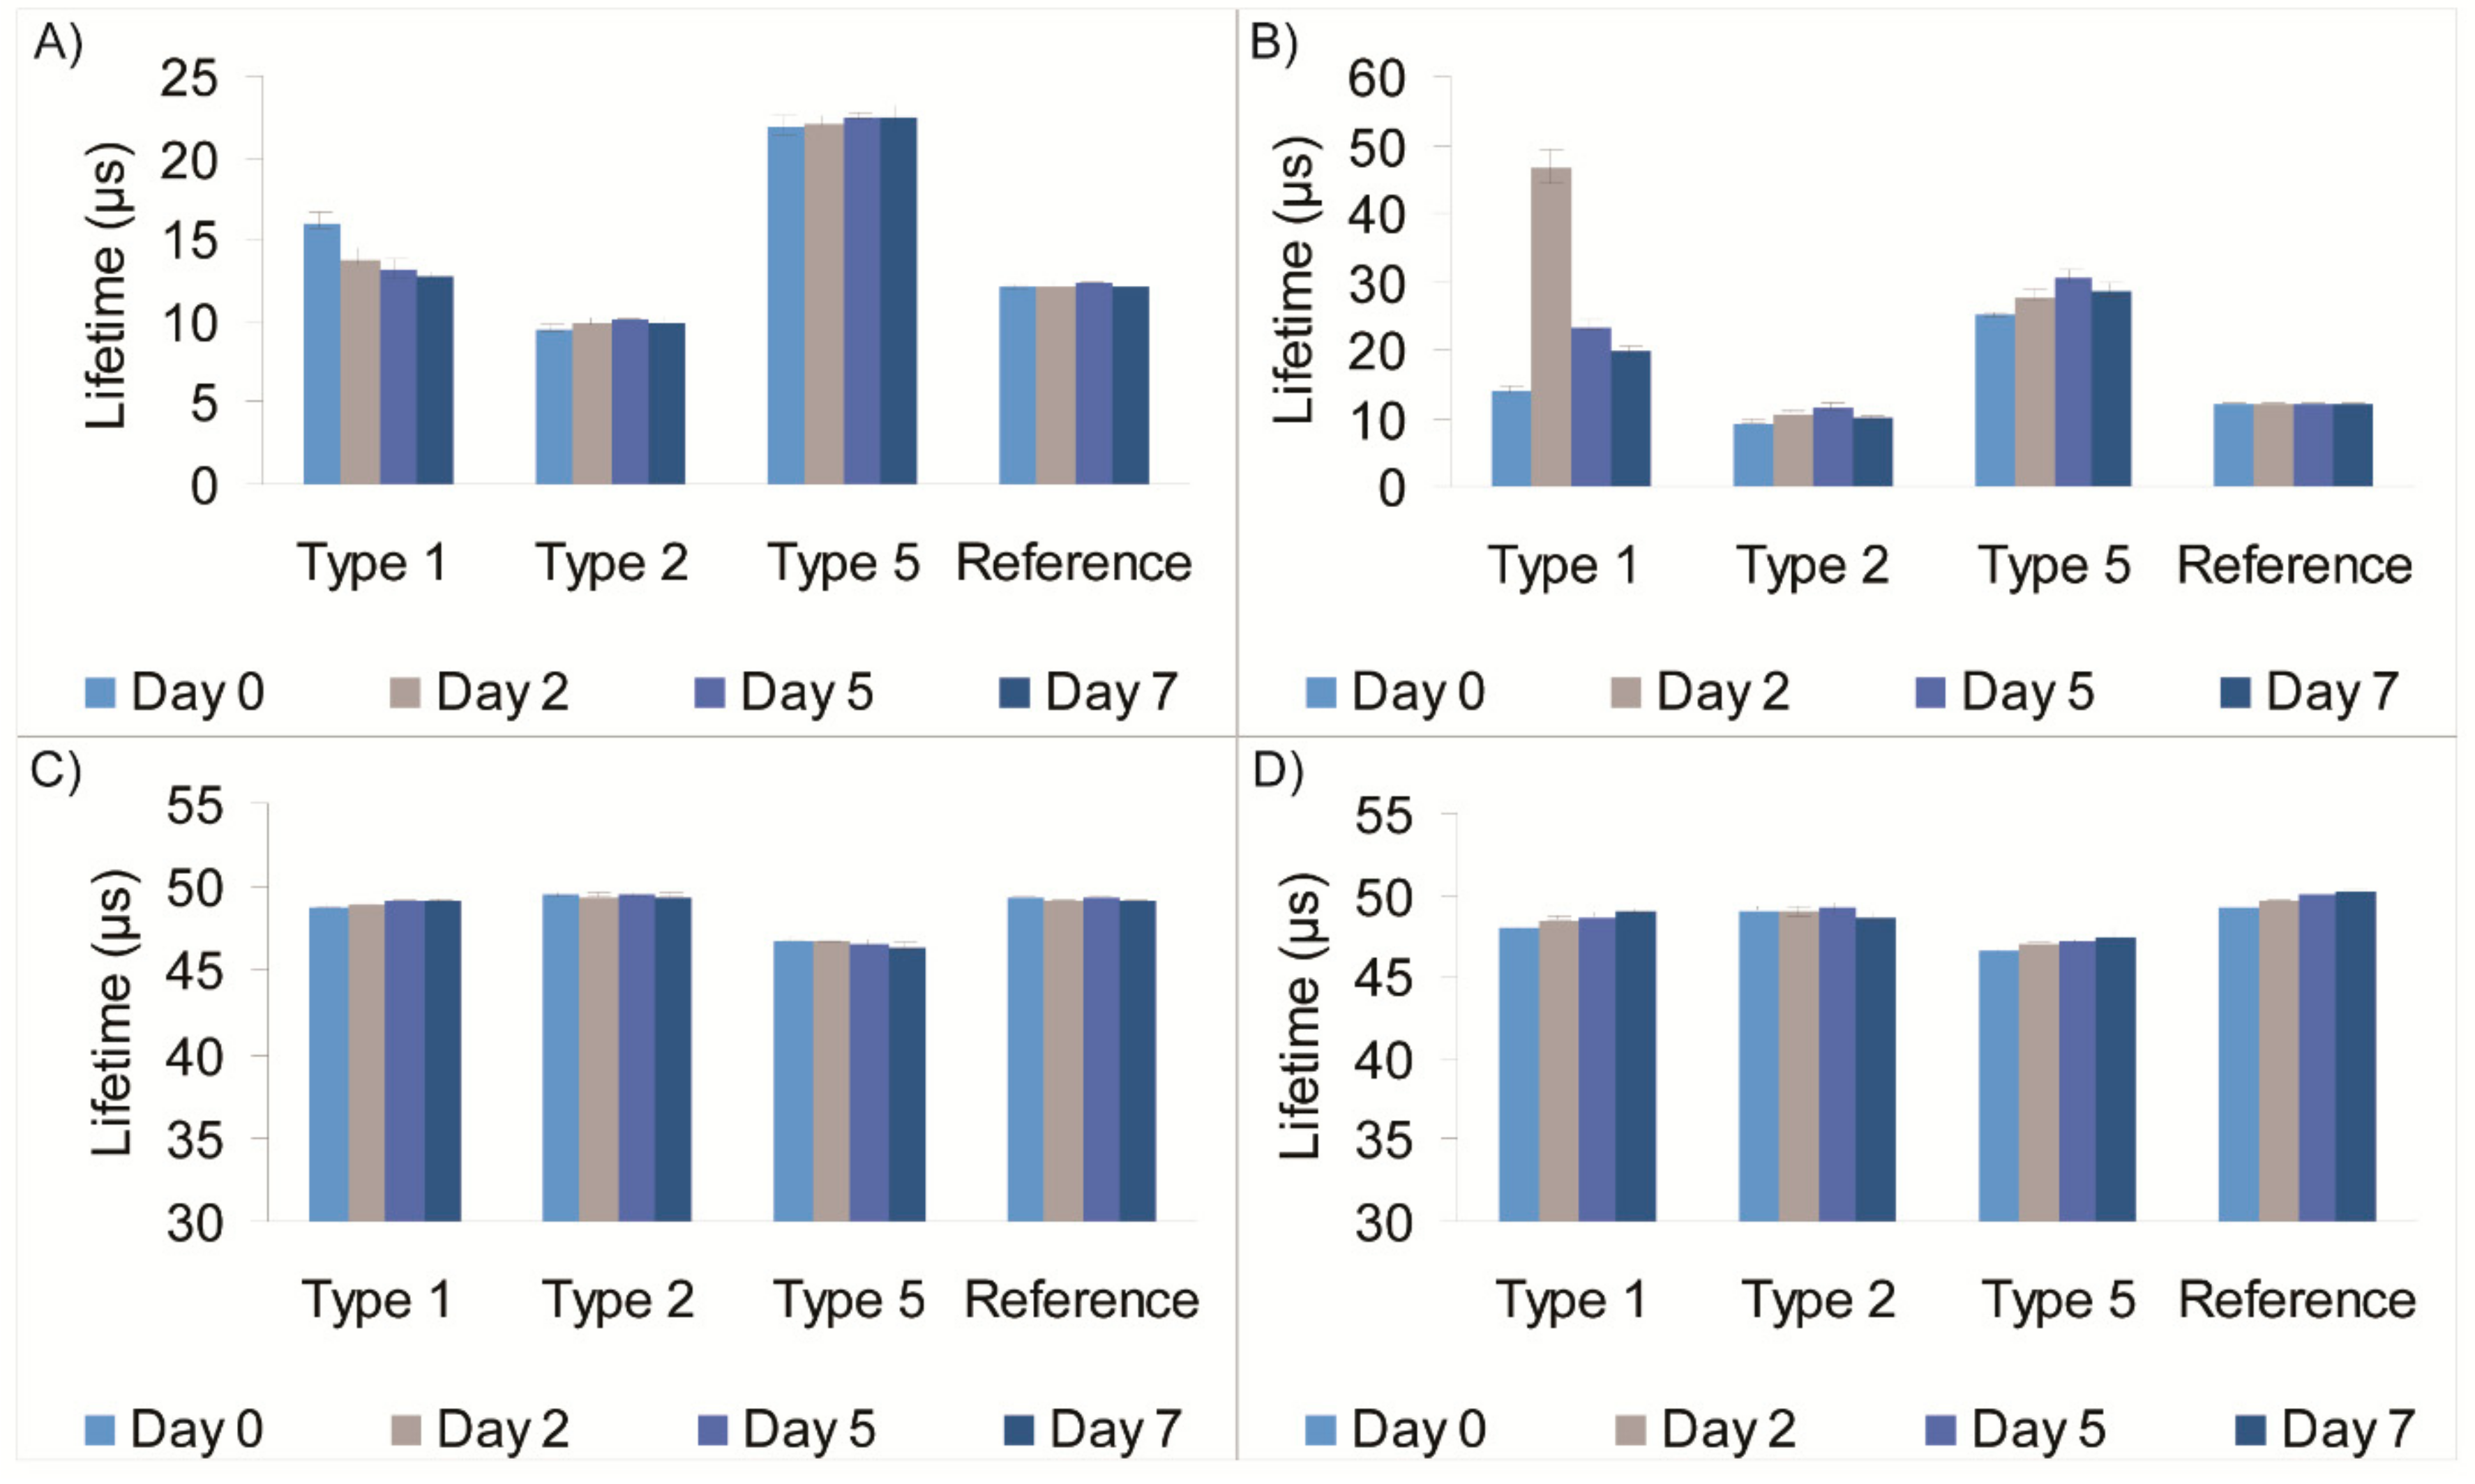
Upon sealing and storing the packages with MAP food samples, phosphorescence lifetime signals from the sensors were measured using the OptechTM handheld instrument—on Days 0, 2, 5 and 7. Results of these measurements for the worst-performing of the four sensor types are shown in Figure 2.
The screening of the meat packages showed the Type 2 sensor having the least variation in lifetime signals (<0.3 µs) over the seven-day period in the chicken packages and the upright beef package. A higher variation was observed in the inverted beef package, which we attribute to the blood juices from the product soaking the sensor after Day 0. Likewise, the Type 1 sensor showed small variations in lifetime signal in chicken packages, however noticeable lifetime variations were observed in the beef samples: a variation of 1.5 µs in the upright and 5.1 µs in the inverted Type 1 sample. The smaller variation can be attributed to moisture condensation around the sensor and/or sensor soaking in fatty meat juice (plasticising effect), while the larger variation could be due to growth of aerobic bacteria at the meat/sensor interface. The Type 5 sensor also performed well, with a variation of 2.5 µs found in the inverted beef package.
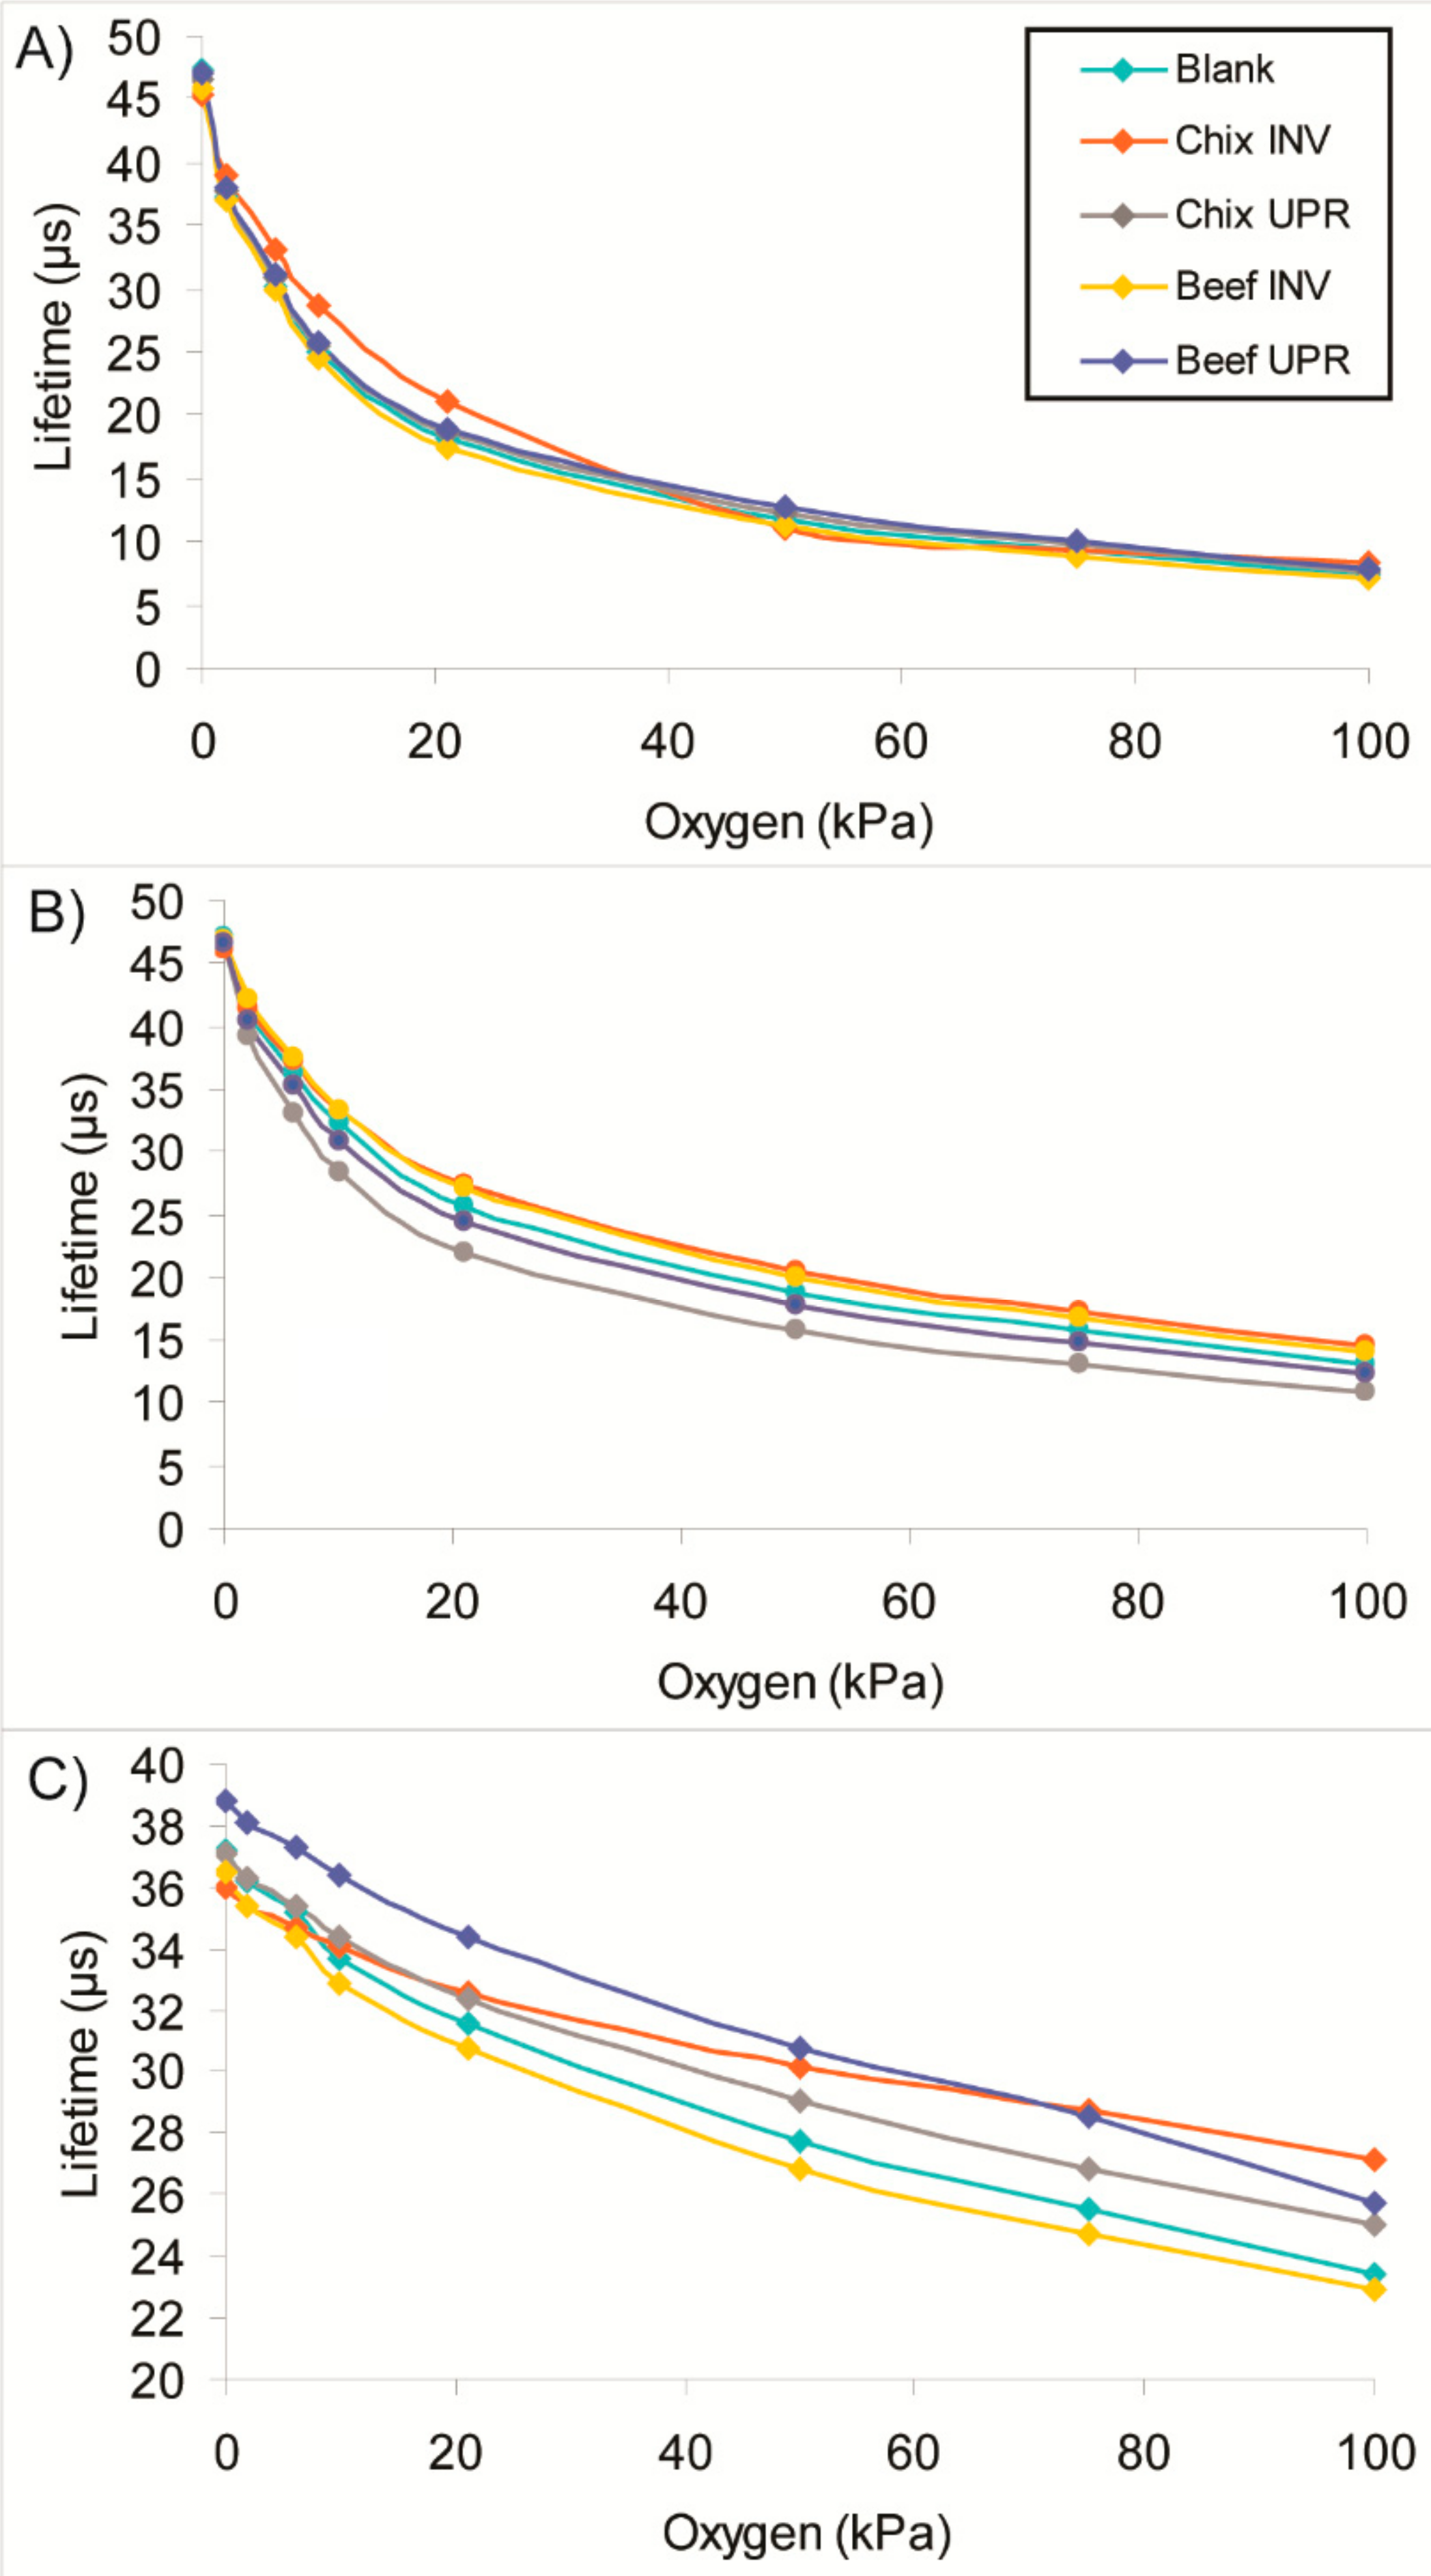
It is worth noting that the sensor lifetimes in beef and chicken packs correspond to the different O2 levels in packs (Table 3). Therefore, changes in sensor signals that occur in the different products are not so easy to compare. To better assess these effects, we carried out full O2 calibrations of used and control sensors under standard conditions: dry gas, 0–100 kPa O2 range, 20 °C. For this, sensors were removed from the packages on Day 7 were thoroughly rinsed with water to remove any residual meat juices, dried overnight and then calibrated. Figure 3 shows that the Type 2 sensors performed well: after the exposure to food calibrations showed only slight deviations, compared to the same unused sensor or sensor placed in the empty package. The Type 1 and 5 sensors showed greater deviation from the original calibration with deviations of up to 3.7 µs. The greatest deviation in the Type 5 sensor was upon direct contact with the chicken, however this was not the case for the Type 1 sensor. No significant change in response time was observed for all the exposed sensors; it was typically <10 s.
3.3. Effects of Sensor Contact with MAP Cheese
The O2 sensors are intended for applications in various types of food packaging. Therefore, selected sensors underwent additional contact testing with MAP cheddar cheese for 32 days. Headspace gas analysis with DansensorTM at the beginning and the end of the study confirmed stable low levels of O2 and significant decrease of CO2 over 32-day storage period for the cheese samples with sensors (Table 3). Screening of the O2 sensors placed in these packs (both in the upward and inverted packs and with the commercial OpTechTM sticker) revealed a slight upward drift in lifetime signal over 32-day storage: 0.7–0.2 μs for the new sensors and 0.5 μs for Optech (Figure 4). This drift is attributed mainly to the natural decrease in residual O2 levels in these packs—from approximately 0.1% to 0.02%. Outliers (e.g., Type 2 readings on Day 14, and Type 1 and 2 readings on Day 7) can be due to temperature variation in these packs and/or measurement error. At the same time, the sensors from blank container showed lower sensor readings than those in the cheese containing packages. The OpTechTM sensors gave ~46 μs instead of the 48–49 μs signals in the cheese packages, indicating O2 ingress had occurred. Comparing these results with DansensorTM data, we could conclude that the blank package had not sealed correctly.
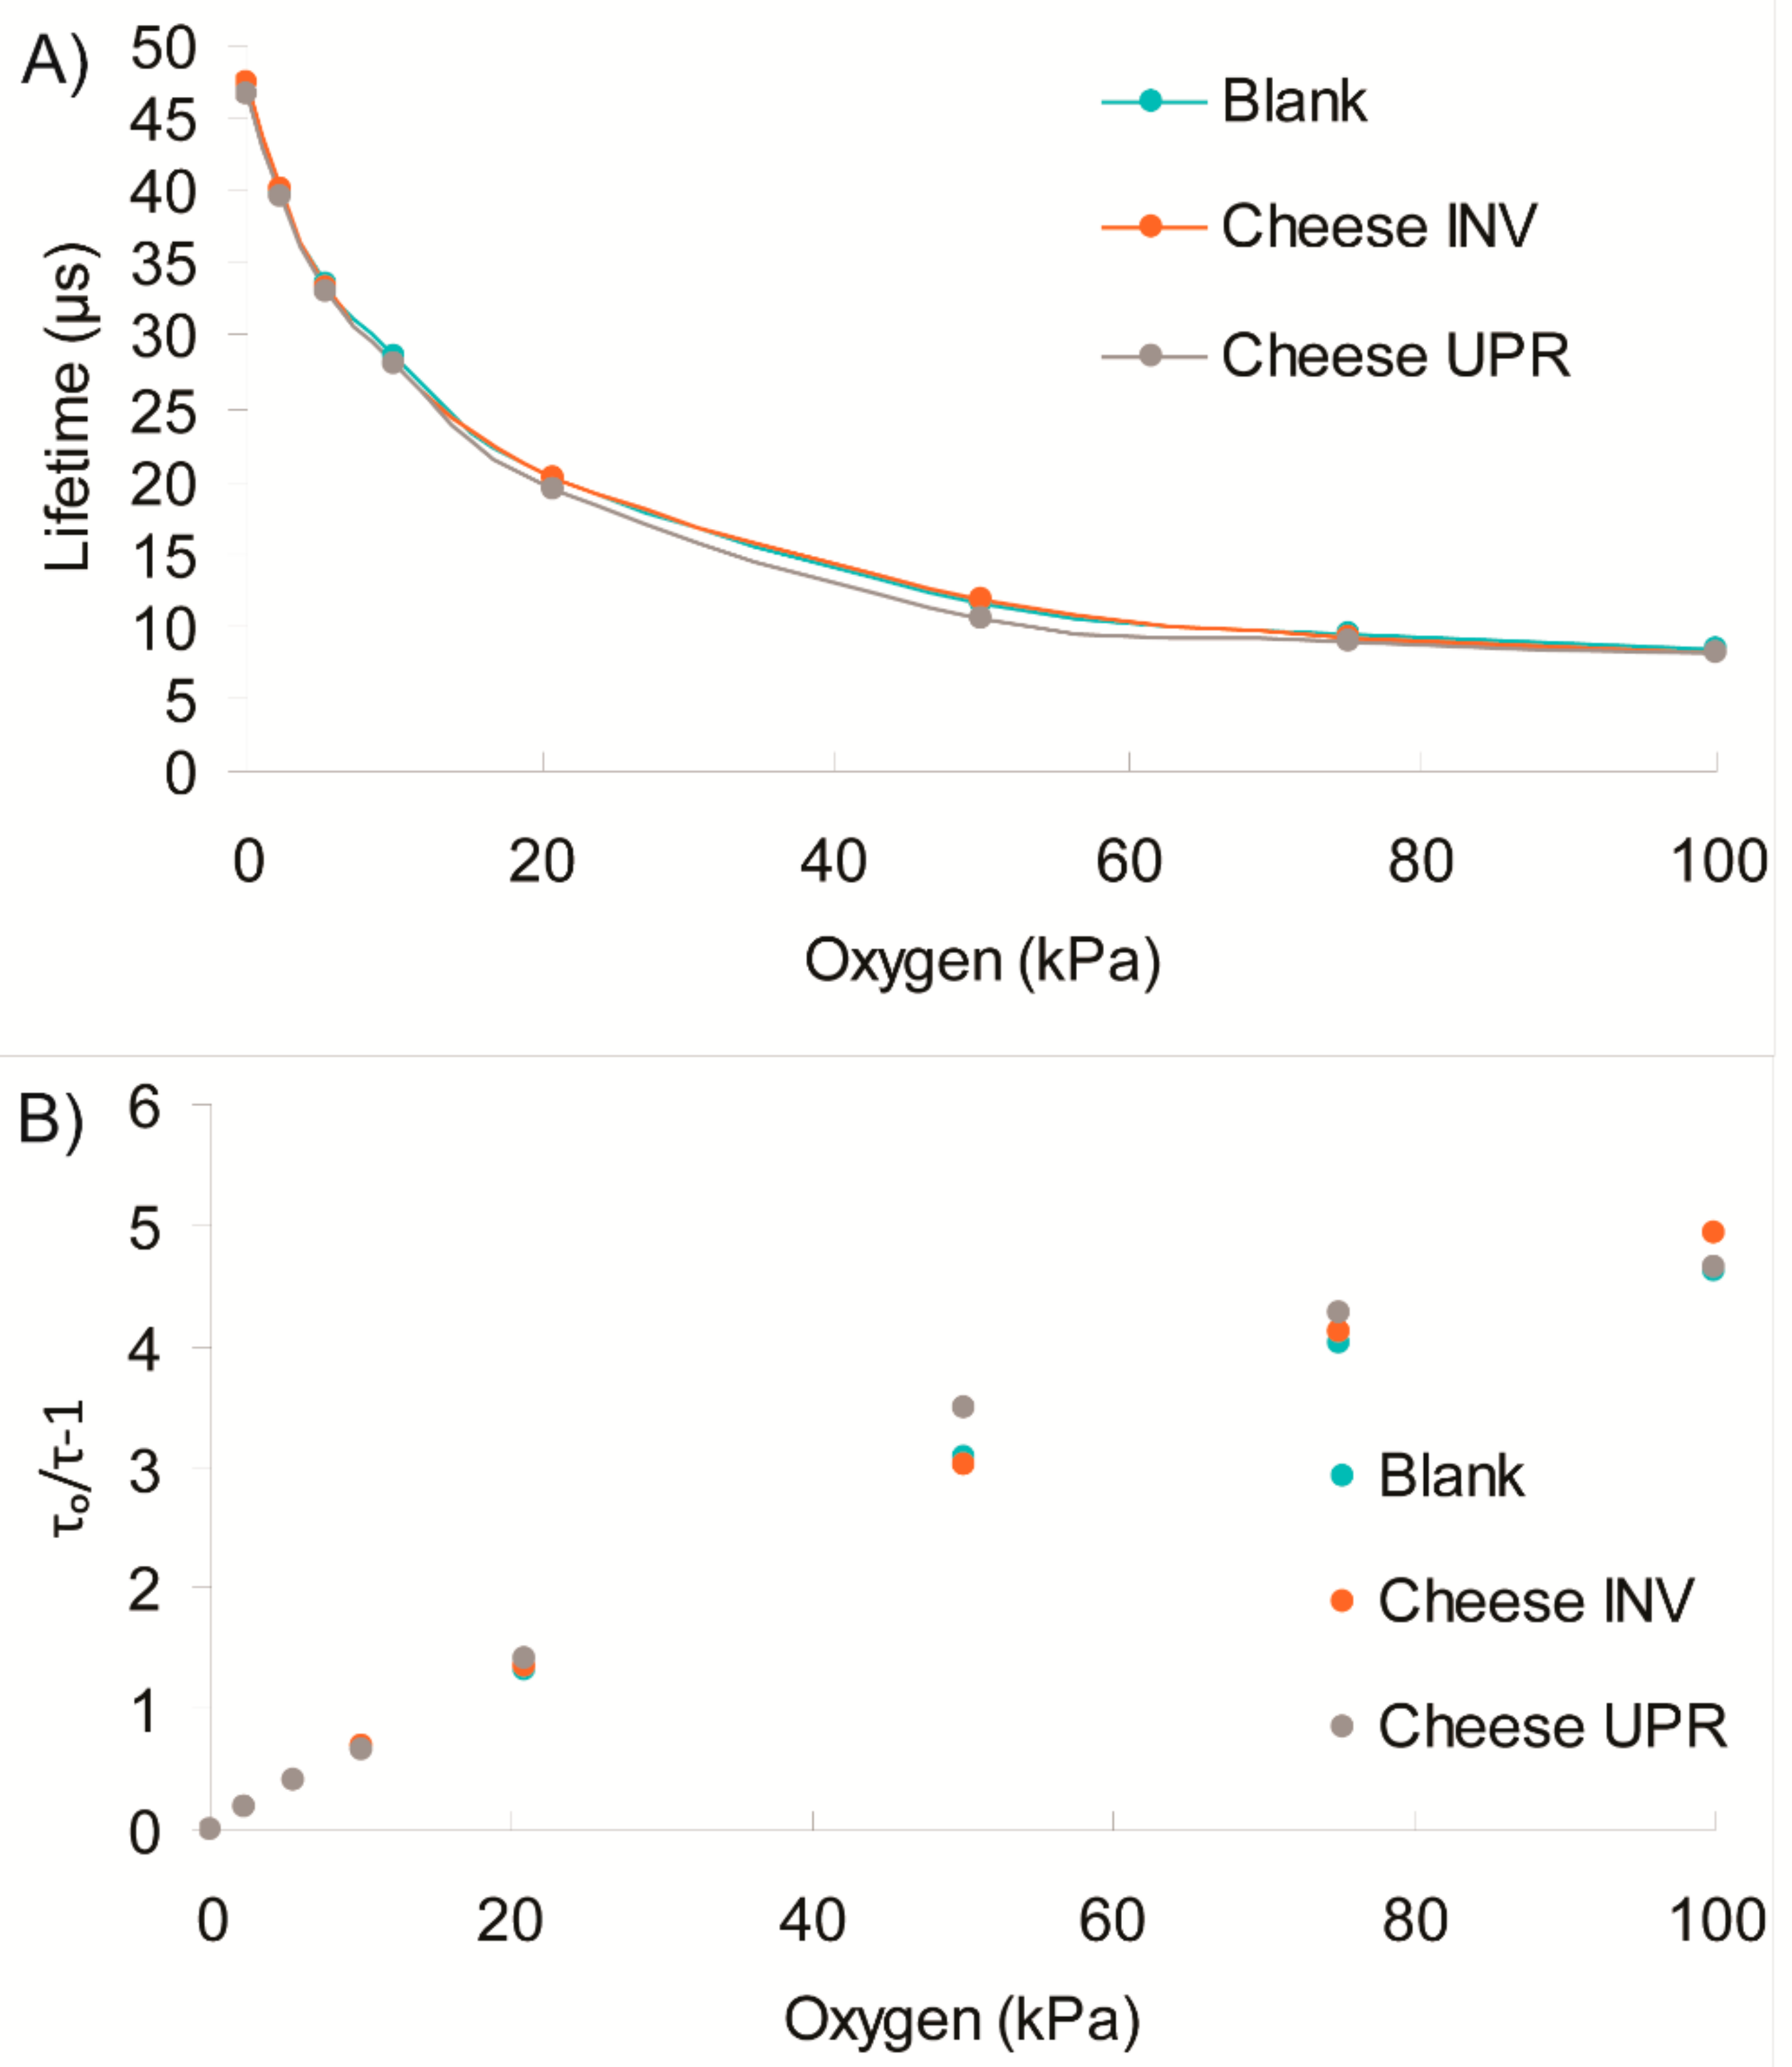
Upon removal from packages on Day 32, all the sensors were washed with water, dried overnight and then underwent full O2 calibration (0–100 kPa) in dry gas at 20 °C. As seen with the meat products, Type 2 sensors performed best. Figure 5 shows that their calibration remained almost unchanged after prolonged exposure to food product in MAP cheese packs. The Type 1 and 5 sensors showed more pronounced deviations from the original calibration—up to 1.2 µs and 1.8 µs, respectively. As before, no difference in response times was seen.
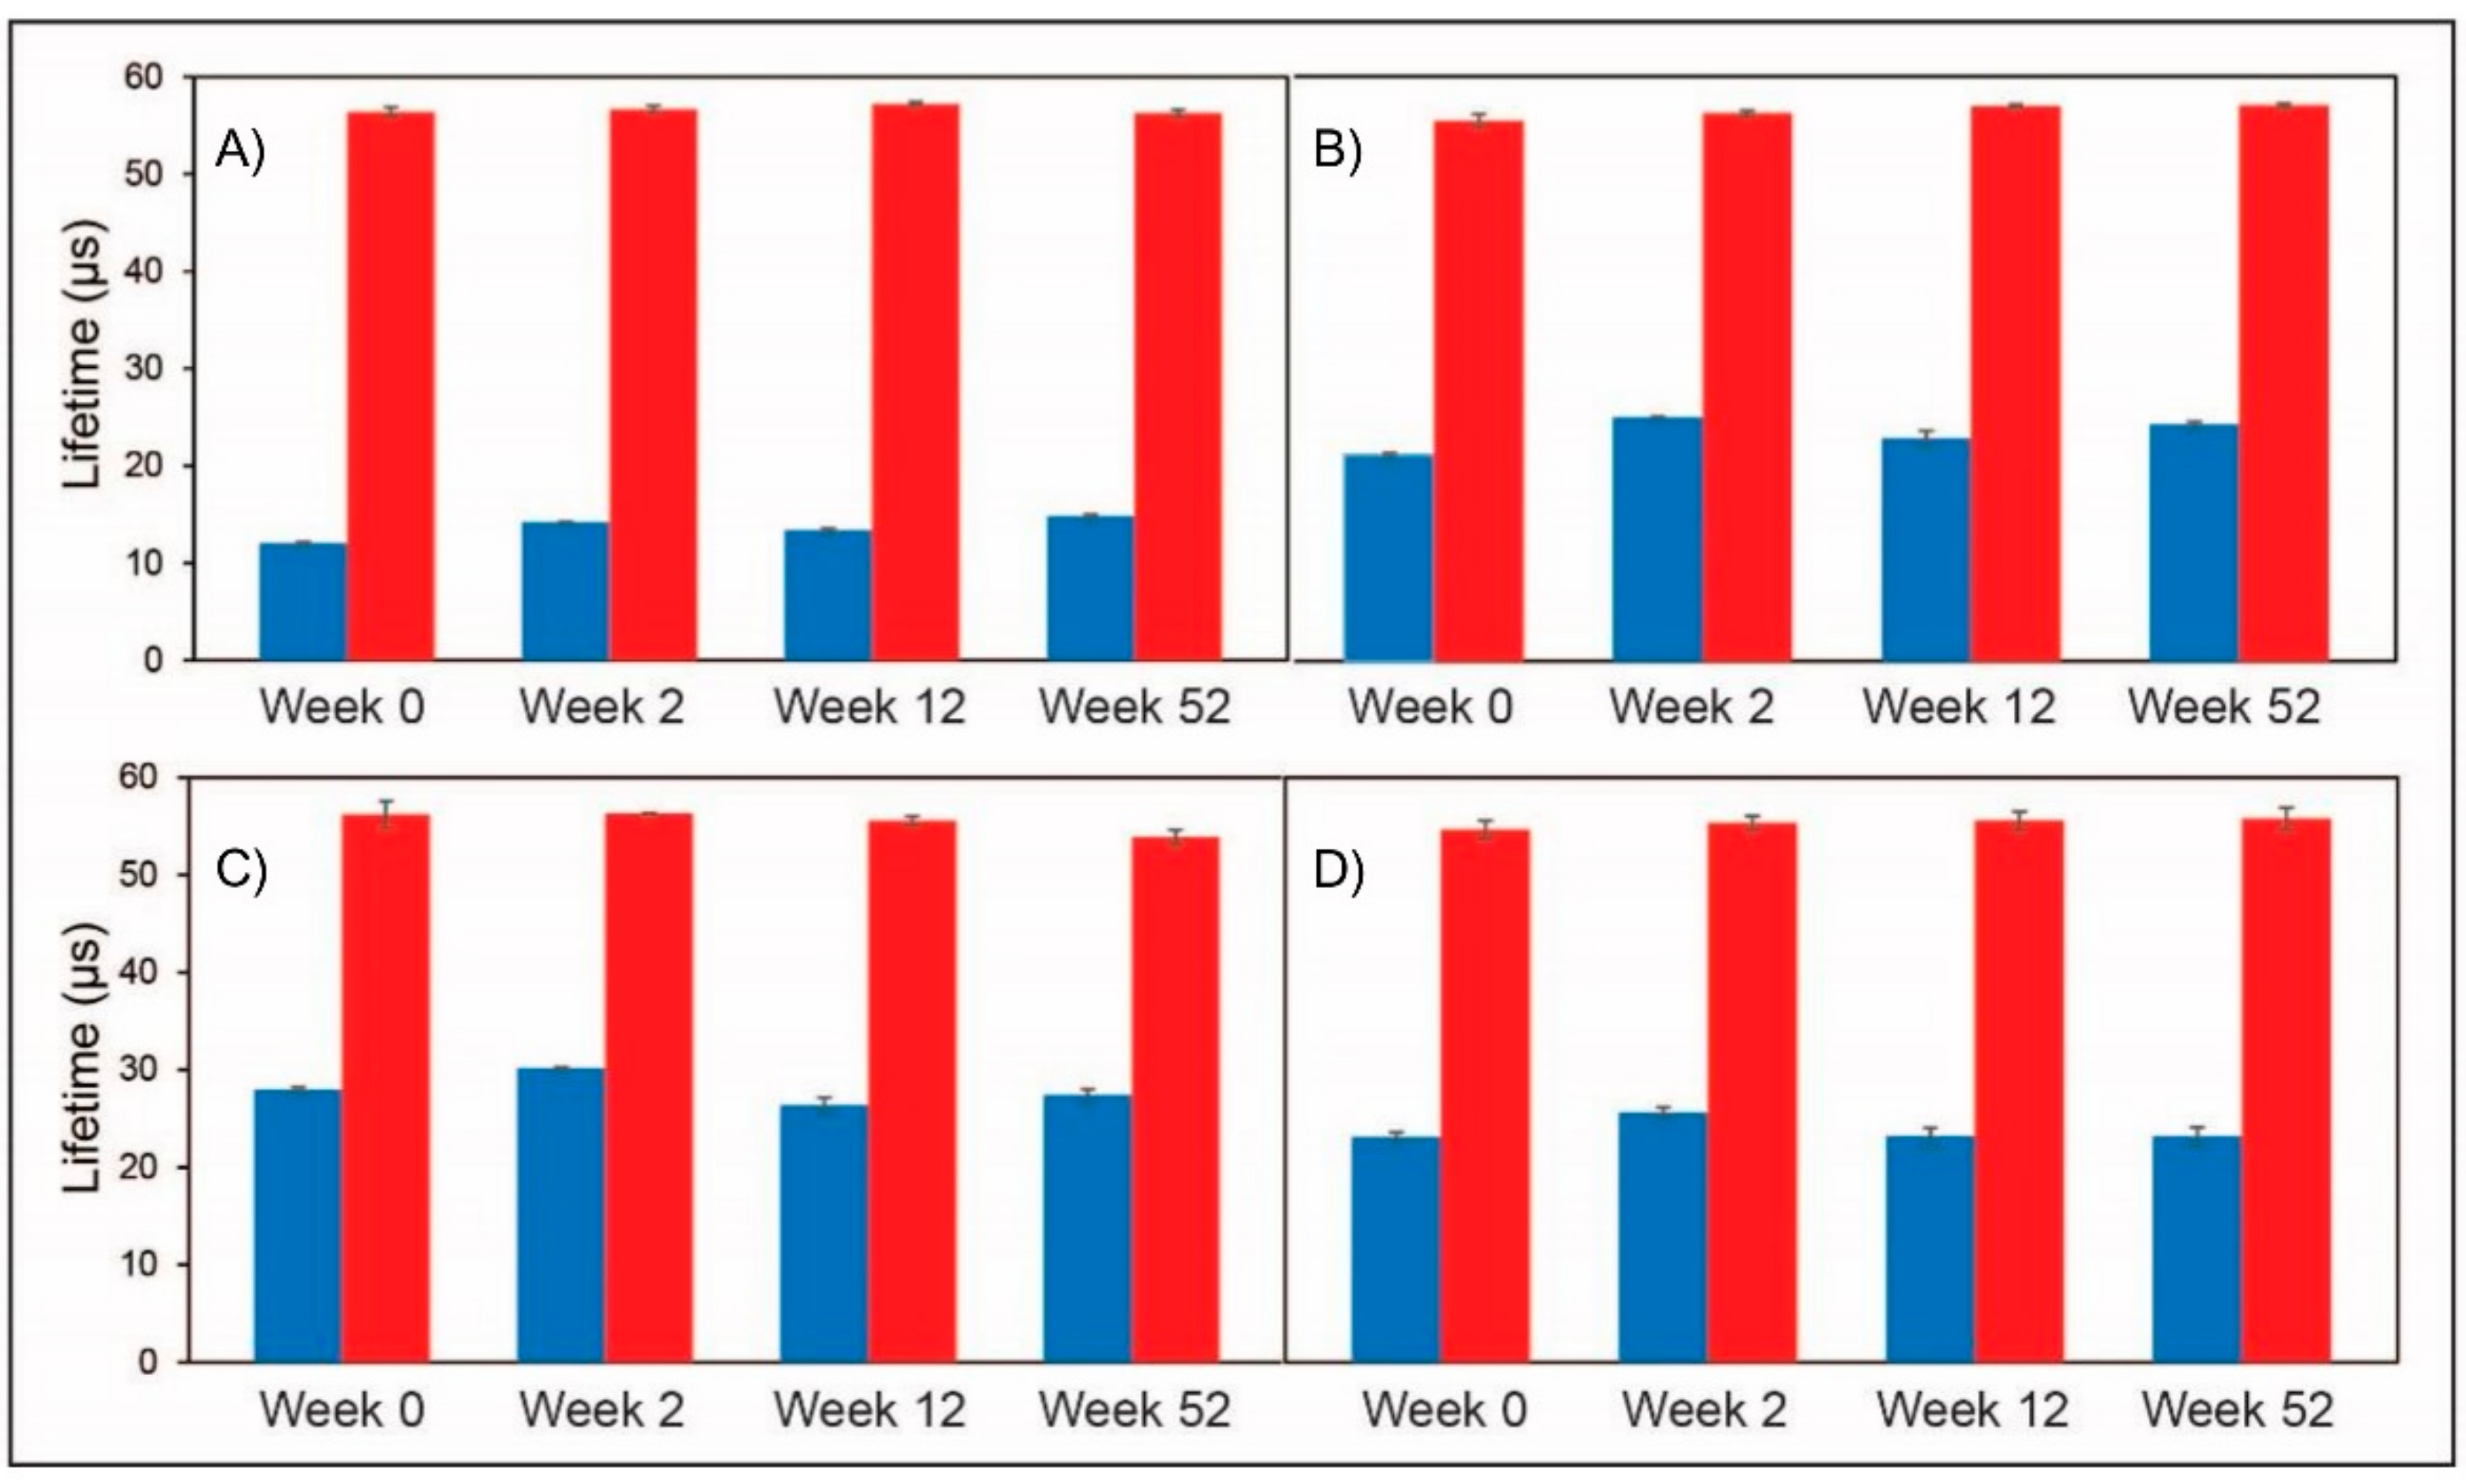
Finally, Types 1–4 sensors were assessed for potential ageing, upon their storage at ambient temperature in air atmosphere for 52 weeks (Figure 6). Again, the Type 2 sensors performed best; changes were less than 0.5 µs at 0 kPa over 12 months. The Type 1, 3 and 4 sensors showed somewhat greater deviations of up to 1–2 µs. The Type 1 sensor showed the lifetime signal increase incrementally over the 12 months from the one-month time-point while Type 3 and 4 sensors showed fluctuating lifetimes from two weeks onward culminating in a change in lifetime signal of greater than 2 µs overall at the 12 month time-point. Small variations in the signals at 21 kPa could be due to differing sites of measurement.
Overall, the PtBP based oxygen sensors studied here, particularly Type 2 sensors, demonstrated useful performance and working characteristics for their use in food packaging applications on disposable basis. Currently, they are better suited and validated for such applications than alternative sensor materials, such as those based on ruthenium dyes and mesoporous silica matrices [24,25].
4. Conclusions
Several new types of phosphorescence based O2 sensors based on PP fabric materials and PPS film were tested for their in standard food simulants, in direct contact with raw meat and cheese samples packaged under real-world MAP conditions and upon long-term storage under ambient conditions. The Type 2 sensor (based on ungrafted PP impregnated with PtBP dyes by soaking method [20]) exhibited the best stability out of all the sensors. It showed undetectable leaching of the dye in food simulants, very minor changes in lifetime signal and O2 calibration upon the exposure to MAP fresh red and chicken meat and cheddar cheese, and upon 52-week storage. The thin film nature and process ability of this material signifies that it could be a viable sensor solution for food packaging. Such sensors can be fabricated using simple and inexpensive raw materials and procedures, be integrated in individual packs by means of adhesion, heat-sealing or lamination which can further protect the sensor from contact with food juices and thus minimise sensor soakage and shifts in O2 calibration. The sensors show satisfactory performance upon direct exposure to food, with quasi-linear calibrations and robust operation over the whole O2 range of 0–100 kPa (or 0–100%). They can provide a viable alternative for the existing O2 sensors currently produced commercially and used in food packaging applications.
Author Contributions
Conceptualization, D.B.P. and J.P.K.; Methodology, D.B.P. and C.A.K; Validation, M.C.-R. and C.A.K.; Formal Analysis, C.A.K.; Resources, D.B.P. and J.P.K.; Data Curation, C.A.K.; Writing-Original Draft Preparation, C.A.K., D.B.P. and J.P.K.; Writing-Review & Editing, D.B.P.; Visualization, C.A.K.; Supervision, D.B.P. and J.P.K.; Project Administration, D.B.P.; Funding Acquisition, D.B.P.
Acknowledgments
Financial support of this work by the Irish Department of Agriculture, Food and Marine, grant DAFM/11/F/015, is gratefully acknowledged.
Conflicts of Interest
The authors declare no conflict of interest.
References
- Banerjee, S.; Kelly, C.; Kerry, J.P.; Papkovsky, D.B. High throughput non-destructive assessment of quality and safety of packaged food products using phosphorescent oxygen sensors. Trends Food Sci. Technol. 2016, 50, 85–102. [Google Scholar] [CrossRef] [Green Version]
- Smiddy, M.; Papkovsky, D.; Kerry, J. Evaluation of oxygen content in commercial modified atmosphere packs (MAP) of processed cooked meats. Food Res. Int. 2002, 35, 571–575. [Google Scholar] [CrossRef]
- Mohebi, E.; Marquez, L. Intelligent packaging in meat industry: An overview of existing solutions. J. Food Sci. Technol. 2015, 52, 3947–3964. [Google Scholar] [CrossRef] [PubMed]
- Ahvinainen, R. Novel Food Packaging Techniques; CRC Press: Boca Raton, FL, USA, 2003; p. 400. [Google Scholar]
- Marasca, E.; Greetham, D.; Herring, S.D.; Fisk, I.D. Impact of nitrogen flushing and oil choice on the progression of lipid oxidation in unwashed fried sliced potato crisps. Food Chem. 2016, 199, 81–86. [Google Scholar] [CrossRef] [PubMed]
- O’Callaghan, K.; Papkovsky, D.; Kerry, J. An Assessment of the Influence of the Industry Distribution Chain on the Oxygen Levels in Commercial Modified Atmosphere Packaged Cheddar Cheese Using Non-Destructive Oxygen Sensor Technology. Sensors 2016, 16, 916. [Google Scholar] [CrossRef] [PubMed]
- Papkovsky, D.B.; Smiddy, M.A.; Papkovskaia, N.Y.; Kerry, J.P. Nondestructive Measurement of Oxygen in Modified Atmosphere Packaged Hams Using a Phase-Fluorimetric Sensor System. J. Food Sci. 2002, 67, 3164–3169. [Google Scholar] [CrossRef]
- Cornforth, D.; Hunt, M. Low-oxygen packaging of fresh meat with carbon monoxide. AMSA White Paper Ser. 2008, 2, 1–12. [Google Scholar]
- Dansensor. Available online: http://dansensor.com/products/headspace-analysers (accessed on 30 June 2015).
- Hugi, A.; Voirol, E. Instrumental measurements and sensory parameters. In Instrumentation and Sensors for the Food Industry, 2nd ed.; Kress-Rogers, E., Brimelow, C.J.B., Eds.; Woodhead Publishing: Sawston, UK, 2001; pp. 31–60. [Google Scholar]
- Kress-Rogers, E. Instrumentation for food quality assurance. In Instrumentation and Sensors for the Food Industry, 2nd ed.; Kress-Rogers, E., Brimelow, C.J.B., Eds.; Woodhead Publishing: Sawston, UK, 2001; pp. 1–30. [Google Scholar]
- Ogurtsov, V.I.; Papkovsky, D.B. Selection of modulation frequency of excitation for luminescence lifetime-based oxygen sensors. Sens. Actuators B Chem. 1998, 51, 377–381. [Google Scholar] [CrossRef]
- Baleizão, C.; Nagl, S.; Schäferling, M.; Berberan-Santos, M.N.; Wolfbeis, O.S. Dual Fluorescence Sensor for Trace Oxygen and Temperature with Unmatched Range and Sensitivity. Anal. Chem. 2008, 80, 6449–6457. [Google Scholar] [CrossRef] [PubMed]
- Tian, Y.; Shumway, B.R.; Meldrum, D.R. A New Cross-Linkable Oxygen Sensor Covalently Bonded into Poly(2-hydroxyethyl methacrylate)-co-Polyacrylamide Thin Film for Dissolved Oxygen Sensing. Chem. Mater. 2010, 22, 2069–2078. [Google Scholar] [CrossRef] [PubMed]
- Quaranta, M.; Borisov, S.; Klimant, I. Indicators for optical oxygen sensors. Bioanal. Rev. 2012, 4, 115–157. [Google Scholar] [CrossRef] [PubMed] [Green Version]
- Wang, X.-D.; Wolfbeis, O.S. Optical methods for sensing and imaging oxygen: Materials, spectroscopies and applications. Chem. Soc. Rev. 2014, 43, 3666–3761. [Google Scholar] [CrossRef] [PubMed]
- Mills, A. Oxygen indicators and intelligent inks for packaging food. Chem. Soc. Rev. 2005, 34, 1003–1011. [Google Scholar] [CrossRef] [PubMed]
- Toncelli, C.; Arzhakova, O.V.; Dolgova, A.; Volynskii, A.L.; Bakeev, N.F.; Kerry, J.P.; Papkovsky, D.B. Oxygen-Sensitive Phosphorescent Nanomaterials Produced from High-Density Polyethylene Films by Local Solvent-Crazing. Anal. Chem. 2014, 86, 1917–1923. [Google Scholar] [CrossRef] [PubMed]
- Kelly, C.A.; Toncelli, C.; Cruz-Romero, M.; Arzhakova, O.V.; Kerry, J.P.; Papkovsky, D.B. Phosphorescent O2 sensors integrated in polymeric film materials by local solvent crazing. Mater. Des. 2015, 77, 110–113. [Google Scholar] [CrossRef]
- Kelly, C.A.; Toncelli, C.; Kerry, J.P.; Papkovsky, D.B. Phosphorescent O2 sensors based on polyolefin fabric materials. J. Mater. Chem. C 2014, 2, 2169–2174. [Google Scholar] [CrossRef]
- Kelly, C.A.; Toncelli, C.; Kerry, J.P.; Papkovsky, D.B. Discrete O2 sensors produced by a spotting method on polyolefin fabric substrates. Sens. Actuators B Chem. 2014, 203, 935–940. [Google Scholar] [CrossRef]
- MOCON. Available online: http://www.mocon.com/instruments/ox-tran-model-2-21.html (accessed on 25 June 2015).
- O’Riordan, T.C.; Voraberger, H.; Kerry, J.P.; Papkovsky, D.B. Study of migration of active components of phosphorescent oxygen sensors for food packaging applications. Anal. Chim. Acta 2005, 530, 135–141. [Google Scholar] [CrossRef]
- Bolivar, J.M.; Schelch, S.; Mayr, T.; Nidetzky, B. Mesoporous Silica Materials Labeled for Optical Oxygen Sensing and Their Application to Development of a Silica-Supported Oxidoreductase Biocatalyst. ACS Catal. 2015, 5, 5984–5993. [Google Scholar] [CrossRef]
- Zhang, H.; Lei, B.; Mai, W.; Liu, Y. Oxygen-sensing materials based on ruthenium(II) complex covalently assembled mesoporous MSU-3 silica. Sens. Actuators B Chem. 2011, 160, 677–683. [Google Scholar] [CrossRef]
Figure 1.
Photographs of O2 sensors inserted in sealed MAP: beef steak (A); chicken breast (B); and cheese (C) packages (shown in upright orientation).
Figure 1.
Photographs of O2 sensors inserted in sealed MAP: beef steak (A); chicken breast (B); and cheese (C) packages (shown in upright orientation).

Figure 2.
Lifetime values of sensors in: upright steak package (A); inverted steak package (B); upright chicken package (C); and inverted chicken package (D).
Figure 2.
Lifetime values of sensors in: upright steak package (A); inverted steak package (B); upright chicken package (C); and inverted chicken package (D).

Figure 3.
Changes in lifetime calibrations of: Type 2 (A); Type 1 (B); and Type 5 (C) sensors upon seven-day exposure to MAP meats. Measured at 20 °C in dry gas.
Figure 3.
Changes in lifetime calibrations of: Type 2 (A); Type 1 (B); and Type 5 (C) sensors upon seven-day exposure to MAP meats. Measured at 20 °C in dry gas.
Figure 4.
Changes in sensor lifetime signals in: Uupright (A); and inverted (B) cheese packages.
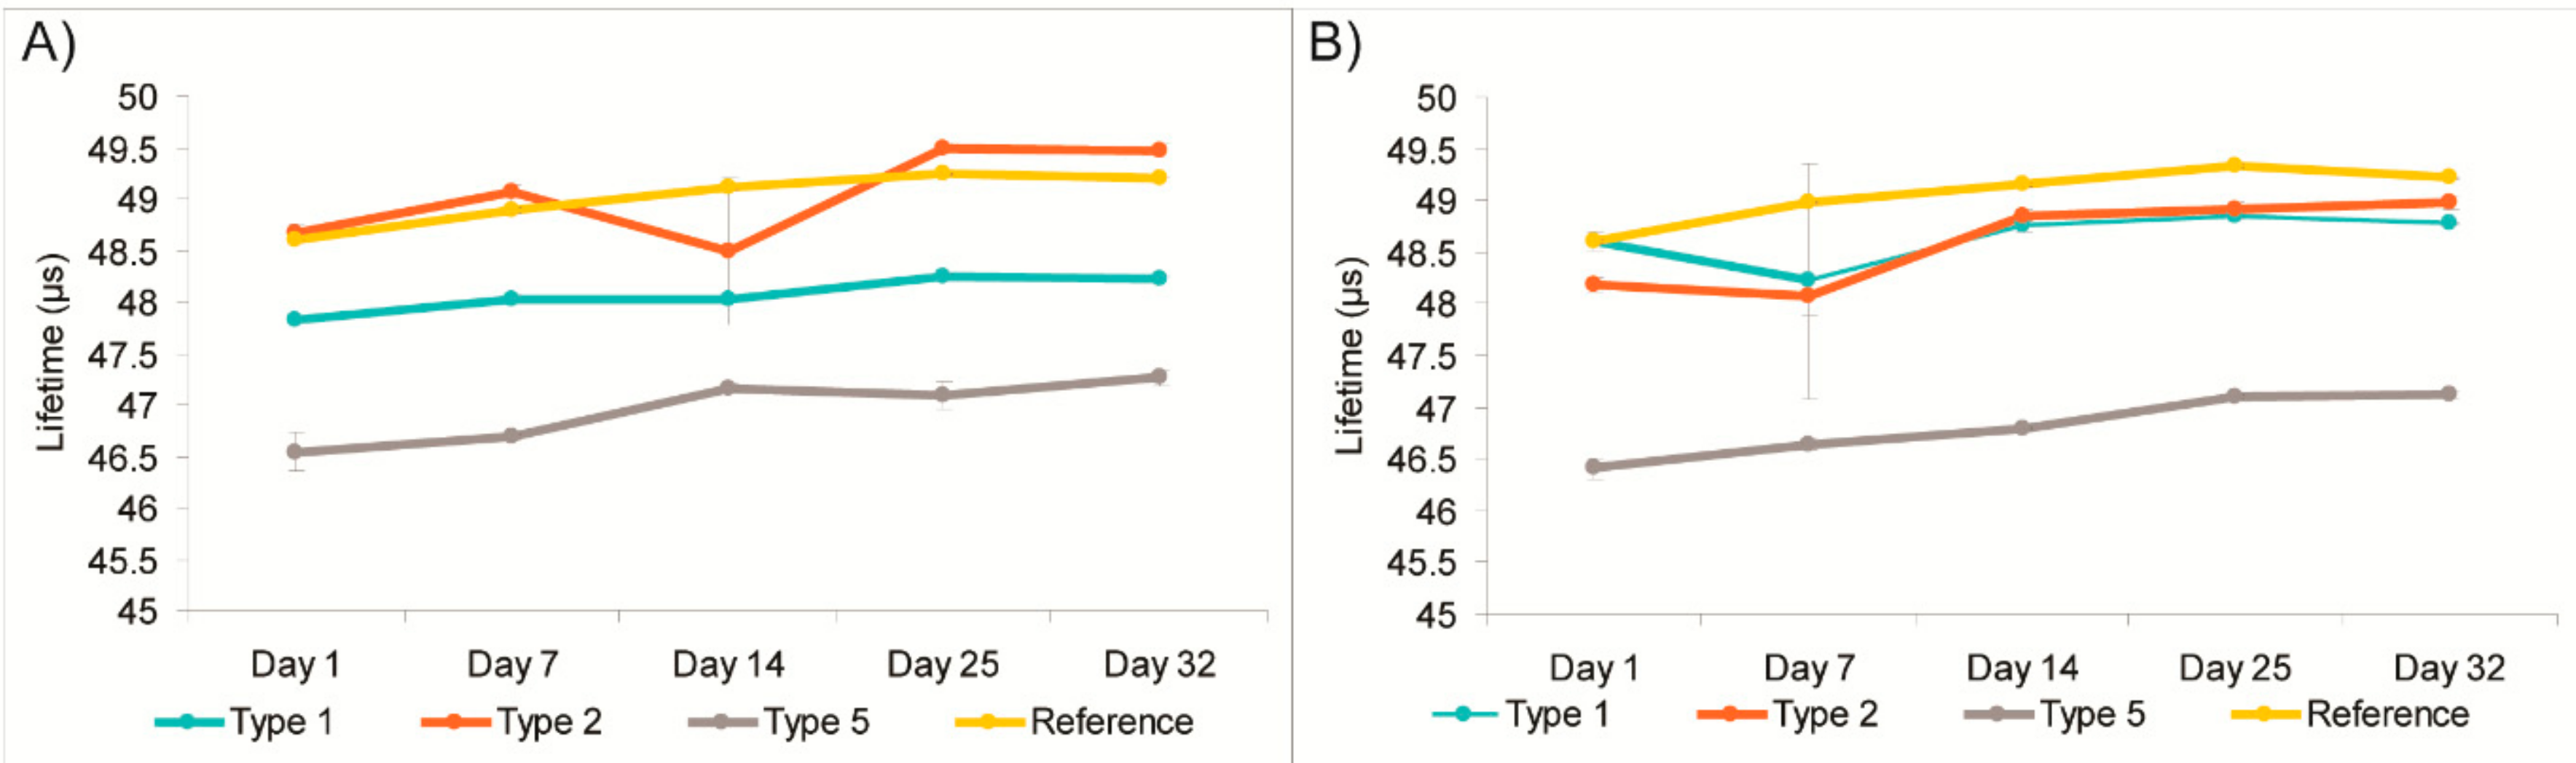
Figure 5.
Lifetime calibration curves (A); and corresponding Stern–Volmer plots (B) for Type 2 sensors after incorporation in cheese packs. Measured at 20 °C, 0–100 kPa dry O2 gas.
Figure 5.
Lifetime calibration curves (A); and corresponding Stern–Volmer plots (B) for Type 2 sensors after incorporation in cheese packs. Measured at 20 °C, 0–100 kPa dry O2 gas.
Figure 6.
Averaged lifetimes at 21 kPa O2 (blue) and 0 kPa O2 (red) for the: Type 1 (A); Type 2 (B); Type 3 (C); and Type 4 (D) sensors over the 52 weeks of storage time.
Figure 6.
Averaged lifetimes at 21 kPa O2 (blue) and 0 kPa O2 (red) for the: Type 1 (A); Type 2 (B); Type 3 (C); and Type 4 (D) sensors over the 52 weeks of storage time.

Table 1.
Description of the sensor materials tested in this study.
| O2 Sensor | Dye | Host Polymer | Fabrication Method | Reference |
|---|---|---|---|---|
| Type 1 | PtBP | Spunbond PP fabric, 130 μm thick, 17 μm porosity (Freudenberg). | Soaking | [20] |
| Type 2 | PtBP | Ungrafted PP fabric, 80 μm thick, 17 μm porosity (Freudenberg). | Soaking | [20] |
| Type 3 | PtBP | Spunbond PP fabric, 130 μm thick, 17 μm porosity (Freudenberg). | Spotting | [21] |
| Type 4 | PtBP | Wetlaid PP fabric, 160 μm thick, 18 μm porosity (Freudenberg). | Spotting | [21] |
| Type 5 | PtBP | PPS Fortron® Film, blown PPS, 127 μm thick, (CSHyde). | Spot-crazing | [19] |
| OptechTM sticker (reference) | PtBP | Undisclosed. Sensor mateiral is adhered to a thick paper sticker. | Undisclosed | [22] |
PP, poly(propylene); PPS, poly(phenylidenesulfide).
Table 2.
Leaching of PtBP dye from the different sensors in 95% ethanol.
| Sensor | Average Amount of Dye Per Sensor (μg) | Dye Leached Out of Sensor (%) |
|---|---|---|
| Type 1 | 5.7 | 36.31 |
| Type 2 | 0.4 | 38.46 |
| Type 3 | 2.0 | 24.50 |
| Type 4 | 2.0 | 12.00 |
| Type 5 | <4.0 | No detectable leaching |
Table 3.
O2 and CO2 levels in packs of MAP raw meat (beef and chicken) and cheese measured by DansensorTM (n = 2 for each reading).
Table 3.
O2 and CO2 levels in packs of MAP raw meat (beef and chicken) and cheese measured by DansensorTM (n = 2 for each reading).
| Sample | After Sealing on Day 0 (%) | After 7 Days of Storage at 4 °C (%) | ||
|---|---|---|---|---|
| O2 | CO2 | O2 | CO2 | |
| Meat samples a | ||||
| Blank, no beef | 55.30 ± 0.00 | 40.90 ± 0.07 | 55.40 ± 0.00 | 40.50 ± 0.07 |
| Beef upright | 55.30 ± 0.00 | 40.90 ± 0.00 | 54.30 ± 0.00 | 41.40 ± 0.07 |
| Beef inverted | 55.30 ± 0.00 | 41.20 ± 0.00 | 54.30 ± 0.00 | 41.50 ± 0.07 |
| Chicken upright | 0.10 ± 0.02 | 41.00 ± 0.02 | 0.03 ± 0.07 | 36.00 ± 0.07 |
| Chicken inverted | 0.09 ± 0.02 | 41.40 ± 0.00 | 0.00 ± 0.07 | 35.80 ± 0.07 |
| Cheese samples b | ||||
| Blank, no cheese | 0.14 ± 0.00 | 32.70 ± 0.01 | 1.22 ± 0.00 | 28.40 ± 0.00 |
| Cheese upright | 0.09 ± 0.00 | 32.70 ± 0.00 | 0.02 ± 0.00 | 16.70 ± 0.00 |
| Cheese inverted | 0.10 ± 0.00 | 32.60 ± 0.00 | 0.02 ± 0.07 | 20.10 ± 0.14 |
a Beef samples were stored seven days at +4 °C; b Cheese samples were stored 32 days at 4 °C.
© 2018 by the authors. Licensee MDPI, Basel, Switzerland. This article is an open access article distributed under the terms and conditions of the Creative Commons Attribution (CC BY) license (http://creativecommons.org/licenses/by/4.0/).
Share and Cite
MDPI and ACS Style
Kelly, C.A.; Cruz-Romero, M.; Kerry, J.P.; Papkovsky, D.B. Stability and Safety Assessment of Phosphorescent Oxygen Sensors for Use in Food Packaging Applications. Chemosensors 2018, 6, 38. https://doi.org/10.3390/chemosensors6030038
AMA Style
Kelly CA, Cruz-Romero M, Kerry JP, Papkovsky DB. Stability and Safety Assessment of Phosphorescent Oxygen Sensors for Use in Food Packaging Applications. Chemosensors. 2018; 6(3):38. https://doi.org/10.3390/chemosensors6030038
Chicago/Turabian StyleKelly, Caroline A., Malco Cruz-Romero, Joseph P. Kerry, and Dmitri B. Papkovsky. 2018. "Stability and Safety Assessment of Phosphorescent Oxygen Sensors for Use in Food Packaging Applications" Chemosensors 6, no. 3: 38. https://doi.org/10.3390/chemosensors6030038
Note that from the first issue of 2016, this journal uses article numbers instead of page numbers. See further details here.