Article

Detecting Fingerprints of Waterborne Bacteria on a Sensor

1
Department of Chemistry, Hacettepe University, 06800 Ankara, Turkey
2
Department of Biology, Hacettepe University, 06800 Ankara, Turkey
*
Author to whom correspondence should be addressed.
Chemosensors 2019, 7(3), 33; https://doi.org/10.3390/chemosensors7030033
Submission received: 27 June 2019 / Revised: 18 July 2019 / Accepted: 23 July 2019 / Published: 25 July 2019
(This article belongs to the Collection Optical Chemosensors and Biosensors)

Abstract

:
Human fecal contamination is a crucial threat that results in difficulties in access to clean water. Enterococcus faecalis is a bacteria which is utilized as an indicator in polluted water. Nevertheless, existing strategies face several challenges, including low affinity and the need for labelling, which limit their access to large scale applications. Herein, a label-free fingerprint of the surface proteins of waterborne bacteria on a sensor was demonstrated for real-time bacteria detection from aqueous and water samples. The kinetic performance of the sensor was evaluated and shown to have a range of detection that spanned five orders of magnitude, having a low detection limit (3.4 × 10⁴ cfu/mL) and a high correlation coefficient (R2 = 0.9957). The sensor also designated a high selectivity while other competitor bacteria were employed. The capability for multiple usage and long shelf-life are superior to other modalities. This is an impressive surface modification method that uses the target itself as a recognition element, ensuring a broad range of variability to replicate others with different structure, size and physical and chemical properties.

1. Introduction

Microorganisms can be found and survive in various sources including food, water, soil and bodies of human or animals [1]. Pollution of water resources, such as rivers, sea and wastewater, as well as drinking water, causes worries about public health and control of recreational uses. After mixing sewage in the receiving water environment, pollutants, as well as pathogenic bacteria and viruses associated with feces, are the main concerns that exposure to vulnerability will cause [2]. In many countries, low water quality and difficulty in access to clean drinking water continue to pose a significant risk to public health. Pathogen microorganisms that cause waterborne diseases are found in surface or drinking water and reduce water quality [3]. Enterococcus faecalis (E. faecalis) is an indicator of bacteria for fecal pollution in water [4]. Many virulence factors, such as aggregation substance (Agg), enterococcal surface protein (Esp) and capsule formation, are involved in biofilm formation in bacterial adherence to host cells in abiotic surfaces in different environments [5,6]. Existing methods used for the detection of microorganisms for many years including traditional culture methods [7], advanced immunological techniques, such as enzyme-linked immunosorbent assay [8,9,10], and polymerase chain reaction [11,12]. The traditional culture methods are cumbrous and laborious, although trustworthy [13]. In this case, thanks to many advantages, sensors are one of the good alternatives. They provide a simple, cost-effective alternative to conventional methods for the detection of a target in short analysis time [14]. To date, a variety of sensors for the detection of several molecules have been demonstrated [15,16,17,18,19,20].
The methods used for detection should have recognition sites with high specificity, selectivity and sensitivity [21]. The molecular imprinting method, which is based on the fingerprint of the target molecule, and polymeric matrices have particular recognition sites due to polymerization around a target molecule. The specific cavities are obtained for a target molecule when the target is removed from the polymeric matrices [22,23]. Basically, this method follows these steps: The monomers interact with the target molecule to obtain a pre-complex, then radical polymerization is initiated and the substrate is washed carefully to remove the target molecules from the polymeric matrices. This step allows the creation of a scaffold that perfectly envelops and places a predetermined target [24]. This method works well with small molecules, but is difficult for larger molecules, such as proteins, because of their solubility, complexity and conformational flexibility. However, it is possible to prepare protein-imprinted nanoparticles or films for sensor and other numerous applications. Easy approaches, such as epitope or surface imprinting, metal-ion coordination or biological and non-toxic and biocompatible polymers, are used [25]. This technique is similar to antigen recognition by the antibody, in which an “epitope” of the immunogenic protein is the binding site of the antibody, rather than the whole protein. Large imprinted areas can be seen as common nanopores that may interfere with a number of other small peptides, which may inhibit the imprinting effect in general, therefore reducing selectivity [26].
Surface plasmon resonance sensors, one of the optical sensors, use surface plasmon waves to investigate molecular interactions on the sensor surface. The change of refractive index is measured by the sensor using a detection surface coated with a metal film [27]. These optical sensors offer an unlabeled, real-time, fast and precise method of analysis, while at the same time the sample and buffer amounts are minimized. This method has been widely used to obtain binding specificity between two molecules, the concentration of a target molecule, the binding affinity, the kinetic parameters, cell adhesion, etc. [28].
Herein, a fingerprint sensor was developed to create artificial recognition sites for waterborne bacteria detection. A bacterial surface protein was extracted from E. faecalis and then imprinted on the nanoparticles. After that, these nanoparticles were used to modify the sensor surface to selectively detect waterborne bacteria. Kinetic analyses, selectivity and repeatability performances of the sensor were examined for real-time detection of E. faecalis. Furthermore, the fingerprint sensor was also validated with water samples.

2. Materials and Methods

2.1. Materials

Enterococcus faecalis (29212™), Escherichia coli (11303™), Staphylococcus aureus (14990™) and Bacillus subtilis (6051™) were obtained from American Type Culture Collection. Phosphate buffered saline, Luria Bertani and Trypticase Soy Broth were purchased from Fisher Scientific Co. and Pronadisa. Other chemicals were obtained from Sigma-Aldrich Corporation. The gold coated surfaces were purchased from GWC Technologies.

2.2. Preparation of Bacteria

The target molecule (E. faecalis) and other competitor bacteria were grown in Luria Bertani and Trypticase Soy Broth medium. Incubation was carried out under static conditions at 37 °C for 18 h. The concentrations of each sample were calculated as colony forming units per mL (cfu/mL). Then, 1 mL of each sample was centrifuged at 6000 rpm and the pellet was re-suspended with pH 7.4 phosphate buffered saline (PBS). Bacterial suspensions were prepared with PBS and used for the benchmarking kinetic analyses of the sensor.

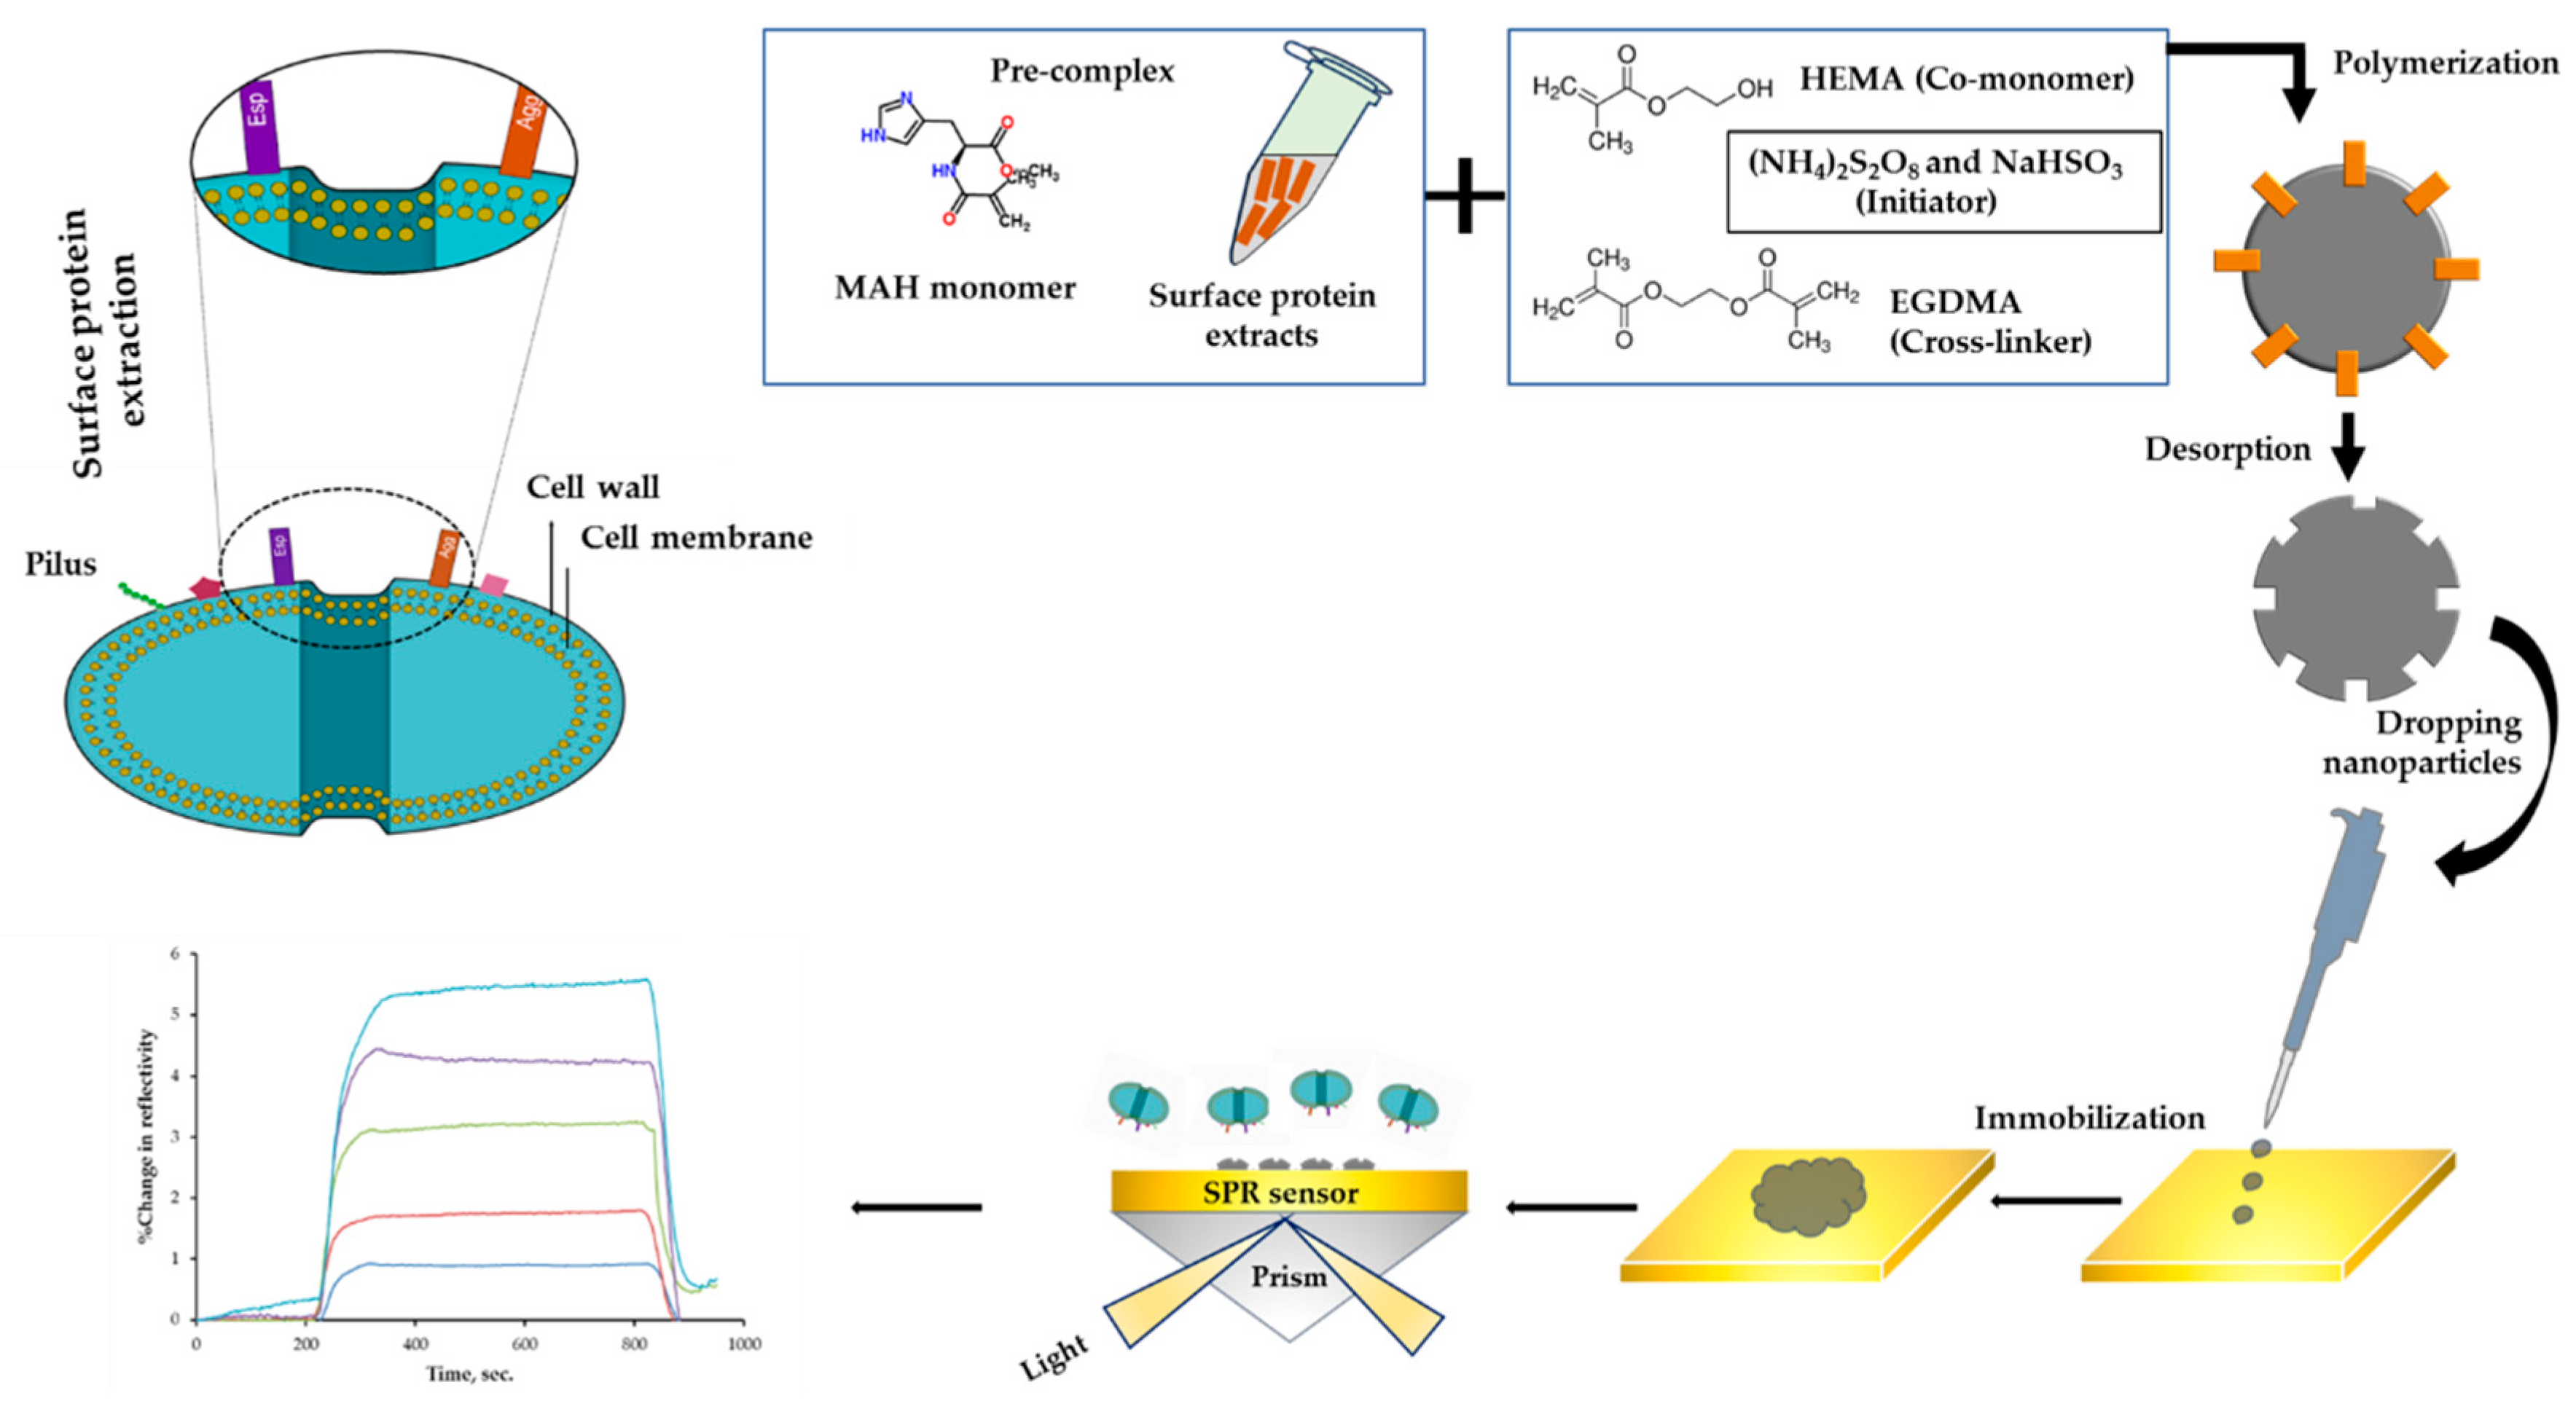
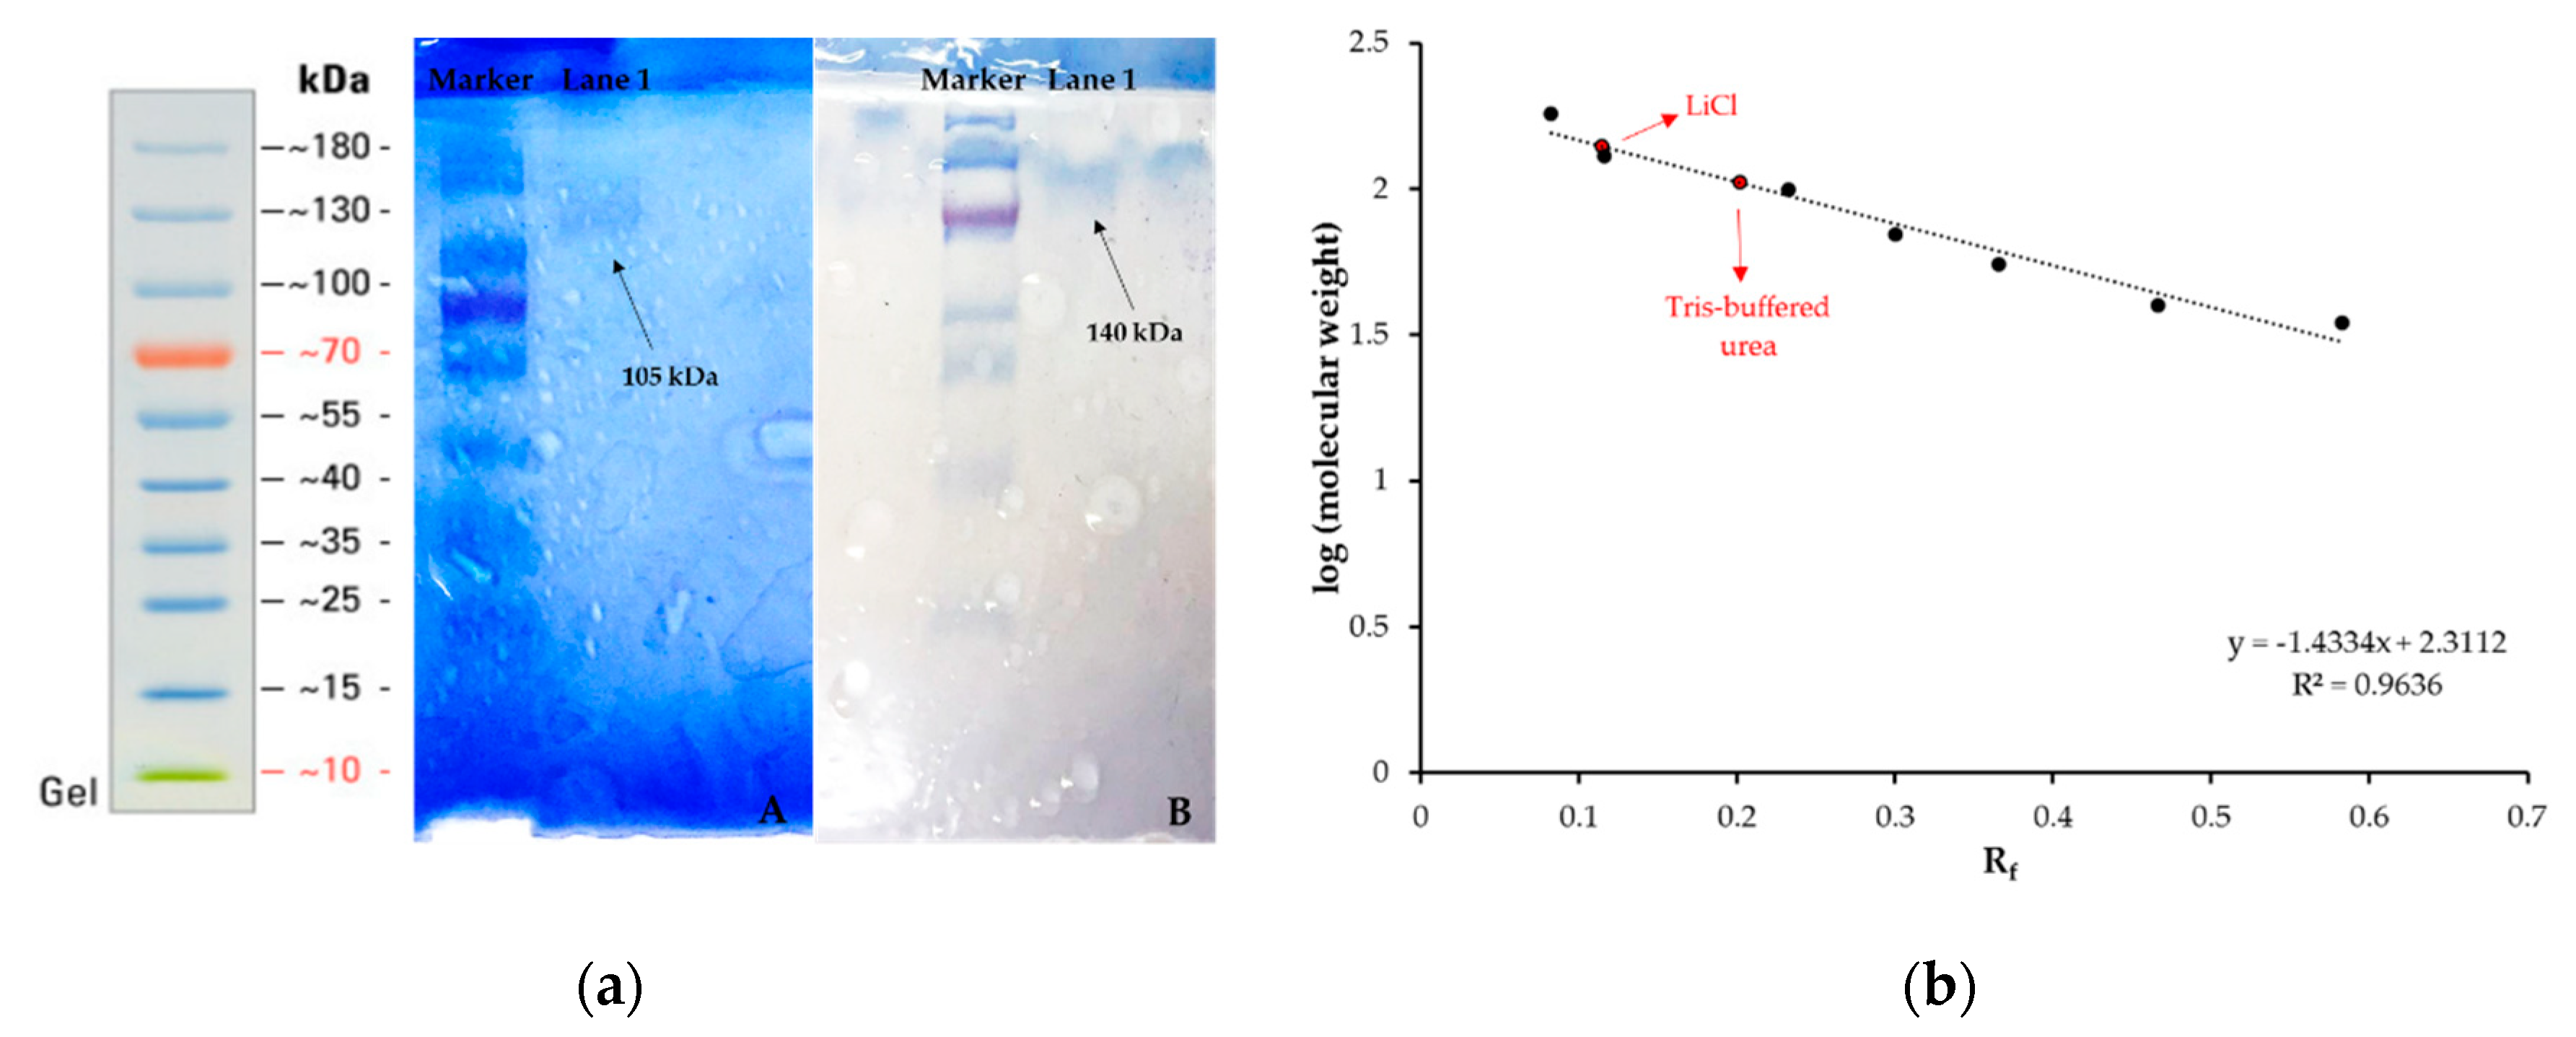
2.3. Preparation and Characterization of Surface Proteins

Two different extraction methods were applied to cells: Lithium chloride extraction and Tris-buffered urea [23] extraction. Overnight cells from 50 mL of culture were centrifugated (7000 rpm, 6 min) and afterwards washed three times with PBS buffer. A lithium chloride (LiCl) extraction method has been used in previous studies to isolate surface proteins from Gram-positive bacteria [29,30]. LiCl (5 M) was dissolved in ultrapure water and filtered through a 0.45 μm filter. Washed cell pellets were re-suspended in 300 μL LiCl. After incubation at 37 °C (500 rpm, 1 h), the mixture was centrifuged at 11,000 rpm for 6 min and the supernatant was collected by centrifugation and then filtered again. Another extraction protocol was used to extract membrane anchored surface proteins. The cell pellet was re-suspended in 150 μL of Tris-buffered urea (8 M) solution. After incubation at room temperature (500 rpm, 1 h) the supernatant containing solubilized proteins was collected by centrifugation and filtered using the same conditions.
Sodium dodecyl sulfate–polyacrylamide gel electrophoresis (SDS-PAGE) was performed with separation gel (10%) and the stacking gel (5%). After polymerization, 10 μL of each sample was loaded on the gel. Electrophoresis was performed at 120 kV for 45 min. Thermo Scientific Page Ruler™—26,616 (10–180 kDa) was used as the molecular weight standard. After electrophoresis, the gel was stained with Coomasie Brillant Blue dye for 24 h at room temperature and washed several times to remove excessive dye.

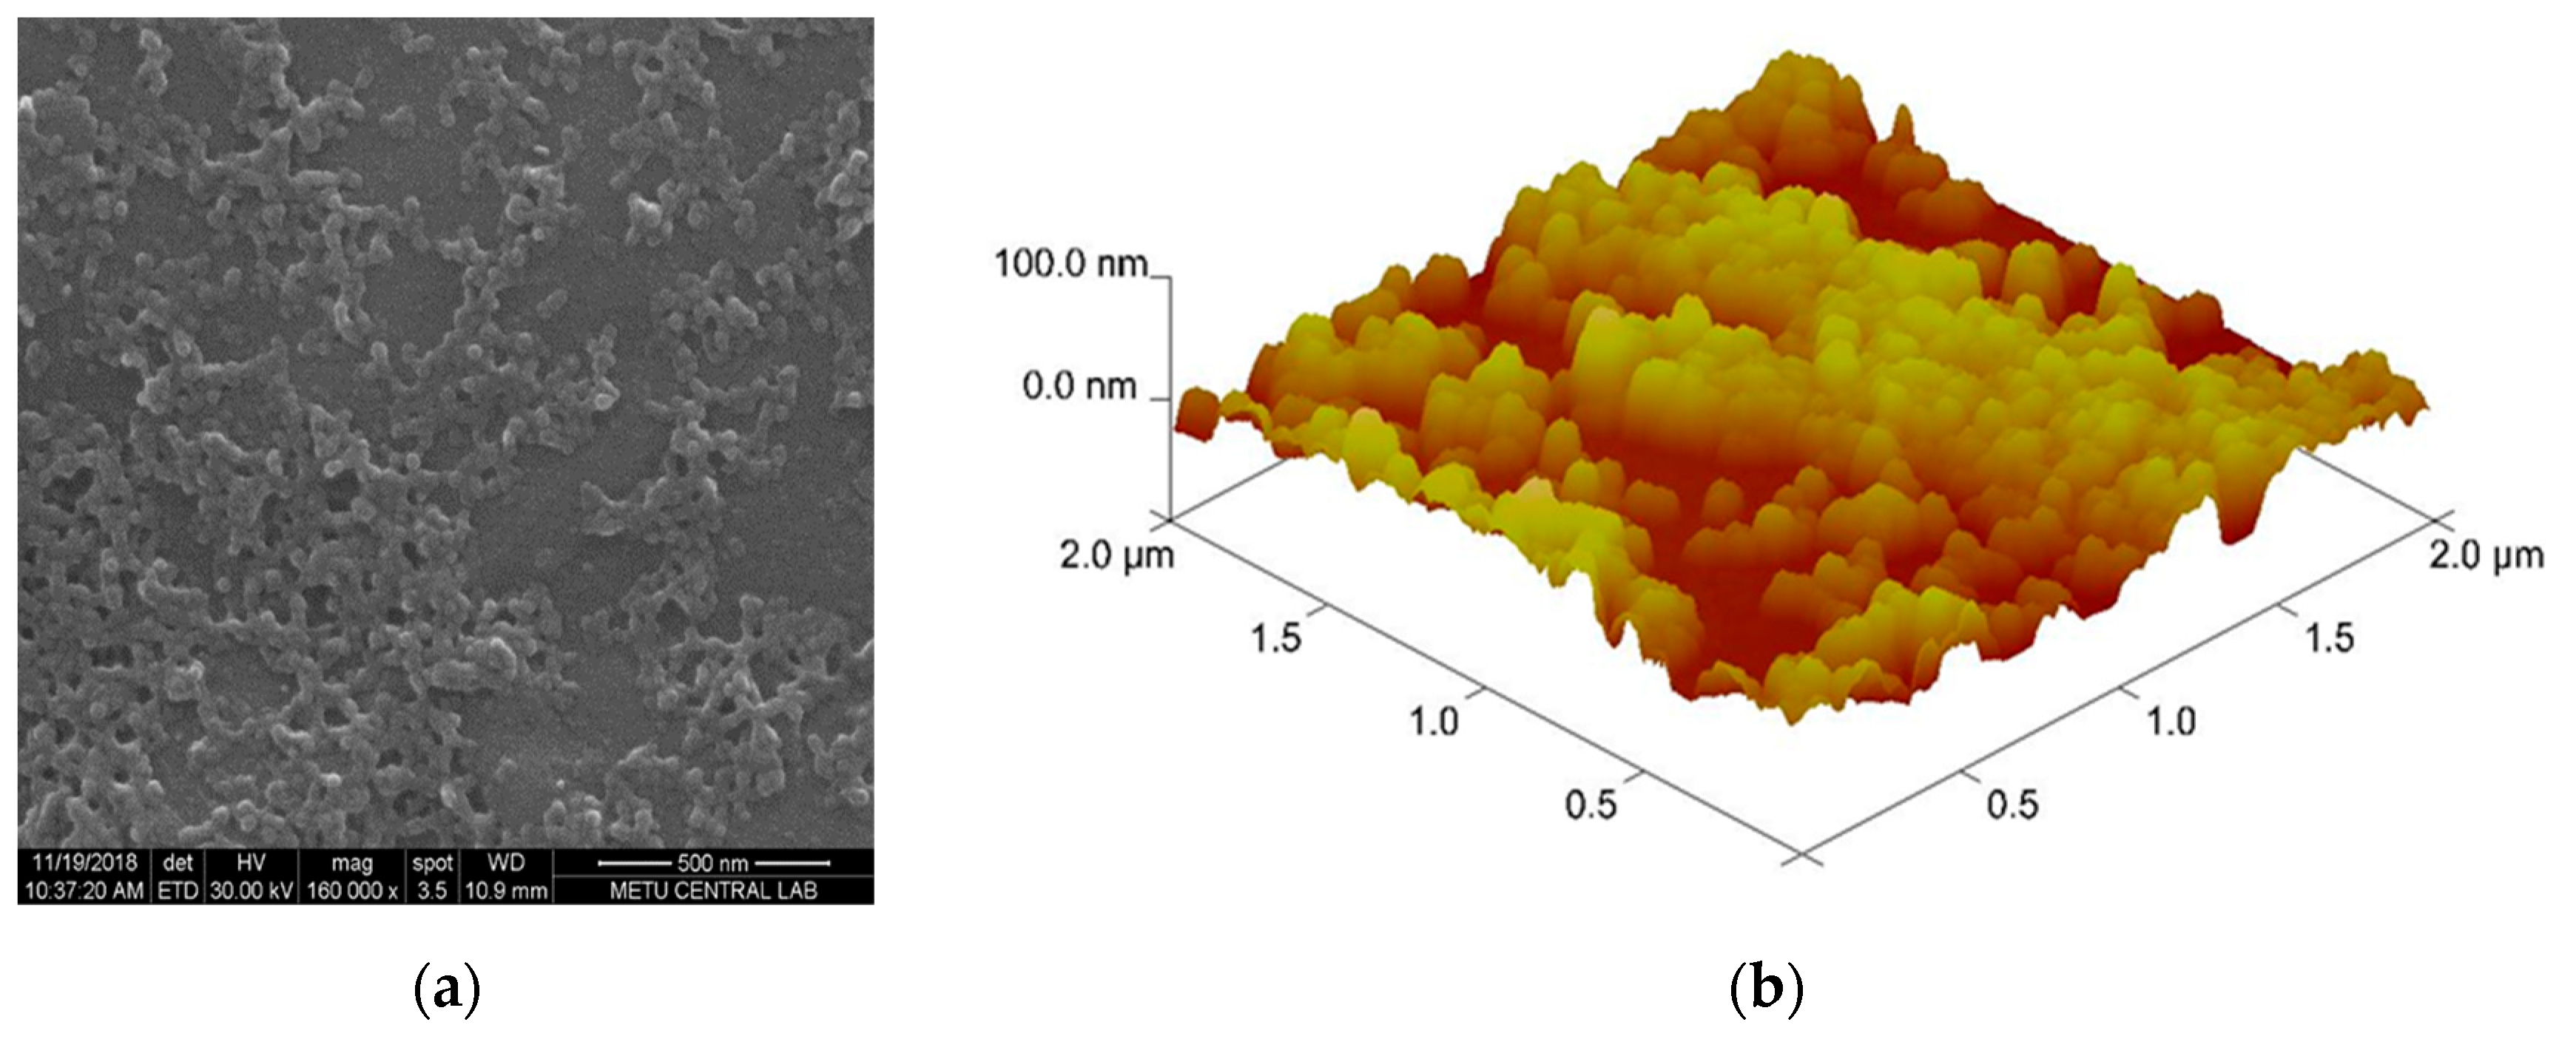
2.4. Preparation and Characterization of Nanoparticles

N-methacryloyl-(L)-histidine-methyl ester was selected as a monomer and E. faecalis surface protein extracts were used as a target molecule and mixed to form a pre-complex for polymerization. A micro-emulsion method was used to prepare the nanoparticles. Poly(vinyl alcohol) and sodium dodecyl sulfate were used as a stabilizer and surfactant, respectively, to form an emulsion. Sodium bicarbonate was employed as an agent. Ethylene glycol dimethacrylate and 2-hydroxyethyl methacrylate acted as a cross-linker and co-monomer, respectively, and were mixed with the first solution and then homogenized to obtain a micro-emulsion. The pre-complex was added to the mixture. Sodium bisulfite and ammonium persulfate were also added to the final mixture as initiators, and polymerization was carried out at 40 °C and 500 rpm for 24 h. After polymerization, the nanoparticles were washed with ethanol, water-ethanol mixture and water using centrifugation at 30,000 rpm (Allegra-64R Beckman Coulter, Indianapolis, IN, USA). Then, 0.1 M NaCl solution was applied as a desorption agent. The desorption process was continued until no absorbance was observed at 600 nm by UV-visible spectrophotometry [31]. Characterization experiments were performed by scanning electron microscopy (SEM, Quanta 400F Field Emission), atomic force microscopy (AFM, Veeco MultiMode V, AS-12 “E”), transmission electron microscopy (TEM, FEI/Tecnai G2 Spirit Biotwin) and zeta-size (Nano-ZS, Malvern Instrument Company, Malvern, UK).

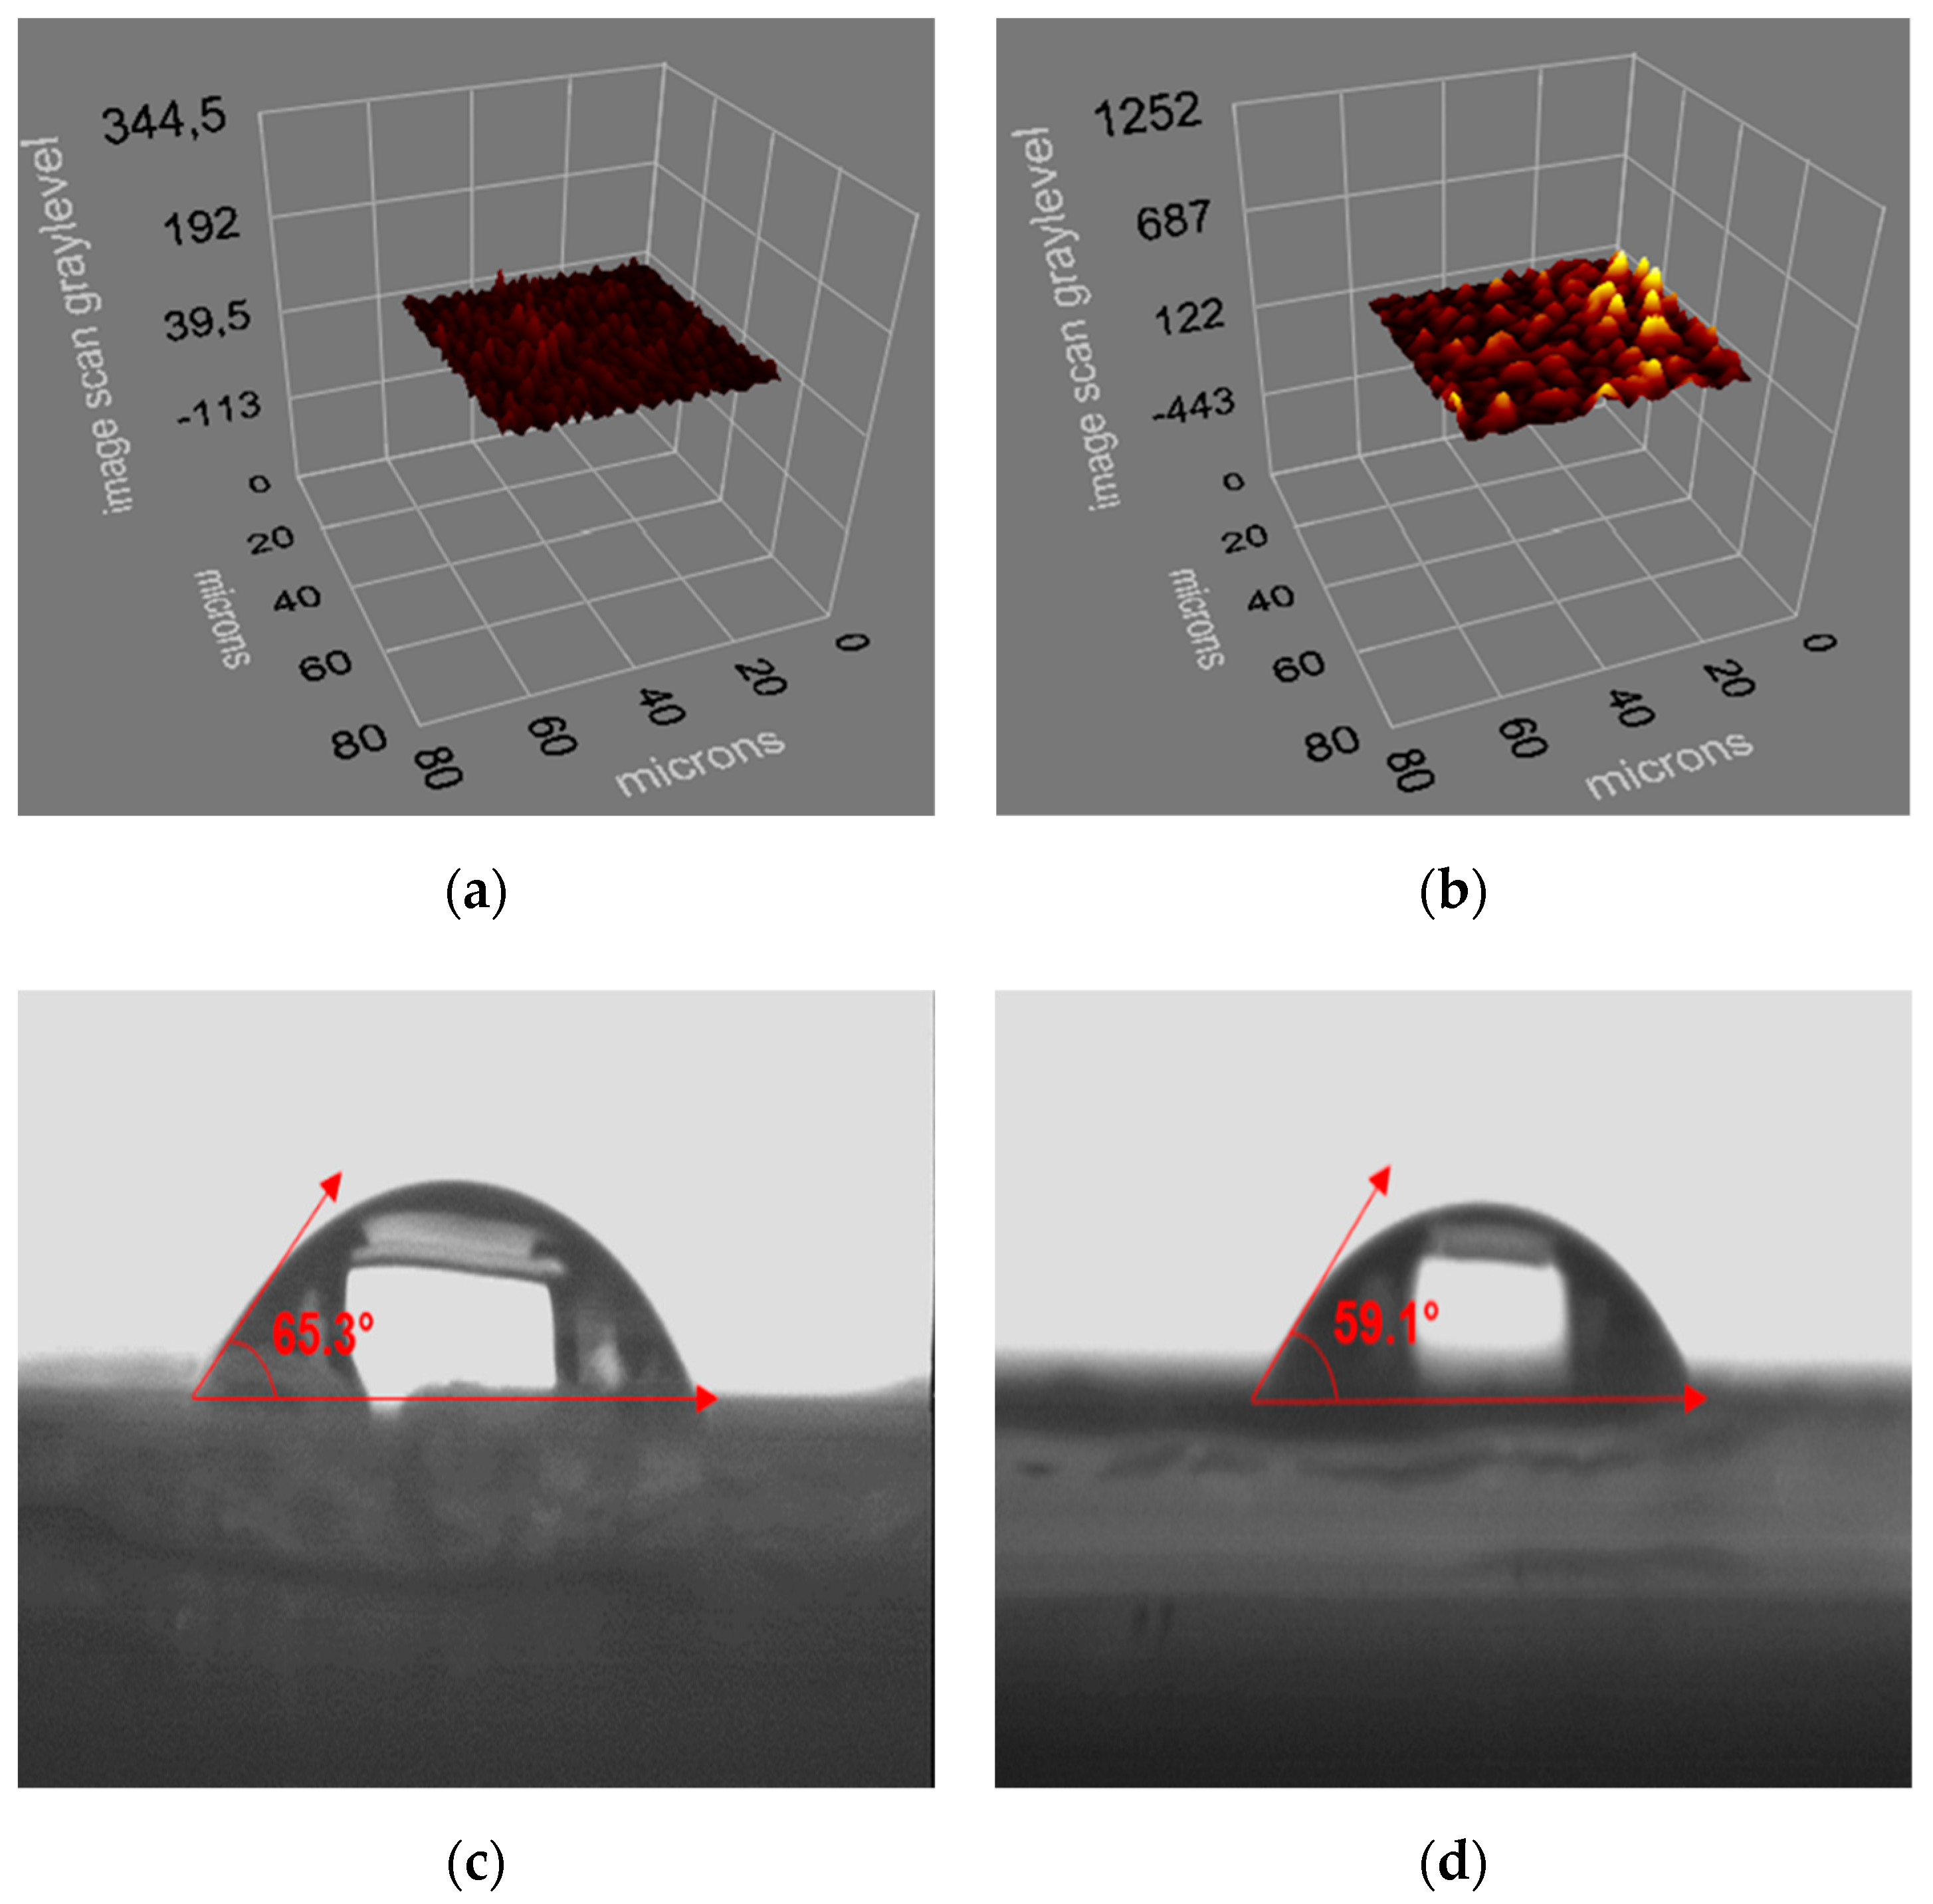
2.5. Preparation and Characterization of Sensor

To begin, 10 µL of nanoparticle was released onto the sensor surface and was covered using spin-coating. The immobilization was accomplished under UV light for half an hour (Figure 1). The non-imprinted sensor was also prepared using the same method with non-imprinted nanoparticles. Characterization experiments were complemented by ellipsometry (Nanofilm EP3) and contact angle (Krüss DSA100) measurements for imprinted and non-imprinted sensors.

2.6. Kinetic Analyses

After all characterization experiments were performed, kinetic analyses were executed via SPRimager II. In the beginning, the sensor was balanced using PBS buffer and the resonance angle was adjusted to the appropriate angle. All studies continued at the same setting. The buffer solution movement was continued with a pump with a 150 µL/min flow rate to obtain a baseline. Each sample solution was applied to the sensor system. The percent of change in reflectivity (ΔR) was monitored in real-time and reached a plateau value for each sample. After that, the desorption process followed. The sensor was washed with water and PBS buffer after desorption to prepare for the next analysis. E. faecalis solutions were prepared and interacted with the sensor at a certain concentration range (5 × 10⁴–5 × 10⁸ cfu/mL) for comparison in kinetic analyses.

2.7. Repeatability and Selectivity Analyses

The same sample solution was interacted three times to examine the repeatability performance of the sensor. Three different bacterial solutions (E. coli, S. aureus, B. subtilis) of the same concentration were prepared in order to test the selectivity of the imprinted and non-imprinted sensors. In accordance with the results, selectivity and relative selectivity coefficients were also calculated using the change in reflectivity values of imprinted and non-imprinted sensors.

2.8. Water Sample Analyses

Seawater and tap water could supply a usable environment for bacterial growth, and one of the important possible pollution sources, among various factors, was tested to observe the performance of the sensor in a complex medium. Seawater and tap water samples were diluted ten times with PBS buffer, due to the need to add bacteria, and then spiked with waterborne bacteria to a concentration of 5 × 10⁷ cfu/mL. The artificially contaminated sample solution was applied to the sensor and the response was monitored in real-time.

3. Results and Discussion

3.1. Characterization Results

Characterization experiments were performed for surface proteins, nanoparticles and sensor using SDS-PAGE, SEM, AFM, TEM, zeta-size, ellipsometry and contact angle measurements. At first, two different bands were obtained, one at 140 kDa (Figure 2aA) and one at 105 kDa (Figure 2aB), when the LiCl and Tris-buffered urea methods for surface protein extraction, respectively, were analyzed by SDS-PAGE. In the literature, the molecular weight of the enterococcal surface protein is reported as 200 kDa and the aggregation factor is 137 kDa [32]. The molecular weights of surface proteins were also measured using graphs drawn using Rf values and molecular weights of standard proteins (Figure 2b). As a result of comparison experiments, the extraction method using LiCl was chosen as the appropriate method. It is thought that the protein extract with the molecular weight of 140 kDa could be the aggregation factor.
The surface morphology of the nanoparticles was investigated by SEM, AFM and TEM analyses. As shown in Figure 3a–c, the nanoparticles have a spherical shape and homogeneous size. In addition, the surface distance and root mean square values were measured as 57.96 nm and 0.22 nm, respectively. Figure 3d depicts that the average size of the nanoparticles was measured as 57.85 nm, with a low polydispersity index (0.116). Furthermore, magnified SEM, lower magnified TEM and two dimensional AFM images are shown in Figure S1 to reflect the homogeneity of the nanoparticles. All of the characterization results are consistent with each other. The average surface thickness values of imprinted and non-imprinted sensors were examined using ellipsometry and found to be 76.7 ± 3.9 nm and 82.6 ± 3.4 nm, respectively. According to the analyses, the sensors have rough surfaces due to the successful immobilization of the nanoparticles, and the distribution on the surface was almost homogeneous (Figure 4a,b). A partial increase in thickness value was observed due to some heterogeneous sites on the non-imprinted sensor. The contact angle analysis of the imprinted and non-imprinted sensor surfaces was carried out and the measured values were 59.7° and 65.1°, respectively (Figure 4c,d).

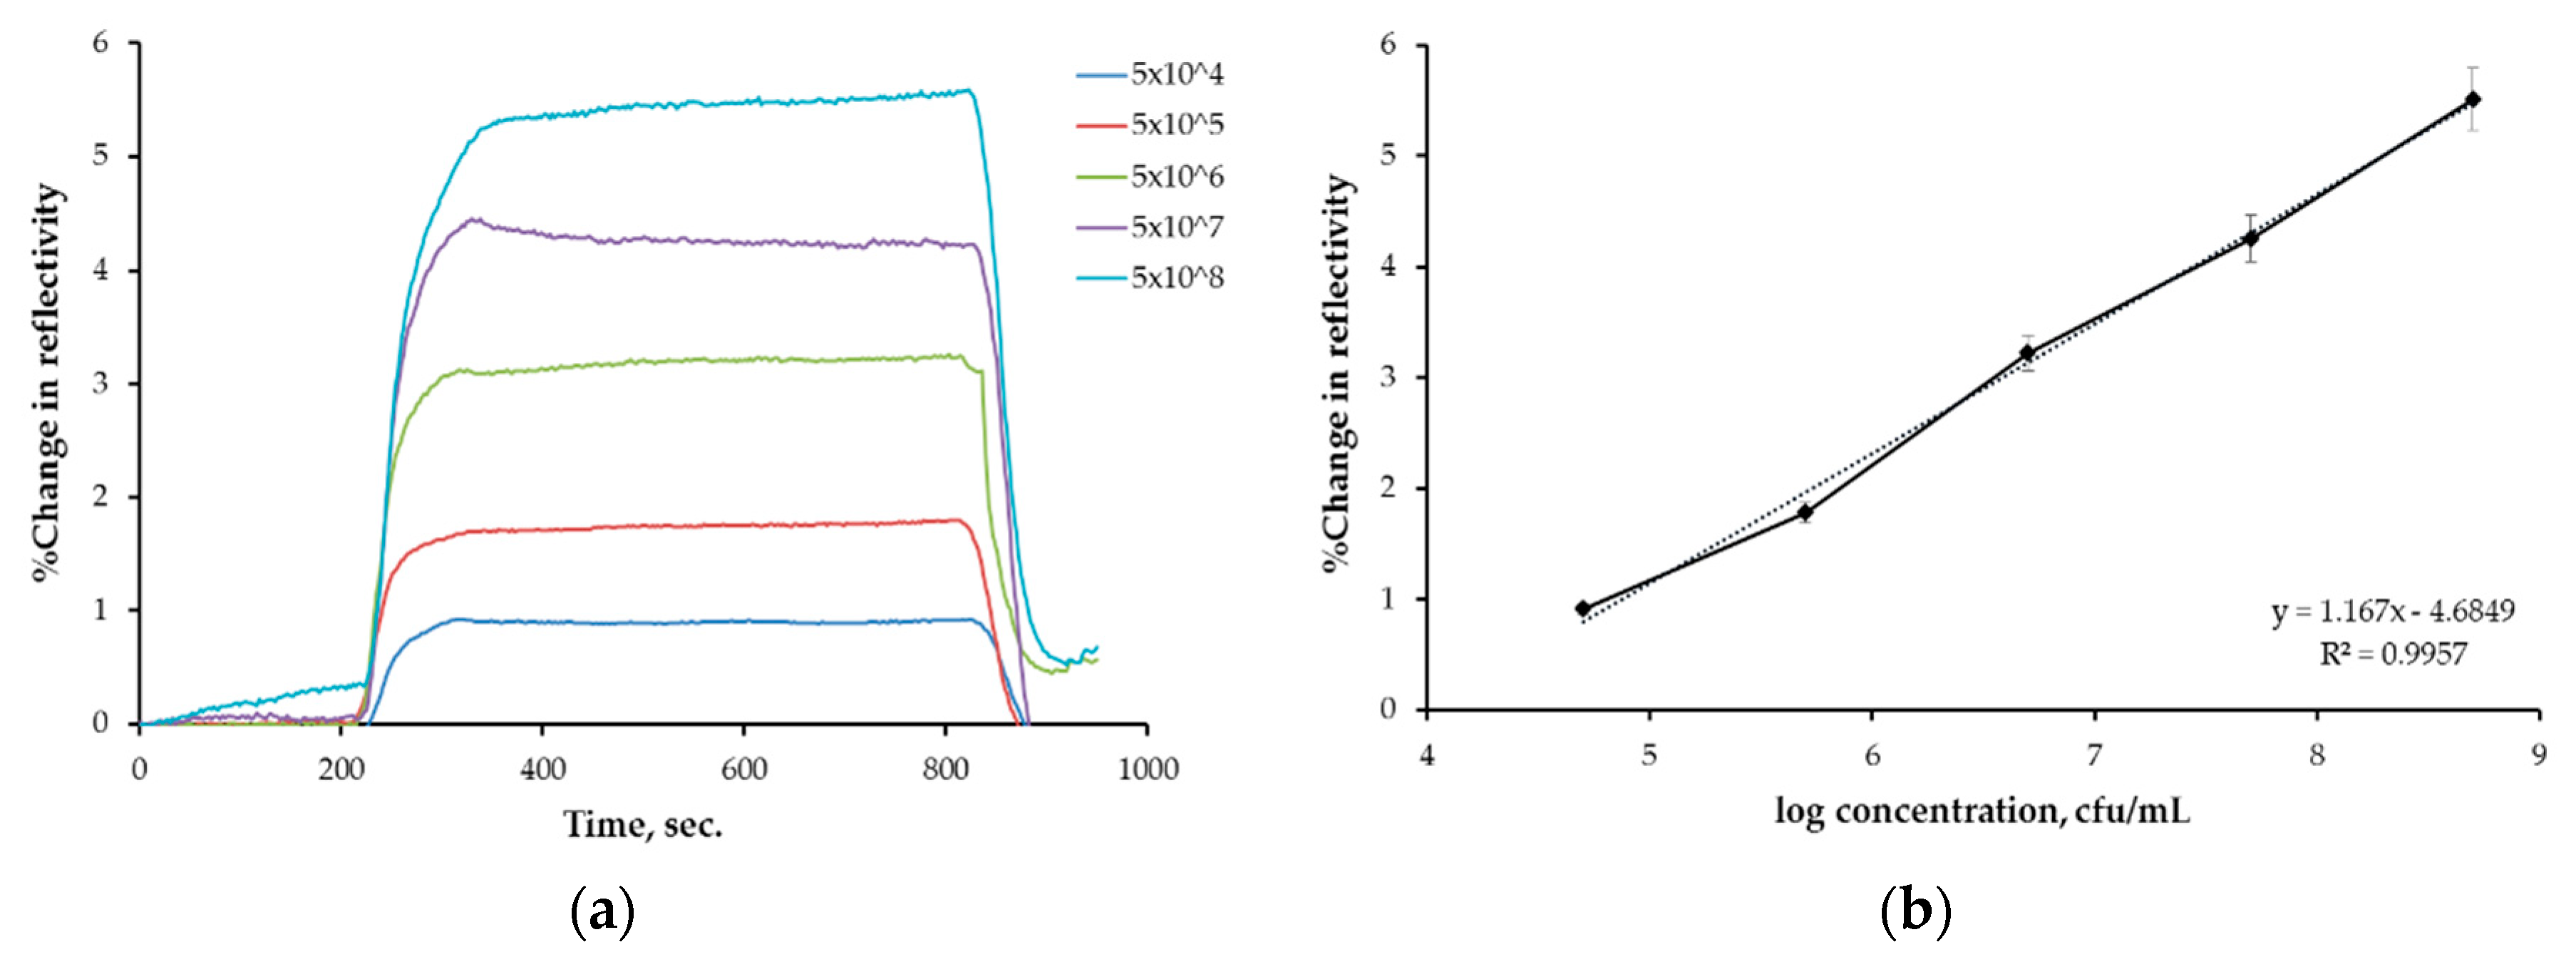
3.2. Kinetic Analyses Results

In order to evaluate the relationship between sensor response and waterborne bacteria, sample solutions at different concentrations (5 × 10⁴–5 × 10⁸ cfu/mL) interacted with sensor and kinetic data were obtained using SPRview software. As depicted in Figure 5a, the sensor had a quick response (25 s) when waterborne bacteria solutions reached the sensor. A rise in sensor response was observed with an increase in sample concentration, as expected. After that, the sensor was treated with desorption agent and ultrapure water before new analyses. Additionally, there is a direct relationship between the sample concentration and the percent of change in the reflectivity value. Moreover, kinetic investigations on the sensor performance denoted 99.57% precision with y = 1.167x − 4.6849 being the equation describing waterborne bacteria concentrations from 5 × 10⁴ cfu/mL to 5 × 10⁸ cfu/mL (Figure 5b). The limit of detection value can be also stated as 3s/b, where s is the standard deviation of sensor response and can be evaluated as the y-intercept of the regression equation. So, a more homogeneous distribution appeared after a more relevant evaluation, and the limit of detection value was calculated as 3.4 × 10⁴ cfu/mL.

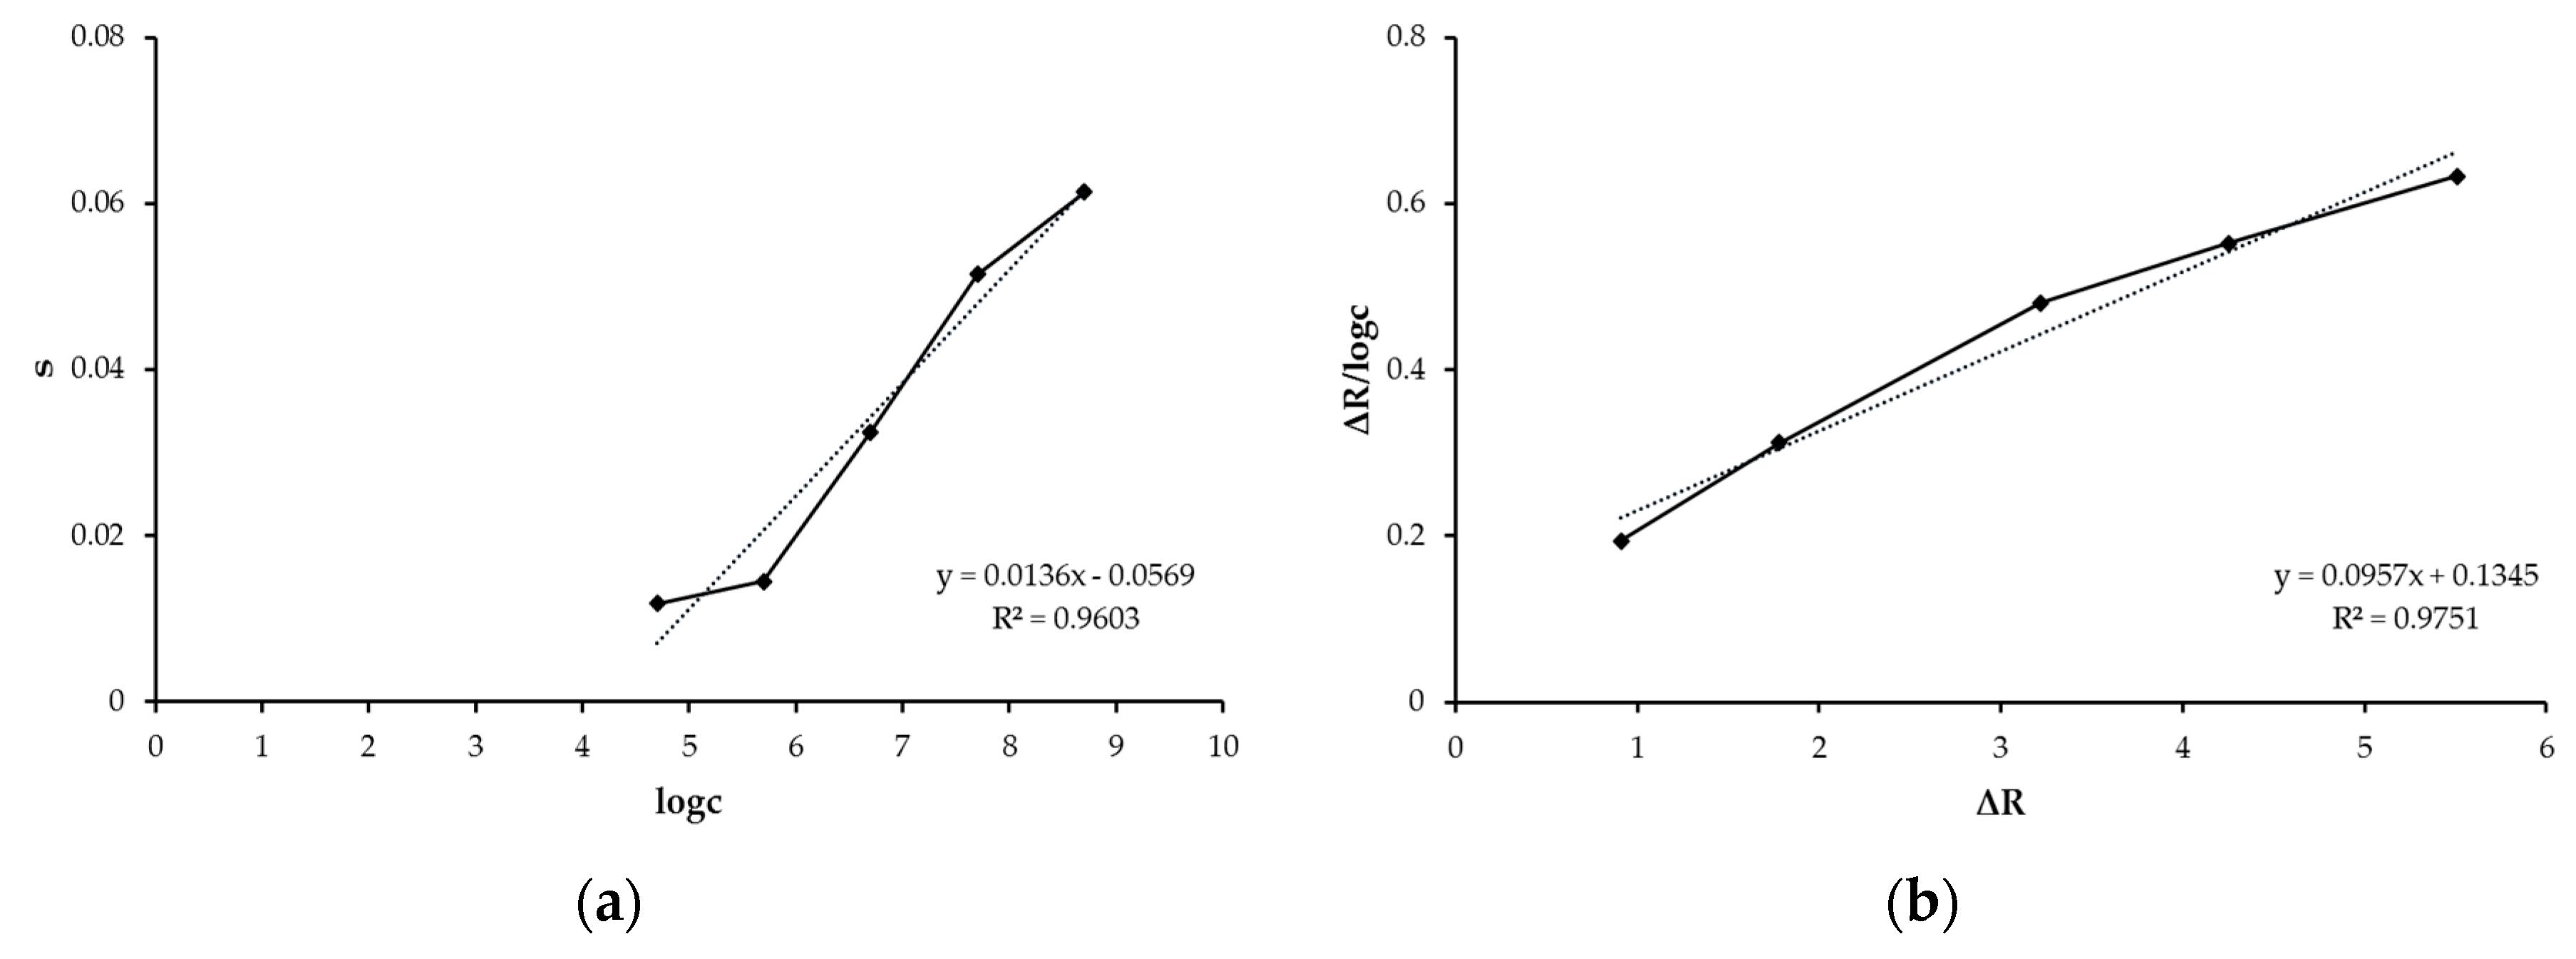
3.3. Adsorption Isotherm Models

Three different isotherm models (Scatchard, Langmuir and Freundlich) were applied to determine the interaction model between the sensor and waterborne bacteria. Association analysis is an approach base on pseudo-first order adsorption kinetics. The Scatchard model analyzes the experimental data from reversible binding interactions, and also calculates the number of binding sites in an equilibrium situation. The Langmuir model depends on the supposition of homogeneous adsorption on a monolayer surface, and the distribution of equal energy without extra interactions, while the Freundlich model is heterogeneous, and adsorption is observed with heterogeneous surfaces with extra interactions. The mathematical coefficients (ΔRmax, ka, kd, KA and KD) were calculated using related equations. Examination of Figure 6 and Table 1 reveals that the experimental data is the most compatible with the Langmuir model (R2 = 0.9363). This result showed that the binding properties of bacteria on the sensor surface were homogeneously distributed, single- and mono-layered, equal energy and had minimal lateral interaction.

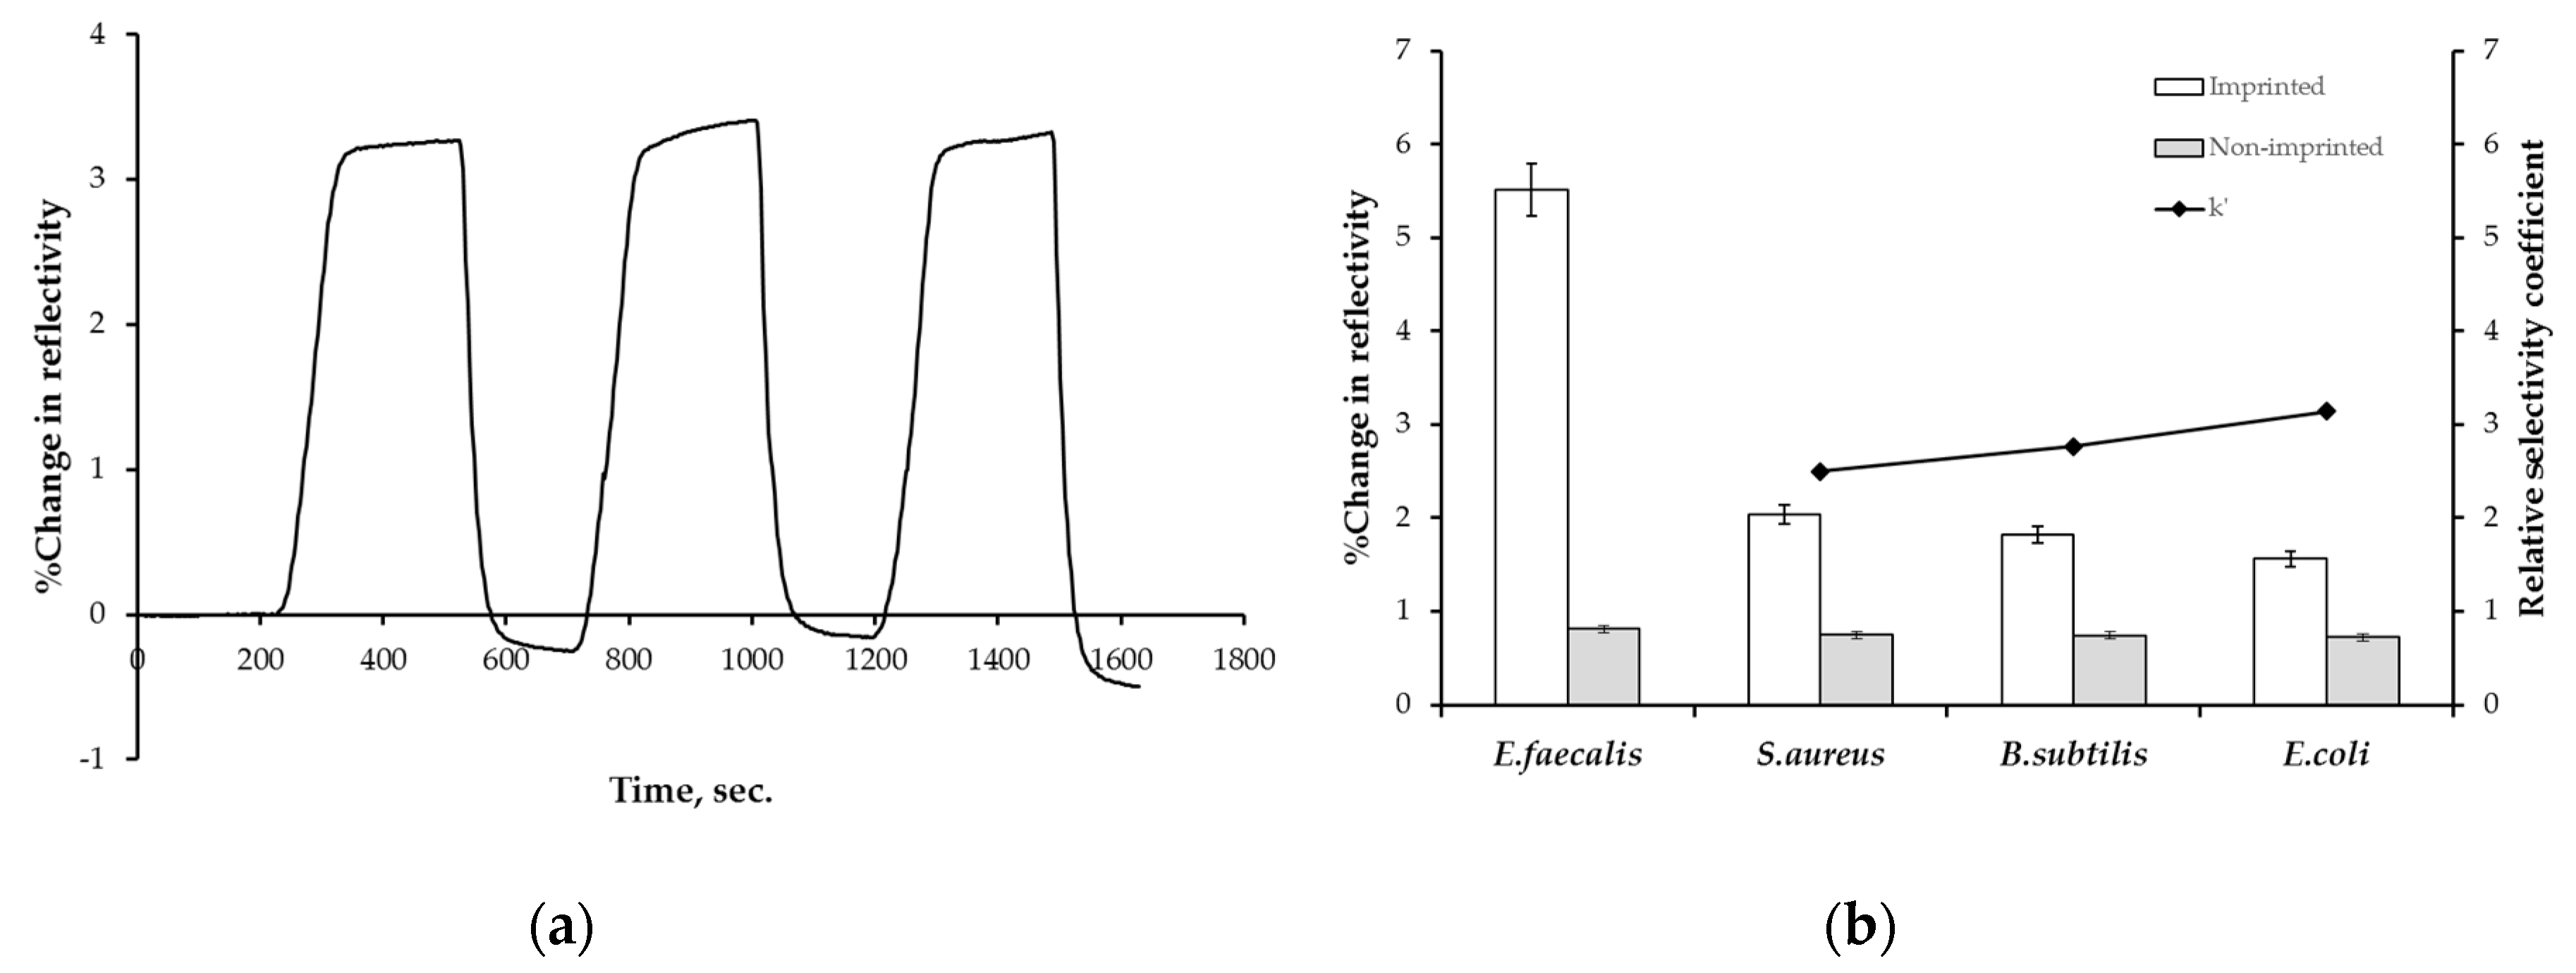
3.4. Repeatability and Selectivity Analyses Results

To examine the repeatability of the imprinted sensor, bacteria solutions (5 × 10⁶ cfu/mL) were repeatedly (three times) interacted with the sensor and the results are given in Figure 7a. According to these results, the sensor can be used repeatedly without any performance loss. In order to demonstrate the imprinting selectivity, a non-imprinted sensor was also prepared and a response comparison was made between the two sensors. Sample solutions prepared using B. subtilis, E. coli and S. aureus competing agents were given to the sensor. While E. coli is a different bacterium in terms of both morphological and Gram properties, B. subtilis shows similarity in Gram properties and S. aureus shows similarity in both Gram properties and morphology. These solutions were prepared in PBS at a concentration of 5 × 10⁸ cfu/mL. Figure 7b shows the percent of change in reflectivity graphs of imprinted and non-imprinted sensors prepared with solutions with different microorganisms. As shown in the figure, the sensor prepared with non-imprinted nanoparticles gave lower signals than the sensor prepared by imprinted nanoparticles. In addition, the selectivity (k) and relative selectivity coefficients (k′) that were calculated from changes in reflectivity values of imprinted and non-imprinted sensors are given for S. aureus, B. subtilis and E. coli according to E. faecalis in Table 2. According to these results, compared to the imprinted and non-imprinted sensors, the signal decreased from 5.5 to 0.8, and the relative selectivity coefficients were calculated as 2.5 for S. aureus, 2.8 for B. subtilis, 3.1 for E. coli. Relative selectivity values above 1 indicate that the imprinting was efficient and successful.

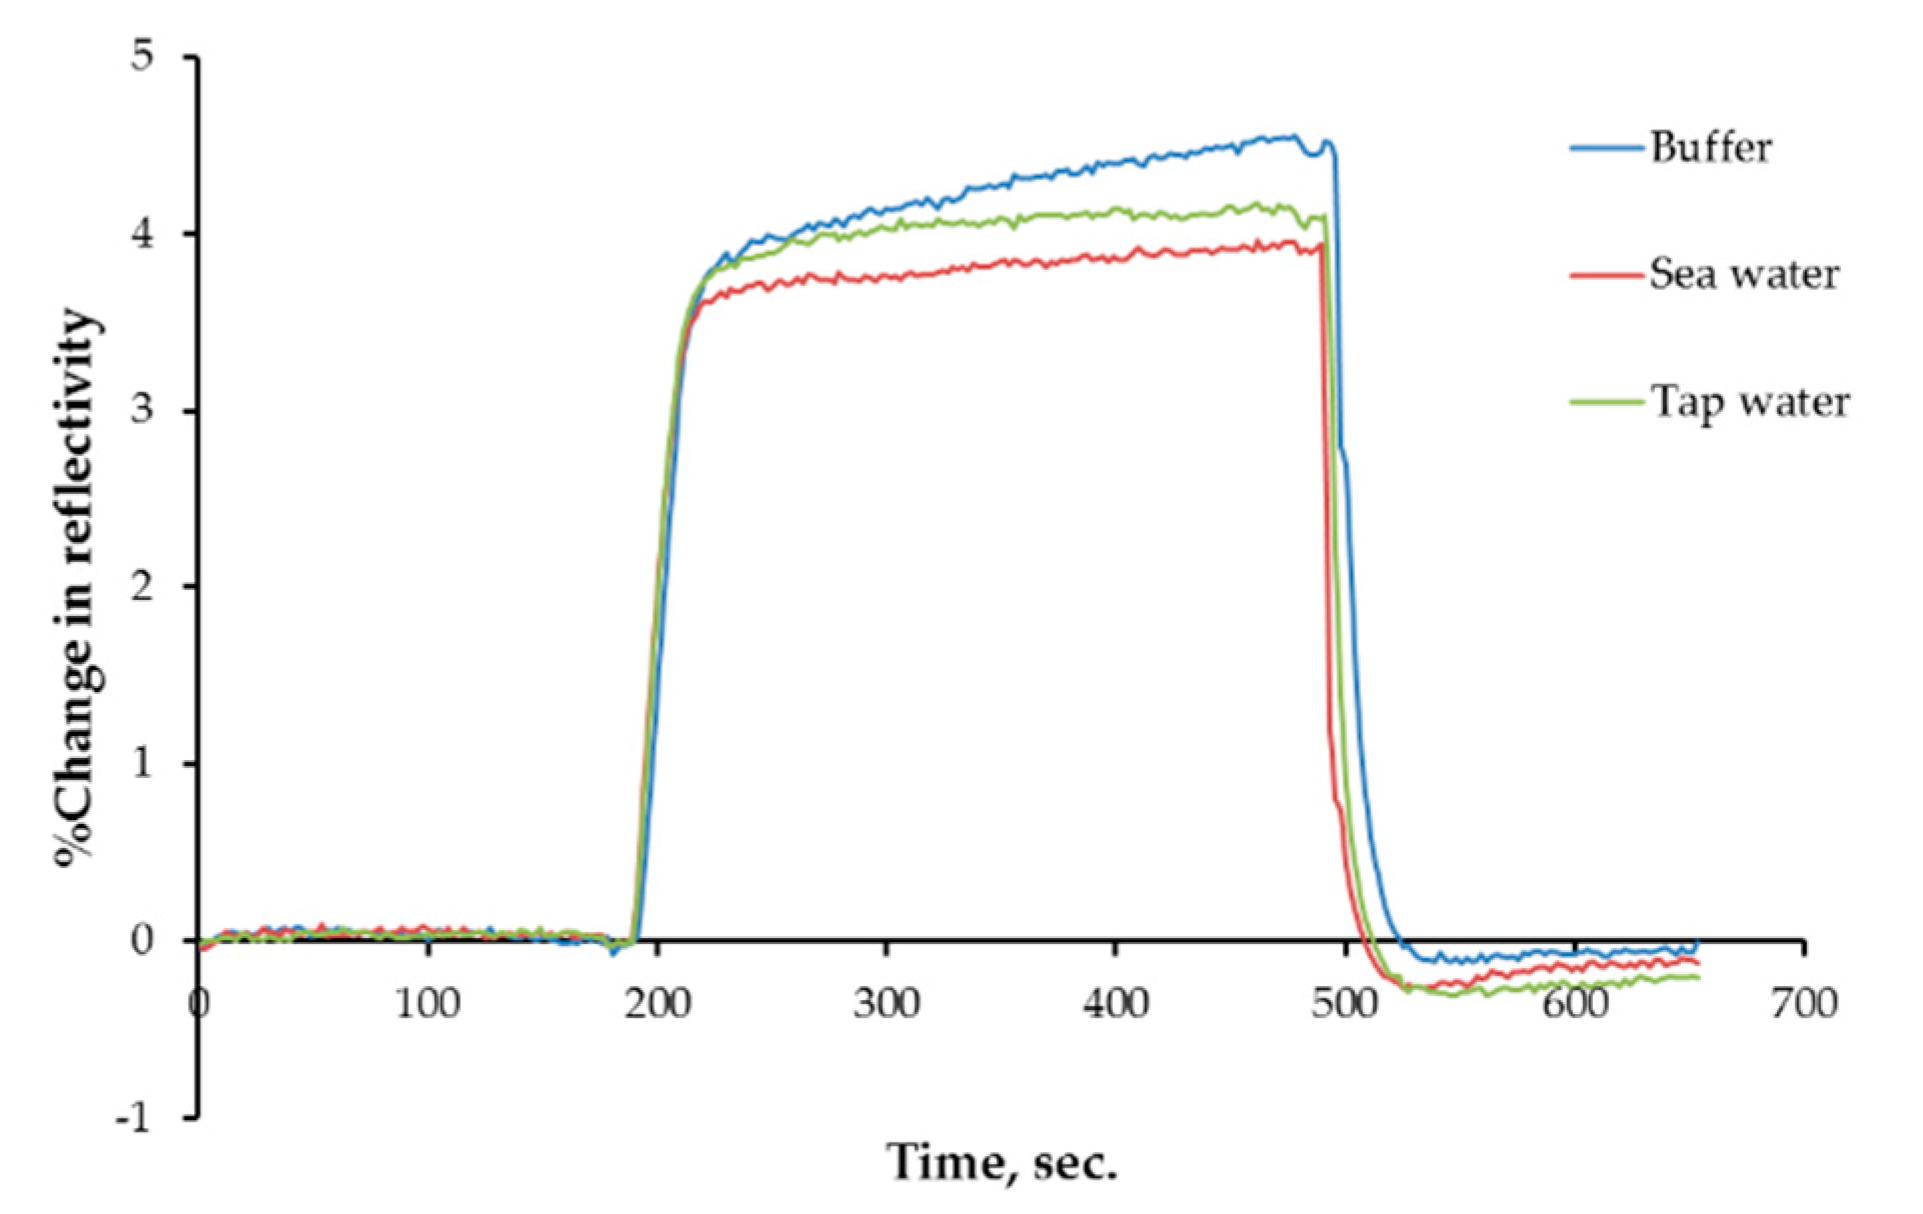
3.5. Water Sample Analyses Results

Water sample analyses were carried out to consider the usability of the sensor in different environments. Figure 8 depicts the percent of change in reflectivity values versus time with 5 × 10⁷ cfu/mL waterborne bacteria concentration in PBS, sea and tap water. According to the results, the sensor can detect E. faecalis samples with different concentrations with 90–95% recovery.

4. Discussion and Conclusions

Careful monitoring of water quality is increasingly needed because fecal contamination is a major health and environmental threat. For many years, the concept of fecal indicator bacteria has been one of the first methods of choice for microbiological risk evaluation of water quality. In general, the indicator bacteria can be enumerated using standard culture-based microbiological methods. E. coli and Enterococcus strains were thought to be good candidates for microbial tracking of water. To this purpose, E. faecalis surface protein-imprinted nanoparticles were prepared and immobilized on the sensor surface for waterborne bacteria detection. In addition, selectivity analyses showed that the specific cavities of the nanoparticles recognize this waterborne bacteria more than other competitor bacteria. The sensor is able to detect in real-time with a low detection limit, and high sensitivity, without the need for labeling. According to the results, this prepared sensor constitutes a highly selective alternative for the detection of microorganisms in environmental pollution for public health control. This study provides an example of more effective alternatives for the detection of microorganisms, such as imprinting of surface protein, pilus, and other antigenic regions. Imprinting of bacterial proteins also eliminates the disadvantages, such as the morphology and size of bacteria, that stand out in whole cell imprinting.
The use of molecularly imprinted nanoparticles in the determination of waterborne bacteria made the sensor system more sensitive and selective. In addition, real-time analyses were performed at low concentrations without any need for labeling. The sensor has been re-usable without any loss of performance, thus providing lower cost than other methods. This study, which was carried out within the scope, contributed to the literature in order to compare the advantages of surface protein imprinted nanoparticles with a sensor for the determination of E. faecalis. Detailed comparison parameters prepared from molecularly imprinted polymer based studies are shown in Table 3. According to the table, researchers detected different types of bacteria with a wide concentration range by imprinting different type of bacterial regions. When the sensor studies for bacterial determination in the literature are examined, mostly studies on whole cell imprinting are found. This study provides a good example of imprinting a specific region of bacteria, therefore eliminating the disadvantages that may arise in whole cell suppression, and contributes to the literature.

Supplementary Materials

The following is available online at https://www.mdpi.com/2227-9040/7/3/33/s1, Figure S1: Nanoparticle characterization results: (a) SEM; (b) AFM and (c) TEM.

Author Contributions

Y.S. and Ö.E. designed the study and performed the experiments and wrote the manuscript. N.C. and A.D. supervised the study and revised the manuscript.

Funding

This research was funded by Hacettepe University, Scientific Research Projects Coordination Unit, Ankara, Turkey (Grant number: FHD-2018-17000).

Conflicts of Interest

The authors declare no conflict of interest.

Abbreviations

kSelectivity coefficient
kRelative selectivity coefficient
ΔRmaxMaximum signal shift
ka (cfu/mL−1·s−1)Forward kinetic rate constant
kd (1/s)Reverse kinetic rate constant
KA (mL/cfu)Forward equilibrium constant
KD (cfu/mL)Reverse equilibrium constant
1/nFreundlich exponent
R2Correlation coefficient

References

  1. Erdem, Ö.; Saylan, Y.; Cihangir, N.; Denizli, A. Molecularly imprinted nanoparticles based plasmonic sensors for real-time Enterococcus faecalis detection. Biosens. Biolectron. 2019, 126, 608–614. [Google Scholar] [CrossRef]
  2. O’Mullan, G.D.; Juhl, A.R.; Reichert, R.; Schneider, E.; Martinez, N. Patterns of sediment-associated fecal indicator bacteria in an urban estuary: Benthic-pelagic coupling and implications for shoreline water quality. Sci. Total Environ. 2019, 656, 1168–1177. [Google Scholar] [CrossRef]
  3. Rochelle-Newall, E.; Nguyen, T.M.H.; Le, T.P.Q.; Sengtaheuanghoung, O.; Ribolzi, O. A short review of fecal indicator bacteria in tropical aquatic ecosystems: knowledge gaps and future directions. Front. Microbiol. 2015, 6, 1–15. [Google Scholar] [CrossRef]
  4. Scott, T.M.; Jenkins, T.M.; Lukasik, J.; Rose, J.B. Potential use of a host associated molecular marker in Enterococcus faecium as an index of human fecal pollution. Environ. Sci. Technol. 2015, 39, 283–287. [Google Scholar] [CrossRef]
  5. Strateva, T.; Atanasova, D.; Savov, E.; Petrova, G.; Mitov, I. Incidence of virulence determinants in clinical Enterococcus faecalis and Enterococcus faecium isolates collected in Bulgaria. Braz. J. Infect. Dis. 2016, 20, 127–133. [Google Scholar] [CrossRef]
  6. Waar, K.; Van Der Mei, H.C.; Harmsen, H.J.M.; Degener, J.E.; Busscher, H.J. Enterococcus faecalis surface proteins determine its adhesion mechanism to bile drain materials. Microbiology 2002, 148, 1863–1870. [Google Scholar] [CrossRef]
  7. Gracias, K.S.; McKillip, J.L. A review of conventional detection and enumeration methods for pathogenic bacteria in food. Can. J. Microbiol. 2004, 50, 883–890. [Google Scholar] [CrossRef] [Green Version]
  8. Ali, Y.M.; Sim, R.B.; Schwaeble, W.; Sshabaan, M.A. Enterococcus faecalis escapes complement-mediated killing via recruitment of complement factor H. J. Infect. Dis. 2019. accepted manuscript. [Google Scholar] [CrossRef]
  9. Hashemi, E.; Forouzandeh, M. Designing a new biosensor “DNA ELISA” to detect Escherichia coli using genomic DNA and comparison of this method to PCR-ELISA. J. Enzyme Inhib. Med. Chem. 2018, 33, 722–725. [Google Scholar] [CrossRef]
  10. Zhu, L.; He, J.; Cao, X.; Huang, K.; Luo, Y.; Xu, W. Development of a double-antibody sandwich ELISA for rapid detection of Bacillus cereus in food. Sci. Rep. 2016, 6, 16092. [Google Scholar] [CrossRef]
  11. Jordana-Lluch, E.; Giménez, M.; Quesada, M.D.; Ausina, V.; Martró, E. Improving the diagnosis of bloodstream infections: PCR coupled with mass spectrometry. BioMed Res. Int. 2014, 2014, 1–8. [Google Scholar] [CrossRef]
  12. Ma, K.; Deng, Y.; Bai, Y.; Xu, D.; Chen, E.; Wu, H.; Li, B.; Gao, L. Rapid and simultaneous detection of Salmonella, Shigella, and Staphylococcus aureus in fresh pork using a multiplex real-time PCR assay based on immunomagnetic separation. Food Control 2014, 42, 87–93. [Google Scholar] [CrossRef]
  13. Liu, X.; Hu, Y.; Zheng, S.; Liu, Y.; He, Z.; Luo, F. Surface plasmon resonance immunosensor for fast, highly sensitive, and in situ detection of the magnetic nanoparticles-enriched Salmonella enteritidis. Sens. Actuators B Chem. 2016, 230, 191–198. [Google Scholar] [CrossRef]
  14. Vaisocherová-Lísalová, H.; Víšová, I.; Ermini, M.L.; Špringer, T.; Song, X.C.; Mrázek, J.; Lamačová, J.; Lynn, N.S., Jr.; Šedivákb, P.; Homola, J. Low-fouling surface plasmon resonance biosensor for multi-step detection of foodborne bacterial pathogens in complex food samples. Biosens. Bioelectron. 2016, 80, 84–90. [Google Scholar] [CrossRef]
  15. Saylan, Y.; Denizli, A. Molecular fingerprints of hemoglobin on a nanofilm chip. Sensors 2018, 18, 3016. [Google Scholar] [CrossRef]
  16. Farka, Z.; Juřík, T.; Pastucha, M.; Skládal, P. Enzymatic precipitation enhanced surface plasmon resonance immunosensor for the detection of Salmonella in powdered milk. Anal. Chem. 2016, 88, 11830–11836. [Google Scholar] [CrossRef]
  17. Saylan, Y.; Akgönüllü, S.; Yavuz, H.; Ünal, S.; Denizli, A. Molecularly imprinted polymer based sensors for medical applications. Sensors 2019, 19, 1279. [Google Scholar] [CrossRef]
  18. Shang, L.; Liu, C.; Chen, B.; Hayashi, K. Plant biomarker recognition by molecular imprinting based localized surface plasmon resonance sensor array: Performance improvement by enhanced hotspot of au nanostructure. ACS Sens. 2018, 3, 531–1538. [Google Scholar] [CrossRef]
  19. Yildiz, U.H.; Inci, F.; Wang, S.Q.; Toy, M.; Tekin, H.C.; Javaid, A.; Lau, D.T.Y.; Demirci, U. Recent advances in micro/nanotechnologies for global control of hepatitis B infection. Biotechnol. Adv. 2015, 33, 178–190. [Google Scholar] [CrossRef]
  20. Atale, S.S.; Dyawanapelly, S.; Jagtap, D.D.; Jain, R.; Dandekar, P. Understanding the nano-bio interactions using real-time surface plasmon resonance tool. Int. J. Biol. Macromol. 2019, 123, 97–107. [Google Scholar] [CrossRef]
  21. Saylan, Y.; Yilmaz, F.; Özgür, E.; Derazshamshir, A.; Yavuz, H.; Denizli, A. Molecular imprinting of macromolecules for sensor applications. Sensors 2017, 17, 898. [Google Scholar] [CrossRef]
  22. Garipcan, B.; Denizli, A. A novel affinity support material for the separation of immunoglobulin G from human plasma. Macromol. Biosci. 2002, 2, 135–144. [Google Scholar] [CrossRef]
  23. Tiong, H.K.; Hartson, S.; Muriana, P.M. Comparison of five methods for direct extraction of surface proteins from Listeria monocytogenes for proteomic analysis by orbitrap mass spectrometry. J. Microbiol. Methods 2015, 110, 54–60. [Google Scholar] [CrossRef]
  24. Templier, V.; Roux, A.; Roupioz, Y.; Livache, T. Ligands for label-free detection of whole bacteria on biosensors: A review. Trends Anal. Chem. 2016, 79, 71–79. [Google Scholar] [CrossRef]
  25. Saylan, Y.; Tamahkar, E.; Denizli, A. Recognition of lysozyme using surface imprinted bacterial cellulose nanofibers. J. Biomater. Sci. Polym. 2017, 28, 1950–1965. [Google Scholar] [CrossRef]
  26. Jia, M.; Zhang, Z.; Li, J.; Ma, X.; Chen, L.; Yang, X. Molecular imprinting technology for microorganism analysis. Trends Anal. Chem. 2018, 106, 190–201. [Google Scholar] [CrossRef]
  27. Masdor, N.; Altintas, Z.; Tothill, I. Surface plasmon resonance immunosensor for the detection of Campylobacter jejuni. Chemosensors 2017, 5, 16. [Google Scholar] [CrossRef]
  28. Zhang, P.; Chen, Y.P.; Wang, W.; Shen, Y.; Guo, J.S. Surface plasmon resonance for water pollutant detection and water process analysis. Trends Anal. Chem. 2016, 85, 153–165. [Google Scholar] [CrossRef]
  29. Aryantini, N.P.D.; Kondoh, D.; Nishiyama, K.; Yamamoto, Y.; Mukai, T.; Sujaya, I.N.; Urashima, T.; Fukuda, K. Anchorless cell surface proteins function as laminin-binding adhesins in Lactobacillus rhamnosus FSMM22. FEMS Microbiol. Lett. 2017, 364, fnx056. [Google Scholar] [CrossRef]
  30. Moreno-Gordaliza, E.; Stigter, E.C.; Lindenburg, P.W.; Hankemeier, T. Bacterial surface layer proteins as a novel capillary coating material for capillary electrophoretic separations. Anal. Chim. Acta 2016, 923, 89–100. [Google Scholar] [CrossRef]
  31. McBirney, S.E.; Trinh, K.; Wong-Beringer, A.; Armani, A.M. Wavelength-normalized spectroscopic analysis of Staphylococcus aureus and Pseudomonas aeruginosa growth rates. Biomed. Opt. Express 2016, 7, 4034–4042. [Google Scholar] [CrossRef]
  32. Hancock, L.E.; Murray, B.E.; Sillanpää, J. Enterococcal Cell Wall Components and Structures. In Enterococci: From Commensals to Leading Causes of Drug Resistant Infection. Master’s Thesis, Massachusetts Eye and Ear Infirmary, Boston, MA, USA, 2014; pp. 1–44. [Google Scholar]
  33. Khan, M.A.R.; Moreira, F.T.; Riu, J.; Sales, M.G.F. Plastic antibody for the electrochemical detection of bacterial surface proteins. Sens. Actuators B Chem. 2016, 233, 697–704. [Google Scholar] [CrossRef] [Green Version]
  34. Lahcen, A.A.; Arduini, F.; Lista, F.; Amine, A. Label-free electrochemical sensor based on spore-imprinted polymer for Bacillus cereus spore detection. Sens. Actuators B Chem. 2018, 276, 114–120. [Google Scholar] [CrossRef]
  35. Khan, M.A.R.; Cardoso, A.R.A.; Sales, M.G.F.; Merino, S.; Tomás, J.M.; Rius, F.X.; Riu, J. Artificial receptors for the electrochemical detection of bacterial flagellar filaments from Proteus mirabilis. Sens. Actuators B Chem. 2017, 244, 732–741. [Google Scholar] [CrossRef]
Figure 1. Scheme of nanoparticle and sensor preparation.
Chemosensors 07 00033 g001
Figure 2. Surface protein characterization results: (a) SDS-PAGE and (b) Rf value.
Chemosensors 07 00033 g002
Figure 3. Nanoparticle characterization results: (a) SEM; (b) AFM; (c) TEM and (d) zeta-size.
Chemosensors 07 00033 g003aChemosensors 07 00033 g003b
Figure 4. Sensor characterization results: Ellipsometry and contact angle images of (a,c) imprinted and (b,d) non-imprinted.
Chemosensors 07 00033 g004
Figure 5. Concentration response results: (a) Sensorgram and (b) calibration curve.
Chemosensors 07 00033 g005
Figure 6. Adsorption isotherm models: (a) Association, (b) Scatchard, (c) Langmuir and (d) Freundlich.
Chemosensors 07 00033 g006aChemosensors 07 00033 g006b
Figure 7. (a) Repeatability and (b) selectivity results.
Chemosensors 07 00033 g007
Figure 8. Water sample analyses results.
Chemosensors 07 00033 g008
Table 1. Kinetic constants.
AssociationScatchardLangmuirFreundlich
ka = 0.014Ka = 0.096Ka = 0.1061/n = 0.95
kd = 0.057Kd = 10.45Kd = 9.466ΔRmax = 97.92
Ka = 0.239ΔRmax = 1.41ΔRmax = 1.01R2 = 0.983
Kd = 4.184
R2 = 0.960
R2 = 0.975R2 = 0.936
Table 2. Selectivity (k) and relative selectivity (k′) constants of imprinted and non-imprinted sensors.
BacteriaΔRImprintedkImprintedΔRNon-ImprintedkNon-Imprintedk
E. faecalis5.510.81
S. aureus2.042.710.751.082.51
B. subtilis1.823.030.741.092.77
E. coli1.563.530.721.133.14
Table 3. Comparison of molecularly imprinted studies for bacteria detection.
BacteriaMethodLinearityLimit of DetectionReference
Staphylococcus aureus (protein A)Electrochemical impedance spectroscopy23.8 pM–4.76 µM16.83 nM[33]
Bacillus cereus (spores)Electrochemical sensor102–105 cfu/mL102 cfu/mL[34]
Proteus mirabilis (flagellar filaments)Electrical impedance spectroscopy0.01 ± 60 µg/mL0.7 ng/mL[35]
Enterococcus faecalis (surface protein)Surface plasmon resonance5 × 104–5 × 10⁸ cfu/mL3.4 × 104 cfu/mLThis study

