Article

Building Selectivity for NO Sensing in a NOx Mixture with Sonochemically Prepared CuO Structures

Department of Chemistry and Biochemistry, The Ohio State University, Columbus, OH 43210, USA
*
Author to whom correspondence should be addressed.
Chemosensors 2016, 4(1), 1; https://doi.org/10.3390/chemosensors4010001
Submission received: 28 August 2015 / Revised: 11 November 2015 / Accepted: 24 November 2015 / Published: 23 December 2015
(This article belongs to the Special Issue Chemical Vapor Sensing)

Abstract

:
Several technologies are available for decreasing nitrogen oxide (NOx) emissions from combustion sources, including selective catalytic reduction methods. In this process, ammonia reacts with nitric oxide (NO) and nitrogen dioxide (NO2). As the stoichiometry of the two reactions is different, electrochemical sensor systems that can distinguish between NO and NO2 in a mixture of these two gases are of interest. Since NO and NO2 can be brought to equilibrium, depending on the temperature and the surfaces that they are in contact with, the detection of NO and NO2 independently is a difficult problem and has not been solved to date. In this study, we explore a high surface area sonochemically prepared CuO as the resistive sensing medium. CuO is a poor catalyst for NOx equilibration, and requires temperatures of 500 °C to bring about equilibration. Thus, at 300 °C, NO and NO2 retain their levels after interaction with CuO surface. In addition, NO adsorbs more strongly on the CuO over NO2. Using these two concepts, we can detect NO with minimal interference from NO2, if the latter gas concentration does not exceed 20% in a NOx mixture over a range of 100–800 ppm. Since this range constitutes most of the range of total NOx concentrations in diesel and other lean burn engines, this sensor should find application in selective detection of NO in this combustion application. A limitation of this sensor is the interference with CO, but with combustion in excess air, this problem should be alleviated.

Graphical Abstract

1. Introduction

There are numerous studies of different electrochemical methods of sensing for NO and NO2 in the literature [1], but, interestingly, there are very few studies which focus on the detection of one of these gas species in a mixture of NO and NO2. Most studies focus on detection of one of these gases and measure selectivity to one of these gases against the other with both in their pure form, in a balance of some mixture of N2 and O2. If one gas responds strongly to one analyte independently, it cannot be deemed selective, since the sensor may respond very differently to a mixture of gases than it does to them individually. Measurement of NO and NO2 in a NOx mixture is made even more difficult since NO and NO2 can be in equilibrium. Under equilibrium conditions, NO is favored at high temperature, and NO2 is favored at low temperature.
There are also electrochemical sensors that can measure total NOx [2,3,4,5]. Nitric oxide is typically emitted from high temperature combustion processes, but in the ambient it is rapidly converted to NO2. The need for NO2 sensors is driven by the environmental impact of this gas. However, for combustion emissions, the gas is primarily NO, and minimization of NO emissions requires the development of several types of sensors. There can be a small amount of NO2 in these combustion exhausts and thus focus has been on total NOx sensors. The concentration of NOx in these exhausts can be hundreds of ppm. Recently, there has been interest in NO sensors in human breath as a way to diagnose respiratory diseases with concentration range of the order of ppb [6,7].
With the higher efficiency lean-burn engines, conventional catalytic converters that remove NO from the emission exhausts do not function optimally, and new technologies for removing NO are being developed. In one such process, selective catalytic reduction (SCR), NOx removal involves reaction with ammonia (from urea) over a catalyst via reactions shown in Equations (1) and (2) [8]. There is a need to know how much ammonia should be mixed with NOx species, because unreacted ammonia is an environmental contaminant. Since different amounts of ammonia are required to reduce NO as NO2, knowledge of concentration of each gas individually is of interest. This information would allow better ammonia dosage.
4 N O + 4 N H 3 + O 2 4 N 2 + 6 H 2 O
2 N O 2 + 4 N H 3 + O 2 3 N 2 + 6 H 2 O
Developing an electrochemical sensor with a small footprint that can detect NO and NO2 in a mixture, in a harsh high temperature environment, with rapid response times suitable for feedback control has yet to be accomplished.
In this paper, we focus on resistive semiconductor oxide based sensors. Our interest in this study is on CuO, a p-type semiconducting material, which has been reported for detection of NOx [9,10,11,12,13,14], CO [12,15,16,17], H2 [18,19,20], and ethanol [14,20,21,22,23,24,25]. CuO has also been studied as a NOx reduction catalyst in SCR [26,27].
The purpose of this work is to design a sensor that is selective to NO in a NOx mixture, so that one component can be measured in a gas stream where both NO and NO2 are present. The synthesis of a high surface area form of CuO using sonochemical methods reported in the literature is the material of choice [28]. The sensing/selection mechanism is considered in terms of morphology of CuO, its defect formation, NO/NO2 equilibration, and sensor phenomenology. The effect of interfering CO gas is also examined.

2. Experimental Section

2.1. Synthesis of CuO

CuO synthesis was performed using a sonochemically-assisted precipitation reaction [28]. In a 100 mL beaker, 0.11 g Cu(II)acetate monohydrate (Aldrich CAS# 21-755-7) was dissolved in 15 mL ethanol and 35 mL H2O and stirred at room temperature. After complete dissolution, 4.0–8.0 mL 0.5 M NaOH was added drop wise with continued stirring. Afterwards 0.3–0.45 g cetyltrimethyl ammonium bromide (CTAB) (Aldrich CAS # 57-09-0) was added slowly. The sample was sonicated with a Branson Sonifier 250 sonic horn. After reaction, the sample was washed three times in EtOH and two times with H2O. Commercial CuO was obtained from Sigma-Aldrich (Aldrich CAS # 1318-38-0).

2.2. Structural Characterization

Crystallinity of CuO was determined using a Bruker D8 Advance XRD in flat plate mode. Size and morphology was determined using an FEI Nova 400 NanoSEM using a through lens detector at a voltage of 5 kV and a spot size of 3.0. TEM images were collected on an FEI Tecnai G2 Spirit TEM at 80 kV. Brunauer–Emmett–Teller (BET) surface area analysis was performed on a Quantachrome Instruments Nova 2200e Surface Area and Pore Size Analyzer (sample was degased for at least 6 hours at 320 °C prior to data collection).

2.3. NOx Equilibration Studies

A mixture of 300 ppm NO in 10% O2 with a balance of N2 was passed through a reaction vessel containing sonochemical CuO into an EcoPhysics CLD 70 S Chemiluminescence NO/NOx analyzer. The temperature of the reaction vessel was set to 200, 300, 400, or 500 °C. A set of bypass valves was used to determine baseline NO levels in between tests. NO and NOx levels were recorded for both the bypass and the heated reaction vessel. Error was calculated based on the accuracy of each MFC and the error of the NO/NOx analyzer, which was 1% of the range. The baseline level of NO and NOx detected by the NOx analyzer in the bypass mode was 297 ppm.

2.4. Sensing Experiments

CuO was painted on to an alumina substrate with interdigitated gold electrodes made by Makel Engineering. The gold pattern on the alumina substrate was two interpenetrating comb shaped interdigits. Each electrode had 10 interdigits. The spacing between interdigits was 250 microns all around and the thickness of the gold interdigits was also 250 microns. The thickness of the deposited layer varied; however, it was on the order of hundreds of microns in each case. Gold wires were attached to pads at the end of the gold interdigits. The ends of the gold leads were held by alligator clips, which connected the sensor element to a dielectric interface for measuring resistance. Sonochemical CuO and commercial CuO were deposited in a slurry of α-terpineol. Prior to starting sensor experiments the sample was baked out to 320 °C or 500 °C depending on the sample, unless otherwise noted. Ten different batches of sonochemcial CuO were prepared, and at least one sensor was made from each batch. Data from each and every sensor are not represented in this paper. The data in this paper are from several sensors prepared in a similar manner.
For sensing experiments, the CuO deposited on gold/alumina substrate was placed inside a custom made quartz probe and quartz tube sensing chamber, mounted in a Lindburg Blue tube furnace Type TF55035A. The CuO and substrate were connected through gold lead wires to an Agilent LXI data acquisition/switch unit. The gases used in the sensing experiments were 99.998% N2, 50/50 O2/N2, 996 ppm NO in N2, 1501 ppm NO2 in N2, 50 ppm CO in N2. Gas flow in and out of the quartz sensing chamber was controlled by LabVIEW software made in house and Sierra Mass Flow Controllers (MFCs) calibrated using our own flow meter. The flow rate was held steady at 100 sccm for all sensing experiments. Pulses of NO, NO2, and known mixtures of the two were introduced in a step wise method, on or off, however due to gas mixing inside the tube, it took on the order of a minute for gas concentration inside the sensing chamber to be approximately equal to the gas pumping out of the MFCs. Response was calculated from Equation (3) where Ranalyte is resistance in the presence of NO and reference indicates the resistance prior to introduction of NO, with only background gas.
R e s p o n s e = R a n a l y t e N O R r e f e r e n c e N O

3. Results

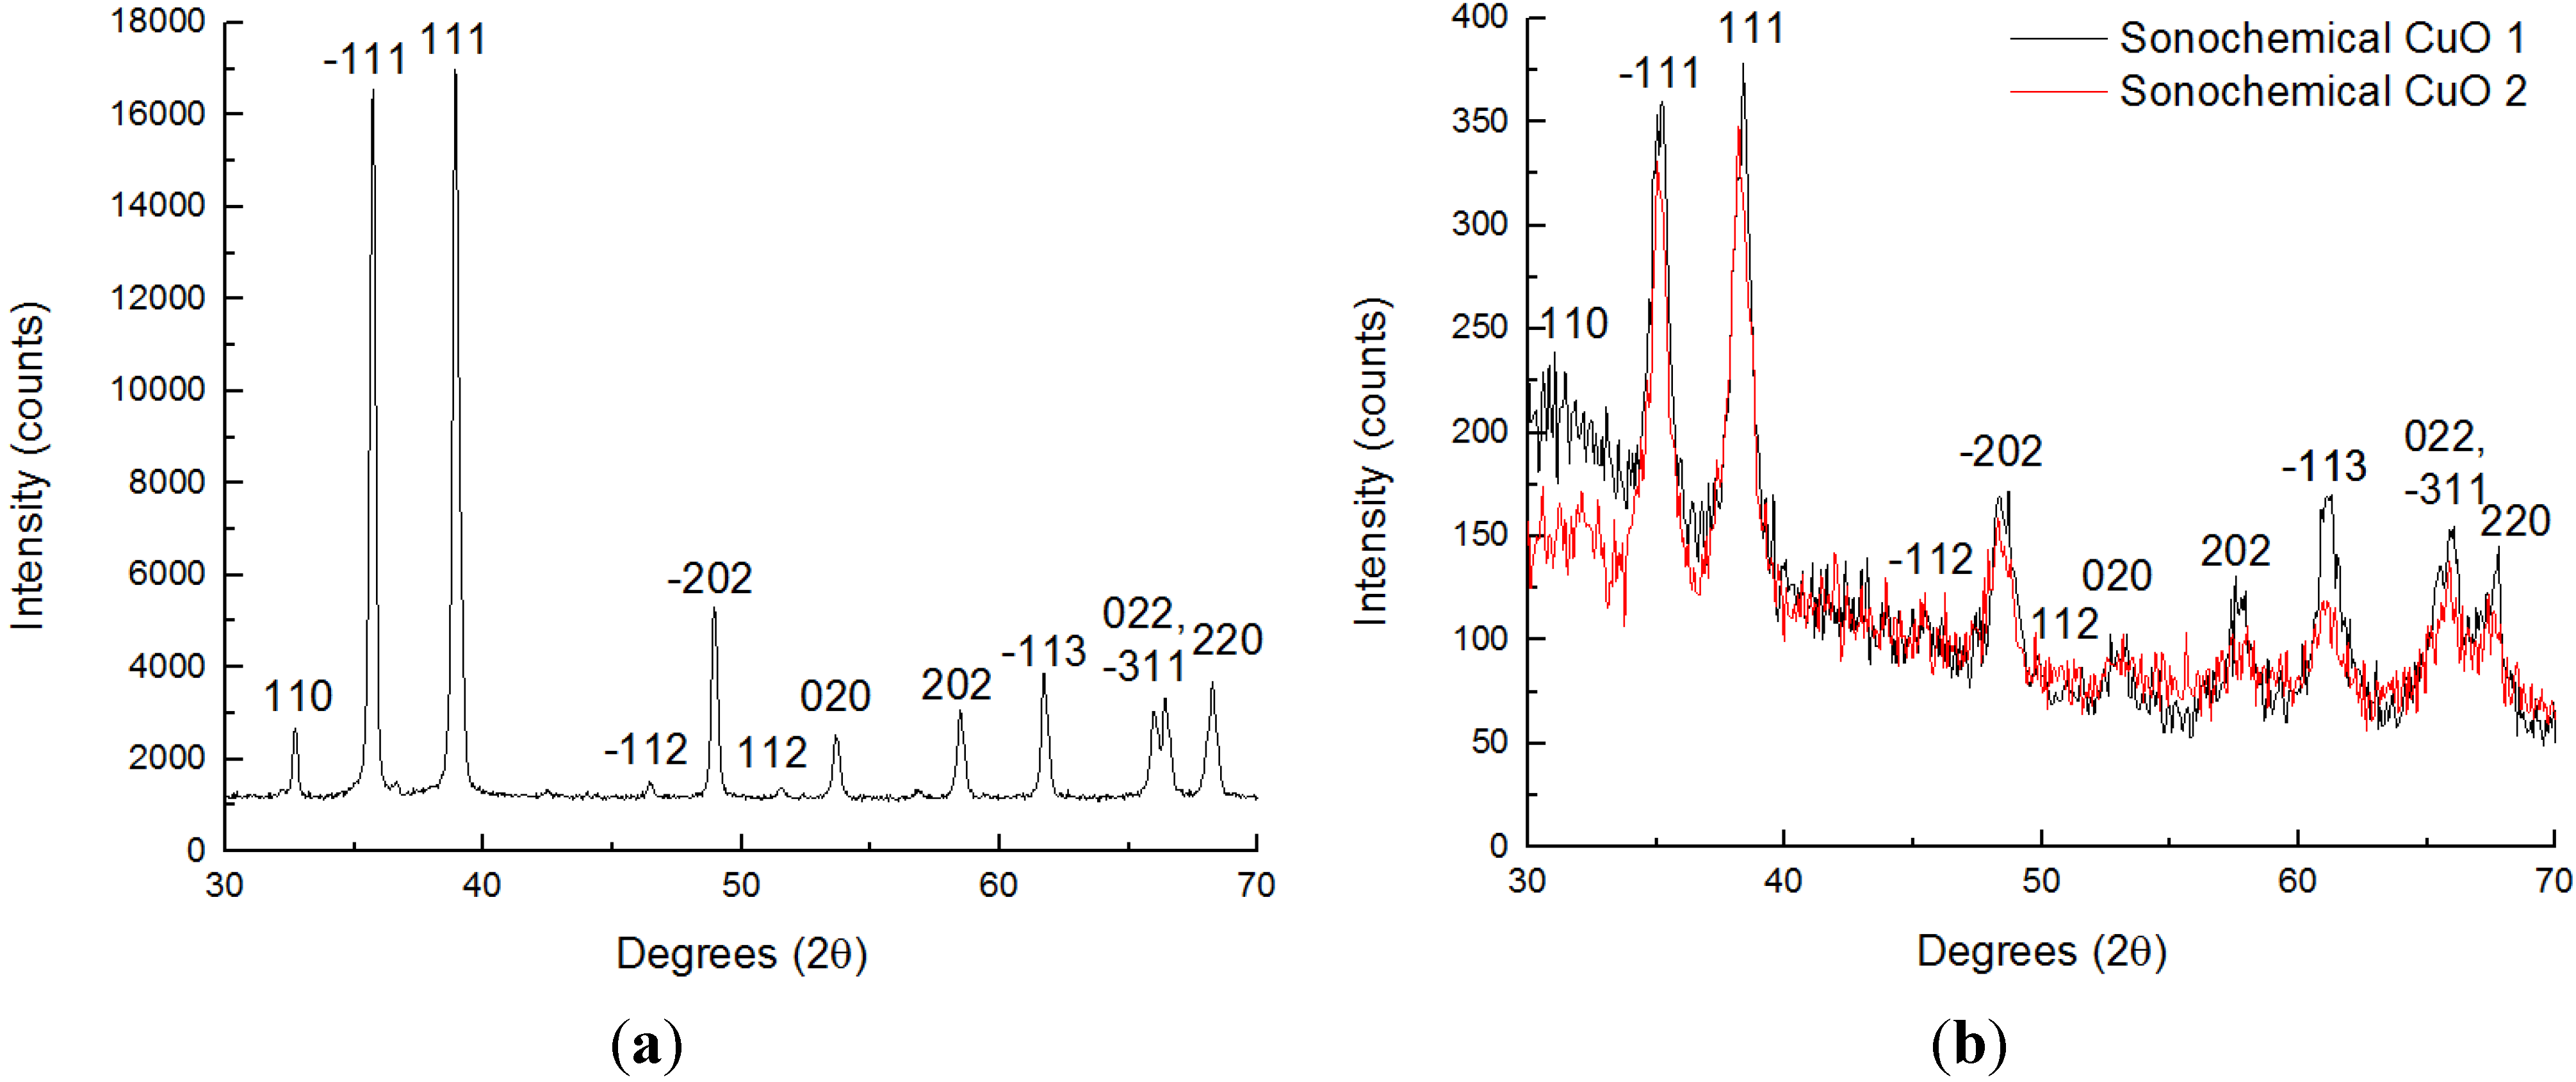
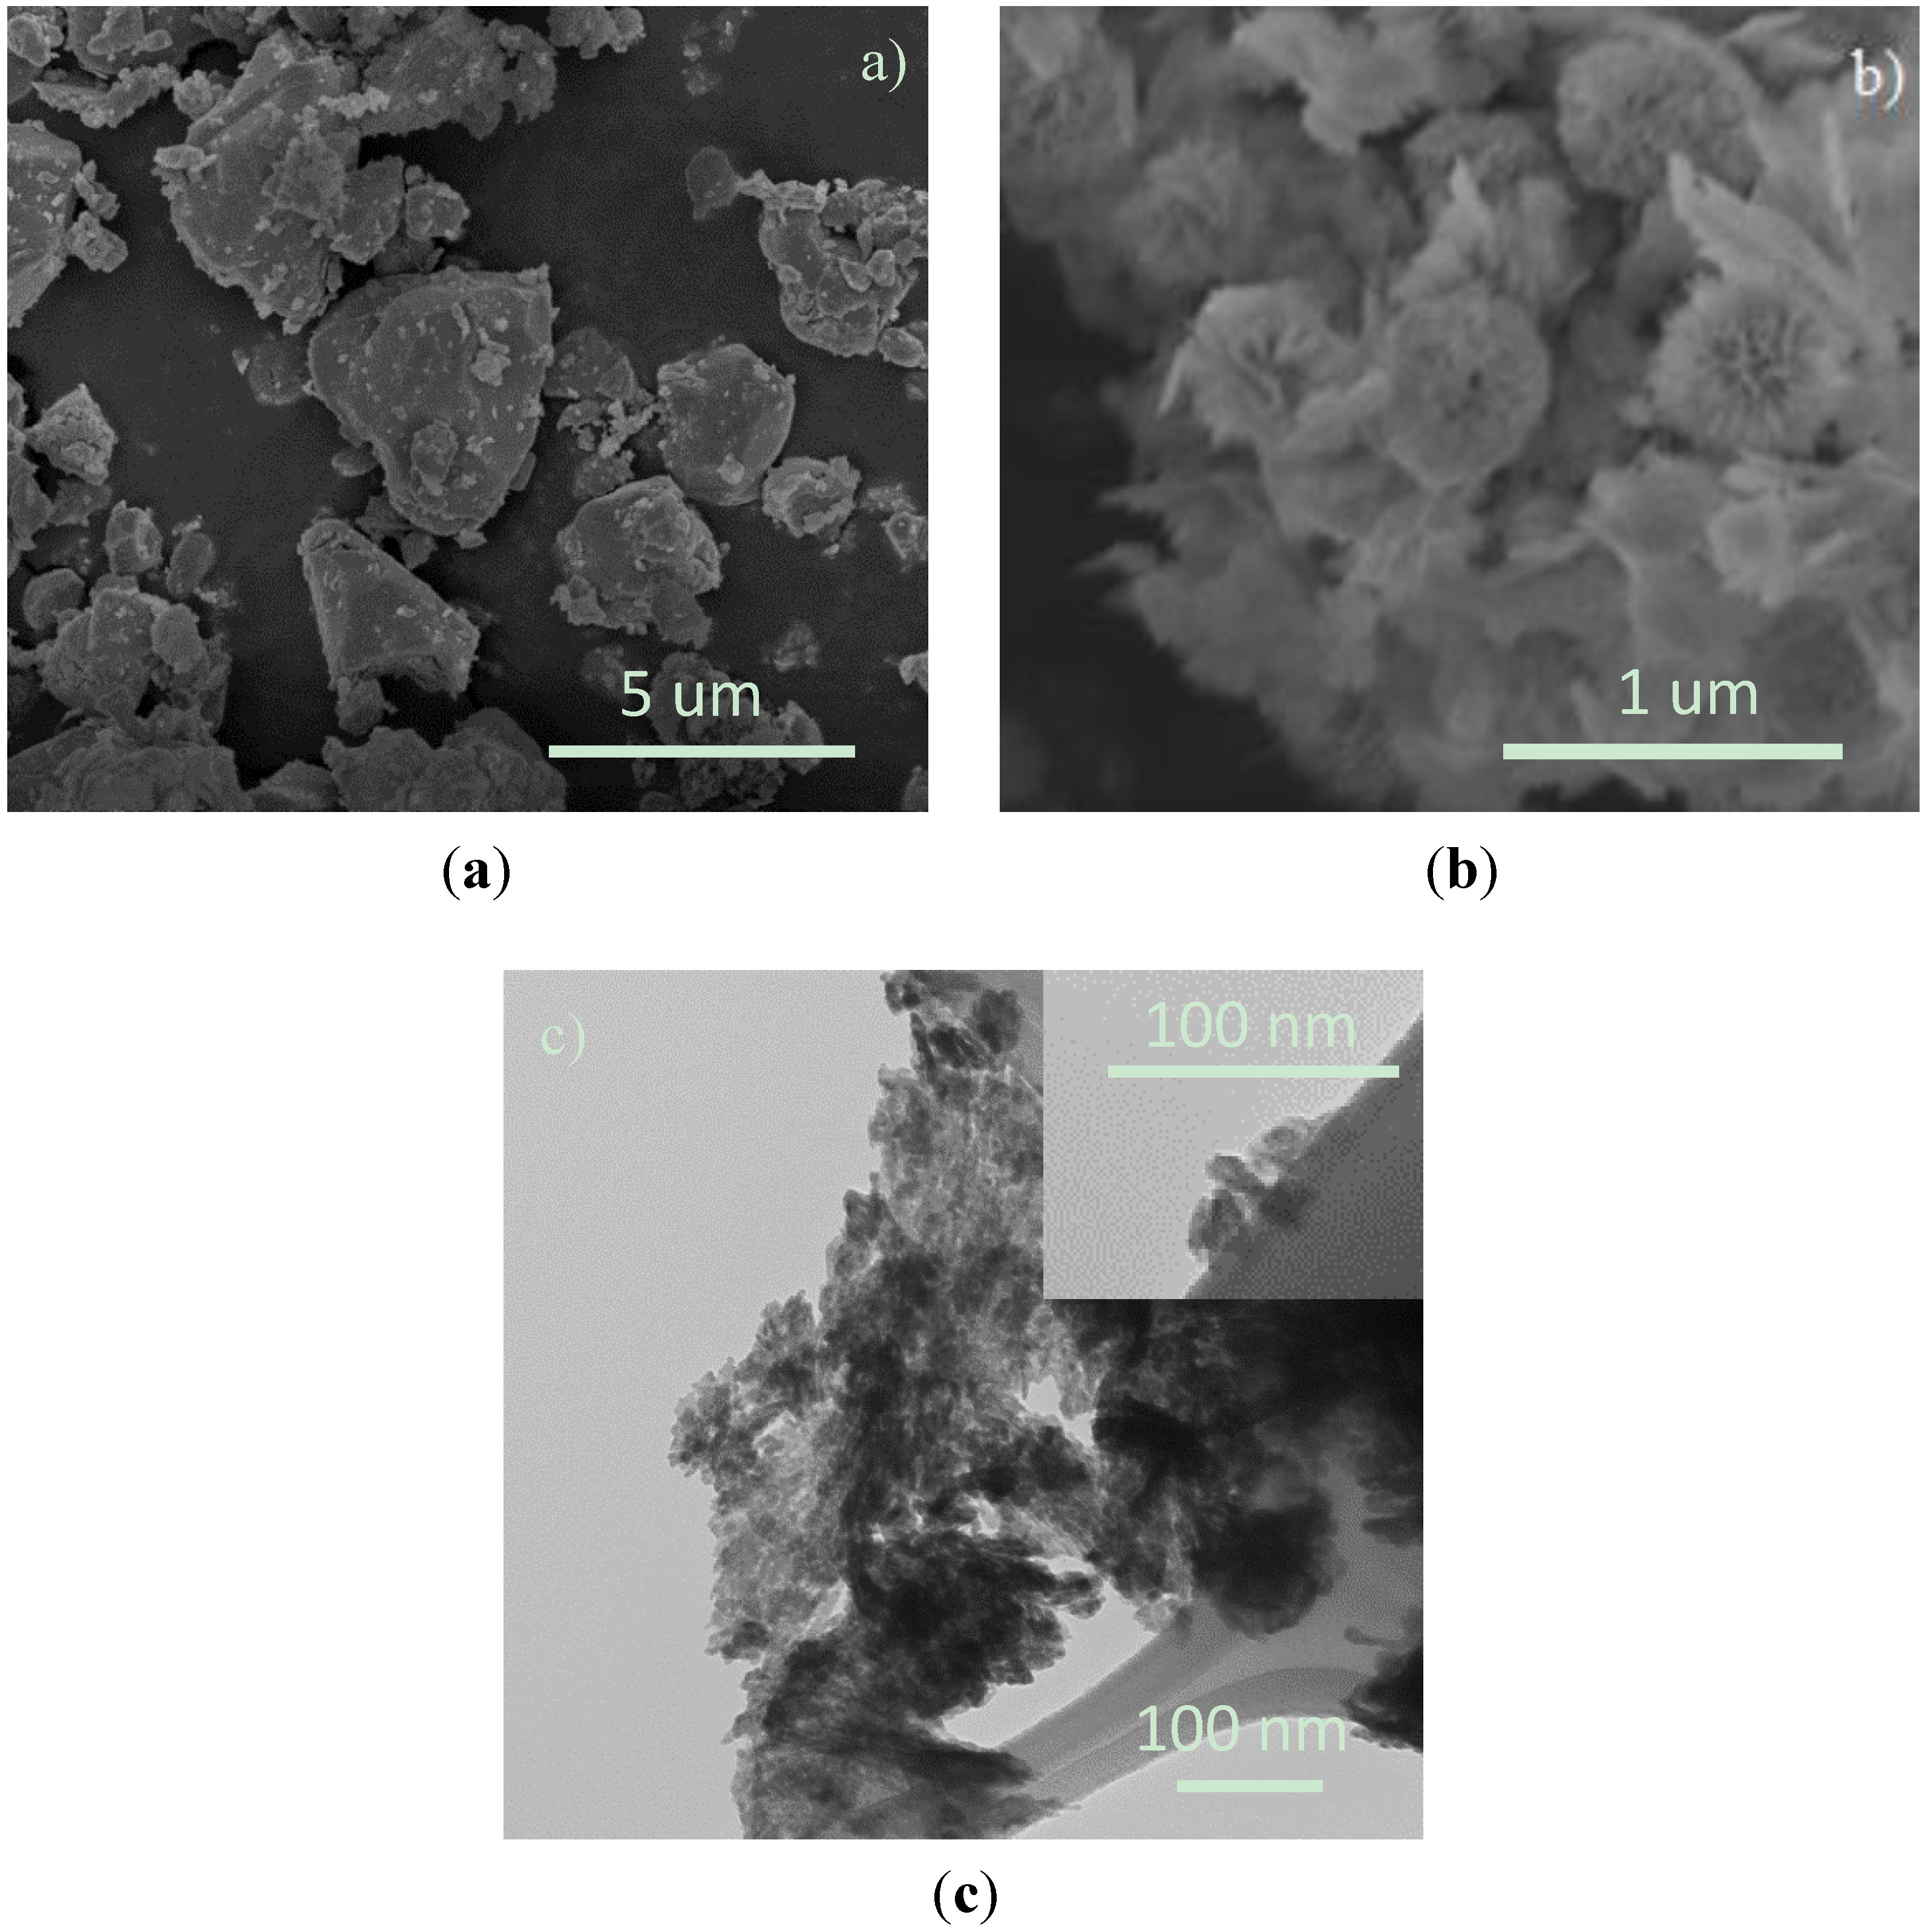
3.1. Structural Investigations

The crystallinity of the commercial and sonochemical CuO was investigated using XRD. As shown in Figure 1, both materials are monoclinic with C2/c symmetry, (JCPDS, 41–0254). The crystallinity of the commercial CuO is excellent, while the as prepared sonochemical CuO has broader peaks, indicative of smaller particle sizes. The morphologies of the commercial and sonochemical CuO were very different both in terms of absolute size and dimension, as shown in Figure 2. The commercial CuO has a quasi-spherical shape and a grain size of 2–5 microns (Figure 2a). The sonochemical CuO by comparison is a combination of mostly platelets with the occasional flower shaped dendrite (Figure 2b). From the TEM of these dendrites shown in Figure 2c, the length of the platelets are hundreds of nm, and made up of small 20–30 nm rods. After annealing at 500 °C for two hours, the sonochemical CuO had experienced minimal aggregation and ripening, indicating that over the range of temperatures that these materials are processed, morphological changes were minimal. The surface area of the sonochemical CuO was determined to be 183 m2/g, and that of the commercial CuO was 2.6 m2/g after both had been heated at 320 °C.
Figure 1. X-ray powder diffraction patterns for (a) commercial CuO and (b) sonochemical CuO.
Chemosensors 04 00001 g001
Figure 2. Electron microscopy images of (a) commercial and (b) sonochemical CuO. In (c) a TEM image is shown showing that the structure of sonochemical CuO is made of heterostructured platelets of low aspect ratio rods. A small clump of several rods of 20–30 nm is shown in the inset.
Chemosensors 04 00001 g002

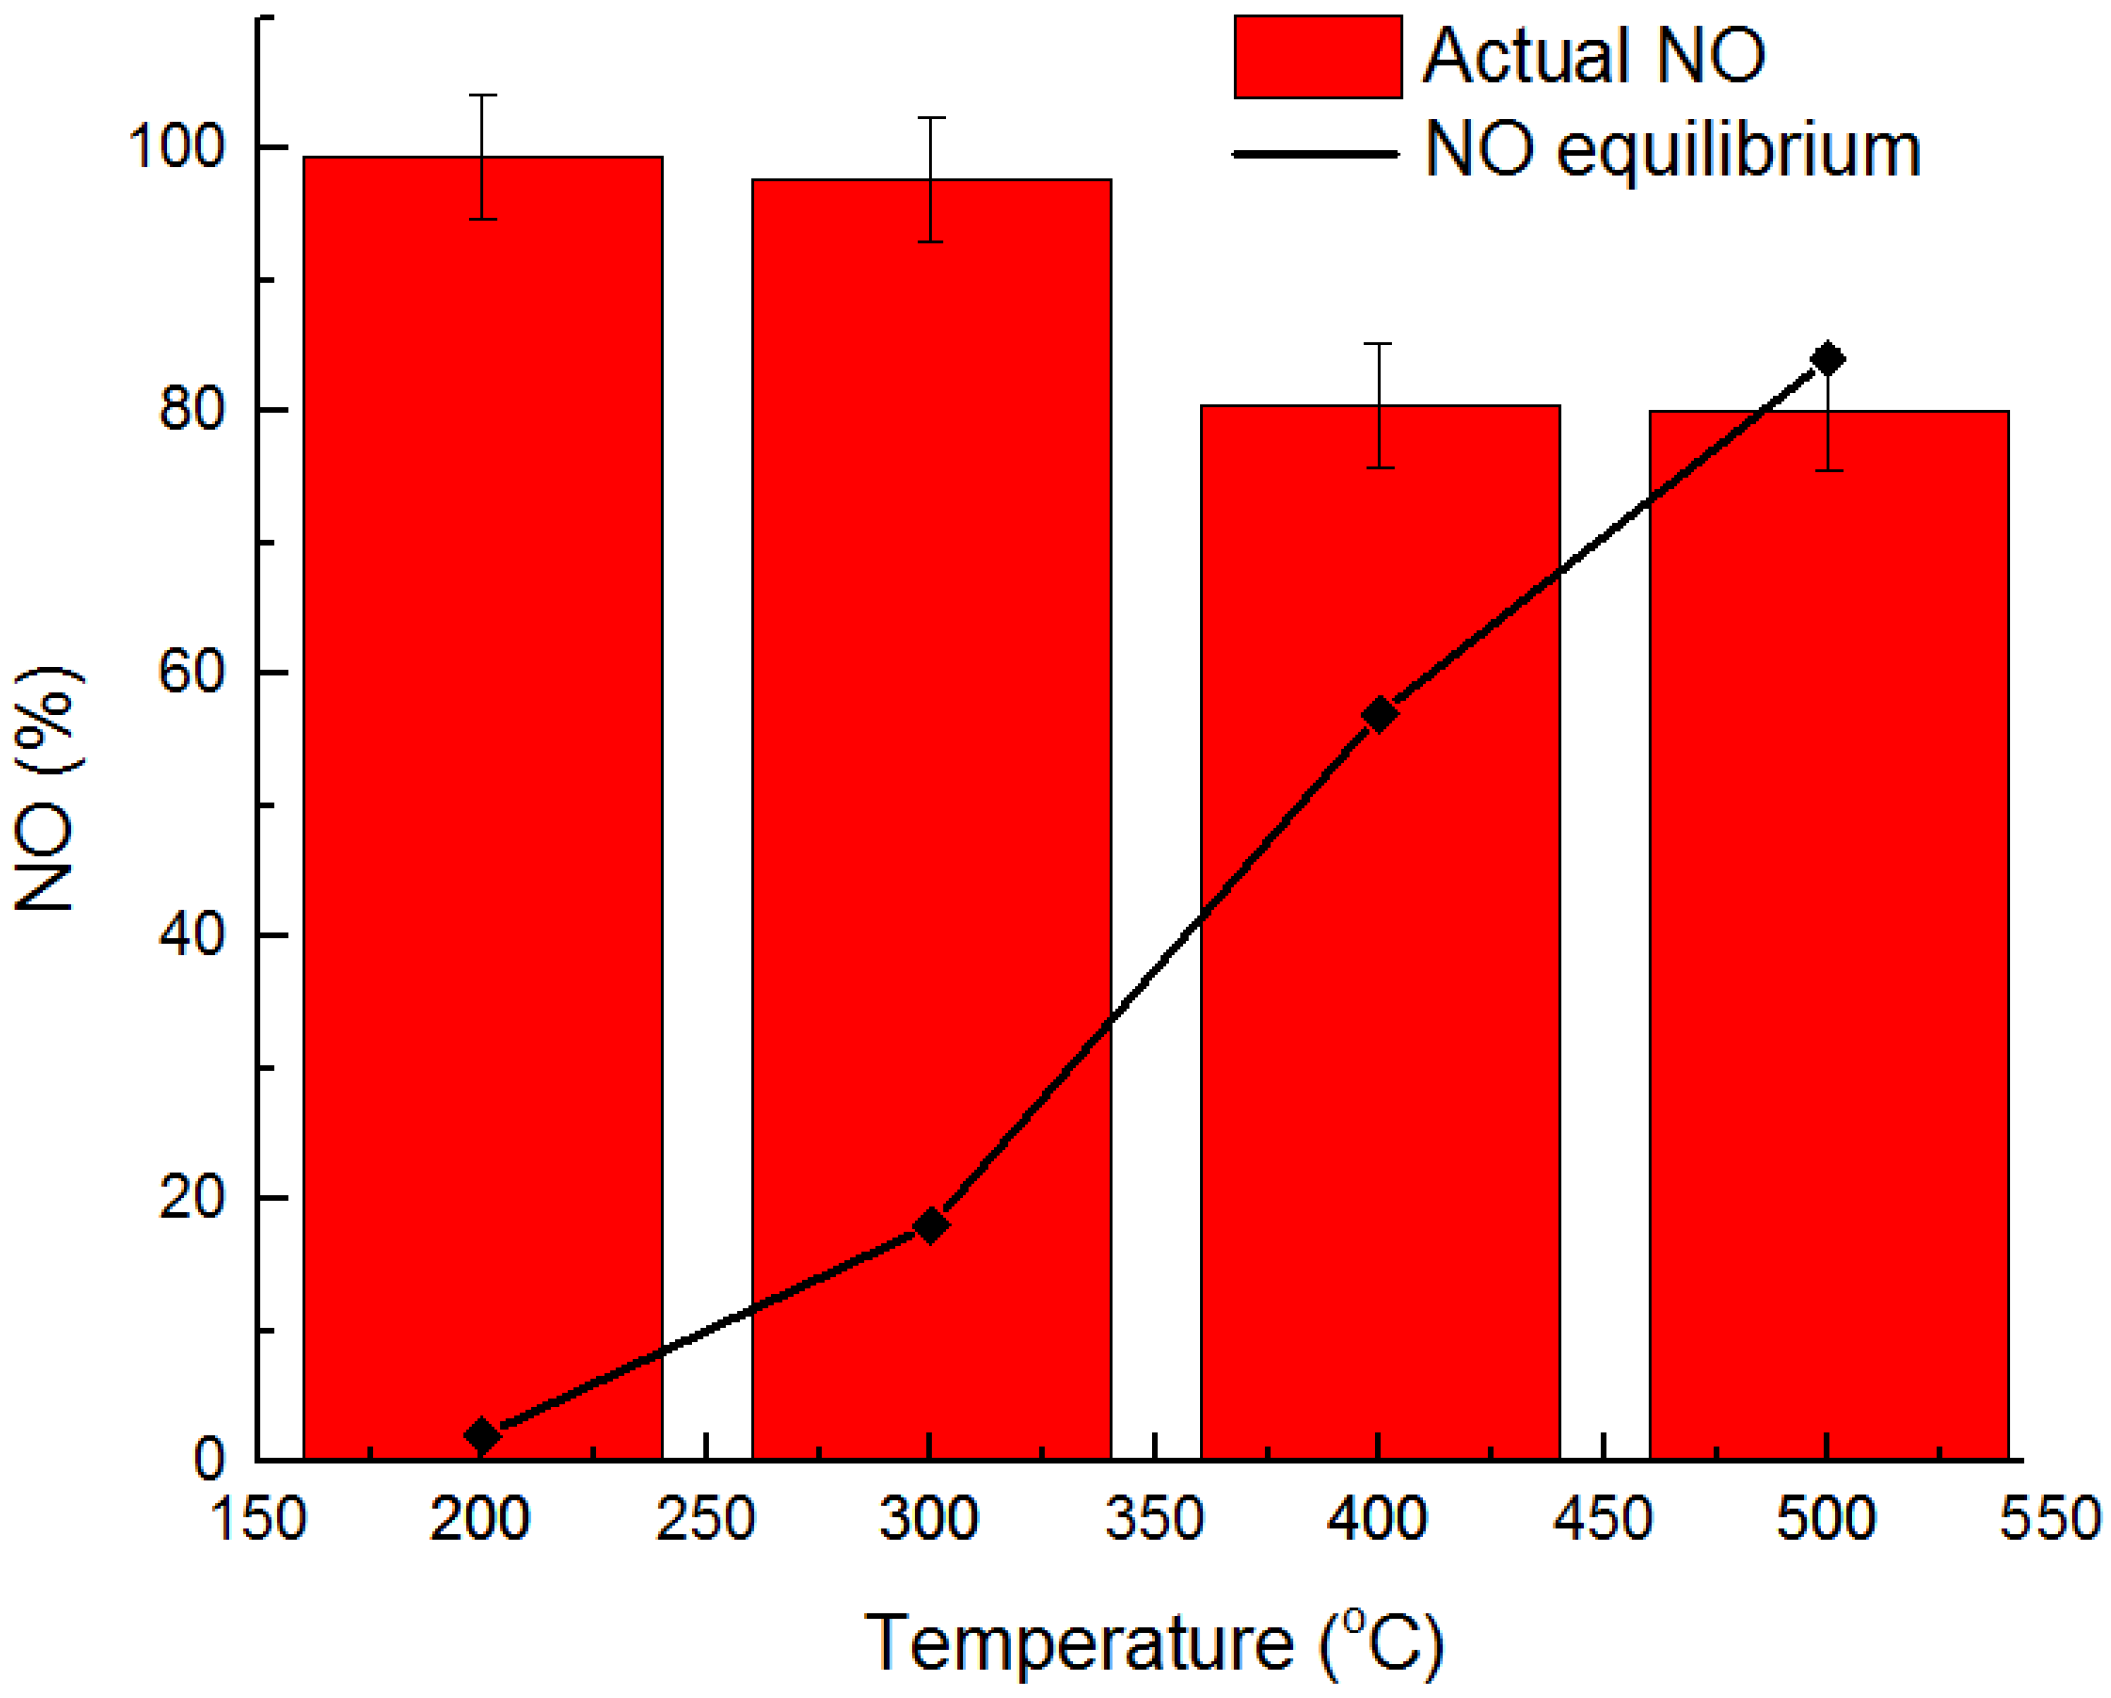
3.2. NOx Equilibration Experiments

Figure 3 shows the amounts of NO detected by the chemiluminescence analyzer for gas mixtures flowing through the reaction vessel containing sonochemical CuO at temperatures ranging from 200–500 °C. In addition, it also shows the equilibrium concentration of NO at that temperature based on ΔH and ΔS values from the literature. It can be seen that, at 200 °C, barely no equilibration occurs and that at 300 °C some equilibration may occur (<2%), and is within error. At 400 °C there is considerable equilibration, and thermodynamic equilibrium mixture is reached at 500 °C.
Figure 3. NO (300 ppm) in 10% O2 was flowed from calibrated MFCs into NOx analyzer and the concentration of NO detected by the instrument was consistently about 297 ppm. This NO was then passed through a heated reaction vessel containing sonochemical CuO at 200, 300, 400, and 500 °C and onto the NOx analyzer. The % NO that was detected is shown by the red plots. The NO calculated from the free energy at the different temperatures are plotted as the black circles (the line joining them is an aid to the eye).
Chemosensors 04 00001 g003

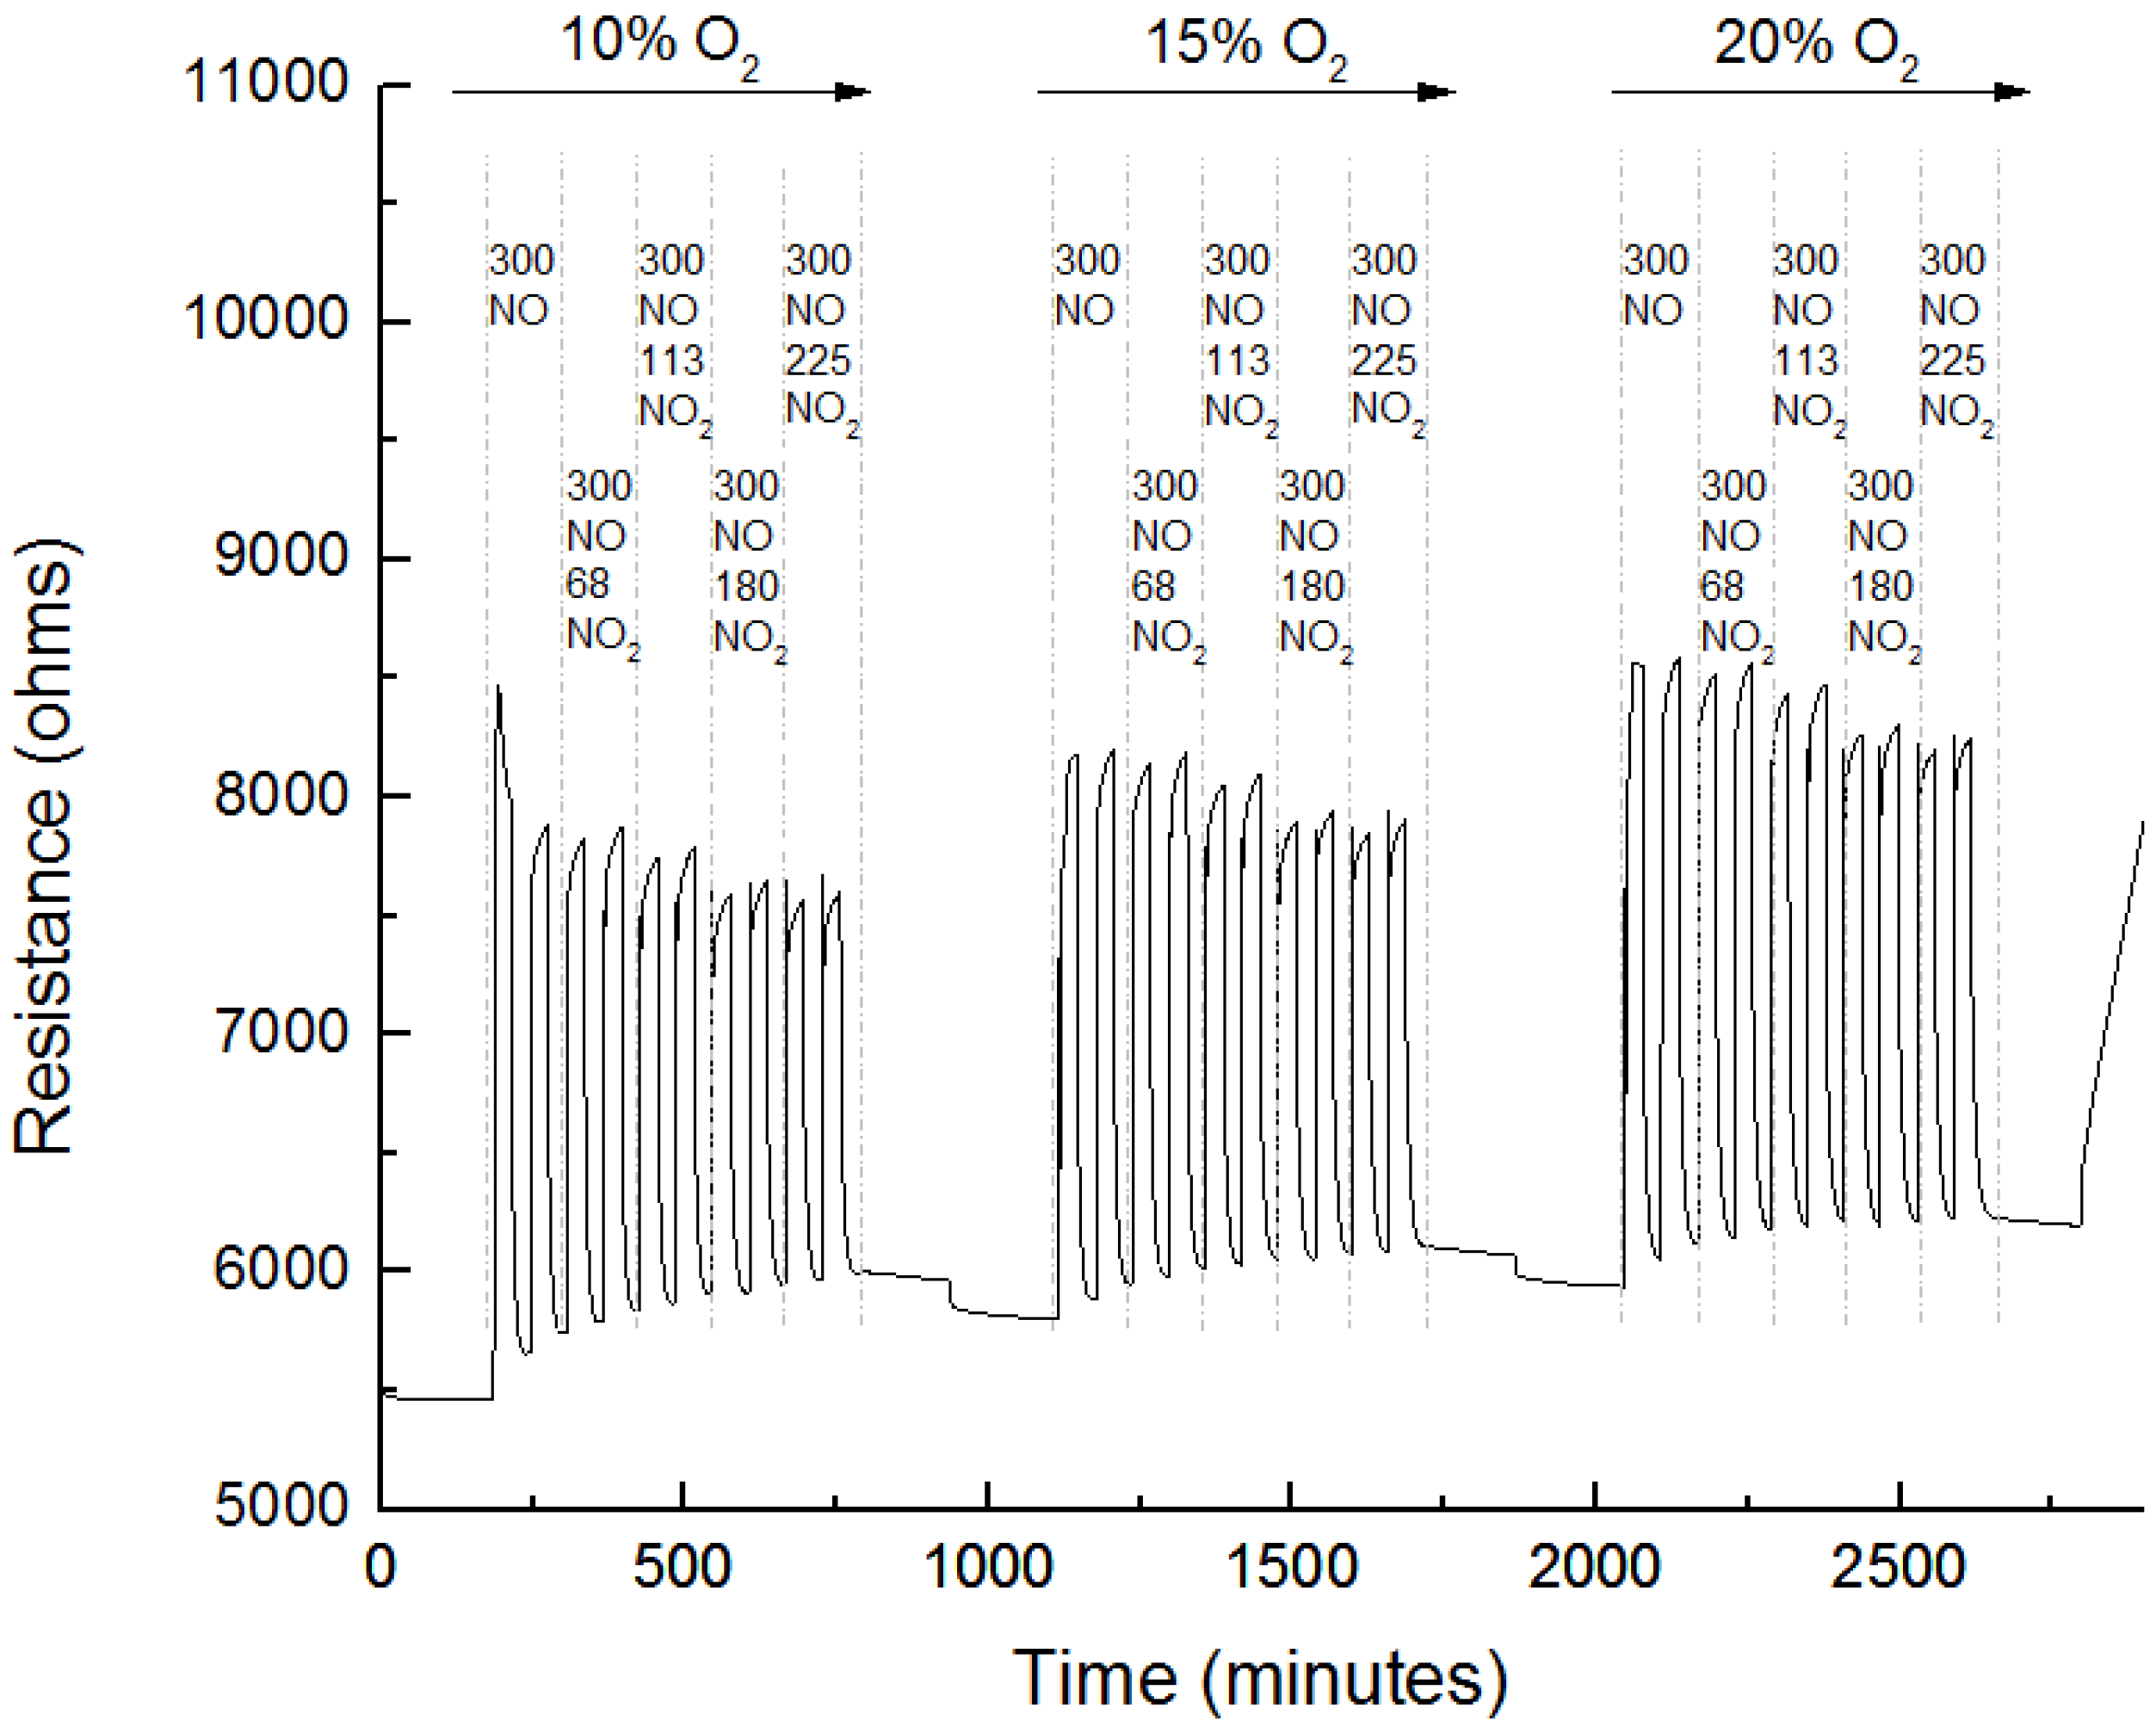
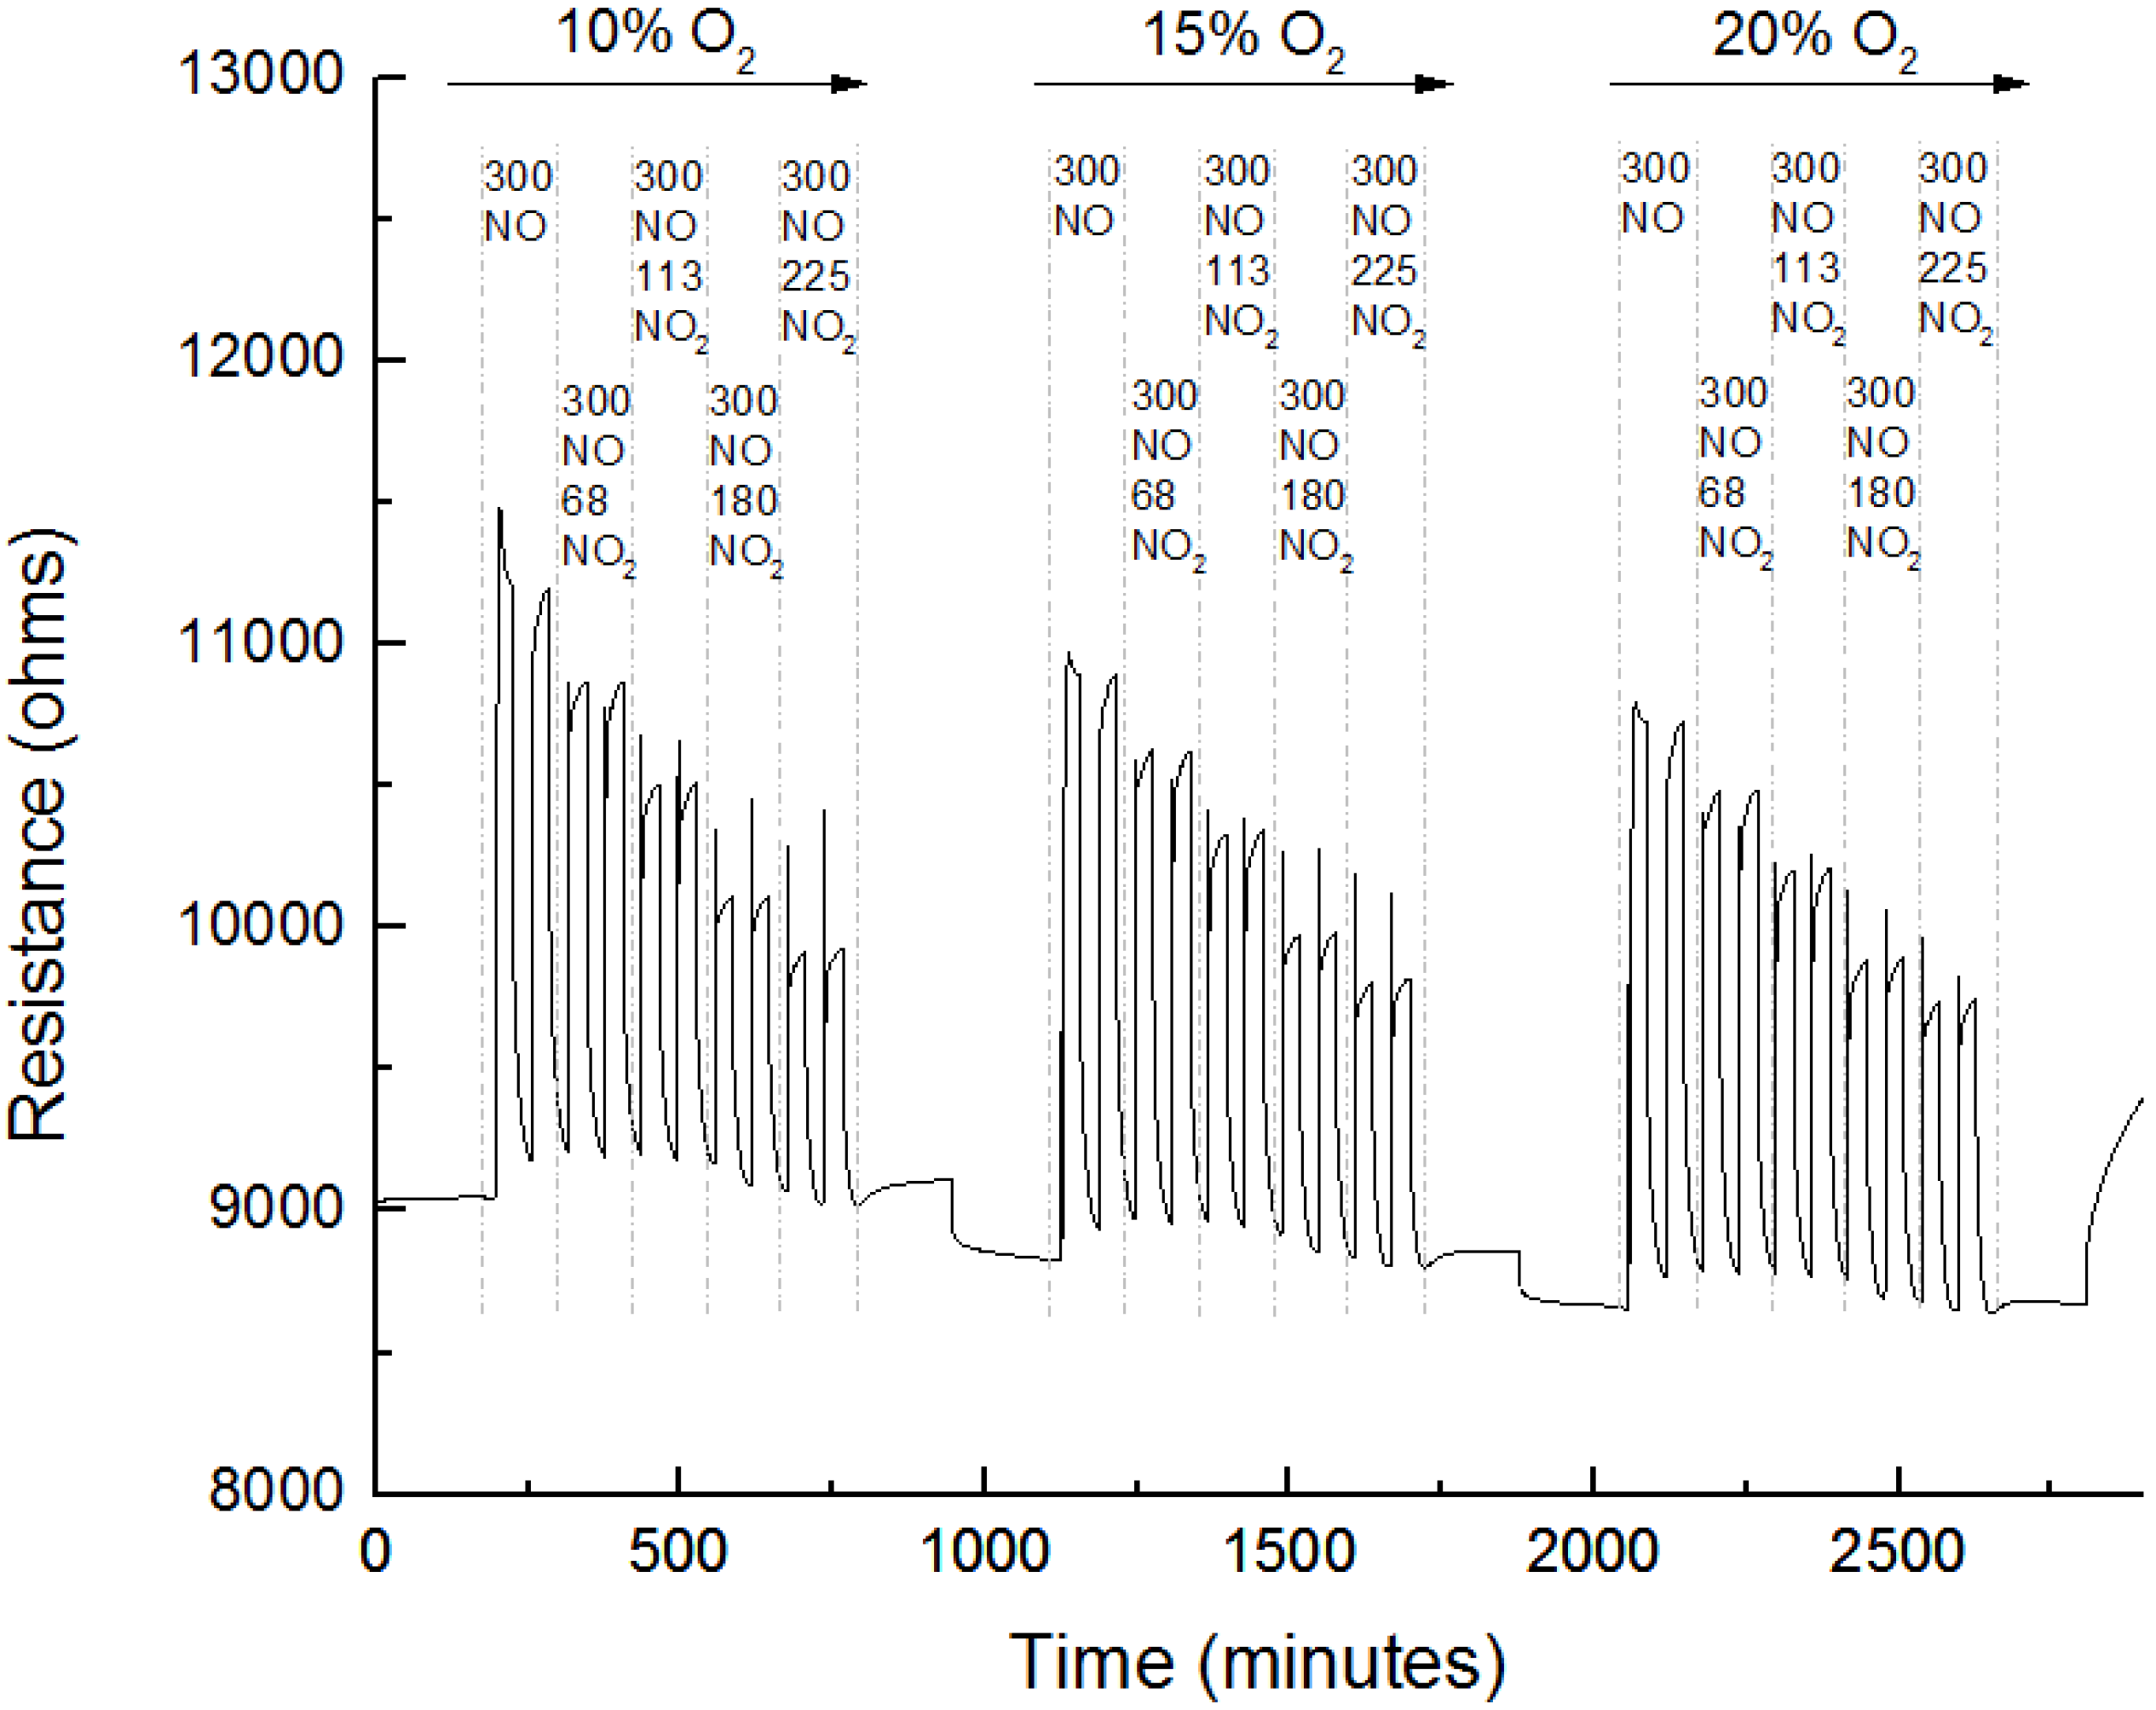
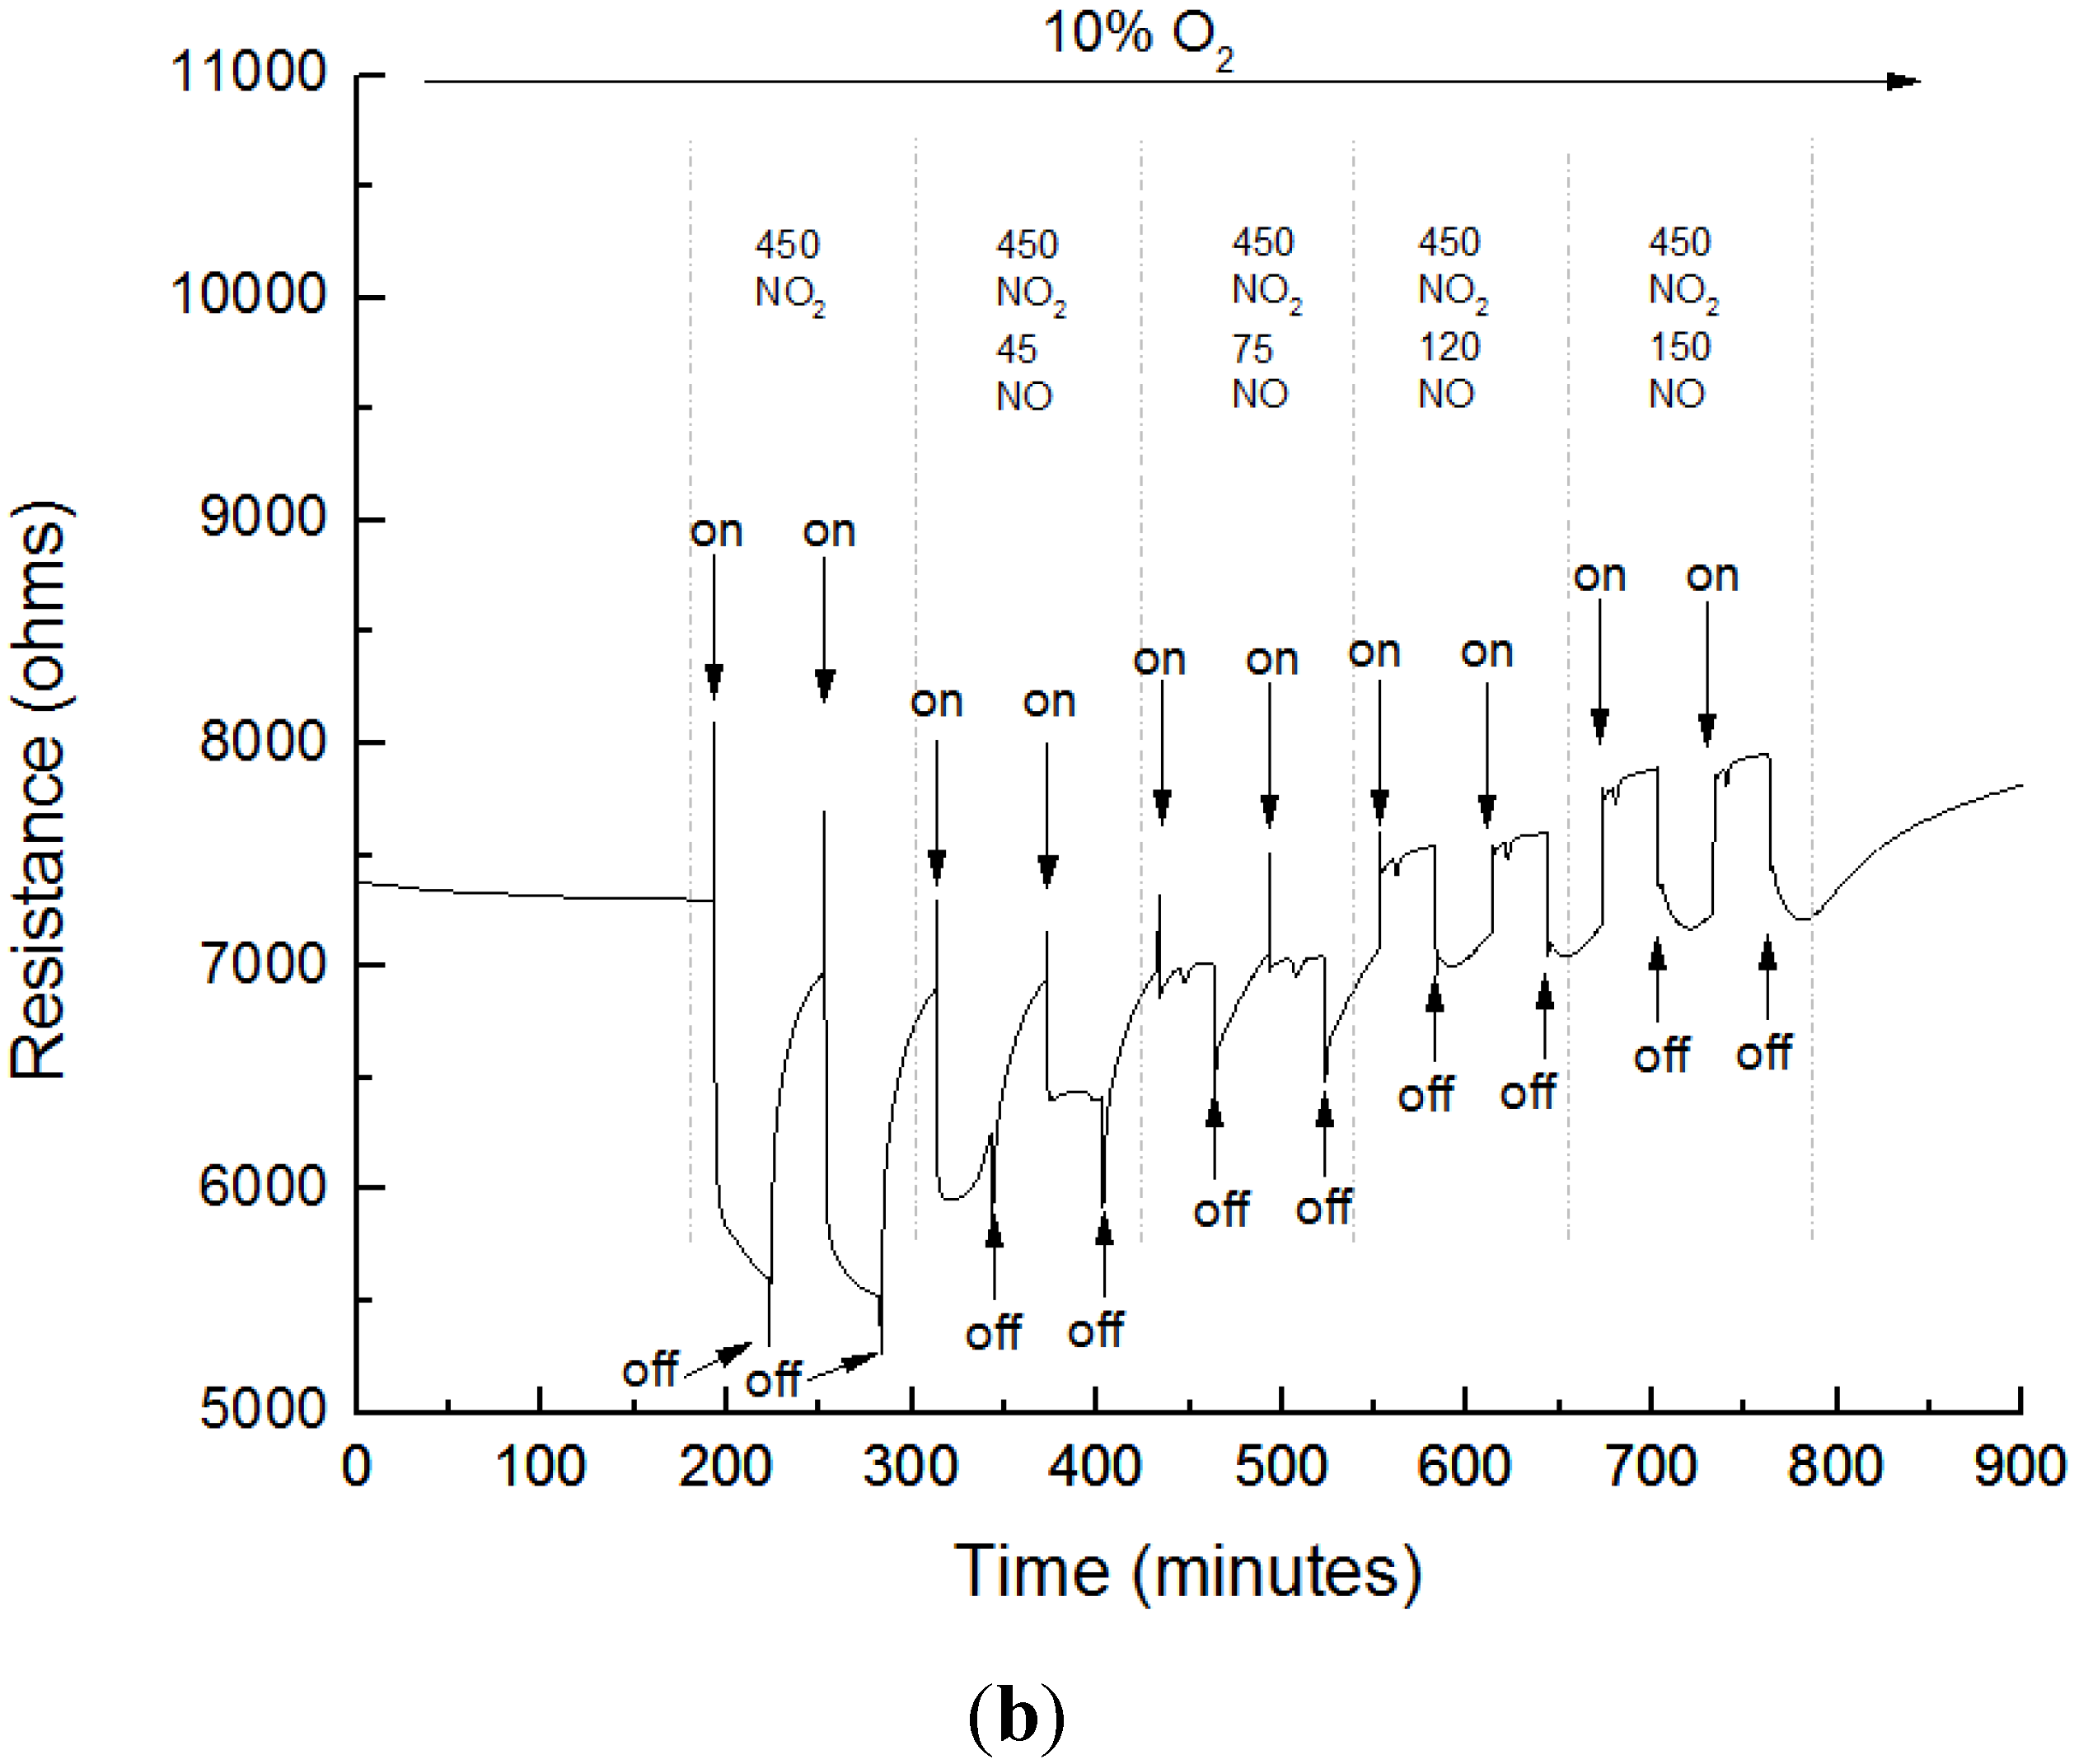
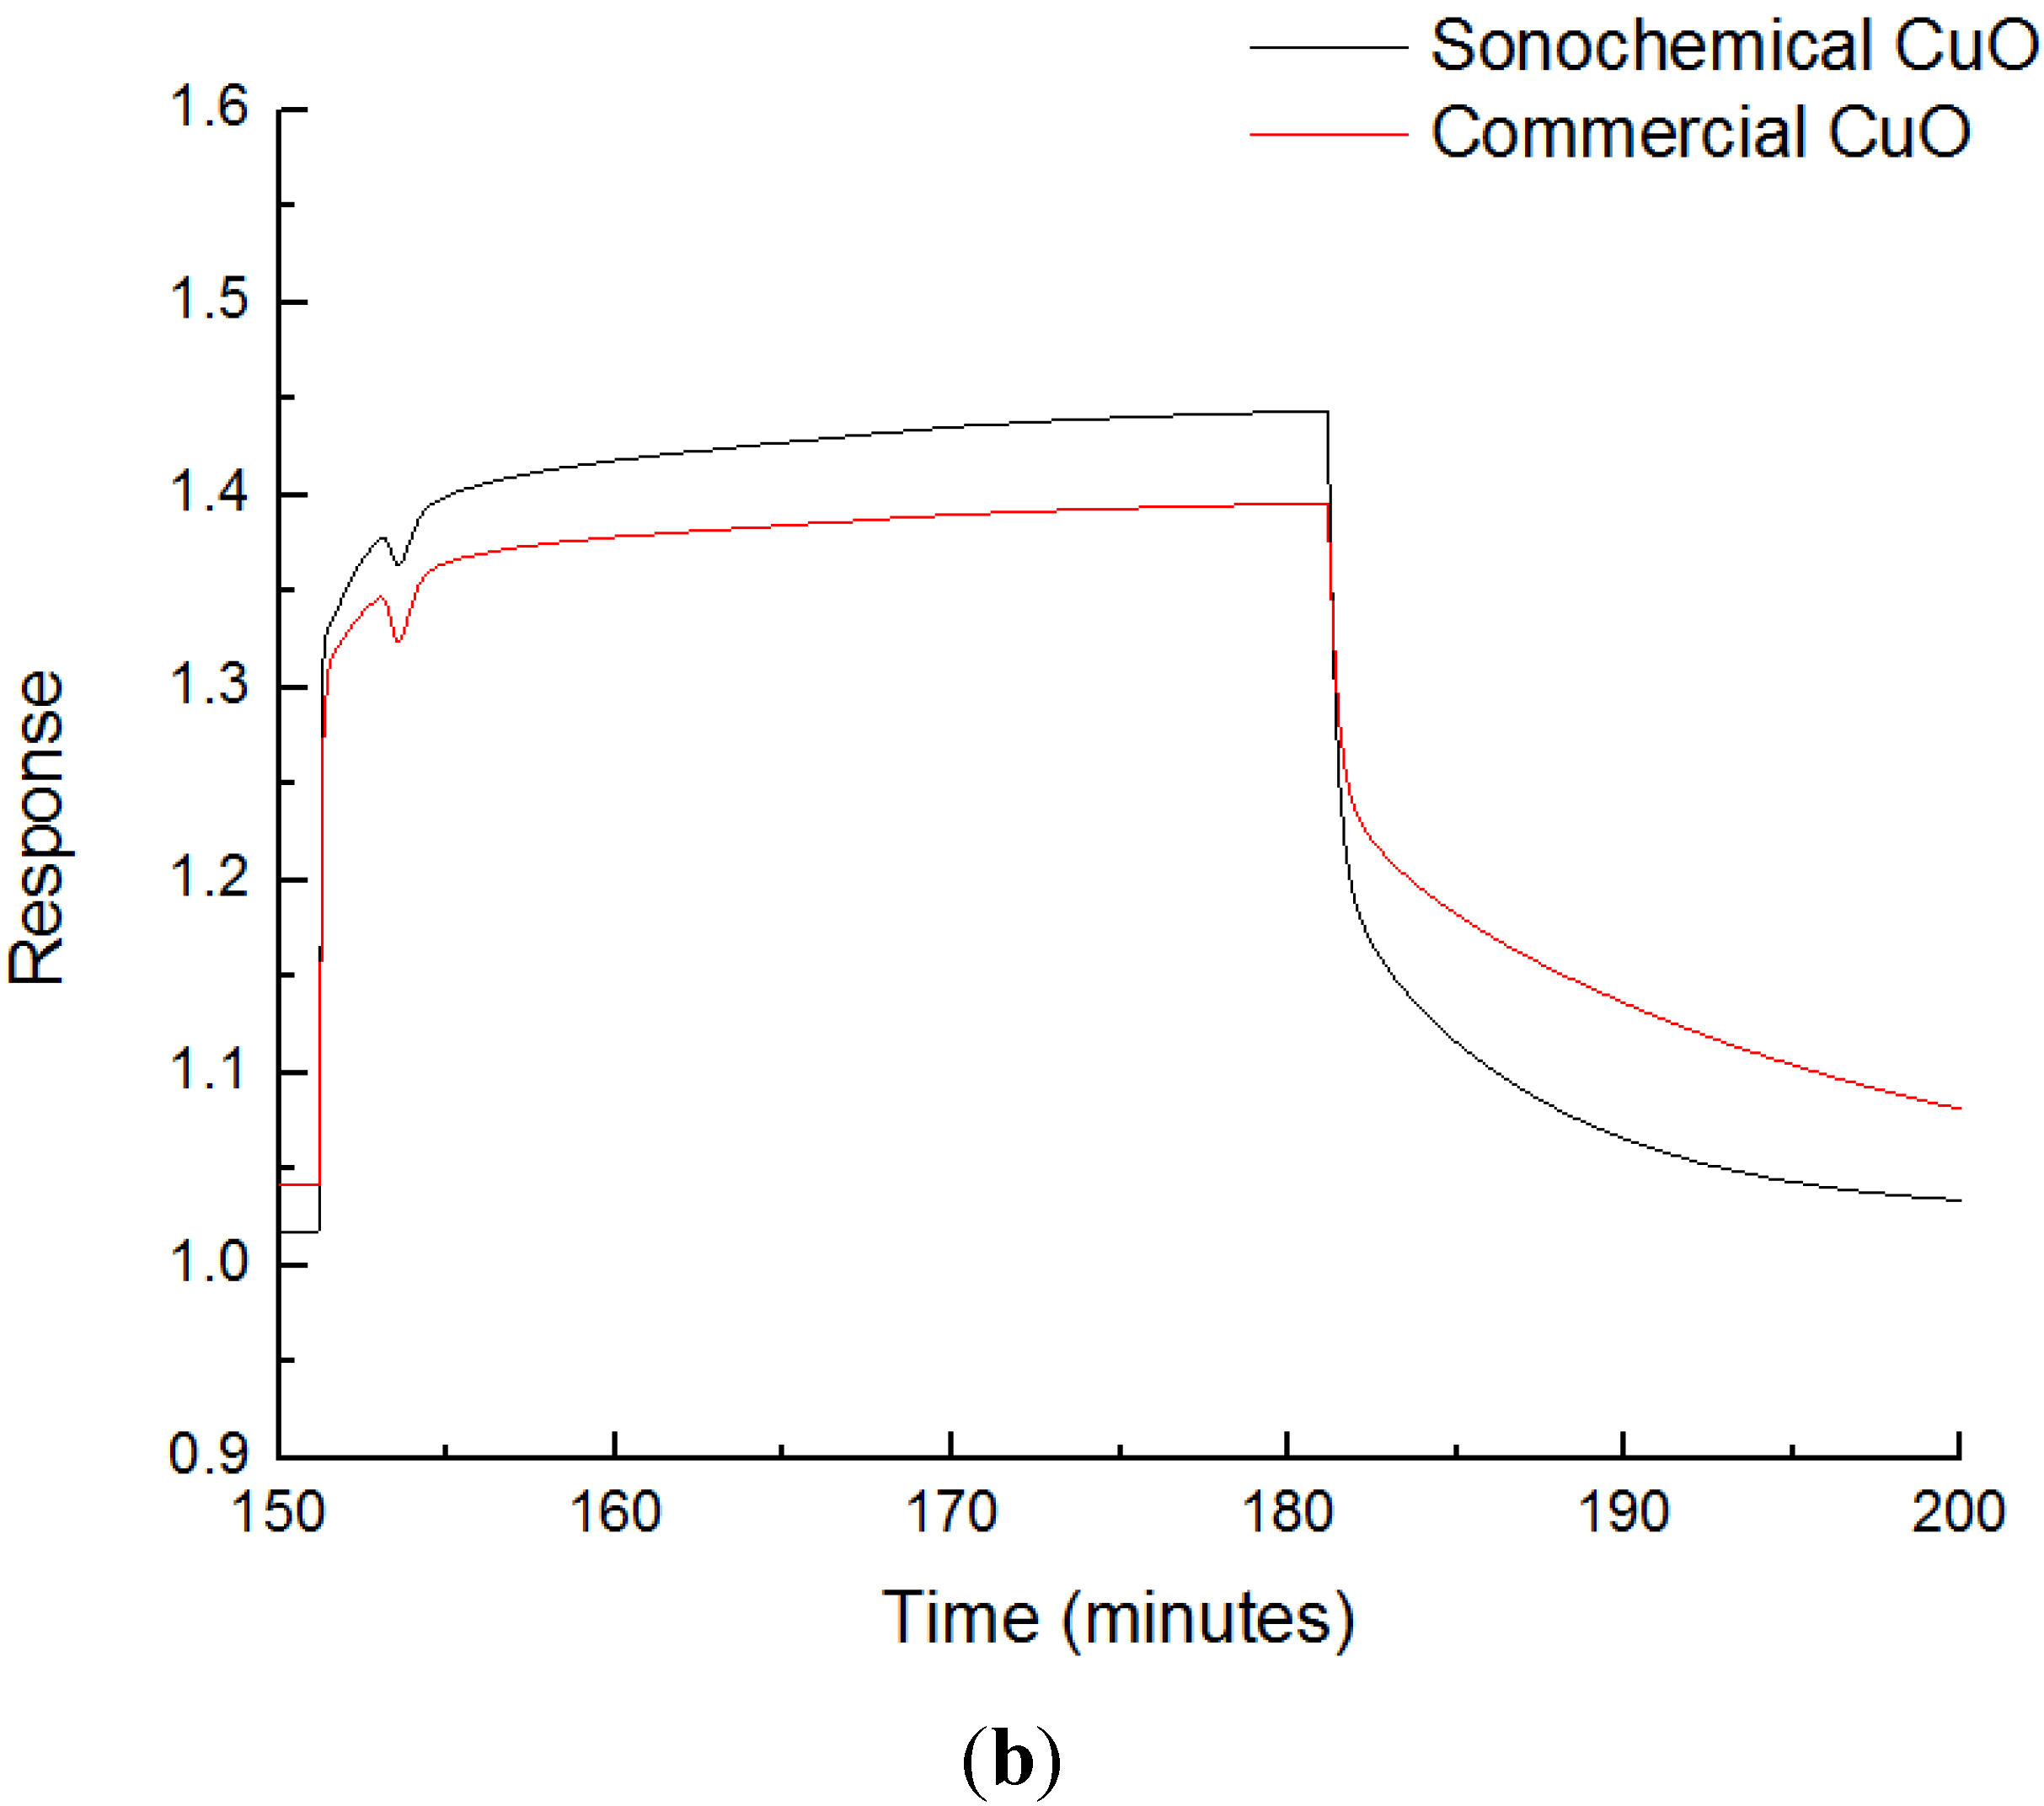
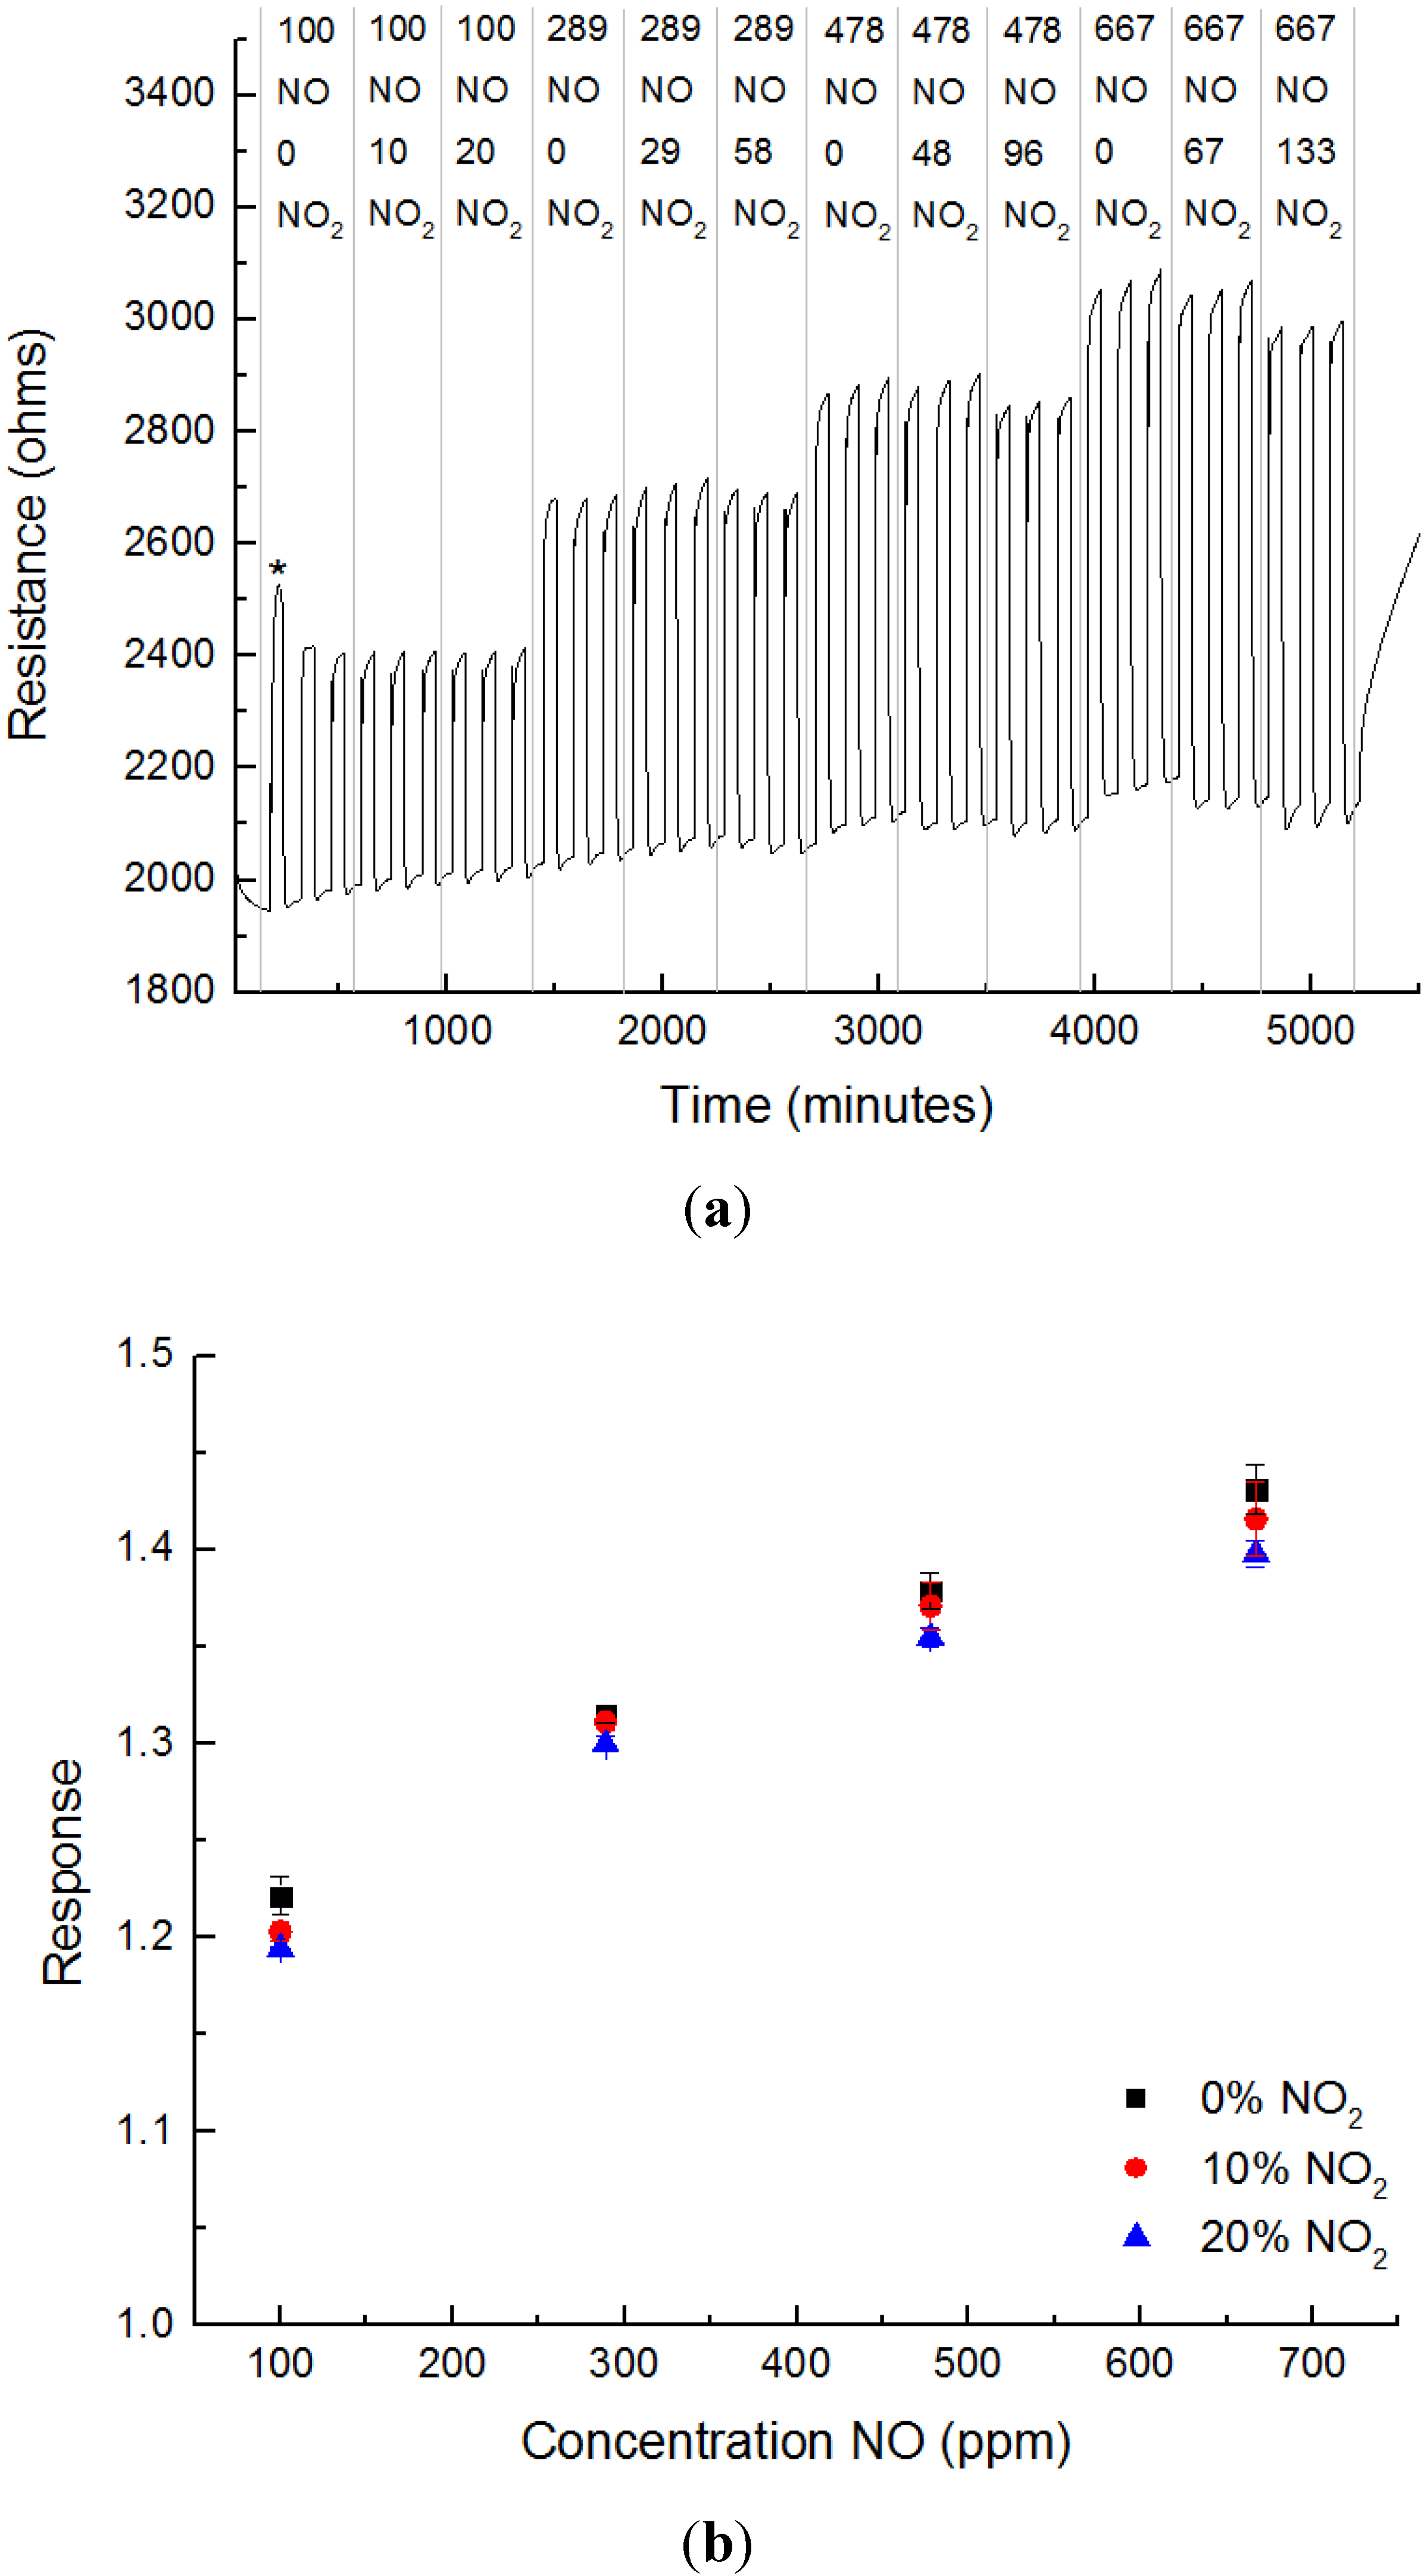
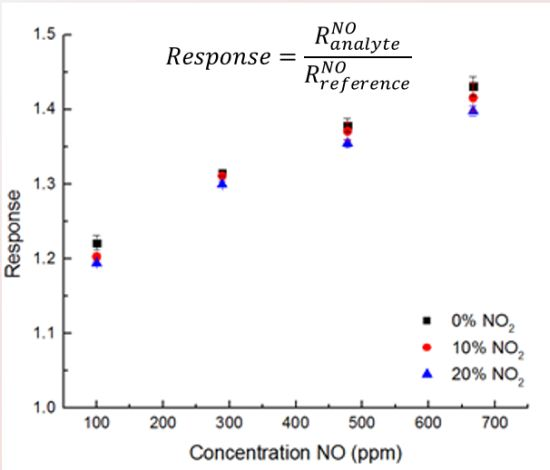
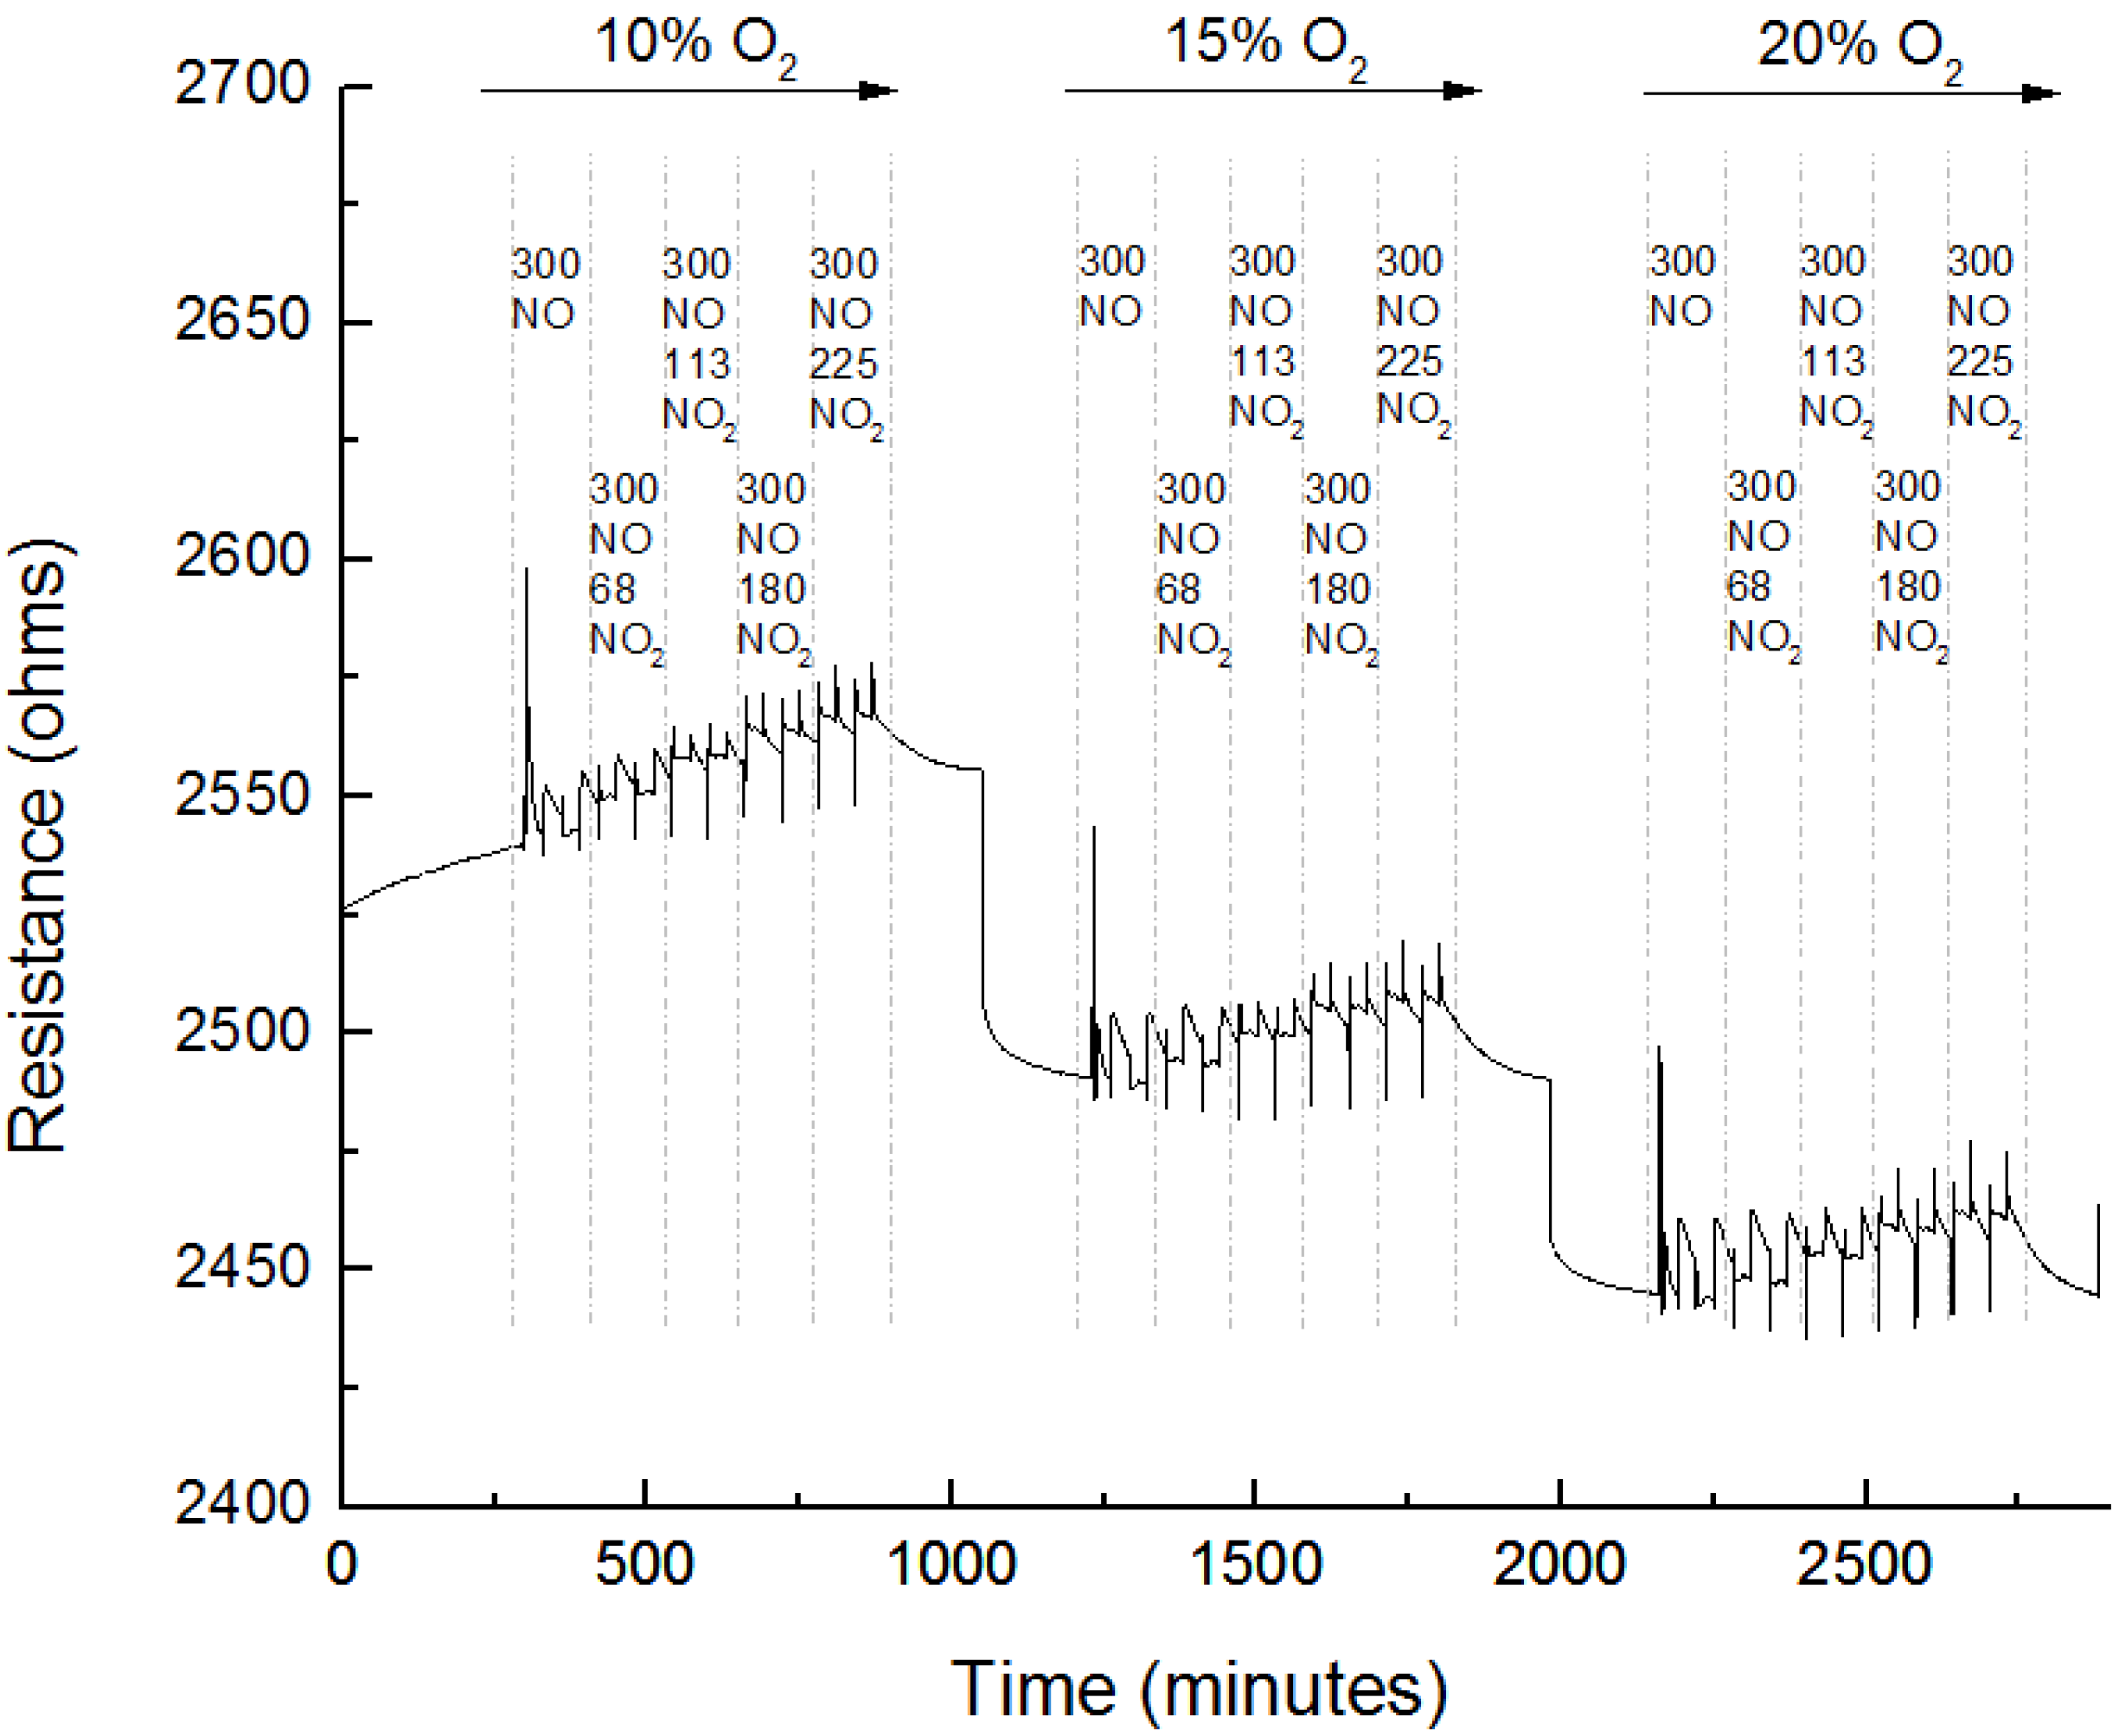
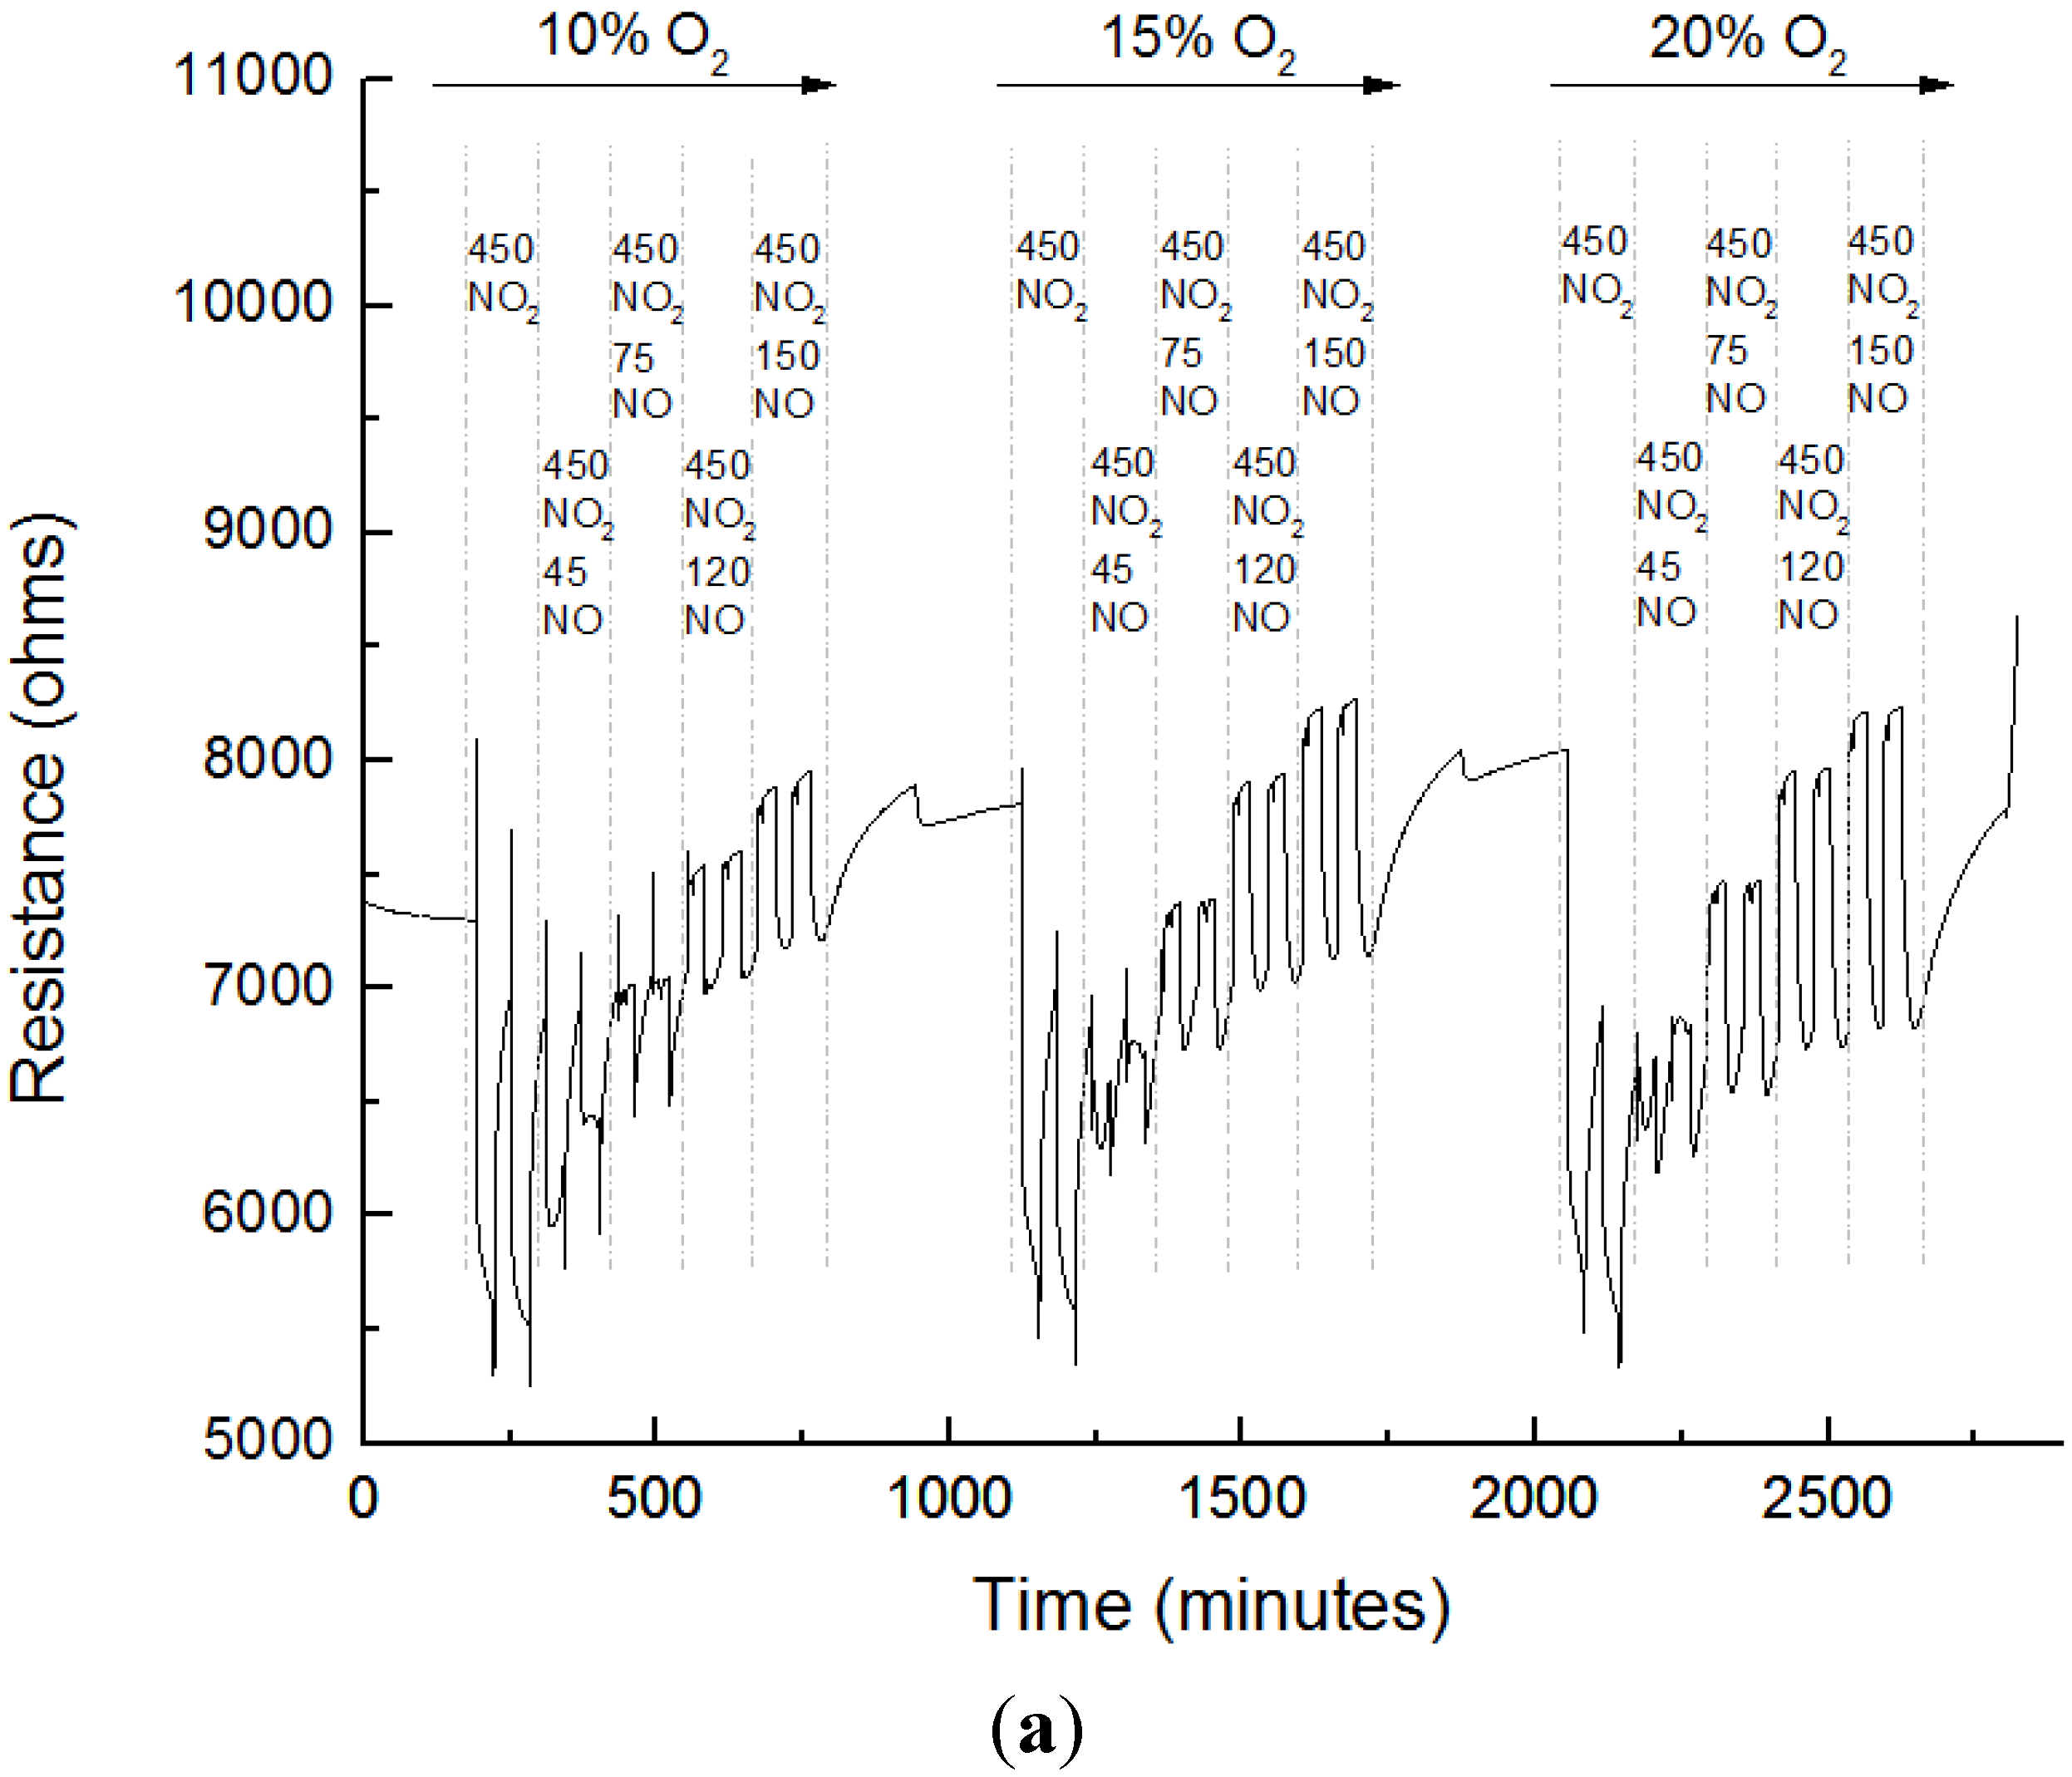
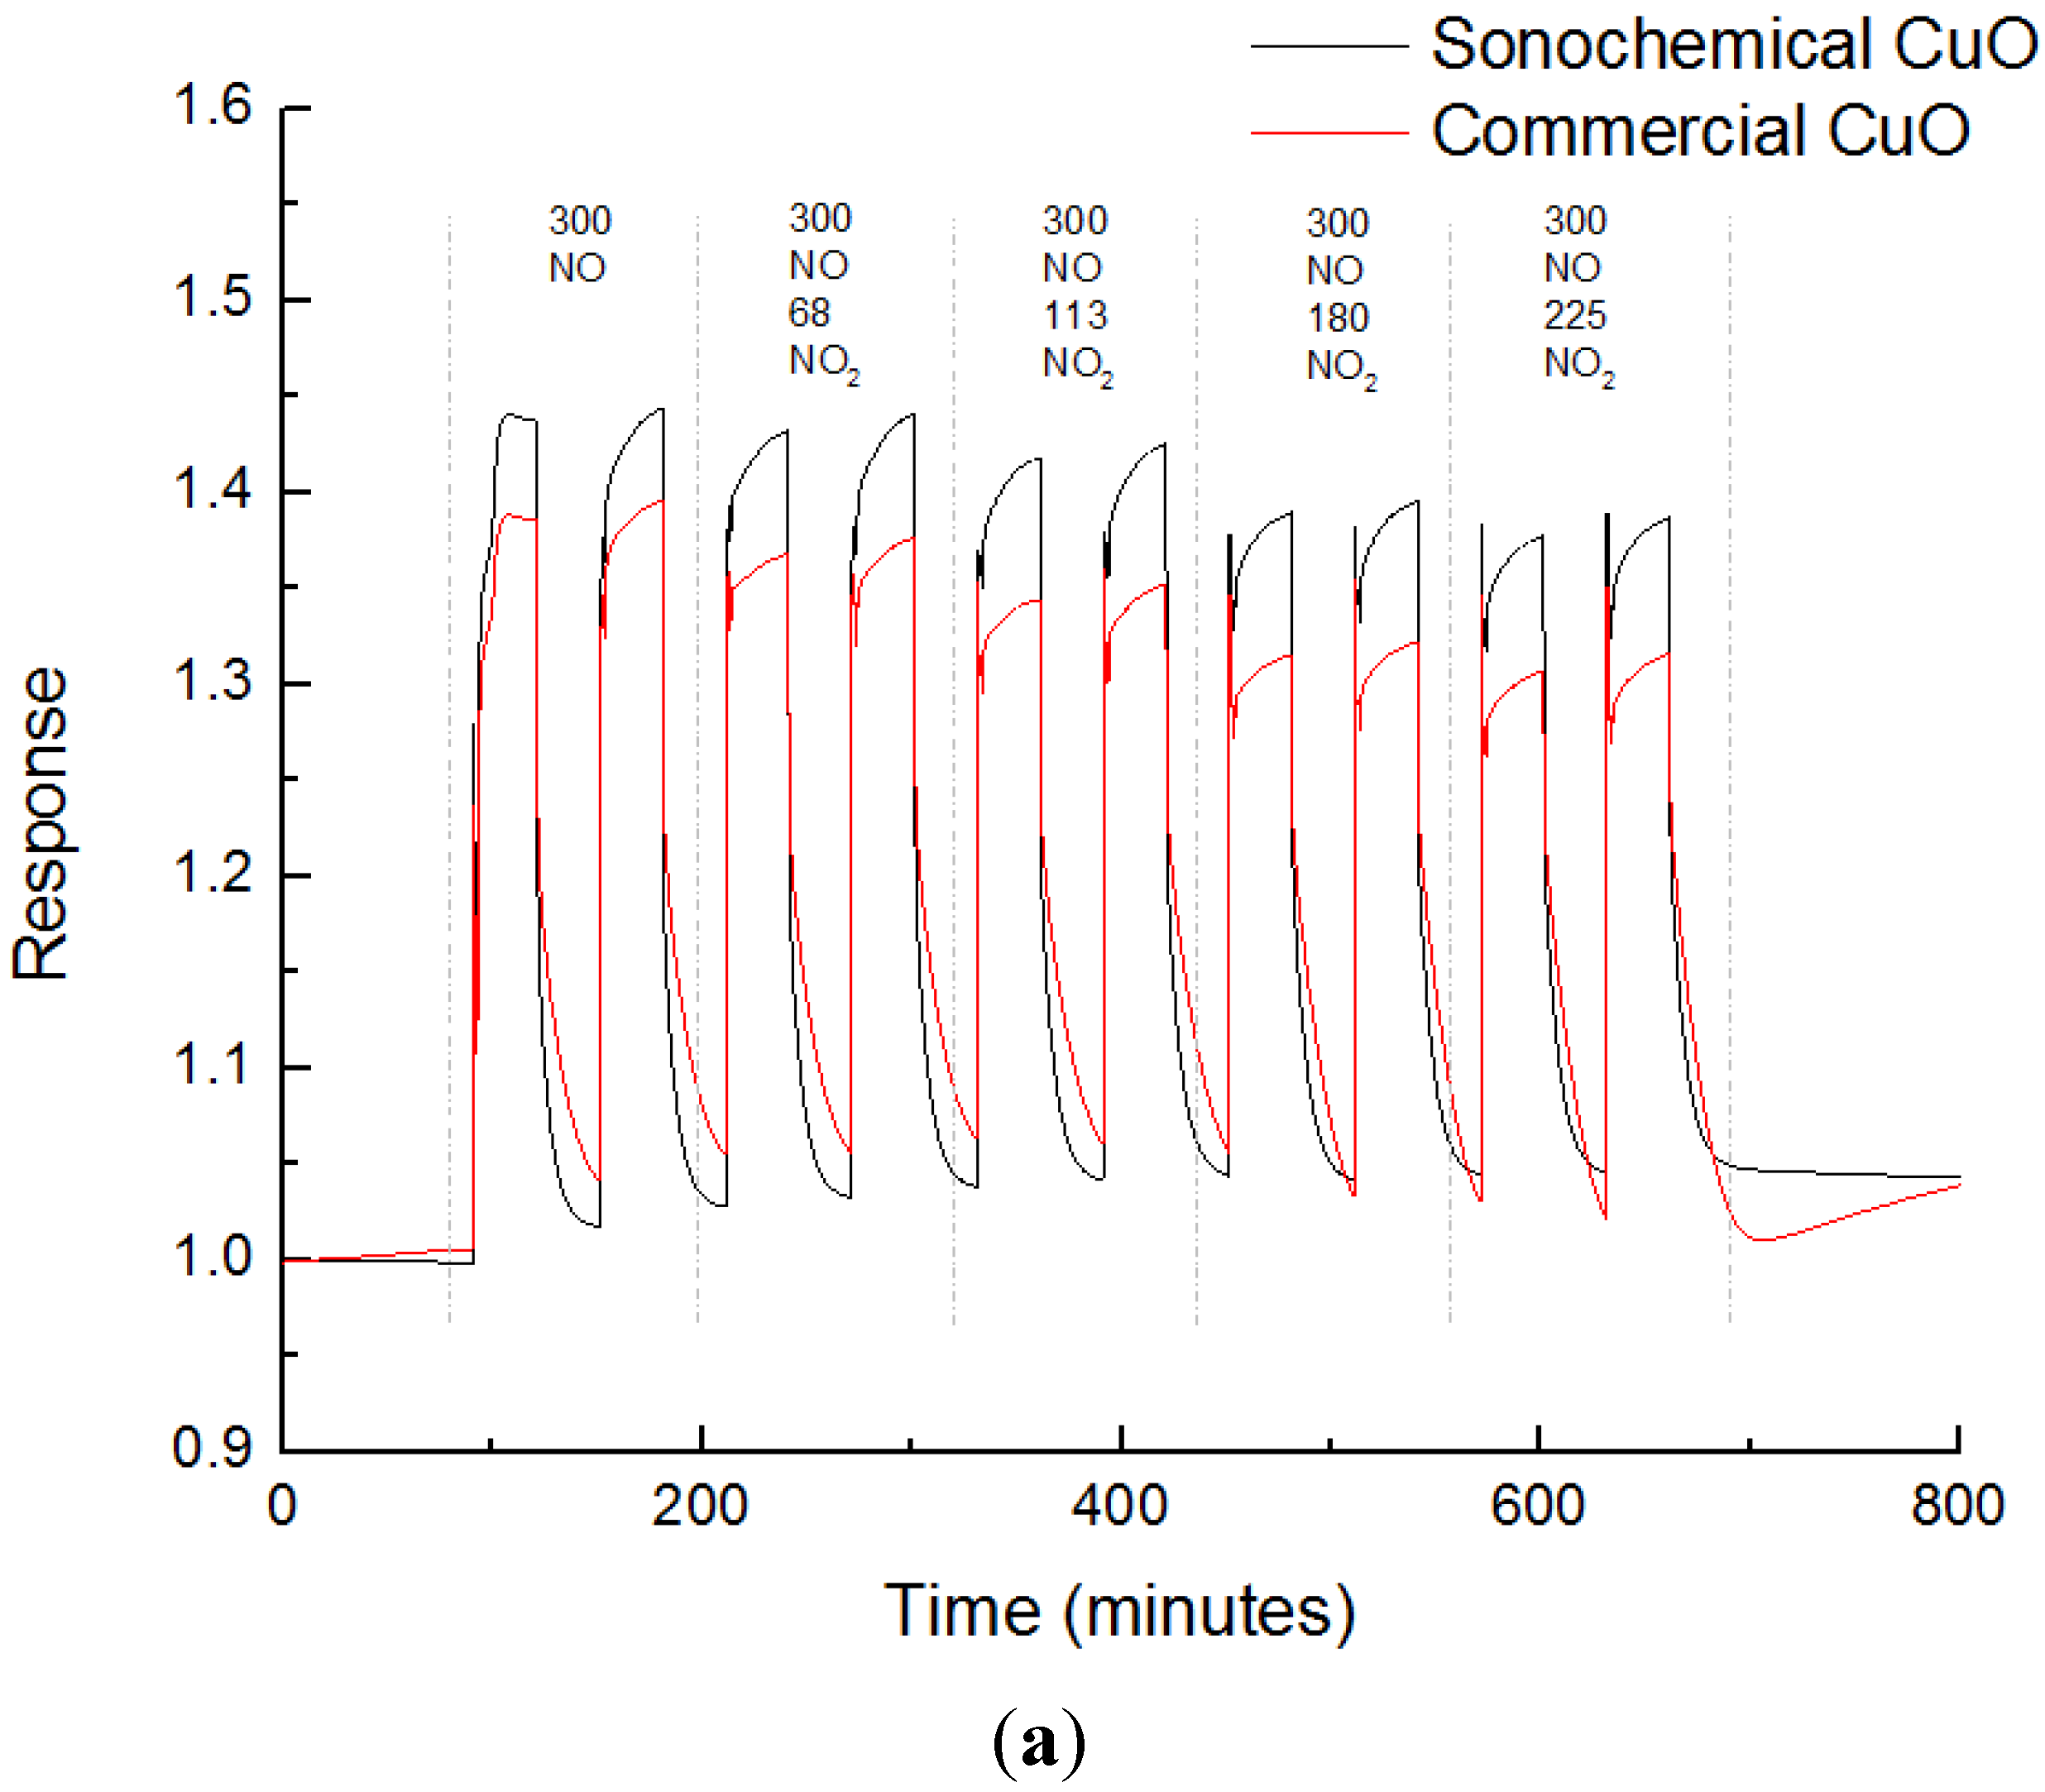
3.3. Sensing Experiments

Figure 4, Figure 5 and Figure 6 focus on resistance changes of the sonochemical CuO to varying mixtures of NO and NO2. Figure 4 shows the traces at 300 °C. A baseline resistance to concentration of 10% O2 (rest N2) was established after which pulses of 300 ppm NO along with NO2 was introduced into the system. Two pulses of gas at the same concentrations are shown separated by dotted lines (the anomalous first pulse is due to turning on the MFC). Subsequently, double pulses of 300 ppm NO with increasing concentrations of NO2, 68 ppm, 113 ppm, 180 ppm, and 225 ppm NO2, were introduced into the sensing environment. This same experiment was then repeated for 15 and 20% O2 in the background gas. Figure 5 and Figure 6 show the data for 400 and 500 °C, respectively. At 300 and 400 °C, with NO, the resistance of the CuO increases, eventually reaching a steady state. With increasing levels of NO2, the signal is lower, the interference effect being minimal at 300 °C. At 500 °C, the sensor shows no discernible response to all combinations of NOx. The sensor at 300 °C is different from the sensor at 400 and 500 °C, and have different baselines, possibly due to different thicknesses of the film.
Figure 4. Sensor traces of sonochemical CuO exposed to different pulses of NO and NO2 mixtures (majority NO) at 300 °C after annealing at 320 °C for 6 h (the first pulse in the first trace noted is anomalous due to switching on the MFC).
Chemosensors 04 00001 g004
Figure 5. Sensor traces of sonochemical CuO exposed to different pulses of NO and NO2 mixtures (majority NO) at 400 °C after annealing at 500 °C for 2 h.
Chemosensors 04 00001 g005
Figure 7 shows the data where two pulses of 450 ppm NO2 were introduced at 300 °C. Dotted lines separate one set of double pulses from the next. Subsequently, double pulses of 450 ppm NO2 with increasing concentrations of NO, 45 ppm, 75 ppm, 120 ppm, and 150 ppm NO, were introduced into the sensing environment. Figure 7b is a blowup of the data at 10% O2. With the introduction of NO2, the resistance decreases, but the baseline does not recover within the 30-minute recovery time given before the next pulse in the experiment. With increasing NO, the effect on the resistance is quite drastic. With the 450 ppm NO2/75 ppm NO (15% NO), the signal is entirely absent, and with the higher concentrations of NO (120 and 150 ppm, NO2 still at 450 ppm), there is a resistance increase from the baseline.
Figure 6. Sensor traces of sonochemical CuO exposed to different pulses of NO and NO2 mixtures (majority NO) at 500 °C after annealing at 550 °C for 12 h.
Chemosensors 04 00001 g006
Figure 7. Sensor traces of sonochemical CuO exposed to different pulses of NO and NO2 mixtures (majority NO2) at 300 °C. In (a) the resistance change is shown and in (b) the 10% oxygen region is blown up with ‘on’ and ‘off’ labeled on the pulses.
Chemosensors 04 00001 g007aChemosensors 04 00001 g007b
Figure 8. Sensor traces of sonochemical CuO and commercial CuO exposed to different pulses of NO and NO2 mixtures (majority NO) at 300 °C in 10% O2 after annealing for 6 h at 320 °C. In (a) the raw sensing data is plotted. In (b) the sensing data is replotted using response with R = 1 equal to the baseline at 10% O2 before any analyte introduction.
Chemosensors 04 00001 g008aChemosensors 04 00001 g008b
Figure 8a compares the relative responses of the sonochemical versus commercial CuO at 300 °C to 300 ppm NO along with 0–225 ppm NO2 for 10% O2 (the rest is N2). For each peak RNO is the resistance of the peak at peak maximum and Rbkg is the resistance several seconds before the introduction of the analyte gas pulse into the sensor system, with response being defined as RNO/Rbkg. In all cases, the sonochemical CuO gives a stronger response by about 10%. Figure 8b shows a detailed profile of the transient response curve, for the 300 ppm NO, the sonochemical CuO shows faster recovery to baseline.
Figure 9a shows the transient resistance changes to 100–667 ppm NO at 300 °C, with NO2 concentrations varying from 0–20% in a background of 10% O2. At the highest level, the total NOx concentrations were up to 800 ppm. The responses calculated from these data are plotted in Figure 9b, along with the standard deviations. These data indicate that, up to 20% NO2 concentrations with the NO, there is minimal effect on the NO response. For example, with 133 ppm NO2 added to 667 ppm NO, the response was 92% of the original response in the absence of NO2.
Figure 9. (a) Response of a sonochemical CuO sensor to pulses of NO with up to 20% relative NO2 in the range of 100 to 667 ppm NO is shown, with three sensor pulses per NOx mixture. In (b) the response based on Equation (3) with the standard deviation also plotted is shown. The first pulse in the first trace noted with an * is discarded, this anomalous point shows up with switching the MFC.
Chemosensors 04 00001 g009

3.4. Interference to CO

Table 1 shows the response (RNO/Rbkg) to NO, CO, and combinations of the two gases. NO behavior was as expected, increasing amounts of NO lead to greater response. Increasing amounts of CO did not increase the response to CO; the sensor appears saturated at 10 ppm CO. Mixtures of the two gases where NO is over an order of magnitude larger than CO does not show the expected increase from NO alone, indicating that CO will be an interferent gas for this sensor.
Table 1. Response of sonochemical CuO sensor to NO and CO gas.
Pulse (NO ppm)ResponsePulse (CO ppm)ResponsePulse (NO:CO ppm)Response
200 NO1.31101.12200:101.16
400 NO1.37201.12400:101.19
600 NO1.41301.11600:101.20

4. Discussion

The resistance increase upon exposure to an electron donating gas, such as NO, and resistance decrease upon exposure to an electron accepting gas, such as NO2, for p-type CuO is well documented in the literature [12,20,29,30]. Conduction in CuO, as in many other p-type oxides [31], is governed by defect chemistry. CuO is nonstoichiometric, having a structure of Cu1-δO, where the value of delta is determined by the atmosphere and maximum temperature achieved during sintering [18,29,30]. There is a negative enthalpy associated with the formation of CuO defects [18,20].
Holes are generated by a Cu vacancy, or an excess of oxygen in the crystal structure described in Equation (4).
C u O + δ V C u 2 C u 1 δ O + 2 δ h +
An electron donating gas, such as NO, will inject electrons into the surface layer of the CuO and the electrons will obliterate holes generated from Cu vacancies resulting in an increase in resistance. An electron accepting gas, such as NO2, will accept additional electrons from the CuO surface, creating a conductive layer at the surface of the CuO that is rich in holes. From the resistance change data in the presence of pure NO or pure NO2, shown in Figure 4, Figure 5, Figure 6 and Figure 7, the p-type behavior of CuO is evident. With mixtures of NO and NO2, the observations are more complicated.
Chemical equilibration between NO, O2 and NO2, has been studied [32]. At low temperatures NO2 is the preferred species, however, the oxidation of NO to NO2 is kinetically limited, whereas at higher temperatures, the formation of NO2 is thermodynamically limited. For equilibration of NO and NO2, catalysts are required. Figure 3 shows that CuO begins to become catalytically active at temperatures above 400 °C. Thus, from a perspective of sensing focused on only NO, temperatures at or above 400 °C are going to give anomalous results. Even at the higher temperature of 500 °C, as observed in Figure 3, NO and NO2 are chemically equilibrated at the CuO surface, making sensor response negligible, as shown in Figure 6.
On the other hand at 300 °C, even with 20%–30% NO2 in a NO stream, there is only minor (10%) change in overall resistance (Figure 4). However, with NO2 as the majority gas in the stream (Figure 7), presence of NO has a large effect on the resistance. Theoretical studies of O2 and NO2 absorption on CuO surfaces indicate that in both cases, there is electron transfer from the oxide to the absorbed species, though the extent of transfer is higher for NO2 [33]. Additionally, the binding energy of O2 adsorption is weaker than that of NO2. This is consistent with the data we observed at 300 °C, where NO2 absorption followed by removal and replacement with O2 results in a new baseline resistance since NO2- remains absorbed and not readily replaced with O2. However, even at 10% NO of the gas stream with NO2, there is a decrease in resistance and at higher NO concentrations (still with NO2 as majority gas), the resistance shows an increase. This indicates that NO is preferentially adsorbing on the CuO, even with the presence of significantly higher concentrations of NO2.
Thus, it is clear that if the individual components of a mixture of NO and NO2 are to be determined, we have to operate under conditions where the driving force for chemical equilibration of NO and NO2 is minimized. In that case, each individual species maintains its identity. In the case of CuO, this condition is satisfied at temperature of 300 °C.
The second important aspect is that there must be a selective interaction of one of the NOx species with the semiconductor. Exploitation of the difference in adsorption has been exploited for sensing purposes, e.g., in NOx sensing and discrimination against CO for an alumina/vanadium mixture [34]. With CuO, we find that at 300 °C, NO has a stronger interaction (Figure 7). Periodic density functional calculations of NO and NO2 absorption on Cu2+ site of CuAl2O4 has been reported [35]. The absorption of NO2 on Cu2+ takes place through the O atom, has an absorption energy of –127.4 kcal/mole and occurs with charge transfer from the solid to NO2. With NO, the calculations show that absorption can occur via the O or N atom, with the ON –> Cu2+ having a more favorable absorption energy of –144.1 kcal/mole and occurs with charge transfer from the NO to the solid adsorption site. Interestingly, this charge was also found to flow within the solid substrate. Another theoretical study concluded that the strong interaction of NO with CuO as measured by the high absorption energy is due to charge transfer from the d orbitals of Cu2+ to the anti-bonding (2π) orbital of NO [36].
With the temperature of CuO at 300 °C, up to 20% NO2 does not significantly perturb the NO signal (Figure 9). The use of sonochemical CuO provides a 10% better signal response (Figure 8), as well as faster recovery to baseline, as compared with commercial CuO. The sonochemical method provides a CuO with smaller size (tens of nm, Figure 2) and higher surface area (two orders of magnitude) and thus provides more adsorption sites. This sonochemical CuO-based system can be used for detecting NO selectively in a NO + NO2 mixture typical of lean burn engines (10–20% O2), with a potential range of total NOx of 100–1000 ppm [37]. With use of such a sensor platform, it will also be necessary to measure total NOx to obtain the NO2 concentration using technology already available. As shown in Table 1, there will be interference if CO is present in the gas stream. However, for lean-burn operations, the excess air should reduce CO and hydrocarbons, and this problem will be alleviated. The effect of humidity has not been examined in this paper, but, usually, resistance-based sensors do show some interference from humidity [17].

5. Conclusions

CuO exhibits greater selectivity to NO at 300 °C over NO2, even at concentrations approaching 20% of the total gas mixture. Advantage is taken of the fact that NO/NO2 equilibration is not significantly promoted over CuO at 300 °C, thus, each component, NO and NO2, maintain their identity. Moreover, NO has stronger adsorption on CuO at 300 °C. The sonochemically prepared CuO sensor is more selective to NO at 300 °C with 92% signal maintained when 20% NO2 was added to the system at 667 ppm NO. The selectivity of sonochemical CuO for NO detection at 300 °C is an adsorption phenomenon and not due to a catalytic effect. Concentrations of known mixtures of NOx as low as 100 ppm and up to 800 ppm total NOx were tested without sensor saturation. This range constitutes most of the range of total NOx concentrations in diesel and other lean burn engines.

Acknowledgements

The authors would like to acknowledge the NSF for its support of this research (NSF-IIP 1318136). The authors would also like to thank Bo Wang for collection of TEM images.

Author Contributions

Max Mullen carried out the research under the direction of Prof Dutta. They both contributed to the writing of the manuscript.

Conflicts of Interest

The authors declare no conflict of interest.

References

  1. Fergus, J.W. Materials for high temperature electrochemical NOx gas sensors. Sens. Actuators B Chem. 2007, 121, 652–663. [Google Scholar] [CrossRef]
  2. Blackburn, B.M.; Wachsman, E.D. Performance of Thermally Modified, Potentiometric Gas Sensor Array in Gas Mixtures. ECS Trans. 2009, 16, 339–354. [Google Scholar]
  3. Yang, J.-C.; Dutta, P.K. Promoting selectivity and sensitivity for a high temperature YSZ-based electrochemical total NOx sensor by using a Pt-loaded zeolite Y filter. Sens. Actuators B Chem. 2007, 125, 30–39. [Google Scholar] [CrossRef]
  4. Docquier, N.; Candel, S. Combustion control and sensors: A review. Prog. Energy Combust. Sci. 2002, 28, 107–150. [Google Scholar] [CrossRef]
  5. Park, J.; Yoon, B.Y.; Park, C.O. The mixed potentials of NiO(+ YSZ) and CuO electrodes in a mixture gas of NO and NO2. Sens. Lett. 2008, 6, 844–847. [Google Scholar] [CrossRef]
  6. Mondal, S.P.; Dutta, P.K.; Hunter, G.W.; Ward, B.J.; Laksowski, D.; Dweik, R. Development of high sensitivity potentiometric NOx sensor and its application to breath analysis. Sens. Actuators B Chem. 2011, 158, 292–298. [Google Scholar] [CrossRef]
  7. Sun, C.; Maduraiveeran, G.; Dutta, P. Nitric oxide sensors using combination of p- and n-type semiconducting oxides and its application for detecting NO in human breath. Sens. Actuators B Chem. 2013, 186, 117–125. [Google Scholar] [CrossRef]
  8. Can, F.; Courtois, X.; Berland, S.; Seneque, M.; Royer, S.; Duprez, D. Composition dependent performance of alumina-based oxide supported WO3 catalysts for the NH3-SCR reaction and the NSR + SCR coupled process. Catal. Today 2015, 257, 41–50. [Google Scholar] [CrossRef]
  9. Choi, S.-W.; Park, J.Y.; Kim, S.S. Growth behavior and sensing properties of nanograins in CuO nanofibers. Chem. Eng. J. 2011, 172, 550–556. [Google Scholar] [CrossRef]
  10. Hansen, B.J.; Kouklin, N.; Ganhua, L.; Lin, I.-K.; Chen, J.; Zhang, X. Transport, analyte detection, and opto-electronic response of p-type CuO nanowires. J. Phys. Chem. C 2010, 114, 2440–2447. [Google Scholar] [CrossRef]
  11. Kim, K.-M.; Jeong, H.-M.; Kim, H.-R.; Choi, K.-I.; Kim, H.-J.; Lee, J.-H. Selective Detection of NO(2) Using Cr-Doped CuO Nanorods. Sensors 2012, 12, 8013–8025. [Google Scholar] [CrossRef] [PubMed]
  12. Cruccolini, A.; Narducci, R.; Palombari, R. Gas adsorption effects on surface conductivity of nonstoichiometric CuO. Sens. Actuators B Chem. 2004, 98, 227–232. [Google Scholar] [CrossRef]
  13. Das, A.; Venkataramana, B.; Partheephan, D.; Prasad, A.K.; Dhara, S.; Tyagi, A.K. Facile synthesis of nanostructured CuO for low temperature NO2 sensing. Phys. E Low-Dimens. Syst. Nanostructures 2013, 54, 40–44. [Google Scholar] [CrossRef]
  14. Li, Y.; Liang, J.; Tao, Z.; Chen, J. CuO particles and plates: Synthesis and gas-sensor application. Mater. Res. Bull. 2008, 43, 2380–2385. [Google Scholar] [CrossRef]
  15. Yu, M.-R.; Wu, R.-J.; Chavali, M. Effect of ‘Pt’ loading in ZnO–CuO hetero-junction material sensing carbon monoxide at room temperature. Sens. Actuators B Chem. 2011, 153, 321–328. [Google Scholar] [CrossRef]
  16. Jun, S.T.; Choi, G.M. CO gas-sensing properties of ZnO/CuO contact ceramics. Sens. Actuators B Chem. 1994, 17, 175–178. [Google Scholar] [CrossRef]
  17. Hüebner, M.; Simion, C.E.; Tomescu-Stanoiu, A.; Pokhrel, S.; Barsan, N.; Weimar, U. Influence of humidity on CO sensing with p-type CuO thick film gas sensors. Sens. Actuators B Chem. 2011, 153, 347–353. [Google Scholar] [CrossRef]
  18. Nguyen, D.H.; Nguyen, V.Q.; Jung, H.; Kim, D.; Kim, H.; Hong, S.-K. Synthesis of porous CuO nanowires and its application to hydrogen detection. Sens. Actuators B Chem. 2010, 146, 266–272. [Google Scholar]
  19. Volanti, D.P.; Felix, A.A.; Orlandi, M.O.; Whitfield, G.; Yang, D.-J.; Longo, E.; Tuller, H.L.; Varela, J.A. The role of hierarchical morphologies in the superior gas sensing performance of CuO-based chemiresistors. Adv. Funct. Mater. 2013, 23, 1759–1766. [Google Scholar] [CrossRef]
  20. Choi, Y.-H.; Kim, D.-H.; Hong, S.-H.; Hong, K.S. H2 and C2H5OH sensing characteristics of mesoporous p-type CuO films prepared via a novel precursor-based ink solution route. Sens. Actuators B Chem. 2013, 178, 395–403. [Google Scholar] [CrossRef]
  21. Gopalakrishna, D.; Vijayalakshmi, K.; Ravidhas, C. Effect of pyrolytic temperature on the properties of nano-structured Cuo optimized for ethanol sensing applications. J. Mater. Sci. Mater. Electron. 2013, 24, 1004–1011. [Google Scholar] [CrossRef]
  22. Yu, M.-R.; Suyambrakasam, G.; Wu, R.-J.; Chavali, M. Performance evaluation of ZnO-CuO hetero junction solid state room temperature ethanol sensor. Mater. Res. Bull. 2012, 47, 1713–1718. [Google Scholar] [CrossRef]
  23. Liu, X.; Zhang, J.; Kang, Y.; Wu, S.; Wang, S. Brochantite tabular microspindles and their conversion to wormlike CuO structures for gas sensing. CrystEngComm 2012, 14, 620–625. [Google Scholar] [CrossRef]
  24. Yang, C.; Su, X.; Xiao, F.; Jian, J.; Wang, J. Gas sensing properties of CuO nanorods synthesized by a microwave-assisted hydrothermal method. Sens. Actuators B Chem. 2011, 158, 299–303. [Google Scholar] [CrossRef]
  25. Zhang, J.; Liu, J.; Peng, Q.; Wang, X.; Li, Y. Nearly Monodisperse Cu2O and CuO Nanospheres:  Preparation and Applications for Sensitive Gas Sensors. Chem. Mater. 2006, 18, 867–871. [Google Scholar] [CrossRef]
  26. Radlik, M.; Adamowska, M.; Lamacz, A.; Krzton, A.; Da Costa, P.; Turek, W. Study of the surface evolution of nitrogen species on CuO/CeZrO2 catalysts. React. Kinet. Mech. Catal. 2013, 109, 43–56. [Google Scholar] [CrossRef]
  27. Chi, Y.; Chuang, S.S.C. Infrared Study of NO Adsorption and Reduction with C3H6 in the Presence of O2 over CuO/Al2O3. J. Catal. 2000, 190, 75–91. [Google Scholar] [CrossRef]
  28. Xiao, G.; Gao, P.; Wang, L.; Chen, Y.; Wang, Y.; Zhang, G. Ultrasonochemical-assisted Synthesis of CuO Nanorods with High Hydrogen Storage Ability. J Nanomater. 2011, 2011. [Google Scholar] [CrossRef]
  29. Jeong, Y.K.; Choi, G.M. Nonstoichiometry and electrical conduction of CuO. J. Phys. Chem. Solids 1996, 57, 81–84. [Google Scholar] [CrossRef]
  30. Suda, S.; Fujitsu, S.; Koumoto, K.; Yanagida, H. Effect of atmosphere and doping on electrical conductivity of CuO. Jpn. J. Appl. Phys. Part 1 Regul. Pap. Short Notes Rev. Pap. 1992, 31, 2488–2491. [Google Scholar] [CrossRef]
  31. Kim, H.-J.; Lee, J.-H. Highly sensitive and selective gas sensors using p-type oxide semiconductors: Overview. Sens. Actuators B Chem. 2014, 192, 607–627. [Google Scholar] [CrossRef]
  32. Bacher, V.; Perbandt, C.; Schwefer, M.; Siefert, R.; Turek, T. Kinetics of the NO/NO2 equilibrium reaction over an iron zeolite catalyst. Appl. Catal. B Environ. 2013, 134–135, 55–59. [Google Scholar] [CrossRef]
  33. Hu, J.; Li, D.; Lu, J.G.; Wu, R. Effects on Electronic Properties of Molecule Adsorption on CuO Surfaces and Nanowires. J. Phys. Chem. C 2010, 114, 17120–17126. [Google Scholar] [CrossRef]
  34. Ishihara, T.; Shiokawa, K.; Eguchi, K.; Arai, H. The mixed oxide A12O3-V2O5 as a semiconductor gas sensor for NO and NO2. Sens. Actuators 1989, 19, 259–265. [Google Scholar] [CrossRef]
  35. Yin, X.; Han, H.; Kubo, M.; Miyamoto, A. Adsorption of NH3, NO2 and NO on copper-aluminate catalyst: an ab initio density functional study. Theor. Chem. Acc. 2003, 109, 190–194. [Google Scholar] [CrossRef]
  36. Duan, Y.; Zhang, K.; Xie, X. Theoretical studies of CO and NO on CuO and Cu2O(110) surfaces. Surf. Sci. 1994, 321, L249–L254. [Google Scholar] [CrossRef]
  37. Hansen, K.K. Solid state electrochemical DeNOx—An overview. Appl. Catal. B Environ. 2010, 100, 427–432. [Google Scholar] [CrossRef]

