Article

Combinatorial Material Strategy: Parallel Synthesis and High-Throughput Screening of WO3 Nanoplates Decorated with Noble Metals for VOCs Sensor

1
Department of Metallurgical and Energy Engineering, Kunming University of Science and Technology, Kunming 650093, China
2
Shanghai Key Laboratory of Intelligent Sensing and Detection Technology, School of Mechanical and Power Engineering, East China University of Science and Technology, Shanghai 200237, China
3
College of Biomass Science and Engineering, Sichuan University, Chengdu 610065, China
*
Authors to whom correspondence should be addressed.
Chemosensors 2023, 11(4), 239; https://doi.org/10.3390/chemosensors11040239
Submission received: 18 March 2023 / Revised: 5 April 2023 / Accepted: 7 April 2023 / Published: 11 April 2023

Abstract

:
In this study, we report on the rapid preparation of WO3 nanoplates decorated with noble metals and evaluate their gas-sensing performance using a high-throughput screening technique. The incorporation of Pd significantly enhanced the gas-sensing properties, and, among all of the samples tested, the WO3 nanoplate containing 0.3 mol% Pd exhibited the highest response to 100 ppm xylene at 250 °C (Ra/Rg = 131.2), which was almost 56 times greater than that of the pure WO3 sample. Additionally, this sample demonstrated rapid response and recovery times (τresponse = 3.9 s and τrecovery = 189.2 s, respectively). The nanoplate samples were also classified and screened using cluster analysis, and the selected samples were optimized for use in a sensor array. By applying principal component analysis and Fisher discriminant analysis, four typical gases were identified and a potential sensitization mechanism was elucidated.

1. Introduction

In the last few decades, the emission of hazardous gases has attracted widespread attention with the development of the industrial economy and the improvement in people’s living standards. Although there are several indoor air pollutants that threaten human health, volatile organic compounds (VOCs) are considered the most harmful, particularly benzene, toluene, xylene, and formaldehyde; this is because their long-term contact increases the probability of people contracting cancer, asthma, skin allergies, and other serious ailments [1,2]. Since the number of household deaths occurring because of substandard indoor air quality is increasing, researchers have put forward higher requirements for VOC detection, especially in recent years [3,4]. Consequently, the screening of VOC gas sensors with high sensitivity, excellent selectivity, and good stability has great application value in indoor pollution monitoring and the early diagnosis of major diseases. This screening has been widely used to monitor VOCs using gas sensors based on metal oxide semiconductors (MOSs) due to their low costs, good sensitivity, ultra-fast response, and simple structure [5,6,7,8,9,10]. As an MOS with a broadband gap, WO3 is an ideal gas-sensitive material with good thermal and chemical stability [11,12,13]. However, pure WO3 still has shortcomings, such as a high working temperature, low response value, and poor gas selectivity. It is difficult to circumvent these disadvantages via traditional methods used for morphology regulation; however, these shortcomings can be significantly alleviated via surface modification [14,15,16]. In a study by Horprathum et al., Pt nanoparticles were sputtered onto WO3 surfaces via direct current sputtering, which showed that the response of the gas sensor materials to H2 was significantly improved with a deposition time of 10 s [17]. A sensor decorated with Pt-WO3 nanorods exhibited an extremely high response value of 1530 to 214,000 at 150 to 3000 ppm H2 and 200 °C, respectively. Wang et al. actualized the surface modification of WO3 with Pd elements through a dipping method [18]. The sensing material with 2 at% Pd had a superior response value of 1029 to H2S at 190 °C, which was 270 times higher than that of pure WO3 (S = 3.8), and its response time was shortened to within 1 s.
Traditionally, developing a new gas-sensitive material generally takes a long time since the following steps are involved: material preparation, material performance evaluation, material re-preparation, and material performance reevaluation. This cycle continues until materials exhibit an excellent performance; however, there are many kinds of surface-modified metals. Traditional methods used to assess the effect of different additive concentrations on the performance of gas-sensitive materials not only take a large amount of time and energy, but also slow down the development of new materials greatly.
Thus, it is important to shorten the preparation time of gas-sensitive materials, reduce costs, and improve the performance of existing gas sensors. Under this premise, combination and high-throughput (CHT) experiments have emerged. In the fields of materials science and physics, high-throughput characterization and parallel synthesis have been widely used to screen high-performance materials. The research on CHT experimentation can be traced back to 1995 [19], after which it was used to screen numerous materials, including gas-sensing materials [20,21,22], magneto-resistive materials [23], polymers [24], and heterogeneous catalysts [25]. However, it is unclear how WO3 modified with different concentrations of precious metals affects the gas-sensing performance.
In this study, we synthesized WO3 nanoplates via the hydrothermal method and dispersed as-synthesized sensing materials into deionized water using ball grinding to form a uniform and stable WO3 slurry. The mixed slurry with different molar proportions was formed using the premixed function of a parallel synthesizer, and 36 gas-sensing films were then deposited onto Al2O3 ceramic sheets with Pt electrodes. The resulting gas-sensitive films, along with their substrates, were packaged into miniaturized sensors and labeled for modular and unmanned testing using a high-throughput screening platform with four typical VOC gases. The WO3-0.3 mol% Pd gas-sensitive material displayed a response of 131.2 to 100 ppm xylene at 250 °C, which was 56 times higher than that of pure WO3. To remove redundant information, a cluster analysis was performed, and principal component analysis (PCA) and Fisher discriminant analysis (FDA) were used to identify the four gases. Finally, the mechanism of the gas-sensing reaction was explained.

2. Experimental Section

2.1. Synthesis of WO3 Nanoplates

Reagents used in this study were purchased through formal commercial channels. Sodium tungstate dihydrate (Na2WO4·2H2O), gold trichloride (AuCl3), silver nitrate (AgNO3), chloroplatinic acid (H2PtCl6·6H2O), palladium chloride (PdCl2), rhodium trichloride (RhCl3·3H2O), ruthenium trichloride (RuCl3·3H2O), iridium (IrCl3), and hydroxypropyl methyl cellulose (HPMC) were purchased from Aladdin (Shanghai, China). Ethanol (C2H6O), nitric acid (HNO3, 65%), and polyethylene carboxide ketone (PVP, MW~58,000, K30) were bought from the MacLean reagent network (Shanghai, China).
WO3 nanoplates were synthesized via a hydrothermal method [26,27], wherein 14 mL of distilled water was used to dissolve 0.48 g of Na2WO4·2H2O and 0.07 g of PVP via stirring at normal temperature. Afterwards, 21 mL of HNO3 was used to provide an acidic environment, which was added into the as-prepared mixing liquid. The resulting miscible liquid was transferred into an autoclave of 50 mL, sealed, and stored in an oven for 12 h at 180 °C. The high-pressure autoclave was then taken out and cooled down at normal temperature. The resulting reaction solution was centrifuged, and the precipitate was washed three times with alcohol and distilled water. Then, the above precipitate was dried at 70 °C in a vacuum state for 10 h. The dried powder was calcined in a tubular furnace, and the heating schedule was 2 °C/min at 450 °C for 2 h. Consequently, WO3 nanoplates were obtained.

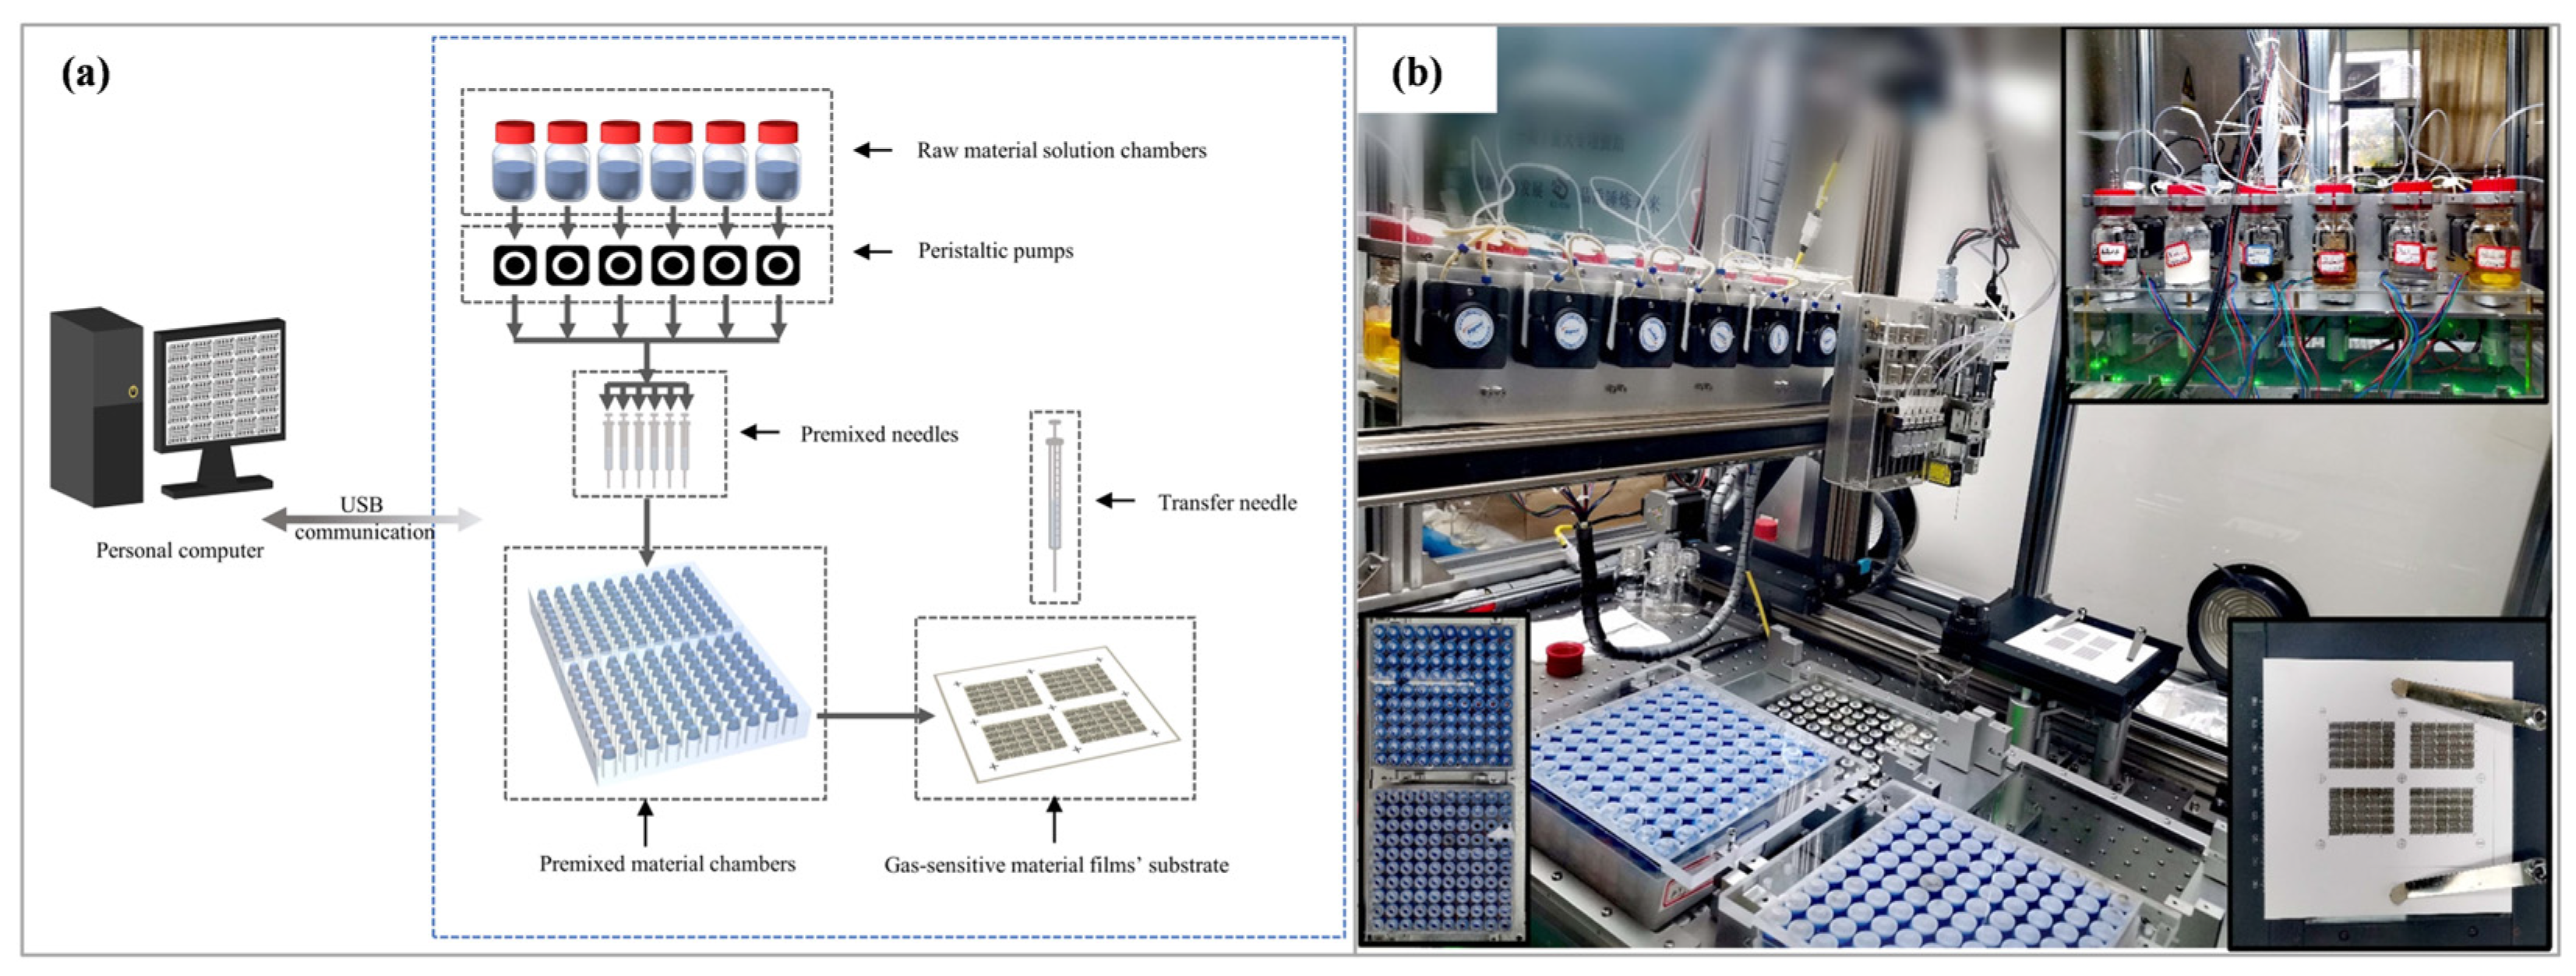
2.2. Preparation of Gas Sensors

The above-mentioned WO3 powder and HPMC were mixed at a mass ratio of 9:1 and dissolved in 10 mL of distilled water to produce a WO3 solution with a concentration of 0.09 g/mL. Subsequently, WO3 dispersion was implemented via ball milling. The gas-sensitive substrates were prepared via a screen-printing technique [28]. A Pt paste (Sino-Platinum Metals Co., Ltd., Kunming, China) was used to fabricate a Pt electrode on top of the Al2O3 ceramic substrate, as shown in Figure 1. Then, this ceramic sheet with the Pt electrode was dried at 60 °C for 2 h in air and calcined in the Mafer furnace wherein the temperature was first increased to 550 °C at 2 °C/min for 2 h and then to 850 °C at 2 °C/min for 10 min.
The chemical reagents used in this study and their concentrations are shown in Table 1. The modified WO3 membranes were synthesized and deposited using a parallel synthesis platform, and the ratio range of surface modification was 0.1 to 0.5 mol%. The fabrication process of gas-sensitive films can be divided into two parts in Figure 2: (1) premixing of WO3, metal ions, and distilled water; (2) transfer printing. Subsequently, the alumina substrate with a thick gas-sensitive film was first annealed at 350 °C for 2 h at a heating rate of 5 °C/min and then at 550 °C for 2 h at the same heating rate. Finally, the substrates with gas-sensitive films were fabricated into sensors comprising different ratios of noble metals (Supplementary Table S1).

2.3. Characterization

X-ray diffraction (XRD, Rigaku D/max-2500, Shenzhen HPG Technology Co. Ltd., Tokyo, Japan, Cu Kα, λ = 1.5418 Å) was used to determine the crystal phase of WO3 nanoplates. The morphologies of these nanoplates and gas-sensitive membranes were characterized using field-emission scanning electron microscopy (FESEM, ZEISSEVO-GeminiSEM300, Shenzhen HPG Technology Co. Ltd., Tokyo, Japan, 30 KV). Subsequently, EDS mapping of the gas-sensitive membrane decorated with 0.5 mol% Pd was performed using an energy dispersive spectrometer (EDS, ZEISSEVO-GeminiSEM300, Shenzhen HPG Technology Co. Ltd., Tokyo, Japan, 30 KV).

2.4. Measurements

The performance characterization of gas-sensitive films was accomplished using an unmanned high-throughput screening platform (Figure 3). This platform includes an automated testing function. Hence, uninterrupted testing can be performed for 24 h (all 7 days) by setting appropriate measurement parameters, which significantly improves material screening efficiency. In this work, 36 gas-sensitive membranes were tested at the same time. Furthermore, the target gas mixture prepared via the headspace method included benzene, toluene, xylene, and formaldehyde, with a gas source concentration of 1000 ppm. The screening test was first conducted using an appropriate temperature gradient (50, 100, 150, 200, 250, 300, 350, and 400 °C), with the target gas concentration being 100 ppm. We determined the optimal working temperature for the target gas by calculating the response values at above-mentioned temperatures. Meanwhile, the gas-sensitive materials that respond well to a certain target gas were screened out. The ratio of the sensor resistance in air (Rair) to that in the target gas (Rgas) is defined as the sensor response value (S). When the target gas is introduced inside and outside the testing chamber, the time required for the resistance to change by 90% is defined as the response time and recovery time.

3. Results and Discussion

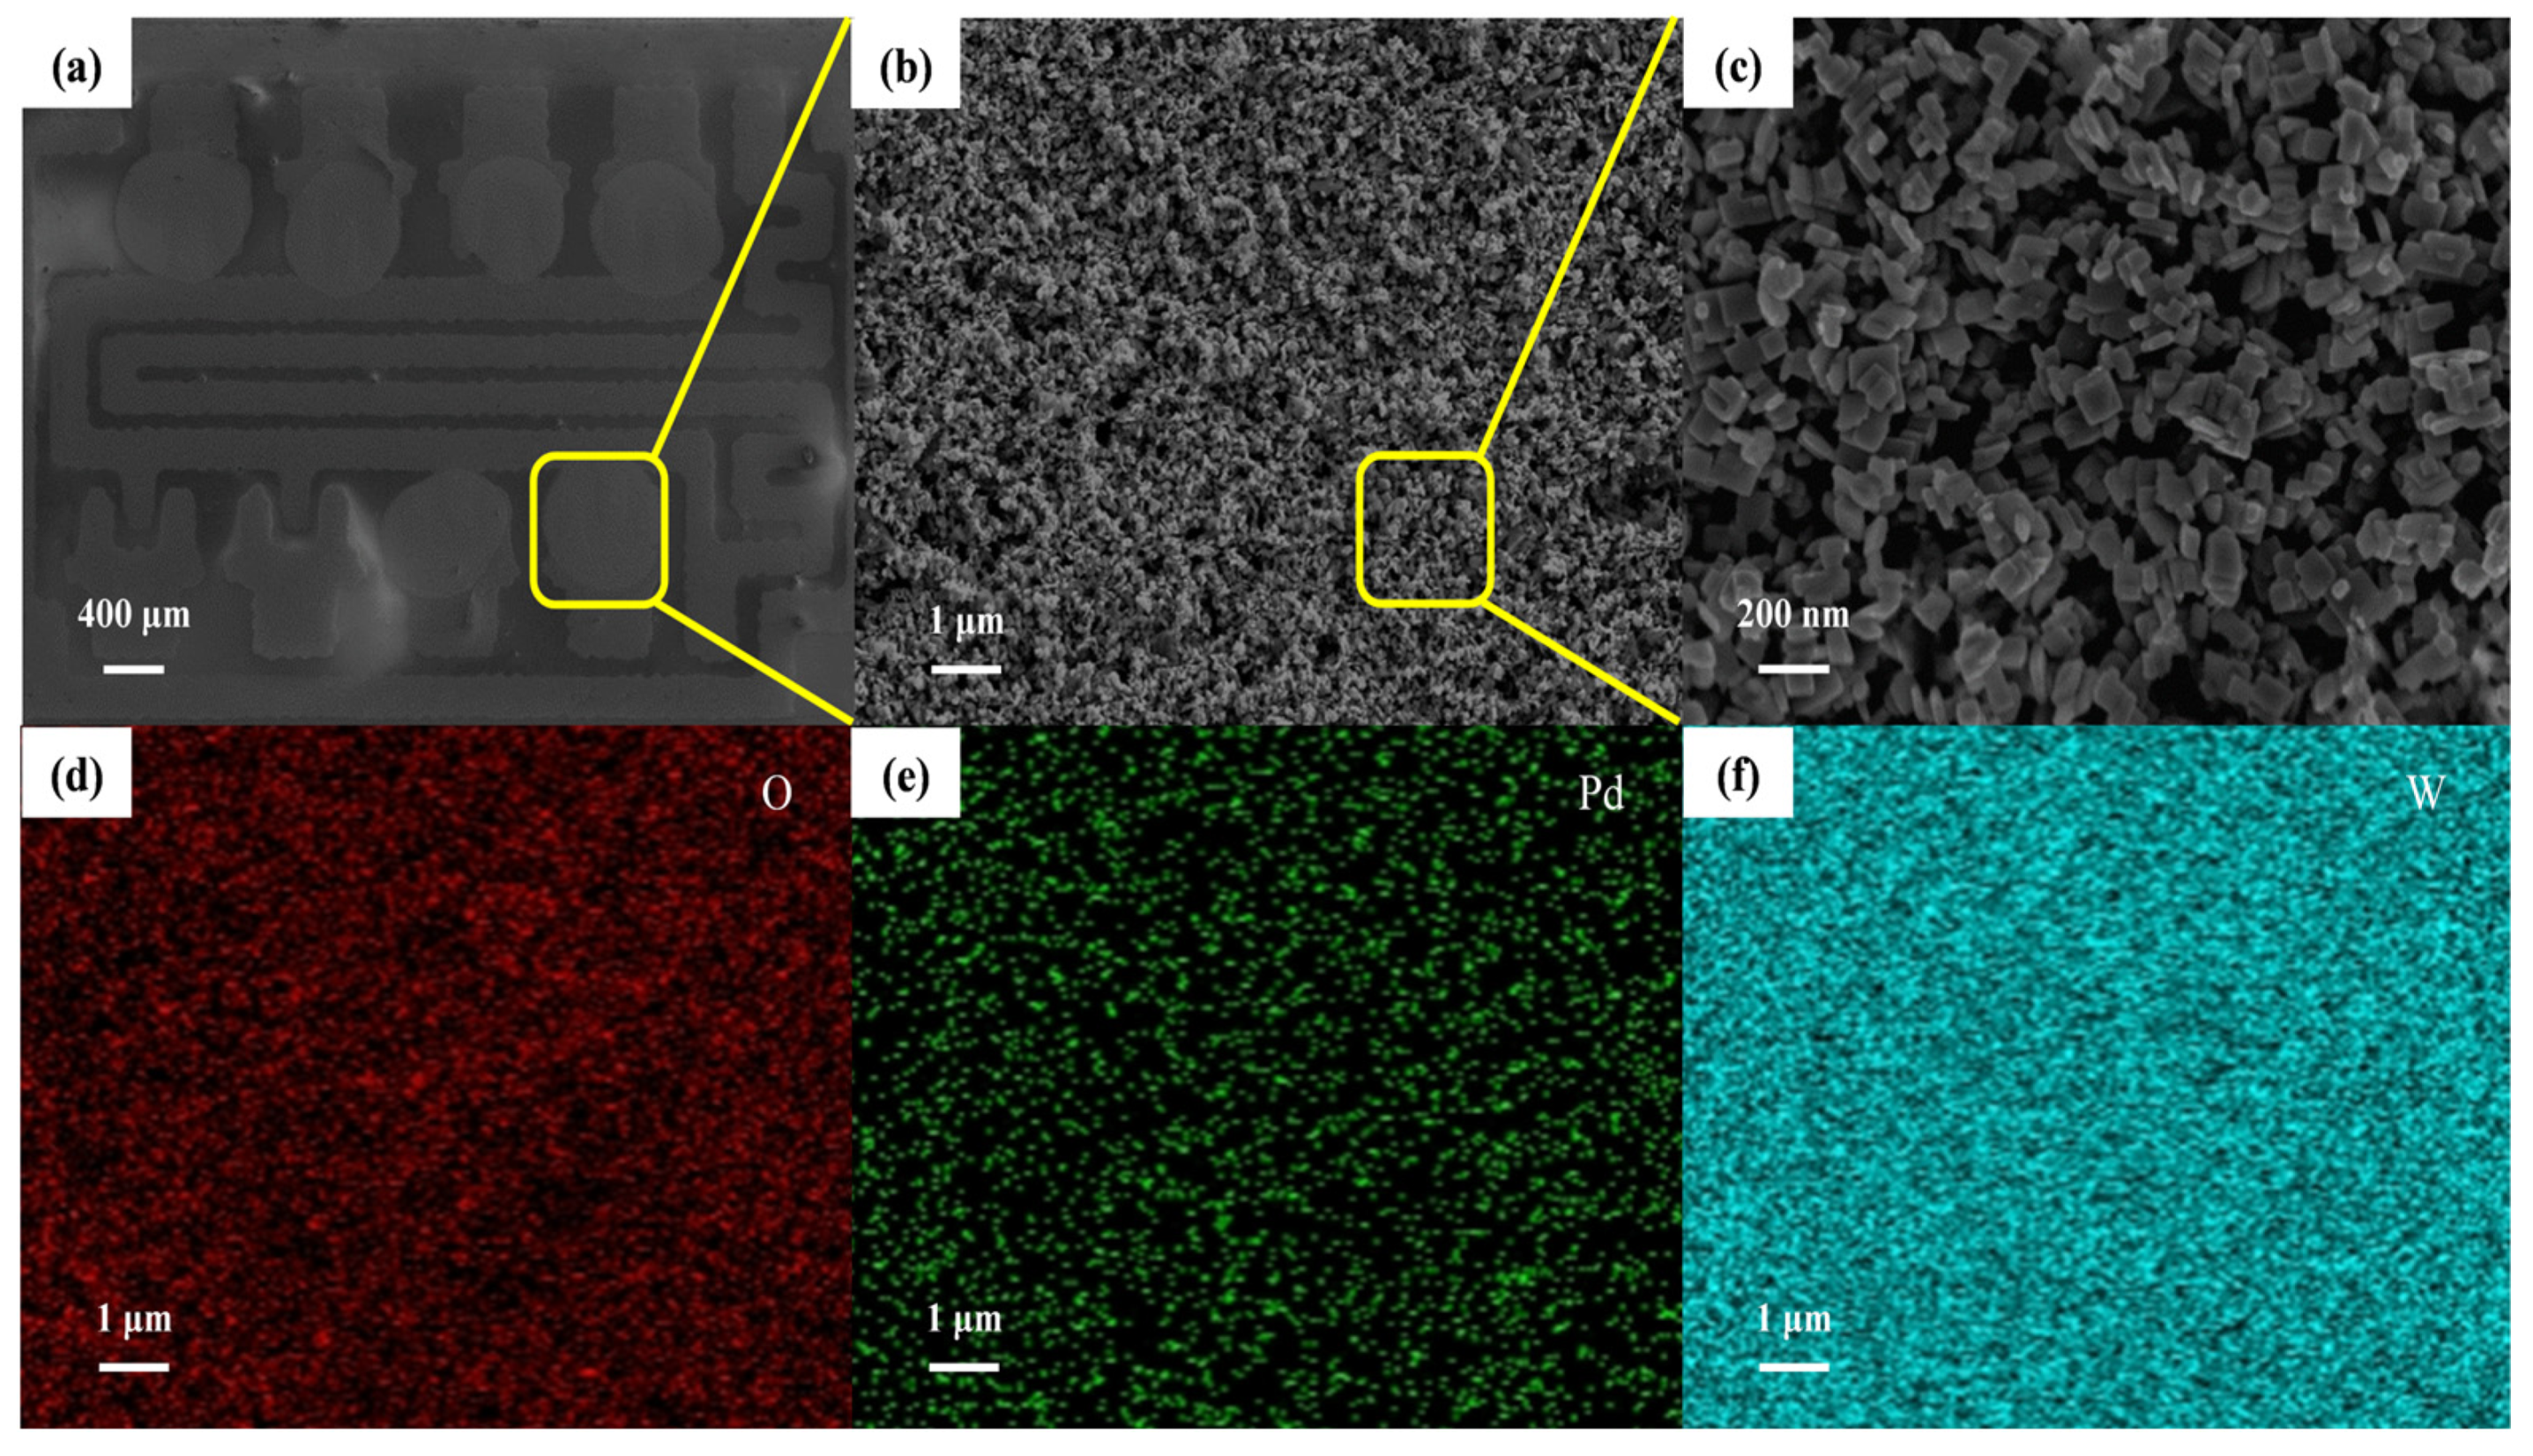
3.1. Structure and Morphology Characterization

To determine the crystallinity and crystal phase of the as-fabricated samples, we used X-ray diffraction. The diffraction peaks corresponded to monoclinic WO3 (JCPDS: 43-1035), as shown in Figure 4a. The peaks were sharp and exhibited a high intensity, with no miscellaneous peaks observed. These results indicate that pure monoclinic WO3 with a high crystallinity was obtained. In Figure 4b, the WO3 nanoplates with significant dispersion were clearly visible. The nanoplates exhibited a smooth plate-like morphology, with an average thickness of 30 nm and length of 80 nm.
Figure 5a depicts the WO3 gas-sensitive films modified by Pd at different modification ratios (0.1 mol%, 0.2 mol%, 0.3 mol%, 0.4 mol%, and 0.5 mol%). Figure 5b,c show a local amplification map of the WO3-0.5 mol% Pd film, which is a thick, porous film with a flat surface and no macroscopic or microscopic cracks. Moreover, WO3 was uniformly attached to the substrate. To illustrate the spatial distribution of W, O, and Pd in the WO3-0.5 mol% Pd film, homologous elemental mappings were obtained (Figure 5d–f). The fact that all three components were distributed uniformly further indicated that Pd had been evenly loaded onto the surface of WO3 nanoplates.

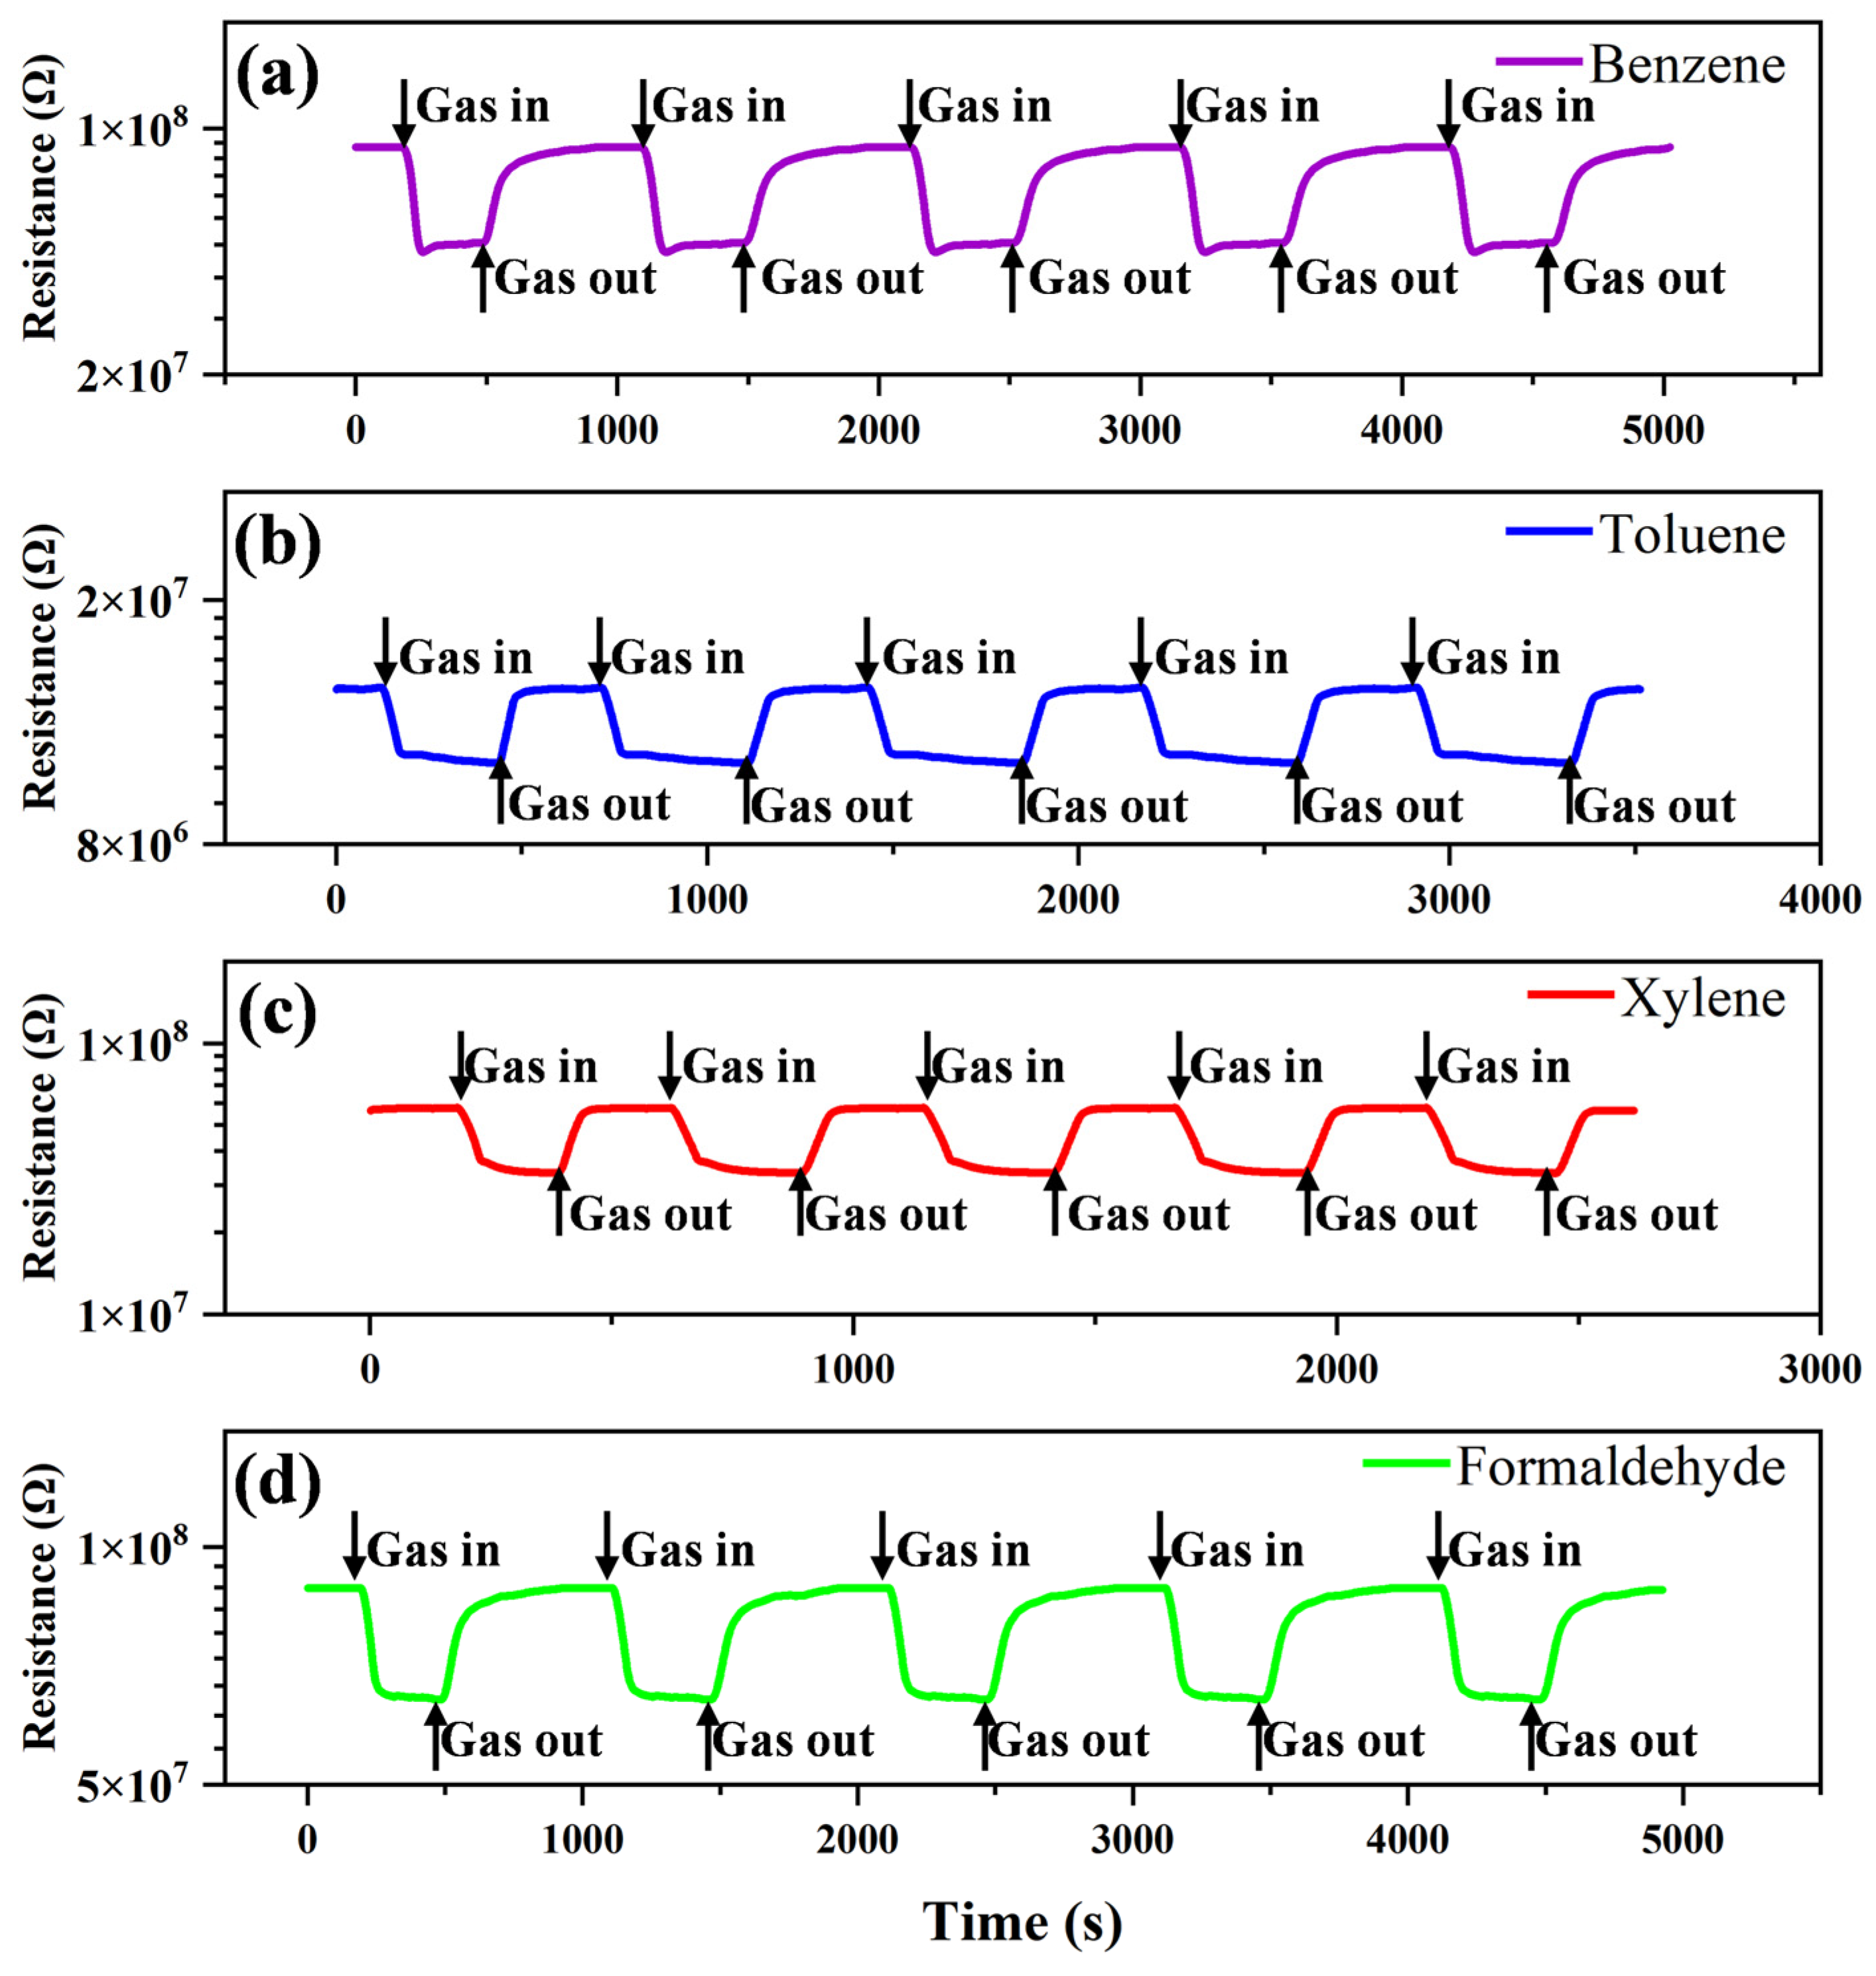
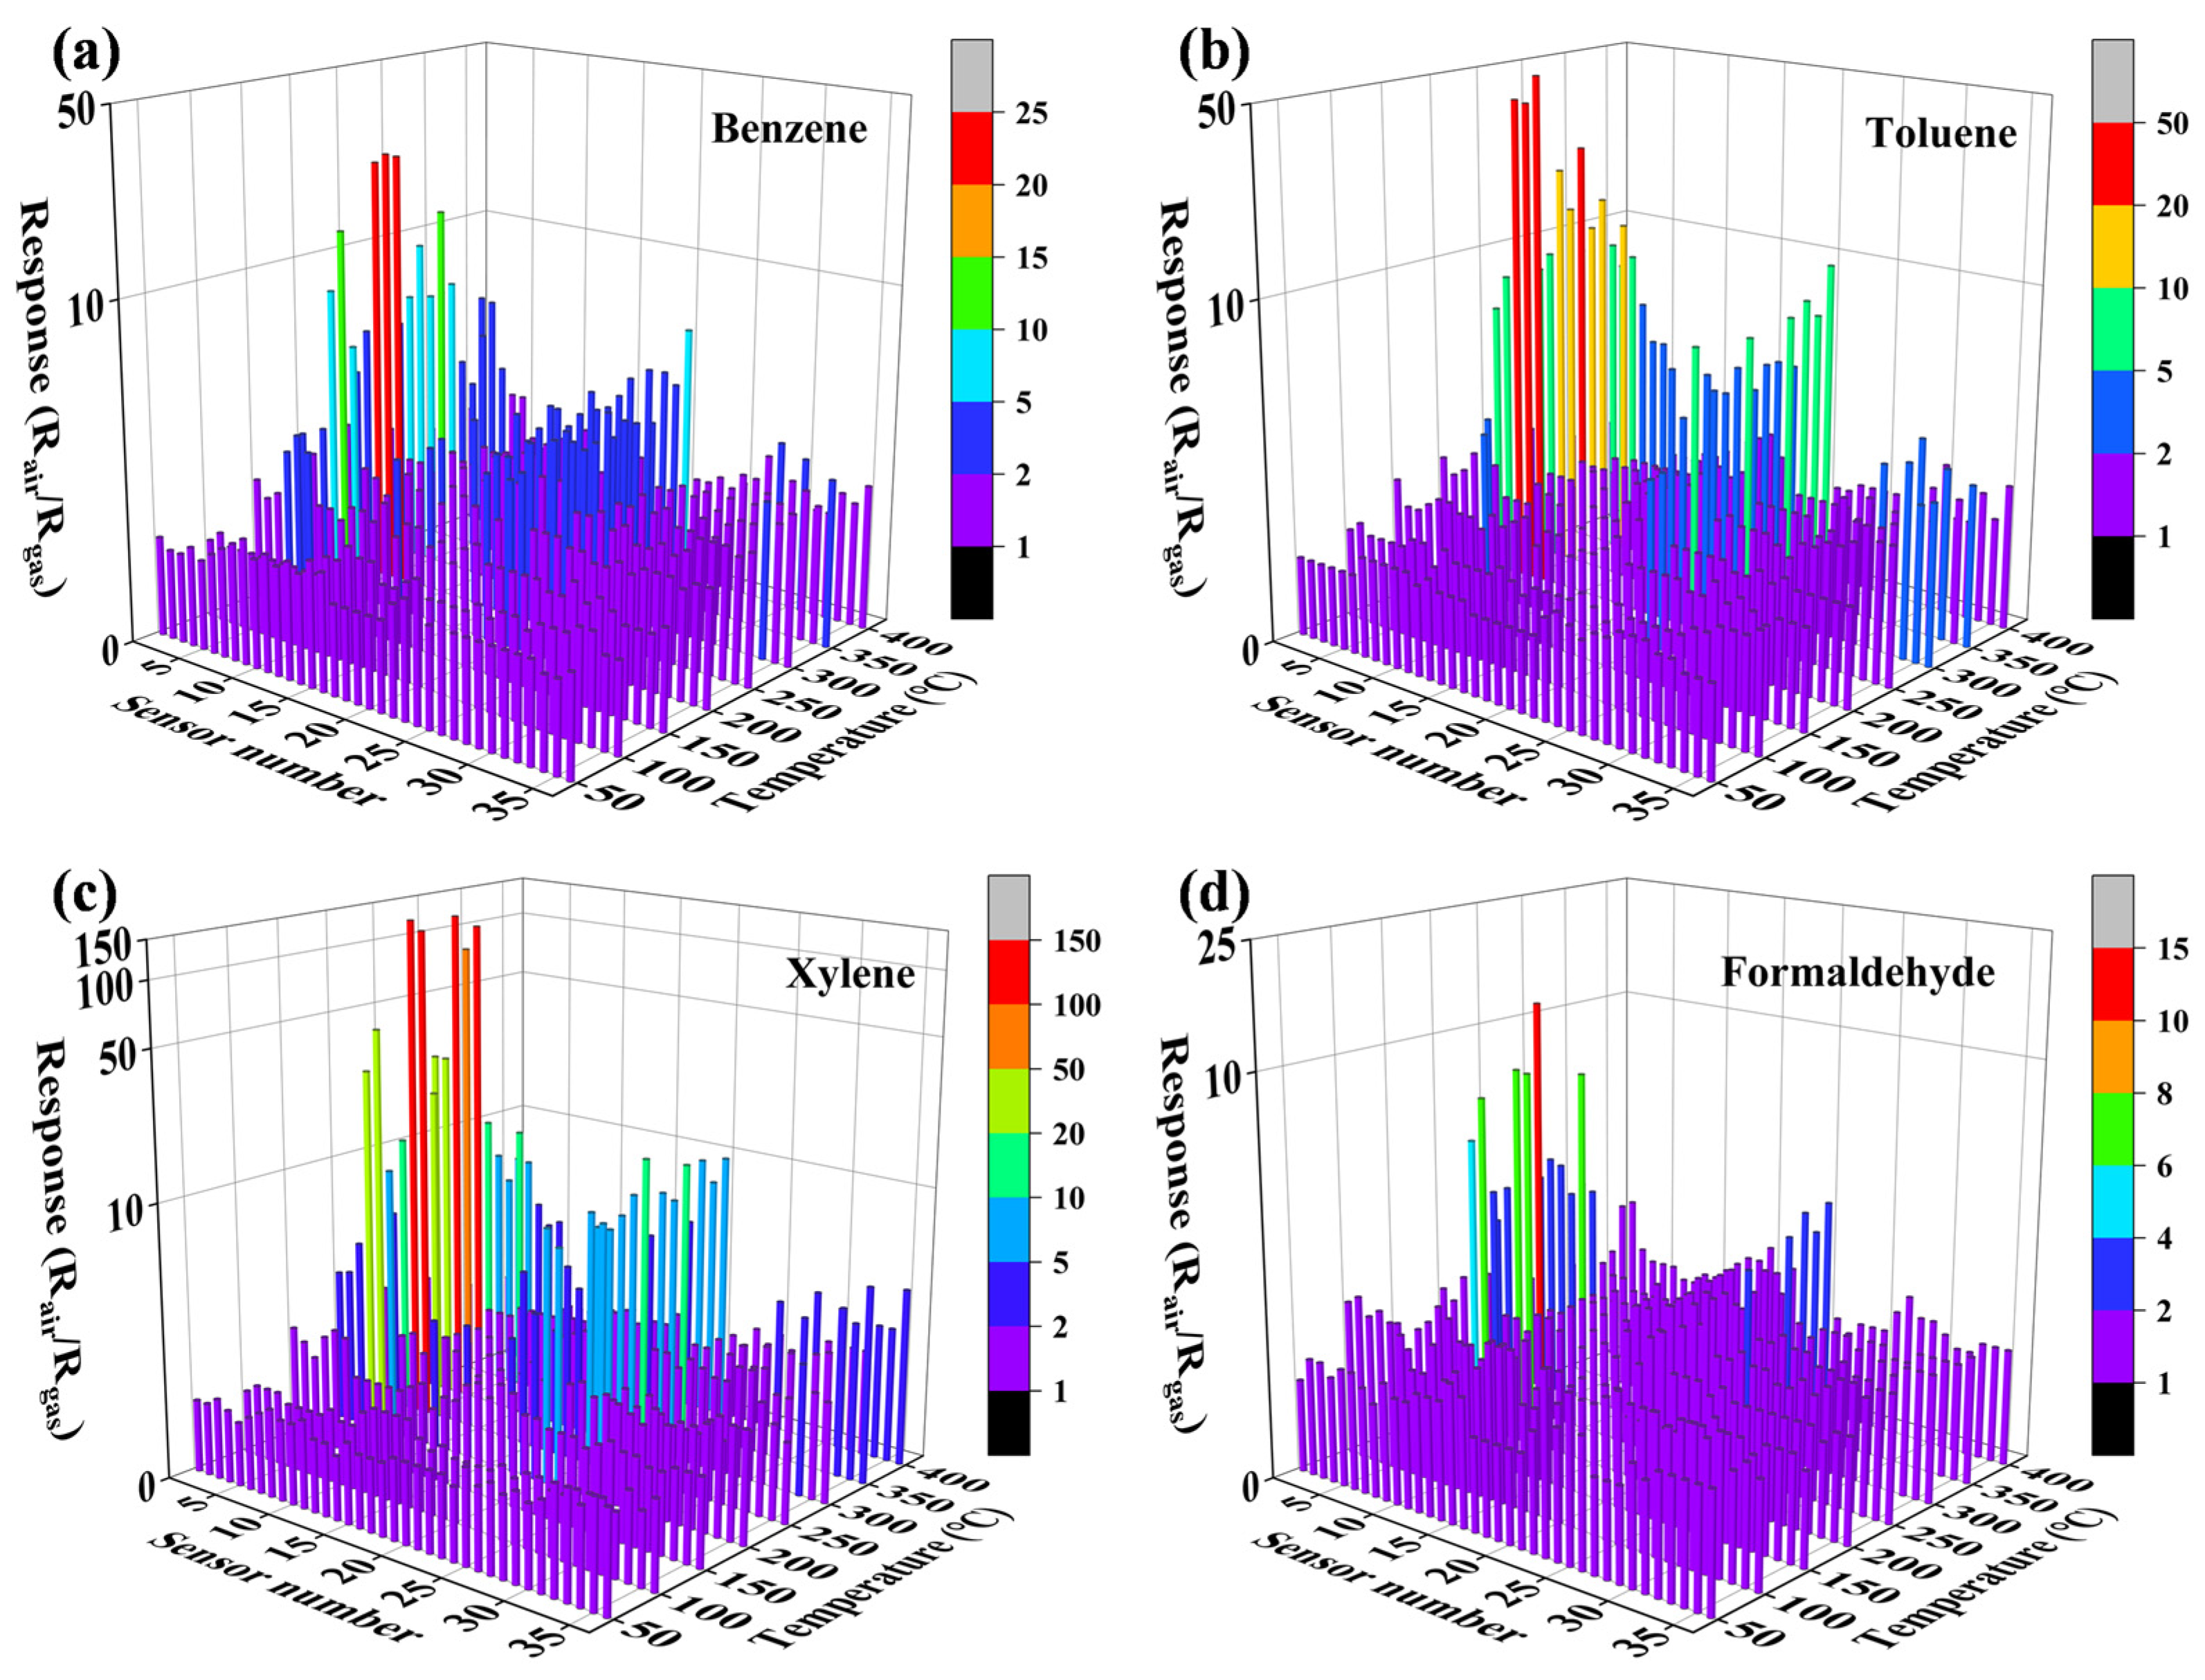
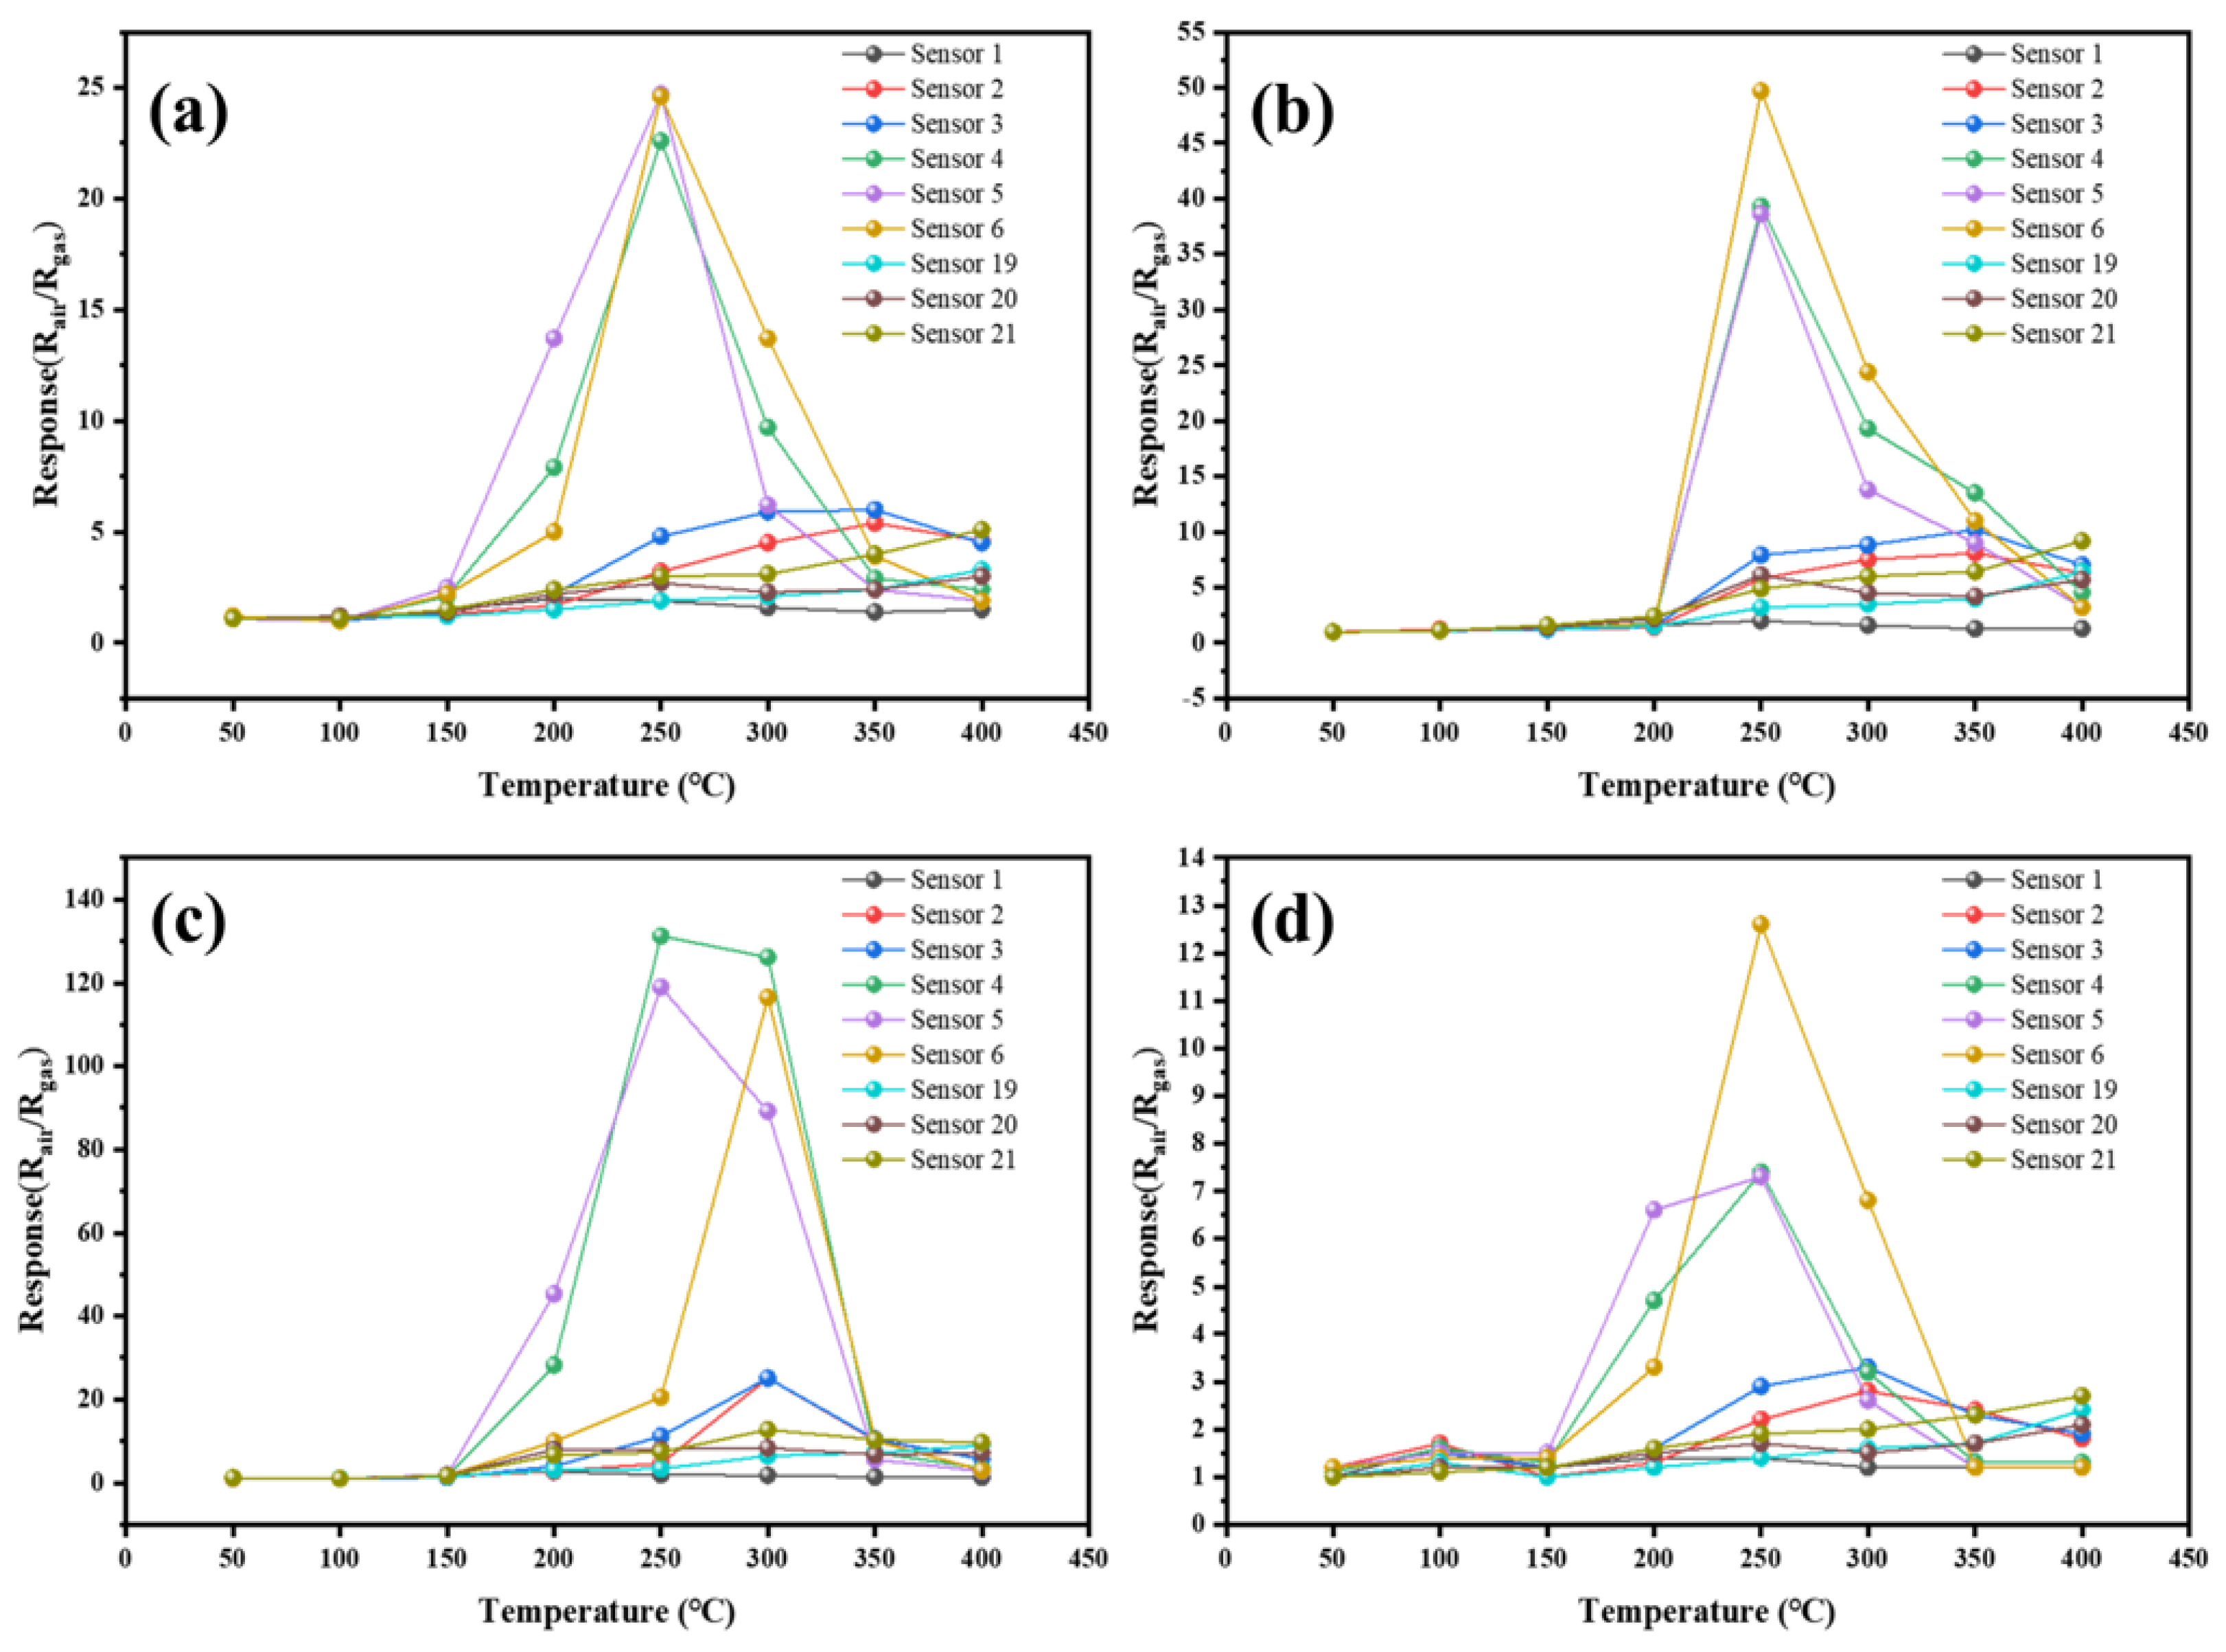
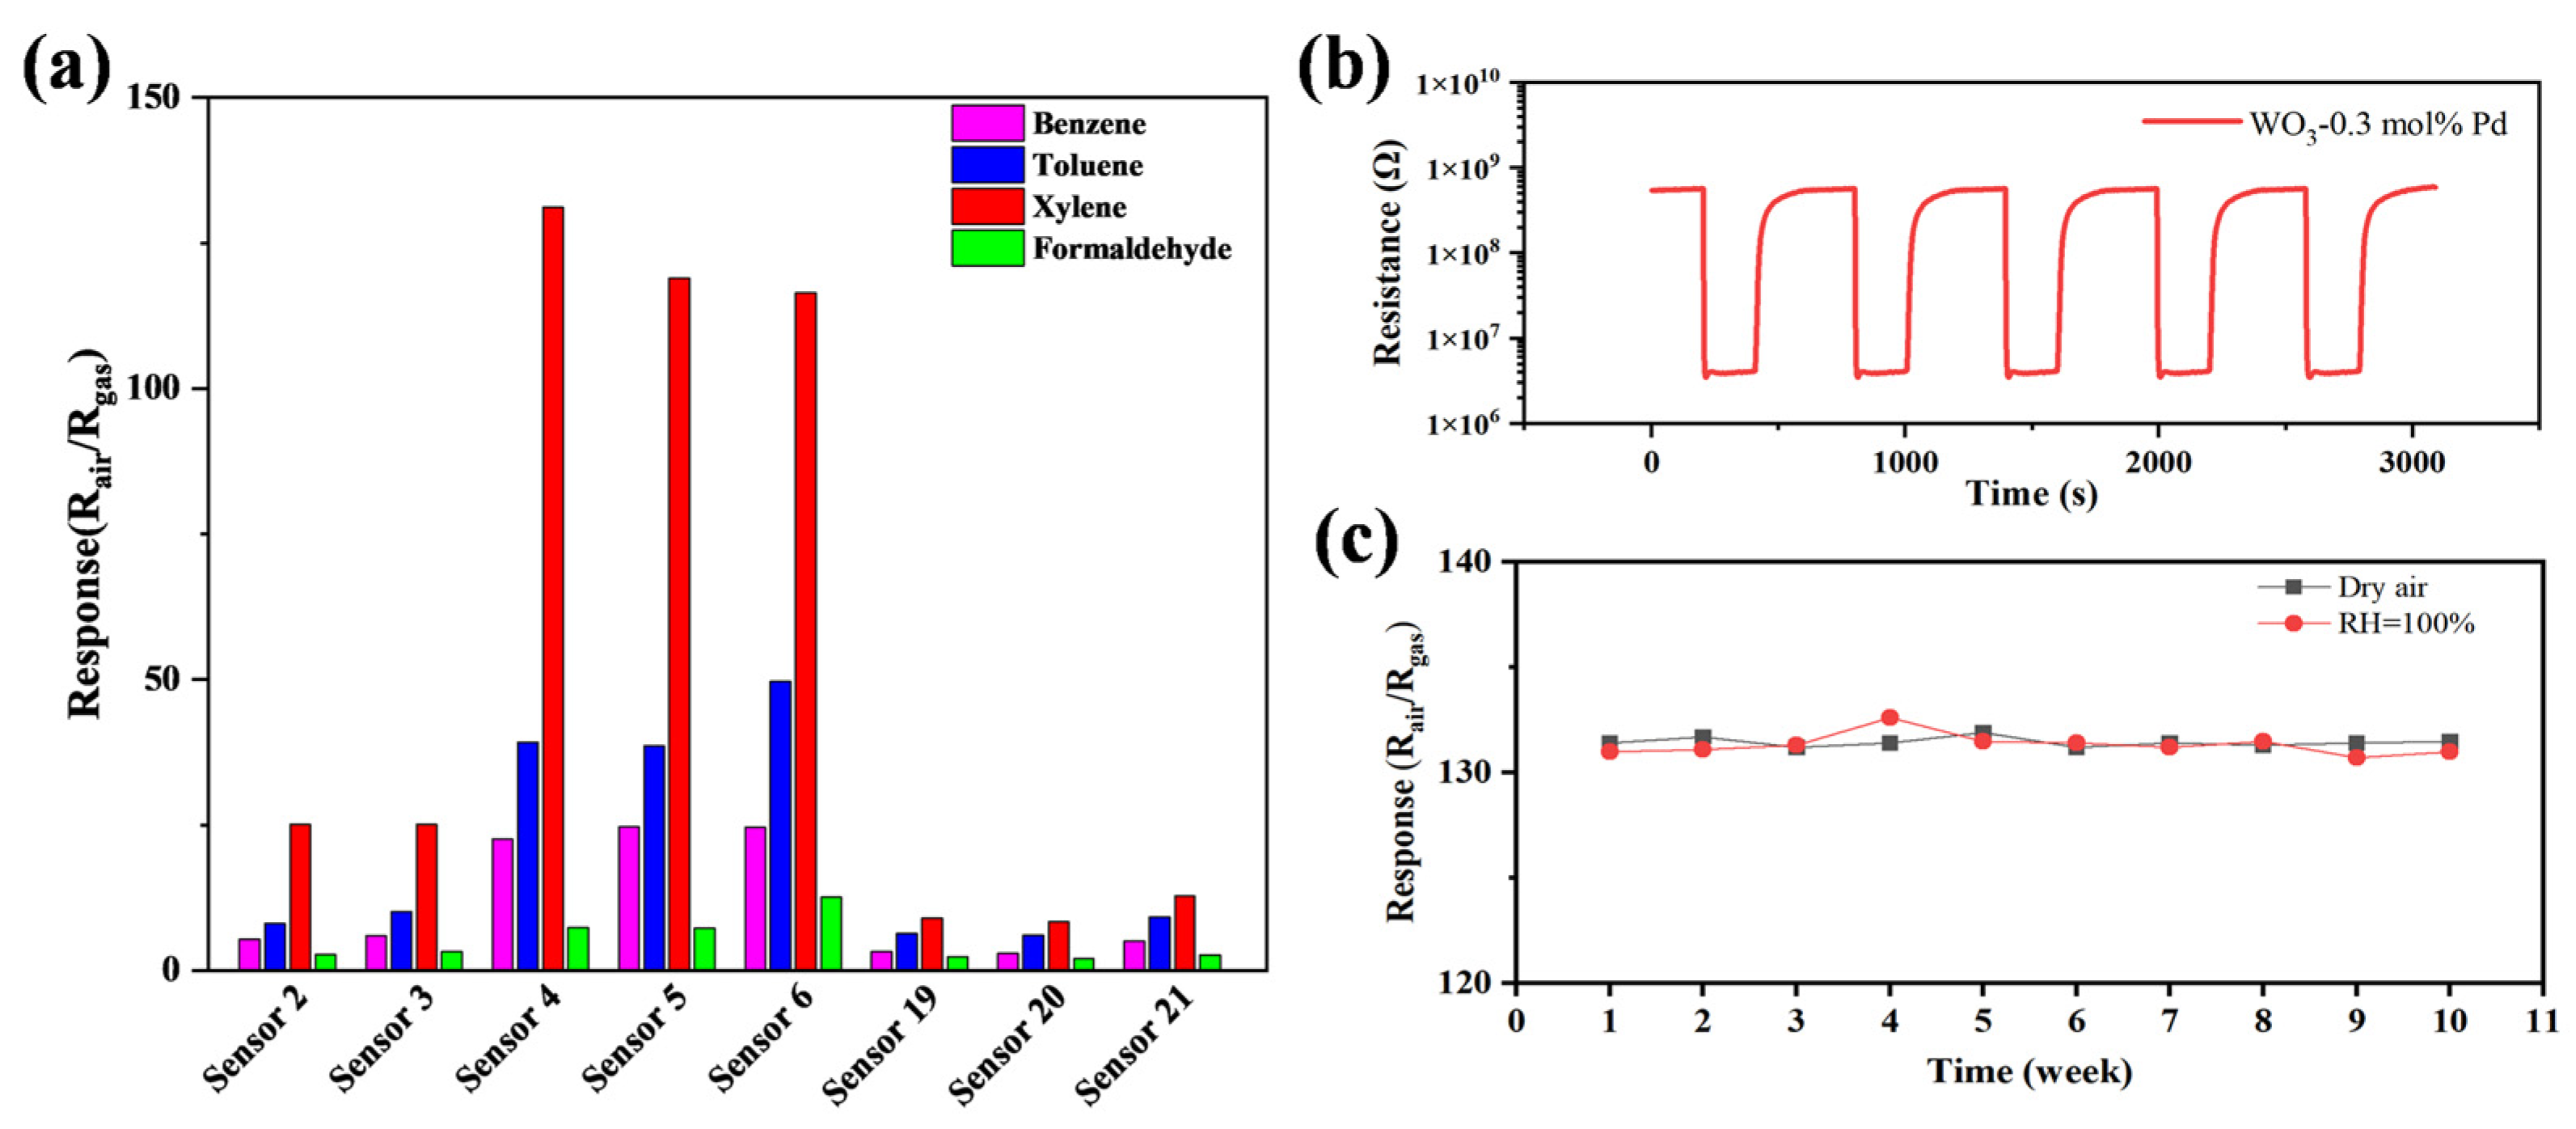
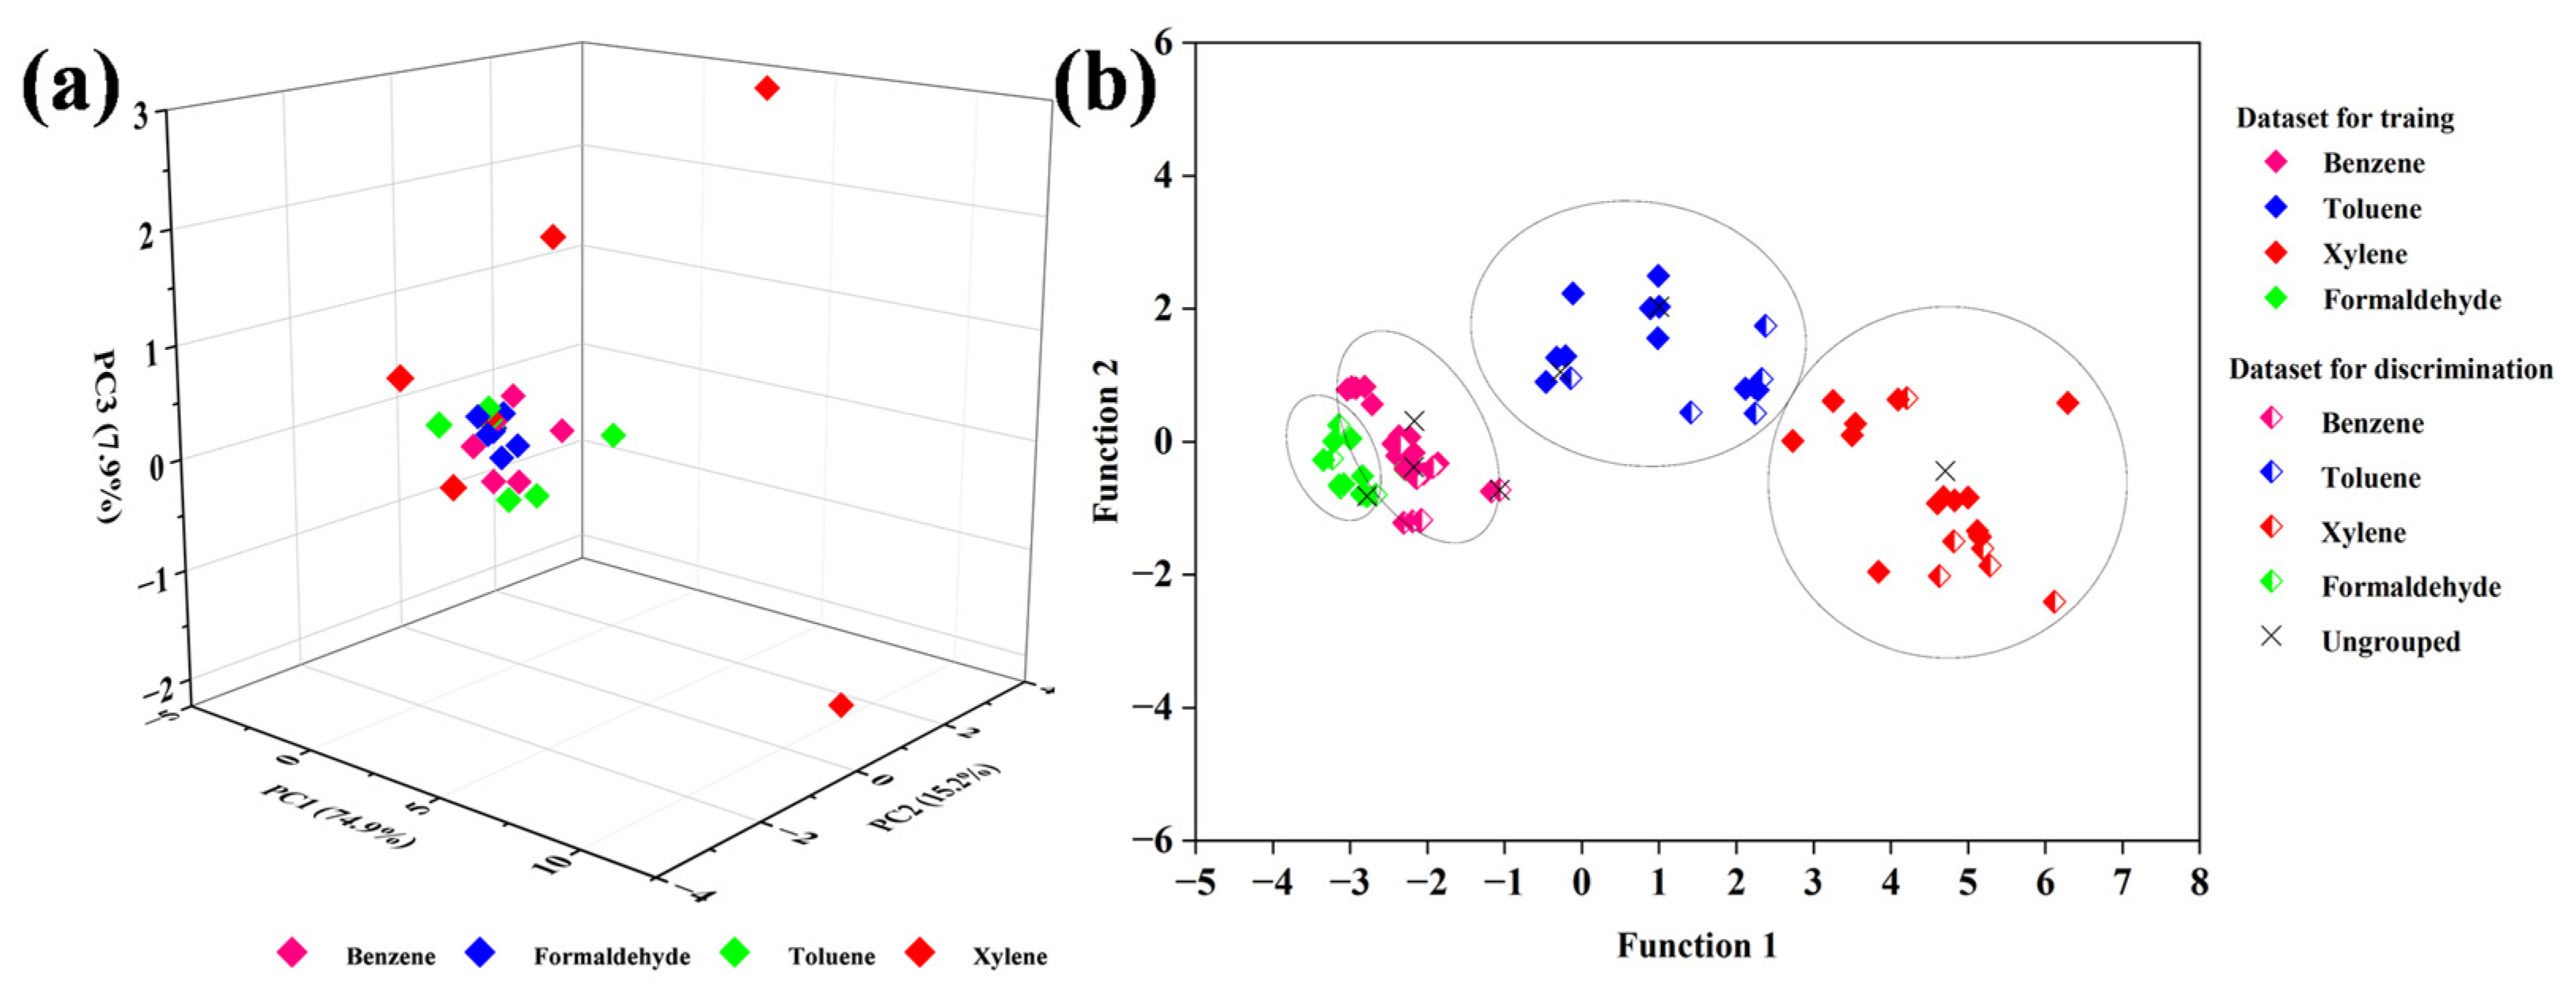
3.2. Gas-Sensing Properties

The adsorption and desorption of surface gas molecules affect changes in resistance, which are used to assess the response of semiconductor gas sensors. The operating temperature, which changed the adsorption and desorption properties, rate of gas molecules diffusion, and concentration of charges in the sensing material, has a significant impact on the response. To investigate how the response value and operational temperature are related, responses of as-prepared 36 materials toward 100 ppm of benzene, toluene, xylene, and formaldehyde were determined at different operating temperatures (400, 350, 300, 250, 200, 150, 100, and 50 °C). The response equation of the sensor is as follows:
S = Rair/Rgas
where Rair denotes air resistance and Rgas denotes test gas resistance. Each test was run five times, and the average response value was determined as S. Figure 6 shows the resistance–time (RT) curves of the sensor for the four gases at 250 °C; the sensor showed repeatable results. In addition, the gas response of pristine WO3 at 250 °C for 100 ppm of benzene, toluene, xylene, and formaldehyde are 1.9, 2.0, 2.7 and 1.6, respectively.
Figure 7 displays the reactions of all 36 materials to the four gases at different operating temperatures. For each gas, the responses of materials modified with Pd and Pt were significantly superior to those of the other gas sensors. This may be due to their unique catalytic properties and electron arrangement [29]. We selected eight materials with the best performance to compare with pristine WO3 (Figure 8): Sensor 2, Sensor 3, Sensor 4, Sensor 5, Sensor 6, Sensor 19, Sensor 20, and Sensor 21. The results show that precious metal ions can reduce the optimal temperature and significantly improve the response of alkaline materials to the test gas. Most of the sensors showed subpar responses below 150 °C, probably due to the unavailability of active sensing locations on the sensor surface, thereby resulting in a reduced interaction between WO3 and the test gas on the surface. In general, a higher operating temperature enhances the reaction kinetics at the sensor surface [30,31]; this is because a sufficient amount of thermal energy can overcome the activation energy barrier. For example, responses of WO3-0.3 mol% Pd increased with a rise in operating temperature until 250 °C (Sensor 4). The reaction was inhibited as a result of the dominance of gas desorption at excessive operating temperatures [32]. Consequently, the optimal operating temperature of WO3 modified with 0.3 mol% Pd (Sensor 4), 0.4 mol% Pd (Sensor 5), and 0.5 mol% Pd (Sensor 6) under 100 ppm of benzene, toluene, and formaldehyde was reduced to 250 °C. Meanwhile, the optimal operating temperature of WO3 modified with 0.3 mol% Pd and 0.4 mol% Pd for xylene was 250 °C. The response values of pristine WO3 to 100 ppm of the four gases were around 1 to 2, whereas those of WO3-0.4 mol% Pd, WO3-0.5 mol% Pd, WO3-0.3 mol% Pd, and WO3-0.5 mol% Pd were 24.7, 49.7, 131.2, and 12.6, respectively. We can see that WO3-0.3 mol% Pd responds better to 100 ppm xylene than WO3-0.4 mol% Pd and WO3-0.5 mol% Pd. This is because, in some cases, low Pd concentrations can be distributed uniformly on the films. Meanwhile, higher Pd concentrations can coalesce with themselves instead of combining with the films in the modified state. Alternatively, this discrepancy may be a result of the intermediates produced in the reaction for the different types of gas.
The response and recovery times of the 36 gas-sensitive materials are shown in Figure 9. Compared to pristine WO3, the response and recovery times of Sensor 4, Sensor 5, and Sensor 6 were lower. For benzene, toluene, xylene, and formaldehyde, the response time was shortened by 27.7 s, 30.1 s, 31.1 s, and 33.5 s, respectively; the recovery time was shortened by 37.9 s, 13 s, 10.2 s, and 11.2 s, respectively. In particular, the response and recovery times of WO3-0.3 mol% Pd are 3.9 s and 189.2 s. In Figure 9, the modification element of Sensor 4, 5, and 6 is Pd. The response value’s sudden change in gas exposure could be interpreted as the work function of the Pd element (5.22 eV) and WO3 (4.56 eV) having an obvious difference, resulting in the formation of a Schottky barrier in the contact interface. Its existence results in an increase in the material baseline resistance, promoting the response value. Moreover, owing to the electron sensitization of Pd element, it is easily oxidized to form PdOx in air and quickly reduced to metal in reducing gas. The conversion between the two forms causes a rapid increase in the gas-sensitive response, and this phenomenon recovers slightly and becomes gradually steady when the reduced gas is saturated. Thus, it can be concluded that Pd improves the gas-sensing properties of tungsten oxide the most. WO3 modified with Pd exhibited modest selectivity due to the wide-spectrum response of the metal oxide materials sensitive to gases. Thus, it is difficult to distinguish its response to the four gases.
To facilitate gas identification, we first performed a cluster analysis of the 36 materials described above. Materials with a good performance were selected to test the various types of gases under optimal temperature conditions; that is, the material performance was represented using a raw feature space with dimensions of 36 × 4. To show the relationship between materials, the effect of modification elements on the material properties was analyzed. We used Euclidean distance between the materials to analyze the material response (Supplementary Figure S1). By drawing a straight horizontal line in the tree gram, sensors were divided into six categories. The first three categories of sensors are represented by Sensor 4, Sensor 5, and Sensor 6, which have the best response values. The fourth category includes Sensor 3 and Sensor 2, which exhibit an inferior performance to those of sensors in the first three categories. The fifth category includes Sensor 21, Sensor 20, Sensor 19, and Sensor 18.
After conducting a repeatability test, we selected the above eight sensors as the optimized sensor arrays, and their sensing performance to 100 ppm of the four tested gases at optimal operating temperatures is displayed in Figure 10a. The responses of Sensor 4, Sensor 5, and Sensor 6 to xylene were markedly superior to their responses to the other three gases. Conversely, the other five sensors exhibited comparatively weaker responses, thus affirming the clustering analysis findings. The repeatability and long-term stability of materials have always been important parameters for measuring the practical applicability of gas-sensitive sensors. To explore the cycling stability of materials, the five response and recovery curves of WO3-0.3 mol% Pd at 250 °C for 100 ppm xylene are compared in Figure 10b. It can be seen that the cycling stability of WO3-0.3 mol% Pd is excellent. Furthermore, the effect of humidity on the sensor performance should be taken into account. Therefore, repeatability and long-term stability tests of WO3-0.3 mol% Pd were performed for 100 ppm xylene under dry air at 250 °C and a relative humidity of 100%. Long-term stability experiments were performed once a week in five cycles for ten weeks. As shown in Figure 10c, the gas-sensing response of WO3-0.3 mol% Pd fluctuated around 131.2 and the maximum fluctuation difference was only 2.31%, indicating that this sample exhibited good resistance to humidity interference and showed good long-term stability and repeatability.
Subsequently, the four gases were qualitatively identified with the optimized sensor array using principal component analysis (PCA) and Fisher discriminant analysis (FDA) [33,34]. To eliminate any redundant signals, response values obtained below 200 °C were excluded. Each gas was tested five times at the same temperature. In the PCA analysis, the response values for 100 ppm of the four test gases at 200 °C, 250 °C, 300 °C, 350 °C, and 400 °C were considered as the observed values, while the four gas samples were used as variables. The results are presented in Figure 11a. According to the figure, the optimized sensor array shows improved recognition rules and a clear clustering effect for the four gases. Each target gas sample was dispersed throughout a variety of areas, especially xylene, which could be clearly distinguished. However, due to the differences in the response values at various temperatures, its characteristic points are relatively scattered. For benzene, toluene, and formaldehyde, there was a substantial overlap, indicating a low discrimination capability. To further discriminate between the tested gases, FDA was employed, which is widely used as a pattern recognition method [35,36]. High-dimensional historical data can be reduced with this analytic procedure to a low-dimensional principal component space; that is, the newly acquired data are used for pattern recognition by projecting them onto the principal component space. In FDA, three steps are involved: first, identify a category pattern vector that can represent the data category; second, extract the most important and most sensitive feature parameter and feature vector in the data category and then extract the data category; finally, perform pattern recognition using a discriminant function composed of feature vectors, where function 1 and function 2 are discriminant functions. K-fold cross-validation was used to divide the pretreatment data into training and validation sets on many occasions to prevent over-fitting [37,38]. Four-fold cross-validation was used with a large number of data sets; that is, the tested samples were split into four sample subsets: one sample served as the discrimination validation data, whereas the remaining three were used as training data. The two-dimensional plots of FDA exhibit the independent gas species. The samples could be distinguished with 95% accuracy, as shown in Figure 11b. The discrimination rates are shown in Table 2 and demonstrate that the array optimization sensor was reliable.

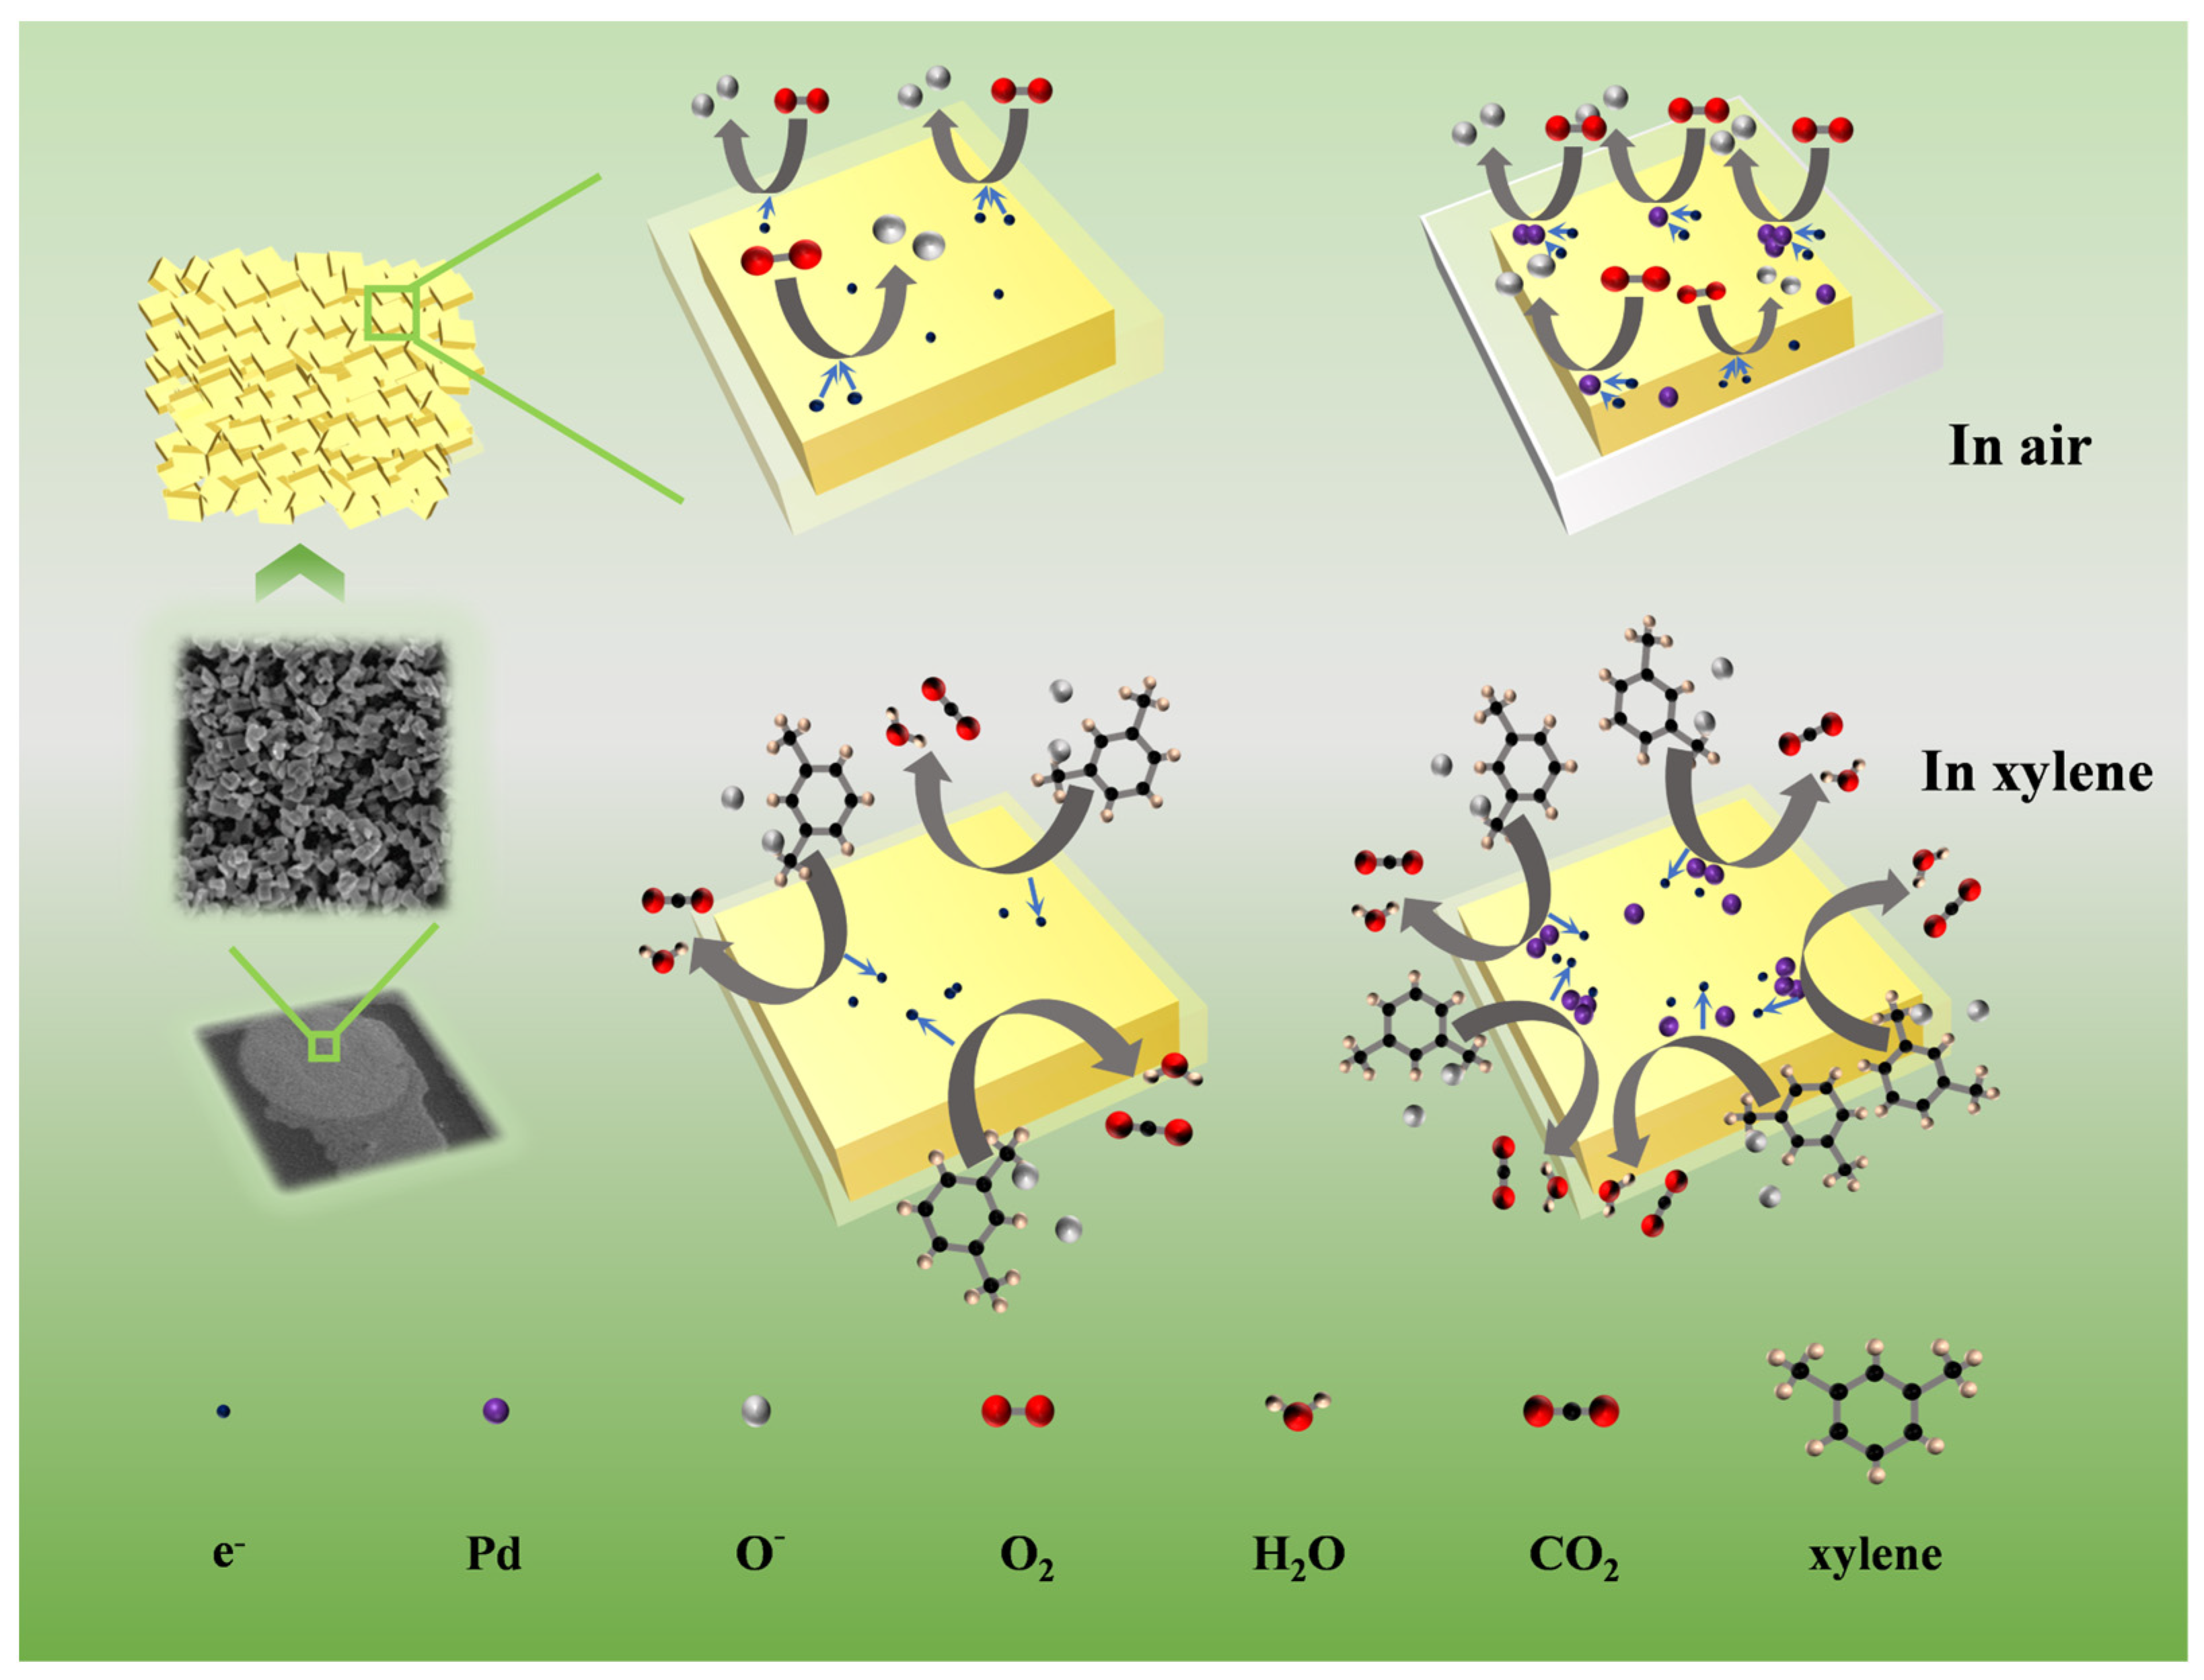
3.3. Gas-Sensing Mechanism

In this section, we focus on the reaction mechanisms of the pristine WO3 nanoplates and WO3 decorated with Pd to xylene. In general, it is believed that the sensing mechanism of MOS-based gas sensors varies according to the electrical characteristics of the redox reaction that takes place on the material surface. The gas-sensing performance of WO3-based gas-sensing materials is probably attributed to the change in resistance. As shown in Figure 12, oxygen molecules had a tendency to take electrons from the compound and split into adsorbed oxygen ions (O, O2, O2−) when n-type WO3 was exposed to air. This led to the formation of a depletion layer, which increased resistance. The oxygen ion species were determined using the operating temperature range, and their formation equations are as follows [39]:
O2(gas) → O2(ads)
O2(ads) + e → O2(ads) (T < 100 °C)
O2(ads) + 2e → 2O(ads) (100 °C < T < 300 °C)
O2(ads) + 4e → 2O2−(ads) (300 °C < T)
where O may be the predominant oxygen species, since the WO3-Pd sensor responds best at 250 °C. When the gas sensor came into contact with xylene molecules, adsorbed oxygen ions (O) interacted with xylene and electrons were released back to the WO3 surface. This caused the depletion layer to become thin and reduce resistance while producing the final products of CO2 and H2O [40]; the reaction equation can be described as follows:
C8H10(gas) → C8H10(ads)
C8H10(gas) + 21O(ads) → 8CO2 + 5H2O + 21e
The sensing performance was enhanced due to the chemical sensitization occurring in the presence of noble metals [41]. As shown in the right part of Figure 12, Pd nanoparticles were embedded onto the WO3 surface, which facilitated the catalytic dissociation of oxygen molecules into adsorbed oxygen. The spillover effect occurred as the adsorbed oxygen content gradually increased on metal oxide surfaces; that is, the addition of Pd extends the depletion layer, increases resistance, and facilitates the adsorption of oxygen molecules. The experimental results reveal that WO3 modified with Pd and Pt exhibited significantly better response values to the four gases when compared to the response values of WO3 modified with other precious metals. This may be related to their unique catalytic properties and electron arrangements. Moreover, the modification concentration also affected the response results. Figure 8 shows that the response of WO3-0.3 mol% Pd to xylene is the best at 250 °C. This may be because of the inferior precious metal catalysis and reduced preferential oxygen adsorption when the Pd content is lower than 0.3 mol%. However, concentrations higher than 0.3 mol% are actually unnecessary; that is, noble metals agglomerate and bind to each other, but not to the modified substrate. This results in a decreased oxygen adsorption content and reduced response value. Another significant factor for performance improvement is electron sensitization. Owing to the difference in the work functions of Pd (5.22 eV) nanoparticles and WO3 (4.56 eV), the contact interface forms a Schottky barrier. Electrons continue to move from WO3 to Pd nanoparticles until the same Fermi level is reached. The cumulation of electrons on Pd nanoparticles enhances the oxygen capture ability, which, in turn, promotes the adsorption of oxygen.

4. Conclusions

In summary, we utilized a parallel synthesizer and high-throughput screening platform to prepare and characterize 36 gas-sensitive materials in conjunction with four typical VOCs. This approach enabled a rapid, efficient, and simultaneous characterization of gas-sensitive material screening. Our findings demonstrate that WO3 modified with 0.3 mol% Pd exhibited a 56-fold greater responsiveness than pristine WO3 toward 100 ppm xylene, and the optimal operating temperature was reduced to 250 °C. This improved performance is likely attributed to the chemical sensitization and electron sensitization of Pd. Overall, WO3 decorated with Pd has the potential to be used for the development of high-performance xylene gas sensors, enabling the rapid detection of xylene. To further identify the gas species, we performed a cluster analysis of the materials prepared above and identified eight materials as optimized sensor arrays. The classification rate of the four gases exceeded 95%. Owing to the high-throughput screening technique, the preparation speed and characterization of VOC gas-sensitive materials were greatly improved. The selected sensor arrays can be used to monitor and identify indoor organic pollutants.

Supplementary Materials

The following supporting information can be downloaded at: https://www.mdpi.com/article/10.3390/chemosensors11040239/s1, Figure S1: Cluster analysis of the different gas-sensitive materials; Table S1: Sensor number of the gas-sensitive materials.

Author Contributions

Conceptualization, M.H., L.Y. and S.G.; methodology, R.G., J.G. and M.H.; validation, Y.M.; investigation, Y.M., G.Z. and J.G.; writing—review and editing, Y.M., G.Z. and L.Y.; project administration, S.G. and R.G. All authors have read and agreed to the published version of the manuscript.

Funding

This research was supported by Yunnan Province Science and Technology Major Project for Materials Genetic Engineering of Rare and Precious Metal (202002AB080001); National Natural Science Foundation of China (51864028); Science Research Foundation of Yunnan Provincial Education Department (2022J0441); Sichuan Science and Technology Program (22QYCX0097).

Institutional Review Board Statement

Not applicable.

Informed Consent Statement

Not applicable.

Data Availability Statement

Not applicable.

Conflicts of Interest

The authors declare no conflict of interest.

References

  1. Chung, P.R.; Zeng, C.T.; Ke, M.T.; Lee, C.Y. Formaldehyde gas sensors: A review. Sensors 2013, 13, 4468–4484. [Google Scholar] [CrossRef] [PubMed] [Green Version]
  2. Guo, W.; Surya, S.G.; Babar, V.; Ming, F.; Sharma, S.; Alshareef, H.N.; Schwingenschlogl, U.; Salama, K.N. Selective Toluene Detection with Mo2CTx MXene at Room Temperature. ACS Appl. Mater. Interfaces 2020, 12, 57218–57227. [Google Scholar] [CrossRef] [PubMed]
  3. Li, Y.; Wang, H.; Liu, Y.; Li, Y.; Wang, C.; Bai, J.; Yang, L.; Wang, Y.; Liu, F.; Liang, X.; et al. Bimetallic PtRu alloy nanocrystal-functionalized flower-like WO3 for fast detection of xylene. Sens. Actuators B Chem. 2022, 351, 130950–130960. [Google Scholar] [CrossRef]
  4. Wang, W.; Li, F.; Zhang, N.; Liu, C.; Zhou, J.; Liu, D.; Ruan, S. Self-assembled Co3O4@WO3 hollow microspheres with oxygen vacancy defects for fast and selective detection of toluene. Sens. Actuators B Chem. 2022, 351, 130931–130943. [Google Scholar] [CrossRef]
  5. Lee, J.H. Gas sensors using hierarchical and hollow oxide nanostructures: Overview. Sens. Actuators B Chem. 2009, 140, 319–336. [Google Scholar] [CrossRef]
  6. Korotcenkov, G. Practical aspects in design of one-electrode semiconductor gas sensors: Status report. Sens. Actuators B Chem. 2007, 121, 664–678. [Google Scholar] [CrossRef]
  7. Greene, L.E.; Law, M.; Goldberger, J.; Kim, F.; Johnson, J.C.; Zhang, Y.; Saykally, R.J.; Yang, P. Low-Temperature Wafer-Scale Production of ZnO Nanowire Arrays†. Angew. Chem. Int. Ed. Engl. 2003, 42, 3031–3034. [Google Scholar] [CrossRef] [PubMed]
  8. Li, C.; Zhang, S.; Hu, M.; Xie, C. Nanostructural ZnO based coplanar gas sensor arrays from the injection of metal chloride solutions: Device processing, gas-sensing properties and selectivity in liquors applications. Sens. Actuators B Chem. 2011, 153, 415–420. [Google Scholar] [CrossRef]
  9. Xie, C.; Xiao, L.; Hu, M.; Bai, Z.; Xia, X.; Zeng, D. Fabrication and formaldehyde gas-sensing property of ZnO–MnO2 coplanar gas sensor arrays. Sens. Actuators B Chem. 2010, 145, 457–463. [Google Scholar] [CrossRef]
  10. Yamazoe, N. Toward innovations of gas sensor technology. Sens. Actuators B Chem. 2005, 108, 2–14. [Google Scholar] [CrossRef]
  11. Lin, H.M.; Hsua, C.M.; Yang, H.Y.; Lee, P.Y.; Yang, C.C. Nanocrystalline WO3-based H2S sensors. Sens. Actuators B Chem. 1994, 22, 63–68. [Google Scholar] [CrossRef]
  12. Cai, Z.X.; Li, H.Y.; Ding, J.C.; Guo, X. Hierarchical flowerlike WO3 nanostructures assembled by porous nanoflakes for enhanced NO gas sensing. Sens. Actuators B Chem. 2017, 246, 225–234. [Google Scholar] [CrossRef]
  13. Liu, Z.; Liu, B.; Xie, W.; Li, H.; Zhou, R.; Li, Q.; Wang, T. Enhanced selective acetone sensing characteristics based on Co-doped WO3 hierarchical flower-like nanostructures assembled with nanoplates. Sens. Actuators B Chem. 2016, 235, 614–621. [Google Scholar] [CrossRef]
  14. Feng, C.; Teng, F.; Xu, Y.; Zhang, Y.; Fan, T.; Lin, T. Au-nanoparticle-decorated SnO2 nanorod sensor with enhanced xylene-sensing performance. Int. J. Appl. Ceram. Technol. 2017, 15, 742–750. [Google Scholar] [CrossRef]
  15. Liu, J.; Zhang, L.; Fan, J.; Zhu, B.; Yu, J. Triethylamine gas sensor based on Pt-functionalized hierarchical ZnO microspheres. Sens. Actuators B Chem. 2021, 331, 129425–129435. [Google Scholar] [CrossRef]
  16. Abbas, A.M.; Naif, H.A.; Hassan, E.S. Silver Loading Tin Oxide Nanostructure for Gas Sensing Application. Braz. J. Phys. 2021, 51, 618–624. [Google Scholar] [CrossRef]
  17. Horprathum, M.; Srichaiyaperk, T.; Samransuksamer, B.; Wisitsoraat, A.; Eiamchai, P.; Limwichean, S.; Chananonnawathorn, C.; Aiempanakit, K.; Nuntawong, N.; Patthanasettakul, V.; et al. Ultrasensitive Hydrogen Sensor Based on Pt-Decorated WO3 Nanorods Prepared by Glancing-Angle dc Magnetron Sputtering. ACS Appl. Mater. Interfaces 2014, 6, 22051–22060. [Google Scholar] [CrossRef]
  18. Wang, C.; Zhang, Y.; Sun, X.; Sun, Y.; Liu, F.; Yan, C.; Wang, X.; Sun, P.; Lu, G. Preparation of Pd/PdO loaded WO3 microspheres for H2S detection. Sens. Actuators B Chem. 2020, 321, 128629–128637. [Google Scholar] [CrossRef]
  19. Xiang, X.D.; Sun, X.; Briceño, G.; Lou, Y.; Wang, K.A.; Chang, H.; WallaceFreedman, W.G.; Chen, S.W.; Schultz, P.G. A Combinatorial Approach to Materials Discovery. Science 1995, 268, 1738–1740. [Google Scholar] [CrossRef]
  20. Frantzen, A.; Scheidtmann, J.; Frenzer, G.; Maier, W.F.; Jockel, J.; Brinz, T.; Sanders, D.; Simon, U. High-Throughput Method for the Impedance Spectroscopic Characterization of Resistive Gas Sensors†. Angew. Chem. Int. Ed. Engl. 2004, 43, 752–754. [Google Scholar] [CrossRef]
  21. Siemons, M.; Leifert, A.; Simon, U. Preparation and Gas Sensing Characteristics of Nanoparticulate p-Type Semiconducting LnFeO3 and LnCrO3 Materials†. Adv. Funct. Mater. 2007, 17, 2189–2197. [Google Scholar] [CrossRef]
  22. Wang, J.; Gao, S.; Zhang, C.; Zhang, Q.; Li, Z.; Zhang, S. A high throughput platform screening of ppb-level sensitive materials for hazardous gases. Sens. Actuators B Chem. 2018, 276, 189–203. [Google Scholar] [CrossRef]
  23. Briceño, G.; Chang, H.; Sun, X.; Schultz, P.G.; Xiang, X.D. A Class of Cobalt Oxide Magnetoresistance Materials Discovered with Combinatorial Synthesis. Science 1995, 270, 273–275. [Google Scholar] [CrossRef]
  24. Brocchini, S.; James, K.; Kohn, J.J. Non-Bonding Interaction of Neighboring Fe and Ni Single-Atom Pairs on MOF-Derived N-Doped Carbon for Enhanced CO2 Electroreduction. Am. Chem. Soc. 1997, 119, 4553–4554. [Google Scholar] [CrossRef]
  25. Baldwin, J.E.; Ciaridge, T.D.W.; Culshaw, A.J.; Heupel, F.A.; Lee, V.; Spring, D.R.; Whitehead, R.C.; Boughtflower, R.J.; Mutton, I.M.; Upton, R.J. Investigations into the Manzamine Alkaloid Biosynthetic Hypothesis. Angew. Chem. Int. Ed. Engl. 1998, 37, 2661–2663. [Google Scholar] [CrossRef]
  26. Zhang, H.; Liu, Z.; Yang, J.; Guo, W.; Zhu, L.; Zheng, W. Temperature and acidity effects on WO3 nanostructures and gas-sensing properties of WO3 nanoplates. Mater. Res. Bullet. 2014, 57, 260–267. [Google Scholar] [CrossRef]
  27. Liu, G.; Zhu, L.; Yu, Y.; Qiu, M.; Gao, H.; Chen, D.J. WO3 nanoplates for sensitive and selective detections of both acetone and NH3 gases at different operating temperatures. J. Alloy. Compd. 2021, 858, 157638–157647. [Google Scholar] [CrossRef]
  28. Li, D.; Lei, T.; Zhang, S.; Shao, X.; Xie, C. A novel headspace integrated E-nose and its application in discrimination of Chinese medical herbs. Sens. Actuators B Chem. 2015, 221, 556–563. [Google Scholar] [CrossRef]
  29. Kolmakov, A.; Klenov, D.O.; Lilach, Y.; Stemmer, S.; Moskovits, M. Enhanced Gas Sensing by Individual SnO2 Nanowires and Nanobelts Functionalized with Pd Catalyst Particles. Nano Lett. 2005, 5, 667–673. [Google Scholar] [CrossRef]
  30. Ionescu, R.; Llobet, E.; Vilanova, X.; Brezmes, J.; Sueiras, J.E.; Calderer, J.; Correig, X. Quantitative analysis of NO2 in the presence of CO using a single tungsten oxide semiconductor sensor and dynamic signal processing†. Analyst 2002, 127, 1237–1246. [Google Scholar] [CrossRef]
  31. Bai, S.; Hu, J.; Li, D.; Luo, R.; Chen, A.; Liu, C.C. Quantum-sized ZnO nanoparticles: Synthesis, characterization and sensing properties for NO2. J. Mater. Chem. 2011, 21, 12286–12294. [Google Scholar] [CrossRef]
  32. You, L.; Sun, Y.F.; Ma, J.; Guan, Y.; Sun, J.M.; Du, Y.; Lu, G.Y. Highly sensitive NO2 sensor based on square-like tungsten oxide prepared with hydrothermal treatment. Sens. Actuators B Chem. 2011, 157, 401–407. [Google Scholar] [CrossRef]
  33. Feng, S.; Farha, F.; Li, Q.; Wan, Y.; Xu, Y.; Zhang, T.; Ning, H. Review on Smart Gas Sensing Technology. Sensors 2019, 19, 3760–3781. [Google Scholar] [CrossRef] [Green Version]
  34. Lim, J.W.; Kang, D.W.; Lee, D.S.; Huh, J.S.; Lee, D.D. Heating power-controlled micro-gas sensor array. Sens. Actuators B Chem. 2001, 77, 139–144. [Google Scholar] [CrossRef]
  35. Deng, Q.; Gao, S.; Lei, T.; Ling, Y.; Zhang, S.; Xie, C. Temperature & light modulation to enhance the selectivity of Pt-modified zinc oxide gas sensor. Sens. Actuators B Chem. 2017, 247, 903–915. [Google Scholar] [CrossRef]
  36. Ricardo, G.O. Ultrasensitive and Selective Bacteria Sensors Based on Functionalized Graphene Transistors. IEEE Sens. J. 2002, 2, 189–202. [Google Scholar] [CrossRef] [Green Version]
  37. Chung, H.J.; Park, C.H.; Han, M.R.; Lee, S.; Ohn, J.H.; Kim, J.; Kim, J.; Kim, J.H. ArrayXPath II: Mapping and visualizing microarray gene-expression data with biomedical ontologies and integrated biological pathway resources using Scalable Vector Graphics. Nucleic Acids Res. 2005, 33, 621–626. [Google Scholar] [CrossRef] [Green Version]
  38. Macias, M.M.; Agudo, J.E.; Manso, A.G.; Orellana, C.J.G.; Velasco, H.M.G.; Caballero, R.G. A compact and low cost electronic nose for aroma detection. Sensors 2013, 13, 5528–5541. [Google Scholar] [CrossRef] [Green Version]
  39. Tshabalala, Z.P.; Mokoena, T.P.; Hillie, K.T.; Swart, H.C. Improved BTEX gas sensing characteristics of thermally treated TiO2 hierarchical spheres manifested by high-energy {001} crystal facets. Motaung 2021, 338, 129774–129789. [Google Scholar] [CrossRef]
  40. Wang, C.; Zhang, S.; Qiu, L.; Rasaki, S.A.; Qu, F.; Thomas, T.; Liu, M.; Yang, Y.J. Ru-decorated WO3 nanosheets for efficient xylene gas sensing application. J. Alloy. Compd. 2020, 826, 154196–154203. [Google Scholar] [CrossRef]
  41. Han, B.; Wang, H.; Yang, W.; Wang, J.; Wei, X. Hierarchical Pt-decorated In2O3 microspheres with highly enhanced isoprene sensing properties. Ceram. Int. 2021, 47, 9477–9485. [Google Scholar] [CrossRef]
Figure 1. (a) Photograph of the substrate. (b) Structure of the Pt electrode.
Chemosensors 11 00239 g001
Figure 2. Parallel synthesis of gas-sensitive films, (a) Schematic diagram, (b) Physical diagram.
Chemosensors 11 00239 g002
Figure 3. High-throughput screening of gas-sensitive films, (a) Schematic diagram, (b) Physical diagram.
Chemosensors 11 00239 g003
Figure 4. (a) XRD pattern, (b) FESEM image of the WO3 nanoplates.
Chemosensors 11 00239 g004
Figure 5. (a) Macroscopic photographs of gas-sensing films, (b) a microscopic magnification of the yellow underlined region in (a), (c) a microscopic magnification of the yellow underlined region in (b) and EDS mapping of WO3-0.5 mol% Pd film: (d) O, (e) Pd, (f) W.
Chemosensors 11 00239 g005
Figure 6. RT curves of pristine WO3 (Sensor 1) at 250 °C for 100 ppm of (a) benzene, (b) toluene, (c) xylene, and (d) formaldehyde.
Chemosensors 11 00239 g006
Figure 7. Responses (Rair/Rgas) of all sensors to 100 ppm of four gases at various temperatures: (a) benzene, (b) toluene, (c) xylene, and (d) formaldehyde.
Chemosensors 11 00239 g007
Figure 8. Response of nine gas sensors exposed to 100 ppm of four gases at different operating temperatures, (a) benzene, (b) toluene, (c) xylene, and (d) formaldehyde.
Chemosensors 11 00239 g008
Figure 9. Response and recovery time of nine gas sensors exposed to 100 ppm of four gases at 250 °C, (a) benzene, (b) toluene, (c) xylene, and (d) formaldehyde.
Chemosensors 11 00239 g009
Figure 10. (a) Selectivity of the eight sensors to 100 ppm of the tested gases, (b,c) response and recovery cycles of WO3-0.3 mol% Pd to 100 ppm of xylene at 250 °C.
Chemosensors 11 00239 g010
Figure 11. (a) PCA score plots of the array optimization sensors, (b) Fisher discriminant analysis results of all subsamples.
Chemosensors 11 00239 g011
Figure 12. Schematic of the sensing mechanism of pristine and Pd-modified WO3.
Chemosensors 11 00239 g012
Table 1. Chemical reagents and their concentrations.
ElementChemical ReagentsConcentration
(g/mL)
AuAuCl30.01
AgAgNO3
PdPdCl2
PtH2PtCl6·6H2O
RuRuCl3·3H2O
RhRhCl3·3H2O0.002
IrIrCl3
Table 2. Classification rates of FDA (groups 1–4 represent benzene, toluene, xylene, and formaldehyde, respectively).
Date of Gas
for Training
Date of Gas
for Discrimination
Classification Rates (%)
Group 1Group 2Group 3Group 4All Samples
1–25, 26–50, 51–75,76–10092.6510097.3710097.51
1–25, 26–50, 76–100,51–7597.3794.3298.7510097.61
1–25, 51–75, 76–100,26–5090.4898.8193.7510095.76
26–50, 51–75, 76–100,1–2591.6710010096.2596.98
The average classification rates93.0498.2897.4799.0696.96
Disclaimer/Publisher’s Note: The statements, opinions and data contained in all publications are solely those of the individual author(s) and contributor(s) and not of MDPI and/or the editor(s). MDPI and/or the editor(s) disclaim responsibility for any injury to people or property resulting from any ideas, methods, instructions or products referred to in the content.

