
Low-Cost, High-Sensitivity Paper-Based Bacteria Impedance Sensor Based on Vertical Flow Assay
by
 , and
, and
Yifan Long
1,
Zhehong Ai
1,2,
Longhan Zhang
1,
Han Zhang
3,
Jing Jiang
1,3,* and
Gang Logan Liu
3,* 1
Research Center for Intelligent Sensing Systems, Zhejiang Laboratory, Hangzhou 311100, China
2
Hangzhou Institute for Advanced Study, University of Chinese Academy of Sciences, Hangzhou 310024, China
3
Department of Electrical & Computer Engineering, the University of Illinois at Urbana-Champaign, Urbana, IL 61801, USA
*
Authors to whom correspondence should be addressed.
Chemosensors 2023, 11(4), 238; https://doi.org/10.3390/chemosensors11040238
Submission received: 13 February 2023
/
Revised: 14 March 2023
/
Accepted: 6 April 2023
/
Published: 11 April 2023
(This article belongs to the Special Issue Recent Developments in Wearable Sensors for Biomedical and Healthcare Applications)
Abstract
:This study proposes a low-cost, portable paper-fluidic vertical flow assay bacterium counter with high accuracy. We designed sensors with low fabrication costs based on e-beam evaporation and three-dimensional printing based on the impedance measurement principle. Interdigitated (IDT) electrodes were coated on the filter membrane by e-beam evaporation with a shadow mask. We could print wafer-scale frames with low melting temperature three-dimensional-printing materials for confining liquid bacterial samples within the IDT sensing region. This novel fabrication technique significantly reduced the chip’s cost to less than 1% of that of silicon-based chips. Two equivalent circuit models were proposed for different concentration ranges to analyze the principle of paper-based impedance bacterial sensors. We proposed an improved model based on the Randles model for low concentrations by considering the leaky double-layer capacitor effect and spherical diffusion from the nano-structural electrodes of the gold-coated filter membrane. The phenomenon in which charge transfer resistance, Rct, declines at high concentration ranges was found and explained by the pearl chain effect. The pearl effect could cause a false-negative at high concentrations. We modeled the pearl chain effect as an R and C, connected parallel to the low-concentration model. When users properly applied both models for analyses, this sensor could quantitatively measure cell concentrations from 400 to 400 M per milliliter with superior linearity.
1. Introduction
Bacteria widely exist in the natural environment. They are distributed in soil, water, and organisms, including human bodies. A healthy human body carries more than 150 types of bacteria, among which some species are harmful or even lethal. Therefore, detecting bacteria is essential for guaranteeing food safety and monitoring water quality and bacterial pollution. It is estimated that bacterial contamination accounts for 91% of the total foodborne disease incidents—which is referred to as bacterial pollution. Researchers have found thousands of foodborne pathogenic bacteria causing more than hundreds of known diseases [1]. Escherichia coli (E. coli), Salmonella, Campylobacter, Listeria monocytogenes, and Bacillus cereus are the major foodborne pathogen bacteria responsible for numerous foodborne illness outbreaks [2,3,4,5,6]. The concentration of E. coli is essential for evaluating food sanitariness and safety. Therefore, developing bacterial detection methods to detect the concentration of harmful bacteria in the food industry at various production stages is crucial.
Moreover, the quality of water resources plays a critical role in human well-being and the environment. Bacterial pollution in the aquatic environment will cause serious problems, such as dysentery, acute gastroenteritis, and bacterial food poisoning [7]. According to the standard manual of water quality detection published by Multiple Indicator Cluster Surveys (MICS) and relevant papers [8], it takes 24–48 h to detect the bacterial concentration by the traditional method of culture and colony counting. The consequences of water pollution cannot be detected in time, which is very serious or even fatal. Therefore, a method that can quickly detect bacterial pollution of water quality is essential.
Currently, researchers use several methods for the detection of bacteria. Conventional strategies include morphological evaluation, culture, and colony counting [7], ATP detection [8] by bioluminescence, DNA or protein detection [9], MALDI-TOF spectrum [10], and 16S rRNA gene sequence [11], etc. Lab specialists usually use these methods with specific equipment and reagents, involving long processing steps and periods. Therefore, there needs to be better alternatives for on-site testing. Researchers recently proposed near-infrared spectroscopy (NIRS) as a new method for bacterial detection [12]. This method can detect bacteria concentrations using infrared spectral imaging and has the benefits of species identification, quick response times, and remote detection capabilities. However, the infrared imaging equipment for NIRS is too expensive for civil applications such as food safety and medicine. A low-cost, real-time, fast-responding bacterial detection method for replacing NIRS has excellent prospects for civil applications.
Recently, researchers have developed a few biosensors that can perform on-site bacterial testing, including optical biosensors (colorimetric, fluorescence, and surface plasmon resonance (SPR) sensors [13,14]), mechanical biosensors (quartz crystal microbalance [15]), and electrochemical biosensors. Electrochemical biosensors can test bacteria without sample pretreatment and are applicable candidates for quick on-site bacterial detections [16,17]. Furthermore, electrochemical impedance spectroscopy (EIS) methods have attracted some interest because they can show the electronic and physical properties of the detecting system [18]. Researchers have started using an impedance method with two bulk electrodes to detect bacterial growth in media and built an equivalent circuit model for analyzing the results [19,20]. More recently, researchers have applied an IDT array microelectrode for the benefits of the rapid attainment of steady states, high signal-to-noise ratios, and small sample volumes [21]. Improved microfabrication techniques and numerous analytical methods—such as SPR, fluorescence, and EIS—have been integrated with microfluidic devices to further increase the sensitivity of bacterial detection by confining a few live bacterial cells into a small volume [22,23,24]. However, sensors developed based on the microfluidics techniques mentioned above face the high processing cost of microfluidic components. As a new alternative bio-sensing paradigm, paper-based microfluidics sensing devices have been developed since 2007 [25] and are widely used for electrochemical sensing [26,27,28] and electronic biosensing [26,27,28,29]. Paper-based microfluidic techniques have attracted attention as a more practical microfluidics system due to their advantages of low cost and simple fabrication requirements [29,30].
In this work, an improved portable paper-based bacteria sensor for fast and cheap bacteria detection was developed based on our former work of smartphone-based bacteria sensors [31]. Three major improvements were achieved in this work: (1) The manufacturing cost of our new sensors is less than 1% of the previous silicon-based bacterial pre-concentrating microfluidics sensors. This cost reduction significantly empowers the application in scenarios that require high portability and low costs, such as water quality detection. (2) We achieved a wider detection range and a lower detection limit than the previous sensors. (3) Two improved models are proposed for sensor data analysis for the high-concentration and low-concentration scenarios to achieve a higher accuracy of readout interpretation. With the potential to combine with mature wireless smartphone impedance platforms in our early studies [31,32,33], this paper-based sensor will be a promising candidate for inexpensive, ultra-sensitive bedside bacteria detections.
2. Methods and Materials
Our former smartphone-based sensor suffers from the drawback of the expensive silicon-based sensing unit [31]. In this research, we designed and developed a method to produce low-cost paper-based bacterial sensing units on a wafer scale. The proposed sensor costs only one percent of the previously designed silicon-based microfluidic bacterial sensors [31] but retains a lower detection limit and broader detection range. The detailed design, fabrication, and testing process are described as follows.
2.1. Design
Figure 1a shows the schematic of the vertical flow assay sensor. The sensor’s structure consisted of an active sensing layer (Figure 1a-②), two confining layers (Figure 1a-①), a supporting layer (Figure 1a-③), and an absorbing layer (Figure 1a-④). The active sensing layer was composed of a filter membrane coated with IDT electrodes. We chose IDT electrodes because they can enhance the signal-to-noise ratio by increasing the area of the electrodes and allowing the sample solution to quickly soak through the paper [34]. The IDT electrode region would be where the sensing measurement would be conducted, i.e., the active sensing region. The confining layers were designed to melt through the filter membrane and limit the bacterial liquid flow within this active sensing region. The supporting layer was 3D-printed with a grid structure to support the membrane of the active sensing layer so that it would allow a smooth flow of the liquid through the supporting layer to the absorbing layer. The absorbing layer was a thin sponge layer designed to quickly absorb the excess solvent liquid that flowed through the filter membrane.
In one detection process, the sample solution would be dropped onto the top of the active sensing layer and flow through the membrane. The membrane with tiny pores would filter and keep the bacteria in the membrane between the IDT electrodes, and the solvent will flow through the membrane and be absorbed by the absorbing layer. Figure 1b illustrates a zoom-in picture of the sensor, showing E. coli on the filter with electrodes. The bacteria would change the impedance between the IDT gold electrodes. Then, the impedance measurement would be carried out to determine the concentration of the collected bacteria, which will be described in the Impedance Measurement Section. In our layered design of the paper-based microfluidics sensor, the bacterial solution can be pre-concentrated within the active sensing region. The pre-concentration ratio in this step depends on the active sensing region’s saturation volume, and the sample solution’s volume dropped onto the membrane. By increasing the pre-concentration ratio of the bacteria solution, we could lower the detection limit, since the collected bacteria on the filter membrane would increase. In our experiments, the saturation volume of the active sensing region was 15 µL, and we dropped 50 µL of sample solution for detection.
2.2. Sensor Fabrication
We developed a new four-staged manufacturing technique for the designed paper-based microfluidics sensors. The method achieved wafer-scale fabrication of multiple sensor units in one batch at a low cost. The cost per unit for the sensors was lowered to just US 60 cents, which accounts for the facility charge at MRL at the UIUC and the cost of the filter membrane. In stage one, the wafer-scale layer structures were prepared separately. The active sensing layer was fabricated by coating IDT gold electrodes using a shadow mask onto a filter membrane (EMD Millipore Corp., Durapore® Membrane Filter, 5 µm pore size), as illustrated in Figure 2d. The coating method will be described in detail in the next paragraph. For the confining layers, a low-melting temperature 3D-printing filament called Emate (melting temperature of 80 °C, Esun Industrial Co., Ltd. Shenzhen city, China) was used to print thin layers of a square array (Figure S1b). For the supporting layer, we 3D-printed the grid structure with polylactic acid (PLA) material (HATCHBOX, 1.75 mm PLA). In the second stage, the structures were stacked and aligned in the order of one Emate confining layer, one active sensing layer, another Emate confining layer, and a supporting layer, as illustrated in Figure 1c. We also designed four aligning extrusions on the supporting layer (the red parts in Figure 1c) and the confining layers to quickly align the structures. In the third stage, we baked the stacked layers setup in an oven at 90 °C for two hours so that the Emate confining layers would melt through the filter membrane in the active sensing layer. The melted Emate frame would confine the testing solution within the active sensing region. In the last stage, the baked layers mentioned above would be stacked over one sponge sheet as the absorbing layer to assemble the sensor. Figure 1d demonstrates the sensor’s portable proof-of-concept setup. The right part of Figure S7 shows that a unit of the sensor layer was comparable to the size of a US quarter coin.
To prepare the active sensing layer, we developed a low-cost fabrication process to coat the IDT gold electrodes onto the paper-based filter membrane. Figure 2a shows the conceptual diagram of the fabrication process, where high-energy electron beams bombarded the gold target in a vacuum chamber. First, an Epilog Mini 24 Laser Engraver was used to cut an acrylic board with the IDT patterns to obtain the shadow mask (Figure 2b). Then, we attached the selected filters to the shadow mask and loaded them into the Temescal six-pocket E-beam evaporator, where up to 12 4-inch-sized samples could be loaded in a batch. Next, we evaporated gold atoms into the masked filter membrane to pattern the exposed area with the gold electrodes. Figure 2b shows the actual shadow mask used in the experiment, and Figure 2d shows the filter membrane after gold deposition, which shows that each piece of filter membrane could contain 20 units of sensors. The filter membrane of PDVF is dense and can withstand 150 °C temperatures. Hence, the stability of this material makes e-beam evaporation feasible in our fabrication process. To examine the microstructure of the gold-coated paper electrodes, we sputtered a thin layer of gold on the exposed PVDF and the golden IDT electrode part simultaneously, then used scanning electron microscopy (SEM) to capture the sensor image. Figure 2c shows the SEM image of the sensor, where the right half shows the original polyvinylidene fluoride (PVDF) filter membrane, and the left half is the IDT electrode area that was coated with gold. We could observe that the filter’s structure was sustained after the gold deposition.
The shadow mask preparation is very flexible and affordable. We can conveniently tune the shape of the electrodes. Additionally, this fabrication is a one-step and low-cost process. Two hundred and forty sensor units can be fabricated on twelve pieces of a four-inch shadow mask in one batch. The sensing membrane can be rapidly produced in batches. For each test, only one sensor unit will be used. In addition, this process does not require photolithography or photo-resistance. Traditional lithography methods have difficulty patterning electrodes on the filters because fully developed photo-resistance in the fiber’s structure is almost impossible. Therefore, the shadow mask method we developed could significantly reduce fabrication costs and complexities.
2.3. Impedance Measurement
In the sensor detecting measurements, the bacteria sample solutions to be measured were first prepared with a DH5a E. coli sample (all bacteria were provided by Carl R. Woese Institute for Genomic Biology at the University of Illinois at Urbana-Champaign; cultivated with fermentation medium; each liter of medium contained K2HPO4 (7.5 g), citric acid monohydrate (2.1 g), ammonium iron citrate (0.3 g), and concentrated H2SO4 (1.2 mL)) and deionized (DI) water from the Milli Q Advantage Water Purification System. We used the DH5a strain in this work and conducted the study in a level one biosafety level (BSL) environment. The stock solution’s E. coli concentration was . We first centrifuged the E. coli stock solution with deionized (DI) water, twice. The centrifuged E. coli stock solution was diluted with DI water to 400–400M cells per milliliter concentration for testing. Generally, phosphate-buffered saline (PBS) is used as the solvent. However, our primary goal was to develop a household biosensor for people’s daily food quality testing, and thus the solvent should be easier to acquire. Therefore, we selected DI water as our choice of solvent since it is similar to drinking water. According to our previous microscope testing, the bacteria also remained intact after diluting in the DI water [31]. The bacteria concentrations were verified from the measurement with a hemocytometer (Hausser Scientific™ 3900, Hausser Scientific, Horsham, PA, USA).
After preparing samples, we dropped the bacterial solution to be detected through the top of the fabricated sensing layer when measuring. We sequentially dropped 50 µL of each prepared E. coli solution and DI water into the sensor in increasing concentrations. The absorbent pad absorbed the solvent, and the bacteria were filtered and kept on the active sensing membrane. The bacteria on the membrane then changed the impedance between the IDT gold electrodes. A commercial LCR meter (Agilent 4284A) was used to measure the frequency response of the IDT gold electrodes. The LCR meter and electrodes were connected with a pair of flat-end copper clippers. We tested the bacterial impedance by sweeping the sinusoidal frequency from 30 Hz to 1 MHz with a geometric sequence of 1.1. The Nyquist plot obtained from this impedance measurement was then used to derive the bacterial concentrations, which will be discussed in the Results and Discussion Section.
Note that our paper-based electrode sensing unit was designed to be a cheap, one-time replaceable part for our former smartphone bacteria sensor [31]. A portable impedance readout device based on the smartphone has already been developed and extensively tested in our previous work. In this research, we mainly focused on the manufacturing and performance testing of the new paper-based sensing unit, so the standard LCR meter with high precision, yet not portable, was used as our choice of readout device. We can easily transfer to the portable readout device we built at no extra cost.
3. Result and Discussion
3.1. Concentration Derivation
After the Nyquist plot was collected from the impedance measurement, a circuit model needed to be developed to reversely derive the bacteria concentrations. The accuracy of the concentration readout significantly depends on this circuit model. Typically, the Randles model’s equivalent circuit is widely used in electrochemical impedance biosensors for sensing bacteria (Figure 3a). In this equivalent circuit, Rct denotes the charge transfer resistance, Cd denotes double-layer capacitance, RΩ denotes the ohmic resistance of the electrolyte, and Zw denotes the Warburg impedance. Researchers commonly model Zw for the diffusion phenomena at low frequencies, showing a linear curve at a 45° angle in the Nyquist plot.
In the Randles model, the Rct describes the resistance of charge transfer on the electrode surface. Since there is no redox reaction in the system, theoretically, the Rct in the Randles model should be removed in our case. However, even though we used DI water as the solvent, there were still a small number of ions in the water. Furthermore, although the bacteria are not conductors, they will carry charges on the surface. The charge transfer on the electrode surface is still possible. Therefore, the Rct of the Randles model was retained when fitting the experimental data.
Figure S2a shows the Nyquist plot, measuring bacterial impedance in red points. The fitting data of the impedance measurement based on the Randles model are plotted with green dots. We observed that the low-frequency region significantly differed between measurement and fitting data. At low frequencies, the process of sensing bacteria is mass-transfer-controlled, while at high frequencies, bacterial sensing is controlled by kinetics [35]. The mass-transfer-controlled region in Figure S2a approximates a linear part, representing the diffusion-limited process. In the kinetics-controlled region, the diameter of the semicircle on the Nyquist plot indicates electron transfer resistance, Rct, according to the literature [35,36,37]. Therefore, an improvement needed to be applied to the original Randles model in our case.
3.2. Low-Concentration Circuit Modeling for a Paper-Based Impedance Sensor
It is crucial to build a proper model of the equivalent circuit of the paper-based sensor to accurately analyze the concentration of bacteria based on impedance measurements. Due to significant deviations between the measurement and the Randles model’s (Figure S2a) data fitting, as mentioned in the previous section, an improved model (for low concentration) was proposed here for data fitting (Figure 3b), achieving a much better fit with the measurement data in low-frequency regions.
Nitrocellulose (NC) membrane testing with DI water was used to study whether the improved model worked effectively with our sensor. We used a nitrocellulose filter membrane in this study because its impedance spectroscopy displays regions of both the semicircle and linear part (red dots in Figure S2a). The fitting result (green dots in Figure S2a) demonstrates that in the high-frequency (semicircle) region (left part), the Randles model fits well with the measurement data. In contrast, the measurement dataset has a curvature at low frequencies in the right part. At the same time, the calculated data exhibit linear behavior, which is contributed by the linear portion of the Randles model.
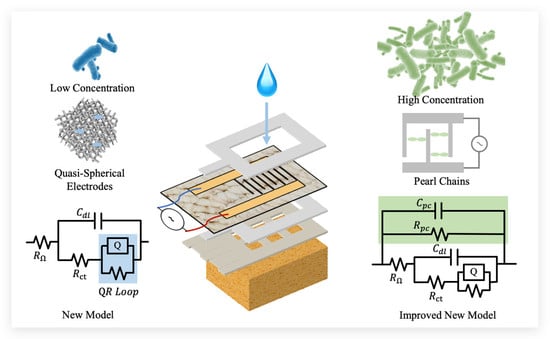
Considering the differences between the experimental conditions and the assumptions of the Randles model, we tried to fit the testing data with various models. As shown in Figure 3b, an “improved equivalent circuit model” was designed, where we replaced Zw with a QR loop and replaced Cd with Qd. Q is a constant phase element (CPE), as defined by the following formula:
where ω is frequency, and Q0 and n (0 < n < 1) are frequency-independent. Q0 equals its admittance magnitude at:
Researchers use Q to model an imperfect capacitor, “n” in Formula (1) denotes the quality of dielectrics, and an ideal capacitor has 1 for “n” while a pure resistor has 0 for “n” [38].
Usually, the surface roughness of capacitance is not considered in the Randles model. Our sensor used a paper-based evaporated electrode. According to Figure 2c, the surface of the electrode was rough and porous. Physically, CPE describes the extent to which the capacitance deviates from the ideal capacitance. We consider using CPE to have a better fitting result and describe the scenario more appropriately. The Randles model contains Warburg impedance, Zw, which means that the capacitor near the electrode’s surface is considered an ideal planar capacitance. When bacterial sensors are IDT electrodes on rigid substrates, the electrode’s surfaces are smooth and flat, so the Randles model accurately matched the measurement. Bacterial testing showed a 45° straight line in the low-frequency range. However, in paper-based IDT electrodes, a high error was observed between the Randles model’s fitting and the measurement data in the low-frequency range. It was caused by the porous microstructure of the paper-based IDT surface with nanometer-scale meshes (Figure 2c), producing spheric diffusion. The rough surface of paper-based IDT was no longer equivalent to an ideal capacitor’s surface. Hence, we replaced the capacitance of the Warburg impedance with the CPE Qd. The physical meaning of CPE is exactly the roughness of the capacitor’s surface.
The reason why the calculated data with the improved model fit the measurement much better (Figure S2b) in the low-frequency region was due to two modifications. (1) We used CPE to replace the ideal double-layer capacitor because our filter-based double-layer capacitance was “leaky”. We improved the fit of the semicircle region by replacing the circuit model with a CPE. Since “n”, when extracted from the fitting model, was close to 1 (from 0.949 to 0.977), the capacitor did not severely leak. (2) We replaced the Warburg impedance with a QR loop because the Warburg impedance models a planar electrode’s diffusion process. However, as shown in Figure 2c, we observed that electrodes on the filter membrane are similar to a network of tiny, connected wires. Those wires had curved interfaces with the solution where Warburg impedances were not applicable. According to “Semiconductors and Mott-Schottky Plots” [39], the impedance in a Nyquist plot is closer to an ellipse shape as the radius of circular electrodes becomes smaller (Figure S2c). This means if the surface of the electrode became more irregular or less like an ideal surface, the low-frequency region would be characterized by a greater deviation from curve a in Figure S2c, which represents the ideal planar capacitance. Thus, in the improved model, the Warburg impedance was replaced with a QR loop, which generated an elliptical shape on the Nyquist plot.
With this improved model, we fit the measured impedance, as Figure S2b shows. Additionally, we fit the measured data of different concentrations and extracted each Rct from the fitting curves. In Figure 3c, we plot Rct relative to the concentration, and a linear relationship was achieved in a semi-log scale. The error values for both the intercept and slope of the fitting line are also presented in Figure 3c. The formula is described as follows.
Thus, the concentration “c” can be ascertained via the following experimental equation:
In order to compare the performance of our improved model and the Randles model, we also fit our measurement data with the Randles model, extracted Rct, and plotted another fitting line in Figure 3c. All the measurement result and fitting data of the improved model compared with the Randles model is shown in Figure S5. As Figure 3c shows, the line extracted from the Randles model (purple) is higher than the line from our improved model (black). In Figure S5, our model’s curve fitting demonstrated a superior fit to the measured data compared to the Randles model, thereby indicating that the extracted Rct from our model is more accurate and closer to the actual value (the data acquired through the Randles model may be skewed towards higher values).
On the fitting curve of the impedance response, we can find the highest point on the semicircle part. We call the imaginary part value of the highest point Rpeak. R2 is 0.9992. We expected Rct to be double that of the Rpeak theoretically, which can be verified by comparing Figure 3d.
The improved model was used to fit the Nyquist plot of the bacterial impedance measurements from DI to 4 M cells per milliliter (Figure 3d), and the fitting curve provided experimental data with a good R2. According to the experiment results in Figure 3c, the bacterial concentrations and Rct had an excellent linear relationship.
3.3. High-Concentration Circuit Modeling for a Paper-Based Impedance Sensor
The linear relationship between Rpeak and bacterial concentrations was not sustained (Figure S3a,b) for concentrations higher than 40 M/mL. To address this problem, we proposed an explanation and developed a “high-concentration model” (Figure 4a) to fit the data for more concentrated bacterial testing (Figure 4b).
With further studies and analyses, the Rct decreased as the concentrations increased at high concentrations. The Rct concentration curve increased at low concentrations, and a peak appeared after reaching a specific concentration. Then, the curve started to decline. The peak of Rct means that the response of bio-sensor assays may produce a false-negative result with specific immunoassays due to a very high concentration of a particular analyte. This could also occur in electrical bio-impedance measurements. When we attempted to fit the data with the improved model, the data did not exhibit a good fit (Figure S4a). Therefore, we believed that a different mechanism was involved in the high-concentration measurement for the observed phenomena.
When we measured bacteria on a glass slide coated with IDT electrodes, the bacteria formed lines at high concentrations (Figure 4a). E. coli is not conductive, but the isoelectric point of E. coli is about pH 5.6. In DI water, which is pH 7, the surface of E. coli carries negative charges. When an alternating current (AC) electrical field was applied, cells tended to form lines due to the dielectrophoretic effect. As Figure S4b shows, this phenomenon is called the pearl chain effect [20,32,38]. The bacterial line could produce a current path across the electrodes, decreasing the overall impedance. Each chain can be modeled as a resistor and a capacitor connected in parallel, as shown in Figure 4c [40].
According to the above experiment results and reasoning, we proposed a new improved model for high bacterial concentrations in Figure 4a, where a parallel-connected Rpc-Cpc (pc means pearl chain) was added to the improved model. The fitting data and measurements in the high concentration range agreed (Figure S6). Figure 4b shows the measurement results for 40 M and 400 M cells per milliliter. Moreover, we extracted Rpc from the fitting parameters, as shown. From Figure 4d, we can observe that Rpc decreased when the concentration of bacteria increased. This observation is reasonable because forming more chains is equivalent to connecting more resistors in parallel.
3.4. Paper-Based Impedance Sensor Application
To calculate the concentration of an unknown E. coli sample solution, if we only use Rpeak (Figure S3a) to interpret the concentration, it could be ambiguous because Rpeak decreases at high concentrations. In this research study, we proposed two methods to solve this problem. The first method measured the impedance of the target solution and the serially diluted target solutions. If the Rpeak of the diluted solution becomes higher in the Nyquist diagram, we can infer that the testing target is within the high-concentration range. Otherwise, the sample is within the low-concentration range. The second method was fitting the measurement data directly with the improved model (low-concentration model). The sample would belong to low concentrations if the result achieved a good fit. Otherwise, it belongs to high-concentration ranges. After we know the correct concentration range of the testing target, researchers could calculate the sample’s concentration from the calibration dataset.
Based on this research study, we could develop a new portable bacterial sensor for detecting multiple bacterial species. We could further expand the sensing capability by vertically stacking various sensor layers of different pore sizes of filter membranes together. Each filter layer can block bacteria with the corresponding sizes. The component concentration of every type of bacteria in the mixed bacterial solution can be individually measured. In this manner, our proposed sensor could work with smartphones via Bluetooth-based multiplex impedance-sensing circuitry to realize quick deployment and timely detections for testing multiple bacterial species.
4. Conclusions
This study developed a portable, low-cost, paper-based impedance bacterial sensor to determine E. coli concentrations with a lower limit of detection (LOD) of 400 cells/mL. Moreover, we expanded the dynamic range covering 400 cells/mL to 400 M cells/mL. According to the Centers for Disease Control and Prevention (CDC) and European Union (EU) drinking water standards (500 CFU/mL and 100 CFU/mL), we considered that the current 400 cells/mL LOD could already meet the water quality detection usage. For test scenarios requiring a lower LOD, with the function of pre-concentration of our sensor [31], we could test samples with lower concentrations by adding more sample solution. We developed equivalent circuit models for low- and high-concentration ranges, explaining the filter-based impedance paper and the phenomenon where Rpeak decreased at high concentrations. The appropriate equivalent circuit model can be determined after identifying the concentration range with our proposed serial diluting testing method. Moreover, a new fabrication method for the paper-based microfluidic sensor was proposed in this study. This fabrication method lowered the cost per unit to only US 60 cents per sensor based on the facility charge of MRL at the UIUC and the filter membrane’s cost.
As for future work, a significant target would be developing parallel detection for different bacteria and increasing the selectivity for our bacteria sensors. First, the membrane’s pore size can be tuned to retain the bacteria of a specific size on the filter with electrodes. Other particles will flow through. Second, with multiple layers of different filter pore sizes stacked together, the sensor can detect the concentration of multiple sizes of bacteria in each layer, simultaneously. Furthermore, the antibody could be integrated into the electrodes of the sensor to permit the acquisition of specific detection capabilities. These further improvements of paper-based sensing layers would enable low-cost, in situ, ultra-sensitive multi-bacterial detections using a wireless smartphone platform and the software application.
Supplementary Materials
The following supporting information can be downloaded at: https://www.mdpi.com/article/10.3390/chemosensors11040238/s1. Figure S1. (a) 3D-printed wafer-scale PLA holder. (b) 3D-printed wafer-scale Emate material with low melting temperature. Figure S2. (a) Measurement data (red) and fitted data (green) with Randles model of the DI water impedance measurement on the NC membrane. (b) This figure shows the measurement data in (a) fitted with the "improved model" for low concentrations. (c) Nyquist plot of electrodes of different radii, where curve a is a planar electrode and e is a circular electrode with the smallest radius [1]. Figure S3. (a) The peak of the semicircle part of the impedance measurement of DI water, 40–400 M cells per milliliter. (b) The Nyquist plot of DI water, 40–400 M cells per milliliter. Figure S4. (a) Fitting (green) the measured data (red) of 40 M/mL (red) with the improved model for low concentrations. (b) The pearl chain effect of bacteria cells between the two IDT electrodes. Figure S5. Fitting (green) the measured data (red) of DI water, 400, 4,000, 40,000, 400,000, and 4M, cells/mL, with the improved model for low concentrations and the Randles model. Figure S6. Fitting (green) the measured data (red) of (a) 40 M and (b) 400 M cells/mL (red) with the high-concentration model. Figure S7. (left) The demonstration of the actual image of the sensor during testing, and (right) the comparison of the sensor layer and a US quarter dollar. Figure S8. (a) The Nyquist plot of measurement data for E. coli in urine. (b) The zoom-in image of the experiment data in Figure S8a. Figure S9. (a) Nyquist plot of measurement data for yeast samples. (b) Extracted charge transfer resistance (Rct) decreased as the yeast concentration increased.
Author Contributions
Conceptualization, J.J. and G.L.L.; methodology, J.J. and G.L.L.; software, H.Z.; validation, H.Z.; formal analysis, Y.L. and J.J.; investigation, Z.A. and J.J.; resources, H.Z.; data curation, Y.L. and L.Z.; writing—original draft, J.J.; writing—review and editing, Y.L., Z.A., and G.L.L.; visualization, L.Z.; supervision, G.L.L.; project administration, G.L.L.; funding acquisition, G.L.L. All authors have read and agreed to the published version of the manuscript.
Funding
The work was supported by the Center-initiated Research Project of Zhejiang Lab (No. 113015-AL2202; Founder: Zhejiang Lab, China, Hangzhou city).
Institutional Review Board Statement
Not applicable.
Informed Consent Statement
Not applicable.
Data Availability Statement
Data available on request due to privacy.
Conflicts of Interest
The authors declare no conflict of interest.
References
- Altekruse, S.; Cohen, M.; Swerdlow, D. Emerging foodborne diseases. Emerg. Infect. Dis. 1997, 3, 285. [Google Scholar] [CrossRef] [PubMed]
- Gould, L.H.; Mody, R.K.; Ong, K.L. Increased recognition of non-O157 Shiga toxin–producing Escherichia coli infections in the United States during 2000–2010: Epidemiologic features and comparison with E. coli O157 infections. Foodborne Pathog. Dis. 2013, 10, 453–460. [Google Scholar] [CrossRef] [PubMed]
- Kurtz, J.R.; Goggins, J.A.; McLachlan, J.B. Salmonella infection: Interplay between the bacteria and host immune system. Immunol. Lett. 2017, 190, 42–50. [Google Scholar] [CrossRef] [PubMed]
- Wang, Y.; Ye, Z.; Ying, Y. New trends in impedimetric biosensors for the detection of foodborne pathogenic bacteria. Sensors 2012, 12, 3449–3471. [Google Scholar] [CrossRef] [PubMed] [Green Version]
- Gandhi, M.; Chikindas, M.L. Listeria: A foodborne pathogen that knows how to survive. Int. J. Food Microbiol. 2007, 113, 1–15. [Google Scholar] [CrossRef]
- Murphy, C.; Carroll, C.; Jordan, K. Environmental survival mechanisms of the foodborne pathogen Campylobacter jejuni. J. Appl. Microbiol. 2006, 100, 623–632. [Google Scholar] [CrossRef]
- Wang, Y.; Salazar, J.K. Culture-independent rapid detection methods for bacterial pathogens and toxins in food matrices. Compr. Rev. Food Sci. Food Saf. 2016, 15, 183–205. [Google Scholar] [CrossRef]
- Turner, D.E.; Daugherity, E.K.; Altier, C.; Maurer, K.J. Efficacy and limitations of an ATP-based monitoring system. J. Am. Assoc. Lab. Anim. Sci. 2010, 49, 190–195. [Google Scholar]
- Holben, W.E.; Jansson, J.K.; Chelm, B.K.; Tiedje, J.M. DNA probe method for the detection of specific microorganisms in the soil bacterial community. Appl. Environ. Microbiol. 1988, 54, 703–711. [Google Scholar] [CrossRef] [Green Version]
- Singhal, N.; Kumar, M.; Kanaujia, P.K.; Virdi, J.S. MALDI-TOF mass spectrometry: An emerging technology for microbial identification and diagnosis. Front. Microbiol. 2015, 6, 791. [Google Scholar] [CrossRef] [Green Version]
- Clarridge, J.E., III. Impact of 16S rRNA gene sequence analysis for identification of bacteria on clinical microbiology and infectious diseases. Clin. Microbiol. Rev. 2004, 17, 840–862. [Google Scholar] [CrossRef] [PubMed] [Green Version]
- Rodriguez-Saona, L.; Khambaty, F.; Fry, F.; Calvey, E. Rapid detection and identification of bacterial strains by Fourier transform near-infrared spectroscopy. J. Agric. Food Chem. 2001, 49, 574–579. [Google Scholar] [CrossRef] [PubMed]
- Jayan, H.; Pu, H.; Sun, D.-W. Recent development in rapid detection techniques for microorganism activities in food matrices using bio-recognition: A review. Trends Food Sci. Technol. 2020, 95, 233–246. [Google Scholar] [CrossRef]
- Wang, K.; Sun, D.-W.; Wei, Q.; Pu, H. Quantification and visualization of α-tocopherol in oil-in-water emulsion based delivery systems by Raman microspectroscopy. Lwt 2018, 96, 66–74. [Google Scholar] [CrossRef]
- Yu, X.; Chen, F.; Wang, R.; Li, Y. Whole-bacterium SELEX of DNA aptamers for rapid detection of E. coli O157: H7 using a QCM sensor. J. Biotechnol. 2018, 266, 39–49. [Google Scholar] [CrossRef]
- Jiang, H.; Sun, Z.; Guo, Q.; Weng, X. Microfluidic thread-based electrochemical aptasensor for rapid detection of Vibrio parahaemolyticus. Biosens. Bioelectron. 2021, 182, 113191. [Google Scholar] [CrossRef]
- Hou, Y.; Tang, W.; Qi, W.; Guo, X.; Lin, J. An ultrasensitive biosensor for fast detection of Salmonella using 3D magnetic grid separation and urease catalysis. Biosens. Bioelectron. 2020, 157, 112160. [Google Scholar] [CrossRef]
- Chiriacò, M.S.; Parlangeli, I.; Sirsi, F.; Poltronieri, P.; Primiceri, E. Impedance sensing platform for detection of the food pathogen listeria monocytogenes. Electronics 2018, 7, 347. [Google Scholar] [CrossRef] [Green Version]
- Felice, C.; Valentinuzzi, M. Medium and interface components in impedance microbiology. IEEE Trans. Biomed. Eng. 1999, 46, 1483–1487. [Google Scholar] [CrossRef]
- Grossi, M.; Lazzarini, R.; Lanzoni, M.; Pompei, A.; Matteuzzi, D.; Riccò, B. A portable sensor with disposable electrodes for water bacterial quality assessment. IEEE Sens. J. 2013, 13, 1775–1782. [Google Scholar] [CrossRef]
- Radke, S.M.; Alocilja, E.C. Design and fabrication of a micro impedance biosensor for bacterial detection. IEEE Sens. J. 2004, 4, 434–440. [Google Scholar] [CrossRef]
- Varshney, M.; Li, Y. Interdigitated array microelectrodes based impedance biosensors for detection of bacterial cells. Biosens. Bioelectron. 2009, 24, 2951–2960. [Google Scholar] [CrossRef] [PubMed]
- Yang, L.; Li, Y.; Erf, G.F. Interdigitated array microelectrode-based electrochemical impedance immunosensor for detection of Escherichia coli O157: H7. Anal. Chem. 2004, 76, 1107–1113. [Google Scholar] [CrossRef] [PubMed]
- Ehret, R.; Baumann, W.; Brischwein, M.; Schwinde, A.; Stegbauer, K.; Wolf, B. Monitoring of cellular behaviour by impedance measurements on interdigitated electrode structures. Biosens. Bioelectron. 1997, 12, 29–41. [Google Scholar] [CrossRef]
- Verma, N.; Tiwari, B.S.; Pandya, A. Field deployable vertical flow based immunodevice for detection of Potato virus Y in potato leaves. ACS Agric. Sci. Technol. 2021, 1, 558–565. [Google Scholar] [CrossRef]
- Määttänen, A.; Vanamo, U.; Ihalainen, P.; Pulkkinen, P.; Tenhu, H.; Bobacka, J.; Peltonen, J. A low-cost paper-based inkjet-printed platform for electrochemical analyses. Sens. Actuators B: Chem. 2013, 177, 153–162. [Google Scholar] [CrossRef]
- Nie, Z.; Nijhuis, C.A.; Gong, J.; Chen, X.; Kumachev, A.; Martinez, A.W.; Narovlyansky, M.; Whitesides, G.M. Electrochemical sensing in paper-based microfluidic devices. Lab A Chip 2010, 10, 477–483. [Google Scholar] [CrossRef] [Green Version]
- Verma, N.V.; Tiwari, B.S.; Pandya, A. Paper disc interfaced Prussian blue nanocube modified immunodevice for electrochemical detection of diverse biomarker at point of care. Bioelectrochemistry 2023, 150, 108346. [Google Scholar] [CrossRef]
- Luo, K.; Ryu, J.; Seol, I.-H.; Jeong, K.-B.; You, S.-M.; Kim, Y.-R. based radial chromatographic immunoassay for the detection of pathogenic bacteria in milk. ACS Appl. Mater. Interfaces 2019, 11, 46472–46478. [Google Scholar] [CrossRef]
- Choopara, I.; Suea-Ngam, A.; Teethaisong, Y.; Howes, P.D.; Schmelcher, M.; Leelahavanichkul, A.; Thunyaharn, S.; Wongsawaeng, D.; DeMello, A.J.; Dean, D.; et al. Fluorometric Paper-Based, Loop-Mediated Isothermal Amplification Devices for Quantitative Point-of-Care Detection of Methicillin-Resistant Staphylococcus aureus (MRSA). ACS Sens. 2021, 6, 742–751. [Google Scholar] [CrossRef]
- Jiang, J.; Wang, X.; Chao, R.; Ren, Y.; Hu, C.; Xu, Z.; Liu, G.L. Smartphone based portable bacteria pre-concentrating microfluidic sensor and impedance sensing system. Sens. Actuators B Chem. 2014, 193, 653–659. [Google Scholar] [CrossRef]
- Zhang, D.; Jiang, J.; Chen, J.; Zhang, Q.; Lu, Y.; Yao, Y.; Li, S.; Liu, G.L.; Liu, Q. Smartphone-based portable biosensing system using impedance measurement with printed electrodes for 2, 4, 6-trinitrotoluene (TNT) detection. Biosens. Bioelectron. 2015, 70, 81–88. [Google Scholar] [CrossRef] [PubMed]
- Zhang, D.; Lu, Y.; Zhang, Q.; Liu, L.; Li, S.; Yao, Y.; Jiang, J.; Liu, G.L.; Liu, Q. Protein detecting with smartphone-controlled electrochemical impedance spectroscopy for point-of-care applications. Sens. Actuators B: Chem. 2016, 222, 994–1002. [Google Scholar] [CrossRef]
- Güder, F.; Ainla, A.; Redston, J.; Mosadegh, B.; Glavan, A.; Martin, T.J.; Whitesides, G.M. Paper-based electrical respiration sensor. Angew. Chem. Int. Ed. 2016, 55, 5727–5732. [Google Scholar] [CrossRef] [Green Version]
- Yang, L.; Bashir, R. Electrical/electrochemical impedance for rapid detection of foodborne pathogenic bacteria. Biotechnol. Adv. 2008, 26, 135–150. [Google Scholar] [CrossRef]
- Daniels, J.S.; Pourmand, N. Label-free impedance biosensors: Opportunities and challenges. Electroanal. Int. J. Devoted Fundam. Pract. Asp. Electroanal. 2007, 19, 1239–1257. [Google Scholar] [CrossRef] [PubMed]
- Lisdat, F.; Schäfer, D. The use of electrochemical impedance spectroscopy for biosensing. Anal. Bioanal. Chem. 2008, 391, 1555–1567. [Google Scholar] [CrossRef] [PubMed]
- Kochowski, S.; Nitsch, K. Description of the frequency behaviour of metal–SiO2–GaAs structure characteristics by electrical equivalent circuit with constant phase element. Thin Solid Film. 2002, 415, 133–137. [Google Scholar] [CrossRef]
- Lasia, A. Semiconductors and Mott-Schottky Plots. In Electrochemical Impedance Spectroscopy and Its Applications; Springer: Berlin/Heidelberg, Germany, 2014; pp. 251–255. [Google Scholar]
- Suehiro, J.; Yatsunami, R.; Hamada, R.; Hara, M. Quantitative estimation of biological cell concentration suspended in aqueous medium by using dielectrophoretic impedance measurement method. J. Phys. D Appl. Phys. 1999, 32, 2814. [Google Scholar] [CrossRef]
Figure 1.
(a) The configuration of a sensor, where ① is the 3D-printed Emate confining layer, ② is the active sensing layer of the PVDF filter patterned with a pair of IDT gold electrodes, ③ is the 3D-printed PLA supporting layer, and ④ is an absorbing layer. (b) A zoom-in picture of the sensor showing E. coli on the electrode-coated filter. (c) The schematic shows the wafer-scale stacking configuration of Emate(①)-filter(②)-Emate(①)-PLA(③), which was aligned with four extruding corners (in red). We stacked, baked, and cut the materials to make our sensor. (d) Test scene of the sensing membrane attached on a slide (75 mm × 25 mm). The comparison of the sensor and a US quarter can be found in Figure S7. The scale bar is 10 mm.

Figure 2.
(a) Illustration of the e-beam evaporation process with a shadow mask: the top layer is the shadow mask, and the bottom layer is the filter membrane. (b) The acrylic shadow mask after gold deposition. The scale bar is 10 mm. (c) SEM picture of the PVDF filter membrane at the edge of one finger: the left half is on the IDT finger, and the right half is on the filter. The scale bar is 1 μm. (d) The filter membrane after gold deposition. The scale bar is 10 mm.

Figure 3.
(a) Equivalent circuit of the Randles model. (b) An improved model for paper-based impedance measurements at low concentrations. (c) Extracted charge transfer resistance (Rct) for low-concentration bacterial measurements and the fitting curve.(“*” in the chart below the plot is multiplication sign) (d) The Nyquist plot of measurement data for bacteria at low concentrations, where the 4 M/mL dashed line is re-plotted in Figure 4b for reference.

Figure 4.
(a) Microscopic image of bacterial impedance measurements, where lines (pearl chains) were formed. The bacterial pearl chain in the blue square can be equivalent to an RC circuit model. The scale bar is 0.5 mm. (b) A modified new model to evaluate bacteria for high-concentration ranges. (c) Extracted pearl resistance for highly concentrated bacterial measurements and the fitting curve. (d) The Nyquist plot of measurement data for bacteria at high concentrations (40 M/mL and 400 M/mL).

Disclaimer/Publisher’s Note: The statements, opinions and data contained in all publications are solely those of the individual author(s) and contributor(s) and not of MDPI and/or the editor(s). MDPI and/or the editor(s) disclaim responsibility for any injury to people or property resulting from any ideas, methods, instructions or products referred to in the content. |
© 2023 by the authors. Licensee MDPI, Basel, Switzerland. This article is an open access article distributed under the terms and conditions of the Creative Commons Attribution (CC BY) license (https://creativecommons.org/licenses/by/4.0/).
Share and Cite
MDPI and ACS Style
Long, Y.; Ai, Z.; Zhang, L.; Zhang, H.; Jiang, J.; Liu, G.L. Low-Cost, High-Sensitivity Paper-Based Bacteria Impedance Sensor Based on Vertical Flow Assay. Chemosensors 2023, 11, 238. https://doi.org/10.3390/chemosensors11040238
AMA Style
Long Y, Ai Z, Zhang L, Zhang H, Jiang J, Liu GL. Low-Cost, High-Sensitivity Paper-Based Bacteria Impedance Sensor Based on Vertical Flow Assay. Chemosensors. 2023; 11(4):238. https://doi.org/10.3390/chemosensors11040238
Chicago/Turabian StyleLong, Yifan, Zhehong Ai, Longhan Zhang, Han Zhang, Jing Jiang, and Gang Logan Liu. 2023. "Low-Cost, High-Sensitivity Paper-Based Bacteria Impedance Sensor Based on Vertical Flow Assay" Chemosensors 11, no. 4: 238. https://doi.org/10.3390/chemosensors11040238
Note that from the first issue of 2016, this journal uses article numbers instead of page numbers. See further details here.