Communication

Advanced Mapping of Optically-Blind and Optically-Active Nitrogen Chemical Impurities in Natural Diamonds

1
Lebedev Physical Institute, Moscow 119991, Russia
2
Geology Faculty, Lomonosov Moscow State University, Moscow 119899, Russia
3
School of Natural Sciences and Mathematics, Ural Federal University, Ekaterinburg 620000, Russia
*
Author to whom correspondence should be addressed.
Chemosensors 2023, 11(1), 24; https://doi.org/10.3390/chemosensors11010024
Submission received: 17 November 2022 / Revised: 20 December 2022 / Accepted: 24 December 2022 / Published: 27 December 2022
(This article belongs to the Collection Optical Chemosensors and Biosensors)

Abstract

:
Natural diamonds with a rich variety of optically blind and optically active nitrogen impurity centers were explored at a nano/microscale on the surface and in bulk by a number of advanced chemical and structural analytical tools in order to achieve a comprehensive characterization by establishing enlightening links between their analysis results. First, novel compositional relationships were established between high-energy X-ray photoelectron spectroscopy (XPS) and low-energy Fourier-transform infrared vibrational spectroscopy (FT-IR) signals of nitrogen impurity defects acquired in the microscopy mode at the same positions of the diamond surface, indicating the verification XPS modality for qualitative and quantitative FT-IR analysis of high concentrations of nitrogen and other chemical impurity defects in diamond. Second, depth-dependent spatial distributions of diverse photoluminescence (PL)-active nitrogen defects were acquired in the confocal scanning mode in an octahedral diamond and then for the first time corrected to the related Raman signals of the carbon lattice to rule out artefacts of the confocal parameter and to reveal different micron-scale ontogenetic layers in the impurity distributions on its surface. Third, intriguing connections between local structural micro-scale defects (dislocation slip bands of plastic deformation zones) visualized by optical microscopy and Raman microspectroscopy, and related distributions of stress-sensitive PL-active nitrogen impurity defects in the proximity of these planes inside bulk diamonds were revealed. These findings demonstrate the broad instrumental opportunities for comprehensive in situ studies of the chemical, structural, and mechanical micro-features in diamonds, from the surface into bulk.

1. Introduction

Despite their unprecedented transparency, high-index brightness, and attractive colors harnessed in optics, optoelectronics, and jewelry, natural diamonds carry out tremendous (up to 0.1–1 at. %) concentrations of atomistic intrinsic and impurity defects (mostly, nitrogen ones [1,2,3,4,5]), considerably masked by their ultra-rigid crystalline lattice (Supplementary materials). The variety of nitrogen impurity defects (Figure 1), partially combined with intrinsic (carbon interstitials I and vacancies V) ones, differs in its composition, symmetry and configuration, thermodynamic stability, optical (UV-vis and IR absorption) and electronic (electron orbital or spin momentum) properties [1]. These intrinsic structural characteristics dictate many of the crucial properties of the resulting material and, thus, require that they control different analytical methods—UV-vis and IR transmission spectroscopy, PL spectroscopy, electron paramagnetic resonance (EPR) spectroscopy, and even more sophisticated methods to characterize their corresponding relevant properties in the bulk of the hardest material [2,3,5]. Meanwhile, local microscale structural defects—radioactive inclusions, growth layers, plastically-deformed zones, voidities, and platelets [2,3,6,7]—could also strongly modulate distributions of impurities, making their overall macroscopic analysis unreliable.
For most nitrogen impurity defects, depending on the symmetry of their configuration and related electronic structure, typically either optical (UV-vis, IR-transmission, PL) or electronic (EPR) characterization methods are employed [1,2,3,4,5,6,7,8,9,10,11,12,13,14,15,16,17,18]. As a result, for the comprehensive characterization of the abundance of nitrogen impurity defects in bulk natural diamonds, a number of complementary analytical methods are required, which are still not always available for the microscopic characterization of impurity distributions between different growth sectors and extended microscopic defects in real natural diamonds, even in common daily gemological practice.
Specifically, FT-IR analysis is commonly used for determining nitrogen concentration in diamonds, enabling measurements of average quantities up to 3 × 10³ ppm [8], with a spatial resolution with a depth of ~100 μm, according to typical absorption coefficients of nitrogen in one-phonon range ~10–102 cm−1 [1,3,4]. Hence, both the local and high-concentration acquisition of nitrogen abundance becomes impossible by FT-IR spectroscopy (even, in its microscopy mode) in micro-scale internal features in diamonds (sharp interfaces of growth and plastic deformation zones [9,10,11], inclusions [12]). Alternatively, the X-ray photoelectron micro-spectroscopy method is known to provide surfaces with a high spatial resolution (~10–102 μm laterally, ~10–102 nm in depth) and a broad dynamic range of measurable impurity concentrations, starting from ~0.1 at. % (>103 ppm) but has been never used for the evaluation of nitrogen abundance in diamonds [13,14,15]. In contrast, in studies of minute internal diamond structures, either ontogenetic evolutionary growth zones (core, mantle, periphery) [8,9] or plastic deformation zones decorated by impurity centers [11,16,17], FT-IR [11], or EPR [4,18] methods appear uninformative due to macroscopic acquisition, while more envisioning tools such as cathodoluminescence (CL) with is micrometer-deep probing layer still require technically challenging and sometimes impossible diamond slicing into thin plates for CL mapping [8,9]. Overall, extensive diverse microscopic studies of natural diamonds enriched by various nitrogen impurity defects and different structural imperfections (dislocations, platelets, voidities etc.), are still demanded by properly chosen and relevant analytical methods to establish the unambiguously important connections between their chemical, structural, optical, and mechanical properties in situ.
In this study, our primary mission was in demonstrating novel applications of different advanced high-resolution microspectroscopic analytical methods (XPS, 3D-scanning PL/Raman micro-spectroscopy) for in situ studies of micro-scale structural or chemical features in natural diamonds on surfaces and in bulk, related to nitrogen impurity defects, and establishing useful links between the measured various chemical, mechanical, and optical characteristics.

2. Materials and Methods

In these experiments, we used natural diamonds of different shapes (dodecahedral habit and plates made from octahedron, sometimes rather irregular, almost spherical shapes—see below) and compositional types (IaAB, IaB) from M. V. Lomonosov (Arkhangelsk province) and Ebelyakh (Anabar region) deposits of Russia [18,19,20,21].
In order to derive the concentrations of nitrogen impurity defects in the 100-micron thick surface layer of diamonds, the samples were characterized in ambient air by room-temperature (RT) Fourier-transform infrared (FT-IR) transmission microspectroscopy (spectral range—400–4000 cm−1, resolution—1 cm−1), using a spectrometer Optics IFS-125HR (Bruker, Billerica, MA, USA) with a microscope Hyperion 2000 (Bruker, Billerica, MA, USA).
The chemical bonding of nitrogen impurity and intrinsic carbon atoms was studied on the diamond surfaces by means of an X-ray photoelectron spectrometer K-Alpha (Thermo Fisher Scientific, Waltham, MA, USA). The photoelectron spectra were acquired for 225 s each using an Al-Kα line as an excitation source at the energy accuracy of 0.1 eV and composition accuracy of 0.1 at. %, from the spot of 200-µm in diameter, using 40-eV pass energy for high-resolution spectra. The spectrometer was calibrated to the binding energy of an Au 4f7/2 line at 84.00 eV.
RT PL spectra of the samples were acquired by 3D-scanning confocal Raman/PL microspectroscopy and using Alpha 300 AR (WiTec, London, UK) and Confotec 350 (SOL instruments, Minsk, Belorussia) microscopes-spectrometers at 405-, 488- and 532-nm laser excitation wavelengths (spectral resolution—0.5 nm), using 0.3-NA Nikon objectives and excitation laser power not exceeding 50 mW.

3. Results and Discussion

3.1. Surface Concentration Measurements for Optically Blind and Optically Active Nirogen Impurity Defects via XPS Probing of Their Chemical States

Some nitrogen impurity defects are optically blind in PL spectra (2N/A, 4N2V/B1, B2 etc. [1,3,5,6,7,8,18]) and can be identified only by FT-IR spectroscopy (Figure 2) if average concentrations are not too high. In Table 1, there are the corresponding FT-IR microspectroscopy results of the compositional analysis for surface spots of a few natural diamonds, showing the abundance of the different nitrogen impurity defects up to 103 ppm, according to the calibration procedures reported in refs. [21,22,23]. It is noteworthy that high impurity (e.g., nitrogen) concentrations (>103 ppm) in diamonds in many cases are challenging for FT-IR measurements due to total IR-light absorbance (noise-level transmittance) even in moderately thick diamonds.
In comparison, we have suggested, for the first time, employing an XPS method for the evaluation of nitrogen concentration in the surface layer of these diamonds (Table 2), while previous XPS studies were focused on other impurities [13,14] or structural states of carbon in diamonds [15]. Below, we compare the FT-IR results with the relative content in atomic % of C–N and N–N bonds in these defects, according to the intensities of their XPS peaks (Figure 3). Previously, such a qualitative comparison was performed in refs. [24,25,26,27,28,29,30], though without deep analysis. Here, we assign N–N bonds to only the 2N(A)-centers [27,29], while C–N bonds are present in all types of nitrogen impurity defects.
Furthermore, we explored the correlation between the XPS-based contents of nitrogen atoms in N–N and C–N bonds in at. % and FT-IR-based concentrations of the different nitrogen impurity defects in ppm (Figure 4). Accounting for the XPS detection limit of 0.1 at. %, these plots reasonably indicate the linear calibration relationship between XPS N–N intensity and ΣN (Figure 4a), similar to XPS C–N intensity and ΣN. The same is true for the other plots—XPS N–N intensity versus [A] (Figure 4b), and XPS C–N intensity versus [B1] (Figure 4c).
Overall, these studies indicate that our XPS probing of the chemical states of nitrogen impurity defects, accompanied by statistical analysis, could provide the envisioning insight into their quantitative abundance on the very surfaces of natural diamonds compared with FT-IR probing depths ~102–103 μm (typical measurable IR absorption coefficients ~10–102 cm−1 [1,6,8,12,18,22]). As a result, the XPS-measured concentrations generally differ from the FT-IR measured ones, indicating their only order-of-magnitude correspondence (Figure 4). Hence, in addition to the rather standard FT-IR (micro)spectroscopy of bulk diamonds, a less sensitive XPS method could measure high concentrations (>103 ppm) of nitrogen and other chemical impurities, thus making possible not only qualitative but also broad-range quantitative analysis for their combination.

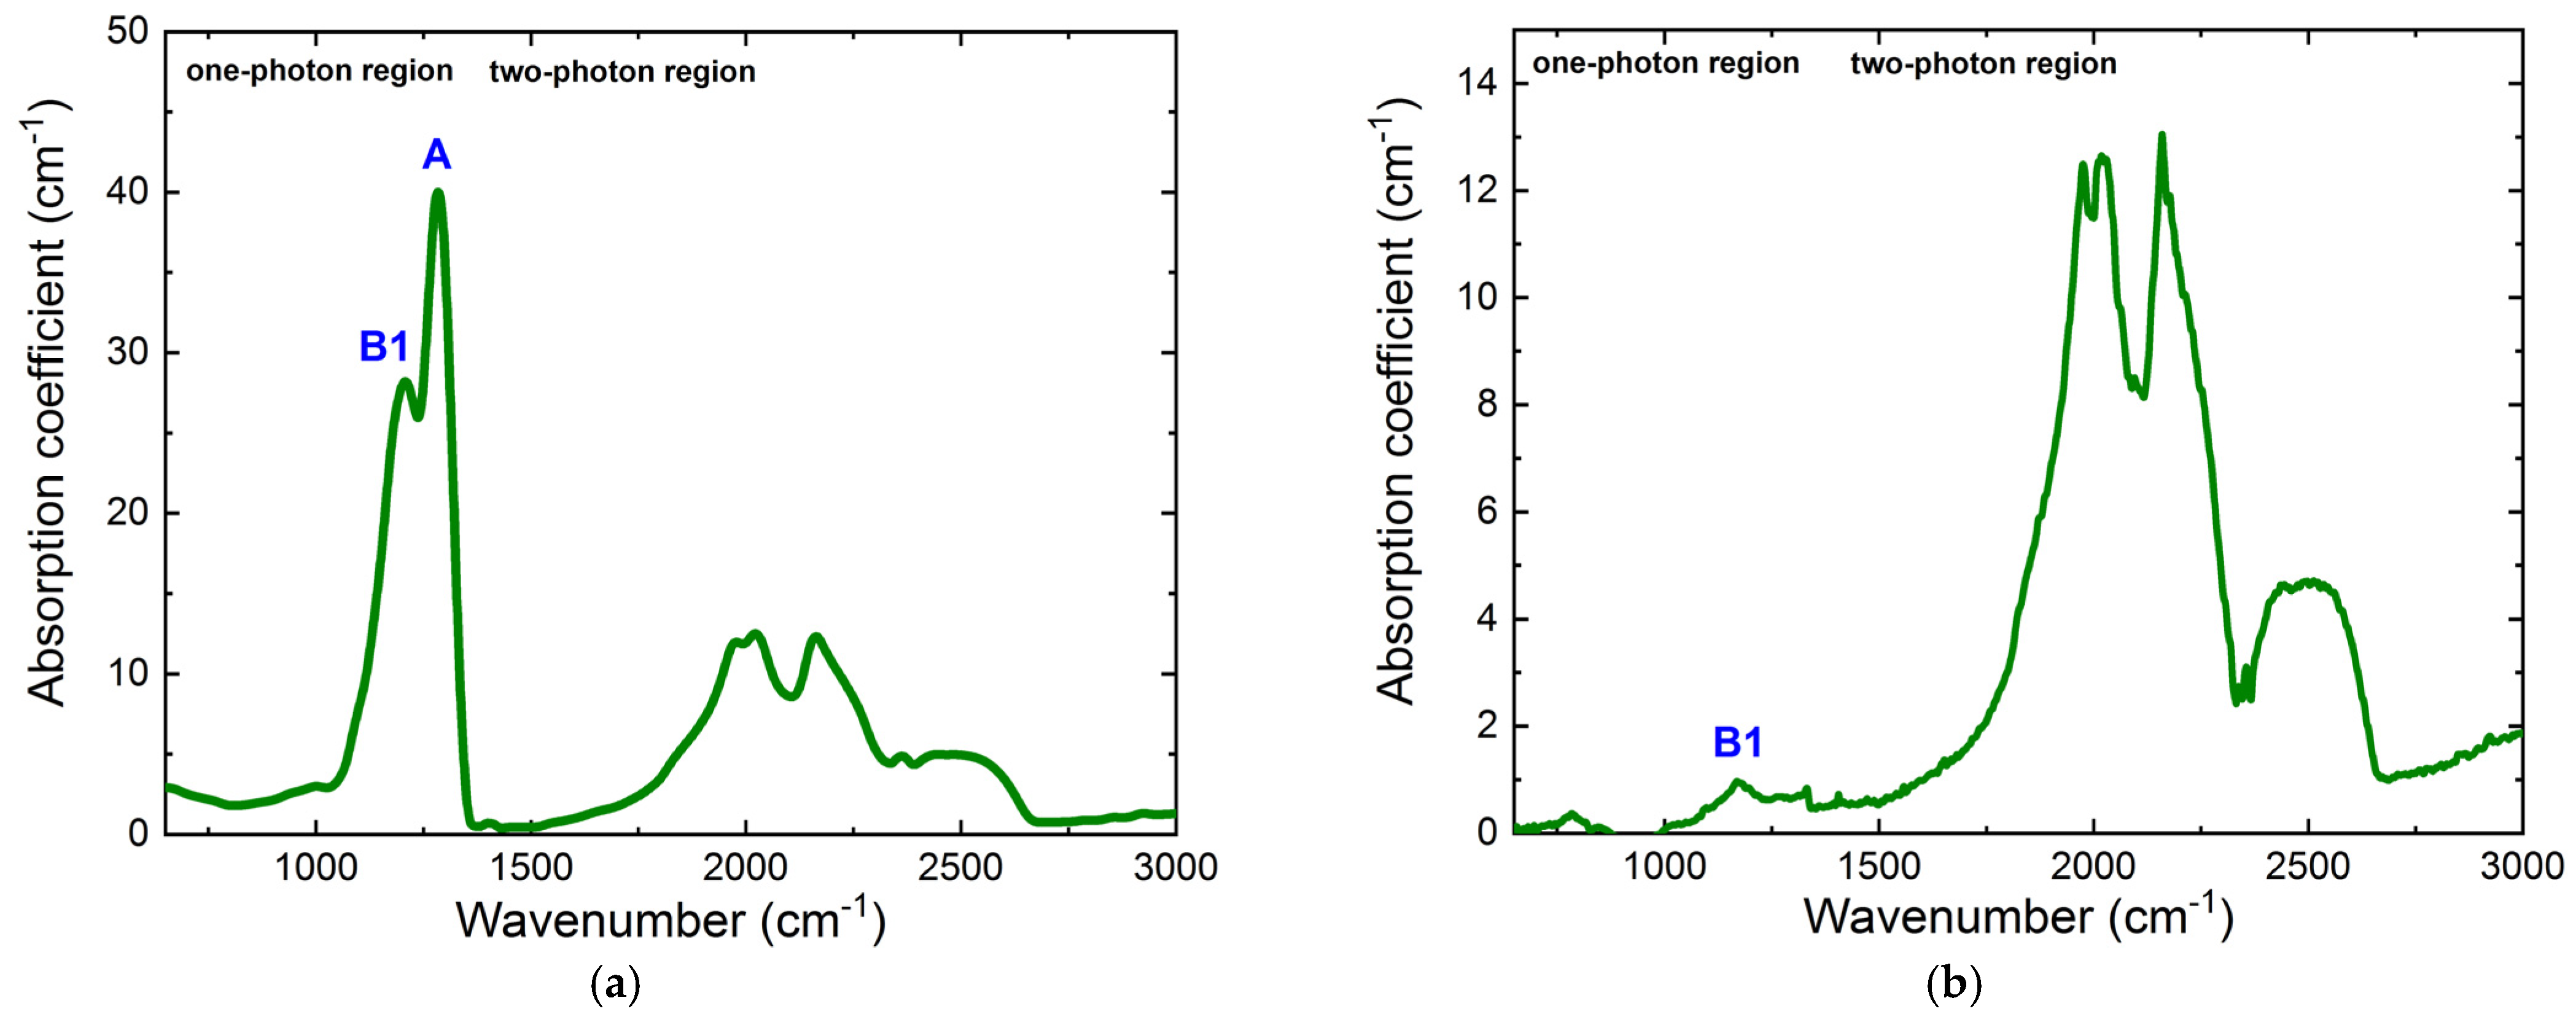
3.2. Raman Correction of Depth-Dependent PL-Active Nitrogen Impurity Abundance in Bulk Diamond

In this section, we explore the octahedral natural IaAB-diamond to identify the ontogenetic evolutionary transition (new growth or modification) layer on its surface via depth-dependent 3D-scanning confocal PL/Raman acquisition, utilizing the Raman intensity dependence on the depth to correct the PL yield of N3 and H3/H4 centers for the confocal probe factor [1,5,7,31,32,33,34]. Typically, for this purpose, the diamond under study is sliced into thin plates for their cross-sectional surface CL mapping of nitrogen impurity centers [9,10].
In these experiments, we acquired the 3D PL and Raman spectra of the octahedral natural IaAB-diamond, excited at the 405-nm wavelength (for comparison—also at 532 nm), as a function of depth z ≤ 200 μm inside it (Figure 5). These spectra exhibit in Figure 5a a 428-nm Raman line and PL bands of N3 (ZPL at 415 nm [1,3,5,7]) and H3/H4-centers (ZPLs at 496 and 503 nm [1,3,5,7]). Both the Raman and PL intensities demonstrated the diminished magnitudes close to the sample surface: for the Raman signal—in the surface layer of ≈25 μm (Figure 5b, ≈50 μm at the 532-nm wavelength); for the N3-band—in the 100-μm thick layer; and for the H3/H4-bands—in the 75-μm thick layer (Figure 5c). Meanwhile, in bulk, the Raman signal from the ultra-stable diamond lattice comes to true saturation, exhibiting the only near-surface diminishing effect.
Importantly, the Raman signals demonstrate the much thinner layer of diminished intensity, which is divergence- and wavelength-dependent, e.g., thicker at the 532-nm wavelength by a factor of 532 nm/405 nm ≈ 1.35. We considered this near-surface reduction of the Raman intensity as a confocal effect, resulting from the incomplete/partial laser focus arrangement inside the sample. The Raleigh length LR for our acquisition conditions (λ = 405 nm, NA = 0.25) was equal to
2 L R 2 λ ( n 2 N A 2 ) n N A 2 30   μ m ,
in good agreement with the observed thickness of the layer of reduced Raman signal excited at 405-nm wavelength. Hence, we can consider the surface decrease of the Raman intensity as a purely instrumental effect and perform a normalization of the depth-dependent PL intensities to the Raman one.
In Figure 5d, one can see the normalized depth dependencies of the PL intensity of the N3 and H3/H4 centers. Obviously, despite the right shape of the gem, its surface layer of a thickness of ~100 μm is strongly depleted by N3 centers but enriched by H3/H4 ones. This could correspond to a transition layer, either modified by some occasional chemical and physical (radioactivity etc.) perturbation factors or its new regression ontogenetic growth zone of a different composition regarding the nitrogen impurity centers [5,6,18,33]. Such layered differences in N3 and H3/H4 abundance in natural diamonds are known to occur in different ontogenetic layers [34].
Overall, our microscale 3D-scanning confocal Raman/PL microspectroscopic in-depth mapping of a sub-mm thick subsurface layer in an octahedral natural IaAB-diamond was performed, accounting for the first time the confocal correction via normalization of the spatially inhomogeneous PL signal to the Raman one. This procedure enabled the identification of the modified internal chemical structure of the diamond and established the inhomogeneous, anti-correlating abundance of the characteristic N3 and H3/H4 nitrogen impurity centers across it, without the diamond slicing into thin plates [9,10], potentially reflecting different ontogenetic layers during the diamond formation.

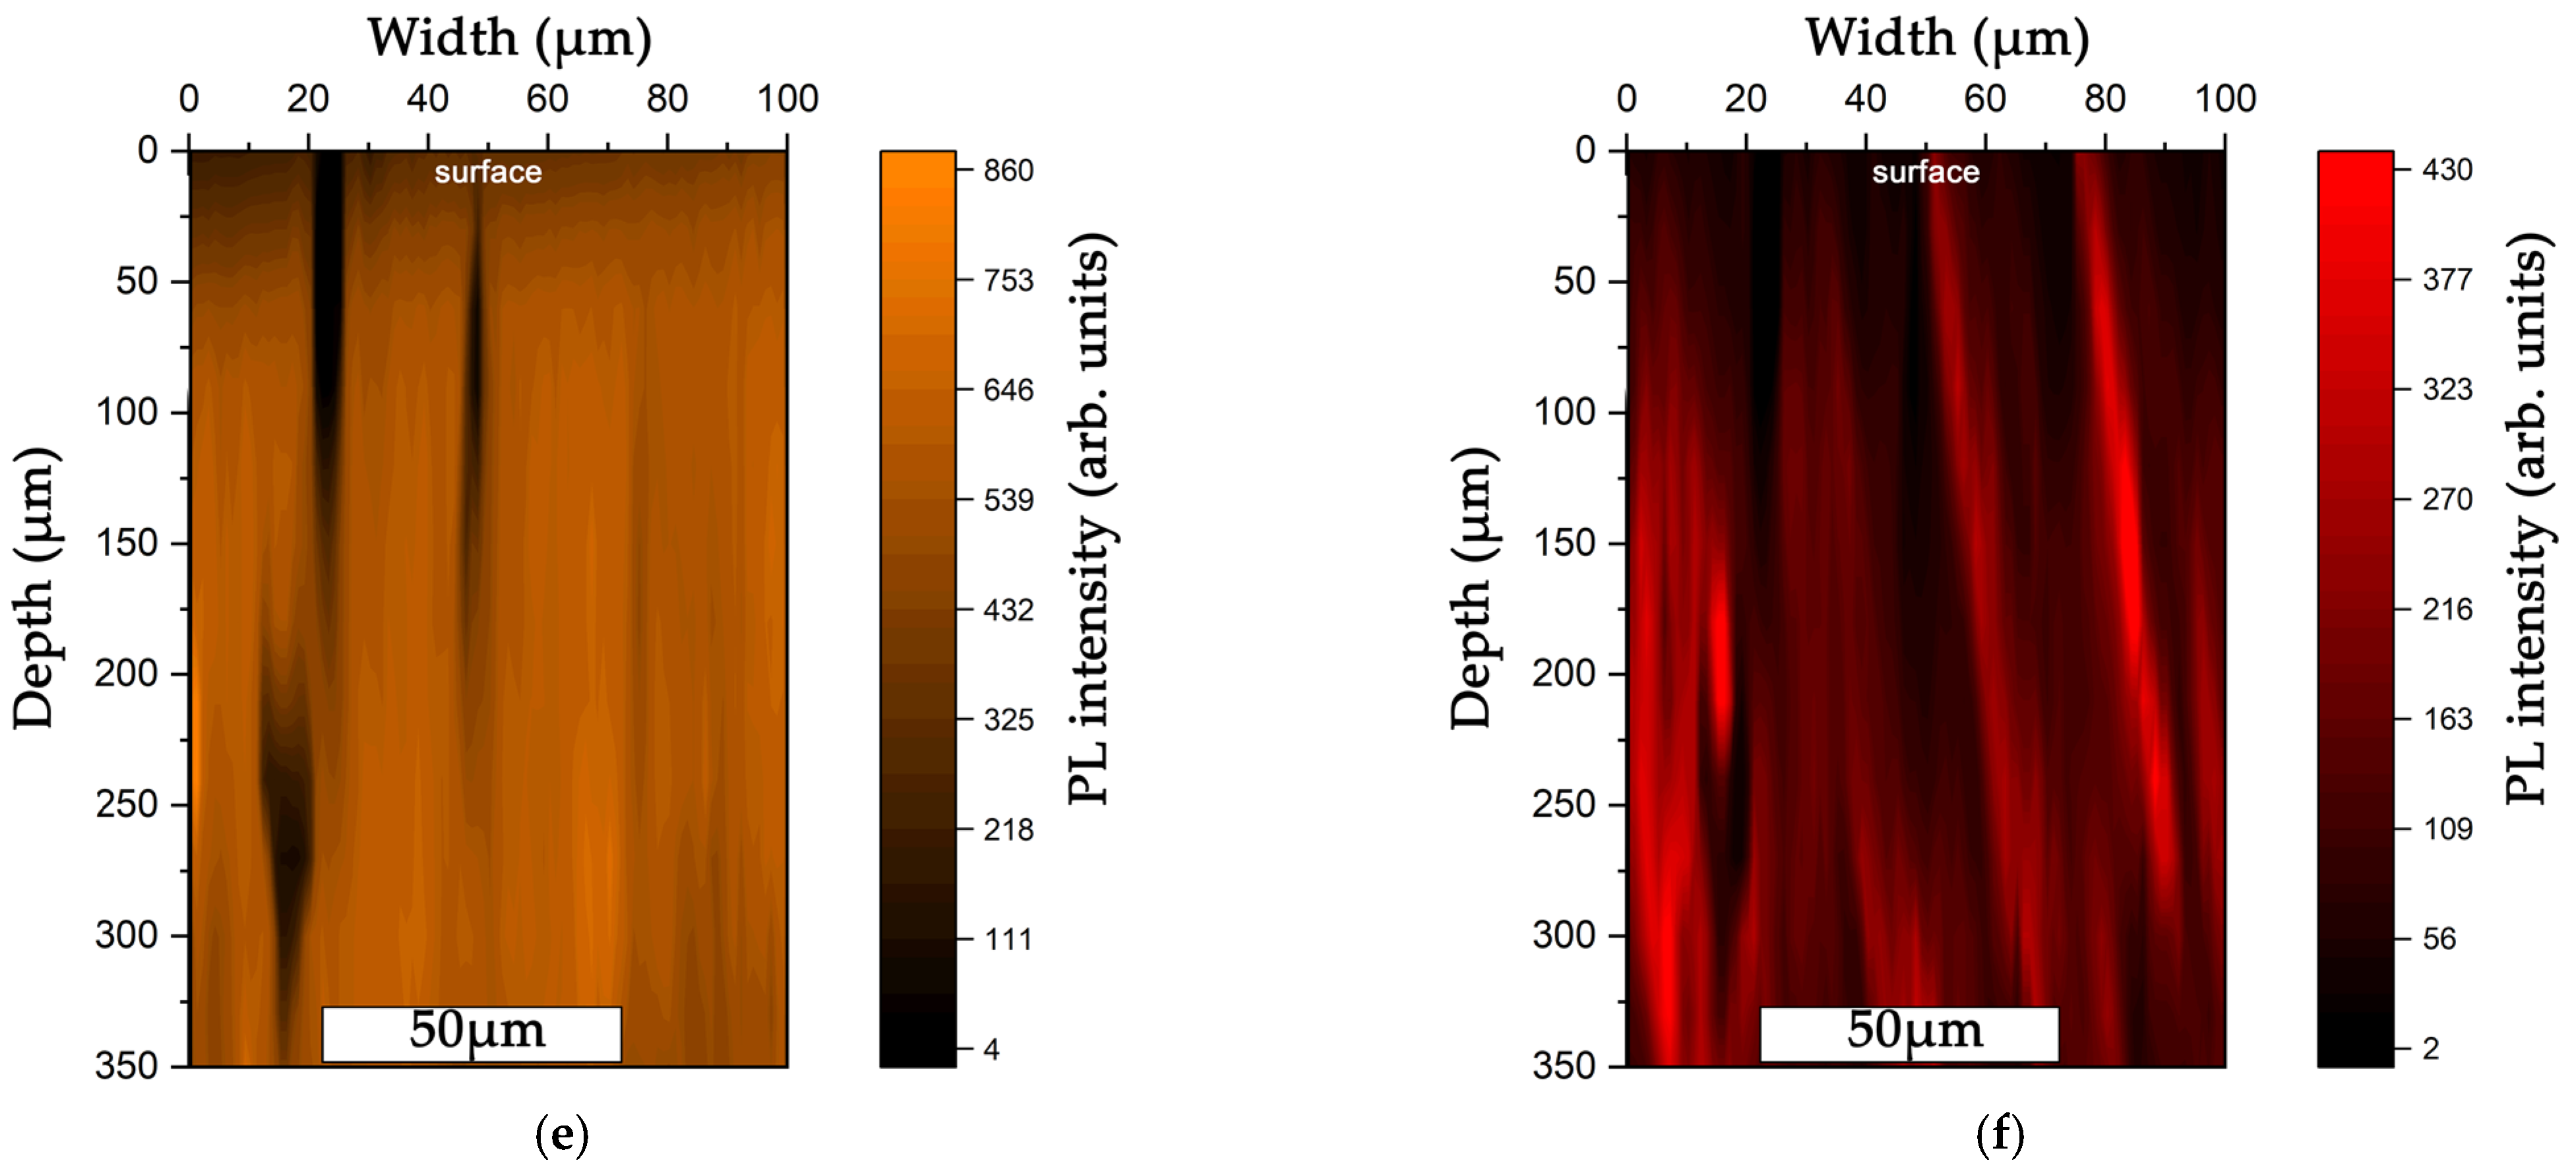
3.3. Correlation between Local Plastic Deformations and Distribution of PL-Active Nitrogen Impurity Defects

In this section, we explore microscopic plastic deformation zones (lamellae) related to dislocation slip bands in brown [11,16,17] and pink [11] diamonds and decorated by vacancies (vacancy clusters) [16,17] and N3, H3/H4 nitrogen impurity centers [11]. In our case, the distinct micro-scale bands were observed inside a rare bulk pink-brown diamond by optical microscopy (Figure 6a) but do not directly coincide with the pink coloration patterns provided by H3(2NV), H4(4N2V) centers (ZPLs at ≈500 nm, peak at ≈550 nm) [6,19,20,21,22,35], NV0-centers (ZPL at 575 nm, peak at ≈650 nm) [1,7,36] and dislocation-related centers (peak at ≈700 nm) [28,32,36]. Below, we used the combination of optical transmission microscopy and 3D-scanning confocal Raman/PL microspectroscopy to identify microscopic plastic deformation zones inside the diamond and relate them to stress-sensitive distributions of PL-active nitrogen impurity defects [28,36].
In Figure 6, the optical image (a) and corresponding Raman/PL maps (c–f) of the near-surface region in the bulk diamond are shown. Interestingly, a few-micron periods of the plastic deformation (PD) zones in the optical image partially replicate the period of the bright Raman (Figure 6c,e) and PL (Figure 6d,f) intensity features across the sample.
As we can see in the detailed spectra (Figure 6b), the overall spectral fingerprint in the PD area fully repeats the spectral fingerprint of the surrounding diamond, which means that they contain the same nitrogen impurity centers. In the spectra, we can see the Raman lines at 522 nm (488 nm excitation) and 573 nm (532 nm excitation), the green-yellow PL band of H3/H4 centers [1,7,28,34,35], where the H3 center could be considered an A(N–N)-center with a vacancy inside, making an N–V–N structure and red PL band of NV-centers [1,5,18] or dislocation-related centers [1,3,4,7,11,16,17]. Since PD zones cover the entire diamond, periodic bands of complex nitrogen impurity defects are also observed in the PL yield across the whole volume of the gem (Figure 6d,e).
Specifically, in Figure 6c,d, one can see the good correspondence between the Raman and H3/H4 PL peaks in the maps, indicating that the brighter plastically deformed zone induced the enhanced Raman signal and attracted additional highly aggregated H3/H4 centers, increasing in situ their PL yield. Intriguingly, in Figure 6e,f, there is a general correspondence between the Raman and 700-nm-PL peaks at the moderate intensity level, which is surprising except for a few very bright PL spots, which are absent in the Raman map. Apparently, mechanical stresses are relaxed in some of these dislocation-related micro-scale features, while their atomistic internal structure induces the observed strong compositional modulation in the 700-nm PL intensity. Additional multi-spectral analysis in our forthcoming studies could give enlightening insights into the origin and structure of the observed dislocation-related PL centers.

4. Conclusions

In our study, various types of electrons, IR, Raman/PL, and optical microscopy methods were employed in pairs to provide complementary enlightening insights into the chemical or structural properties of microscale features in diamonds. Using nitrogen impurities in diamonds as an example, X-ray photoelectron microspectroscopy was demonstrated to verify FR-IR microspectroscopy findings in a qualitative and quantitative analysis of different chemical impurities present in a broad range of concentrations. Raman scattering analysis was shown to enable spatial confocal corrections of PL yield for different nitrogen centers in the multi-micron thick near-surface diamond layer, which typically represents different ontogenetic formation zones in diamonds. Finally, optical imaging of plastic deformation microzones and their Raman/PL microspectroscopy mapping of stresses and nitrogen impurity concentrations revealed their distinct correlation, enabling our forthcoming detailed studies in specially prepared thin diamond plates. Overall, the overviewed versatile microscopy methods characterize from different viewpoints the interesting and challenging “evergreen” compositional or structural microscale features on the surface and in bulk diamonds, in order to shed light on their origin and internal structure.

Supplementary Materials

The following supporting information can be downloaded at: https://www.mdpi.com/article/10.3390/chemosensors11010024/s1, Table S1: Characterization of coloured diamonds.

Author Contributions

Conceptualization, S.K. and G.K.; methodology, P.D.; software, E.K.; validation, R.K., E.R. and E.K.; investigation, V.P. and A.M.; resources, R.K. and G.K.; data curation, P.D.; writing—original draft preparation, S.K., E.R. and V.P.; writing—review and editing, S.K., E.R., G.K. and V.S.; visualization, E.K. and E.G.; supervision, G.K.; project administration, S.K.; funding acquisition, S.K. All authors have read and agreed to the published version of the manuscript.

Funding

This research was funded by the Ministry of Science and Higher Education of the Russian Federation (Project # 075-15-2021-677, Ural Federal University Program of Development within the Priority-2030 Program).

Institutional Review Board Statement

Not applicable.

Informed Consent Statement

Not applicable.

Data Availability Statement

The data supporting the reported results are available from the authors upon reasonable request.

Acknowledgments

The equipment of the Ural Center for Shared Use “Modern nanotechnology” of Ural Federal University (Reg.# 2968), which is supported by the Ministry of Science and Higher Education RF. The samples were provided by Geological Faculty of Moscow State University (G.K.).

Conflicts of Interest

The authors declare no conflict of interest.

References

  1. Zaitsev, A.M. Optical Properties of Diamond: A Data Handbook; Springer: Berlin/Heidelberg, Germany, 2013. [Google Scholar]
  2. Orlov, Y.L. Mineralogy of Diamond; Moscow: Moscow, Russian, 1984. [Google Scholar]
  3. Ashfold, M.N.; Goss, J.P.; Green, B.L.; May, P.W.; Newton, M.E.; Peaker, C.V. Nitrogen in diamond. Chem. Rev. 2020, 120, 5745–5794. [Google Scholar] [CrossRef] [PubMed]
  4. Nadolinny, V.; Komarovskikh, A.; Palyanov, Y. Incorporation of Large Impurity Atoms into the Diamond Crystal Lattice: EPR of Split-Vacancy Defects in Diamond. Crystals 2017, 7, 237. [Google Scholar] [CrossRef] [Green Version]
  5. Bokii, G.B.; Bezrukov, G.N.; Klyuev, Y.A.; Naletov, A.M.; Nepsha, V.I. Natural and Synthetic Diamonds; Nauka: Moscow, Russian, 1986. [Google Scholar]
  6. Garanin, V.; Garanin, K.; Kriulina, G.; Samosorov, G. Diamonds from the Arkhangelsk Province, NW Russia; Springer: Cham, Switzerland, 2021. [Google Scholar]
  7. Dobrinets, I.A.; Vins, V.G.; Zaitsev, A.M. HPHT-Treated Diamond; Springer: Berlin/Heidelberg, Germany, 2013. [Google Scholar]
  8. Vasilev, E.; Petrovsky, V.; Kozlov, A.; Antonov, A.; Kudryavtsev, A.; Orekhova, K. The story of one diamond: The heterogeneous distribution of the optical centres within a diamond crystal from the Ichetju placer, northern Urals. Mineral. Mag. 2003, 83, 515–522. [Google Scholar] [CrossRef]
  9. Klepikov, I.V.; Vasilev, E.A.; Antonov, A.V. Regeneration Growth as One of the Principal Stages of Diamond Crystallogenesis. Minerals 2022, 12, 327. [Google Scholar] [CrossRef]
  10. Vasilev, E.A.; Zedgenizov, D.A.; Klepikov, I.V. The enigma of cuboid diamonds: The causes of inverse distribution of optical centers within the growth zones. J. Geosci. 2020, 65, 59–70. [Google Scholar] [CrossRef]
  11. Collins, A.T.; Kanda, H.; Kitawaki, H. Colour changes produced in natural brown diamonds by high-pressure, high-temperature treatment. Diam. Relat. Mater. 2000, 9, 113–122. [Google Scholar] [CrossRef]
  12. Vasilev, E.; Zedgenizov, D.; Zamyatin, D.; Klepikov, I.; Antonov, A. Cathodoluminescence of Diamond: Features of Visualization. Crystals 2021, 11, 1522. [Google Scholar] [CrossRef]
  13. Calderón-Martínez, M.C.; Gil-Tolano, M.I.; Navarro-Espinoza, S.; Meléndrez, R.; Chernov, V.; Barboza-Flores, M. Optical properties and functional groups characterization of commercial HPHT micro-diamond samples. Opt. Mat. 2022, 131, 112592. [Google Scholar] [CrossRef]
  14. Araujo, D.; Suzuki, M.; Lloret, F.; Alba, G.; Villar, P. Diamond for Electronics: Materials, processing and devices. Materials 2021, 14, 7081. [Google Scholar] [CrossRef]
  15. Xu, H.; Zang, J.; Yuan, Y.; Yan, S.; Tian, P.; Wang, Y.; Xu, X. Fabrication and microstructural characterization of the diamond@ amorphous carbon nanocomposite core/shell structure via in-situ polymerization. Ceram. Int. 2019, 45, 18430–18438. [Google Scholar] [CrossRef]
  16. Avalos, V.; Dannefaer, S. Vacancy-type defects in brown diamonds investigated by positron annihilation. Phys. B Condens. 2003, 340, 76–79. [Google Scholar] [CrossRef]
  17. Hounsome, L.S.; Jones, R.; Martineau, P.M.; Fisher, D.; Shaw, M.J.; Briddon, P.R.; Öberg, S. Origin of brown coloration in diamond. Phys. Rev. B 2006, 73, 125203. [Google Scholar] [CrossRef]
  18. Dishler, B. Handbook of Spectral Lines in Diamond; Springer: Berlin/Heidelberg, Germany, 2012. [Google Scholar]
  19. Gaillou, E.; Post, J.E.; Bassim, N.; Fries, M.; Rose, T.; Stroud, R.; Butler, J.E. Spectroscopic and microscopic characterization of color lamellae in natural pink diamonds. Diam. Relat. Mater. 2010, 19, 1207–1220. [Google Scholar] [CrossRef]
  20. Kriulina, G.; Vasilev, E.; Garanin, V. Structural and mineralogical features of diamonds from the Lomonosov deposit (Arkhangelsk province): New data and interpretation. Dokl. Earth Sci. 2019, 2, 627–629. [Google Scholar] [CrossRef]
  21. Yuryeva, O.P.; Rakhmanova, M.I.; Zedgenizov, D.A.; Kalinina, V.V. Spectroscopic evidence of the origin of brown and pink diamonds family from Internatsionalnaya kimberlite pipe (Siberian craton). Phys. Chem. Miner. 2020, 47, 20. [Google Scholar] [CrossRef]
  22. Iakoubovskii, K. Characterization of platelet-related infrared luminescence in diamond. Philos. Mag. Lett. 2020, 6, 441–444. [Google Scholar] [CrossRef]
  23. Vasilev, E. Luminescence of plastically deformed diamond in the range 800–1050 nm. J. Appl. Spectrosc. 2019, 3, 512–515. [Google Scholar] [CrossRef]
  24. Hu, M.; Bi, N.; Li, S.; Su, T.; Hu, Q.; Ma, H.; Jia, X. Synthesis and characterization of boron and nitrogen co-doped diamond crystals under high pressure and high temperature conditions. Cryst. Eng. Comm. 2017, 31, 4571. [Google Scholar] [CrossRef]
  25. Domashevskaya, E.P.; Chernyshev, A.V.; Turishchev, S.Y.; Kalinin, Y.E.; Sitnikov, A.V.; Marchenko, D.E. X-ray photoelectron spectroscopy investigations of atomic interactions in surface layers of multilayered nanostructures (Co45Fe45Zr10/a-Si)40 and (Co45Fe45Zr10/SiO2)32. Phys. Solid State 2014, 56, 2294–2306. [Google Scholar] [CrossRef]
  26. Peng, J.; Yang, M.; Zeng, J.; Sub, D.; Liao, J.; Yick, M.-L. Influence of nitrogen doping on the thermal stability of hydrogenated amorphous diamond coating. Thin Solid Films 2020, 709, 138188. [Google Scholar] [CrossRef]
  27. Howe, J.Y.; Jones, L.E.; Braski, D.N. An Auger Electron Spectroscopy (AES) and X-Ray Photoelectron Spectroscopy (XPS) Study of CVD and Natural diamonds. Mater. Res. Soc. Symp. Proc. 1999, 593, 453–458. [Google Scholar] [CrossRef]
  28. Sharma, S.C.; Green, M.; Hyer, R.C.; Dark, C.A.; Black, T.D.; Chourasia, A.R.; Chopra, D.R.; Mishra, K.K. Growth of diamond films and characterization by Raman, scanning electron microscopy, and X-ray photoelectron spectroscopy. J. Mater. Res. 1990, 5, 2424–2432. [Google Scholar] [CrossRef]
  29. Chastain, J.; King, R.C., Jr. Handbook of X-ray Photoelectron Spectroscopy; Physical Electronics: Eden Prairie, MN, USA, 1995. [Google Scholar]
  30. Okano, K.; Yamaguchi, H.; Kudo, Y.; Masuzawa, T.; Kudo, M.; Yamada, T.; Takakuwa, T. Electron emission mechanism of diamond characterised by combined XPS/UPS/FES. In Proceedings of the 2nd IEEE International Nanoelectronics Conference, Shanghai, China, 24–27 March 2008. [Google Scholar]
  31. Collins, A.T.; Connor, A.; Ly, C.-H.; Shareef, A.; Spear, P.M. High-temperature annealing of optical centers in type-I diamond. J. Appl. Phys. 2005, 97, 083517. [Google Scholar] [CrossRef]
  32. Luo, Y.; Breeding, C.M. Fluorescence produced by optical defects in diamond: Measurement, characterization, and challenges. Gems Gemol. 2013, 49, 82–97. [Google Scholar] [CrossRef]
  33. Beskrovanov, V.V. Diamond Ontogeny; Nauka: Moscow, Russian, 1992. [Google Scholar]
  34. Collins, A.T. Excited states of the H3 vibronic centre in diamond. J. Phys. C Solid State Phys. 1983, 16, 6691–6694. [Google Scholar] [CrossRef]
  35. Khmelnitsky, R.A.; Kovalchuk, O.E.; Gulina, Y.S.; Nastulyavichus, A.A.; Kriulina, G.Y.; Boldyrev, N.Y.; Kudryashov, S.I.; Levchenko, A.O.; Shiryaev, V.S. Optimal direction and propagation of mid-IR light inside rough and polished diamonds for highly-sensitive transmission measurements of nitrogen content. Diam. Relat. Mater. 2022, 128, 109278. [Google Scholar] [CrossRef]
  36. Danilov, P.; Kuzmin, E.; Rimskaya, E.; Chen, J.; Khmelnitskii, R.; Kirichenko, A.; Rodionov, N.; Kudryashov, S. Up/Down-Scaling Photoluminescent Micromarks Written in Diamond by Ultrashort Laser Pulses: Optical Photoluminescent and Structural Raman Imaging. Micromachines 2022, 13, 1883. [Google Scholar] [CrossRef]
Figure 1. Main types of nitrogen impurity defects in diamonds: (a) N (C-center), (b) 2N (A-center), (c) 4NV (B-center), (d) NV-center [4].
Chemosensors 11 00024 g001
Figure 2. FT-IR spectra of natural diamonds: (a) IaAB (1784-8-1); (b) IaB (EV-8-5).
Chemosensors 11 00024 g002
Figure 3. Typical XPS spectra of natural diamonds containing N–N and/or C–N bonding: (a) IaAB (1784-8-1); (b) IaB (EV-8-5); (c) comparison of all samples. Insets: white-light images of the diamonds under study. The low-intensity and noisy XPS signals result from the highly irregular shapes of the diamonds at the sub-millimeter scale, despite the rather long, 225-s acquisition (exposition) time.
Chemosensors 11 00024 g003
Figure 4. Correlation plots for IaAB and IaB diamonds: (a) XPS-acquired N–N and C–N intensities versus ΣN; (b) XPS-acquired N–N and C–N intensities versus [A]; (c) XPS-acquired N–N and C–N intensities versus [B1]. The bottom grey highlighted band denotes the device detection limit of 0.1 at. %.
Chemosensors 11 00024 g004
Figure 5. (a) PL/Raman spectra of IaAB diamond at different depths (405-nm excitation). Inset: the image of the octahedral diamond; (b) Depth dependence of normalized Raman signal excited at 405 and 532 nm; (c) Depth dependence of normalized PL yield of N3 (415 nm) and H3/H4 centers, taken at 550 nm, excited at 405 nm; (d) Depth dependence of normalized PL yield of N3 (415 nm) centers and H3/H4 (550 nm) centers, excited at 405 nm and corrected for the depth dependence of the Raman signal.
Chemosensors 11 00024 g005
Figure 6. (a) Optical image of the diamond and (inset) its magnified view in the near-surface region with microscale plastic deformation zones; (b) Raman and PL spectra of the plastic deformation zones (Intensity Max) and reference spot outside zones (Intensity Min), excited at 488- and 532-nm wavelengths; (c) Raman map of the diamond at 522-nm wavelength (excitation wavelength—488 nm); (d) PL map of the diamond at 550-nm wavelength, representing the spatial abundance of H3/H4 centers (excitation wavelength—488 nm); (e) Raman map of the diamond at 573-nm wavelength (excitation wavelength—532 nm); (f) PL map of the diamond at 700-nm wavelength, representing dislocation-related centers (excitation wavelength—532 nm).
Chemosensors 11 00024 g006aChemosensors 11 00024 g006b
Table 1. Content of different nitrogen impurity defects in IaAB and IaB diamonds.
SampleColorShapeIR Data
Ntotal, ppmA, ppmB1, ppmPlatelets, cm−1C, ppm
1784-8-1
(IaAB)
pinkdodecahedral habit1085 ± 109910 ± 91175 ± 18-0
1784-31-1
(IaAB)
brownoctahedral habit187 ± 19100 ± 1087 ± 920
EV-8-5
(IaB)
colorlessdodecahedral habit33 ± 3-33 ± 3-0
EV-8-32
(IaAB)
colorlessdodecahedral habit455 ± 45264 ± 26191 ± 19210
EV-8-39
(IaAB)
colorlessdodecahedral habit890 ± 89330 ± 33560 ± 56-0
T-210
(IaB)
colorlessplate62 ± 6-62 ± 6-0
T-284
(IaAB)
colorlessplate280 ± 28165 ± 17115 ± 1280
Table 2. Nitrogen content in C–N and N–N bonding states in the diamonds measured by XPS.
Sample1784-8-1
(IaAB)
1784-31-1
(IaAB)
EV-8-5
(IaB)
EV-8-32
(IaAB)
EV-8-39
(IaAB)
T-210
(IaB)
T-284
(IaAB)
C–N, at. % 0.49 ± 0.0200.66 ± 0.030.52 ± 0.030.56 ± 0.0300.38 ± 0.02
N–N, at. %0.19 ± 0.0100.44 ± 0.020.16 ± 0.010.38 ± 0.0200.14 ± 0.01
Disclaimer/Publisher’s Note: The statements, opinions and data contained in all publications are solely those of the individual author(s) and contributor(s) and not of MDPI and/or the editor(s). MDPI and/or the editor(s) disclaim responsibility for any injury to people or property resulting from any ideas, methods, instructions or products referred to in the content.

