
Large-Scale No-Show Patterns and Distributions for Clinic Operational Research

Abstract
:1. Introduction
2. Materials and Methods
2.1. Data Sources
2.2. Data Collection and Cleaning
2.3. Data Analyses and Methods
3. Results and Discussion

| Main Effects | Sum of Squares | Df | Mean Square | f-ratio | p-value |
|---|---|---|---|---|---|
| A: New vs Est | 11679.9 | 1 | 11679.9 | 96782.68 | 0 |
| B: Appt Age Group | 14534.5 | 9 | 1614.94 | 13381.88 | 0 |
| C: Age Group | 10367.9 | 13 | 797.527 | 6608.54 | 0 |
| D: Gender | 10.5457 | 1 | 10.5457 | 87.38 | 0 |
| E: Service Line | 1254.31 | 5 | 250.682 | 2078.72 | 0 |
| Interactions | Sum of Squares | Df | Mean Square | f-ratio | p-value |
| AB | 14906.3 | 9 | 1656.25 | 13724.16 | 0 |
| AC | 246.517 | 13 | 18.9628 | 157.13 | 0 |
| AD | 13.2343 | 1 | 13.2343 | 109.66 | 0 |
| AE | 4289.99 | 5 | 857.997 | 7109.61 | 0 |
| BC | 11011.8 | 117 | 94.1178 | 779.89 | 0 |
| BD | 59.6455 | 9 | 6.62728 | 54.92 | 0 |
| BE | 6113.94 | 45 | 135.865 | 1125.82 | 0 |
| CD | 302.393 | 13 | 23.261 | 192.75 | 0 |
| CE | 2057.52 | 65 | 31.6541 | 262.29 | 0 |
| DE | 66.027 | 5 | 13.2054 | 109.42 | 0 |
| Residual | 3.02 × 10⁶ | 25048804 | 0.120681 | ||
| Total (Corrected) | 3.21 × 10⁶ | 25049115 |
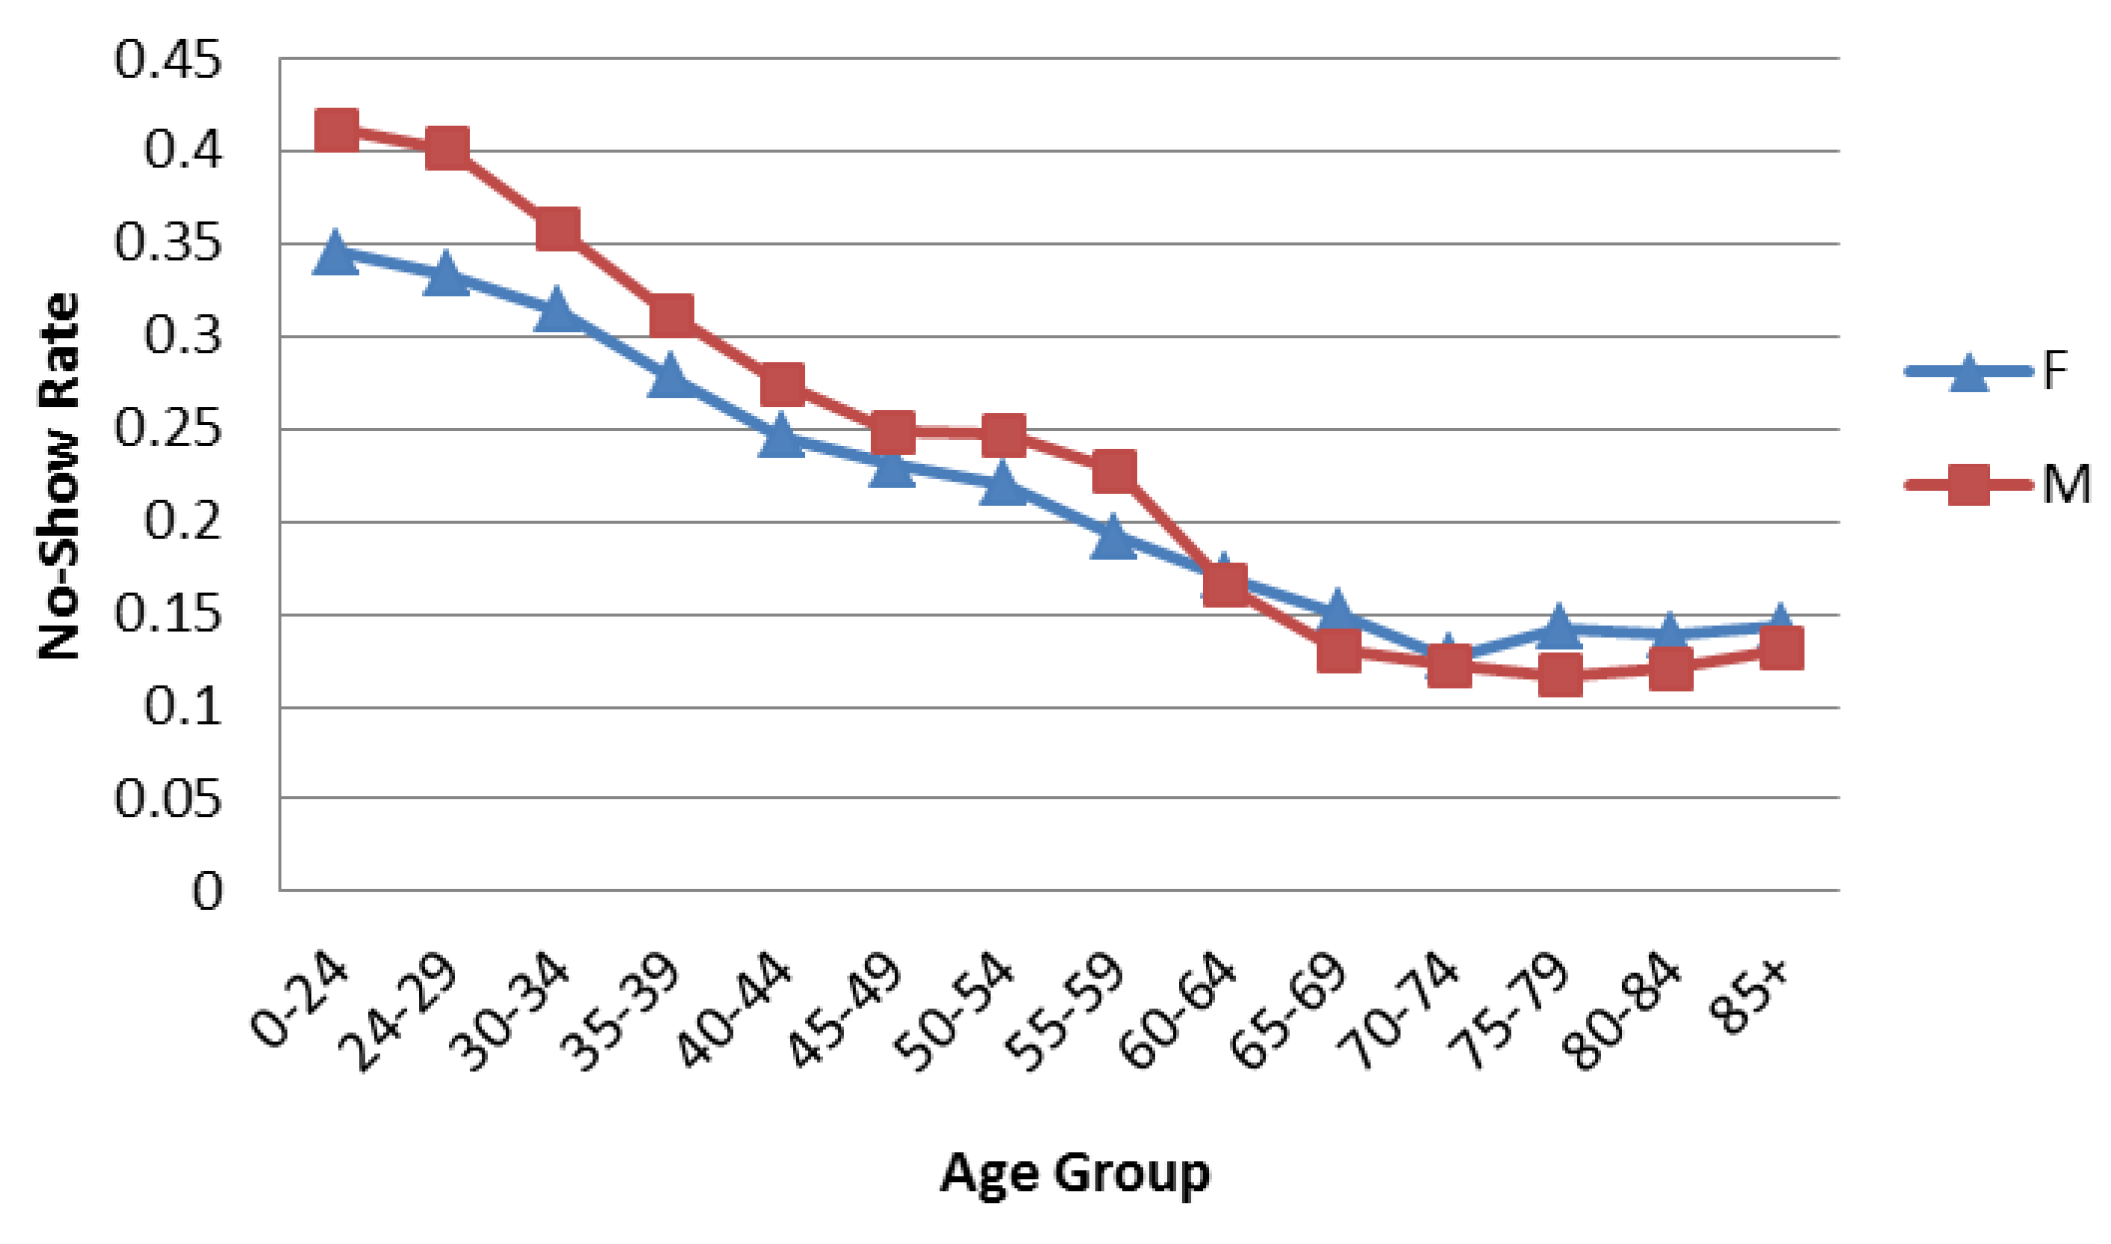
3.1. Gender and Age Frequencies
| Age Group | Females | Males | ||
|---|---|---|---|---|
| Number of Appointments | % of Total | Number of Appointments | % of Total | |
| 0–24 | 19,673 | 0.92% | 63,943 | 0.28% |
| 24–29 | 131,159 | 6.14% | 494,210 | 2.16% |
| 30–34 | 173,758 | 8.14% | 583,566 | 2.55% |
| 35–39 | 147,651 | 6.91% | 423,802 | 1.85% |
| 40–44 | 199,126 | 9.32% | 697,399 | 3.04% |
| 45–49 | 241,899 | 11.33% | 923,322 | 4.03% |
| 50–54 | 328,301 | 15.37% | 1,599,931 | 6.98% |
| 55–59 | 339,660 | 15.91% | 2,339,433 | 10.21% |
| 60–64 | 277,320 | 12.99% | 4,378,852 | 19.11% |
| 65–69 | 124,670 | 5.84% | 4,311,926 | 18.82% |
| 70–74 | 42,317 | 1.98% | 2,001,707 | 8.74% |
| 75–79 | 32,224 | 1.51% | 1,746,780 | 7.62% |
| 80–84 | 24,441 | 1.14% | 1,575,799 | 6.88% |
| 85+ | 52,891 | 2.48% | 1,773,356 | 7.74% |
| Total | 2,135,090 | 22,914,026 | ||
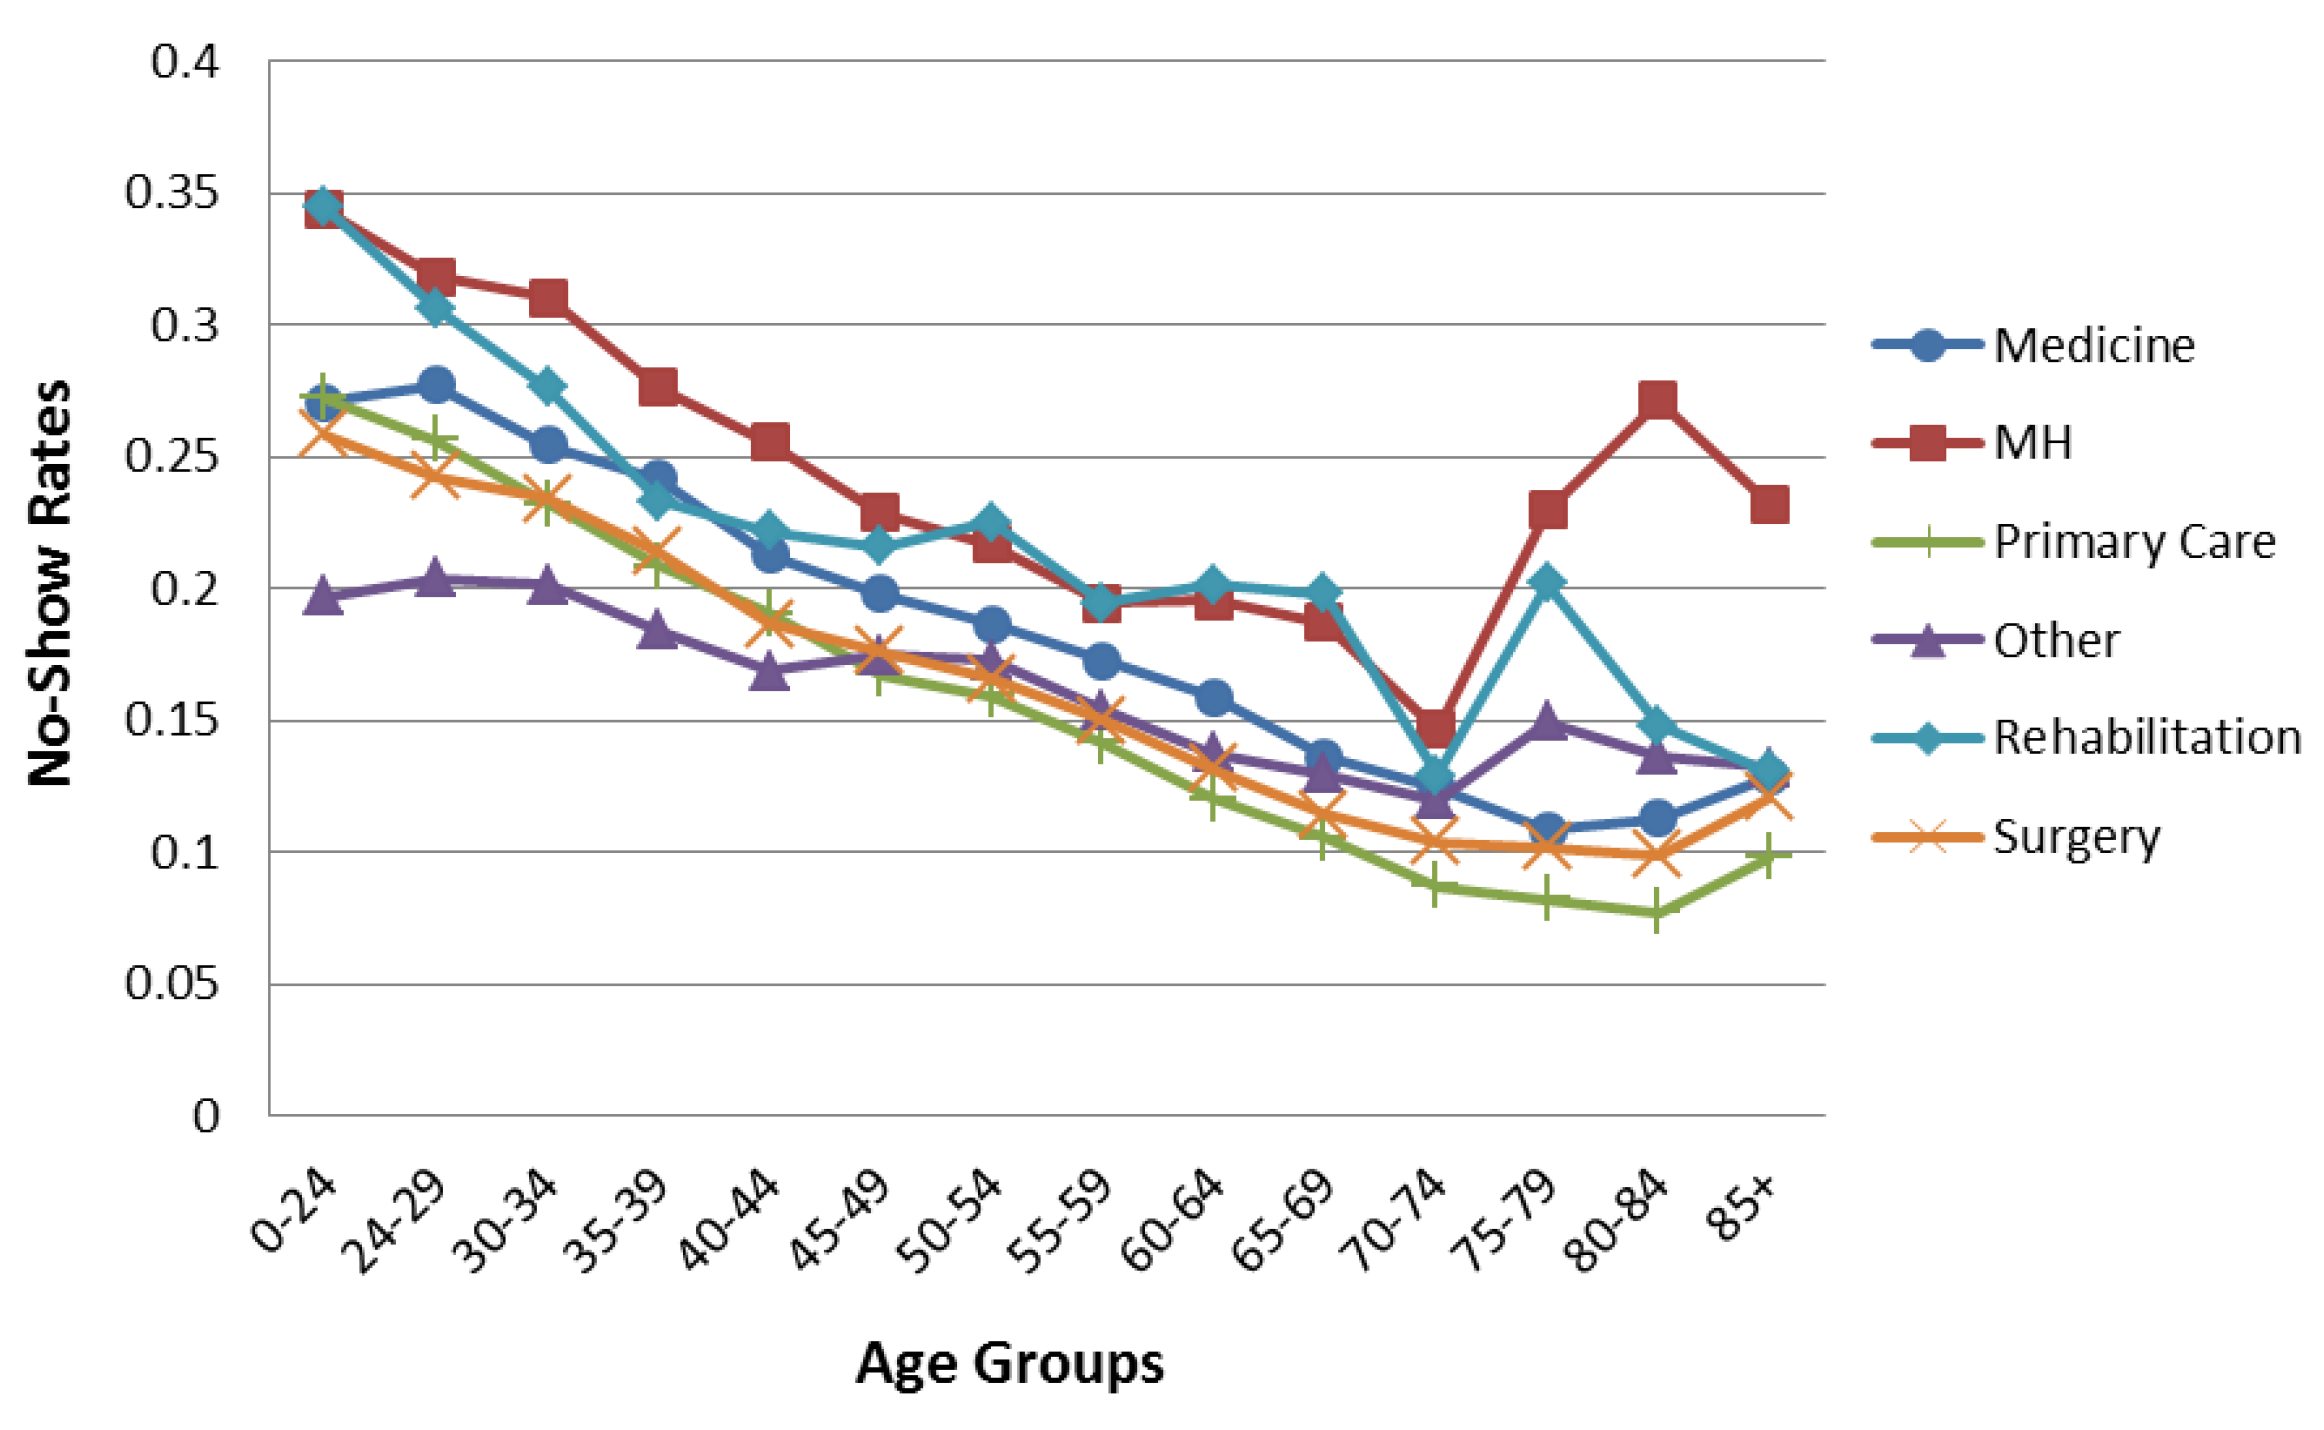
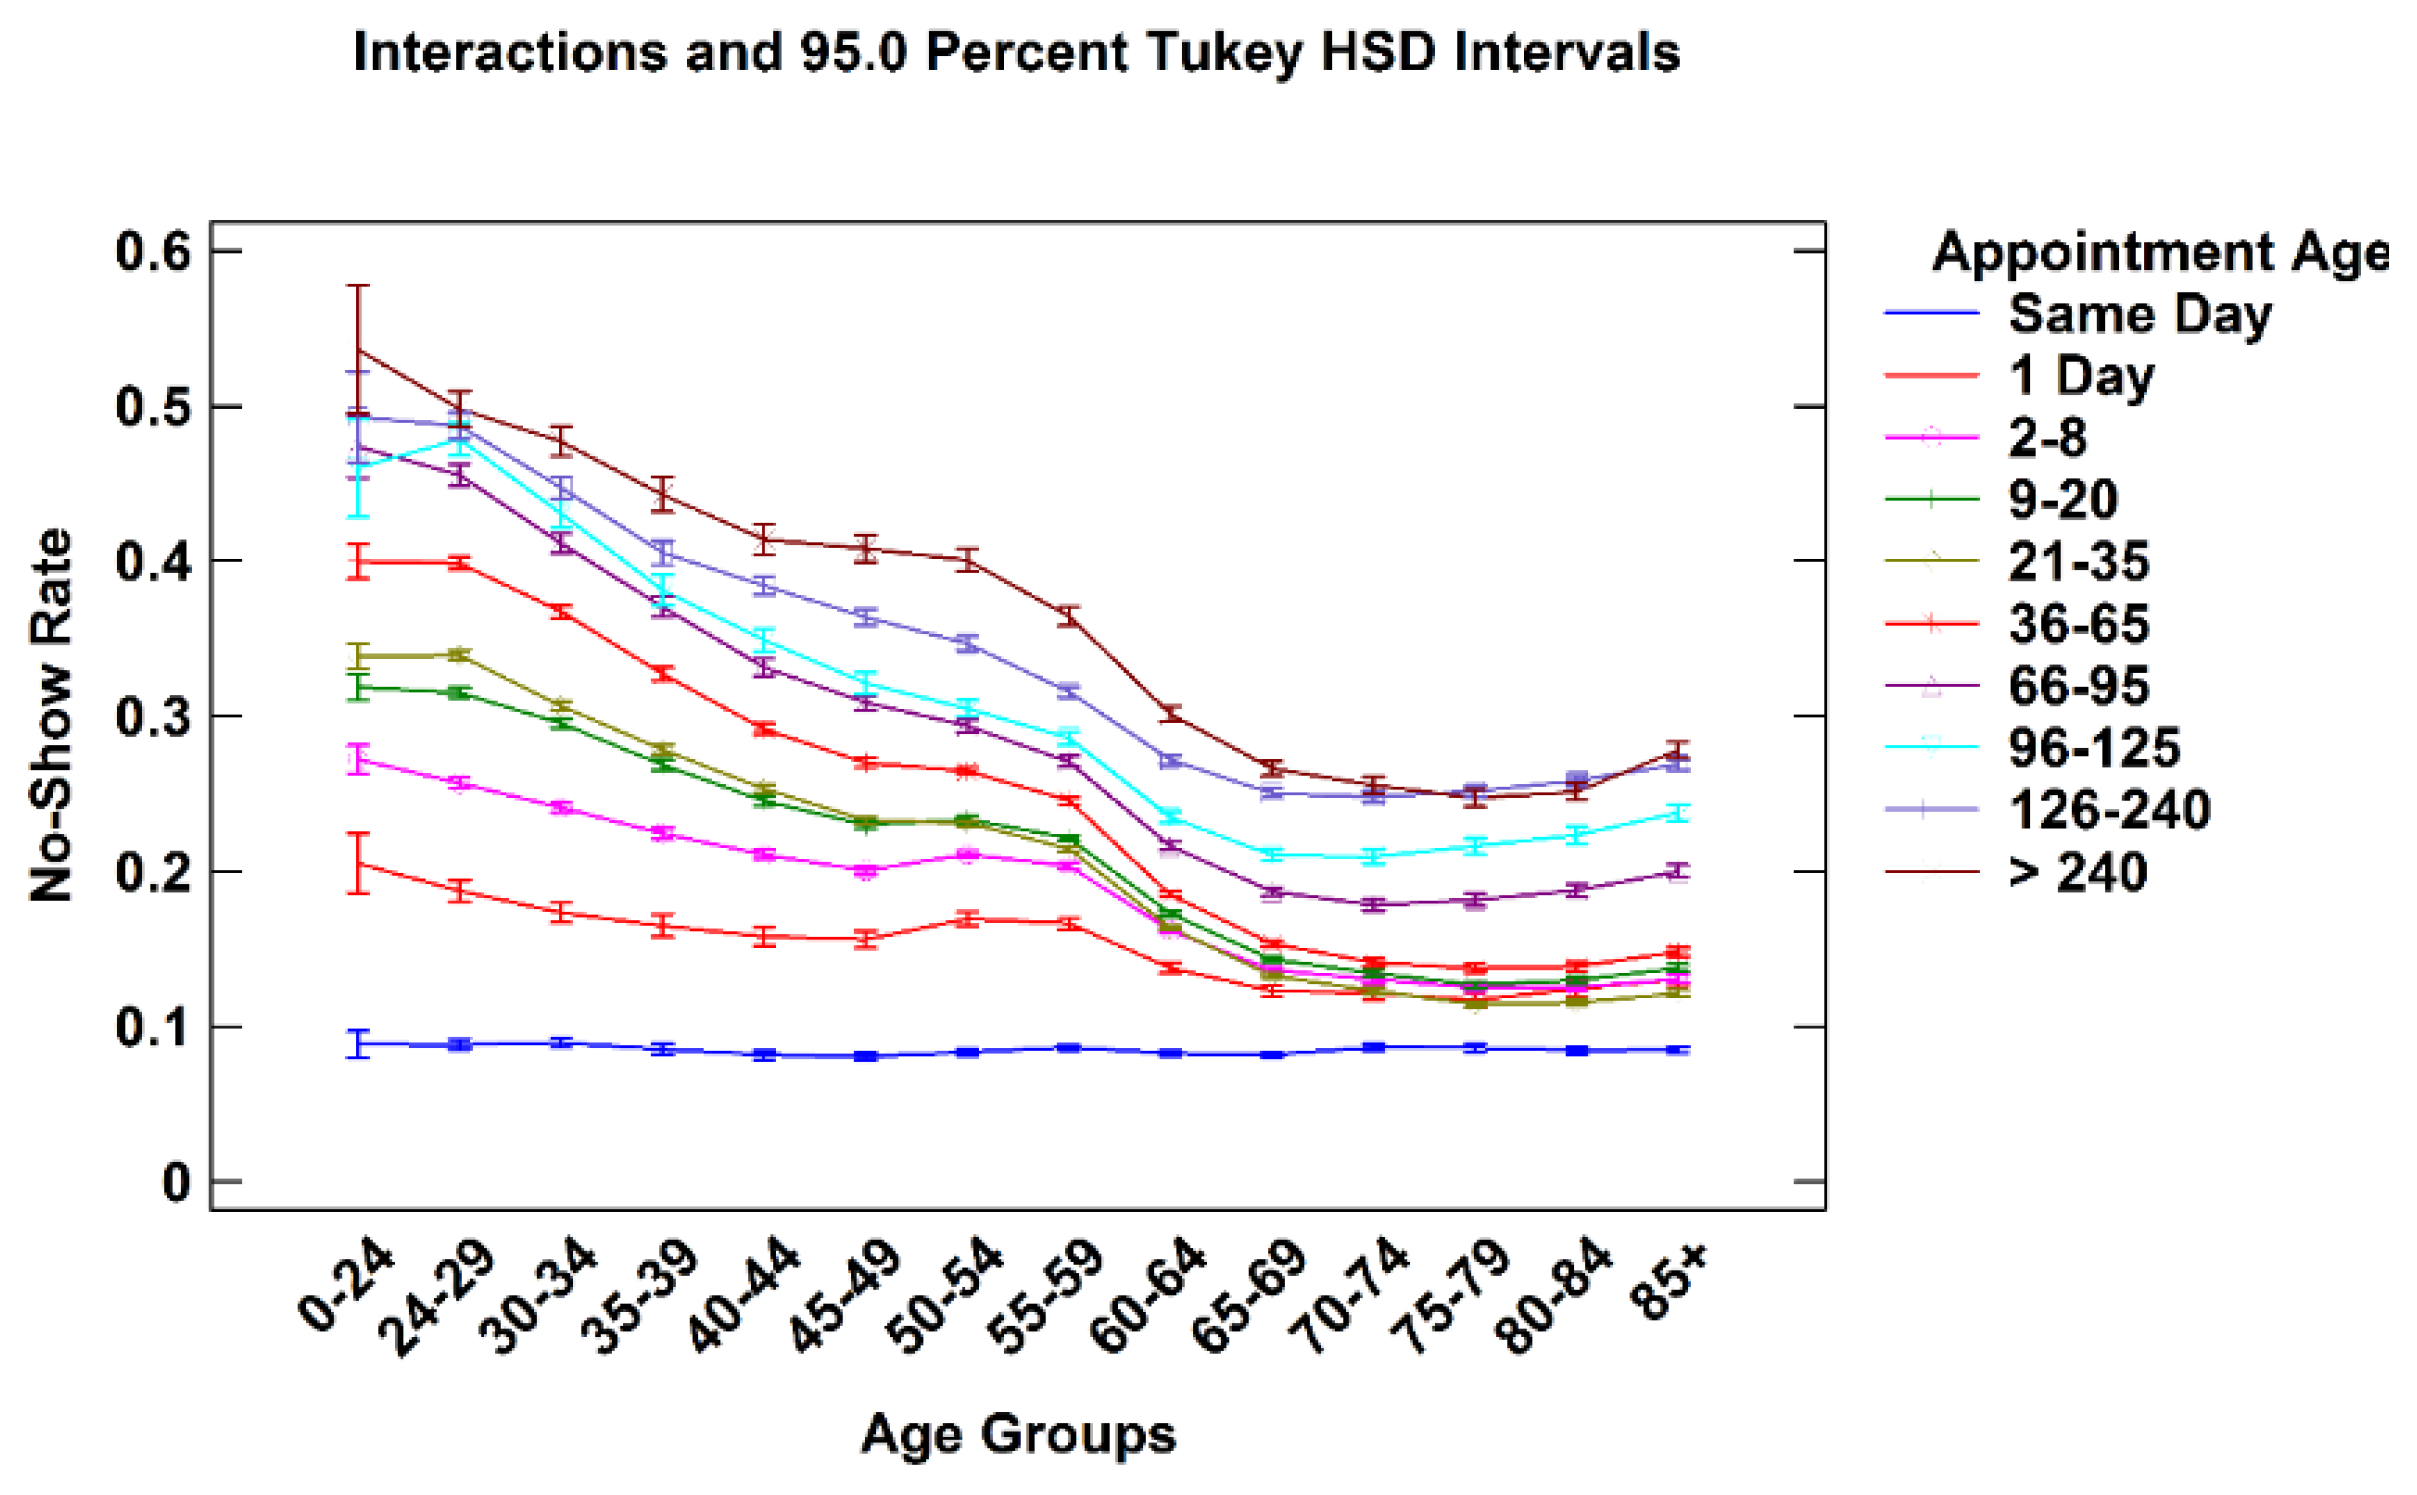
3.2. Appointment Age

| Age Group | Medicine | Mental Health | Primary Care | Other | Rehabilitation | Surgery | ||||||
|---|---|---|---|---|---|---|---|---|---|---|---|---|
| Female | Male | Female | Male | Female | Male | Female | Male | Female | Male | Female | Male | |
| 0–24 | 1754 | 6586 | 3018 | 11,944 | 4321 | 11,381 | 7542 | 21,041 | 1112 | 7302 | 1926 | 5689 |
| 24–29 | 12,304 | 45,206 | 20,822 | 101,700 | 29,131 | 89,165 | 46,589 | 170,995 | 5696 | 47,220 | 16,617 | 39,924 |
| 30–34 | 17,149 | 57,504 | 29,122 | 126,908 | 36,642 | 107,362 | 60,358 | 197,751 | 7532 | 41,984 | 22,955 | 52,057 |
| 35–39 | 16,136 | 44,540 | 26,023 | 83,089 | 29,326 | 81,285 | 49,719 | 144,080 | 6533 | 28,317 | 19,914 | 42,491 |
| 40–44 | 22,920 | 81,845 | 33,637 | 134,158 | 37,011 | 132,791 | 68,282 | 229,308 | 9208 | 41,837 | 28,068 | 77,460 |
| 45–49 | 27,562 | 113,670 | 41,140 | 167,283 | 44,297 | 178,699 | 83,010 | 299,944 | 11,078 | 51,745 | 34,812 | 111,981 |
| 50–54 | 39,846 | 199,999 | 51,901 | 284,787 | 61,392 | 301,947 | 112,290 | 532,357 | 15,846 | 77,383 | 47,026 | 203,458 |
| 55–59 | 43,107 | 326,969 | 47,007 | 352,886 | 64,995 | 444,169 | 118,507 | 787,947 | 16,129 | 106,456 | 49,915 | 321,006 |
| 60–64 | 36,171 | 706,403 | 31,860 | 587,188 | 58,037 | 832,968 | 96,595 | 1,416,052 | 13,284 | 196,063 | 41,373 | 640,178 |
| 65–69 | 18,416 | 753,579 | 10,289 | 394,470 | 26,057 | 849,214 | 43,823 | 1,416,132 | 6076 | 203,456 | 20,009 | 695,075 |
| 70–74 | 6624 | 360,514 | 2256 | 89,101 | 8834 | 427,438 | 15,107 | 675,099 | 1817 | 106,472 | 7679 | 343,083 |
| 75–79 | 5765 | 295,694 | 1372 | 47,478 | 6874 | 398,430 | 10,945 | 599,550 | 1493 | 107,521 | 5775 | 298,107 |
| 80–84 | 3440 | 239,636 | 1327 | 49,929 | 5168 | 369,757 | 8965 | 530,041 | 1219 | 121,908 | 4322 | 264,528 |
| 85+ | 7613 | 244,755 | 1991 | 52,690 | 12,754 | 423,617 | 18,113 | 587,055 | 4364 | 171,569 | 8056 | 293,670 |
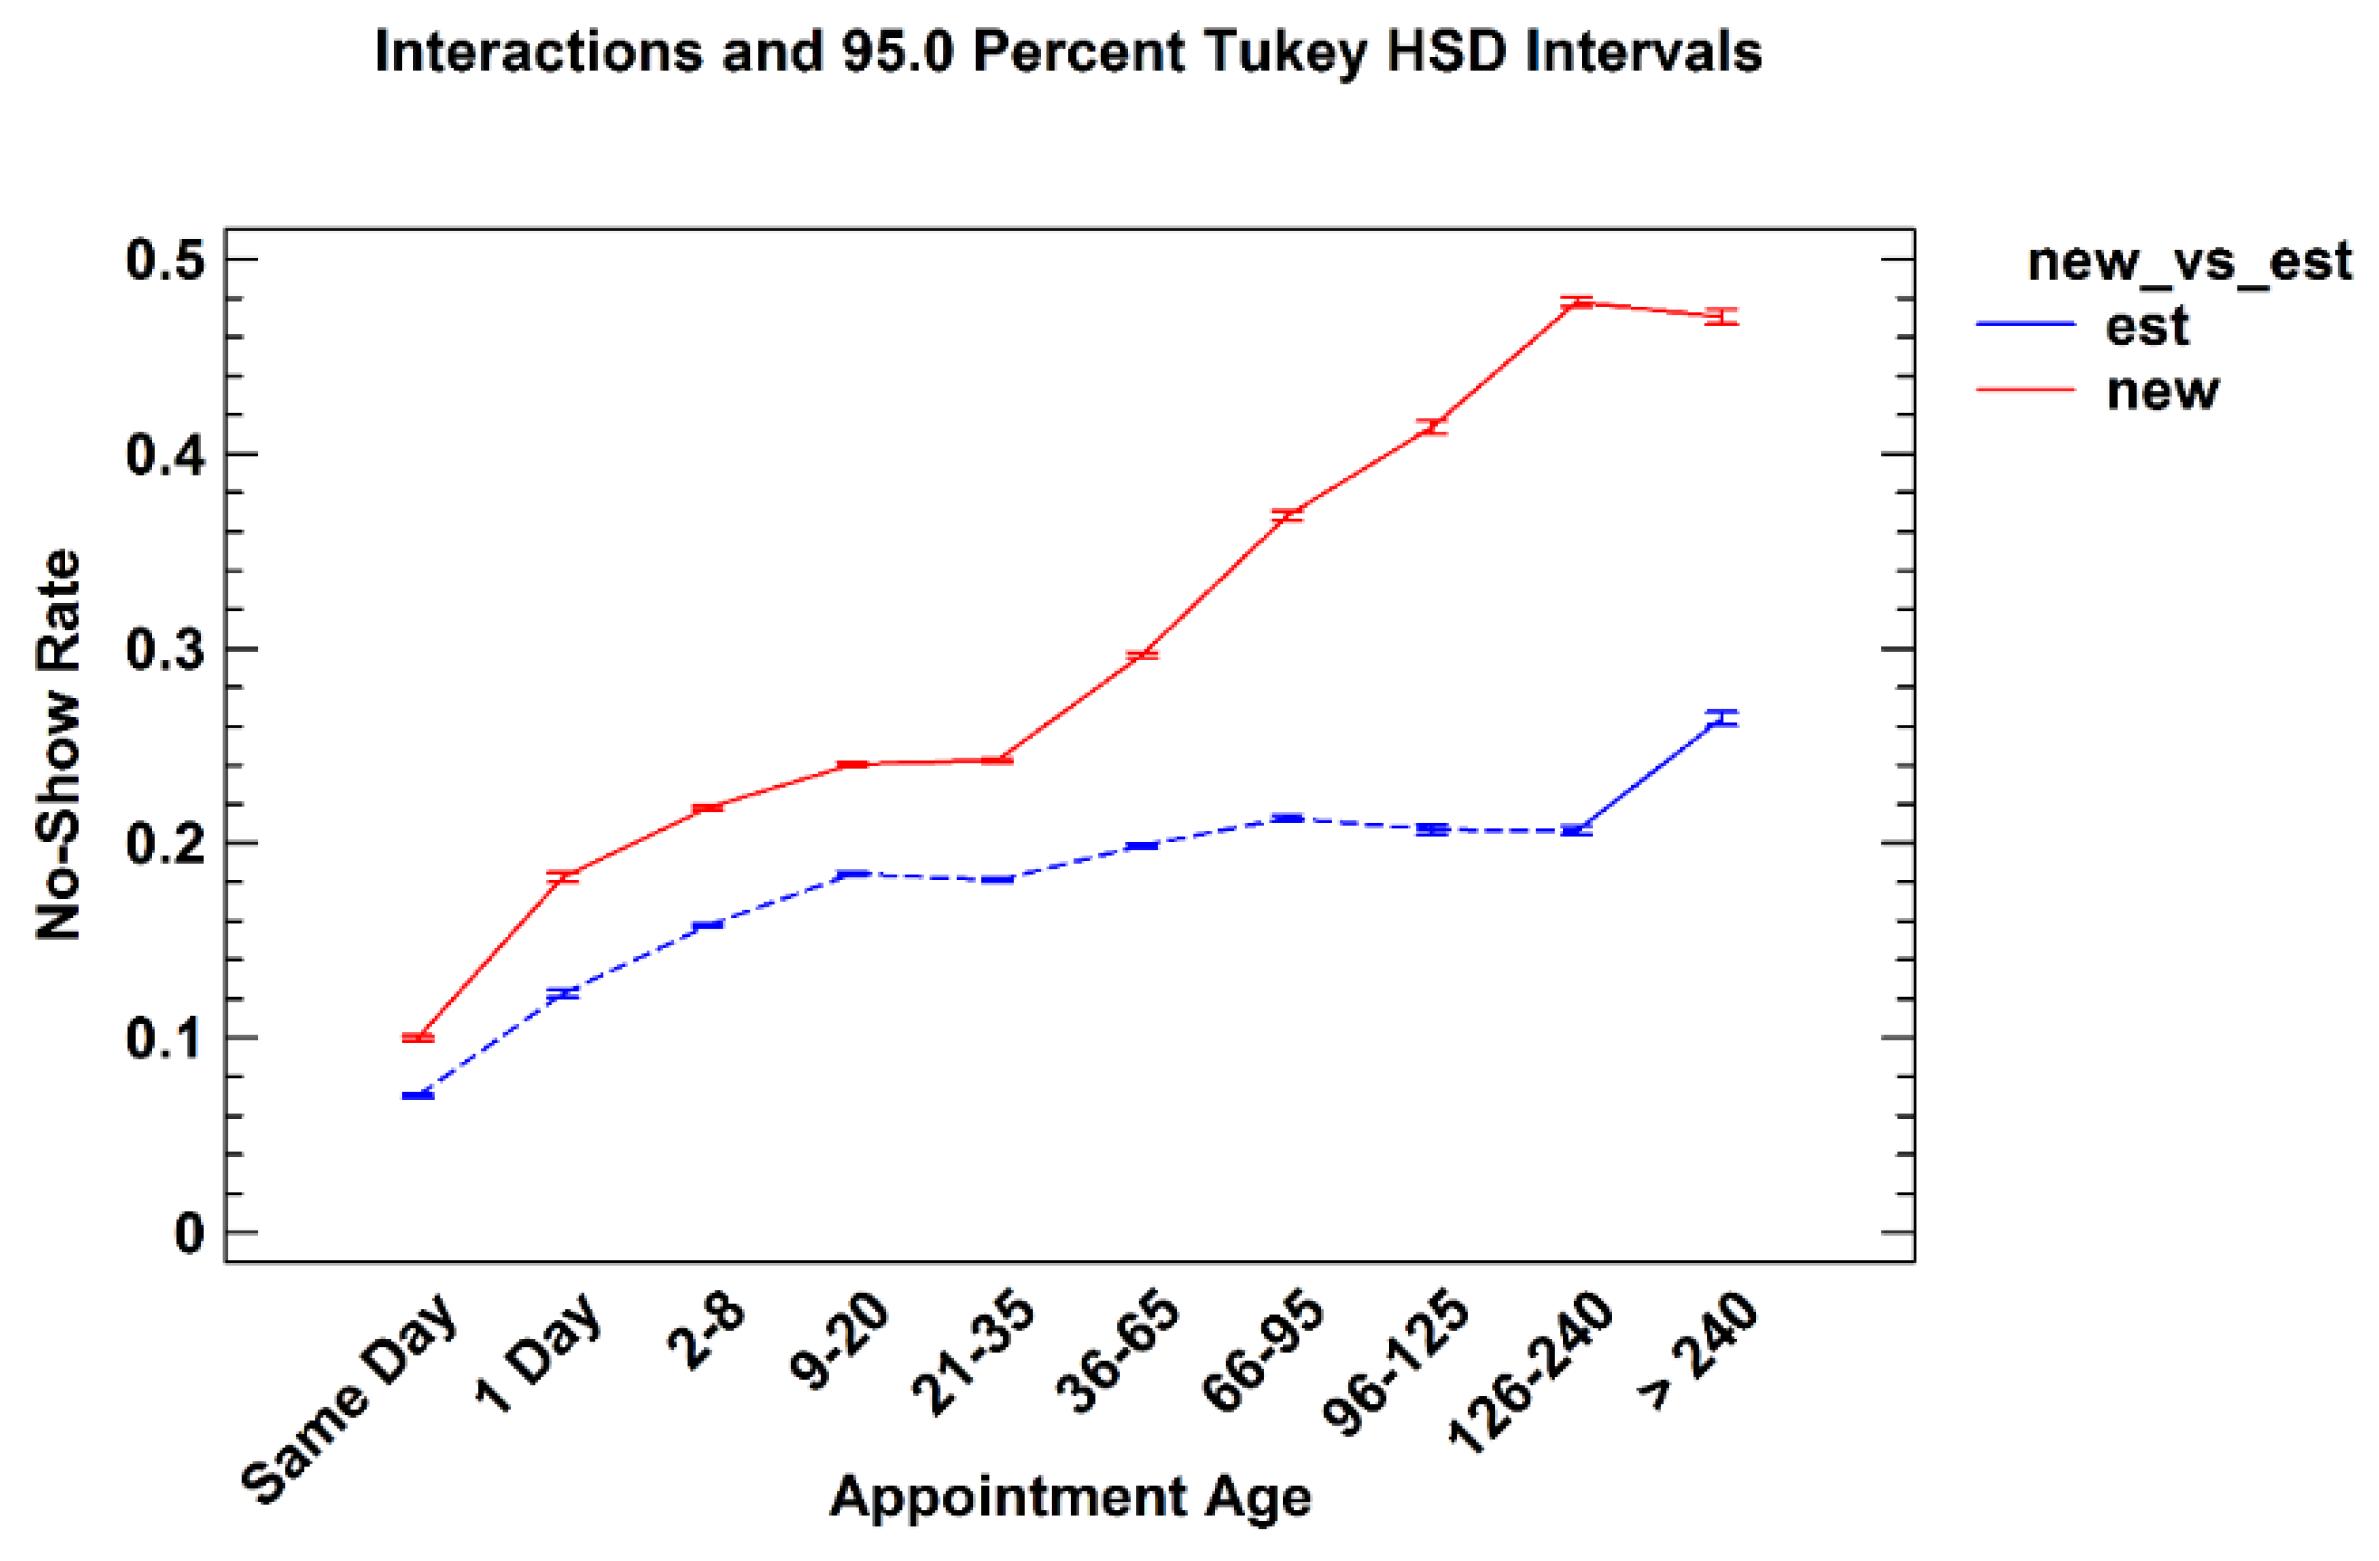
| Appt Age (Day) | Female | Male | Total | |||
|---|---|---|---|---|---|---|
| Number of Appts | % Total of Female Appts | Number of Appts | % Total of Male Appts | Number of Appts | % of Total Appts | |
| Same Day | 395,364 | 18.51% | 3,689,640 | 16.1% | 4,085,004 | 16.31% |
| 1 | 84,264 | 3.95% | 814,249 | 3.55% | 898,513 | 3.59% |
| 2–8 | 313,590 | 14.68% | 3,128,648 | 13.65% | 3,442,238 | 13.74% |
| 9–20 | 364,528 | 17.07% | 3,842,965 | 16.77% | 4,207,493 | 16.8% |
| 21–35 | 417,340 | 19.54% | 4,686,005 | 20.45% | 5,103,345 | 20.37% |
| 36–65 | 268,719 | 12.58% | 2,906,762 | 12.69% | 3,175,481 | 12.68% |
| 66–95 | 113,174 | 5.3% | 1,258,943 | 5.49% | 1,372,117 | 5.48% |
| 96–125 | 54,656 | 2.56% | 726,417 | 3.17% | 781,073 | 3.12% |
| 126–240 | 86,278 | 4.04% | 1,364,690 | 5.96% | 1,450,968 | 5.79% |
| >240 | 37,560 | 1.76% | 496,253 | 2.17% | 533,813 | 2.13% |
| Total | 2,135,473 | 22,914,572 | 25,050,045 | |||
| Appt Age (Day) | Medicine | Mental Health | Other | Primary Care | Rehabilitation | Surgery | Total | |||||||
|---|---|---|---|---|---|---|---|---|---|---|---|---|---|---|
| Number of Appts | % Total Medicine appts | Number of Appts | % Total Number of MH Appts | Number of Appts | % Total Number of Other Appts | Number of Appts | % Total Number of PC Appts | Number of Appts | % Total Number of Rehab Appts | Number of Appts | % Total Number of Surgery Appts | Number of Appts | % Total Number of All Appts | |
| Same Day | 441,431 | 11.8% | 413,203 | 14.8% | 1,878,555 | 22.5% | 717,933 | 14.2% | 262,853 | 18.6% | 371,093 | 10.0% | 4,085,068 | 16.3% |
| 1 | 111,423 | 3.0% | 86,504 | 3.1% | 297,810 | 3.6% | 202,417 | 4.0% | 73,192 | 5.2% | 127,180 | 3.4% | 898,526 | 3.6% |
| 2–8 | 472,527 | 12.6% | 449,746 | 16.1% | 1,038,066 | 12.4% | 641,199 | 12.6% | 299,801 | 21.3% | 540,970 | 14.6% | 3,442,309 | 13.7% |
| 9–20 | 664,157 | 17.8% | 511,787 | 18.4% | 1,271,704 | 15.2% | 762,196 | 15.0% | 307,757 | 21.8% | 689,969 | 18.7% | 4,207,570 | 16.8% |
| 21–35 | 857,743 | 23.0% | 566,629 | 20.3% | 1,393,564 | 16.7% | 1,124,022 | 22.2% | 302,548 | 21.4% | 858,938 | 23.2% | 5,103,444 | 20.4% |
| 36–65 | 571,111 | 15.3% | 441,443 | 15.8% | 838,245 | 10.0% | 690,110 | 13.6% | 127,235 | 9.0% | 507,387 | 13.7% | 3,175,531 | 12.7% |
| 66–95 | 229,025 | 6.1% | 190,068 | 6.8% | 422,612 | 5.1% | 257,315 | 5.1% | 24,462 | 1.7% | 248,664 | 6.7% | 1,372,146 | 5.5% |
| 96–125 | 141,963 | 3.8% | 80,148 | 2.9% | 253,607 | 3.0% | 164,523 | 3.2% | 6,332 | 0.4% | 134,508 | 3.6% | 781,081 | 3.1% |
| 126–240 | 201,667 | 5.4% | 43,991 | 1.6% | 658,778 | 7.9% | 380,146 | 7.5% | 3,858 | 0.3% | 162,545 | 4.4% | 1,450,985 | 5.8% |
| >240 | 44,785 | 1.2% | 1,925 | 0.1% | 295,111 | 3.5% | 133,339 | 2.6% | 2,681 | 0.2% | 55,978 | 1.5% | 533,819 | 2.1% |
| Total | 3,735,832 | 2,785,444 | 8,348,052 | 5,073,200 | 1,410,719 | 3,697,232 | 25,050,479 | |||||||
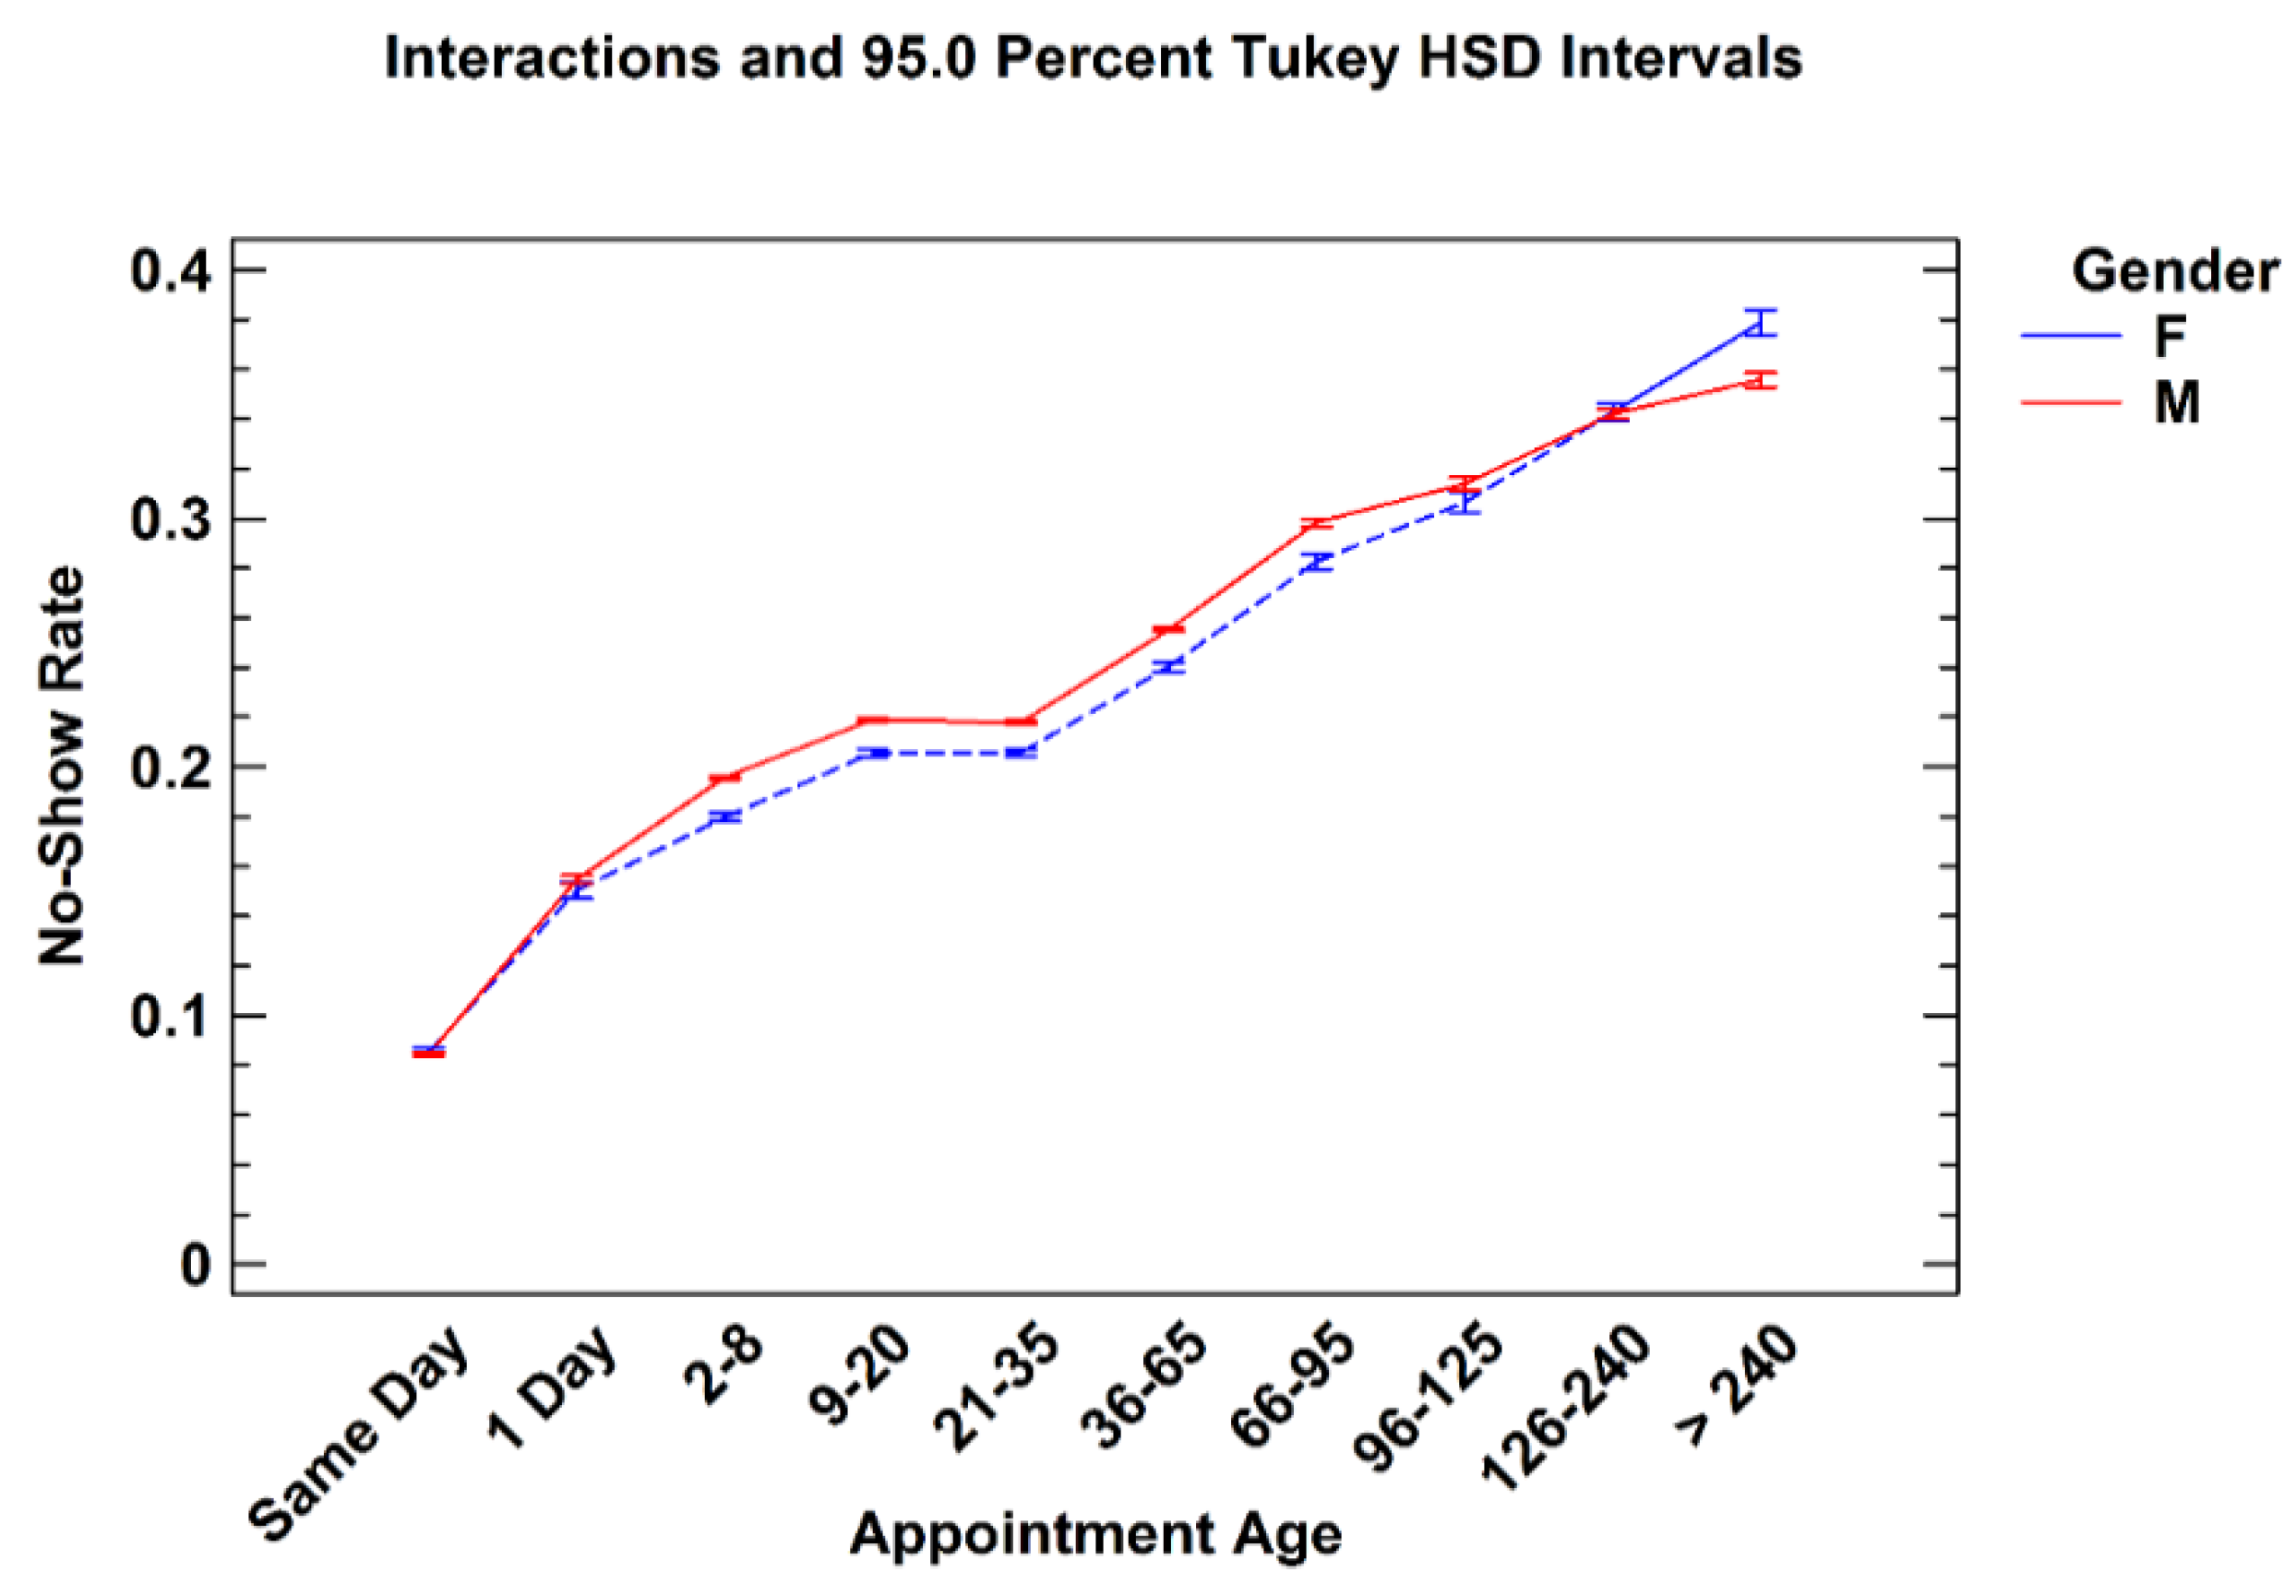
3.2.1. New versus Established Patients

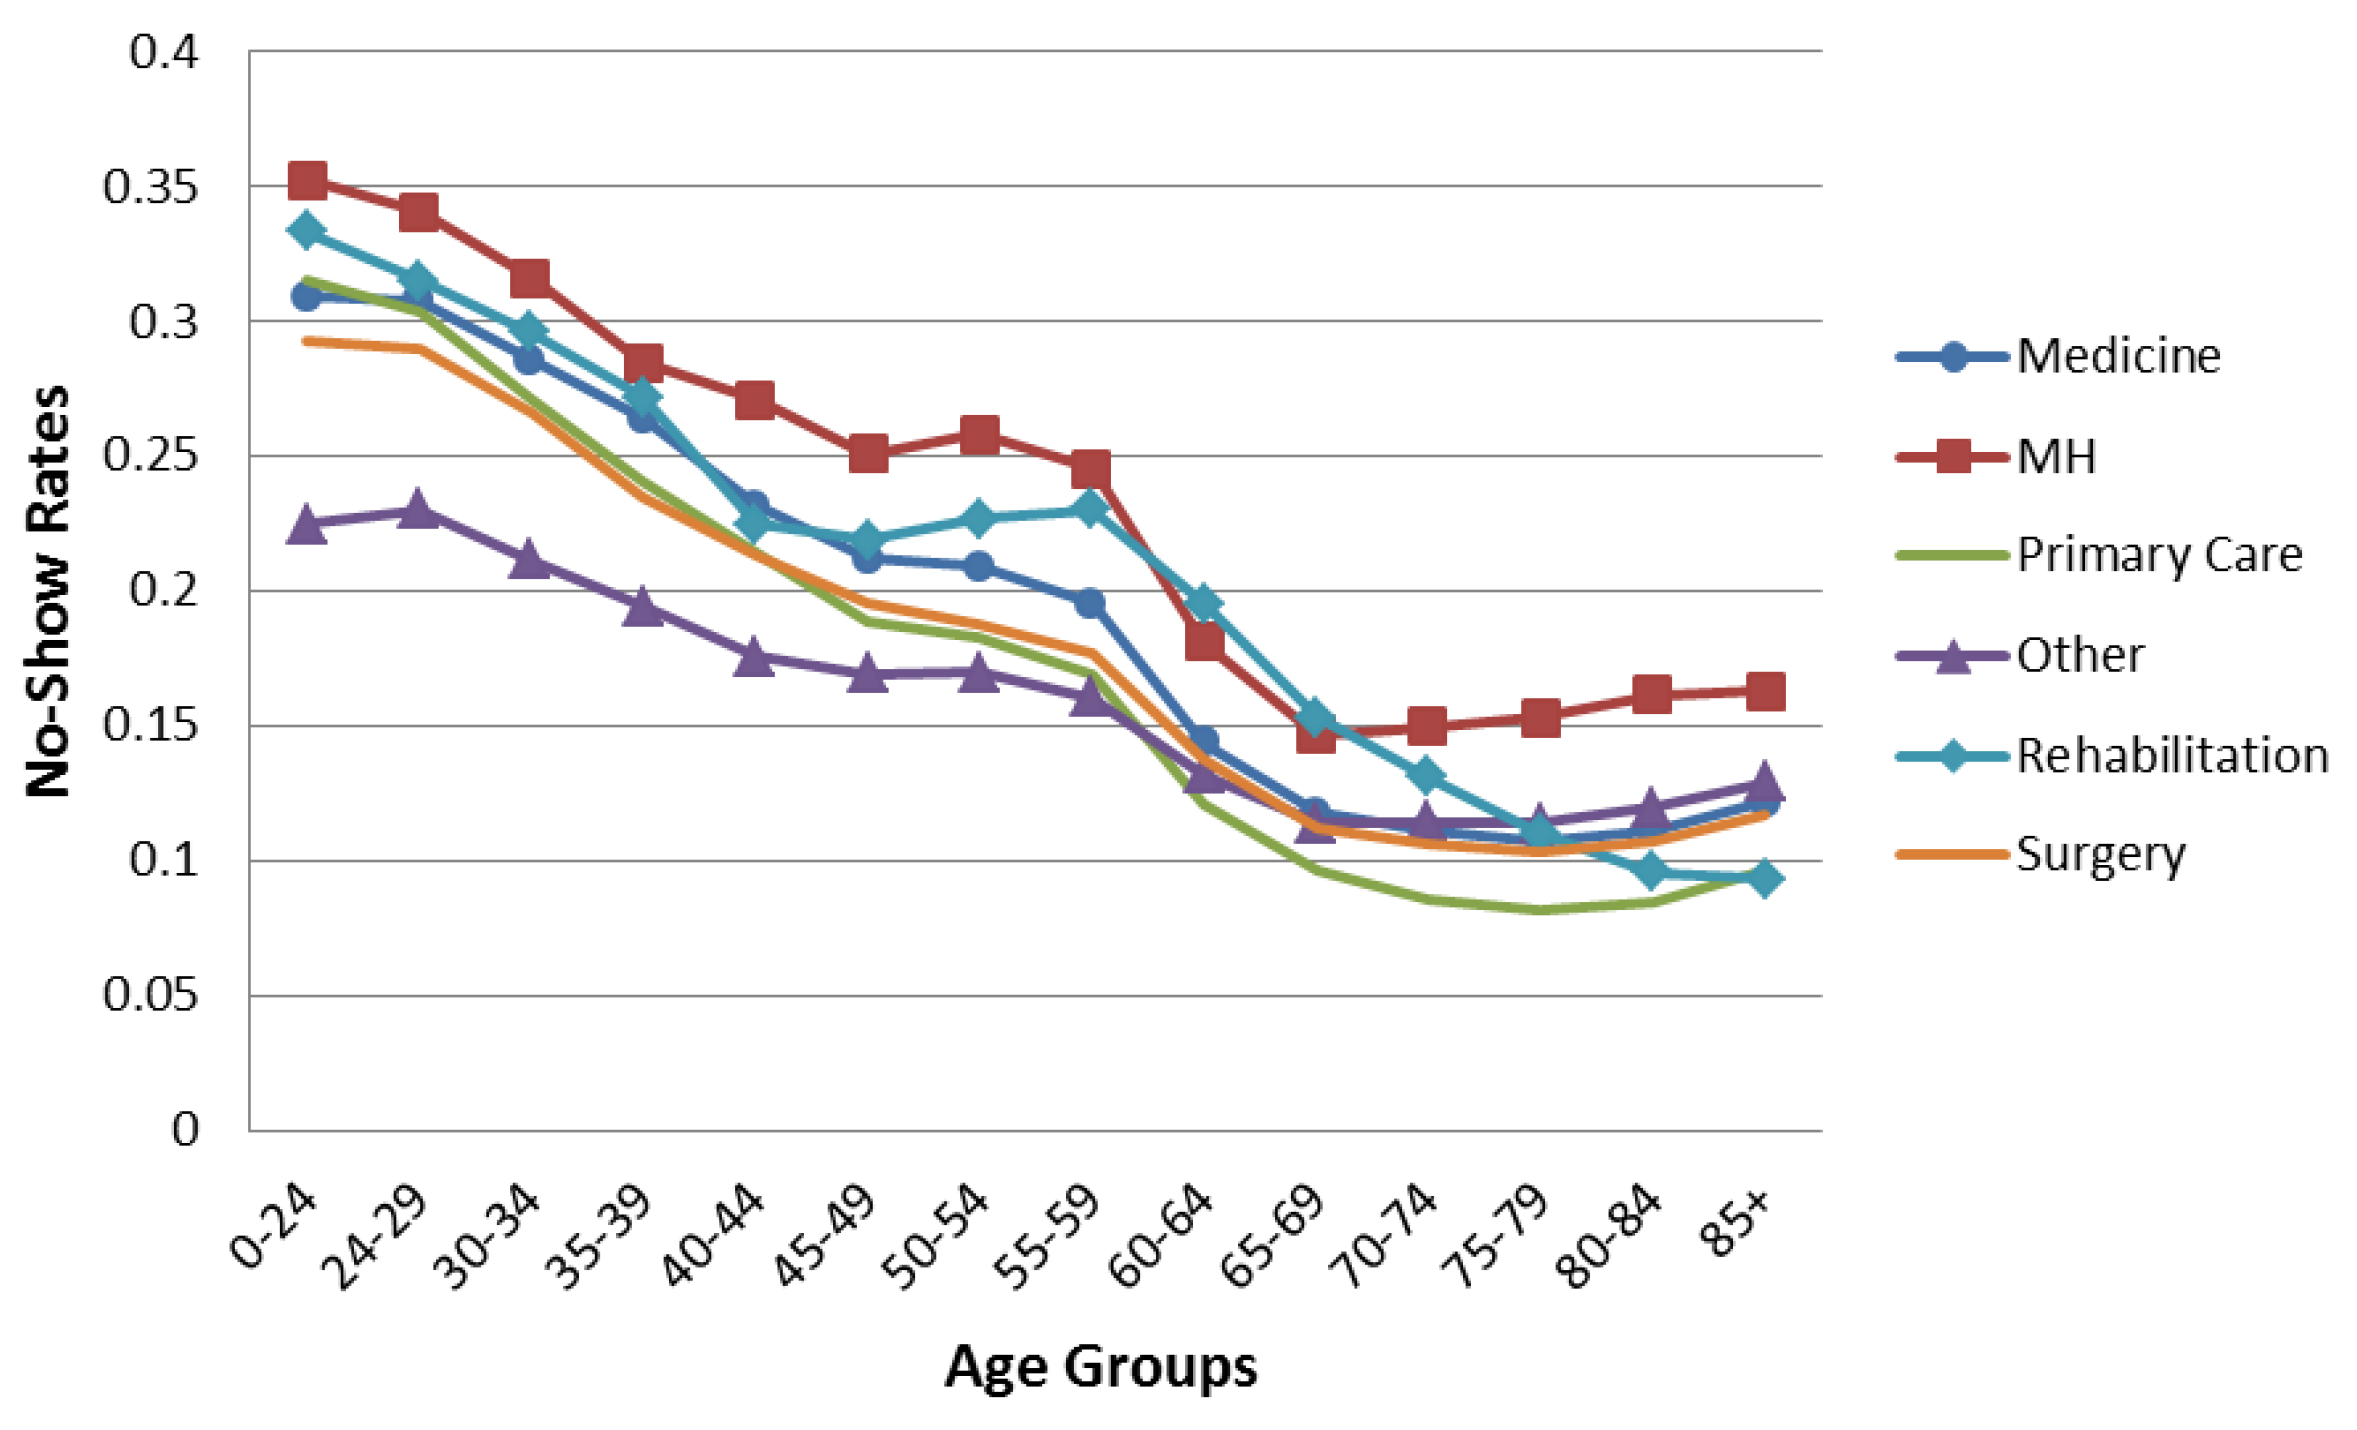
3.2.2. Patient Age vs. Appointment Age

4. Conclusions
Acknowledgments
Author Contributions
Conflicts of Interest
Disclaimer
Appendix
| Medicine | Nutrition/Dietetics | Radiation Therapy | General Internal Medicine | Allergy Immunology |
| Cardiology | Dermatology | Endocrinology | ||
| Diabetes | Gastroenterology | Hematology | ||
| Oncology | Hypertension | Infectious disease | ||
| Pacemaker | Pulmonary | Renal | ||
| Rheumatology | Neurology | Oncology | ||
| Anti-Coagulation Clinic | Geriatrics | Alzheimer's/Dementia Clinic | ||
| Endoscopy | Chemotherapy | Cardiac Catheterization | ||
| Cardiac Stress Test | Hepatology Clinic | Sleep Medicine | ||
| Mental Health | Mental Health Clinic | Psychiatry | Psychology | Substance Use Disorder |
| Other | Pulmonary Function | X-ray | EEG | EKG |
| Laboratory | Nuclear Medicine | Ultrasound | ||
| Respiratory Therapy | Home Treatment/Services | Health Screening | ||
| Residential Care | Social Work Service | Topography | ||
| Emergency Dept | Urgent Care Unit | Sleep Study | ||
| Computerized Tomography | MRI | Interventional Radiography | ||
| Magnetoencephalography | Brachytherapy Treatment | Alternative Medicine | ||
| Clinical Pharmacy | Dental | Care/Case Manager | ||
| Recreation Therapy Service | Blind Rehab | Parkinson's Disease Service | ||
| Obstetrics | Genomic Care | Pediatrics | ||
| Family Practice | Epilepsy | ALSs Center | ||
| Hospice Care | Amputation Clinic | Cast clinic | ||
| Chiropractic Care | Low Vision care | Transplant | ||
| Research | Bronchoscopy | Hemodialysis | ||
| Primary Care | Primary Care/Medicine | |||
| Rehabilitation | Enterostomal Care | Radionuclide Therapy | Polytrauma | Physical Medicine Audiology |
| Speech-Language Pathology | Physical Therapy | Occupational Therapy | ||
| Spinal Cord Injury | Electromyogram | Kinesiotherapy | ||
| Intermed Low Vision Care | ||||
| Surgery | General Surgery | Cardiac Surgery | ENT | Gynecology |
| Hand surgery | Neurosurgery | Ophthalmology | ||
| Optometry | Orthopedics | Plastic surgery | ||
| Podiatry | Proctology | Thoracic Surgery | ||
| Urology | Vascular Surgery | Dialysis | ||
| Prosthetics/Orthotics | Anesthesia Surgical Consult | Pain Clinic | ||
References
- Tuso, P.J.; Murtishaw, K.; Tadros, W. The easy access program: A way to reduce patient no-show rate, decrease add-ons to primary care schedules, and improve patient satisfaction. Perm. J. 1999, 3, 68–71. [Google Scholar]
- Perron, N.J.; Dao, M.D.; Kossovsky, M.P.; Miserez, V.; Chuard, C.; Calmy, A.; Gaspoz, J.M. Reduction of missed appointments at an urban primary care clinic: A randomised controlled study. BMC Fam. Pract. 2010, 11. [Google Scholar] [CrossRef]
- Atun, A.R.; Sittampalam, S.R.; Mohan, A. Uses and Benefits of SMS in Healthcare Delivery; Centre for Health Management, Imperial College: London, UK, 2005; Volume 21. [Google Scholar]
- Turkcan, A.; Nuti, L.; DeLaurentis, P.C.; Tian, Z.; Daggy, J.; Zhang, L.; Lawley, M.; Sands, L. No-show modeling for adult ambulatory clinics. In Handbook of Healthcare Operations Management; Denton, B.T., Ed.; Springer: New York, NY, USA, 2013; Volume 184, pp. 251–288. [Google Scholar]
- Goldman, L.; Freidin, R.; Cook, E.F.; Eigner, J.; Grich, P. A multivariate approach to the prediction of no-show behavior in a primary care center. Arch. Intern. Med. 1982, 142, 563–567. [Google Scholar] [CrossRef] [PubMed]
- Hixon, A.L.; Chapman, R.W.; Nuovo, J. Failure to keep clinic appointments: Implications for residency education and productivity. Fam. Med. 1999, 31, 627–630. [Google Scholar] [PubMed]
- Lacy, N.L.; Paulman, A.; Reute, M.D.; Lovejoy, B. Why we don’t come: Patient perceptions of no-shows. Ann. Fam. Med. 2004, 2, 541–545. [Google Scholar] [CrossRef] [PubMed]
- Moore, C.G.; Wilson-Witherspoon, P.; Probst, J.C. Time and money: Effects of no-shows at a family practice residency clinic. Fam. Med. 2001, 33, 522–527. [Google Scholar] [PubMed]
- Gupta, D.; Denton, B. Appointment scheduling in health care: Challenges and opportunities. IIE Trans. 2008, 40, 800–819. [Google Scholar] [CrossRef]
- Kopach, R.; DeLaurentis, P.C.; Lawley, M.; Muthuraman, K.; Ozen, L.; Rardin, R.; Wan, H.; Intrevado, P.; Qu, X.; Willis, D. Effects of clinical characteristics on successful open access scheduling. Health Care Manag. Sci. 2007, 10, 111–124. [Google Scholar] [CrossRef] [PubMed]
- Daggy, J.; Lawley, M.; Willis, D.; Thayer, D.; Suelzer, C.; DeLaurentis, P.C.; Turkcan, A.; Chakraborty, S.; Sands, L. Using no-show modeling to improve clinic performance. Health Inform. J. 2010, 16, 246–259. [Google Scholar] [CrossRef] [PubMed]
- Nguyen, D.L.; DeJesus, R.S.; Wieland, M.L. Missed appointments in resident continuity clinic: Patient characteristics and health care outcomes. J. Grad. Med. Educ. 2011, 3, 350–355. [Google Scholar] [CrossRef] [PubMed]
- Johnson, B.J.; Mold, J.W.; Pontius, J.M. Reduction and management of no-shows by family medicine residency practice exemplars. Ann. Fam. Med. 2007, 5, 534–539. [Google Scholar] [CrossRef] [PubMed]
- Bowser, D.M.; Utz, S.; Glick, D.; Harmon, R. A systematic review of the relationship of diabetes mellitus, depression, and missed appointments in a low-income uninsured population. Arch. Psychiatr. Nurs. 2010, 24, 317–329. [Google Scholar] [CrossRef] [PubMed]
- Nuti, L.A.; Lawley, M.; Turkcan, A.; Tian, Z.; Zhang, L.; Chang, K.; Willis, D.R.; Sands, L.P. No-shows to primary care appointments: Subsequent acute care utilization among diabetic patients. BMC Health Serv. Res. 2012, 12. [Google Scholar] [CrossRef] [PubMed]
- Schectman, J.M.; Schorling, J.; Voss, J.D. Appointment adherence and disparities in outcomes among patients with diabetes. J. Gen. Intern. Med. 2008, 23, 1685–1687. [Google Scholar] [CrossRef] [PubMed]
- United States Department of Veterans Affairs. Audit of Veterans Health Administration's Efforts to Reduce Unused Outpatient Appointments; Report Number 08-00879-36; U.S. Department of Veterans Affairs Office of Inspector General: Washington, DC, USA, 2008. [Google Scholar]
- United States Department of Veterans Affairs. Focusing on the Nation’s Priorities; Department of Veterans Affairs: Washington, DC, USA, 2007. Available online: http://www.gpoaccess.gov/usbudget/fy07/pdf/budget/veterans.pdf (accessed on 6 July 2015).
- D’Avolio, L.W. Electronic Medical Records at a crossroads: Impetus for change or missed opportunity? JAMA 2009, 302, 1109–1111. [Google Scholar] [CrossRef] [PubMed]
- Perron, N.J.; Dao, M.D.; Righini, N.C.; Humair, J.P.; Broers, B.; Narring, F.; Haller, D.M.; Gaspoz, J.M. Text-messaging versus telephone reminders to reduce missed appointments in an academic primary care clinic: A randomized controlled trial. BMC Health Serv. Res. 2013, 13. [Google Scholar] [CrossRef]
- Parikh, A.; Gupta, K.; Wilson, A.C.; Fields, K.; Cosgrove, N.M.; Kostis, J.B. The effectiveness of outpatient appointment reminder systems in reducing no-show rates. Am. J. Med. 2010, 123, 542–548. [Google Scholar] [CrossRef] [PubMed]
- Woodcock, E.W. Mastering Patient Flow: Using Lean Thinking to Improve Your Practice Operations, 3rd ed.; Medical Group Management Association: Englewood, CO, USA, 2007. [Google Scholar]
- Liu, N.; Ziya, S.; Kulkarni, V.G. Dynamic scheduling of outpatient appointments under patient no-shows and cancellations. Manuf. Serv. Oper. Manag. 2010, 12, 347–364. [Google Scholar] [CrossRef]
- Luo, J.; Kulkarni, V.G.; Ziya, S. Appointment scheduling under patient no-shows and service interruptions. Manuf. Serv. Oper. Manag. 2012, 14, 670–684. [Google Scholar] [CrossRef]
- George, A.; Rubin, G. Non-attendance in general practice: A systematic review and its implications for access to primary health care. Fam Pract. 2003, 20, 178–184. [Google Scholar] [CrossRef] [PubMed]
- Samorani, M.; LaGanga, L. Outpatient appointment scheduling given individual day-dependent no-show predictions. Eur. J. Oper. Res. 2015, 240, 245–257. [Google Scholar] [CrossRef]
- Bagalman, E. Suicide Prevention Efforts of the Veterans Health Administration; Report Number 7-5700. R42340; Congressional Research Service: Washington, DC, USA, 2013. [Google Scholar]
- Mitchell, A.J.; Selems, T. Why don’t patients attend their appointments? Maintaining engagement with psychiatric services. Adv. Psychiatr. Treat. 2007, 13, 423–434. [Google Scholar] [CrossRef]
- United States Department of Veterans Affairs. Interventions to Improve Veteran’s Access to Care: A Systematic Review of the Literature; U.S. Department of Veterans Affairs, Health Services Research and Development Service, Evidence-Based Synthesis Program: Washington, DC, USA, 2011. [Google Scholar]
- Weinberger, M.; Oddone, E.Z.; Henderson, W.G. Does increased access to primary care reduce hospital readmissions? Veterans Affairs Cooperative Study Group on Primary Care and Hospital Readmission. N. Engl. J. Med. 1996, 334, 1441–1447. [Google Scholar] [CrossRef] [PubMed]
- Gardner, L.I.; Marks, G.; Craw, J.A.; Wilson, T.E.; Drainoni, M.L.; Moore, R.D.; Mugavero, M.J.; Rodriguez, A.E.; Bradley-Springer, L.A.; Holman, S.; et al. Retention in Care Study Group. A low-effort, clinic-wide intervention improves attendance for HIV primary care. Clin. Infect. Dis. 2012, 55, 1124–1134. [Google Scholar] [CrossRef] [PubMed]
- Kirsh, S.R.; Lawrence, R.H.; Aron, D.C. Tailoring an intervention to the context and system redesign related to the intervention: A case study of implementing shared medical appointments for diabetes. Implement. Sci. 2008, 3. [Google Scholar] [CrossRef] [PubMed]
- Giachetti, R.E. A simulation study of interventions to reduce appointment lead-time and patient no-show rate. In Proceedings of the 2008 Winter Simulation Conference, Miami, FL, USA, 7–10 December 2008.
- Kessler, C.S.; Bhandarkar, S.; Casey, P.; Tenner, A. Predicting patient patterns in veterans administration emergency departments. West. J. Emerg. Med. 2011, 12, 204–207. [Google Scholar] [PubMed]
- Bean, A.G.; Talaga, J. Predicting appointment breaking. J. Health Care Mark. 1995, 15, 29–34. [Google Scholar] [PubMed]
- United States Department of Veterans Affairs. VetPOP 2011; Office of Policy and Planning: Washington, DC, USA, 2011. Available online: http://www.va.gov/VETDATA/Veteran_Population.asp (accessed on 6 July 2015).
- Siminoff, L.A.; Hausmann, L.R.M.; Ibrahim, S. Barriers to obtaining diagnostic testing for coronary artery cisease among veterans. Am. J. Public Health. 2008, 98, 2207–2213. [Google Scholar] [CrossRef] [PubMed]
© 2016 by the authors; licensee MDPI, Basel, Switzerland. This article is an open access article distributed under the terms and conditions of the Creative Commons by Attribution (CC-BY) license (http://creativecommons.org/licenses/by/4.0/).
Share and Cite
Davies, M.L.; Goffman, R.M.; May, J.H.; Monte, R.J.; Rodriguez, K.L.; Tjader, Y.C.; Vargas, D.L. Large-Scale No-Show Patterns and Distributions for Clinic Operational Research. Healthcare 2016, 4, 15. https://doi.org/10.3390/healthcare4010015
Davies ML, Goffman RM, May JH, Monte RJ, Rodriguez KL, Tjader YC, Vargas DL. Large-Scale No-Show Patterns and Distributions for Clinic Operational Research. Healthcare. 2016; 4(1):15. https://doi.org/10.3390/healthcare4010015
Chicago/Turabian StyleDavies, Michael L., Rachel M. Goffman, Jerrold H. May, Robert J. Monte, Keri L. Rodriguez, Youxu C. Tjader, and Dominic L. Vargas. 2016. "Large-Scale No-Show Patterns and Distributions for Clinic Operational Research" Healthcare 4, no. 1: 15. https://doi.org/10.3390/healthcare4010015