Comparative Proteomics Analysis of Urine Reveals Down-Regulation of Acute Phase Response Signaling and LXR/RXR Activation Pathways in Prostate Cancer

 ,
, 
Abstract
:
1. Introduction
2. Materials and Methods
2.1. Samples
2.2. Sample Preparation
2.3. 2-D DIGE and Mass Spectrometry Identification
2.4. Label-Free LC-MS/MS Analysis
2.5. Analysis of the Proteomics Data
3. Results
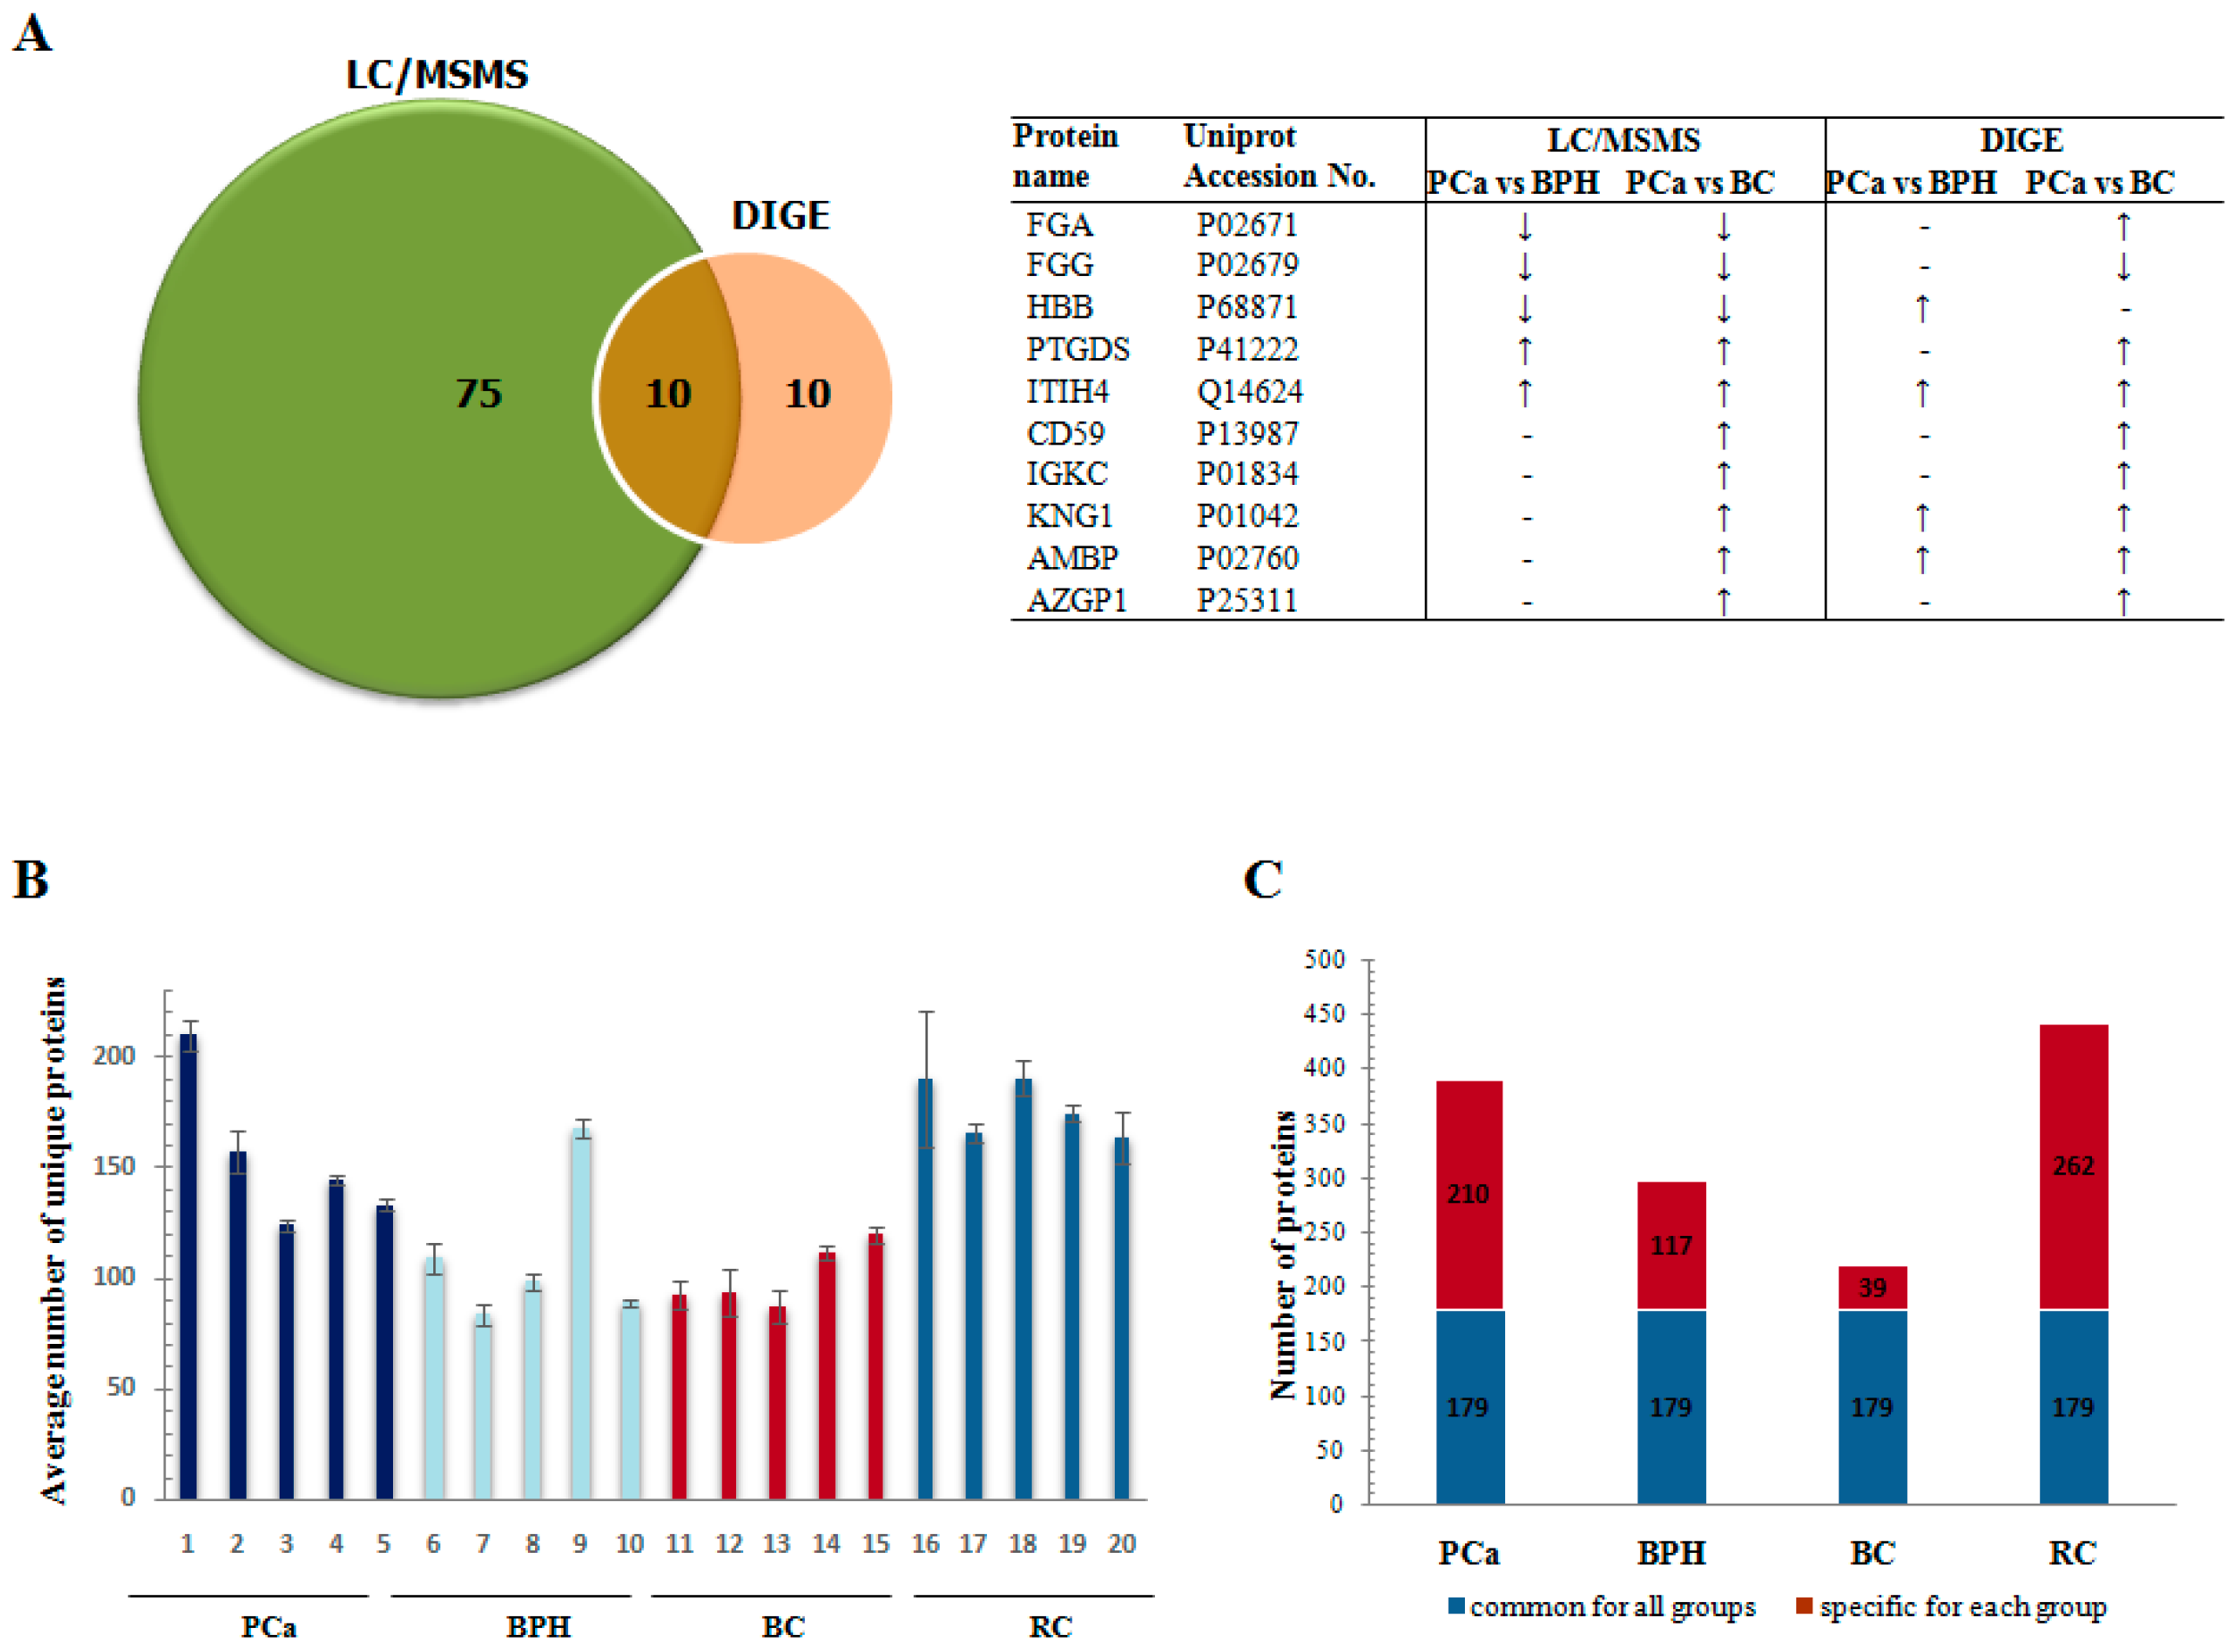
3.1. 2-D DIGE Analysis
3.2. LC-MS/MS Analysis
4. Discussion
5. Conclusions
Supplementary Materials
Acknowledgments
Author Contributions
Conflicts of Interest
References
- Siegel, R.L.; Sahar, L.; Portier, K.M.; Ward, E.M.; Jemal, A. Cancer death rates in US congressional districts. CA Cancer J. Clin. 2015, 65, 339–344. [Google Scholar] [CrossRef] [PubMed]
- Nadler, R.B.; Humphrey, P.A.; Smith, D.S.; Catalona, W.J.; Ratliff, T.L. Effect of inflammation and benign prostatic hyperplasia on elevated serum prostate specific antigen levels. J. Urol. 1995, 154, 407–413. [Google Scholar] [CrossRef]
- Thompson, I.M.; Pauler, D.K.; Goodman, P.J.; Tangen, C.M.; Lucia, M.S.; Parnes, H.L.; Minasian, L.M.; Ford, L.G.; Lippman, S.M.; Crawford, E.D.; et al. Prevalence of prostate cancer among men with a prostate-specific antigen level ≤4.0 ng per milliliter. N. Engl. J. Med. 2004, 350, 2239–2246. [Google Scholar] [CrossRef] [PubMed]
- Draisma, G.; Etzioni, R.; Tsodikov, A.; Mariotto, A.; Wever, E.; Gulati, R.; Feuer, E.; de Koning, H. Lead time and overdiagnosis in prostate-specific antigen screening: Importance of methods and context. J. Natl. Cancer Inst. 2009, 101, 374–383. [Google Scholar] [CrossRef] [PubMed]
- Makarov, D.V.; Loeb, S.; Getzenberg, R.H.; Partin, A.W. Biomarkers for prostate cancer. Annu. Rev. Med. 2009, 60, 139–151. [Google Scholar] [CrossRef] [PubMed]
- Hori, S.; Blanchet, J.S.; McLoughlin, J. From prostate-specific antigen (PSA) to precursor PSA (proPSA) isoforms: A review of the emerging role of proPSAs in the detection and management of early prostate cancer. BJU Int. 2013, 112, 717–728. [Google Scholar] [CrossRef] [PubMed]
- Prensner, J.R.; Rubin, M.A.; Wei, J.T.; Chinnaiyan, A.M. Beyond PSA: The next generation of prostate cancer biomarkers. Sci. Transl. Med. 2012, 4. [Google Scholar] [CrossRef] [PubMed]
- Sartori, D.A.; Chan, D.W. Biomarkers in prostate cancer: What’s new? Curr. Opin. Oncol. 2014, 26, 259–264. [Google Scholar] [CrossRef] [PubMed]
- Goo, Y.A.; Goodlett, D.R. Advances in proteomic prostate cancer biomarker discovery. J. Proteom. 2010, 73, 1839–1850. [Google Scholar] [CrossRef] [PubMed]
- Pin, E.; Fredolini, C.; Petricoin, E.F., III. The role of proteomics in prostate cancer research: Biomarker discovery and validation. Clin. Biochem. 2013, 46, 524–538. [Google Scholar] [CrossRef] [PubMed]
- Davalieva, K.; Polenakovic, M. Proteomics in diagnosis of prostate cancer. Prilozi (Makedon. Akad. Nauk. Umet. Odd Med. Nauki) 2015, 36, 5–36. [Google Scholar] [PubMed]
- Hanash, S.M.; Pitteri, S.J.; Faca, V.M. Mining the plasma proteome for cancer biomarkers. Nature 2008, 452, 571–579. [Google Scholar] [CrossRef] [PubMed]
- Gaudreau, P.O.; Stagg, J.; Soulieres, D.; Saad, F. The present and future of biomarkers in prostate cancer: Proteomics, genomics, and immunology advancements. Biomark. Cancer 2016, 8, 15–33. [Google Scholar] [CrossRef] [PubMed]
- Decramer, S.; Gonzalez de Peredo, A.; Breuil, B.; Mischak, H.; Monsarrat, B.; Bascands, J.L.; Schanstra, J.P. Urine in clinical proteomics. Mol. Cell. Proteom. 2008, 7, 1850–1862. [Google Scholar] [CrossRef] [PubMed]
- Hortin, G.L.; Sviridov, D. Diagnostic potential for urinary proteomics. Pharmacogenomics 2007, 8, 237–255. [Google Scholar] [CrossRef] [PubMed]
- Tosoian, J.J.; Ross, A.E.; Sokoll, L.J.; Partin, A.W.; Pavlovich, C.P. Urinary biomarkers for prostate cancer. Urol. Clin. N. Am. 2016, 43, 17–38. [Google Scholar] [CrossRef] [PubMed]
- Davalieva, K.; Kiprijanovska, S.; Komina, S.; Petrusevska, G.; Zografska, N.C.; Polenakovic, M. Proteomics analysis of urine reveals acute phase response proteins as candidate diagnostic biomarkers for prostate cancer. Proteome Sci. 2015, 13. [Google Scholar] [CrossRef] [PubMed]
- Bradford, M.M. A rapid and sensitive method for the quantitation of microgram quantities of protein utilizing the principle of protein-dye binding. Anal. Biochem. 1976, 72, 248–254. [Google Scholar] [CrossRef]
- Strohalm, M.; Hassman, M.; Kosata, B.; Kodicek, M. Mmass data miner: An open source alternative for mass spectrometric data analysis. Rapid Commun. Mass Spectrom. 2008, 22, 905–908. [Google Scholar] [CrossRef] [PubMed]
- Vizcaino, J.A.; Cote, R.G.; Csordas, A.; Dianes, J.A.; Fabregat, A.; Foster, J.M.; Griss, J.; Alpi, E.; Birim, M.; Contell, J.; et al. The PRoteomics IDEntifications (PRIDE) database and associated tools: Status in 2013. Nucleic Acids Res. 2013, 41. [Google Scholar] [CrossRef] [PubMed]
- Benjamini, Y.; Hochberg, Y. Controlling the false discovery rate—A practical and powerful approach to multiple testing. J. R. Stat. Soc. B Methodol. 1995, 57, 289–300. [Google Scholar]
- Bhatia, V.N.; Perlman, D.H.; Costello, C.E.; McComb, M.E. Software tool for researching annotations of proteins: Open-source protein annotation software with data visualization. Anal. Chem. 2009, 81, 9819–9823. [Google Scholar] [CrossRef] [PubMed]
- Uhlen, M.; Fagerberg, L.; Hallstrom, B.M.; Lindskog, C.; Oksvold, P.; Mardinoglu, A.; Sivertsson, A.; Kampf, C.; Sjostedt, E.; Asplund, A.; et al. Proteomics. Tissue-based map of the human proteome. Science 2015, 347. [Google Scholar] [CrossRef] [PubMed]
- Mischak, H.; Kolch, W.; Aivaliotis, M.; Bouyssie, D.; Court, M.; Dihazi, H.; Dihazi, G.H.; Franke, J.; Garin, J.; Gonzalez de Peredo, A.; et al. Comprehensive human urine standards for comparability and standardization in clinical proteome analysis. Proteom. Clin. Appl. 2010, 4, 464–478. [Google Scholar] [CrossRef] [PubMed]
- Filip, S.; Vougas, K.; Zoidakis, J.; Latosinska, A.; Mullen, W.; Spasovski, G.; Mischak, H.; Vlahou, A.; Jankowski, J. Comparison of depletion strategies for the enrichment of low-abundance proteins in urine. PLoS ONE 2015, 10, e0133773. [Google Scholar] [CrossRef] [PubMed]
- Bergamini, S.; Bellei, E.; Reggiani Bonetti, L.; Monari, E.; Cuoghi, A.; Borelli, F.; Sighinolfi, M.C.; Bianchi, G.; Ozben, T.; Tomasi, A. Inflammation: An important parameter in the search of prostate cancer biomarkers. Proteome Sci. 2014, 12. [Google Scholar] [CrossRef] [PubMed] [Green Version]
- Fan, Y.; Murphy, T.B.; Byrne, J.C.; Brennan, L.; Fitzpatrick, J.M.; Watson, R.W. Applying random forests to identify biomarker panels in serum 2D-DIGE data for the detection and staging of prostate cancer. J. Proteome Res. 2011, 10, 1361–1373. [Google Scholar] [CrossRef] [PubMed]
- Jayapalan, J.J.; Ng, K.L.; Razack, A.H.; Hashim, O.H. Identification of potential complementary serum biomarkers to differentiate prostate cancer from benign prostatic hyperplasia using gel- and lectin-based proteomics analyses. Electrophoresis 2012, 33, 1855–1862. [Google Scholar] [CrossRef] [PubMed] [Green Version]
- Byrne, J.C.; Downes, M.R.; O’Donoghue, N.; O’Keane, C.; O’Neill, A.; Fan, Y.; Fitzpatrick, J.M.; Dunn, M.; Watson, R.W. 2D-DIGE as a strategy to identify serum markers for the progression of prostate cancer. J. Proteome Res. 2009, 8, 942–957. [Google Scholar] [CrossRef] [PubMed]
- Hassan, M.I.; Kumar, V.; Kashav, T.; Alam, N.; Singh, T.P.; Yadav, S. Proteomic approach for purification of seminal plasma proteins involved in tumor proliferation. J. Sep. Sci. 2007, 30, 1979–1988. [Google Scholar] [CrossRef] [PubMed]
- Rehman, I.; Evans, C.A.; Glen, A.; Cross, S.S.; Eaton, C.L.; Down, J.; Pesce, G.; Phillips, J.T.; Yen, O.S.; Thalmann, G.N.; et al. iTRAQ identification of candidate serum biomarkers associated with metastatic progression of human prostate cancer. PLoS ONE 2012, 7, e30885. [Google Scholar] [CrossRef]
- Balkwill, F.; Mantovani, A. Inflammation and cancer: Back to Virchow? Lancet 2001, 357, 539–545. [Google Scholar] [CrossRef]
- Mantovani, A.; Allavena, P.; Sica, A.; Balkwill, F. Cancer-related inflammation. Nature 2008, 454, 436–444. [Google Scholar] [CrossRef] [PubMed]
- Thapa, D.; Ghosh, R. Chronic inflammatory mediators enhance prostate cancer development and progression. Biochem. Pharmacol. 2015, 94, 53–62. [Google Scholar] [CrossRef] [PubMed]
- Pang, W.W.; Abdul-Rahman, P.S.; Wan-Ibrahim, W.I.; Hashim, O.H. Can the acute-phase reactant proteins be used as cancer biomarkers? Int. J. Biol. Markers 2010, 25, 1–11. [Google Scholar] [PubMed]
- A-Gonzalez, N.; Castrillo, A. Liver X receptors as regulators of macrophage inflammatory and metabolic pathways. Biochim. Biophys. Acta 2011, 1812, 982–994. [Google Scholar] [CrossRef] [PubMed]
- Zelcer, N.; Tontonoz, P. Liver X receptors as integrators of metabolic and inflammatory signaling. J. Clin. Investig. 2006, 116, 607–614. [Google Scholar] [CrossRef] [PubMed]
- Lin, C.Y.; Gustafsson, J.A. Targeting liver X receptors in cancer therapeutics. Nat. Rev. Cancer 2015, 15, 216–224. [Google Scholar] [CrossRef] [PubMed]
- Yasuda, M.; Bloor, W.R. Lipid content of tumors. J. Clin. Investig. 1932, 11, 677–682. [Google Scholar] [CrossRef] [PubMed]
- Ettinger, S.L.; Sobel, R.; Whitmore, T.G.; Akbari, M.; Bradley, D.R.; Gleave, M.E.; Nelson, C.C. Dysregulation of sterol response element-binding proteins and downstream effectors in prostate cancer during progression to androgen independence. Cancer Res. 2004, 64, 2212–2221. [Google Scholar] [CrossRef] [PubMed]
- Fukuchi, J.; Kokontis, J.M.; Hiipakka, R.A.; Chuu, C.P.; Liao, S. Antiproliferative effect of liver X receptor agonists on LNCaP human prostate cancer cells. Cancer Res. 2004, 64, 7686–7689. [Google Scholar] [CrossRef] [PubMed]
- Krycer, J.R.; Brown, A.J. Cross-talk between the androgen receptor and the liver X receptor: Implications for cholesterol homeostasis. J. Biol. Chem. 2011, 286, 20637–20647. [Google Scholar] [CrossRef] [PubMed]
- Shevde, L.A.; Samant, R.S. Role of osteopontin in the pathophysiology of cancer. Matrix Biol. 2014, 37, 131–141. [Google Scholar] [CrossRef] [PubMed]
- Ding, Z.; Wu, C.J.; Chu, G.C.; Xiao, Y.; Ho, D.; Zhang, J.; Perry, S.R.; Labrot, E.S.; Wu, X.; Lis, R.; et al. SMAD4-dependent barrier constrains prostate cancer growth and metastatic progression. Nature 2011, 470, 269–273. [Google Scholar] [CrossRef] [PubMed]
- Pio, R.; Corrales, L.; Lambris, J.D. The role of complement in tumor growth. Adv. Exp. Med. Biol. 2014, 772, 229–262. [Google Scholar] [PubMed]
- Rutkowski, M.J.; Sughrue, M.E.; Kane, A.J.; Mills, S.A.; Parsa, A.T. Cancer and the complement cascade. Mol. Cancer Res. 2010, 8, 1453–1465. [Google Scholar] [CrossRef] [PubMed]
- Bateman, A.; Bennett, H.P. The granulin gene family: From cancer to dementia. Bioessays 2009, 31, 1245–1254. [Google Scholar] [CrossRef] [PubMed]
- Deftos, L.J.; Abrahamsson, P.A. Granins and prostate cancer. Urology 1998, 51, 141–145. [Google Scholar] [CrossRef]
- Shannan, B.; Seifert, M.; Leskov, K.; Willis, J.; Boothman, D.; Tilgen, W.; Reichrath, J. Challenge and promise: Roles for clusterin in pathogenesis, progression and therapy of cancer. Cell Death Differ. 2006, 13, 12–19. [Google Scholar] [CrossRef] [PubMed]
- Rizzi, F.; Bettuzzi, S. Clusterin (CLU) and prostate cancer. Adv. Cancer Res. 2009, 105, 1–19. [Google Scholar] [PubMed]
- Lamiman, K.; Keller, J.M.; Mizokami, A.; Zhang, J.; Keller, E.T. Survey of Raf kinase inhibitor protein (RKIP) in multiple cancer types. Crit. Rev. Oncog. 2014, 19, 455–468. [Google Scholar] [CrossRef] [PubMed]
- Markowitz, J.; Carson, W.E., III. Review of S100A9 biology and its role in cancer. Biochim. Biophys. Acta 2013, 1835, 100–109. [Google Scholar] [CrossRef] [PubMed]
- Hermani, A.; Hess, J.; De Servi, B.; Medunjanin, S.; Grobholz, R.; Trojan, L.; Angel, P.; Mayer, D. Calcium-binding proteins S100A8 and S100A9 as novel diagnostic markers in human prostate cancer. Clin. Cancer Res. 2005, 11, 5146–5152. [Google Scholar] [CrossRef] [PubMed]
- Yun, S.J.; Yan, C.; Jeong, P.; Kang, H.W.; Kim, Y.H.; Kim, E.A.; Lee, O.J.; Kim, W.T.; Moon, S.K.; Kim, I.Y.; et al. Comparison of mRNA, protein, and urinary nucleic acid levels of S100A8 and S100A9 between prostate cancer and BPH. Ann. Surg. Oncol. 2015, 22, 2439–2445. [Google Scholar] [CrossRef] [PubMed]
- Subramanian, A.; Miller, D.M. Structural analysis of alpha-enolase. Mapping the functional domains involved in down-regulation of the c-myc protooncogene. J. Biol. Chem. 2000, 275, 5958–5965. [Google Scholar] [CrossRef] [PubMed]
- Jersmann, H.P. Time to abandon dogma: CD14 is expressed by non-myeloid lineage cells. Immunol. Cell Biol. 2005, 83, 462–467. [Google Scholar] [CrossRef] [PubMed]
- Bas, S.; Gauthier, B.R.; Spenato, U.; Stingelin, S.; Gabay, C. CD14 is an acute-phase protein. J. Immunol. 2004, 172, 4470–4479. [Google Scholar] [CrossRef] [PubMed]
- Bazil, V.; Strominger, J.L. Shedding as a mechanism of down-modulation of CD14 on stimulated human monocytes. J. Immunol. 1991, 147, 1567–1574. [Google Scholar] [PubMed]
- Arias, M.A.; Rey Nores, J.E.; Vita, N.; Stelter, F.; Borysiewicz, L.K.; Ferrara, P.; Labeta, M.O. Cutting edge: Human B cell function is regulated by interaction with soluble CD14: Opposite effects on IgG1 and IgE production. J. Immunol. 2000, 164, 3480–3486. [Google Scholar] [CrossRef] [PubMed]

| Reff. Spot No. | PCa/BPH | PCa/BC | PCa/RC | Protein Name | Gene Name | Mw (kDa) b | pl | Mascot Protein Score | p Value | RMS Error (ppm) | Matched Peptides/Total | % of Sequence Coverage | |||
|---|---|---|---|---|---|---|---|---|---|---|---|---|---|---|---|
| t-Test | Fold Change | t-Test | Fold Change | t-Test | Fold Change | ||||||||||
| 1 | 4.0 × 10⁻² | −3.8 | Serotransferrin | TF | 79.3 | 6.81 | 205 | 6.4 × 10⁻¹⁷ | 35 | 20/23 | 35 | ||||
| 2 | 8.5 × 10⁻³ | −3.6 | Serotransferrin | TF | 79.3 | 6.81 | 203 | 1.0 × 10⁻¹⁶ | 33 | 21/27 | 31 | ||||
| 3 | 2.7 × 10⁻² | −3.6 | Serotransferrin | TF | 79.3 | 6.81 | 190 | 2.0 × 10⁻¹⁵ | 46 | 23/37 | 37 | ||||
| 4 | 3.7 × 10⁻² | −3.0 | Serotransferrin | TF | 79.3 | 6.81 | 287 | 4.0 × 10⁻²⁵ | 39 | 29/36 | 41 | ||||
| 5 | 4.5 × 10⁻² | −3.6 | Serotransferrin | TF | 79.3 | 6.81 | 148 | 3.2 × 10⁻¹¹ | 44 | 17/34 | 23 | ||||
| 6 | 3.1 × 10⁻³ | −6.5 | Serotransferrin | TF | 79.3 | 6.81 | 70 | 1.8 × 10⁻³ | 99 | 8/11 | 13 | ||||
| 7 | 2.3 × 10⁻² | 3.5 | Kininogen-1 | KNG1 | 73.0 | 6.34 | 94 | 7.9 × 10⁻⁶ | 88 | 9/13 | 18 | ||||
| 8 | 4.3 × 10⁻² | 2.6 | 6.2 × 10⁻⁵ | 3.0 | Kininogen-1 | KNG1 | 73.0 | 6.34 | 156 | 5.1 × 10⁻¹² | 43 | 17/24 | 24 | ||
| 9 | 2.2 × 10⁻² | 2.4 | Kininogen-1 | KNG1 | 73.0 | 6.34 | 139 | 2.5 × 10⁻¹⁰ | 56 | 14/20 | 24 | ||||
| 10 | 3.4 × 10⁻² | 2.6 | Kininogen-1 | KNG1 | 73.0 | 6.34 | 131 | 1.6 × 10⁻⁹ | 101 | 11/12 | 18 | ||||
| 11 | 4.5 × 10⁻² | 2.5 | 6.9 × 10⁻³ | 4.4 | Kininogen-1 | KNG1 | 73.0 | 6.34 | 111 | 1.6 × 10⁻⁷ | 35 | 10/14 | 19 | ||
| 12 | 5.5 × 10⁻³ | 3.1 | Kininogen-1 | KNG1 | 73.0 | 6.34 | 90 | 5.6 × 10⁻⁶ | 58 | 9/14 | 18 | ||||
| 13 | 1.3 × 10⁻² | −2.8 | 3.7 × 10⁻² | −2.6 | mix (Ig alpha-1 chain C region/Ig alpha-2 chain C region) | IGHA1/ IGHA2 | 38.5/ 37.3 | 6.08/ 5.71 | 65/81 | 2.4 × 10⁻³/ 1.1 × 10⁻⁴ | 48/45 | 6/6/8 | 14/20 | ||
| 14 | 3.9 × 10⁻² | −2.4 | 1.9 × 10⁻² | −2.7 | mix (Ig alpha-1 chain C region/Ig alpha-2 chain C region) | IGHA1/ IGHA2 | 38.5/ 37.3 | 6.08/ 5.71 | 59/82 | 2.4 × 10⁻²/ 1.3 × 10⁻⁴ | 48/45 | 5/6/8 | 13/20 | ||
| 15 | 2.2 × 10⁻² | −2.9 | 1.3 × 10⁻² | −2.5 | Ig alpha-1 chain C region | IGHA1 | 38.5 | 6.08 | 84 | 8.8 × 10⁻⁵ | 13 | 7/13 | 31 | ||
| 16 | 8.3 × 10⁻³ | −2.1 | mix (Ig alpha-1 chain C region/Ig alpha-2 chain C region) | IGHA1/ IGHA2 | 38.5/ 37.3 | 6.08/ 5.71 | 111/84 | 1.6 × 10⁻⁷/ 7.7 × 10⁻⁵ | 59/63 | 10/8/19 | 38/27 | ||||
| 17 | 2.1 × 10⁻² | −2.7 | 3.5 × 10⁻² | −2.5 | mix (Ig alpha-1 chain C region/Ig alpha-2 chain C region) | IGHA1/ IGHA2 | 38.5/ 37.3 | 6.08/ 5.71 | 102/84 | 1.3 × 10⁻⁶/ 7.7 × 10⁻⁵ | 89/93 | 9/8/19 | 33/27 | ||
| 18 | 3.1 × 10⁻² | −2.2 | 1.2 × 10⁻² | −2.1 | 5.1 × 10⁻³ | −1.6 | mix (Ig alpha-1 chain C region/Ig alpha-2 chain C region) | IGHA1 | 38.5/ 37.3 | 6.08/ 5.71 | 92/56 | 1.2 × 10⁻⁵/ 5.0 × 10⁻² | 23/28 | 7/6/20 | 28/26 |
| 19 | 1.4 × 10⁻² | −2.4 | 5.6 × 10⁻² | −1.6 | mix (Ig alpha-1 chain C region/Ig alpha-2 chain C region) | IGHA1/ IGHA2 | 38.5/ 37.3 | 6.08/ 5.71 | 97/69 | 3.8 × 10⁻⁶/ 2.4 × 10⁻³ | 37/37 | 10/8/38 | 38/27 | ||
| 20 | 2.9 × 10⁻² | −2.0 | 6.4 × 10⁻³ | −2.0 | 6.7 × 10⁻² | −1.7 | mix (Ig alpha-1 chain C region/Ig alpha-2 chain C region) | IGHA1/ IGHA2 | 38.5/ 37.3 | 6.08/ 5.71 | 122/82 | 1.3 × 10⁻⁸/ 1.4 × 10⁻⁴ | 11/12 | 9/8/12 | 26/21 |
| 21 a | 2.0 × 10⁻² | −3.2 | Arginyl-tRNA-protein transferase 1 | ATE1 | 60.0 | 8.17 | 98 | 3.6 × 10⁻⁶ | 67 | 9/16 | 28 | ||||
| 22 | 1.8 × 10⁻² | −2.0 | Fibrinogen gamma chain | FGG | 52.1 | 5.37 | 121 | 1.6 × 10⁻⁸ | 43 | 12/23 | 38 | ||||
| 23 | 2.1 × 10⁻² | −5.3 | Fibrinogen gamma chain | FGG | 52.1 | 5.37 | 174 | 8.0 × 10⁻¹⁴ | 39 | 14/18 | 42 | ||||
| 24 | 3.4 × 10⁻² | −5.7 | Fibrinogen gamma chain | FGG | 52.1 | 5.37 | 117 | 4.0 × 10⁻⁸ | 83 | 12/19 | 31 | ||||
| 25 | 3.5 × 10⁻² | −7.1 | Fibrinogen gamma chain | FGG | 52.1 | 5.37 | 107 | 4.0 × 10⁻⁷ | 35 | 12/26 | 32 | ||||
| 26 | 4.1 × 10⁻² | −5.8 | Fibrinogen gamma chain | FGG | 52.1 | 5.37 | 139 | 2.5 × 10⁻¹⁰ | 39 | 13/25 | 37 | ||||
| 27 | 2.0 × 10⁻³ | 2.1 | Zinc-alpha-2-glycoprotein | AZGP1 | 34.5 | 5.71 | 102 | 1.3 × 10⁻⁶ | 45 | 13/27 | 30 | ||||
| 28 | 2.0 × 10⁻² | −4.7 | Haptoglobin | HP | 45.9 | 6.13 | 87 | 3.8 × 10⁻⁵ | 104 | 8/17 | 18 | ||||
| 29 | 1.9 × 10⁻² | −6.7 | Haptoglobin | HP | 45.9 | 6.13 | 108 | 3.2 × 10⁻⁷ | 11 | 13/25 | 27 | ||||
| 30 | 2.2 × 10⁻² | −6.3 | Haptoglobin | HP | 45.9 | 6.13 | 107 | 4.0 × 10⁻⁷ | 53 | 16/37 | 28 | ||||
| 31 | 2.6 × 10⁻² | −7.5 | Haptoglobin | HP | 45.9 | 6.13 | 98 | 3.1 × 10⁻⁶ | 47 | 12/27 | 27 | ||||
| 32 | 2.6 × 10⁻² | −8.1 | Haptoglobin | HP | 45.9 | 6.13 | 86 | 5.0 × 10⁻⁵ | 55 | 13/30 | 28 | ||||
| 33 | 2.1 × 10⁻² | −7.7 | Haptoglobin | HP | 45.9 | 6.13 | 129 | 2.5 × 10⁻⁹ | 44 | 12/16 | 30 | ||||
| 34 | 1.8 × 10⁻³ | 3.4 | Fibrinogen alpha chain (fragment) | FGA | 95.7 (45) | 5.7 | 125 | 6.4 × 10⁻⁹ | 72 | 12/16 | 15 | ||||
| 35 | 2.6 × 10⁻³ | 5.3 | Inter-alpha-trypsin inhibitor heavy chain H4 (fragment) | ITIH4 | 103.5 (45) | 6.57 | 69 | 2.5 × 10⁻³ | 47 | 9/26 | 12 | ||||
| 36 | 2.2 × 10⁻² | 2.5 | Hemoglobin subunit beta | HBB | 16.1 | 6.75 | 141 | 1.6 × 10⁻¹⁰ | 88 | 11/22 | 69 | ||||
| 37 | 8.4 × 10⁻³ | 2.5 | 5.0 × 10⁻⁴ | 4.3 | Inter-alpha-trypsin inhibitor heavy chain H4 (fragment) | ITIH4 | 103.5 (45) | 6.57 | 90 | 2.1 × 10⁻⁵ | 59 | 13/23 | 15 | ||
| 38 | 1.6 × 10⁻² | 4.8 | Protein AMBP | AMBP | 39.9 | 5.95 | 94 | 8.0 × 10⁻⁶ | 66 | 11/30 | 24 | ||||
| 39 | 1.5 × 10⁻² | 5.0 | Protein AMBP | AMBP | 39.9 | 5.95 | 135 | 6.4 × 10⁻¹⁰ | 37 | 13/18 | 32 | ||||
| 40 | 1.4 × 10⁻² | 5.2 | Protein AMBP | AMBP | 39.9 | 5.95 | 108 | 3.2 × 10⁻⁷ | 91 | 10/19 | 18 | ||||
| 41 | 5.3 × 10⁻³ | 2.0 | Protein AMBP | AMBP | 39.9 | 5.95 | 74 | 7.3 × 10⁻⁴ | 12 | 9/17 | 26 | ||||
| 42 | 3.3 × 10⁻³ | 4.0 | Prostaglandin-H2 D-isomerase | PTGDS | 21.2 | 7.66 | 64 | 7.3 × 10⁻³ | 63 | 7/15 | 33 | ||||
| 43 | 6.2 × 10⁻³ | 4.0 | Prostaglandin-H2 D-isomerase | PTGDS | 21.2 | 7.66 | 70 | 2.3 × 10⁻³ | 72 | 8/25 | 27 | ||||
| 44 | 8.9 × 10⁻³ | 3.3 | Prostaglandin-H2 D-isomerase | PTGDS | 21.2 | 7.66 | 60 | 1.9 × 10⁻² | 93 | 7/26 | 26 | ||||
| 45 a | 4.6 × 10⁻² | 1.9 | Ig kappa chain C region | IGKC | 11.8 | 5.58 | 83 | 1.1 × 10⁻⁴ | 51 | 5/10 | 56 | ||||
| 46 | 4.1 × 10⁻² | −1.9 | Serum amyloid P-component | APCS | 25.5 | 6.1 | 106 | 5.1 × 10⁻⁷ | 31 | 10/27 | 34 | ||||
| 47 a | 7.3 × 10⁻⁴ | 6.9 | Vitelline membrane outer layer protein 1 homolog | VMO1 | 22.0 | 4.9 | 82 | 1.3 × 10⁻⁴ | 101 | 7/24 | 57 | ||||
| 48 | 5.4 × 10⁻⁴ | 8.2 | CD59 glycoprotein | CD59 | 14.8 | 6.02 | 67 | 4.1 × 10⁻³ | 17 | 4/5 | 21 | ||||
| 49 | 4.8 × 10⁻² | 3.4 | Retinol-binding protein 4 | RBP4 | 23.3 | 5.76 | 111 | 1.6 × 10⁻⁷ | 76 | 9/11 | 41 | ||||
| 50 | 3.4 × 10⁻² | −7.8 | Haptoglobin (fragment) | HP | 45.9 (20) | 6.13 | 71 | 2.4 × 10⁻³ | 50 | 6/11 | 12 | ||||
| 51 | 3.8 × 10⁻² | −8.9 | Haptoglobin (fragment) | HP | 45.9 (20) | 6.13 | 73 | 1.1 × 10⁻³ | 16 | 6/9 | 12 | ||||
| 52 | 3.2 × 10⁻² | −10.4 | Haptoglobin (fragment) | HP | 45.9 (20) | 6.13 | 72 | 1.3 × 10⁻³ | 49 | 6/9 | 14 | ||||
| 53 | 2.7 × 10⁻² | 4.5 | 3.7 × 10⁻³ | 11.0 | Mannan-binding lectin serine protease 2 (fragment) | MASP2 | 77.2 (19.5) | 5.39 | 125 | 6.4 × 10⁻⁹ | 104 | 12/16 | 18 | ||
| 54 | 1.7 × 10⁻² | 4.5 | Chain A, Laminin G Like Domain 3 From Human Perlecan | HSPG2 (gi|361131590) | 20.7 | 5.47 | 181 | 2.5 × 10⁻¹³ | 55 | 11/15 | 73 | ||||
| Uniprot Accession No. | Protein Name | Gene Name | Peptide Count | Unique Peptides | Confidence Score | ANOVA | Max Fold Change | Highest Mean Condition | Lowest Mean Condition | Group Comparison | p-Value a | Ratio |
|---|---|---|---|---|---|---|---|---|---|---|---|---|
| P08571 | Monocyte differentiation antigen | CD14 | 8 | 7 | 75.64 | 8.87 × 10⁻¹⁰ | 2.70 | PCa | Bc | PCa vs. BC | 2.71 × 10⁻⁴ | 2.7 |
| CD14 | PCa vs. BPH | 4.67 × 10⁻³ | 1.8 | |||||||||
| PCa vs. RC | 2.61 × 10⁻² | 1.6 | ||||||||||
| P62736 | Actin_ aortic smooth muscle | ACTA2 | 3 | 3 | 24.21 | 1.75 × 10⁻⁹ | 5.89 | Bc | PCa | PCa vs. BC | 3.40 × 10⁻⁴ | 0.2 |
| PCa vs. BPH | 1.75 × 10⁻² | 0.4 | ||||||||||
| P02765 | Alpha-2-HS-glycoprotein | AHSG | 9 | 9 | 94.63 | 5.73 × 10⁻⁴ | 2.70 | PCa | Bc | PCa vs. BC | 9.03 × 10⁻³ | 2.7 |
| PCa vs. BPH | 4.14 × 10⁻² | 2.1 | ||||||||||
| P04745 | Alpha-amylase 1 | AMY1A | 9 | 5 | 101.49 | 1.42 × 10⁻⁷ | 3.46 | PCa | Bc | PCa vs. BC | 3.40 × 10⁻⁴ | 3.5 |
| PCa vs. BPH | 4.14 × 10⁻² | 1.7 | ||||||||||
| P19961 | Alpha-amylase 2B | AMY2B | 3 | 1 | 21.24 | 3.52 × 10⁻⁶ | 12.86 | Rc | Bc | PCa vs. BC | 1.25 × 10⁻² | 11.9 |
| PCa vs. BPH | 4.32 × 10⁻² | 4.1 | ||||||||||
| P06733 | Alpha-enolase | ENO1 | 2 | 2 | 14.73 | 3.64 × 10⁻⁵ | 1.78 | BPH | PCa | PCa vs. BC | 1.54 × 10⁻² | 0.7 |
| PCa vs. BPH | 7.97 × 10⁻³ | 0.6 | ||||||||||
| P04083 | Annexin A1 | ANXA1 | 5 | 5 | 41.02 | 5.95 × 10⁻¹² | 5.45 | Rc | Bc | PCa vs. BC | 1.08 × 10⁻³ | 3.8 |
| PCa vs. BPH | 1.20 × 10⁻² | 2.2 | ||||||||||
| P20160 | Azurocidin | AZU1 | 2 | 2 | 13.76 | 7.34 × 10⁻⁵ | 2.80 | BPH | PCa | PCa vs. BC | 3.35 × 10⁻² | 0.6 |
| PCa vs. BPH | 8.89 × 10⁻³ | 0.4 | ||||||||||
| P10909 | Clusterin | CLU | 10 | 10 | 99.24 | 6.33 × 10⁻⁶ | 2.26 | BPH | PCa | PCa vs. BC | 5.24 × 10⁻³ | 0.6 |
| PCa vs. BPH | 2.55 × 10⁻² | 0.4 | ||||||||||
| P12109 | Collagen alpha-1(VI) | COL6A1 | 6 | 4 | 46.91 | 2.05 × 10⁻⁷ | 3.44 | BPH | PCa | PCa vs. BC | 7.15 × 10⁻⁴ | 0.4 |
| chain | PCa vs. BPH | 8.66 × 10⁻³ | 0.3 | |||||||||
| P39060 | Collagen alpha-1(XVIII) | COL18A1 | 2 | 2 | 14.39 | 2.92 × 10⁻⁹ | 14.26 | Rc | Bc | PCa vs. BC | 6.21 × 10⁻³ | 7.1 |
| chain | PCa vs. BPH | 2.30 × 10⁻² | 4.2 | |||||||||
| P01024 | Complement C3 | C3 | 57 | 57 | 545.51 | 2.30 × 10⁻⁷ | 3.43 | Rc | Bc | PCa vs. BC | 6.30 × 10⁻³ | 2.9 |
| PCa vs. BPH | 2.77 × 10⁻² | 2.2 | ||||||||||
| P24855 | Deoxyribonuclease-1 | DNASE1 | 3 | 3 | 23.62 | 1.84 × 10⁻¹⁰ | 4.85 | Rc | Bc | PCa vs. BC | 6.30 × 10⁻³ | 3.6 |
| PCa vs. BPH | 3.55 × 10⁻² | 2.3 | ||||||||||
| O94919 | Endonuclease domain-containing 1 | ENDOD1 | 3 | 3 | 24.51 | 1.64 × 10⁻⁷ | 2.97 | PCa | Bc | PCa vs. BC | 1.01 × 10⁻³ | 3.0 |
| protein | PCa vs. BPH | 4.67 × 10⁻³ | 2.8 | |||||||||
| P02671 | Fibrinogen alpha chain | FGA | 24 | 24 | 293.54 | 7.67 × 10⁻⁶ | 2.72 | BPH | Rc | PCa vs. BC | 2.94 × 10⁻³ | 0.6 |
| PCa vs. BPH | 3.15 × 10⁻² | 0.4 | ||||||||||
| P02679 | Fibrinogen gamma chain | FGG | 20 | 20 | 251.65 | 1.07 × 10⁻⁴ | 2.32 | BPH | Rc | PCa vs. BC | 2.48 × 10⁻² | 0.5 |
| PCa vs. BPH | 4.25 × 10⁻² | 0.5 | ||||||||||
| P28799 | Granulins | GRN | 2 | 2 | 18.13 | 2.87 × 10⁻⁸ | 3.92 | BPH | PCa | PCa vs. BC | 2.32 × 10⁻³ | 0.5 |
| PCa vs. BPH | 8.89 × 10⁻³ | 0.3 | ||||||||||
| P68871 | Hemoglobin subunit beta | HBB | 10 | 10 | 138.23 | 1.54 × 10⁻⁵ | 4.62 | Bc | PCa | PCa vs. BC | 2.96 × 10⁻² | 0.2 |
| PCa vs. BPH | 1.75 × 10⁻² | 0.3 | ||||||||||
| P02790 | Hemopexin | HPX | 16 | 16 | 164.63 | 4.66 × 10⁻⁶ | 2.44 | BPH | PCa | PCa vs. BC | 6.60 × 10⁻³ | 0.6 |
| PCa vs. BPH | 1.30 × 10⁻² | 0.4 | ||||||||||
| P01857 | Ig gamma-1 chain C region | IGHG1 | 6 | 6 | 76.08 | 6.40 × 10⁻⁴ | 3.29 | BPH | PCa | PCa vs. BC | 6.71 × 10⁻³ | 0.5 |
| PCa vs. BPH | 4.14 × 10⁻² | 0.3 | ||||||||||
| P05451 | Lithostathine-1-alpha | REG1A | 5 | 4 | 35.95 | 3.83 × 10⁻⁴ | 3.96 | PCa | BPH | PCa vs. BC | 6.30 × 10⁻³ | 3.8 |
| PCa vs. BPH | 1.50 × 10⁻² | 4.0 | ||||||||||
| P11117 | Lysosomal acid | ACP2 | 5 | 4 | 45.84 | 5.59 × 10⁻⁶ | 2.11 | BPH | PCa | PCa vs. BC | 7.15 × 10⁻⁴ | 0.6 |
| phosphatase | PCa vs. BPH | 6.07 × 10⁻³ | 0.5 | |||||||||
| P08246 | Neutrophil elastase | ELANE | 3 | 3 | 39.04 | 6.45 × 10⁻³ | 3.25 | BPH | PCa | PCa vs. BC | 2.74 × 10⁻² | 0.5 |
| PCa vs. BPH | 4.99 × 10⁻² | 0.3 | ||||||||||
| P10153 | Non-secretory | RNASE2 | 4 | 3 | 51.80 | 3.38 × 10⁻⁸ | 5.21 | PCa | Bc | PCa vs. BC | 8.08 × 10⁻³ | 5.2 |
| ribonuclease | PCa vs. BPH | 2.55 × 10⁻² | 3.9 | |||||||||
| P10451 | Osteopontin | SPP1 | 12 | 11 | 164.02 | 1.10 × 10⁻¹¹ | 15.72 | Rc | Bc | PCa vs. BC | 2.32 × 10⁻³ | 8.4 |
| PCa vs. BPH | 2.55 × 10⁻² | 2.6 | ||||||||||
| P04746 | Pancreatic alpha-amylase | AMY2A | 3 | 1 | 27.44 | 3.66 × 10⁻⁶ | 5.06 | PCa | Bc | PCa vs. BC | 4.27 × 10⁻³ | 5.1 |
| PCa vs. BPH | 4.32 × 10⁻² | 2.3 | ||||||||||
| P30086 | Phosphatidylethanolamine- | PEBP1 | 3 | 3 | 27.16 | 2.93 × 10⁻⁵ | 3.38 | BPH | PCa | PCa vs. BC | 7.15 × 10⁻⁴ | 0.5 |
| binding protein 1 | PCa vs. BPH | 1.75 × 10⁻² | 0.3 | |||||||||
| P20742 | Pregnancy zone protein | PZP | 7 | 7 | 82.62 | 4.09 × 10⁻⁸ | 2.27 | Bc | Rc | PCa vs. BC | 2.32 × 10⁻³ | 0.5 |
| PCa vs. BPH | 4.76 × 10⁻² | 0.7 | ||||||||||
| P41222 | Prostaglandin-H2 | PTGDS | 9 | 7 | 140.59 | 4.51 × 10⁻¹¹ | 5.56 | PCa | Bc | PCa vs. BC | 3.40 × 10⁻⁴ | 5.6 |
| D-isomerase | PCa vs. BPH | 1.75 × 10⁻² | 1.8 | |||||||||
| P06702 | Protein S100-A9 | S100A9 | 3 | 3 | 26.61 | 1.49 × 10⁻⁶ | 6.46 | BPH | PCa | PCa vs. BC | 1.22 × 10⁻³ | 0.5 |
| PCa vs. BPH | 5.03 × 10⁻² | 0.2 | ||||||||||
| Q8WZ75 | Roundabout homolog 4 | ROBO4 | 7 | 7 | 55.71 | 3.32 × 10⁻³ | 2.27 | BPH | PCa | PCa vs. BC | 1.47 × 10⁻² | 0.6 |
| PCa vs. BPH | 2.96 × 10⁻² | 0.4 | ||||||||||
| Q12907 | Vesicular integral-membrane | LMAN2 | 9 | 8 | 94.66 | 1.64 × 10⁻⁶ | 2.48 | Rc | Bc | PCa vs. BC | 2.32 × 10⁻³ | 2.4 |
| protein VIP36 | PCa vs. BPH | 2.55 × 10⁻² | 1.7 | |||||||||
| Q14624 | Inter-alpha-trypsin inhibitor heavy | ITIH4 | 9 | 9 | 94.01 | 3.21 × 10⁻¹³ | 5.55 | Rc | Bc | PCa vs. BC | 5.07 × 10⁻⁵ | 3.5 |
| chain H4 | PCa vs. BPH | 4.67 × 10⁻³ | 1.6 | |||||||||
| P63267 | Actin_ gamma-enteric | ACTG2 | 3 | 3 | 19.63 | 4.29 × 10⁻² | 1.79 | PCa | Rc | PCa vs. BC | 1.08 × 10⁻³ | 1.7 |
| smooth muscle | PCa vs. RC | 2.56 × 10⁻³ | 1.8 | |||||||||
| P07858 | Cathepsin B | CTSB | 3 | 2 | 19.04 | 5.87 × 10⁻³ | 3.16 | Bc | PCa | PCa vs. BC | 3.10 × 10⁻² | 0.3 |
| PCa vs. RC | 3.14 × 10⁻² | 0.4 | ||||||||||
| P01023 | Alpha-2-macroglobulin | A2M | 38 | 38 | 491.82 | 1.42 × 10⁻⁴ | 2.29 | BPH | PCa | PCa vs. BPH | 6.07 × 10⁻³ | 0.4 |
| P15144 | Aminopeptidase N | ANPEP | 2 | 2 | 14.55 | 3.31 × 10⁻⁴ | 1.70 | BPH | PCa | PCa vs. BPH | 4.20 × 10⁻² | 0.6 |
| P07355 | Annexin A2 | ANXA2 | 2 | 2 | 16.06 | 9.99 × 10⁻⁵ | 4.27 | Rc | BPH | PCa vs. BPH | 4.76 × 10⁻² | 4.1 |
| P06727 | Apolipoprotein A-IV | APOA4 | 3 | 3 | 31.32 | 3.77 × 10⁻³ | 2.28 | BPH | PCa | PCa vs. BPH | 5.03 × 10⁻² | 0.4 |
| Q8NFZ8 | Cell adhesion molecule 4 | CADM4 | 8 | 7 | 60.30 | 1.09 × 10⁻³ | 2.26 | BPH | PCa | PCa vs. BPH | 3.15 × 10⁻² | 0.4 |
| P17900 | Ganglioside GM2 activator | GM2A | 4 | 3 | 40.41 | 4.80 × 10⁻² | 1.81 | BPH | PCa | PCa vs. BPH | 4.97 × 10⁻² | 0.6 |
| P69905 | Hemoglobin subunit alpha | HBA1 | 5 | 5 | 56.91 | 9.41 × 10⁻³ | 4.36 | Bc | PCa | PCa vs. BPH | 4.67 × 10⁻³ | 0.6 |
| P02042 | Hemoglobin subunit delta | HBD | 3 | 3 | 29.39 | 1.38 × 10⁻⁵ | 13.11 | Bc | Rc | PCa vs. BPH | 4.20 × 10⁻² | 0.5 |
| P01859 | Ig gamma-2 chain C region | IGHG2 | 7 | 7 | 67.03 | 6.75 × 10⁻⁵ | 2.18 | BPH | Bc | PCa vs. BPH | 6.07 × 10⁻³ | 0.5 |
| P01861 | Ig gamma-4 chain C region | IGHG4 | 6 | 6 | 72.40 | 9.74 × 10⁻⁴ | 2.05 | BPH | Rc | PCa vs. BPH | 4.32 × 10⁻² | 0.6 |
| P01772 | Ig heavy chain V-III region KOL | IGHV3-33 | 2 | 1 | 12.43 | 4.33 × 10⁻³ | 1.57 | BPH | PCa | PCa vs. BPH | 4.89 × 10⁻² | 0.6 |
| P0CF74 | Ig lambda-6 chain C region | IGLC6 | 3 | 3 | 28.38 | 7.00 × 10⁻⁴ | 1.97 | BPH | Bc | PCa vs. BPH | 2.30 × 10⁻² | 0.5 |
| P02788 | Lactotransferrin | LTF | 43 | 41 | 601.64 | 8.73 × 10⁻⁵ | 2.61 | BPH | Rc | PCa vs. BPH | 4.20 × 10⁻² | 0.5 |
| P10253 | Lysosomal alpha-glucosidase | GAA | 8 | 8 | 80.33 | 9.63 × 10⁻⁵ | 1.77 | BPH | PCa | PCa vs. BPH | 4.14 × 10⁻² | 0.6 |
| P05164 | Myeloperoxidase | MPO | 16 | 15 | 159.24 | 4.69 × 10⁻⁵ | 1.76 | BPH | PCa | PCa vs. BPH | 4.67 × 10⁻³ | 0.6 |
| P32119 | Peroxiredoxin-2 | PRDX2 | 3 | 1 | 23.32 | 2.58 × 10⁻² | 13.40 | Bc | PCa | PCa vs. BPH | 5.03 × 10⁻² | 0.2 |
| P05155 | Plasma protease C1 inhibitor | SERPING1 | 4 | 4 | 35.56 | 4.75 × 10⁻³ | 1.71 | BPH | PCa | PCa vs. BPH | 4.99 × 10⁻² | 0.6 |
| Q6S8J3 | POTE ankyrin domain family member E | POTEE | 11 | 8 | 93.51 | 3.30 × 10⁻⁴ | 2.04 | BPH | Rc | PCa vs. BPH | 4.76 × 10⁻² | 0.5 |
| P43652 | Afamin | AFM | 6 | 5 | 48.31 | 8.56 × 10⁻⁴ | 1.65 | PCa | Bc | PCa vs. BC | 5.76 × 10⁻³ | 1.6 |
| P02647 | Apolipoprotein A-I | APOA1 | 12 | 12 | 145.00 | 4.72 × 10⁻⁴ | 1.86 | BPH | Rc | PCa vs. BC | 3.02 × 10⁻² | 0.7 |
| P05090 | Apolipoprotein D | APOD | 6 | 6 | 69.92 | 4.00 × 10⁻⁷ | 2.12 | PCa | Bc | PCa vs. BC | 1.19 × 10⁻³ | 2.1 |
| P02749 | Beta-2-glycoprotein 1 | APOH | 11 | 10 | 112.68 | 1.13 × 10⁻⁴ | 3.66 | Bc | Rc | PCa vs. BC | 7.15 × 10⁻⁴ | 0.3 |
| P19835 | Bile salt-activated lipase | CEL | 3 | 3 | 20.03 | 1.76 × 10⁻⁶ | 2.04 | Rc | Bc | PCa vs. BC | 7.58 × 10⁻³ | 1.6 |
| P07339 | Cathepsin D | CTSD | 6 | 6 | 54.69 | 1.61 × 10⁻³ | 1.85 | PCa | Bc | PCa vs. BC | 1.38 × 10⁻² | 1.9 |
| P13987 | CD59 glycoprotein | CD59 | 5 | 5 | 85.01 | 1.42 × 10⁻⁶ | 4.38 | Rc | Bc | PCa vs. BC | 2.94 × 10⁻³ | 4.3 |
| P0C0L4 | Complement C4-A | C4A | 3 | 3 | 21.19 | 1.16 × 10⁻² | 1.85 | Bc | PCa | PCa vs. BC | 6.21 × 10⁻³ | 0.5 |
| P08174 | Complement decay-accelerating factor | CD55 | 5 | 5 | 40.67 | 2.66 × 10⁻⁵ | 2.37 | Rc | Bc | PCa vs. BC | 1.02 × 10⁻² | 2.2 |
| Q02487 | Desmocollin-2 | DSC2 | 4 | 3 | 24.44 | 4.00 × 10⁻⁶ | 2.62 | Bc | BPH | PCa vs. BC | 1.78 × 10⁻³ | 0.6 |
| Q9UHL4 | Dipeptidyl peptidase 2 | DPP7 | 2 | 2 | 12.10 | 4.08 × 10⁻² | 4.13 | BPH | PCa | PCa vs. BC | 2.84 × 10⁻² | 0.6 |
| Q9HCU0 | Endosialin | CD248 | 6 | 6 | 43.09 | 2.31 × 10⁻⁶ | 2.20 | PCa | Bc | PCa vs. BC | 1.14 × 10⁻² | 2.2 |
| P01834 | Ig kappa chain C region | IGKC | 9 | 9 | 154.85 | 3.59 × 10⁻³ | 2.04 | PCa | Bc | PCa vs. BC | 1.11 × 10⁻³ | 2.0 |
| P01617 | Ig kappa chain V-II region TEW | IGKV2D-28 | 5 | 3 | 60.57 | 1.37 × 10⁻² | 2.22 | Rc | Bc | PCa vs. BC | 7.15 × 10⁻⁴ | 1.6 |
| P01625 | Ig kappa chain V-IV region Len | IGKV4-1 | 2 | 1 | 17.70 | 1.49 × 10⁻³ | 1.62 | Rc | Bc | PCa vs. BC | 7.58 × 10⁻³ | 1.6 |
| P80748 | Ig lambda chain V-III region LOI | IGLV3-21 | 3 | 3 | 29.50 | 1.01 × 10⁻³ | 2.13 | PCa | Bc | PCa vs. BC | 1.00 × 10⁻⁴ | 2.1 |
| P0CG04 | Ig lambda-1 chain C regions | IGLC1 | 6 | 6 | 112.58 | 6.98 × 10⁻³ | 2.14 | BPH | Bc | PCa vs. BC | 2.40 × 10⁻³ | 1.8 |
| P0CG05 | Ig lambda-2 chain C regions | IGLC2 | 3 | 3 | 57.93 | 1.94 × 10⁻² | 1.73 | BPH | Bc | PCa vs. BC | 3.90 × 10⁻³ | 1.7 |
| P01042 | Kininogen-1 | KNG1 | 27 | 27 | 362.50 | 8.88 × 10⁻⁷ | 2.71 | Rc | Bc | PCa vs. BC | 8.22 × 10⁻³ | 1.7 |
| P14543 | Nidogen-1 | NID1 | 9 | 8 | 84.01 | 5.13 × 10⁻⁵ | 3.95 | BPH | Bc | PCa vs. BC | 2.23 × 10⁻³ | 2.0 |
| O75594 | Peptidoglycan recognition protein 1 | PGLYRP1 | 5 | 5 | 50.82 | 6.11 × 10⁻⁵ | 2.30 | BPH | Bc | PCa vs. BC | 3.28 × 10⁻³ | 1.9 |
| P01833 | Polymeric immunoglobulin receptor | PIGR | 25 | 24 | 263.55 | 5.20 × 10⁻⁵ | 2.50 | Rc | Bc | PCa vs. BC | 6.21 × 10⁻³ | 1.6 |
| P02760 | Protein AMBP | AMBP | 25 | 24 | 366.65 | 4.27 × 10⁻³ | 2.49 | Rc | Bc | PCa vs. BC | 1.02 × 10⁻² | 1.9 |
| P00734 | Prothrombin | F2 | 16 | 14 | 176.60 | 3.60 × 10⁻⁵ | 5.38 | Rc | Bc | PCa vs. BC | 7.15 × 10⁻⁴ | 2.7 |
| P07998 | Ribonuclease pancreatic | RNASE1 | 4 | 4 | 39.91 | 7.99 × 10⁻¹⁵ | 4.42 | Rc | Bc | PCa vs. BC | 7.63 × 10⁻⁴ | 3.5 |
| Q9UBC9 | Small proline-rich protein 3 | SPRR3 | 2 | 2 | 22.69 | 7.14 × 10⁻³ | 2.10 | PCa | Bc | PCa vs. BC | 1.25 × 10⁻² | 2.1 |
| Q9UGT4 | Sushi domain-containing protein 2 | SUSD2 | 2 | 2 | 13.45 | 5.40 × 10⁻⁵ | 32.32 | PCa | Bc | PCa vs. BC | 4.99 × 10⁻² | 32.3 |
| P07911 | Uromodulin | UMOD | 27 | 27 | 399.14 | 6.23 × 10⁻⁶ | 2.98 | Rc | Bc | PCa vs. BC | 4.00 × 10⁻² | 1.7 |
| P22891 | Vitamin K-dependent protein Z | PROZ | 4 | 3 | 42.25 | 1.29 × 10⁻² | 2.21 | PCa | Bc | PCa vs. BC | 2.92 × 10⁻² | 2.2 |
| P25311 | Zinc-alpha-2-glycoprotein | AZGP1 | 17 | 15 | 230.16 | 1.61 × 10⁻² | 2.47 | PCa | Bc | PCa vs. BC | 1.25 × 10⁻² | 2.5 |
| P06870 | Kallikrein-1 | KLK1 | 6 | 6 | 64.59 | 4.90 × 10⁻⁴ | 2.36 | BPH | Bc | PCa vs. RC | 2.61 × 10⁻² | 0.6 |
| Q96PD5 | N-acetylmuramoyl-L-alanine amidase | PGLYRP2 | 5 | 5 | 56.28 | 7.41 × 10⁻³ | 2.14 | PCa | Rc | PCa vs. RC | 2.56 × 10⁻³ | 2.1 |
© 2017 by the authors. Licensee MDPI, Basel, Switzerland. This article is an open access article distributed under the terms and conditions of the Creative Commons Attribution (CC BY) license (http://creativecommons.org/licenses/by/4.0/).
Share and Cite
Davalieva, K.; Kiprijanovska, S.; Maleva Kostovska, I.; Stavridis, S.; Stankov, O.; Komina, S.; Petrusevska, G.; Polenakovic, M. Comparative Proteomics Analysis of Urine Reveals Down-Regulation of Acute Phase Response Signaling and LXR/RXR Activation Pathways in Prostate Cancer. Proteomes 2018, 6, 1. https://doi.org/10.3390/proteomes6010001
Davalieva K, Kiprijanovska S, Maleva Kostovska I, Stavridis S, Stankov O, Komina S, Petrusevska G, Polenakovic M. Comparative Proteomics Analysis of Urine Reveals Down-Regulation of Acute Phase Response Signaling and LXR/RXR Activation Pathways in Prostate Cancer. Proteomes. 2018; 6(1):1. https://doi.org/10.3390/proteomes6010001
Chicago/Turabian StyleDavalieva, Katarina, Sanja Kiprijanovska, Ivana Maleva Kostovska, Sotir Stavridis, Oliver Stankov, Selim Komina, Gordana Petrusevska, and Momir Polenakovic. 2018. "Comparative Proteomics Analysis of Urine Reveals Down-Regulation of Acute Phase Response Signaling and LXR/RXR Activation Pathways in Prostate Cancer" Proteomes 6, no. 1: 1. https://doi.org/10.3390/proteomes6010001