Article

Nonlinear Monetary Policy Rules: An Essay in the Comparative Study on Egyptian and Tunisian Central Banks

Monnaie Modélisation Financement Développement (MOFID), University of Sousse, Sousse 4003, Tunisia
*
Author to whom correspondence should be addressed.
Economies 2016, 4(2), 6; https://doi.org/10.3390/economies4020006
Submission received: 23 November 2015 / Revised: 11 March 2016 / Accepted: 1 April 2016 / Published: 11 April 2016

Abstract

:
The purpose of this paper is to evaluate the behavior of monetary authorities in Tunisia and Egypt, in response to changes in macroeconomic variables over time based on LSTR model. In this sense, we estimate Taylor-type equations for short-term interest rate in Tunisia and Egypt using quarterly data covering the period 1998.Q4–2013.Q2. We find strong evidence that the real decision-making process followed by these central banks varies from one central bank to another and that it exhibits nonlinear patterns that better capture special events and unexpected contingencies i.e., the terrorist attack in the US in September 2001, the global financial crisis in 2008, and the effect of political instability with the onset of the revolution. Additionally, the presence of asymmetries in the reaction function of the Tunisian and Egyptian Bank requires disconnection from their automatic pilot rules and use of judgement to make decisions.
JEL Classifications:
E52; E58; F31; E32

1. Introduction

For the most part, empirical studies have investigated optimal monetary policy or monetary policy rule under the assumption that central banks handle interest rate setting in a linear manner. The theoretical underpinning of this linear policy rule is the linear-quadratic (LQ) framework, stemming from the combination of a linear economic structure and a symmetric objective preferences of the policymaker. This combination leads to a linear reaction function. The Taylor rule is probably the most recognized features of this literature.
After the seminal work of Taylor (1993) [1], there is a vast amount of empirical research studing and testing Taylor rule and its extensions. Some researchers include a lagged value of interest rate as an additional explanatory variable in the monetary policy. This process called “inertia” or “gradualism” tends to move policy rate in a series of small a moderate steps (Clarida et al., 1998) [2]. Others consider an augmented version of the linear Taylor rule by enclosing other variables in the conduction mechanism of monetary policy. Svensson (2003) [3] proposes an extension of the Taylor rule by incorporating the exchange rate in a rule designed for small open economies. His conclusion is in line with that of Batini et al. (2001) [4] who show that the descriptive power of the Taylor rule augmented by the exchange rate variable is higher than the standard Taylor rule for small open economies (i.e., UK).
A common feature of the above specifications of the Taylor rule is that they are linear specifications. However, as cited above, the cogency of such rules is that policymakers tend to treat, symmetrically and with the same magnitude, deviations (either positive or negative) of the objective variables from their pre-determined target values and that the aggregate supply or Phillips curve is linear.
However, in reality, it might not be the case; monetary authorities may have asymmetric preferences, and the Phillips curve may reflect more complex price-setting behavior than that subsuming a linear specification.
There is growing literature that relaxes the quadratic preference assumption of the Central Bank and adopts instead asymmetric preference specification (Nobay and Peel (2003) [5], Dolado, Maria-Dolores and Ruge-Murcia (2005) [6], Karagedik and Lees (2006) [7], Surico (2007) [8], Cukierman and Muscatelli (2008) [9]).
The not quadratic (asymmetric) preferences imply that the Central Bank is assigning different weight to upwards and downwards deviations of aggregates from their expected values in its loss function. In contrast, what is important in a quadratic loss function is especially magnitude of deviation and not its sign. Which means that the central bankers put equal weights on positive and negative deviations of key macroeconomic variables such as inflation and output from their target values.
It is also possible that the Phillips Curve can assume many forms apart from linearity. Such nonlinearity of the Phillips Curve (PC) implies that the cost of decreasing inflation would not be the same in a recession and in an expansion. Often the Phillips Curve seems to be convex, when the economy is in a recession, further decrease of economic activity does not produce much disinflation (the costs associated with fighting inflation is high).
Schaling (1999) [10], Nobay and Peel (2000) [11], Dolado et al. (2005) [6] among others provide some evidence for the relevance of nonlinearity in the Phillips Curve. To be effective, the quadratic loss function is unable to capture these preference asymmetries and describe perfectly the structure of the economy. While the unawareness of such possible nonlinearity response may bias the results and lead to fallacious policy implications.
Mishkin (2011) [12] questions the traditional quadratic-linear framework when financial markets are disrupted and puts forward the arguments for replacing it by nonlinear dynamics leading to a nonlinear optimal monetary policy.
Consequently, this gives central banks impetus to reconsider their monetary policy framework in view of specific circumstances, such as shocks. In addition, most recent studies focused on nonlinear Taylor rules are limited to industrialized countries, especially the US (Conrad and Eife, 2012 [13]; Lee and Son, 2013 [14]; Olsen et al., 2012 [15]), the UK, ECB, Japan and Canada (Kolman, 2013 [16]).
In this respect, the aim of this paper is to investigate more in-depth the possible presences of nonlinear dynamics using the Smooth Transition Regression (STR) methodology advocated by Granger and Terasvirta (1993) [17]. We established to that purpose a list of two MENA countries presenting a great similarity in terms of economic structure, which are, Tunisia and Egypt.
The LSTR model is appropriate to capture asymmetry, heterogeneity and time-varying monetary policy reaction. Parameters change is governed by a transition variable that traces well heterogeneity and specificity of each country and even each study period. Therefore, it may be a more realistic description of the systematic response of the monetary authority to economic developments since heterogeneity between countries interferes with the reliability and validity of the linear model.
Accordingly, we investigate both linear and nonlinear Taylor-type monetary policy reaction functions in Tunisia and Egypt using inflation, output gap, lagged interest rate, and real effective exchange rate (REER). We also examine whether monetary policy following nonlinear Taylor rule model could provide additional information over a linear model and to what extent special regimes are not detected by a linear Taylor rule.
This paper contributes to current monetary debates through justifying why and when the Central Bank adjusts its policy rule, when fitted in the context of a revolutionary country, namely Tunisia and Egypt.
The remaininder of the paper is organized as follows: Section 2 reviews a brief history of monetary policy. Section 3 describes the econometric methodology. Section 4 outlines the data. In Section 5, the empirical analysis is performed and results are discussed. Section 6 summarizes the main conclusions of this paper.

2. Brief History of Monetary Policy

2.1. Tunisia

The monetary policy adopted in Tunisia has experienced a continuous evolution since the late 1980s. The monetary authorities embarked on structural reform program aimed at establishing a market base and supporting the economic policies of the government. Also, it should be noted that the BCT (la Banque centrale de Tunisie) is entrusted with several objectives at once in its charter, in particular supporting economic activity, defending the value of the currency and ensuring its stability, preserving the stability of the financial system, and keeping the growth of domestic prices under control.
Indeed, since 1987 the monetary policy strategy of the BCT assigned a prominent role to money growth to achieve price stability. In particular, the BCT fixed growth of money supply (M2) at 2% below the projected growth of nominal GDP. Then, under the assumption of a roughly constant multiplier, the level of base money supply consistent with the target growth of M2 is set.
After the amendment1 of the organic law No 58–90 of 19 September 1958 on the establishment and Organization of the Central Bank of Tunisia, the priority objective of monetary policy was to safeguard price stability.
This amendment removed the ambiguity surrounding the main mission of BCT. Practically, the adoption of this new monetary program was established in two stages. At the first stage, the BCT adopt a targeting of board (M3), regarding this choice, the BCT acts on the monetary base, that is the operational target to correlate the money supply growth to nominal GDP.
Afterwards, during the second stage, the BCT will establish an inflation targeting framework using the interest rate as the operating instrument to regulate the money market conditions and then control prices.
The BCT introduced, in early 2009, “the standing facilities of deposits and lending” to establish a hand within the dynamics of money market average rate but the critical phase of transitional revolution in 2011 was worsened by smuggling, trafficking, and illegal export of subsidized foodstuffs across the Libya-Tunisia and Algeria-Tunisia borders has led to increase of inflation prompting the BCT to adopt the inflation targeting framework.

2.2. Egypt

It appears that the Egyptian sovereignty over the conduct of monetary policy is constrained with meeting several, potentially conflicting objectives (Al-Mashat and Billmeier, 2007 [18]). Insofar as through the adoption of a fixed exchange rate regime and allowing free movement of capital entailing non-independent monetary policy (Fleming, 1962 [19]; Mundell, 1963 [20]).
Therefore, the year 2003 marks a turning point for monetary policy in Egypt, where the monetary authorities officially declared the adoption of the free float.
In this regard, the country redesigned its monetary policy framework from intervention in the foreign exchange market to another monetary policy instruments, such as standing facilities, open market operations and repurchase agreements.
In June 2005, the inflation targeting was announced as a monetary-policy strategy using the interest rate as the operating instrument to counter inflation pressure.
Similarly, in post-Mubarak’s Egypt and after the gradual depreciation of the Egyptian pound against the dollar, the consumer price inflation has gone from 10.2% in 2010 to 7.1 % in 2011/2012. Such controls have been unsurprising, it was partly because of major food commodity price falling.

3. Empirical Methodology

3.1. Transmission Channels of Monetary Policy

The effectiveness and reliability of monetary policy depends on the willingness of central banks to induce changes in aggregate demand. The route between monetary policy and aggregate demand operates through a variety of channels.
The monetary policy is assumed to work mostly through four mechanisms, namely: interest rate channel, credit channel, exchange rate channel, and stock price channel.
These four channels generally reinforce each other, all moving aggregate demand in the same direction. Then, changes in aggregate demand either stimulate or restrain the overall macroeconomy. This impact changes over countries (Tunisia and Egypt) and over time under different circumstances (Subprime Crisis, revolution shock, successive transitional governments)

3.1.1. Interest Rate Channel

The main transmission channel is the effect that changes in the bank’s interest rate have on sensitive components of aggregate demand such as consumption and investment.
A tightening of monetary policy may induce a greater cost of capital and lower yield on saving, which in turn leads to a reduction of spending decisions and demand for loans and other financial sources. As a result, over time, there is typically a cut back of aggregate economic activity.
  • Tunisia
Despite the significant role played by the interest rate channel in the transmission of Tunisian monetary policy impulses prior to the revolution, the interest rate lost its central role in the adjustment of monetary conditions after the political events that unfold in Tunisia since the revolution on January 14, 2014. This is due to two reasons: first, within a context of political upheaval and security tensions, the lack of visibility makes firms insensitive to changes of interest rates in their investment strategy which explains the worsened investor’s wait-and-see attitude.
Second, because of negative real interest rates, Tunisian households have deserted bank deposits in favor of real assets such as policy property and real estates.
In sum, these actors continue to be deaf to call for consumption and investment as a result of growing anxiety about the future.
  • Egypt
The monetary channel does not seem to have clear effect on the Egyptian real economy. This result can be attributed to the weak control exercised by the ECB (Egyptian Central Bank) on monetary aggregates. This was notably because of a low degree of monetary policy independence with regard to the exchange rate-based stabilization program. However, following the enactment of the low on price stability and the adoption of the free floating exchange rate regime, reforming its instrument for monetary policy implementation has helped to strengthen the monetary channel (Al-Mashat and Billmeier, 2007 [18]).

3.1.2. Credit Channel

The credit channel was proposed as an enhancement to the traditional interest rate channel. It works as follows: a restrictive monetary policy leads to a drop in bank deposits, which in turn brings about a decrease in bank’s willingness to give loans. This has a negative impact on aggregate demand as the decrease of bank credit causes a cut back on investment and consumption expenditures by bank dependent agents.
  • Tunisia
This channel occupies a place of honor after the revolution. Despite substantial progress in the last few years, the stock markets in Tunisia are still underdeveloped with a relatively small number of listed firms, low free-flat of shares, and thin trading.
The negative impact is more pronounced in Tunisia as the corporate sector relies mostly on banks as the main external source of funds.
In particular, up to the revolution event, global liquidity dried up (large cash withdrawals) and weakened the banking system. To circumvent possible credit crunch and insolvencies, the Central Bank had to provide commercial banks with liquidity, injecting the equivalent of TND 3.588 billion on December 2011 and the ratio of required reserve was cut down from 12.5% to 2%.
  • Egypt
Following the 2011 Egyptian revolution that overthrew the dictatorial regime, the credit channel has weakened, as the loans to the private sector contracted in volume. This is due, in large part, to the attitude of the banks preferring to buy treasury bills rather than lend to the private sector because of the negative impact of political instability on risk aversion. Similarly, we can attribute this downward trend in the volume of the credits to the rising levels of non-performing loans (NPLs) and the fragility of the banking system.

3.1.3. Exchange Rate Channel

The effect of changes in interest rate on the exchange rate has become increasingly important with the growing internationalization of economies throughout the world. An exchange rate channel determines that a monetary expansion will translate into nominal depreciation of local currency.
As a result, a lower value of domestic currency makes domestic goods cheaper than foreign goods, thereby sustaining competitiveness of the home economy and hence causing a rise in net exports and a stimulation of overall economic activity.
  • Tunisia
This channel has become increasingly important with the advent of revolution related events. Two main factors may explain the renewed interest in the role played by the exchange rate channel in the adjustment of monetary conditions. First, growth of monetary supply remains under control and does not represent a source of inflation (wage increase, smuggling, and commodity prices increase). Then, monetary policy cannot act through interest rate adjustments to reduce inflation for instance.
Second, the Tunisian Central Bank attaches priority to exchange rate movements because of fear of the exchange rate pass-through effects.
  • Egypt
The exchange rate channel plays a key role in the transmission of monetary shocks to the Egyptian real economy (Al-Mashat and Billmeier, 2007 [18]). In this sense, Boughrara et al., (2008) [21] show that the pass-through degree in Egypt is relatively high. Indeed, 30% of changes in the nominal exchange rate are transmitted to all prices only with a lag of one year. This is attributed to its relatively high degree of openness, approximately 37.1% and 40.7% for imports and exports, respectively.

3.1.4. Stock Price Channel

The stock price channel becomes increasingly important in the setting of monetary policy. For example, lower interest rates will lead to higher asset prices, which in turn affect the level of aggregate demand for goods and services through three different routes. (1) Effects on investment in the stock market; (2) Bank balance sheet; (3) Household wealth effects.
  • Tunisia
It is noteworthy that the financial assets price channel seems totally inoperative in Tunisia because of the preference of Tunisians for the forms of investment. In fact, the real estate sector in Tunisia have been guaranteed as a safe investment. In this vein, Tunisian people prefer real estate to banks or stocks markets. Similarly, businesses do not rely on direct funding for new capital investment. This reflects a lack of credibility in the financial system in Tunisia.
  • Egypt
This channel occupies an honored place despite the effort and regulatory incentives to develop the banking sector which plays a very limited role in financing the economy. This is due, in large part, to the attitude of Egyptian people prefer engaging their liquidity in buying financial assets rather than to be deposited.
Figure 1 above depicts the configuration of the monetary policy channels in Tunisia and Egypt after the revolution. Indeed, after 14 January 2011 the exchange rate channel (q) becomes the most important channel followed by the credit channel (credit channel) and then the interest rate channel (i) but the financial assets price channel (e) seems totally inoperative in Tunisia. While after 25 January 2011, the design of the Egyptian monetary transmission channel was completely different as the exchange rate and financial assets price were the most important channels. The interest rate and the credit channels had a very little importance.

3.2. Augmented Linear Taylor Rule

Our starting point is the estimation of a linear symmetric Taylor rule for monetary policy in Tunisia. Despite its simplicity, this rule has fit the data relatively well in the literature. Some studies extend this linear rule by considering the effect of additional variables in the conduct of monetary policy. Following Clarida et al. (1998) [2] and Rudebush (2002) [22] among others, we augment the baseline specification by introducing the lagged interest rate that takes into account the inertia of monetary policy.
Clarida et al. (1998) [2] find that the interest rate smoothing parameter enters significantly in the Taylor rule. In fact, the reason of doing so is mainly due to fear to disturbing capital markets which are too sensitive to policy changes and could create financial instability via investor herding behavior, or the need to build consensus to support a policy change. We also augment the conventional Taylor rule by the real exchange rate. Similarly, Svensson (2003) [3] proposes an extension of the Taylor rule by incorporating the exchange rate in a rule designed for small open economies. His conclusion is in line with that of Batini et al. (2001) [4] who show that the descriptive power of the Taylor rule augmented by the exchange rate is higher than the standard Taylor rule for small open economies (i.e., UK).
There are several reasons to include the REER in the MENA reaction function namely, Tunisia and Egypt. The constant real effective exchange rate rule provides a buffer against shocks and helps to reduce volatility in interest rate. This policy is partly out of concern for the international competitiveness of MENA’s manufacturing exports. In particular, a rise in the REER implies a fall in competitiveness and vice versa.
When dealing with capital flows, the authorities confront a trade-off between currency appreciation and depreciation. The former has a negative impact on the competitiveness of exports while the local currencies depreciation induce losses to MENA central banks by increasing the country’s massive debt burden, which is reflected in a higher debt service.
Indeed, the fall of the local currencies is well understood by pressure on the balance of payment which is still running a trade deficit: the domestic currencies slippage have caused large spikes in the price of imports. However, exports have not benefited from improved price competitiveness due to the current Eurozone crisis, which has crippled European demand for Tunisian and Egyptian goods. In addition, government instability went against mastering the social tensions and clarifying the investment outlook.
Thus, the concept of REER goes beyond the weighted average of currencies to greater significance for Tunisian policymakers where sectors are expected to contribute more to the growth of the economy. Indeed, many researchers argue that real effective exchange rate has important effects not only on the general economic performance of a country and its international competitiveness but also on the different sectors of the economy.
Moreover, the Tunisian and Egyptian economic situations remain fragile because the level of foreign reserves, which are barely three months of imports, remaining the lowest in the region and forcing the central banks to pursue an active policy of rebuilding reserves.
Given the importance of exchange rate especially in the context of a small open economy, it is widely agreed to introduce it as an explanatory variable in the Taylor rule. To sum up, the inclusion of the REER is consistent with the objectives of the Tunisian and Egyptian central banks in terms of maintaining price stability.
The model thus becomes:
i t = α + ρ   i t 1 + b π π t + b y y t + b q q t + u 1. t
where α = r φ π * and b π = 1 + φ .
i t stands for the nominal short-term interest rate. r for equilibrium real interest rate. φ indicates the sensitivity of interest rate policy to deviations of inflation from its target. π * refers to the inflation target. ρ measures the degree of interest rate smoothing. i t 1 means the lagged value of the interest rate. π t is the inflation rate at time t, calculated from the consumer price index (CPI), reflecting cost of acquiring a fixed basket of goods and services by an average consumer. b y represents the coefficient of the reaction of the Central Bank in response to output gap. y t refers to the output gap, defined as the difference between actual output and potential output, which is measured using the Hodrick-Prescott filter. b q is the coefficient of reaction of the Central Bank to change in REER. q t refers to the REER and u 1. t is the error term.

3.3. Nonlinear Taylor Rule

Following the work of Teräsvirta (1998) [23], the standard two-regime LSTR for a nonlinear Taylor rule could be derived as follows:
i t = ϕ Z t + θ Z t G ( γ , c , S t ) + u t , t = 1 ,   , T
where G ( γ , c , S t ) = ( 1 + exp { γ σ S t k k = 1 k ( S t c ) } ) 1 with Z t = ( w t , x t ) is a vector of regressors including the exogenous variables, x t = ( 1 , x 1 t , , x k t ) and lagged dependent variable, w t = ( y t 1 , , y t p ) .
The vectors ϕ = ( ϕ 0 , ϕ 1 , , ϕ n ) and θ = ( θ 0 , θ 1 , , θ m ) represent [ ( n + 1 ) × 1 ] and [ ( m + 1 ) × 1 ] parameter vectors in the linear and nonlinear parts of the model, respectively.
The disturbance term is iid (independent identically-distributed) with zero mean and constant variance, u t i i d N ( θ , σ 2 ) .
G ( γ , c , S t ) is the transition function bounded by 0 and 1, and depends upon the transition variable S t , the slope parameter γ , and the location parameter c .
In terms of the above equation, the logistic function increases in tandem with the transition variable. Van Dijk et al. (2002) [24] demonstrate that as S t 0 ( o r ) the transition function becomes abrupt, such that the model becomes indistinguishable from the linear autoregressive model.
Teräsvirta (1994) [25] proposes some procedures to build an LSTR model; these include a linearity test, estimation and evaluation of the model. A linearity test is performed for the purpose of choosing the appropriate transition variable S t and the most suitable form of the transition function among LSTR1 (with a single transition variable), LSTR2 (with two transition variables) and ESTR model. In fact, the null hypothesis of linearity can be formulated as follows: the null hypothesis of linearity consists in testing H 0 : θ = 0 in Equation (2) against the alternative hypothesis of nonlinearity: H 1 : θ 0 .
Luukkonen et al. (1988) [26] argue that testing for linearity is not a straightforward task, due to the fact that the model is only identified under the alternative of nonlinearity. In particular, the parameters c and are nuisance parameters and are not present under the null of linearity. Teräsvirta (1998) [23] shows that this identification problem can be circumvented by approximating the transition function with a third Taylor expansion around γ = 0 . After reparametrization and rearrangement the approximation yields the following regression:
i t = δ 0 + δ Z ˜ t + β 1 Z ˜ t S t + β 2 Z ˜ t S t 2 + β 3 Z ˜ t S t 3 + v t
Accordingly, the null hypothesis of linearity becomes: β 1 = β 2 = β 3 = 0 and a LM-type test with F-distribution is used to test this null hypothesis of linearity. Teräsvirta (1998) [23] suggests a linearity test for each candidate transition variable. In terms of this approach, the variable with the lowest p-value (strongest rejection of linearity) is chosen as the transition variable.
Once the linearity is rejected against LSTR-type nonlinearity, we follow Teräsvirta (2004) [27] and consider the following three tests:
H 04 : β 3 = 0 ,   H 03 : β 2 = 0   /   β 3 = 0   a n d   H 02 : β 1 = 0     /   β 2 = β 3 = 0
The above test statistics are labeled F 2 , F 3   a n d   F 4 , respectively and are used to determine the number of regime shifts among LSTR1 and LSTR2. The decision rule is that the LSTR1 is chosen if the p-value of H 04   o r   H 02 is the lowest. Conversely, the LSTR2 is selected if the p-value of H 03 is the lowest.
The chosen model can then be estimated and evaluated as outlined in Eitrheim and Teräsvirta (1996) [28]. Several misspecification tests are used in the STR literature, such as test of no remaining nonlinearity, test of no residual autocorrelation and test of parameter constancy. These tests will be carried out in the empirical section.

4. Data

As we detailed in the introduction, our empirical analysis focuses on MENA countries: Tunisia and Egypt. Our data set includes quarterly observations, obtained from the international Financial Statistic (IFS) and Bloomberg databases, available from the countries under examination for the interest rate, inflation, industrial production, and the REER.
The sample periods differ slightly across countries and covers the period 1998. Q4→2013.Q4.
Table 1 provides a detailed description of sample size used in the analysis.
Moreover, before the estimation of Equation (1), it is essential to check for the stationarity of the considered time series. The results of ADF and the Zivot- KPSS test are gathered in Table 2.
The ADF test rejects the null hypothesis of unit root for yt, it, qt at the 1% significance level. Consequently, the output gap, interest rate, and REER series are stationary for Tunisia. However, only the πt is not stationary and the hypothesis of the presence of unit root is not rejected. To remedy this problem, first differencing (log-first differencing for inflation) must be used to make this series stationary.
It appears the Augmented Dickey-Fuller test cannot reject the null hypothesis of non-stationarity for inflation, REER, and interest rate series for Egypt. That means these series have a unit root problem. Except for the output gap, which was found to be stationary in level. There is no need to difference them when estimating.
We also apply the Zivot-Andrews stationarity test which is robust to the presence of a structural break either in the mean, the trend, or in both. Results of this test show that the null of unit root is strongly rejected for the interest rate, output gap and REER series for Tunisia while only the output gap series are found to be stationary for Egypt.

5. Results and Discussion

5.1. Linear Specification Results

The estimation results of the linear Taylor rule augmented simultaneously by the lagged monetary policy and REER for Tunisia and Egypt are presented in Table 3.
Results in Table 3 show that all estimates, except the intercept, are significant and have the expected signs in both Tunisia and Egypt series. However, these coefficients are less than unity, which violates the stability condition in the Taylor rule. Additionally, according to the R2 criteria, we notice a good overall fit of the model for Tunisia. However, as can be seen in Table 3, the regression explains about 34.62% of the variation in the interest rate of Egypt. Also, there is no ARCH effect in the residuals of the estimated linear Taylor in both Tunisia and Egypt.
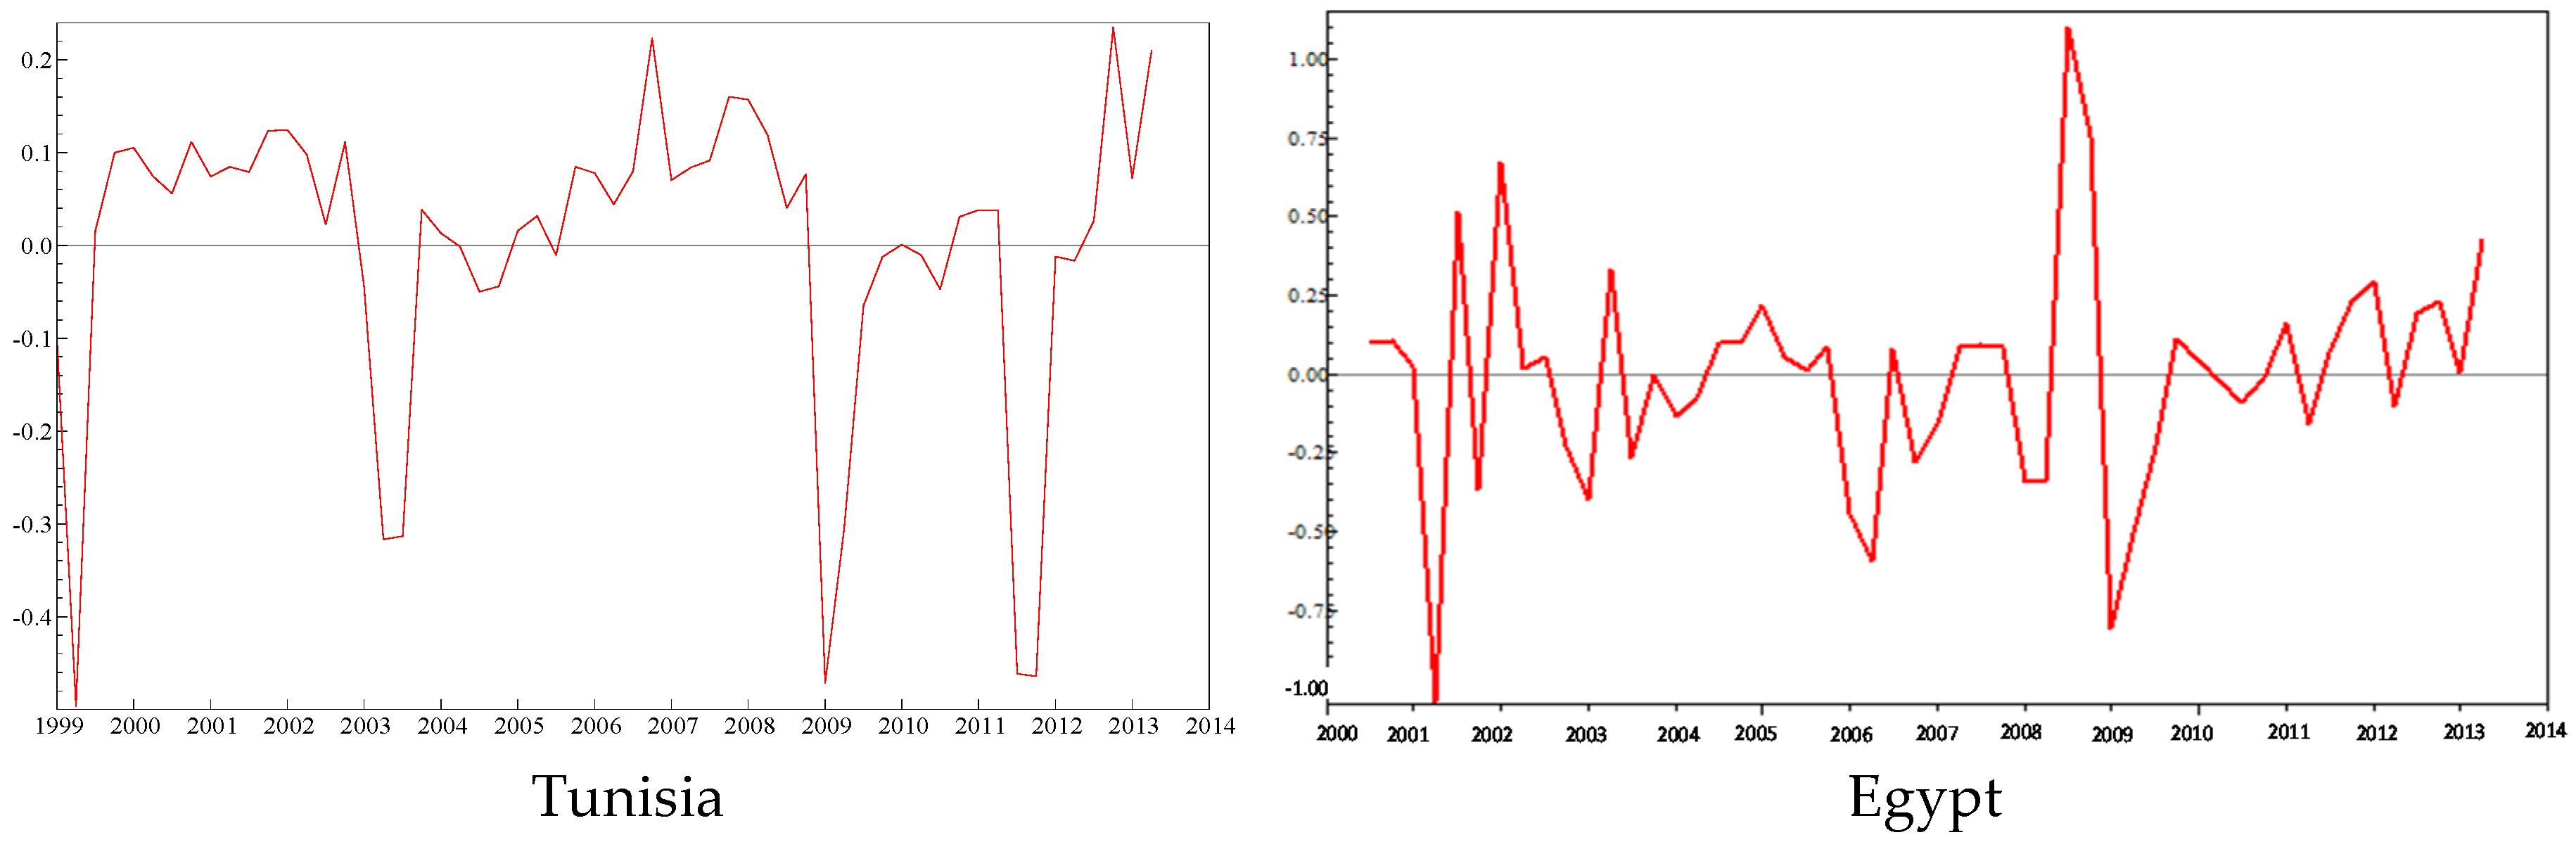
Inspection of the residuals series obtained from the estimation of the linear Taylor rule (Figure 2) reveals that the rule seems to capture the behavior of decision makers for both Tunisia and Egypt well. However, it is interesting to note that there are large residual spikes for more than one period notably in 1999–2000, 2003–2004, 2009 and 2011:Q4 for Tunisia and in 2001–2002, 2008–2009, 2011 and 2013 for Egypt. The fitted interest rate is, over these time intervals, correlated and remarkably different from the actual value.
Negative (positive) residuals correspond to periods when the estimated rule leads to a higher (lower) interest rate than the actual ones. Accordingly, in such periods, monetary policy appears to have been tightened (relaxed) beyond what was suggested by the inflation, the output gap, the lagged interest rate, and the REER deviations. This could be explained by the fact that a linear Taylor rule even augmented is not able to perfectly describe the conduct of monetary policy in the presence of unusual contingencies (Baaziz et al., 2013 [29]; Baaziz et al., 2014 [30]).
In summary, we can deduce that although the linear Taylor rule describes well the broad contours of Tunisia and Egypt’s behavior, it fails to detect significant changes in policy direction in response to in response to the effect the terrorist attack in the US in September 2001, the global financial crisis in 2008, and the effect of political instability with the onset of the revolution, which affected the economy of these countries. Thus, the actual presence of finer monetary regimes corrupts the descriptive power of linear rules even augmented by the lagged policy rate and REER.
The theoretical basis of the linear rule comes from the assumption that policymakers have a quadratic and symmetric loss function and that the aggregate supply or Phillips curve is linear. However, in reality, this assumption is unrealistic; monetary authorities may have asymmetric preferences (Surico, 2007 [8]) and the underlying aggregate supply schedule might be nonlinear leading to a nonlinear adjustment of the policy rate (Dolado et al., 2005 [6]).
Therefore, a nonlinear Taylor rule may be more appropriate to explain the behavior of monetary policy, and thus the adoption of a nonlinear specification instead of the linear one would leads to a better fit of the policy rate of the Tunisian and Egyptian Central Bank.
To get a deeper understanding of this phenomenon and to investigate to what extent concerns of monetary policymakers are related to unexpected events, we adopt the LSTR model to test the hypothesis that the strength of the response of monetary policy to macroeconomic conditions depends on the level of risk facing the economy.

5.2. Nonlinear Specification Results

The results of the tests for the selection among transition variables candidates are reported in Table 4.
Considering the above results, we conclude that there is strong evidence against the linear specification of the Taylor rule and that the past interest rate is likely to be responsible for nonlinear behavior of BCT. Thus, the parameter set changes whenever the interest rate drops below or rises above some threshold value. With regard to the choice of the adequate transition variable for Egypt, the selected variable is the output gap because it provides the lowest p-value of the computed F-statistics for the rejection of the null hypothesis of linearity. Therefore, switching between regimes is controlled by output gap.
For Tunisia, the empirical work that is presented in Table 4 clearly shows that the monetary policy followed by the BCT can be described by a nonlinear Taylor rule and the dynamic of a lagged interest rate seems to be the main driver of monetary policy. This is consistent with Bruggemann and Riedel (2011) [31] and Alcidi et al. (2011) [32] identification of transition variable. They identify and use the lagged interest rate as a threshold variable. Thus the switching between regimes is controlled by concerns about hitting the zero lower bound of the nominal interest rate where policy instrument does not respond in the usual way to its determinants.
An economy is said to be in a “liquidity trap” when short-term nominal interest rates are at a minimum and when money creation is no longer able to stimulate the economy by driving down interest rates. A liquidity trap is related to situations of uncertainty which create great anxiety about the future among economic actors. In such circumstances, nobody would be willing to lend, assuming zero storing costs for cash and nominally riskless zero rate of return.
This problem returned to prominence with the Great Depression in the US (1929–1930). It has been suggested that monetary policy was completely ineffective by then, i.e., a liquidity trap prevailed. Similarly, there has been substantial debate regarding the bank of Japan’s (BoJ) monetary policy conduct during the 1990s and more recently with the Subprime Crisis. In such situations, the Fed’s traditional tools have been unable to provide further stimulus to the economy. The use of unconventional measures acts as substitutes to policy and aims to affect macroeconomic conditions.
Tunisia is not excluded as its economy was also mired in a slump, especially after the revolution of 2011. The first post revolution days were characterized by simultaneous sharp drops in demand and supply, accompanied by serious disturbances in the production system (sit-in, social unrest with strikes). Similarly, this period was marked by a sharp decline in foreign currency assets, down under the combined effect of the fall in the number of tourists visiting the country and exports of phosphates.
All these factors have led to a major shock reflected through the exceptional decline in real GDP growth. This brings the Tunisian economy to move into a situation of a liquidity trap when cuts in policy rates seem to have little or no impact of hick-starting demand and output (twice reducing its interest rate by 50 basis points both in June and September 2011).
This decline in interest rates failed to encourage the economic actors to lend money. These actors continue to be deaf to calls for consumption and investment as a result of growing anxiety about the future.
The empirical findings suggest that the monetary policy followed by the Egyptian Central Bank exhibits nonlinearity and concerns about recession seem to be the major determinant of the change in the conduct of monetary policy across regimes. Our results are consistent with those of Castro (2011) [33], whose findings support evidence of a nonlinear Taylor rule for the European Central Bank and for the Bank of England. The study argues that once the output gap approaches a certain threshold, these central banks begin to react aggressively to recession regimes. He also shows that the Fed's monetary policy is better described by a linear Taylor rule.
We attribute this finding to the sequence of adverse supply shocks that hit the Egyptian economy. During the time spam that we consider in this paper, Egypt underwent several shocks: the terrorist attack in the US in September 2001, the global financial crisis in 2008, and the effect of political instability with the onset of the revolution. When the world financial crisis began, central bankers had expectations regarding its extent. Unfortunately, a series of consequential shocks to the world economy, such as the Lehman Brothers bankruptcy, the AIG flop, and the crush of the Reserve Primary Fund (a large money market mutual fund in the US), spoiled these expectations, leading to the demolition of the financial system and the economy (Mishkin, 2011 [12]). Indeed, after the revolution the political instability in the country had increased uncertainty and led to a systematic capital outflow in the tourism sector, which prior to the revolution had represented 11% of the country’s GDP has been severely affected as tourism income plunged by 9 % after the January 25 revolution which took a toll on the Egyptian growth.
The test for the choice of the transition function is also presented in the Table 4. It indicates that an LSTR1 model better fits the Tunisian and Egyptian monetary policies. This model is often used to capture the asymmetric behavior of the business cycle in the sense that booms and busts are characterized by different dynamics (Teräsvirta and Anderson, 1992 [34]).
Furthermore, Equation (2) describes the model to be estimated with lagged interest rate as the selected threshold variable for Tunisia and with output gap as the selected threshold variable for Egypt, which split the samples into two regimes. Thus, the resulting detailed nonlinear LSTR model to be estimated is reported in Equation (4) for Tunisia and in Equation (5) for Egypt below.
i t = α 1 + ρ 1 i t 1 + b π .1 π t + b y .1 y t + b q .1 q t + ( α 2 + ρ 2 i t 1 + b π .2 π t + b y .2 y t + b q .2 q t ) G ( γ , c , i t 1 )
i t = α 1 + ρ 1 i t 1 + b π .1 π t + b y .1 y t + b q .1 q t + ( α 2 + ρ 2 i t 1 + b π .2 π t + b y .2 y t + b q .2 q t ) G ( γ , c , y t )
LSTR model estimation results are reported in Table 5.
Table 5 confirms our conjectures; the estimates clearly reveal the existence of two regimes. The first regime is very close to the linear augmented rule reported in Table 3 while the second (that we will call the low interest rate regime for Tunisia and the low output gap regime (recession) for Egypt) is at odds with the classical Taylor rule. It clearly shows the existence of a special regime that applies only to unusual economic conditions, in response to which central banks change their usual policy conduct.
Results in Table 5 show that the BCT reacts differently to the REER, the inflation rate and the output gap. This means that when the interest rate falls below the threshold value of 4.708%, monetary policy enters the liquidity trap regime where the policy instrument does not respond in the usual way to its determinants.
Similarly, the reaction of the Egypt's central bank to shocks on these variables changes depending on whether the level of the output gap is above or below the threshold value of –9.855.
The transition speed parameter is statistically significant and has an estimated value equal to 3.45 and 5.324 for Tunisia and Egypt respectively, indicating an abrupt change from one regime to another.
Our estimates suggest that the parameters of the monetary policy rule seem to change over time. We report that 1 > bπ.1 > bπ.2 in both Tunisia and Egypt. This result indicates an accommodative behavior of the interest rate to inflation in the special regime while it did not do so in a tranquil period. We also note that the Taylor principle is not satisfied in either regime; the estimated coefficient on inflation is always lower than one.
We also note that by.1 < by.2, indicating an asymmetric response from the BCT and ECB to the output gap. A plausible explanation is that for a period of distress, the monetary authority is concerned about the expense of recession, even at the expense of inflationary pressures.
Also bq.2 > bq.1 suggesting that the BCT pays close attention to the REER when setting its policy rate.
Additionally, the results reveal that ρ 2 < ρ 1 for both Tunisia and Egypt, that is, an accommodative response to the inertia of monetary policy during the special regimes, which is consistent with Mishkin’s view that considers when macroeconomic risk is high, policy in this setting tends to respond aggressively. For this reason, the degree of inertia in such cases tends to be lower than in more routine circumstances.
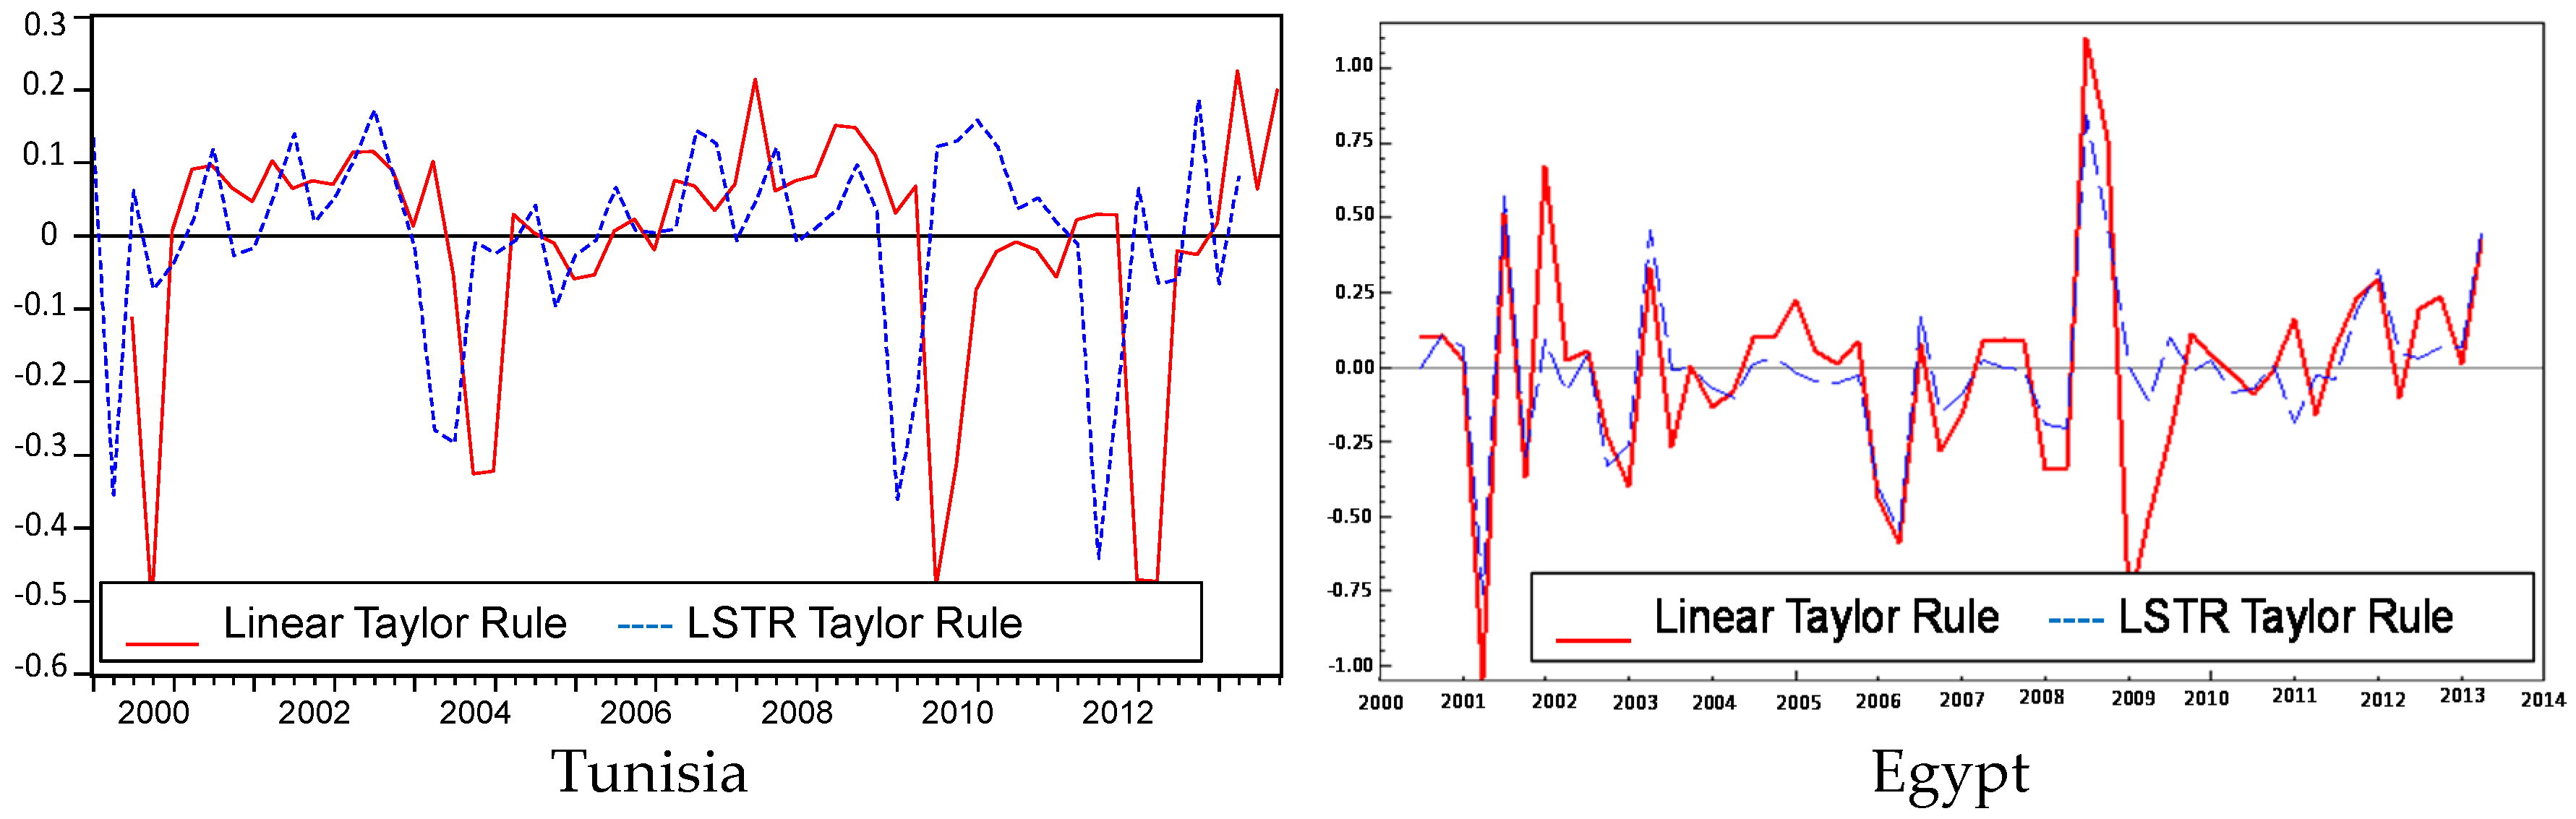
In order to better appreciate the gain in terms of fit obtained by leaving the linear rule for the nonlinear specification we plot in Figure 3 both the residuals from the augmented linear Taylor rule and the nonlinear specification. We notice that allowing for the functional form to deviate from a constant parameter Taylor rule allows good description of the broad contours of Tunisian and Egyptian monetary policy conduct especially in periods of special regime and reveals less autocorrelation of the residuals. Indeed, such special regimes refer to some special circumstances in which policy makers extensively use their judgment to make decisions.
From these results, we can see that although the linear rule effectively describes the broad contours of monetary policy of the BCT and the ECB; it fails to detect significant changes in policy direction following the onset of the revolution. These findings suggest that adopting a nonlinear specification instead of the linear one leads to a reduction in errors of 150 basis points (bps) in 1999, 2009 and 60 bps in October 2011 for Tunisia and 250 bps in 2001, 700 bps in 2009, and 200 bps in 2012 for Egypt.
So far, this paper has provided evidence that it is possible to characterize the behavior of the BCT as a two-state Taylor rule, with different coefficients depending on whether the interest rate is below or above an estimated threshold value. This means that when the interest rate (output gap for the case of Egypt) falls below that value, monetary policy enters the special regime. These special regimes require disconnection from the automatic pilot rule of the Central Bank and policymakers should extensively use their judgments to make decision.
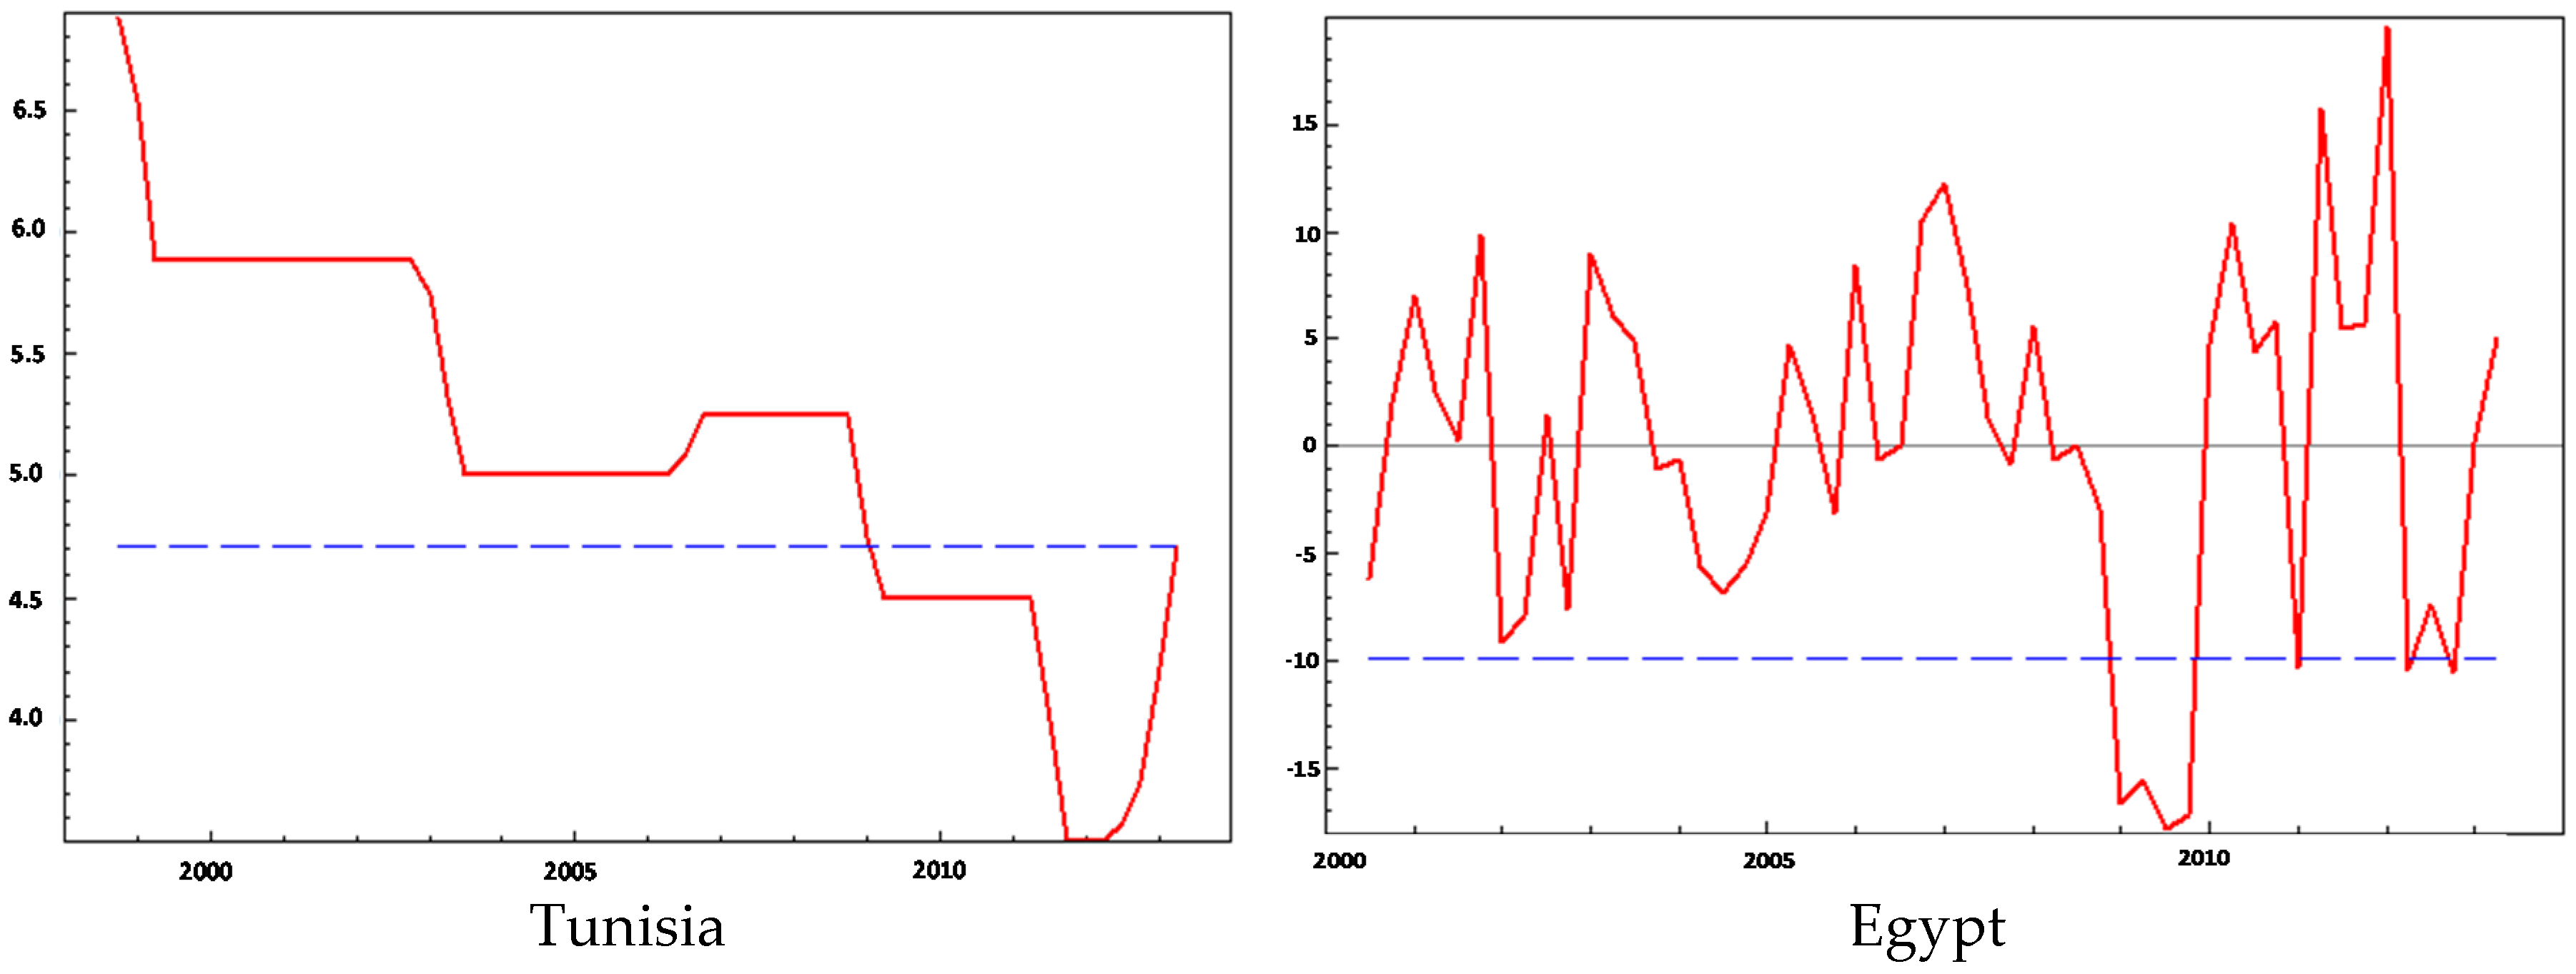
To better appreciate this similarity, the Figure 4 illustrates the transition variable and the estimated threshold.
By looking at the transition variable using the estimated threshold plot, we can identify the timing of the policy switching. In the case of Tunisia, a stronger response regime takes place when the interest rate approaches the edges of liquidity trap band, especially from 2009 onward. However, in the case of Egypt, the estimated threshold value of the output gap is equal to −9.855, indicating that when the output gap falls below that value, monetary policy enters the special regime.
Estimated threshold value splits the sample into two distinct periods of time. The shorter regime can be seen as a finer regime that applies only to unusual economic conditions which requires disconnection from the automatic pilot rule and the use of judgement to make decisions. The other one can be interpreted as the general regime that is at odds with the former one and associated with normal economic conditions.
The Subprime Crisis and the political events that have unfolded in Tunisia since the 14 January 2011 revolution took its toll on the Tunisian economy. Then, many thought that cuts in policy interest rate would contribute to kick-starting an economy mired in slump, but this decline in interest rates failed to get the economic actors out of their reserves. These actors continue to be deaf to calls for consumption and investment as a result of growing anxiety about the future. Tunisia, in such a period, is in a significant "liquidity trap" that monetary policy alone cannot solve. In such a situation, conventional monetary regulation is not able to fully absorb turbulent times (the fallout from the subprime mortgage crisis, the road to the “Jasmine Revolution”). The traditional solutions fall short to regulate these special contingencies. Therefore, unconventional policies need to be taken, whether of credit easing vs quantitative easing. These policies are likely to be a useful complement to monetary policy since their toolbox includes a wide range of operational instruments (capital requirement regulation, leverage ratios, Required Reserve Ratio...). Added to these unconventional instruments, forward guidance regarding the path of the interest rate aims to influence the private sector expectations of the future. However, so long as the BCT is deprived of benefiting from the dynamic bond market, it will remain a prisoner of its traditional instruments (conventional).
It is important to institute stimulus programs to boost the bond market to allow the BCT to intervene in the long compartment and push long rates down through the massive purchase of bonds.
Moreover, the Egyptian situation could be more comfortably limited to the Tunisian economy insofar as the short-term rates are relatively high. In this sense, high-potential economic growth could be boosted by more relaxed monetary policy as low interest rates is likely to give way to reducing the cost of borrowing and support growth. Indeed, this finer regime represents an additional argument to exert a corrective action such as fiscal consolidation measures to foster economic growth.
Overall, this section concludes that the nonlinear models outperform the linear ones in the sense that the linear specification, by imposing a unique constant regime over the entire sample, fails to capture the special events and unexpected contingencies respectively, with the global financial crisis in 2008 and the effect of political instability with the onset of the revolution.
We perform misspecification tests to check for the robustness of our results and determine whether there is evidence of parameter instability, non-normality of residuals, and remaining nonlinearity. These tests have been proposed by Eitrheim and Teräsvirta (1996) [28]. The results of these tests are presented in Table 6.
The results of diagnostic tests indicate the absence of ARCH effects in the residuals. Moreover, the remaining nonlinearity test shows that some of the nonlinearity was absorbed by an LSTR model with two regimes. So, we come to find evidence for the validity of our empirical nonlinear model in both Tunisia and Egypt. In addition, the parameter constancy test shows that the parameters do not vary over time if we consider the two first functional forms suggested by Eitrheim and Teräsvirta (1996) [28]. These various results therefore confirm the idea that the monetary policy followed by the BCT and the ECB exhibit a strong nonlinearity.

6. Conclusions

This paper has shed more light on challenging the suitability of the nonlinear Taylor rule in characterizing the behavior of the Tunisian and Egyptian central banks, especially in abnormal times.
Obviously, in a context dominated by uncertainty, the evolution of monetary policy over a long period may entail structural changes in the behavior of monetary authorities. The failure to take into account these changes may bias the results. This is why the recent literature tries to take asymmetry into account.
Building on this view, this paper has provided evidence that it is possible to characterize the behavior of MENA central banks, particularly in Tunisia and Egypt, as the two-state Taylor rule with different coefficients depending on whether the transition variable is below or above the estimated threshold value of 4.708 for Tunisia (−9.855 for Egypt). This means that when the interest rate (output gap for Egypt) falls below that estimated value, monetary policy enters the finer regime. These finer regimes require involving a range of judgment factors that cannot be included in a parametric approach when setting monetary policy decision.
Overall, the evolution of coefficients portrays a richer picture of MENA conduct and confirms once again our suggestions regarding the heterogeneity associated with these countries.

Author Contributions

Yosra Baaziz was responsible for conceptualizing the paper, framing its research objectives, identifying a suitable empirical methodology and ensuring overall quality control of the paper; while Moez Labidi contributed mainly into the interpretation of empirical results.

Conflicts of Interest

The authors declare no conflict of interest.

References

  1. J.B. Taylor. “Discretion versus policy rules in practice.” Carnegie Rochester Conf. Ser. Public Policy 39 (1993): 195–214. [Google Scholar] [CrossRef]
  2. R. Clarida, J. Galí, and M. Gertler. “Monetary policy rules in practice: Some international evidence.” Eur. Rev. 4 (1998): 1033–1067. [Google Scholar]
  3. L.E.O. Svensson. “What is wrong with Taylor rules? Using judgment in monetary policy through targeting rules.” J. Econ. Lit. 42 (2003): 426–477. [Google Scholar] [CrossRef]
  4. N. Batini, R. Harrison, and S.P. Millard. “Monetary Policy Rules for an Open Economy.” Available online: http://www.frbsf.org/economic-research/files/0103conf2.pdf (accessed on 7 April 2016).
  5. R. Nobay, and D. Peel. “Optimal discretionary monetary policy in a model of asymmetric central bank preferences.” Econ. J. 113 (2003): 657–665. [Google Scholar] [CrossRef]
  6. J. Dolado, R. Dolores, and M. Naveira. “Are monetary policy reaction functions asymmetric? The role of nonlinearity in the Phillips Curve.” Eur. Econ. Rev. 49 (2005): 485–503. [Google Scholar] [CrossRef]
  7. O. Karagedikli, and K. Lees. “Asymmetric monetary policy in Australia.” Econ. Rec. 82 (2006): S85–S96. [Google Scholar]
  8. P. Surico. “The Fed’s monetary policy rule and US inflation: The case of asymmetric preferences.” J. Econ. Dyn. Control 31 (2007): 305–324. [Google Scholar] [CrossRef]
  9. A. Cukierman, and A. Muscatelli. “Nonlinear Taylor Rules and Asymmetric Preferences in Central Banking: Evidence from the United Kingdom and the United States.” B.E. J. Macroecon. 8 (2008): 7. [Google Scholar]
  10. E. Schaling. “The Nonlinear Phillips Curve and Inflation Forecast Targeting.” 1999. Available online: http://www.bankofengland.co.uk/archive/Documents/historicpubs/workingpapers/1999/wp98.pdf (accessed on 15 April 2015).
  11. R. Nobay, and D. Peel. “Optimal monetary policy with a nonlinear Phillips curve.” Econ. Lett. 67 (2000): 159–164. [Google Scholar] [CrossRef]
  12. F.S. Mishkin. “Monetary Policy Strategy Lessons from the Crisis.” NBER Working Paper No. 16755. February 2011. Available online: https://www.imf.org/external/np/seminars/eng/2011/res2/pdf/fm.pdf (accessed on 8 April 2016).
  13. C. Conrad, and T.A. Eife. “Explaining inflation gap persistence by a time-varying Taylor rule.” J. Macroecon. 74 (2012): 59–75. [Google Scholar] [CrossRef]
  14. D.J. Lee, and J.C. Son. “Nonlinearity and structural breaks in monetary policy rules with stock prices.” Econ. Model. 31 (2013): 1–11. [Google Scholar] [CrossRef]
  15. E. Olsen, W. Enders, and E. Vohar. “An empirical investigation of the Taylor curve.” J. Macroecon. 32 (2012): 392–404. [Google Scholar] [CrossRef]
  16. F. Kolman. “The asymmetric reaction of monetary policy to inflation and the output gap: Evidence from Canada.” Econ. Model. 30 (2013): 911–923. [Google Scholar]
  17. C.W.J. Granger, and T. Terasvirta. Modelling Nonlinear Economic Relationships. New York, NY, USA: Oxford University Press, 1993. [Google Scholar]
  18. R. Al-Mashat, and A. Billmeier. “The Monetary Transmission Mechanism in Egypt.” Working Paper WP/07/285. IMF, 2007. Avaiable online: https://www.imf.org/external/pubs/ft/wp/2007/wp07285.pdf (accessed on 8 April 2016).
  19. J.M. Fleming. “Domestic Financial Policies under Fixed and under Floating Exchange Rates.” Staff Papers, Int. Monet. Fund 9 (1962): 369–379. [Google Scholar] [CrossRef]
  20. R.A. Mundell. “The Significance of Capital Mobility for Stabilization Policy under Fixed and Flexible Exchange Rates.” Can. J. Econ. Polit. Sci. 29 (1963): 475–485. [Google Scholar] [CrossRef]
  21. A. Boughrara, M. Boughzala, and M. Moussa. Are the Conditions for the Adoption of Inflation Targeting Satisfied in Morocco. Giza, Egypt: The Economic Research Forum (ERF), 2008. [Google Scholar]
  22. G.D. Rudebusch. “Term Structure evidence on interest rate smoothing and monetary policy inertia.” J. Monet. Econ. 49 (2002): 1161–1187. [Google Scholar] [CrossRef]
  23. T. Teräsvirta. “Modelling economic relationships with smooth transition regressions.” In Smooth Transition Regression Modelling. Edited by H. Lutkepohl and M. Kratzig. Cambridge, UK: Cambridge University Press, 1998, pp. 222–242. [Google Scholar]
  24. D. Van Dijk, T. Teräsvirta, and P.H. Franses. “Smooth transition autoregressive models—A survey of recent developments.” Econ. Rev. 21 (2002): 1–47. [Google Scholar] [CrossRef]
  25. T. Teräsvirta. “Specification, estimation and evaluation of smooth transition autoregressive models.” J. Am. Stat. Assoc. 89 (1994): 208–218. [Google Scholar]
  26. R. Luukkonen, P. Saikkonen, and T. Teräsvirta. “Testing linearity against smooth transition autoregressive models.” Biometrika 75 (1988): 491–499. [Google Scholar] [CrossRef]
  27. T. Teräsvirta. “Smooth transition regression modelling.” In Applied Time Series Econometrics. Edited by H. Lutkepohl and M. Kratzig. Cambridge, UK: Cambridge University Press, 2004, pp. 222–242. [Google Scholar]
  28. Ø. Eitrheim, and T. Terasvirta. “Testing the adequacy of smooth transition autoregressive models.” J. Econ. 74 (1996): 59–75. [Google Scholar] [CrossRef]
  29. Y. Baaziz, M. Labidi, and A. Lahiani. “Does the South African Reserve Bank follow a nonlinear interest rate reaction function? ” Econ. Model. 35 (2013): 272–282. [Google Scholar] [CrossRef]
  30. Y. Baaziz, and M. Labidi. “What can nonlinear Taylor rule say about the Egyptian monetary policy conduct? ” Int. J. Innov. Appl. Stud. 9 (2014): 1245–1257. [Google Scholar]
  31. R. Bruggemann, and J. Riedel. “Nonlinear interest rate reaction functions for the UK.” Econ. Model. 28 (2011): 1174–1185. [Google Scholar] [CrossRef]
  32. C. Alcidi, A. Flamini, and A. Fracasso. “Policy regime changes, judgment and Taylor rules in the Greenspan Era.” Economica 78 (2011): 89–107. [Google Scholar] [CrossRef]
  33. V. Castro. “Can central banks’ monetary policy be described by a linear (augmented) Taylor rule or by a nonlinear rule? ” J. Financial Stab. 157 (2011): 228–246. [Google Scholar] [CrossRef]
  34. T. Teräsvirta, and H.M. Anderson. “Characterizing nonlinearities in business cycles using smooth transition autoregressive models.” In Nonlinear Dynamics, Chaos and Econometrics. Edited by M.H. Pesaran and S.M. Potter. Hoboken, NJ, USA: Wiley, 1992, pp. 111–128. [Google Scholar]
  • 1The former Article 33 of May 2006, Central Bank law stated that “the ultimate objective of monetary policy is to safeguard the value of the currency by keeping inflation down to a rate close to the rate observed in partner and competitor countries”.
Figure 1. Evolution of the transmission channels of the Tunisian and Egyptian monetary policy.
Economies 04 00006 g001
Figure 2. Residual plot from Equation (1).
Economies 04 00006 g002
Figure 3. Residual plot from the linear and LSTR models.
Economies 04 00006 g003
Figure 4. Transition variable using the estimated threshold.
Economies 04 00006 g004
Table 1. Sample size in time series analyses.
CountryObsSample Period
Tunisia641998 Q4→2013 Q4
Egypt542000 Q1→2013 Q2
Table 2. Stationarity test results.
i t π t y t q t Δ i t Δ π t Δ q t
Tunisia
ADF−2.633 ***−0.4959−4.66 ***−3.702 ***---−5.714 ***---
KPSS0.6537 ***0.9480.0801 ***1.9421---0.0312 ***---
ZA−7.626 ***−3.6865−5.3419***−6.3857 ***---−7.368 ***---
Egypt
ADF−0.8092−0.7317−3.587 ***−0.7799−4.8753 ***−5.766 ***−2.754 ***
KPSS1.2880.86520.046 ***0.4312 **0.1358 ***0.0546 ***0.4413 **
ZA−2.546−1.362−6.204 ***−3.105−5.387−8.452−6.539
This table reports the results of ADF, KPSS and Zivot-Andrews stationarity tests. it, πt, yt and qt stand for interest rate, inflation rate, output gap, and real exchange rate, respectively. 1% and 5% Critical values for the ADF test are −2.56 and −1.94 whereas those of the KPSS test are 0.463 and 0.739, respectively. *** and ** indicate significance at the 1% and 5% significance levels respectively.
Table 3. Estimation results of linear augmented Taylor rule.
TunisiaEgypt
Estimatest-StatisticsEstimatest-Statistics
α 0.2070.066−0.0060.366
b π 0.031 *0.15630.044 ***1.8633
b y −0.0045 ***3.2150.013 ***3.166
ρ 0.915 ***3.66120.337 ***3.4081
b q 0.0053 *2.1360.018 **1.182
AIC−3.41−1.9772
R 2 0.9450.3462
ARCH (8)11.793 [0.1607]9.8408 [0.0017]
This table reports the estimates of the linear Taylor rule augmented jointly by the lagged policy rate and the real exchange rate. p-values are between []. ***, ** and * indicate significance at the respective significance levels 1%, 5%, and 10%.
Table 4. Testing Linearity against STR results.
FF2F3F4Selected Model
Tunisia
it−13.7702 × 10−43.637 × 10−17.873 × 10−32.383 × 10−3LSTR1
yt8.792 × 10−28.959 × 10−22.303 × 10−12.32 × 10⁻¹Linear
πt1.4092 × 10−11.179 × 10−16.602 × 10−11.1439 × 10⁻¹Linear
qt3.2244 × 10−22.457 × 10−17.5092 × 10−27.9037 × 10⁻²LSTR2
Egypt
it−11.5013 × 10−31.0905 × 10−12.6572 × 10−26.9245 × 10−3LSTR1
yt4.1783 × 10−48.9142 × 10−37.7167 × 10−28.9499 × 10⁻³LSTR1
πt2.4598 × 10−29.741 × 10−23.5677 × 10−12.0537 × 10⁻²LSTR1
qt2.4421 × 10−21.7443 × 10−11.0814 × 10−14.135 × 10⁻²LSTR1
This table reports the results of the test of linearity against the STR nonlinearity. All numbers in this table are p-values associated with the test. All p-values are higher than 1% except the p-value associated to the lagged interest rate and hence linearity is rejected only for it-1. F refers to the test of linearity against LSTR while, F2, F3, and F4 allow to select the adequate LSTR model among LSTR with one threshold (LSTR1) and LSTR with two thresholds (LSTR2).
Table 5. Nonlinear monetary policy rules: Evidence for the MENA central banks (Tunisia, Egypt).
TunisiaEgypt
Linear part
Constant4.808 (40.763)−1.469 (23.652)
i t 1 0.892 *** (1.814)0.972 *** (2.382)
y t −0.007 *** (4.058)−0.1049 ** (1.24)
π t 0.077 (0.167)0.2237 ** (0.983)
q t −0.046 (0.045)−0.1967 ** (1.058)
Nonlinear part
Constant−3.655 (40.453)1.5539 (18.947)
i t 1 −0.393 (0.709)0.592 ** (2.104)
y t 0.019 *** (3.978)0.1039 (0.558)
π t 0.068 (0.124)−0.2141 *** (2.298)
q t 0.061 (0.092)0.1039 (0.372)
γ 3.455 ** (1.480)5.324 * (5.789)
c4.708 *** (0.218)−9.855 *** (5.465)
AIC−3.622−2.135
R 2 0.9650.5916
Jarque-Bera31.401 [0.000]51.7188 [0.000]
ARCH(8)3.3436 [0.911]2.6563 [0.954]
This table reports the estimates of the nonlinear Taylor rule. t-Statistics are between ( ) and p-values are between []. ***, ** and * indicate significance at the respective significance levels 1%, 5%, and 10%.
Table 6. Diagnostic tests results.
Parameter Constancy Test Results
Transition VariableTunisiaEgypt
H11.8391 0.10152.1958 0.062
H21.8854 0.06881.412 0.203
H32.36 0.02754.3635 0.012
No remaining nonlinearity test results
Tunisia
Transition VariableFF2F3F4
T A O ( t 1 ) 1.85 × 10−46.41 × 10−28.876 × 10−25.939 × 10−4
Egypt
Transition VariableFF2F3F4
Output gap7.035 × 10−15.85 × 10−13.226 × 10−18.6529 × 10⁻¹
This table reports the diagnostic tests of parameter constancy and no remaining nonlinearity. With regard to the parameter constancy test, H1, H2, and H3 refer to the three functional forms of the transition function considered by Eitrhem and Teräsvirta (1996) [28]. The no remaining linearity test uses the sequence of the F-statistics.

