
Demand for Money in the United States: Stability and Forward-Looking Tests

Finance and Economics Department, Utah Valley University, Orem, UT 84058-5999, USA
Economies 2024, 12(2), 49; https://doi.org/10.3390/economies12020049
Submission received: 28 December 2023
/
Revised: 5 February 2024
/
Accepted: 8 February 2024
/
Published: 16 February 2024
(This article belongs to the Section Macroeconomics, Monetary Economics, and Financial Markets)
Abstract
:This study shows that demand for money is a function not only of interest rate, real exchange rate, and personal consumption but also of fiscal variables like deficit, debt, and foreign-financed debt. It is stable over the short and long run. This study also covers the investigation of policy invariance of money demand, an important issue ignored so far in the existing literature on the demand for money in the United States. It was found that the behavior of agents in the money market changes as the real exchange rate, consumption, and interest rate change. Namely, agents in the money market are forward-looking, and their expectations are formed rationally. This also means that even though the parameters of money demand are stable, according to the stability test results, they can be unstable, as agents adapt their behavior based on any change in the exchange rate, consumption, and/or interest rate. In other words, the contemporaneous real exchange and interest rate variables are not superexogenous in demand for M1, and the contemporaneous consumption is not superexogenous in demand for M2.
1. Introduction
Modern quantitative macroeconomics often assumes the stability of money demand (especially M1 or M2) despite the observed instability in numerous countries, particularly when considering changes in the real exchange rate and the gross interest rate. This study examines this significant issue by analyzing the stability of short- and long-run coefficients and the result of policy shocks on agents’ behavior with respect to demand for money. Namely, are agents in the money market forward-looking, and do they change their behavior as real exchange rate, gross interest rate, and consumption change? In other words, is (are) the contemporaneous variable(s) in the error correction model of M1 or M2 superexogenous? If not, then seemingly stable money demand may not be stable as agents change their behavior following policy regime changes. These two issues have not been paid attention to in the specification and stability of money in the United States.
Hoffman et al. (1995), for example, argue that maintaining a stable money demand function is crucial for macroeconomic theories and the implementation of an effective monetary policy. A money demand function that is unstable complicates matters when predicting how the economy will respond to changes in monetary policy, leading to uncertainty and potential economic disruptions.
The significance of a stable money demand function is a basic tenet of many different macroeconomic theories. These include the monetarist theory (Friedman 1956) and Neo-Classical models, which focus on the behavior of individual households and firms (e.g., Sargent and Wallace 1975) and also rely on a stable money demand function to understand how changes in monetary policy affect the economy. Macroeconomic theories also encompass models that depict real business cycles (King et al. 1991) and Neo-Keynesian models (e.g., Mankiw 1991), which are an extension of John Maynard Keynes’ original ideas and recognize the importance of a stable money demand function in the context of understanding how monetary policy affects overall economic activity.
It is worth noting that instability in a model can arise simply due to the exclusion of a significant variable or by a shift in regime. In fact, the stability of money demand is especially critical for policymakers as it insures policy effectiveness or safeguards it against its potential failure if its implementation leads to an unpredictable movement in the model. This situation can occur if agents change their behavior when there is an internal or external shock. This can happen when the contemporaneous real exchange rate and gross interest rate variables in the short-run dynamics of the M1 model or consumption in the M2 model are not superexogenous.
Lucas (1976) makes the distinction between temporal stability and policy invariance in the context of money demand function. Temporal stability means that the parameters of the money demand equation estimated from data collected over a period remain constant, regardless of the monetary policy changes. Policy invariance, on the other hand, means that the parameters of the money demand function remain the same over different monetary policy changes or exogenous shocks. It is possible for a money demand function to be temporally stable but not policy invariant if the parameters of the function change in response to different monetary policy regimes or exogenous shocks. Similarly, it is possible for a money demand function to be policy invariant but not temporally stable if the parameters change over time but remain constant across different policy regimes or shocks. Therefore, both temporal stability and policy invariance are important properties for the money demand function in order to have a robust and accurate understanding of money demand behavior.
To the best knowledge of the author, only a few existing studies, e.g., Favero and Hendry (1992) and Engle and Hendry (1993), have tested the policy invariance of the demand for money in the United States. There was no such testing in the studies of money demand by Bahmani-Oskooee and Nayeri (2019), Watanabe and Yabu (2018), Mogliani and Urga (2018), Lucas and Nicolini (2015), Ragot (2014), Belongia and Ireland (2014), Sousa (2014), Ball (2012), Wang (2011), Reynard (2004), Dutkowsky and Atesoglu (2001), Tanner and Devereux (1993), Hafer and Jansen (1991), Deravi et al. (1990), and Mankiw and Summers (1986).
This lack of testing for policy invariance, except for Kia and Darrat (2007), who studied policy invariant demand for money in Iran, and Sekine (1998), who estimated demand for broad money in Japan using the superexogeniety test, was also noted in the studies with reference to countries other than the United States. Although none of the following studies explored the policy invariance of parameters of demand for money, Khawaja (2022) examined whether the M3 money demand function was stable for the Gulf Cooperation Council consisting of six Arabian Gulf countries; Barnett et al. (2022) estimated and tested the stability of demand for money in the European Monetary Union, India, Israel, Poland, the UK, and the U.S.; Benati et al. (2021) tested money demand for 35 countries; Boucekkine et al. (2021) estimated the money demand for Algeria; Adil et al. (2020) examined the same for India, Nel et al. (2020) for Hungary, Albulescu et al. (2019) for Central and Eastern European countries, and Hossain (2019) for Australia. Bahmani-Oskooee and Nayeri (2018) investigated money demand responses to different measures of uncertainty using Australian data; Dou (2018) estimated demand for money in China; Tweneboah and Alagidede (2018) tested the stability of demand for M1 and M2 in Ghana; Rao and Acharya (2018) estimated the demand for real M3 using data from India; Tümtürk (2017) estimated and tested the stability of demand for real M1 in Turkey; Bahmani-Oskooee and Bahmani (2015) estimated the same for real M2 on Iranian data; Khrawish et al. (2012) tested the demand for money in Jordan; and Boone and van den Noord (2008) estimated the demand for M3 in Euro areas.
In this paper, we find that, besides other fiscal variables, foreign-financed debt per GDP has a significant effect on the demand for money. While the demand for money remains consistent in both the short and long term, the agents modify their behavior with the change in the real exchange rate and gross interest rate (interest rate hereafter) toward M1 and consumption toward M2; i.e., these variables are not superexogenous in the short-run dynamics of the system. Namely, agents are forward-looking and form their expectations in a rational manner.
2. The Model
Consider an economy where a single consumer represents many identical consumers, as Kia (2014) suggests. The consumer seeks to maximize the utility function expressed as:
where ct and are single, non-storable, real domestic and foreign consumption goods, respectively. is the holdings of domestic real cash balances (), where is the nominal money supply, and pt is the domestic price. The variable k summarizes the risk, both positive and negative, associated with holding domestic currency. E is the expectation operator, and the discount factor meets the condition 0 < β < 1. Furthermore, α, η, and ξ are positive parameters. Based on Kia’s (2014) research, we assume 0.5 < α < 1 and 0.5 < η < 1. As Kia (2014) shows, the violation of this assumption will not change the result.
Let us modify Equation (4) from Kia’s (2014) study and assume over the long run:
where defgdp is the government deficit per GDP, debtgdp is the government debt outstanding per GDP, and fdgdp is the government foreign-financed debt per GDP. Another point to consider is that, contrary to Kia, the variable k, which represents risk, does not include government expenditure per GDP. According to Kia (2013, 2014), the government debt and deposits at the bank are assumed to pay the same interest rate (i.e., R). Let us also assume that agents, when facing risks, use real or interest-bearing assets instead of money. Contrary to Kia (2014), we assume that an outstanding government debt per GDP acts as wealth for its holders and leads to a lower k, and, through its wealth effect, demand for money goes up. Individuals hold government bonds to cover extra future expenditures, including tax expenditures. Let us also assume that a higher outstanding government bond/debt creates a higher speculative and precautionary demand for money, so k falls.
log(kt) = k0 defgdpt + k1 debtgdpt + k2 fdgdpt
Consequently, like Kia (2014), we hypothesize constant coefficients k0 > 0, k1 < 0. Furthermore, let us assume, as Kia (2013, p. 166) does, that “an increase in the amount of government debt held by foreign investors may be considered a cause for future devaluation of the domestic currency.” For example, “when a large amount of government-issued bonds is held by foreign investors, there is always the risk that these investors decide to dump those bonds. Such an action would result in an increase in the supply of the country’s currency and so a devaluation of the currency. Consequently, the demand for domestic money may fall if a large portion of the government debt is financed externally, implying k2 > 0.” As we will see in this paper, all the above assumptions are proved empirically to be the case in the United States in the short and long run.
As described by Kia (2014, pp. 22, 23), given defgdp, debtgdp, fdgdp, and inflation rate π, “the consumer maximizes Equation (1) subject to the following budget constraint:
where τt is the real value of any lump-sum transfers/taxes received/paid by consumers, et is the nominal exchange rate, pt* and pt are the foreign and domestic price levels of foreign and domestic goods, respectively, yt is the current real endowment (income) received by the individual, and dt is the one-period real domesticallly-financed government debt which pays R rate of return. Assume further that dt is the only storable financial asset which pays interest rate. We approximate pt*/etpt as the real trade-weighted US dollar index (qt, real effective exchange rate hereafter), which is defined as a trade-weighted average of the foreign exchange value of the US dollar against the currencies of a broad group of major U.S. trading partners.”
τt + yt + (1 + πt)−1 mdt−1 + (1 + πt)−1 (1 + Rt−1) dt−1 = ct + pt*ct*/et pt + mdt + dt
Let us maximize the preferences with respect to md, c, c*, and d and subject to the budget constraint (3) for the given output and fiscal variables to obtain:1
where
log(mdt) = m0 + m1 it + m2 log(ct) + m3 log(kt) + m4 log(qt)
it = log(Rt/1 + Rt), using 0.5 < α < 1 and 0.5 < η < 1 we will have:
m0 = > 0, m1 = − < 0, m2 = > 0,
m3 = < 0 and m4 = > 0.
The negative coefficient of k implies that the risk linked to holding money reduces demand for money. Namely, the result depends on the sign of kj, for j = 0 to 2. The equilibrium requires log(mdt) = log(mst), where ms is the real money supply. Let us substitute Equation (2) for log(k) in Equation (4) to obtain:
where an l before a variable implies the log of the variable, β1 = m0, β2 = m1 < 0, β3 = m2 > 0, β4 = m3 k0 < 0, β5 = m3 k1 > 0, β6 = m3 k2 < 0, and β7 = m4 > 0.
log(mdt) = m0 + m1 it + m2 log(ct) + m3 k0 defgdpt + m3 k1 debtgdpt + m3 k2 fdgdpt + m4 log(qt), or
lmdt = β1 + β2 it + β3 lrpct + β4 defgdpt + β5 debtgdpt + β6 fdgdpt + β7 lqt + ut
Equation (6) is a long-run money demand function, where ut is an error term that is assumed to be white noise. According to Equation (6), a higher interest rate results in a lower demand for money over the long run. A higher real personal consumption rpc (=c) results in a higher real demand for money.
As described by Kia (2014), money demand falls because of an increased deficit and externally financed debt as a percentage of GDP since they create greater uncertainty and risk associated with holding money. The impact of interest-financed outstanding government debt on demand for money is positive since it leads to an increased speculative demand for money. As Kia (2014, p. 23) mentions, “a higher real effective exchange rate results in a lower demand for foreign products (imports), which in turn results in a higher demand for domestic goods and services.” This demand results in an increased transaction demand for money. “In other words, since variable q is a weighted average of the foreign exchange value of the US dollar against the currencies of a broad group of major U.S. trading partners, a higher q leads to a lower foreign competitiveness through higher relative import prices.” Consequently, demand for goods produced domestically will increase, leading to a higher transaction demand for money. Similarly to Kia (2014), theoretically, we expect β7 to be positive. As mentioned by Kia (2014, p. 24), “It should be emphasized that the long-run Equation (8) [in the original article] is also subject to a short-run dynamic of the system which includes stationary variables representing crisis as well as policy regime changes and other exogenous factors that affect the system.”
It should be noted that as policy regime changes, i.e., a higher deficit, debt, and/or foreign financing of the debt, agents may expect higher inflation or taxes. They may also expect that a higher foreign financing of the debt will cause a reduction in the foreign value of the domestic currency. Consequently, such a forward-looking expectation may change their behavior toward their demand for money. The current literature overlooked this issue.
The forward-looking behavior of agents causes the parameters of the error correction model (ECM) to no longer be invariant to the process of forcing variables, as mentioned by Lucas (1976). The forward-looking action of agents leads to at least one parameters to vary with changes in the expectation process. In other words, at least one variable in the ECM does not meet the criteria of being superexogenous in the sense of Engle et al. (1983) and Engle and Hendry (1993).
Let us develop a hypothesis on superexogeneity and invariance associated with Equation (6). Assume the set of variables Zt represents the contemporaneous stationary (first difference) money demand, including all contemporaneous variables in the conditional model. Assume also the information set It contains the past values of ∆lmdt and Zt, as well as the current and past values of other valid conditioning variables included in Zt.2 Furthermore, formulate, respectively, the conditional moments of ∆lmdt and Zt as ηtmd = E(∆lmdt|It), ηZt = E(Zt|It), σtmd = E[(∆lmdt − ηmdt)2|It] and σtZZ = E[(Zt − ηZt)2|It], and let σtmdZ = E[(∆lmdt − ηmdt)(Zt − ηZt)|It].
To test for policy invariance, assume the joint distribution of ∆lmdt and conditional on the information set to have a normal distribution with mean ηt = [ηtmd,] and a varying error covariance matrix . Let us follow Engle et al. (1983) and Engle and Hendry (1993) and express the relationship between ∆lmdt and as:
where α0, ψ0, ψ1, ψ2, ψ3, ψ4, ψ5, δ0, and δ1 are regression coefficients of ∆lmdt and conditional on z’tγ, and the error term Єt is assumed to be white noise, following a normal, identical, and independent distribution. Vector z includes all past values of ∆lmdt, Zt, and other possible explanatory variables in ECM associated with long-run Equation (6), plus present and past values of other pertinent conditioning variables.
∆lmdt = α0 + ψ0 Zt + (δ0 − ψ0) (Zt − ηZt) + δ1 σtZZ (Zt − ηZt) + ψ1 (ηZt)2 + ψ2 (ηZt)3
+ ψ3 σtZZ ηZt + ψ4 σtZZ (ηZt)2 + ψ5 (σtZZ)2 ηZt + z’tγ + Єt
+ ψ3 σtZZ ηZt + ψ4 σtZZ (ηZt)2 + ψ5 (σtZZ)2 ηZt + z’tγ + Єt
It should be noted that some control/target variables that can be influenced by policy interventions are included in Zt. According to the assumption of weak exogeneity, δ0 − ψ0 = 0. Similarly, under the assumption of invariance, ψ1 = ψ2 = ψ3 = ψ4 = ψ5 = 0 which ensures that ψ0 = ψ. Let us assume σtZZ exhibits distinct values over various yet clearly defined regimes; then, under the null of constancy of δ, we need δ1 = 0. If all these assumptions are agreed upon, the equation will be condensed to the ECM. Note that “superexogeneity is sufficient but not a necessary condition for valid inference under intervention” (Engle et al. 1983, p. 284). That is because we can easily formulate estimable models with parameters that remain constant and without any weakly exogenous variables.
3. Empirical Evidence
3.1. Long-Run Relationship
Quarterly US data were used to estimate the model for the sample period 1980Q4–2022Q4 for the demand for M1, and because of the change in the definition of M2 by the Federal Reserve in 2020, the sample period 1980Q4–2020Q1 for the demand for M2 was used. The selection of the sample period depends on the data availability. Data on the federal surplus or deficit were not available before 1980Q4.3 The Federal Reserve Bank of St. Louis (FRED) was the source of all data. Ms is real M1 or real M2 and i (=log (Rt/1 + Rt)), where R is the three-month Treasury Bill rate. Variable rpc (=c) is the real personal consumption. Fiscal variables include defgdp, debtgdp, and fdgdp, which are the U.S. federal government deficit, outstanding debt, and foreign-financed federal debt as a percentage of GDP, respectively. The price-adjusted real effective exchange rate (q) is the real trade-weighted US dollar index, calculated as the average of daily figures.
All variables have been adjusted for seasonality and, when applicable, are expressed in billions of dollars. The Augmented Dickey–Fuller and non-parametric Phillips–Perron tests are used to test the stationary property of the variables. Lee and Strazicich (2003) tests (which were adjusted for four structural breaks in intercept and slope), Perron tests (Perron 1997), and Zivot and Andrews (1992) tests were also used. Based on the test findings, all variables are non-stationary (integrated of degree one). However, Zivot and Andrews’ test result indicates that changes in the variable debt as a percentage of GDP are stationary only at the 90% level of significance.4
Table 1 reports the long-run estimation result for the log of M1. The first and second panels show Johansen–Juselius Maximum Likelihood (JJML) estimation results. In determining the lag length, we employed the Lagrange Multiplier (LM) testing procedure to ensure that the lag profiles used in the tests are sufficiently long to generate residuals that exhibit no autocorrelation. As it was recommended by Hansen and Juselius (1995, p. 26), set p = ρ (the order of cointegration) in Equation (6) and test for autocorrelation. LM(1) and LM(2) are utilized to validate the selection of lag length. According to the diagnostic test, there is no autocorrelation observed with the chosen lag length of 6 for the estimation of M1 and 12 for the estimation of M2, and the error does not follow a normal distribution. However, according to Johansen (1995), a deviation from normality is not overly concerning in cointegration testing; see also Hendry and Mizon (1998). We also allowed the dummy variables Uscrisis and Covid to affect the short-run dynamics of the system. Uscrisis is the dummy variable to reflect the U.S. financial crisis of 2007. It is equal to one in the period 2007Q4–2009Q3 and zero otherwise. Covid is a dummy variable to reflect the impact of the COVID-19 pandemic. It is equal to one since 2020Q1 and has a value of zero for all other periods. Furthermore, we conducted the multiple structural change test by Bai and Perron (2003) allowing for a maximum of two breaks to identify the optimal number of breaks. Based on the test result, structural changes in 2006Q2 and 2016Q4 in the estimation of demand for M1 and 1992Q2 and 1998Q2 in the estimation of demand for M2 are observed for trimming factor of 0.15. Dummy variables D2006Q1, equal to one from the 2006 first quarter and zero otherwise, and D2016Q4, equal to one from the 2016 fourth quarter and zero otherwise, were added in the estimation of demand for M1. Dummy variables D1992Q2, equal to one from the 1992 second quarter and zero otherwise, and D1998Q2, equal to one from the 1998 second quarter and zero otherwise, were added in the estimation of demand for the log of M2. However, none of these four dates are associated with any economic event that can affect the U.S. long-run demand for money up to the last quarter of 2022. In fact, as we will see, we need to restrict these two dummy variables to obtain an identified demand for money.5
Based on the Trace test result, the first panel of Table 1, there are three cointegration relationships in space. Since multiple cointegrating relationships exist, we must identify the estimated cointegrating vectors. This approach ensures that the estimated coefficients of cointegrating equations are meaningful and preserve the uniqueness of all coefficients. Following Johansen and Juselius (1991) and Johansen (1995), among many others, we can examine possible economic hypotheses using the cointegrating vectors present in the system. The middle panel of Table 1 displays the identified relationships. Based on the Chi-squared values, restrictions are jointly accepted, and the system is identified à la Johansen’s (1995) Theorem 3.6 Namely, Johansen and Juselius (1991) argue that testing for cointegration requires two types of identifications: generic (associated to the linear statistical model and requiring the rank condition) and empirical identifications.
Note that the range of normalization to obtain standard errors (t-statistics) was limited as we could only normalize money demand, real exchange rate, and gross interest rate variables. The first row of the middle panel of Table 1 presents the long-run demand for money function. As explained above, the dummy variables Uscrisis and Covid and breaks (D2006Q1 and D2016Q4) needed to be restricted to ensure an identified demand for money equation. As observed, all coefficients associated with money demand, except the coefficient of the gross interest rate, are statistically significant. Furthermore, all of the coefficients have corrected signs as specified by the model.
As the interest rate increases, we have a lower demand for money over the long run. A higher personal consumption in the U.S. leads to a greater demand for money over the long run. A higher deficit and a higher foreign-financed debt result in lower money demand. A higher debt per GDP results in a higher demand for money. Everything else is constant; demand for money will increase as the exchange rate increases (the value of the US dollar falls). That is, according to the estimated coefficient of lq, an increase in the effective real exchange rate in the U.S. (lower foreign competitiveness) leads to an increased demand for US dollars.
To enhance robustness, we also used Phillips and Hansen’s (1990) Fully Modified Least Squares (FMOLS). The result of this test is displayed in the bottom panel of Table 1. We only reported the FMOLS estimation result of the money demand. The only difference between the FMOLS and the JJML estimation results is the coefficient of defgdp, which is positive in the former and negative in the latter. However, according to the model [Equation (6)], the correct sign is negative, which is found in the JJML estimation result. Furthermore, according to the FMOLS estimation result, the Uscrisis dummy is negative but not statistically significant, which means the U.S. financial crisis did not have any impact on the demand for money. However, the estimation coefficient of the Covid dummy variable is positive and statistically significant, which means the impact of the COVID-19 pandemic resulted in a higher demand for money over the long run.
This was mostly because of the Federal Reserve’s actions, which made it easier to hold money than other assets. Namely, “the Federal Reserve stepped in with a broad array of actions to keep credit flowing so as to limit the economic damage from the pandemic. These included large purchases of U.S. government and mortgage-backed securities and lending to support households, employers, financial market participants, and state and local governments.” (Milstein and Wessel 2021).
The second identified equation exhibits similarities to the real exchange rate relationship. We needed to restrict money demand, gross interest rate, consumption, and foreign-financed debt per GDP to ensure an identified equation. A higher deficit per GDP results in a lower real exchange rate, and a higher federal debt per GDP increases the real exchange rate. The dummy variable D2006Q1 has a statistically insignificant coefficient, but the estimated coefficient of D2016Q4 is positive and statistically significant. The third identified equation resembles an interest rate equation. We needed to restrict money demand, consumption, and foreign-financed debt per GDP to identify this equation. Note that the last two identified equations are not based on any theoretical model in this paper. The restrictions on these equations are only made in such a way to identify the demand for money.
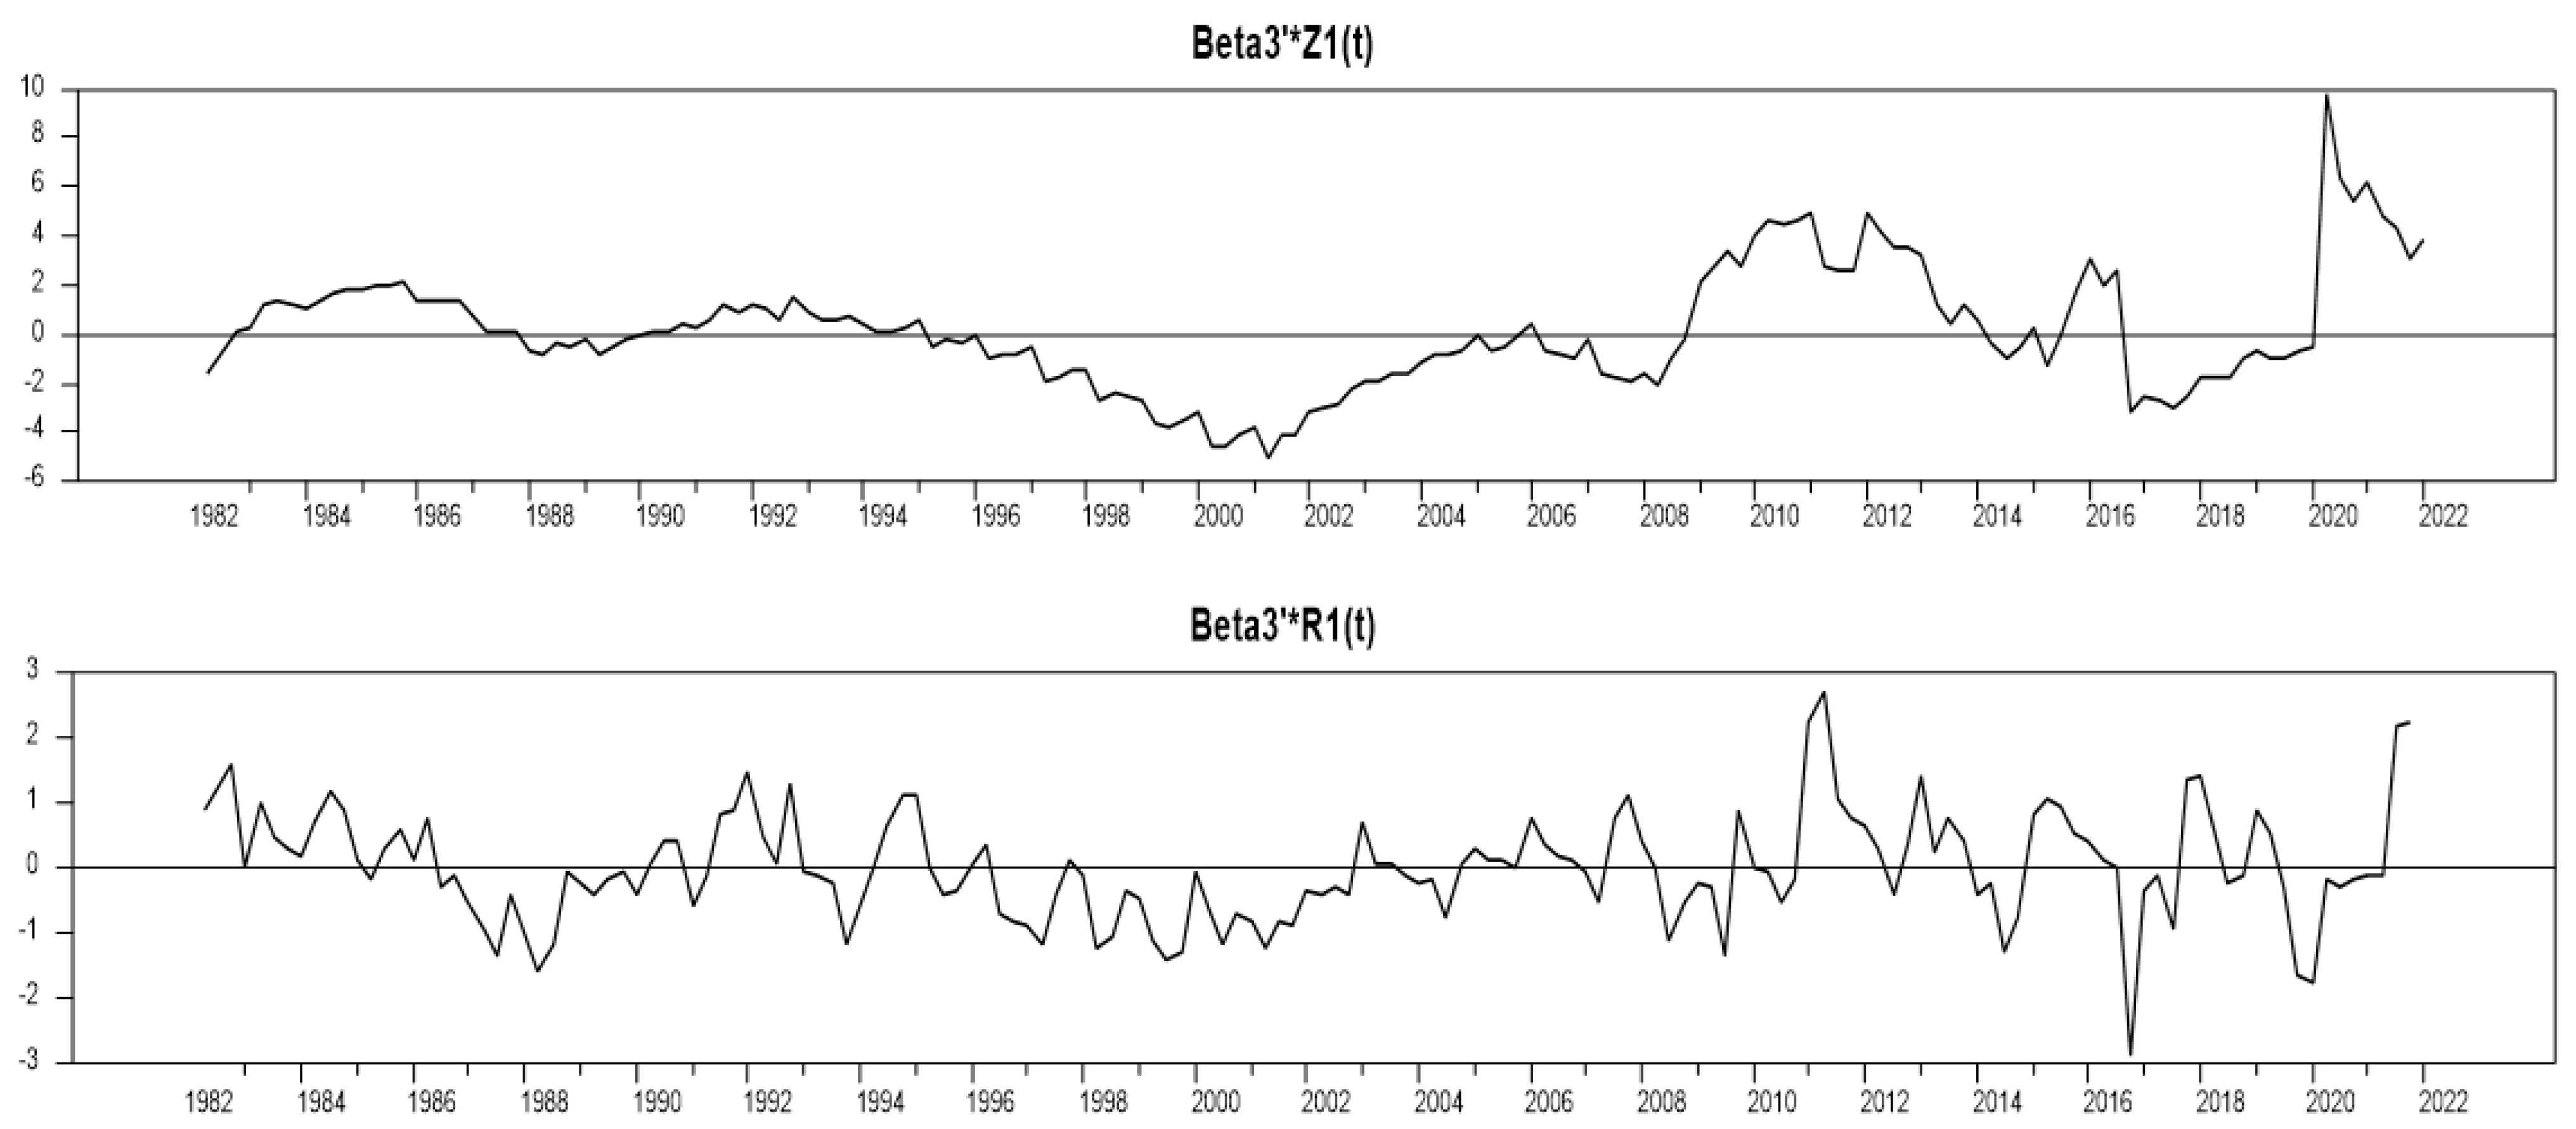
As Figure 1, Figure 2 and Figure 3 show, the parameters of all three identified equations are stable over the long run. The stability of the parameters exists in both non-restricted (Z) and restricted (R) identified models.
Using the same strategy, we also estimated Equation (6) for the M2 money supply.7 The complete estimation result is not reported for the sake of brevity but is available upon request. However, a brief explanation of the result is useful. There are six cointegration relationships in space. We needed to restrict consumption, deficit, and debt per GDP to identify demand for M2. According to the identified long-run demand for M2, the impact of interest rate, foreign-financed debt, and real effective exchange rate on M2 is positive and statistically significant.
Based on the FMOLS estimation result, the consumption, debt per GDP, and real effective exchange rate are positive and statistically significant. During the COVID-19 pandemic, the demand for M2 increased.
3.2. Error Correction Model
Having confirmed in the preceding section the existence of a long-run relationship to describe the money demand and its determinants, we need to specify the error correction model (ECM) indicated by our cointegrating vector. The error correction term in the ECM equation is non-linear if small equilibrium errors can be disregarded while reacting substantially to large ones (Granger 1986).8 Consequently, we incorporated squared, cubed, and fourth-powered variables of the equilibrium error (each with statistically significant coefficients) along with the products of those significant equilibrium errors. The parsimonious estimation result of the final error correction model implied by the cointegrating vector is based on Hendry’s General-to-Specific approach (see Table 2). The lag length is 6, as it was determined in the long-run cointegration estimation. The instruments for the contemporaneous variables are the first four lags of each of them.
For the sake of brevity, let us analyze the ECM of the money demand. In Table 2, Δ indicates a first difference operator, and EC, , σ, and DW denote the error correction term, R-squared, the residual standard deviation, and the Durbin–Watson statistics, respectively. Furthermore, to test the specification of the error correction model, we used the following tests: White’s (1980) general test for heteroskedasticity, the five-order Engle’s (1982) test (ARCH), the five-order Godfrey’s (1978) test, Ramsey’s (1969) misspecification test (REST), Jarque and Bera (1987) normality statistics, Hansen’s (1992) stability test (Li) for the null hypothesis that the estimated ith coefficient or variance of the error term is constant, and Hansen’s stability test (Lc) for the null hypothesis that the estimated coefficients and the error variance are jointly constant.
Except for Godfrey’s autocorrelation test result, none of the diagnostic checks are significant. Because of the existence of autocorrelation, the estimation method is Instrumental-Variable Newey and West’s (1987) Robusterror Ordinary Least Squared.9 The estimated coefficient of the error correction term shows statistical significance in non-linear terms. As expected, the estimated coefficients of (EC)3 and (EC)(EC)3 after one lag are negative, and the estimated coefficient of (EC)2(EC)3 after three lags is negative. The non-linear error correction term implies that the agents may disregard a small deviation from equilibrium but strongly react to a substantial deviation from equilibrium.
According to the final parsimonious estimation result of the error correction model, the only contemporaneous variables with statistically significant coefficients are the change in the log of gross interest rate (Δi) and the change in the log of the real exchange rate (Δlog(q)). The change in the dependent variable affects money demand after one and four periods with a negative and positive coefficient, respectively. However, during the pandemic period, it positively affected demand for money after two and three periods. The estimated coefficient of the change in consumption is surprisingly negative, and it influences the change in demand for money after four periods. However, the U.S. crisis resulted in a higher demand for money after two and four periods.
A rise in the real exchange rate increases the demand for money positively, as expected, currently and after two periods. During the U.S. crisis, the change in the real exchange rate increased money demand after four periods, and it increased money demand drastically after one period during the COVID-19 pandemic. According to the estimation result, the change in deficits per GDP positively influenced money demand during the U.S. financial crisis after two periods and during the pandemic period after one and three periods.
The change in debt per GDP negatively impacted the change in money demand after four periods during the U.S. crisis and the COVID-19 pandemic after one period. This means that during these two events, government debt did not act as wealth as the theoretical model predicts. The change in foreign-financed debt as a percentage of GDP impacts money demand after one and three periods, first positively, the opposite of what the theoretical model predicts, but then negatively, confirming our theoretical model. However, the overall effect is zero after three periods, as the summation of the estimated coefficients is zero. The change in interest rate affects the change in the demand for money simultaneously and confirms our theoretical model. Namely, a higher interest rate reduces money demand. Finally, the estimated coefficient of D2006Q1 is negative, indicating a decline in money demand since the 2006 first quarter. According to Hansen’s stability test, all coefficients, as well as variance, are stable. As the result of the last row of Table 2 indicates, all the coefficients and variance are also jointly stable.
The complete parsimonious estimation results of the error correction model of M2 are not reported for the sake of brevity but are provided upon request. A brief explanation of the estimation result indicates that the growth of real demand for M2 positively affects the current value after one and three periods but negatively after two periods. It also negatively affects the current value after one and three periods but positively after four periods during the U.S. financial crisis. The growth of real consumption influenced the current value negatively after one to three periods during the U.S. financial crisis but positively after four periods. The interest rate negatively influences the growth of real demand for M2 after one period. It also influenced it negatively during the U.S. financial crisis after one to three periods. The change in debt per GDP also negatively influences the growth of real demand for M2 after three periods. The estimated error correction term is negative after two periods but positive after three periods; however, the overall effect is negative.
3.3. Superexogeneity Test Results
According to the estimation of the ECM for M1, only two contemporaneous variables, Δlog(q) and Δi, remain in the final equation. We need to estimate the stochastic process that produces these variables in the ECM. Namely, we need to estimate the marginal model of these two variables as indicated below:
where ∆Y is ∆log(q) and ∆i. In the above equation, the variable Dum is a column vector of dummy variables Uscrisis and Covid and the product of these dummy variables and the variables in ECM. The variable vt is the error term, assumed to be white noise, normally, identically, and independently distributed. We assume k = 4 to reflect a year. Table 3 and Table 4 report the parsimonious estimation of Equation (8) for ∆Y equals ∆log(q) in Table 3 and ∆i in Table 4. Note that the construction of Equation (8) is not based on any theoretical model but, as expected, is based on all the variables in the money demand model.
The estimation method for Equation (8) for dependent variable ∆log(q) is OLS since there is no significance in any of the diagnostic checks. But for the dependent variable ∆i, because of ARCH heteroskedastic error, the estimation method is Newey and West’s (1987) Robusterror OLS. However, none of the other diagnostic checks are significant. According to the estimation result of the parsimonious marginal model of ∆log(q), the growth of q affects its current value positively after three and four periods, but during the U.S. financial crisis, it reduces its value after four periods. But during the COVID-19 pandemic, the growth of q increased by its past value after one period.
The growth of real money demand [∆log(md), where md is M1] negatively affected the real exchange rate after one period and during the U.S. crisis after four periods. However, the impact was estimated to be positive during the COVID-19 pandemic. One possible explanation is that as demand for the US dollar increases, its value increases, i.e., the growth of the real effective exchange rate falls.10 However, during the COVID-19 pandemic, higher growth in money demand resulted in a weaker US dollar exchange rate (higher effective exchange rate).
The estimated coefficient of the growth of consumption is positive after two periods, suggesting that a higher domestic consumption, as expected, results in a lower value of the real effective US dollar. The estimated growth of the gross interest rate is negative after two periods, which means a higher interest rate leads to an increased inflow of capital, which results in a higher value of US dollar, but the estimated coefficient after four periods is positive. This implies a higher interest rate, so the inflow of capital after four periods results in a lower demand for US dollar. However, the overall effect is an improvement in the effective U.S. exchange rate as the summation of estimated coefficients is negative.
As expected, a higher federal government deficit per GDP results in a higher effective exchange rate (lower value of US dollar) after four periods, as its estimated coefficient is positive. This is also true during the U.S. financial crisis. Finally, the impact of the federal government debt per GDP has the same effect on the growth of the real effective exchange rate during the crisis after one period. These results are theoretically expected as a higher government deficit or debt leads to lower demand for US dollar.
According to Hansen’s stability test, all coefficients, as well as the variance of the marginal model of ∆log(q), are stable. As the result in the last row of Table 4 indicates, all the coefficients and the variance are also jointly stable.
According to the estimation result of the parsimonious marginal model of ∆i reported in Table 4, the change in the interest rate during the U.S. financial crisis negatively influences itself after one period, but the growth of real money demand, as expected theoretically, positively affects ∆i after one and two periods during the U.S. financial crisis. The impact of the growth of real consumption on interest rates was estimated to be negative during the COVID-19 pandemic after one period but positive after two periods. The overall effect is, however, positive after two periods. The growth of the real effective exchange rate affects ∆i negatively after one and three periods but positively after two periods. The overall effect, as expected theoretically, was positive during the COVID-19 pandemic period after three periods.
The impact of the change in the federal deficit and debt per GDP is estimated to be negative during the U.S. financial crisis. Furthermore, according to the estimated result, the change in federal foreign-financed debt per GDP negatively influenced the change in the growth of gross interest rate during the COVID-19 pandemic. During the U.S. financial crisis, the growth of the gross interest rate was negative as the estimated coefficient of the Uscrisis dummy variable was negative. According to Hansen’s stability test, all coefficients, as well as the variance of the marginal model of ∆i, individually and jointly, are stable.
Table 5 reports the superexogeneity test result for M1 money demand. The estimate of ηZ for Z = ∆log(q) or ∆i, using the estimated marginal model (8), was calculated and incorporated in the ECM reported in Table 2. As for σtZZ,, we tested a five-period moving average of the variance of the error and we incorporated it into the constructed variables in the ECM. It should be mentioned that the control/target variable Zt is subject to policy interventions. Note that even though the parameters of Z t are assumed to be constant throughout the sample period, these parameters may change (Lucas 1976) under interventions impacting the data-generating process of Z t. This indicates that marginal models ∆log(q) and ∆i change as the policy regime changes. This suggests that agents demonstrate forward-looking behavior, and consequently, the ECM is not policy invariant.
We estimated Equation (7) with the constructed variables ηZ and σtZZ (estimation result reported in Table 5). The individual χ2-test result is derived from the null hypothesis which assumes that the coefficient of each constructed variable is equal to zero. According to the estimation result, the coefficient of (Z-ηZ) for both ∆log(q) and ∆i is not statistically significant; therefore, ∆log(q) and ∆i in Table 2 are weakly exogenous. The null of constancy is not rejected either because the coefficient of σZZ(Z − ηZ) for both variables is statistically insignificant. Moreover, the coefficient of (ηZ)2, (ηZ)3, σZZηZ, σZZ(ηZ)2 and (σZZ)2ηZ is statistically insignificant for ∆log(q) and except for the coefficient of (σZZ)2ηZ is also significant for ∆i, but the coefficient of σZZ (ηZ)2 is statistically significant for both variables, implying that ∆log(q) and ∆i are not invariant with respect to shifts in policy. Consequently, we cannot reject the null of constancy and the weak exogeneity condition, but we reject the null of invariance. Note that constancy refers to the stability of the parameters over time, while invariance refers to the stability of the parameters across different policy regimes or different exogenous shocks. The estimated parameters of the model may remain constant over time, but their values may change following changes in policy regimes or other exogenous shocks in the economy.
Furthermore, as stated by Engle and Hendry (1993), all three conditions must be met to guarantee the superexogeneity of the variables. The deviation from the policy invariance condition, therefore, provides further support for the result of the joint χ2(7) or F-test (reported in the last two rows of Table 5) on the null hypothesis that all coefficients of the constructed variables are jointly zero. Specifically, we generally reject the null hypothesis that ∆log(q) and ∆i are superexogenous. This means that agents in the U.S. money market are forward-looking and change their behavior toward money demand following any policy change. This also means that the demand for money in the U.S. is not stable, even though, based on the backward-using tests, it is stable; see the result in Table 1 and Table 2.
This result aligns with the conclusions of Favero and Hendry (1992) and Engle and Hendry (1993) regarding US money demand. For the robustness test, we also examined the significance of the dummy variables, impacting the intercept and/or slopes in the marginal models ∆log(q) and ∆i when added to the conditional model (ECM). The variables (∆log(md)Uscrisis)t−1, (∆log(md)Uscrisis)t−2, (∆log(md)Uscrisis)t−4, (∆log(md)Covid)t−4, (∆defgdpUscrisis)t−1, (∆debtgdpUscrisis)t−1, (∆log(rpc)Uscrisis)t−1, and Uscrisist were found to be statistically significant. The null of superexogeneity for ∆log(q) and ∆i is therefore rejected, which suggests agents modify their behavior regarding money demand in reaction to any policy change.
We also used the superexogeneity test for the M2 definition of money and conducted all the tests mentioned above. The result was similar to the demand for M1. Namely, in the M2 money market, agents are forward-looking and develop their expectations rationally. Consequently, demand for M2, like M1, is not stable overall. For the sake of brevity, the estimation result of M2 demand for money is not reported but is provided upon request.
4. Conclusions
Studies on the specification of demand for money overlooked the impact of fiscal variables like deficits and debt, as well as foreign financing of the debt. Consequently, many of those studies, by using backward tests, found the demand for money unstable. However, this study shows the opposite when these fiscal variables are included. Another important issue, completely ignored in the study of money demand in the United States, is the examination of policy invariance of money demand, namely, whether the policy variables incorporated in the demand for money function exhibit superexogeneity. It was observed that the behavior of agents in the M1 money market in the United States shifts in response to the real effective exchange and interest rates. The behavior of agents in the M2 money market varies in accordance with the changes in consumption. Specifically, agents in these markets engage in forward-looking behavior and form rational expectations.
Certain policy regime changes strengthen or weaken the effectiveness of monetary services. Similarly to how financial innovations and other financial developments can enhance the services provided by a dollar, certain policy regime changes also shape the environment which influences the effectiveness of money in circulation. This study demonstrates that the absence of adequate adjustments for such policy regime changes in estimating the US demand-for-money relationship inevitably leads to parameter instability. Then, by using quarterly data for the period 1980Q4–2022Q4 to estimate demand for real M1 and for the period 1980Q4–2020Q1 to estimate demand for real M2, this study provides evidence for such a claim.
It was shown over the long run that the real personal consumption expenditures, the federal debt per GDP, and the real effective exchange rate increase the demand for money while the deficit per GDP and the foreign-financed debt per GDP reduce the demand for money. The effect of the interest rate is negative on the demand for real M1 over the long and short run but statistically insignificant over the long run. Over the short run, the change in the real effective exchange rate increased the demand for real M1, especially during the U.S. financial crisis and COVID-19 pandemic periods. The deficit per GDP increased the demand for real M1 after two periods during the U.S. financial crisis and after one and three periods during the COVID-19 pandemic.
The change in debt per GDP negatively affected real M1 money demand after one period during the COVID-19 pandemic but after four periods during the U.S. financial crisis. The change in foreign-financed debt per GDP was found to increase real M1 money demand after one period, but it reduces it after three periods by the same amount so that there is no change in money demand after three periods due to the change of this variable. Finally, it was observed that the agents in the money market may overlook small deviations from equilibrium but react strongly to large ones.
The result of the estimation of real M2 demand for money, using all the tests mentioned in this study, is the same as for real M1. It is clear that if agents are forward-looking in demanding M1, which is a main part of M2, they are also forward-looking in demanding M2, i.e., their expectations are formed rationally. Consequently, demand for M2, like M1, is not stable overall.
Funding
This research received no external funding.
Data Availability Statement
Publicly available datasets were analyzed in this study. This data can be found here: [https://fred.stlouisfed.org/], (accessed on 4 January 2024).
Conflicts of Interest
The author declares no conflicts of interest.
| 1 | The full derivation of Equation (4) is provided upon request. |
| 2 | Note that Z includes all explanatory variables (including the error correction term) in the parsimonious ECM, i.e., conditional model which will be explained in the next section. |
| 3 | Another series of U.S. Federal government budget surplus or deficit is available in FRED, from 1959Q3 to 2020Q4. However, this data series is completely different from the data used in this study and ends in 2020Q4. |
| 4 | For the sake of brevity, these results are not reported but are provided upon request. |
| 5 | In 1992, Bill Clinton was elected the 42nd U.S. President. There have been many other events in these periods, but none could affect demand for money. |
| 6 | Note that we could never estimate the t values if the system were not identified. |
| 7 | Note that, as mentioned before, since the definition of M2 was changed by the Federal Reserve in May 2020, we used the sample period 1980Q4–2020Q1 for the estimation of demand for M2. |
| 8 | As noted in Eslamloueyan and Kia (2015) and Kia (2020), the non-linear error correction term implies that the agents may disregard minor deviations from equilibrium but respond strongly to larger ones. |
| 9 | Due to the presence of autocorrelation, we use the Newey and West approach which first corrects for autocorrelation and/or heteroskedasticity and then uses instrumental variables to correct for simultaneous effect, namely, a two-stage solution. |
| 10 | Note that the real trade-weighted US dollar index (qt = pt*/etpt) is defined as a trade-weighted average of the US dollar’s foreign exchange value against the currencies of a diverse set of major U.S. trading partners. Namely, as the international value of US dollar increases, q falls. |
References
- Adil, Masudul Hasan, Neeraj Hatekar, and Pravakar Sahoo. 2020. The Impact of Financial Innovation on the Money Demand Function: An Empirical Verification in India. Margin—The Journal of Applied Economic Research 14: 28–61. [Google Scholar] [CrossRef]
- Albulescu, Claudiu Tiberiu, Dominique Pépin, and Stephen M. Miller. 2019. The Micro-Foundations of an Open Economy Money Demand: An Application to Central and Eastern European Countries. Journal of Macroeconomics 60: 33–45. [Google Scholar] [CrossRef]
- Bahmani-Oskooee, Mohsen, and Majid Maki Nayeri. 2018. Policy Uncertainty and the Demand for Money in Australia: An Asymmetry Analysis. Australian Economic Papers 57: 456–69. [Google Scholar] [CrossRef]
- Bahmani-Oskooee, Mohsen, and Majid Maki Nayeri. 2019. Asymmetric Effects of Policy Uncertainty on the Demand for Money in the United States. Journal of Risk and Financial Management 12: 1. [Google Scholar] [CrossRef]
- Bahmani-Oskooee, Mohsen, and Sahar Bahmani. 2015. Nonlinear ARDL Approach and the Demand for Money in Iran. Economics Bulletin 35: 381–91. [Google Scholar]
- Bai, Jushan, and Pierre Perron. 2003. Computation and Analysis of Multiple Structural Change Models. Journal of Applied Econometrics 18: 1–22. [Google Scholar] [CrossRef]
- Ball, Laurence. 2012. Short-Run Money Demand. Journal of Monetary Economics 59: 622–33. [Google Scholar] [CrossRef]
- Barnett, William A., Taniya Ghosh, and Masudul Hasan Adil. 2022. Is Money Demand Really Unstable? Evidence from Divisia Monetary Aggregates. Economic Analysis and Policy 74: 606–22. [Google Scholar] [CrossRef]
- Belongia, Michael T., and Peter N. Ireland. 2014. The Barnett Critique After Three Decades: A New Keynesian Analysis. Journal of Econometrics 183: 5–21. [Google Scholar] [CrossRef]
- Benati, Luca, Robert E. Lucas Jr., Juan Pablo Nicolini, and Warren Weber. 2021. International Evidence on Long-Run Money Demand. Journal of Monetary Economics 117: 43–63. [Google Scholar] [CrossRef]
- Boone, Laurence, and Paul van den Noord. 2008. Wealth Effects on Money Demand in the Euro Area. Empirical Economics 34: 525–36. [Google Scholar] [CrossRef]
- Boucekkine, Raouf, Mohammed Laksaci, and Mohamed Touati-Tliba. 2021. Long-Run Stability of Money Demand and Monetary Policy: The Case of Algeria. The Journal of Economic Asymmetries 24: e00217. [Google Scholar] [CrossRef]
- Deravi, M. Keivan, Charles E. Hegji, and H. Dean Moberly. 1990. Government Debt and the Demand for Money: An Extreme Bound Analysis. Economic Inquiry 28: 390–401. [Google Scholar] [CrossRef]
- Dou, Xiangsheng. 2018. The Determinants of Money Demand in China. Cogent Economics & Finance 6: 1564422. [Google Scholar] [CrossRef]
- Dutkowsky, Donald H., and H. Sonmez Atesoglu. 2001. The Demand for Money: A Structural Econometric Investigation. Southern Economic Journal 68: 92–106. [Google Scholar] [CrossRef]
- Engle, Robert F. 1982. Autoregressive Conditional Heteroscedasticity with Estimates of the Variance of United Kingdom Inflation. Econometrica 50: 987–1007. [Google Scholar] [CrossRef]
- Engle, Robert F., and David F. Hendry. 1993. Testing Superexogeneity and Invariance in Regression Models. Journal of Econometrics 56: 119–39. [Google Scholar] [CrossRef]
- Engle, Robert F., David F. Hendry, and Jean-François Richard. 1983. Exogeneity. Econometrica 51: 277–304. [Google Scholar] [CrossRef]
- Eslamloueyan, Karim, and Amir Kia. 2015. Determinants of the Real Exchange Rate in Oil-Producing Countries of the Middle East and North Africa: A Panel Data Investigation. Emerging Markets Finance and Trade 51: 842–55. [Google Scholar] [CrossRef]
- Favero, Carlo, and F. David Hendry. 1992. Testing the Lucas Critique: A Review. Econometric Reviews 11: 265–306. [Google Scholar] [CrossRef]
- Friedman, Milton. 1956. The Quantity Theory of Money—A Restatement. In Studies in the Quantity Theory of Money. Edited by Milton Friedman. Chicago: The University of Chicago Press. [Google Scholar]
- Godfrey, Les G. 1978. Testing Against General Autoregressive and Moving Average Error Models When the Regressors Include Lagged Dependent Variables. Econometrica 46: 1293–1301. [Google Scholar] [CrossRef]
- Godfrey, Les G. 1988. Misspecification Tests in Econometrics. New York: Cambridge University Press. [Google Scholar]
- Granger, Clive W. J. 1986. Developments in the Study of Cointegrated Economic Variables. Oxford Bulletin of Economics and Statistics 48: 213–28. [Google Scholar] [CrossRef]
- Hafer, Rik W., and Dennis W. Jansen. 1991. The Demand for Money in the United States: Evidence from Cointegration Tests. Journal of Money, Credit, and Banking 23: 155–68. [Google Scholar] [CrossRef]
- Hansen, Bruce E. 1992. Testing for Parameter Instability in Linear Models. Journal of Policy Modeling 14: 517–33. [Google Scholar] [CrossRef]
- Hansen, Henrik, and Katarina Juselius. 1995. CATS in RATS Cointegration Analysis of Time Series. Evanston: Estima. [Google Scholar]
- Hendry, David F., and Grayham E. Mizon. 1998. Exogeneity, Causality, and Co-breaking in Economic Policy Analysis of a Small Econometric Model of Money in the UK. Empirical Economics 23: 267–94. [Google Scholar] [CrossRef]
- Hoffman, Dennis L., Robert H. Rasche, and Margie A. Tieslau. 1995. The Stability of Long-Run Money Demand in Five Industrial Countries. Journal of Monetary Economics 35: 317–39. [Google Scholar] [CrossRef]
- Hossain, Akhand Akhtar. 2019. How Justified Is Abandoning Money in the Conduct of Monetary Policy in Australia on the Grounds of Instability in the Money-Demand Function? Economic Notes 48: e12131. [Google Scholar] [CrossRef]
- Jarque, Carlos M., and Anil K. Bera. 1987. A Test for Normality of Observations and Regression Residuals. International Statistical Review 55: 163–72. [Google Scholar] [CrossRef]
- Johansen, Søren, and Katarina Juselius. 1991. Testing Structural Hypotheses in a Multivariate Cointegration Analysis of the PPP and the UIP for UK. Journal of Econometrics 53: 211–44. [Google Scholar] [CrossRef]
- Johansen, Søren. 1995. Likelihood-Based Inference in Cointegrated Vector Autoregressive Models. Oxford: Oxford University Press. [Google Scholar]
- Johansen, Søren. 2000. A Bartlett Correction Factor for Tests on the Cointegrating Relations. Econometric Theory 16: 740–78. [Google Scholar] [CrossRef]
- Johansen, Søren. 2002. A Small Sample Correction for the Test of Cointegrating Rank in the Vector Autoregressive Model. Econometrica 70: 1929–61. [Google Scholar] [CrossRef]
- Khawaja, Muhammad J. 2022. Exploring the Stability of Money Demand Function for GCC Countries. Pakistan Journal of Humanities and Social Sciences 10: 750–61. [Google Scholar] [CrossRef]
- Khrawish, Husni Ali, Ahmad Y. Khasawneh, and Feda’a A. Khrisat. 2012. The Impact of Budget Deficits on Money Demand in Jordan: Co-integration and Vector Error Correction Analysis. Investment Management & Financial Innovations 9: 101–8. [Google Scholar]
- Kia, Amir, and Ali F. Darrat. 2007. Modeling Money Demand Under the Profit-Sharing Banking Scheme: Some Evidence on Policy Invariance and Long-Run Stability. Global Finance Journal 18: 104–23. [Google Scholar] [CrossRef]
- Kia, Amir. 2013. Determinants of the Real Exchange Rate in a Small Open Economy: Evidence From Canada. Journal of International Financial Markets, Institutions & Money 23: 163–78. [Google Scholar] [CrossRef]
- Kia, Amir. 2014. Inflation: Islamic and Conventional Economic System-Evidence from the United States. International Journal of Economic Perspectives 8: 19–40. [Google Scholar]
- Kia, Amir. 2020. Impact of Public Debt, Deficit and Debt Financing on Private Investment in a Large Country: Evidence from the United States. World Journal of Applied Economics 6: 139–61. [Google Scholar] [CrossRef]
- King, Robert G., Charles I. Plosser, James H. Stock, and Mark W. Watson. 1991. Stochastic Trends and Economic Fluctuations. The American Economic Review 81: 819–40. [Google Scholar]
- Lee, Junsoo, and Mark C. Strazicich. 2003. Minimum Lagrange Multiplier Unit Root Test with Two Structural Breaks. The Review of Economics and Statistics 85: 1082–89. [Google Scholar] [CrossRef]
- Lucas, R. E., Jr. 1976. Econometric Policy Evaluation: A Critique. In Phillips Curve and Labor Markets. Edited by Karl Brunner and Allan H. Meltzer. Amsterdam: North-Holland, pp. 19–46. [Google Scholar]
- Lucas, Robert E., Jr., and Juan Pablo Nicolini. 2015. On the Stability of Money Demand. Journal of Monetary Economics 73: 48–65. [Google Scholar] [CrossRef]
- Mankiw, N. Gregory, and Lawrence H. Summers. 1986. Money Demand and the Effects of Fiscal Policies. Journal of Money, Credit, and Banking 18: 415–29. [Google Scholar] [CrossRef]
- Mankiw, N. Gregory. 1991. The Reincarnation of Keynesian Economics. NBER Working Paper No. 3885. Massachusetts: National Bureau of Economic Research. [Google Scholar]
- Milstein, Eric, and David Wessel. 2021. What Did the Fed Do in Response to the COVID-19 Crisis. Brookings. December 17. Available online: www.brookings.edu/research/fed-response-to-covid19 (accessed on 20 December 2023).
- Mogliani, Matteo, and Giovanni Urga. 2018. On the Instability of Long-Run Money Demand and the Welfare Cost of Inflation in the United States. Journal of Money, Credit, and Banking 50: 1645–60. [Google Scholar] [CrossRef]
- Nel, Heinrich, Derick Blaauw, and Anmar Pretorius. 2020. Investigating the Hungarian Money Demand Function: Possible Implications For Monetary Policy. International Journal of Economics and Finance Studies 12: 71–87. [Google Scholar] [CrossRef]
- Newey, Whitney K., and Kenneth D. West. 1987. A Simple, Positive Semi-Definite Heteroskedasticity and Autocorrelation Consistent Covariance Matrix. Econometrica 55: 703–8. [Google Scholar] [CrossRef]
- Perron, Pierre. 1997. Further Evidence on Breaking Trend Functions in Macroeconomic Variables. Journal of Econometrics 80: 355–85. [Google Scholar] [CrossRef]
- Phillips, Peter C. B., and Bruce E. Hansen. 1990. Statistical Inference in Instrumental Variables Regression with I(1) Processes. The Review of Economic Studies 57: 99–125. [Google Scholar] [CrossRef]
- Ragot, Xavier. 2014. The Case for a Financial Approach to Money Demand. Journal of Monetary Economics 62: 94–107. [Google Scholar] [CrossRef]
- Ramsey, James Bernard. 1969. Tests for Specification Errors in Classical Linear Least-Squares Regression Analysis. Journal of Royal Statistical Society 31: 350–71. [Google Scholar] [CrossRef]
- Rao, V. V. Subba, and Debashis Acharya. 2018. Financial Innovation and Stability of Money Demand Function in India: Do Equity Derivatives Matter? The IUP Journal of Applied Economics 17: 27–40. [Google Scholar]
- Reynard, Samuel. 2004. Financial Market Participation and the Apparent Instability of Money Demand. Journal of Monetary Economic 51: 1297–317. [Google Scholar] [CrossRef]
- Sargent, Thomas J., and Neil Wallace. 1975. ‘Rational’ Expectations, the Optimal Monetary Policy Instrument, and the Optimal Money Supply Rule. Journal of Political Economy 83: 241–54. [Google Scholar] [CrossRef]
- Sekine, Toshitaka. 1998. Financial Liberalization, the Wealth Effect, and the Demand for Broad Money in Japan. Monetary and Economic Studies 16: 35–55. [Google Scholar]
- Sousa, Ricardo M. 2014. Wealth, Asset Portfolio, Money Demand and Policy Rule. Bulletin of Economic Research 66: 95–111. [Google Scholar] [CrossRef]
- Tanner, Evan, and John Devereux. 1993. Deficits and the Demand for Money. Southern Economic Journal 60: 316–26. [Google Scholar] [CrossRef]
- Tümtürk, Oğuz. 2017. Stability of Money Demand Function in Turkey. Business and Economics Research Journal 8: 35–48. [Google Scholar] [CrossRef]
- Tweneboah, George, and Paul Alagidede. 2018. Currency Substitution and Stability of Money Demand in Ghana. The Journal of Developing Areas 52: 41–53. [Google Scholar] [CrossRef]
- Wang, Yiming. 2011. The Stability of Long-Run Money Demand in the United States: A New Approach. Economics Letters 111: 60–63. [Google Scholar] [CrossRef]
- Watanabe, Tsutomu, and Tomoyoshi Yabu. 2018. The Demand for Money at the Zero Interest Rate Bound. Central Bank Communication Design. Working Paper Series No. 002, September. Tokyo: The University of Tokyo. [Google Scholar]
- White, Halbert. 1980. A Heteroskedasticity-Consistent Covariance Matrix Estimator and a Direct Test for Heteroskedasticity. Econometrica 48: 817–38. [Google Scholar] [CrossRef]
- Zivot, Eric, and Donald W. K. Andrews. 1992. Further Evidence on the Great Crash, the Oil-Price Shock, and the Unit-Root Hypothesis. Journal of Business and Economic Statistics 10: 251–70. [Google Scholar] [CrossRef]
Figure 1.
Test for constancy of the parameters of the real demand for money function (M1).
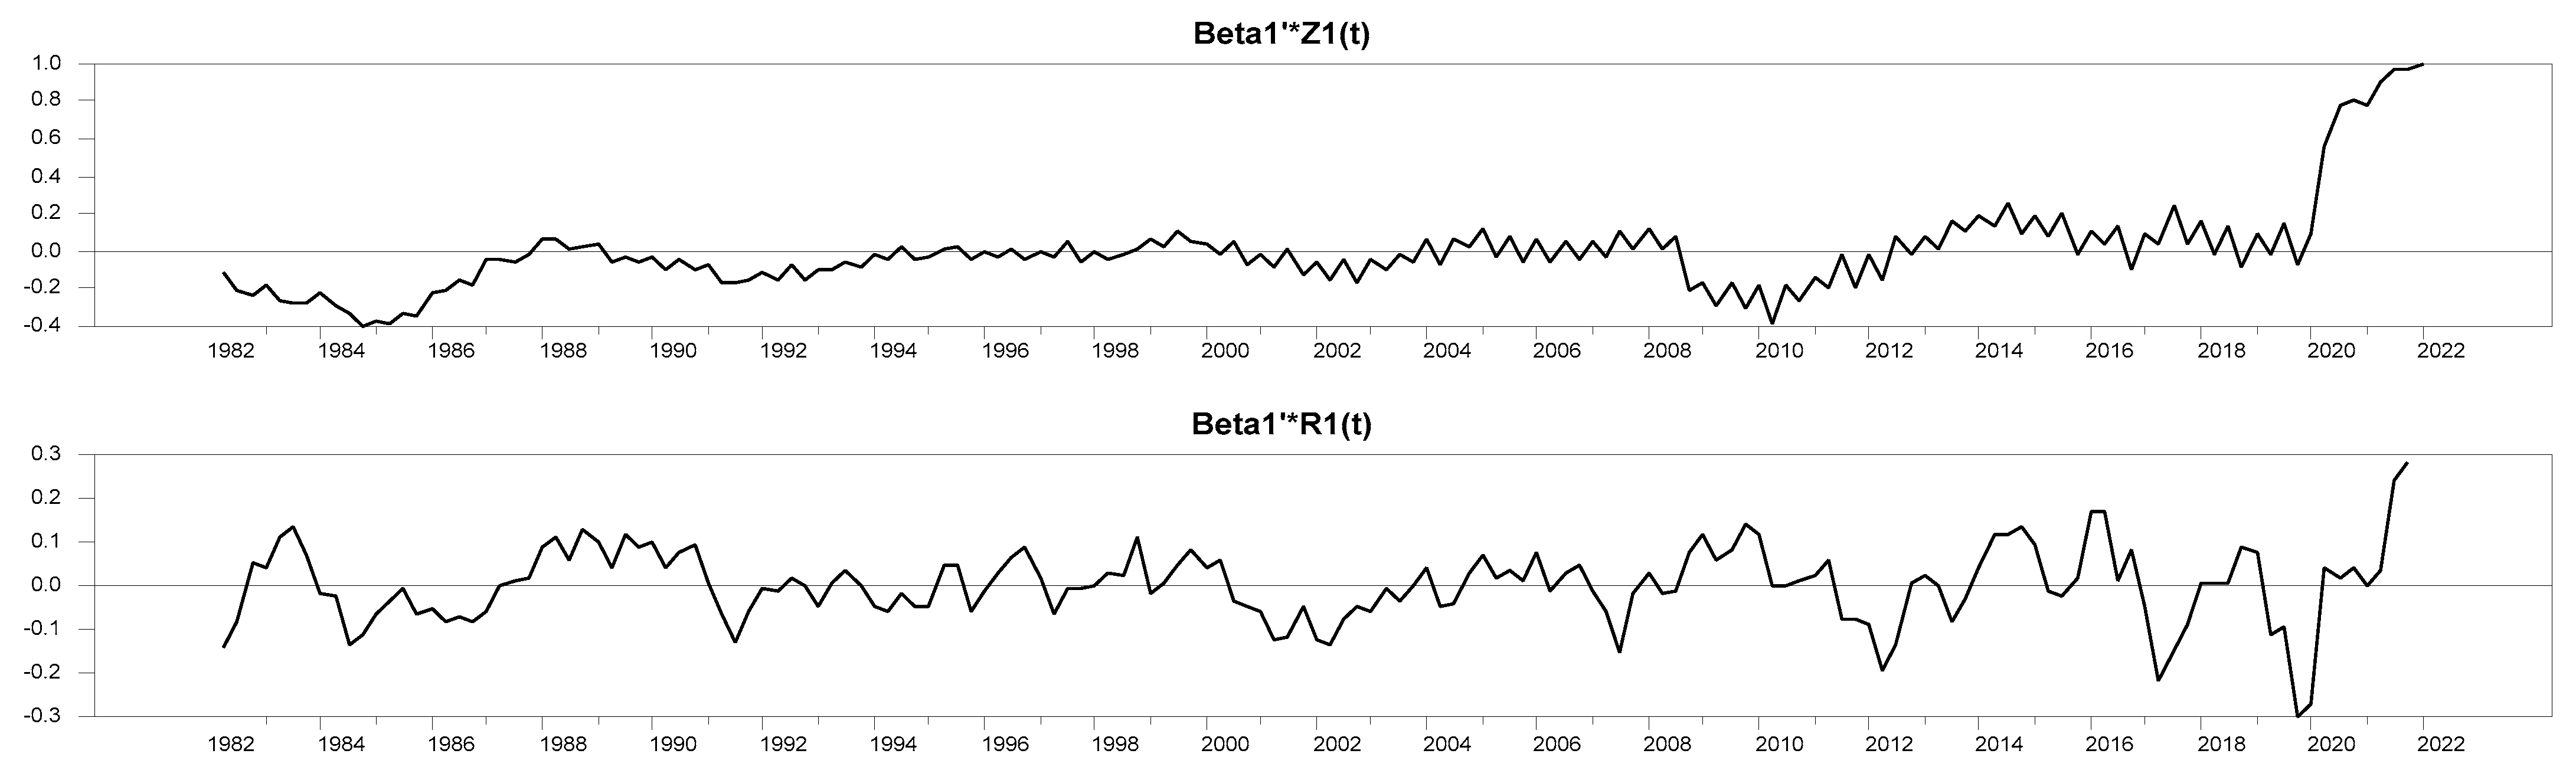
Figure 2.
Test for constancy of the parameters of the real exchange rate function.
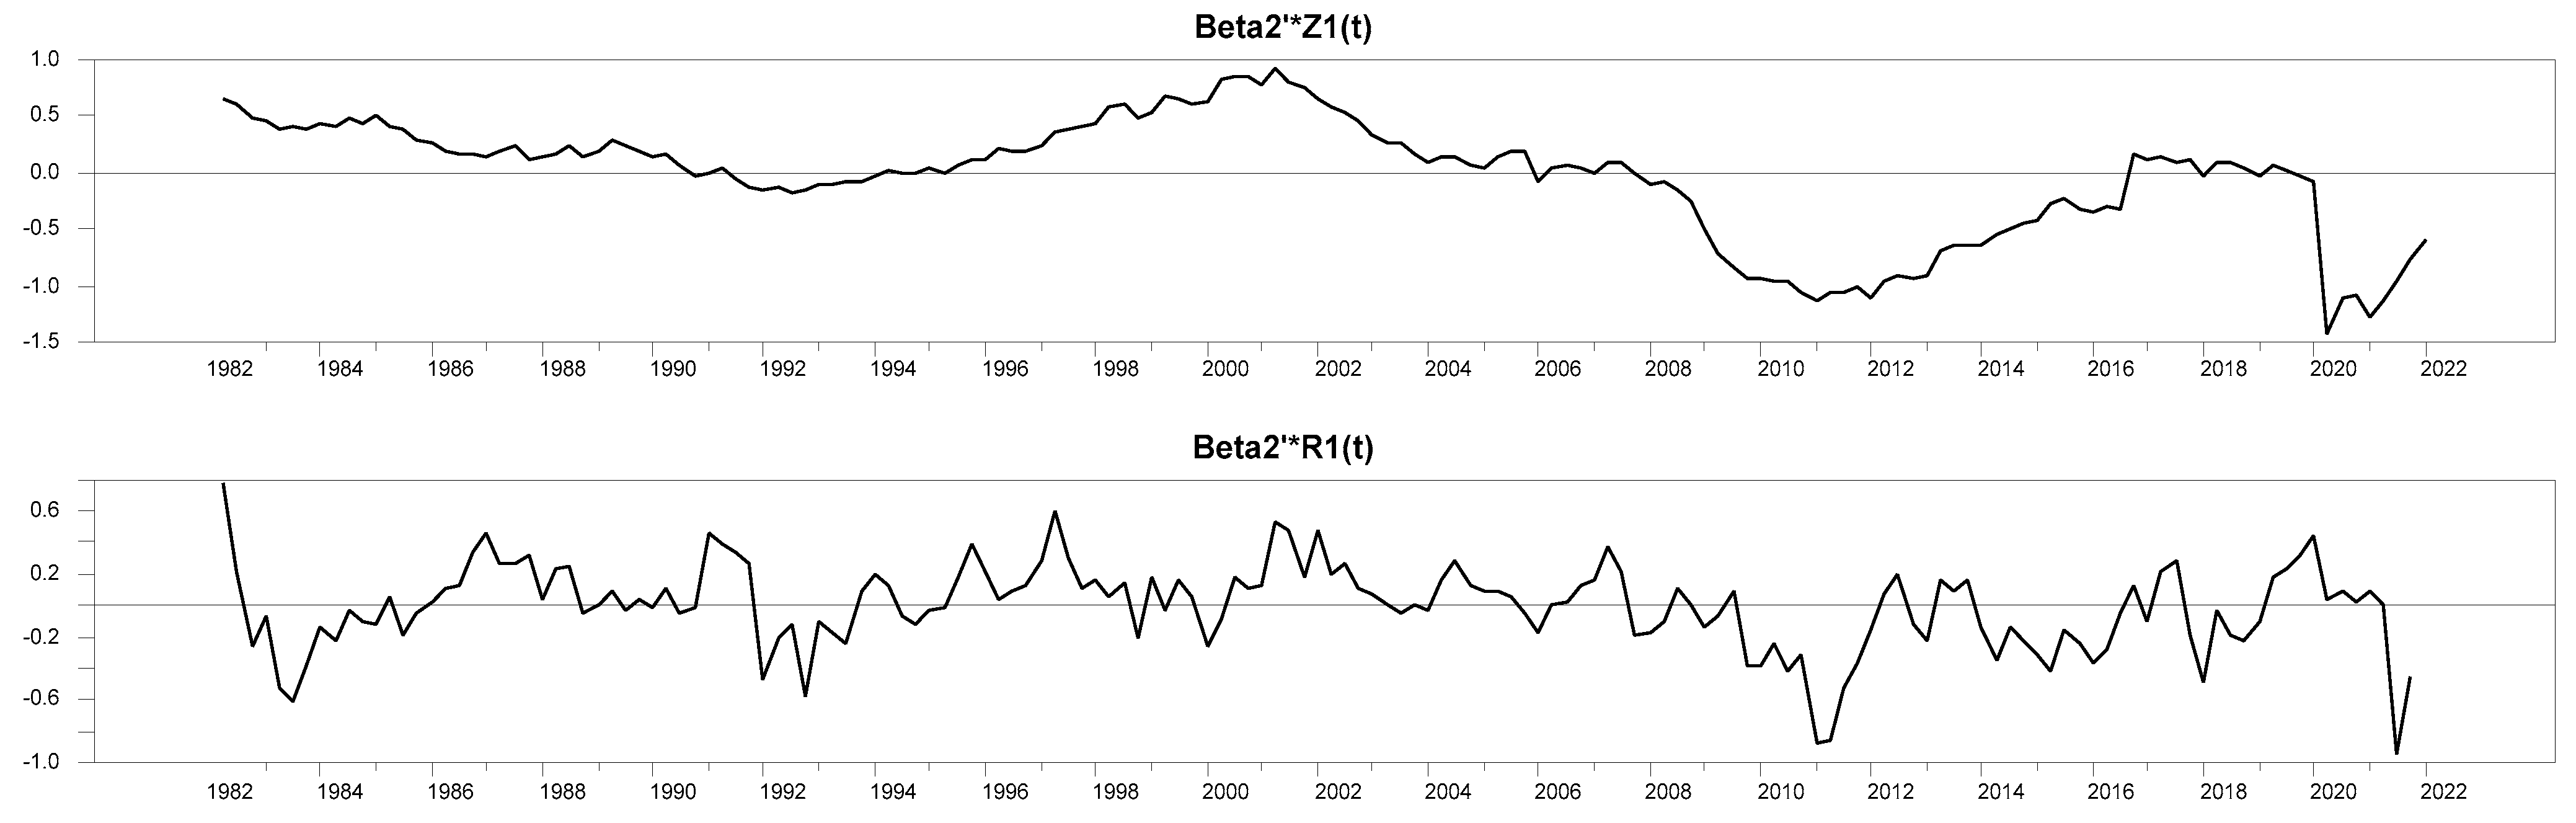
Figure 3.
Test for constancy of the parameters of the gross interest rate function.

Table 1.
Long-run test results for the demand for real M1. ‡
| H0 = ρ | 0 | 1 | 2 | 3 | 4 | 5 | 6 | Diagnostic Tests | p-Value | |||
|---|---|---|---|---|---|---|---|---|---|---|---|---|
| Trace 1 | 287 | 192 | 127 | 71 | 39 | 12 | 2 | Autocorrelation ‡‡ | ||||
| LM (1) | 0.00 | |||||||||||
| LM (2) | 0.29 | |||||||||||
| Trace 95 2 | 172 | 136 | 105 | 76 | 52 | 32 | 16 | ARCH ‡‡ | ||||
| LM (1) | 0.00 | |||||||||||
| LM (2) | 0.00 | |||||||||||
| p-value | 0.00 | 0.00 | 0.00 | 0.10 a | 0.39 | 0.95 | 0.97 | Normality | 0.00 | |||
| Lag length = 6 | ||||||||||||
| Identified Long-Run Relationships for ρ = 3, χ2(6) = 3.33 (0.77) | ||||||||||||
| Normalized | log(md) | i | log(rpc) | defgdp | debtgdp | fdgdp | log(q) | Uscrisis | Covid | D2006Q1 | D2016Q4 | C |
| log(md) | - | −0.01 | 0.27 * | −0.43 * | 0.02 * | −0.03 * | 0.95 * | - | - | - | - | −3.71 * |
| (t-stat) | - | (−0.72) | (3.04) | (−3.31) | (9.13) | (−4.75) | (5.73) | - | - | - | - | (−3.92) |
| log(q) | - | - | - | −1.39 * | 0.01 * | - | - | - | - | 0.17 | −0.48 * | 3.25 * |
| (t-stat) | - | - | - | (−3.83) | (2.79) | - | - | - | - | (1.36) | (−2.37) | (13.02) |
| i | - | - | - | 12.11 * | −0.10 * | - | −5.53 * | - | - | - | 6.74 * | 28.15 * |
| (t-stat) | - | - | - | (13.19) | (−13.42) | (−5.08) | - | - | - | (11.90) | (5.49) | |
| Fully Modified Least Squares Result | ||||||||||||
| log(md) | - | −0.04 * | 0.11 | 0.11 | 0.02 * | −0.02 * | 0.24 * | −0.04 | 1.06 * | −0.003 | 0.21 * | 0.21 |
| (t-stat) | - | (−2.50) | (1.76) | (1.46) | (9.28) | (−3.27) | (2.21) | (−0.85) | (15.17) | (−0.05) | (3.46) | (0.30) |
a = means we cannot reject the null of ρ = 3. * = means 99% statistically significant. 1 Using the Bartlett correction factor, the Trace test has been corrected for the small sample error; see Johansen (2000, 2002). 2 The critical values of the Trace rank test are calculated based on the length of the random walk 400 with 2500 replications. ‡ The sample period is 1980Q4–2022Q4. it = log(Rt/1 + Rt), R is the three-month TB rate in decimal point, md is the real money demand, rpc is the real personal consumption expenditures, defgdp is the percentage of federal government deficits per GDP, debtgdp is the percentage of the federal government outstanding debt per GDP, forgdp is the percentage of the federal government foreign-financed debt per GDP, q is the real trade-weighted US dollar index, C is the constant. Uscrisis is the dummy variable to reflect the U.S. financial crisis of 2007. It is equal to one in the period 2007Q4–2009Q3 and zero otherwise. Covid is the dummy variable to reflect the impact of the COVID-19 pandemic in December 2019. It is equal to one since 2020Q1 and zero otherwise. D2006Q1 and D2016Q4 are long-run break dummies, where D2006Q1 is equal to one since 2006Q1 and zero otherwise, and D2016Q4 is equal to one before 2016Q4 and zero otherwise. These two dummies were added for identification purposes. ‡‡ LM (1) and LM (2) are one and two-order Lagrangian Multiplier tests, respectively (Godfrey 1978, 1988).
Table 2.
Parsimonious conditional error correction model of the demand for real M1—dependent variable = Δlog(md). ‡
Table 2.
Parsimonious conditional error correction model of the demand for real M1—dependent variable = Δlog(md). ‡
| Variable | Coefficient | Standard Error | p-Value for Hansen’s (1992) Stability Li Test |
|---|---|---|---|
| Constant | 0.003 | 0.004 | 0.39 |
| Δlog(md)t−1 | −0.41 * | 0.04 | 0.98 |
| Δlog(md)t−4 | 0.55 * | 0.06 | 0.97 |
| (Δlog(md)Covid)t−2 | 2.73 * | 0.02 | 1.00 |
| (Δlog(md)Covid)t−3 | −3.56 * | 0.06 | 1.00 |
| Δlog(rpc)t−4 | −0.72 * | 0.21 | 0.12 |
| (Δlog(rpc)Uscrisis)t−2 | 2.50 * | 0.40 | 1.00 |
| (Δlog(rpc)Uscrisis)t−4 | 8.31 * | 1.00 | 1.00 |
| Δlog(q)t | 1.30 * | 0.48 | 0.11 |
| Δlog(q)t−2 | 0.16 * | 0.04 | 0.35 |
| (Δlog(q)Uscrisis)t−4 | 1.52 * | 0.17 | 1.00 |
| (Δlog(q)Covid)t−1 | 69.61 * | 0.45 | 1.00 |
| (ΔdefgdpUscrisis)t−2 | 0.80 * | 0.11 | 1.00 |
| (ΔdefgdpCovid)t−1 | 1.90 * | 0.16 | 1.00 |
| (ΔdefgdpCovid)t−3 | 2.81 * | 0.08 | 1.00 |
| (ΔdebtgdpUscrisis)t−4 | −0.01 * | 0.004 | 1.00 |
| (ΔdebtgdpCovid)t−1 | −0.05 * | 0.003 | 1.00 |
| Δdfdgdpt−1 | 0.01 * | 0.003 | 0.27 |
| Δdfdgdpt−3 | −0.01 * | 0.003 | 0.86 |
| Δit | −0.08 * | 0.03 | 0.63 |
| (EC)3t−1 | −2.01 * | 0.07 | 0.88 |
| ((EC)(EC)3)t−1 | −3.42 * | 0.08 | 0.39 |
| ((EC)2(EC)3)t−3 | −0.41 * | 0.17 | 0.80 |
| Covid t | 0.03 * | 0.004 | 1.00 |
| D2006Q1t | −0.02 * | 0.004 | 0.22 |
| Hansen’s (1992) stability Li test on the variance = 0.24 | p-value = 0.19 | ||
| Joint (coefficients and the error variance) Hansen’s (1992) stability Lc test = 4.21 | p-value = 0.62 | ||
* = means 99% statistically significant. ‡ The sample period is 1980Q4–2022Q4. The lag length is 6. The mean of the dependent variable = 0.018. ∆ means the first difference; EC is the error correction term calculated from the long-run demand for money (see Table 1). For the definition of other variables, see the footnote of Table 1. The estimation technique employed is Instrumental-Variable Newey and West’s (1987) Robusterror Ordinary Least Squared. The instruments are first to fourth lags of the endogenous variable Δi and Δlog(q). = 0.98, σ = 0.047, DW = 1.61, Godfrey(6) = 2.34 (significance level = 0.03), White = 32.22 (significance level = 0.22), ARCH(5) = 8.67 (significance level = 0.12), and RESET = 0.33 (significance level = 0.80). Note that , σ and DW represent, respectively, the adjusted squared multiple correlation coefficient, the residual standard deviation, and the Durbin–Watson statistic. White is White’s (1980) general test for heteroskedasticity, ARCH is the five-order Engle’s (1982) test, Godfrey is the five-order Godfrey’s (1978) test, and REST is Ramsey’s (1969) misspecification test. Li is Hansen’s (1992) stability test for the null hypothesis that either the estimated coefficient or variance of the error term is constant. Lc is Hansen’s (1992) stability test for the null hypothesis that both the estimated coefficients and the error variance are jointly constant.
Table 3.
Parsimonious marginal model: (dependent variable = ∆log(q)). ‡
| Variable | Coefficient | Standard Error | p-Value for Hansen’s (1992) Stability Li Test |
|---|---|---|---|
| Constant | 0.001 | 0.002 | 0.65 |
| ∆log(q)t−3 | 0.16 * | 0.07 | 0.53 |
| ∆log(q)t−4 | 0.16 * | 0.06 | 0.57 |
| (∆log(q)Uscrisis)t−4 | −0.46 * | 0.10 | 1.00 |
| (∆log(q)Covid)t−1 | 0.91 * | 0.17 | 1.00 |
| ∆log(md)t−1 | −0.06 * | 0.02 | 0.33 |
| (∆log(md)Uscrisis)t−4 | −0.15 * | 0.05 | 1.00 |
| (∆log(md)Covid)t−4 | 0.10 * | 0.02 | 1.00 |
| (∆log(rpc)Uscrisis)t−2 | 3.13 * | 0.71 | 1.00 |
| ∆it−2 | −0.02 * | 0.01 | 0.23 |
| ∆it−4 | 0.01 * | 0.006 | 0.91 |
| ∆defgdpt−4 | 0.10 * | 0.03 | 0.91 |
| (∆defgdpUscrisis)t−1 | 1.10 * | 0.29 | 1.00 |
| (∆debtgdpUscrisis)t−1 | 0.03 * | 0.01 | 1.00 |
| Hansen’s (1992) stability Li test on the variance = 0.51 | p-value = 0.04 | ||
| Joint (coefficients and the error variance) Hansen’s (1992) stability Lc test = 1.48 | p-value = 0.99 | ||
* = means 99% statistically significant. ‡ The sample period is 1980Q4–2022Q4. The lag length is 2. See the footnote of Table 1 and Table 2 for the definition of variables and mnemonics. The mean of the dependent variable = 0.0008. ∆ means the first difference. The estimation method is OLS. = 0.17, σ = 0.03, DW = 2.18, Godfrey(6) = 0.86 (significance level = 0.52), White = 38.81 (significance level = 0.80), ARCH(5) = 6.50 (significance level = 0.26), and RESET = 0.31 (significance level = 0.81). For the definition of the specification tests, see the footnote of Table 2.
Table 4.
Parsimonious marginal model: (dependent variable = ∆i). ‡
| Variable | Coefficient | Standard Error | p-Value for Hansen’s (1992) Stability Li Test |
|---|---|---|---|
| Constant | 0.001 | 0.03 | 0.18 |
| ((∆i)Uscrisis)t−1 | −0.73 * | 0.03 | 1.00 |
| (∆log(md) Uscrisis)t−1 | 2.40 * | 0.50 | 1.00 |
| (∆log(md) Uscrisis)t−2 | 5.60 * | 0.60 | 1.00 |
| (∆log(rpc)Covid)t−1 | −33.63 * | 0.94 | 1.00 |
| (∆log(rpc)Covid)t−2 | 79.47 * | 1.36 | 1.00 |
| (∆log(q)Covid)t−1 | −130.77 * | 2.48 | 1.00 |
| (∆log(q)Covid)t−2 | 187.74 * | 3.44 | 1.00 |
| (∆log(q)Covid)t−3 | −49.61 * | 1.10 | 1.00 |
| (∆defgdpUscrisis)t−1 | −14.86 * | 0.71 | 1.00 |
| (∆debtgdpCrisis)t−1 | −0.61 * | 0.03 | 1.00 |
| (∆dfdgdpCovid)t−2 | −1.03 * | 0.04 | 1.00 |
| Uscrisist | −0.30 * | 0.07 | 1.00 |
| Hansen’s (1992) stability Li test on the variance = 1.16 | p-value = 0.00 | ||
| Joint (coefficients and the error variance) Hansen’s (1992) stability Lc test = 1.36 | p-value = 0.98 | ||
* = means 99% statistically significant. ‡ The sample period is 1980Q4–2022Q4. The lag length is 2. See the footnote of Table 1 and Table 2 for the definition of variables and mnemonics. Mean of dependent variable= −0.02. ∆ means the first difference. The estimation method is Newey and West’s (1987) Robusterror OLS. = 0.50, σ = 0.31, DW = 1.84, Godfrey(6) = 1.73 (significance level = 0.12), White = 1.23 (significance level = 1.00), ARCH(5) = 11.52 (significance level = 0.04), and RESET = 0.10 (significance level = 0.92). For the definition of the specification tests, refer to the footnote of Table 2.
Table 5.
Superexogeneity test results for the demand for real M1. ‡
| Contemporaneous Variable | ∆log(q) | ∆i |
|---|---|---|
| Variable Z | Chi-Squared (χ2)-Test (Significance Level) | Chi-Squared (χ2)-Test (Significance Level) |
| Zt – ηZ | 1.32 * | 0.00 |
| (0.25) | (0.99) | |
| σZZ (Z – ηZ) | 0.42 | 2.31 * |
| (0.51) | (0.13) | |
| (ηZ)2 | 0.43 | 0.03 |
| (0.51) | (0.86) | |
| (ηZ)3 | 0.43 | 0.61 |
| (0.51) | (0.44) | |
| σZZ ηZ | 1.80 * | 2.08 * |
| (0.18) | (0.15) | |
| σZZ (ηZ)2 | 4.37 * | 10.66 * |
| (0.04) | (0.00) | |
| (σZZ)2ηZ | 0.71 * | 17.19 * |
| (0.40) | (0.00) | |
| χ2(7) or F(7) statistics on the null hypothesis that coefficients of all constructed variables in this column are jointly zero. The equation excludes the constructed variables related to the other contemporaneous variable. | 19.78 or 2.83 Significance level = 0.01 | 88.58 or 12.65 Significance level = 0.00 |
| χ2(7) or F(7) statistics on the null hypothesis that coefficients of all constructed variables are jointly zero. | 192.45 or 13.75 Significance level = 0.00 | |
* = means 99% statistically significant. ‡ The sample period is 1980Q4–2022Q4. ∆log(mdt) = α0 + ψ0 Zt + (δ0 − ψ0) (Zt − ηZt) + δ1 σtZZ (Zt − ηZt)+ ψ1 (ηZt)2 + ψ2 σtZZ + ψ3 σtZZ ηZt + ψ4 σtZZ (ηZt)2 +z’tγ + ut. ∆md is the real money demand, Z represents the first difference in log(q) or i, ηz stands for the conditional mean of ∆log(q) or ∆i, and σZ denotes the conditional variance of ∆log(q) or ∆i. zt includes the current and past values of other valid conditioning variables; see variables in Table 2. The lag length is 6. The estimation method is Ordinary Least Squares. The specification tests for ∆md: = 0.91, σ = 0.04, DW = 1.64, Godfrey (6) = 1.81 (significance level = 0.10), White = 84.19 (significance level = 0.00), ARCH (5) = 3.36 (significance level = 0.64) and RESET = 18.38 (significance level = 0.00). For the definition of these specification tests, see the footnote of Table 2.
Disclaimer/Publisher’s Note: The statements, opinions and data contained in all publications are solely those of the individual author(s) and contributor(s) and not of MDPI and/or the editor(s). MDPI and/or the editor(s) disclaim responsibility for any injury to people or property resulting from any ideas, methods, instructions or products referred to in the content. |
© 2024 by the author. Licensee MDPI, Basel, Switzerland. This article is an open access article distributed under the terms and conditions of the Creative Commons Attribution (CC BY) license (https://creativecommons.org/licenses/by/4.0/).
Share and Cite
MDPI and ACS Style
Kia, A. Demand for Money in the United States: Stability and Forward-Looking Tests. Economies 2024, 12, 49. https://doi.org/10.3390/economies12020049
AMA Style
Kia A. Demand for Money in the United States: Stability and Forward-Looking Tests. Economies. 2024; 12(2):49. https://doi.org/10.3390/economies12020049
Chicago/Turabian StyleKia, Amir. 2024. "Demand for Money in the United States: Stability and Forward-Looking Tests" Economies 12, no. 2: 49. https://doi.org/10.3390/economies12020049
Note that from the first issue of 2016, this journal uses article numbers instead of page numbers. See further details here.