
Collaboration and Competition: A Social Network Analysis of Thailand’s Music Industry


Faculty of Economics, Thammasat University, Bangkok 10200, Thailand
*
Author to whom correspondence should be addressed.
Economies 2024, 12(2), 45; https://doi.org/10.3390/economies12020045
Submission received: 30 December 2023
/
Revised: 5 February 2024
/
Accepted: 7 February 2024
/
Published: 12 February 2024
Abstract
:This study quantitatively investigates the collaborative framework and competitive landscape of Thailand’s evolving music industry, driven by technological progress and changing consumer preferences. By examining data obtained from Thailand’s Department of Intellectual Property, specifically 138,868 songs, it explores the complex network of relationships among music creators, artists, and various rights-holders, including those associated with recording, music, melodies, and lyrics. Utilizing social network analysis, this research uncovers a power law distribution in these networks, reflecting a scale-free market configuration. This characteristic is marked by a few dominant players exercising considerable market influence, contrasted with numerous less-interconnected participants. This investigation notes regular patterns of collaboration between artists and different rights-holders. Furthermore, the network of music creators displays small-world properties, with short collaborative distances fostering efficient information exchange and creative synergy. Crucially, this study identifies key influential players instrumental in directing the industry’s major trends, highlighting their role in market concentration. These significant findings will provide critical evidence for informing future policy development aimed at improving efficiency and equity in the digital content industries.
1. Introduction
The music industry, both on a global scale and in Thailand, plays an integral role in the broader cultural and economic framework. Music can shape societal identities and promote social structure as an influential cultural factor (Tofalvy and Koltai 2023). Furthermore, its economic significance is evident, with global revenues ascending to $21.6 billion in 2020, marking a compound annual growth rate of 7.4% from 2017 to 2020 (IFPI 2020). Moreover, technological advancements have brought in a new era for the music industry. They provide music producers the tools needed to create and distribute their music more effectively and efficiently than before (Krueger 2019). Similarly, the growth of digital platforms in the music industry in Thailand can provide an opportunity for Thai artists and music producers to extend their reach far beyond local boundaries. This evolution is illustrated in Figure 1, showing a rise in song releases by the accumulated number of songs in Thailand up to 2020.
It is also essential that music products with consumption and production patterns, such as songs, deviate from the normal distribution and randomness. They are instead characterized by a long-tail distribution (Anderson 2006; Brynjolfsson et al. 2006; Celma 2010; Bagley et al. 2022; Benner and Waldfogel 2023). This distribution reflects a market with a high demand for a small number of popular items (a short head) and a wide variety of niche items making up the rest (a long tail). Anderson (2006) introduced the concept of long-tail distribution to describe patterns in digital consumption, highlighting the difference between mainstream hits and niche products. In this distribution, there is a short head of frequently consumed items that command high demand, representing market dominance in sales and visibility (Anderson 2006; Brynjolfsson et al. 2010; Krueger 2019; Benner and Waldfogel 2023). Conversely, there exists a long tail comprising a large number of items that may not individually capture significant attention. The long tail accommodates a variety of less common and diverse preferences. This principle aligns with empirical findings in the Thai music industry, as demonstrated by an analysis of data from the Top 200 daily charts on Spotify (Stockholm, Sweden) (Spotify n.d.a) for Thai songs and artists from 2018 to 2020. These findings are illustrated in Figure 2 and Figure 3, respectively. The horizontal axis represents the popularity rank based on the number of streams. A logarithmic scale is applied to the vertical axis to transform the streaming volumes. This transformation modifies the visual representation from a long-tail curve to a more linear one but still maintains the fundamental long-tail nature of the distribution, exhibiting the exponential decline in the number of streams for both songs and artists, from the most popular to the least popular.
The long-tail distribution, with a few products dominating the market while many others maintain niche roles, indicates that network analysis is an appropriate analytical tool for comprehending industry dynamics (Newman 2005; Grando et al. 2018). By mapping relationships and measuring individual centrality, network analysis provides insights into how influence and information spread through a complex network. It helps to identify key connectors and reveal patterns of collaboration that lead the industry (Wolff et al. 2020). Also, social network analysis facilitates understanding of the industry’s small-world nature and how closely connected entities can rapidly share information (Watts and Strogatz 1998; Grando et al. 2018).
Given the unique characteristics of the music business, this study is delineated based on the hypotheses that the distribution of music creators follows a long-tail pattern as well as a small-world phenomenon. Specifically concentrating on the case of Thailand, this paper has the following key objectives: The first aims to examine long-tail and power law distribution among music creators. Secondly, the paper seeks to study the characteristics of music creator networks. The third objective involves investigating the small-world phenomenon in the network of music creators.
This paper is structured as follows: Section 2 of the paper carries out the literature review on the concentration of music stakeholders, the impact of power law and long-tail distributions, and the theoretical aspects of network analysis within the music industry. Section 3 explains the data and the methodologies applied, such as the Easley–Kleinberg model and the social network analyses. Section 4 presents the empirical results, which reveal a non-random network and long-tail patterns with small-world characteristics and identify key influential music creators. In addition, this section discusses the implications and makes recommendations for the music industry’s landscape. The final section, Section 5, summarizes the main contributions of this paper.
2. Literature Review
2.1. Concentration among Music Stakeholders
Market concentration is a considered topic within the music industry. Concentration ratios define the percentage of the market share held by the largest firms within a market (Aguiar and Waldfogel 2021). Studies by Gayer and Shy (2003), Lee (2015), and Im Kampe et al. (2020) have used these ratios to establish the music industry’s high level of concentration, revealing that a small number of firms control a significant part of the market. For instance, a study conducted by Gowers (2006) focused on the UK music industry and found that the top five music labels held over 80% of the market share, demonstrating a high concentration level within the industry. The paper suggested the implementation of policies promoting competition to encourage more diversity in the music industry.
Several studies have further investigated the effects of concentration within the music industry. One area of particular interest has been the influence of new technologies, especially music streaming, due to their potential to modify market concentration and spur innovation. Their results suggested that streaming has decreased concentration by offering independent artists a platform to compete with major labels (Oberholzer-Gee and Strumpf 2007; Aguiar and Waldfogel 2015; Tofalvy and Koltai 2023). In another study, Ko and Lau (2015) explored the music streaming business model, emphasizing the prominent role of a few global brands, such as Spotify and Deezer (Paris, France), in the streaming era. Aguiar and Waldfogel (2017, 2021), and Aguiar et al. (2023) investigated Spotify’s impact on popular song consumption, exploring whether song-level analysis showed a displacement of music sales. Moreover, Prinz (2017) noted that these platforms had reshaped the music popularity landscape, allowing more popular musicians to top the charts, and creating success in the song market.
2.2. Power Law Distributions and Long Tails in the Music Production Network
Power law distribution describes networks in which many nodes are significantly more connected than others (Benner and Waldfogel 2023). In the context of the music industry, this indicates that a few artists or pieces may enjoy extensive connections and popularity, overshadowing the rest (Zhang and Hu 2021; Bagley et al. 2022). Gunaratna et al. (2011) observed this in their study of Brazilian music, noting that collaborations between musicians and composers followed a power law distribution. This pattern suggests that a small number of musicians and composers maintain network dominance, showing extensive collaborations compared to their peers. Similarly, Bryan and Wang (2011) proposed an influence rank method to combine song-level networks into artist and genre networks. Also, Donker (2019) and Benner and Waldfogel (2023) further supported this view through a network analysis on Spotify and revealed a small-world network exhibiting a power law distribution, indicating that the music industry is clustered around a few influential actors.
In addition, the concept of a long tail is associated with power law distributions. It refers to the pattern wherein a few entities accumulate significant popularity or success while the majority remain relatively unknown (Grando et al. 2018; Benner and Waldfogel 2023). This pattern often emerges due to differences in network connections and popularity among nodes (Zhang and Hu 2021). McAndrew and Everett (2015) brought this concept to light in their exploration of British composers. They suggested that the network of composers might have fostered the emergence of particular musical movements and styles, as it allowed for the sharing of ideas and collaboration. Watson (2012), Budner and Grahl (2016), and Zhang and Hu (2021) repeated this perspective by demonstrating that the music industry’s collaboration network follows a scale-free topology, confirming the occurrence of the long-tail phenomenon.
2.3. Network Analysis
Network analysis originated from graph theory, which is a mathematical field focused on examining structures and properties of graphs and compositions of nodes connected by edges. One of the pioneers in this field was Euler (1736), who solved the Seven Bridges of Konigsberg problem, establishing a foundation in graph theory. Over time, graph theory has found applications in various fields. Notably, Erdős and Rényi (1959) introduced the model for random graphs, a widespread model for investigating random networks. Furthermore, Barabási (2003) utilized graph theory to explore complex system structures.
Thus, one significant application of graph theory is network analysis, an essential instrument in this study. Network analysis examines network structures and dynamics, representing a vast array of systems, including social and communication networks (Alarcao and Neto 2016; Pachayappan and Venkatesakumar 2018). It has become a tool for comprehending complex systems and is used across multiple fields. This study focuses on social network analysis, with theoretical foundations drawn from Granovetter (1973), Gladwell (2002), Freeman (2004), Scott (2012), Alarcao and Neto (2016), Pachayappan and Venkatesakumar (2018), and Godart and Mears (2022).
Network analysis contains measures and techniques to interpret the complexities of networks. Centrality analysis emerges as one of the instrumental measures for identifying the details of nodes within a network (Pachayappan and Venkatesakumar 2018). Freeman et al. (1979) studied the importance of individual entities within large networks based on their positions and interconnections within a network. Building on this foundation, Bonacich (1987) expanded the narrative by exploring the equilibrium of power dynamics and how this balance impacts resource distribution. Everett and Borgatti (1999) shifted the idea to studying the roles of groups and classes, emphasizing their dynamics within the network. Bonacich (2007) then introduced the layered dimensions of influence within asymmetric network relations, magnifying the eigenvector centrality concept. The study further evolved with modern research focusing on algorithmic advancements in centrality measures (Grando et al. 2018; Di Tommaso et al. 2020).
In addition to the general framework of network analysis, social network analysis focuses on examining social relationships and interactions among individuals or organizations. It utilizes tools and techniques from network theory and graph theory to probe the structure and dynamics of social networks. Key contributors to the concept and theory of social network analysis include Freeman (2004), Scott (2012), and Hevey (2018). Barnes (1954) was one of the pioneers in applying social network analysis, analyzing a small English community’s structure. Furthermore, centrality analysis has become essential in social network analysis (Klärner et al. 2022). The importance of a node often translates to the influence or power of an individual or network (Wasserman and Faust 1994; Landherr et al. 2010; Bögenhold 2013; Iacobucci et al. 2017). Bonacich (1987) highlighted the asymmetrical nature of social interactions and their connection to influence dynamics. Then, Everett and Borgatti (1999) emphasized the importance of groups and classes within social networks. Iacobucci et al. (2017) studied the social dynamics in communities. Their findings emphasized how collective entities shape social dynamics and influence paths.
A critical component within social network theory is the concept of six degrees of separation, suggesting that any two people on the planet can be connected through a chain of no more than six connections. In the 1970s, Milgram (1967) conducted the famous six degrees of separation experiment, which offered evidence for the small-world phenomenon in social networks. Frank (1978) illustrated that social networks tend to exhibit short average path lengths, a defining feature of small-world networks. This phenomenon, in which people are linked through a small number of intermediaries, inspired the development of the Watts–Strogatz model (Watts and Strogatz 1998), which produces small-world networks by randomly renewing a fraction of a regular framework’s edges. The small-world phenomenon has often been the subject of intensive study in the field of social networks. Recently, small-world network studies have broadened to include various real-world systems, such as brain networks (Sporns et al. 2000), transportation networks (Barthélemy 2011), the World Wide Web (Albert et al. 1999), director networks (Puttanapong 2018), English words (De Deyne et al. 2019), and the internet of drones (Rehman et al. 2020).
In the scope of specific industries, creative industries comprise numerous players cooperating as a network. Studies by Joel (2009), Felton et al. (2010), Lee (2015), and Godart and Mears (2022) explored creative industries using social network analysis methodology to characterize these networks. Furthermore, social media networks within the media sector have been examined using network analysis by Kietzmann et al. (2011), Malinick et al. (2013), and Kim and Chen (2015). In addition, the film industry was among the first to be studied using the network analysis model. For the centrality analysis, Chen (2015) and Di Tommaso et al. (2020) examined the important players on media platforms. Malinick et al. (2013) and Alarcao and Neto (2016) used centrality analysis to calculate the in-degree index for the target actors.
In addition, after the small-world experiment in 1994, the industry has seen a surge in studies exploring its network structure, such as Ahmed et al. (2007), Spitz and Horvát (2014), Kagan et al. (2020), and Noroozian et al. (2022). Additionally, research has focused on the networks and relationships among the various roles within the industry.
The music industry, a creative industry subset, has seen network analysis applied to a variety of topics, from collaboration networks to industry structure and the impact of digital technologies. Joel (2009) conducted one of the earliest network analysis studies in the music industry, examining the changing structure of international music trade flow. The impact of digital technologies on the music industry has also been studied, for example by Leyshon (2001). Recently, network analysis has been used to study the structure and evolution of the music industry in both online and offline fields, as in the works of Watson (2012) and Donker (2019). In Eastern countries, such as China and Taiwan, similar studies were conducted by those such as Lin (2014). Furthermore, centrality analysis in the music industry has shown patterns of collaboration, influence, and popularity (Shin and Oh 2002; Bryan and Wang 2011; Goodrich et al. 2011; McAndrew and Everett 2015; Budner and Grahl 2016; Grando et al. 2018; Donker 2019).
In Thailand, social network analysis has been applied across multiple fields. In the medical and science sector, studies by Tiangtip and Jongwutiwes (2002) and Boonthanapat et al. (2019) used social network analysis to examine patient relationships. Noopataya et al. (2015) analyzed cattle movement patterns, while Phimpraphai et al. (2018) studied food sharing in Thai Isaan culture. Political networks have also been examined, such as in the work of Amorndoljai et al. (2015). Nonetheless, there is still a shortfall in the use of network analysis within Thailand’s creative or music sector.
Based on the literature review elaborated in this section, it is evident that there are research gaps in comprehending the intricate network structures of Thailand’s music industry, specifically regarding aspects like the long-tail and power law distribution. Hence, this paper aims to address these gaps by employing network analysis to explore the intricate relationships and collaborations among music creators in Thailand.
3. Data and Methodologies
3.1. Data Preparation
The primary data for this study was obtained from the Department of Intellectual Property (DIP) under the Ministry of Commerce in Thailand. The DIP is responsible for overseeing the protection of intellectual property rights, including copyrights and royalties related to production. The DIP’s dataset is sourced by companies that earn royalties from songs and contains numerous variables for each song in the companies’ collections. Additionally, this dataset contains data accumulated up until the year 2020 (Department of Intellectual Property Thailand 2021).
This paper aims to examine a network of five groups of creators in the music industry. The first group of music creators in this study is the recording owners who hold the rights to a song in terms of the records in Thailand. The second group is the music owners who create and own the song. The third group is the melody owners or musicians who compose the melody or instrumentals. The fourth group is the lyric owners or the lyricists. Lastly, the fifth group is the artists who perform and present the songs to the public. The study investigates bipartite networks to understand the relationships between these creators and artists.
The data-cleaning process started by removing duplicates from the DIP’s dataset, focusing on song titles and their initial lyrics to ensure each song’s uniqueness. The process also included selecting and focusing on specific variables relevant to the study’s scope: recording owner, music owner, melody owner, and lyric owner. Subsequently, the study integrated an artist’s information from online music platforms such as Google Music (California, United States), Spotify, and YouTube (California, United States). This integration was achieved through Python version 3.10.1 (by Python Software Foundation, Wilmington, NC, United States) scripting and utilizing Spotify’s Application Programming Interface (API) (Spotify n.d.c) to access and retrieve data from Spotify (Spotify n.d.b). This step was designed to integrate the unique characteristics of each song along with supplementary data gathered from publicly available resources. The approach finally resulted in a well-organized dataset of 138,868 songs up to the year 2020.
3.2. Data Description
Table 1 presents the total number of music creators in each role. The data indicates that a number of recording owners, primarily associated with record labels, have the fewest players among all roles. In contrast, the artist player category displays the highest number of players. These initial descriptive findings necessitate further examination using network analysis tools to validate the structure of creators in the Thai music industry.
3.3. Analytical Framework
This section represents the key steps in the whole analytical framework. Figure 4 shows a visual summary of the research methodologies implemented in this study. Initially, data from the Department of Intellectual Property were collected and cleansed. This data facilitated the creation of four bipartite networks. Each network represents the connections between artists and different types of music creators: recording owners, music owners, melody owners, and lyric owners. The study then applied several analytic tests to these networks. Firstly, the Easley–Kleinberg model by Easley and Kleinberg (2010) was tested to statistically confirm the power law distribution within music creators’ networks. Subsequently, social network analysis methods were applied to decipher interaction patterns within the networks of music creators and artists. The computation of the centrality indices provided insights into the importance and roles of specific network nodes. Furthermore, each network was examined for small-world patterns as defined by Watts and Strogatz (1998), testing the network’s clustering coefficient and average path length to confirm the small-world characteristics of the networks.
3.4. Easley–Kleinberg Model
The test of the power law in the popularity of songs applied the model developed by Easley and Kleinberg (2010). They explored the concepts of power law distributions in networks. Utilizing their model in this paper, then represents the number of songs of each creator with rank . Equation (1) represents the logarithm form of a power law relationship, in which the number of popular songs is negatively proportionate to rank k. The coefficient c runs the intensity of this relationship.
With additional modification, this model can quantify the magnitude of the popularity effects as a bias influence. The advanced model, with the application from Bollobás and Riordan (2005), showed that is proportional to another term of the power of , as shown in Equation (2). The value of in Equation (2) represents the probability that creators will randomly collaborate in producing another song. On the other hand, the value of represents the probability that creators will repeatedly collaborate with the same colleagues and artists who previously produced hit songs (i.e., the popularity bias or the popularity effect).
Therefore, by applying Equations (1) and (2), the value of can be obtained in Equation (3). Thus, when is close to one, rank formation predominantly relies on uniform random choices. Conversely, when is near zero, the growth of the popularity of the products is significantly ruled and biased by the popularity.
3.5. Network and Centrality Analysis
Network analysis is a research method examining structures of connectivity which consist of nodes and edges. (Scott 2012; Bögenhold 2013; Iacobucci et al. 2017; Hevey 2018; Puttanapong 2018). Nodes are the fundamental units or entities in a network, representing individual elements (Klärner et al. 2022). Particularly, this study represents individual music creators. Edges identify the relationships or interactions between pairs of nodes (Abbasi et al. 2011; Iacobucci et al. 2017; Pachayappan and Venkatesakumar 2018). Moreover, the networks between two groups (a bipartite network) of music creators (Malinick et al. 2013) were examined. In this study, each edge is the connection between two creators based on musical collaboration. Specifically, because the relationship in this paper indicates collaboration, the edges are undirected.
This study showed the bipartite networks between the four roles of creators and artists. The visualization of the network and the computation of the centrality analysis were conducted using Gephi version 0.10.1 (by Gephi Consortium, Paris, France). The obtained indicators representing the network characteristics are as follows:
- Average degree: The average degree of a network is the average number of edges per node in the network (Klärner et al. 2022). It is calculated by dividing the total number of connections by the total number of nodes (Scott 1991; Iacobucci et al. 2017);
- Average weighted degree: The average weighted degree is a graph computed with weighted edges (Radhakrishnan et al. 2014). It is the average mean of the sum of the weights of incident edges on nodes in the graph;
- Average path length: The average path length is the average distance between all pairs in a particular network (Hevey 2018; Pachayappan and Venkatesakumar 2018);
- Network diameter: The network diameter is the longest path between a pair of nodes in the network, and this indicator represents the width of the network (Parhami and Yeh 2000; Bögenhold 2013; Klärner et al. 2022);
- Connected components: The connected component of an undirected graph is a maximal set of nodes wherein a path connects each pair of nodes (Hirschberg et al. 1979). Connected components in a graph refer to nodes connected by paths;
- Modularity: Modularity is a measure of the structure of networks or graphs which measures the strength of the division of a network into communities. Networks with high modularity have dense connections between the nodes within modules but sparse connections between nodes in different modules (Sosa et al. 2007). Modularity is the fraction of edges that fall within groups 1 or 2 minus the expected number of edges within groups 1 and 2 for a random graph with the same node degree distribution as the given network (Blondel et al. 2008; Pachayappan and Venkatesakumar 2018).
To advance the examination of network topology, centrality analysis is a frequently used technique to identify a network’s most critical and central nodes (Bolland 1988; Borgatti 2005; Gneiser et al. 2012; Landherr et al. 2010). The centrality measures used in this analysis are as follows:
- Degree centrality: Degree centrality is one of the most intuitive indicators of a node’s effect on the overall network (Scott 1991; Freeman 2002). It is the sum of a node’s degrees based on the number of connections a node has to other nodes. Its value can also be used to standardize this measure by specifying the maximum number of possible links (Zhang and Hu 2021);
- Betweenness centrality: Betweenness centrality is based on the number of shortest paths between pairs of nodes that pass a given node (Freeman 2002). It is from one of the important properties of a particular node, which is the function of transmitting physical matter. So, nodes with a high betweenness centrality are located on many shortest paths and can play a key role in connecting other nodes in the network (Pachayappan and Venkatesakumar 2018; Klärner et al. 2022);
- Eigencentrality: Eigencentrality is based on the concept of eigenvectors in linear algebra. It has been developed by summing only linkages connected to important nodes (Bonacich 1987). Thus, this measure is the principal eigenvector of the graph’s adjacency matrix, representing the strength of the node connections. Therefore, a node with high eigencentrality is connected to other nodes with high eigen centrality, giving it a high level of influence within the network (Budner and Grahl 2016; Pachayappan and Venkatesakumar 2018; Klärner et al. 2022);
- PageRank centrality: PageRank centrality measures the centrality of a node in a network, which Google developed as part of its search algorithm (Brin and Page 1998). It is calculated by iteratively updating each node’s importance based on the nodes it is connected to (Zhang and Hu 2021).
3.6. Watts–Strogatz Model
The concept of small-world characteristics was formally introduced by Milgram (1967). Watts and Strogatz (1998) then provided a mathematical model for a small-world network in their paper. Small-world network theory describes a type of graph in which most nodes are not neighbors of one another, but most nodes can be reached from every other node by a small number of hops or steps (Grando et al. 2018). In other words, a small-world network is characterized by short average path lengths and high clustering (Donker 2019; Rehman et al. 2020). Therefore, this study applied the Watts–Strogatz statistic to verify the small-world phenomenon in the case of Thai music creators. Following Humphries and Gurney (2008) and Sankowska and Siudak (2016), the Watts–Strogatz statistics () can be computed using Equation (4).
Based on Humphries and Gurney (2008), it is expected that and , resulting in , which serves as the primary indicator of the small-world case. This indicates that a particular network is more likely to exhibit small-world properties characterized by high clustering coefficients and relatively short average path lengths compared to the hypothetical random-network model. This paper used R version 4.2.2 (by R Foundation, Vienna, Austria) with the igraph package to compute the Watts–Strogatz statistics.
4. Results and Discussions
4.1. Empirical Tests for Easley–Kleinberg Model
The first part of the results presents a mathematical analysis by examining the power law distribution conditions from the Easley–Kleinberg model using Equation (1). The equation is for all bipartite networks between the four roles and artists, ranked by weighted degree, as shown in Table 2. The power law coefficients for these networks were significantly less than two. The value of the creators’ coefficients in this chapter then indicates that these networks display high levels of concentration with extremely few heads within society. Moreover, Equation (3) shows that condition c > 2 enables the analysis of behavior concerning society’s popularity, so the networks cannot specify the social behavior and popularity effect in a normal way. However, according to Newman (2005), these networks remained within the acceptable range for power law distribution, as coefficients below two would render the distribution very extreme and a high deviation from the standard range.
The confirmation results of the distribution for music creators support previous studies that have identified power law distributions in various aspects of music production networks. In particular, the obtained results are in line with the power law pattern found globally in the recorded music industry (Watson 2012), as well as in the cases of Brazil (Gunaratna et al. 2011), British music (McAndrew and Everett 2015), and drum and bass artists (Donker 2019). In addition, this phenomenon also occurs in the neighboring industries: the film industry (Kagan et al. 2020) and creative industries (Lee 2015).
Although the results from this part confirm the power law distribution of the creators, the details of coefficients in the power law of the creators cannot be fully explained in terms of the popularity effects since the values are below the range in the theoretical explanation. This case then only depicts the extremely thin head and very long tail. Then, the networks of creators should have other confirmation of creators’ behaviors through other tools. The next section of the results will explain the characteristics of the music creators and artists of a song by employing social network analysis techniques.
4.2. Network Analysis Results
This section reveals the network analysis results divided into visual and quantitative evaluations. Firstly, the visualization displays the bipartite networks that connect artists with four groups of music creators: recording owners, music owners, melody owners, and lyric owners. Figure 5, Figure 6, Figure 7 and Figure 8 visually show these connections. Key players in the network are identified by the varying size of their nodes of degree, which corresponds to the number of connections they have. The figures also suggest collaboration patterns within the music industry. The structures connecting artists with recording owners and music owners have a notable centralization. There are more interconnected networks where these central recording owners play a key role in the production landscape, engaging with a large array of artists. Conversely, the networks consisting of artists with melody owners and lyric owners present a different situation. Artists seem to engage with a wider variety of melody and lyric owners, which results in a network with less centralization. This result indicates a more independent and possibly more separate interaction.
The comprehensive network displayed in Figure 5, Figure 6, Figure 7 and Figure 8 contains all connections and can obscure the visibility of central figures. Hence, Figure 9, Figure 10, Figure 11 and Figure 12 present a more simplified version of the network by filtering out less-connected nodes. This selective presentation focuses on a core group of individuals who have a greater number of connections, as indicated by their larger node sizes. The direction of these high-degree nodes or influential members underscores their central role and the concentrated nature of collaboration in the network.
The visualizations of these figures reveal a similar trend, characterized by a few dominant players with a bigger degree of size in the networks. Consequently, the networks of music creators do not connect randomly. They tend to be scale-free networks (Barabási 2009), from the discussion of the power law in the previous results. This then is one of the confirmations of the patterns among music creators, along with the power law distribution results in the previous section. The results of these visualizations are consistent with prior research into bipartite networks. Malinick et al. (2013) employed a target name roster to generate two-mode data on social movement activists and subsequently transformed the obtained network matrix into a bipartite graph. This approach facilitated the examination of relationships among target actors in relation to the respondents. Similarly, Karpov and Marakulin (2021) created two-mode data on social movement activists, allowing for the analysis of relationships amongst the target actors with respect to the respondents.
The quantitative indicators from the network analysis of the bipartite networks between artists and four distinct groups of music creators in the Thai music industry are displayed in Table 3. The network composed of recording owners and artists is particularly noteworthy due to its relatively smaller size, encompassing 5883 nodes and 13,659 edges. This smaller network size and correspondingly higher density of connections create a closer relationship between artists and recording owners, which seems more direct and influential. In contrast, the networks between melody owners and artists (13,146 nodes and 39,533 edges) and between lyric owners and artists (13,238 nodes and 39,607 edges) are noticeably larger and less dense. The results imply a wider range of musical influences. The network between music owners and artists stands out as the most interconnected, displaying an average degree of 5.747 and a weighted average degree of 12.625. Furthermore, the network between lyric owners and artists has a network diameter of 12, suggesting a broader and more distributed network structure. The networks involving melody owners with artists and lyric owners with artists both exhibit a fragmented structure with 457 and 508 components, respectively. This fragmentation indicates the isolated communities within the network. The network between music owners and artists exhibited a modularity value of 0.395, suggesting a propensity for artists to work within specific groups or niches. Additionally, the average path length, a measure of the average number of steps along the shortest paths for all possible pairs of network nodes, reveals that the networks involving melody and lyric owners have the longest average path lengths (4.593 and 4.573, respectively). This implies a relatively long chain of interactions between artists and these specific music creators.
The findings enable the categorization of the four groups of music creators into two primary clusters. The first cluster, composed of recording owners and music owners, was distinguished by dense connections and less-diverse relationships with artists. The second cluster, including melody owners and lyric owners, was characterized by less-crowded connections and higher fragmentation, indicating a more complex relationship.
4.3. Analyses of Centrality Indices
Figure 13, Figure 14, Figure 15 and Figure 16 display the distribution of collaboration among different roles of music creators, as calculated by the degree in the bipartite graphs. These figures were generated with filtering conditions to enhance the clarity and focus of the visualization. Each figure represents a distinct role of music creators in the bipartite network. Next, a logarithmic scale has been applied to the vertical axis in Figure 13, Figure 14, Figure 15 and Figure 16 (similar to Figure 2 and Figure 3) to demonstrate the long-tail pattern. The vertical axis in these figures quantifies the degree of collaboration, while the horizontal axis represents the rank, ordered by the degree. The adaptation of the logarithm transforms the distribution into a more linear format while still emphasizing the long-tail shape. The visualization in these figures validates the concentration of collaborations among a few dominant players in each network.
The centrality indices of the Thai music industry, illustrated in Table 4, Table 5, Table 6 and Table 7, present a comprehensive calculation of the relationships between the various industry roles of music creators and artists. This specifically highlights the top 10 individuals in each category, revealing the important players within the industry. The key players among the recording owners are GMM (the full name of GMM is GMM Grammy Company Limited (Bangkok, Thailand)) and RS (the full name of RS is RS Public Company Limited (Bangkok, Thailand)). From Table 4, these two players hold dominance across all centrality measures. This prominence intimates the central position and significant influence of GMM and RS within the network of recording owners and artists. It potentially gives these entities the power to guide the direction of music recording, thereby influencing musical trends. Table 5 shows that the music owner Music Copyright (Bangkok, Thailand) claims the highest centrality scores. This result marks it as a significant controller of music distribution. Following closely behind are GMM and RS, further highlighting the concentrated nature of music ownership. Notably, Music Copyright (Thailand) exhibits the highest eigencentrality score.
Table 6 then reveals the results of melody owners. Kaiwan Kulwattanothai stands out as a dominant player with the highest degree, betweenness, and PageRank scores. However, Chongrak Chankana has the highest eigencentrality, signifying a vast array of connections within the network. Lastly, Table 7 shows that Kaiwan Kulavadhanothai emerges as the predominant lyric owner with the highest degree, betweenness, and PageRank scores, indicating a significant role in distribution. Chongrak Chankana once again demonstrates considerable influence within the network, as indicated by the high eigencentrality score.
The findings in this section extend previous centrality analyses within the Thai music industry’s context. Moon et al. (2010) applied network analysis methodologies to investigate the international music trade. Their results indicated a notable dominance by a select group of countries in the global music landscape. This approach to network analysis is not particular to the music sector. Several empirical studies have showcased its efficacy in both the film and music industries. Malinick et al. (2013) explored the centrality effects of influential entities on media coverage volume within creative sectors. Kagan et al. (2020) assessed the centrality and importance of female characters in cinematic narratives. Their insights underscored the pronounced roles of these characters in shaping film storylines. Similarly, both Kagan et al. (2020) and Jones et al. (2020) employed these analytical tools to interpret character centrality within film narratives, further exemplifying the versatility of network analysis tools across varying contexts. Also, Lee (2015) examined the structure and flow of knowledge within entrepreneurial networks in the creative domain. A noticeable observation from this study was the importance of pre-existing relationships, which frequently concluded in entities assuming central roles in their networks. Exploring the creative clusters, Piccolo et al. (2018) highlighted the significance of generalists, individuals, or entities engaging in a multitude of activities.
The findings of this analysis reveal a pattern of high concentration within the Thai music industry, with a few significant select creators, particularly recording and music owners, driving song creation. This concentration could potentially influence musical diversity, the nature of artist contracts, distribution strategies, and the broader scope of artistic creativity in the industry. Such findings require further investigation into the implications and impact of these power dynamics on the overall creativity and dynamics of the music industry. Obtaining parallels with other research, Moon et al. (2010) employed analytical techniques similar to those used in the international music trade. Their research showed a landscape wherein a limited number of nations exerted substantial influence over the global music domain.
Further confirming this narrative, Watson (2012) pinpointed influential networks anchored in specific urban hubs, notably in the USA and UK, which played critical roles in shaping the recorded music industry. Complementing this line of inquiry, Donker (2019) discovered the massive influence of a select set of artists within the music circle. Essentially, the outcomes of this study echo previous research, consistently highlighting the dominance of a few key players within the creative and media sectors. Such a power connection in industry control repeats perceptions from Klärner et al. (2022). Hence, the results from this study, scoped in the Thai music industry, augment the broader understanding of power distribution in creative sectors globally.
4.4. Empirical Test for Watts–Strogatz Model
The results of the Watts–Strogatz model reveal patterns among the four distinct groups of music creators who collaborate with artists, as presented in Table 8. The clustering coefficient ratio () exceeding one is consistent across all networks of music creators and artists. This indicates a significant level of interconnectedness within each group. Moreover, the average path length ratio (λ) for all networks of music creators and artists is less than one, suggesting that the networks are structured in such a way that there is a relatively short path between any two nodes. This configuration enables the rapid distribution of information across the network. Further examination of these two key indicators reveals that the Watts–Strogatz statistics (), which are a small-world indicator, are substantially greater than one for all groups, confirming the small-world properties inherent in the music creators’ networks. These findings corroborate the small-world phenomenon observed in numerous prior studies. Researchers including Fields et al. (2011), Bryan and Wang (2011), Goodrich et al. (2011), Gunaratna et al. (2011), McAndrew and Everett (2015), Lee (2015), Puttanapong (2018), Donker (2019), and Kagan et al. (2020) contributed to the literature supporting this phenomenon.
The consistency between the observed small-world and power law distribution properties is noteworthy. Both phenomena are characterized by a low average path length, implying that any two nodes within a network can be linked through a relatively small number of steps. Additionally, the networks display a high clustering coefficient, indicative of highly interconnected local clusters. The consistency between these two properties shapes the social pattern evident in the network structure among music creators and artists in Thailand.
4.5. Summary of Discussions and Recommendations
This section summarizes the discussion points from the study’s empirical findings linked with the framework of the analyses in the previous section (Section 3.3), as shown in Table 9. The first statistical indicator by the Easley–Kleinberg model confirms the power law distribution within the networks. It corroborates a significant concentration of connections among a small number of influential players. This trend indicates a possible imbalance in the music market sloping towards oligopoly. The social network analysis supported this concentration by revealing highly centralized interaction patterns within the industry. The centrality indices pointed to a few groups of influential creators at the core of the networks. Moreover, the application of the small-world pattern revealed that the networks of music creators verify short collaboration and communication pathways. This characteristic can facilitate swift information transfer and collaborative opportunities within the industry. Hence, the validation of the model strengthened the proposition that existing market leaders continue to enhance their positions.
The growing digitization of the music business has prompted the current literature to discuss two potential future roles for record companies. The first scenario involves the continued predominance of their roles due to the ongoing need for their distinct and practical abilities in capital investment, marketing promotion, property rights management, and legal arrangements (Weng and Chen 2020; Wikström 2020; Aguiar and Waldfogel 2021; Prey et al. 2022). Conversely, the second possibility implies that record labels are becoming less important due to the emergence of online platforms that offer affordable opportunities for music creation and market expansion. These platforms also facilitate increased collaboration among all parties involved (Jain 2020; Baym et al. 2021; Prey et al. 2022).
Notably, the emergence of artificial intelligence (AI) and its impacts on the music industry have been extensively discussed. The primary domains in which AI applications exhibit promise are the fundamental procedures involved in the composition of songs and the development of lyrics (Ji et al. 2020; Drott 2021; Hesmondhalgh et al. 2021). Moreover, these characteristics facilitate the exploration and development of novel musical genres (Ji et al. 2020; Drott 2021). In addition, artificial intelligence (AI) technologies enable data analytics, which enhances the capacity to analyze musical inclinations and prospective trends. The utilization of data-driven analyses will provide vital insights that will facilitate the creation of songs that are in line with consumer demand (Hesmondhalgh et al. 2021; Aguiar and Waldfogel 2021; Grando et al. 2018; Ji et al. 2020; Weng and Chen 2020).
The advent of Virtual Reality (VR) technology is also highly anticipated. VR applications allow for remote access, resulting in decreased traveling expenses and enabling the innovative practice of organizing virtual events such as music festivals and conferences (Rambarran 2021; Turchet et al. 2021). Moreover, VR will catalyze the creation of new musical genres and unprecedented market segments, opening up new opportunities for emerging artists and music creators (Rambarran 2021; Turchet et al. 2021).
The findings from this study on the network of music creators in Thailand offer significant implications for both industry stakeholders and policymakers. The observed concentration of market power among a few major players suggests a competitive advantage for established entities, hinting at an oligopolistic market structure. This dominance, while beneficial for these entities, might limit opportunities for new entrants and innovation within the industry (Shin and Oh 2002; Rayna and Striukova 2009; Byun 2016; Krueger 2019; Autor et al. 2020). Hence, it is essential to consider strategies that encourage diversity and competitiveness in the music industry. Policies could be designed to support emerging artists and independent labels, fostering a more inclusive environment that fosters diverse talents and genres (Byun 2016; Kanellopoulou 2021). This approach would not only enhance the variety of musical offerings but also potentially lead to a more vital and resilient music industry in Thailand. Additionally, the significance of network centrality in determining the success of music creators implies that promoting collaborative networks can be a crucial strategy for upcoming artists and music creators (Kanellopoulou 2021). Suggestions and initiatives that facilitate networking events, mentorship programs, and collaborative projects could be instrumental in breaking the barriers to entry into the industry.
4.6. Limitations and Future Research
This study has a few limitations. Firstly, there are limitations in the data used, particularly in terms of emerging markets and stakeholders. The data reported to the Department of Intellectual Property might lead to the underrepresentation of emerging artists or music creators who have not registered. Future studies could expand the scope by including a more diverse range of songs, capturing a more comprehensive sample of Thailand’s music production behaviors. Secondly, while the study effectively utilizes network centrality to analyze the music industry’s dynamics, there could be an extension to explore other crucial network characteristics over time. Lastly, the economic aspects of the music industry, particularly the impact of diversity on the consumer side and on societal welfare, were not extensively explored in this study. Future research could investigate how a wider variety of music from diverse players in the market might influence welfare (Aguiar and Waldfogel 2017), offering critical insights into the economic and social implications of music industry trends in both consumption and production. This exploration could inform strategies and policies aimed at fostering a more inclusive and diverse music industry, balancing commercial success with broader societal benefits.
5. Conclusions
The paper analyzes the networks of music creators in Thailand using data from the Department of Intellectual Property. It focuses on four primary roles in song production: recording owner, music owner, lyric owner, and artist. The findings reveal a power law distribution in these networks, indicating a few popular players dominating. The study also confirms the small-world characteristics of the creator network in Thailand, which contribute to the network’s intensity. Such a structure not only accelerates innovation and collaboration among Thai music creators but also contributes to the dominance of a few popular numbers within the industry.
A few key players are identified as dominant in the Thai music industry, significantly influencing popular music trends. The research suggests that this concentration of popularity among a few players may impact competition and market diversity. It highlights the potential benefits of policies promoting diversity and collaboration in the music industry to enhance creativity and productivity.
This study’s limitations show future research opportunities. The reliance on specific data sources from the DIP may not capture the full scale of Thailand’s music industry, indicating the need for more-inclusive data. Further, aspects beyond network centrality, such as the roles of less-prominent industry players, can be explored more deeply. Additionally, the broader economic implications of music production diversity on consumers and social welfare present a constructive path for future studies, potentially offering insights into industry trends and strategies.
Author Contributions
Conceptualization, W.P. and N.P.; methodology, W.P. and N.P.; software, W.P.; validation, N.P.; formal analysis, W.P. and N.P.; investigation, N.P.; resources, W.P.; data curation, W.P.; writing—original draft preparation, W.P.; writing—review and editing, N.P.; visualization, W.P.; supervision, N.P.; project administration, N.P.; funding acquisition, W.P. All authors have read and agreed to the published version of the manuscript.
Funding
Bank of Thailand (A Doctoral Scholarship for the Graduate Student); scholarship approval document number 167/2561.
Informed Consent Statement
Not applicable.
Data Availability Statement
Data is contained within the article.
Conflicts of Interest
The authors declare no conflicts of interest. The funders had no role in the design of the study; in the collection, analyses, or interpretation of data; in the writing of the manuscript; nor in the decision to publish the results.
References
- Abbasi, Alireza, Jörn Altmann, and Liaquat Hossain. 2011. Identifying the effects of co-authorship networks on the performance of scholars: A correlation and regression analysis of performance measures and social network analysis measures. Journal of Informetrics 5: 594–607. [Google Scholar] [CrossRef]
- Aguiar, Luis, and Joel Waldfogel. 2015. Streaming Reaches Flood Stage: Does Spotify Stimulate or Depress Music Sales? NBER Working Paper Series, no. 21653 (October 2015); Cambridge: National Bureau of Economic Research. Available online: http://www.nber.org/papers/w21653 (accessed on 18 May 2023).
- Aguiar, Luis, and Joel Waldfogel. 2017. Quality Predictability and the Welfare Benefits from New Products: Evidence from the Digitization of Recorded Music. Journal of Political Economy 126: 1–33. [Google Scholar] [CrossRef]
- Aguiar, Luis, and Joel Waldfogel. 2021. Platforms, power, and promotion: Evidence from Spotify playlists. The Journal of Industrial Economics 69: 653–91. [Google Scholar] [CrossRef]
- Aguiar, Luis, Imke Reimers, and Joel Waldfogel. 2023. Platforms and the transformation of the content industries. Journal of Economics & Management Strategy. Early View. [Google Scholar] [CrossRef]
- Ahmed, Adel, Vladimir Batagelj, Xiaoyan Fu, Seok-hee Hong, Damian Merrick, and Andrej Mrvar. 2007. Visualisation and Analysis of the Internet Movie Database. Paper presented at 2007 6th International Asia-Pacific Symposium on Visualization, Sydney, NSW, Australia, February 5–7; Piscataway: IEEE, pp. 17–24. [Google Scholar] [CrossRef]
- Alarcao, André, and Mário Neto. 2016. Actor centrality in Network Projects and scientific performance: An exploratory study. RAI Revista de Administração e Inovação 13: 78–88. [Google Scholar] [CrossRef]
- Albert, Réka, Hawoong Jeong, and Albert-László Barabási. 1999. Diameter of the world-wide web. Nature 401: 130–31. [Google Scholar] [CrossRef]
- Amorndoljai, Punyanut, Surasak Taneepanichskul, Sunyarn Niempoog, and Ubonthip Nimmannit. 2015. Improving of knee osteoarthritic symptom by the local application of ginger extract nanoparticles: A preliminary report with short term follow-up. Journal of the Medecal Assocociation of Thailand 98: 871–77. Available online: http://www.jmatonline.com/index.php/jmat/article/view/6505 (accessed on 12 October 2023).
- Anderson, Chris. 2006. The Long-Tail: Why the Future of Business Is Selling Less of More. New York: Hachette Books. Available online: https://www.hachettebookgroup.com/titles/chris-anderson/the-long-tail/9781401384630/?lens=achette-books (accessed on 18 May 2023).
- Autor, David, David Dorn, Lawrence F. Katz, Christina Patterson, and John Van Reenen. 2020. The Fall of the Labor Share and the Rise of Superstar Firms. The Quarterly Journal of Economics 135: 645–709. [Google Scholar] [CrossRef]
- Bagley, Mark J. O., Ethan Gifford, and Maureen McKelvey. 2022. The evolution of niche: Variety in knowledge networks in the global music industry. Industry and Innovation 29: 425–62. [Google Scholar] [CrossRef]
- Barabási, Albert-László. 2003. Linked: The New Science of Networks. Cambridge, MA: Perseus Publishing. [Google Scholar]
- Barabási, Albert-László. 2009. Scale-free networks: A decade and beyond. Science 325: 412–13. [Google Scholar] [CrossRef]
- Barnes, John A. 1954. Class and committees in a Norwegian island parish. Human Relations 7: 39–58. [Google Scholar] [CrossRef]
- Barthélemy, Marc. 2011. Spatial networks. Physics Reports 499: 1–101. [Google Scholar] [CrossRef]
- Baym, Nancy, Rachel Bergmann, Raj Bhargava, Fernando Diaz, Tarleton Gillespie, David Hesmondhalgh, Elena Maris, and Christopher J. Persaud. 2021. Making sense of metrics in the music industries. International Journal of Communication 15: 3418–41. Available online: https://ijoc.org/index.php/ijoc/article/view/17635 (accessed on 12 October 2023).
- Benner, Mary J., and Joel Waldfogel. 2023. Changing the channel: Digitization and the rise of “middle tail” strategies. Strategic Management Journal 44: 264–87. [Google Scholar] [CrossRef]
- Blondel, Vincent D., Jean-Loup Guillaume, Renaud Lambiotte, and Etienne Lefebvre. 2008. Fast unfolding of communities in large networks. Journal of Statistical Mechanics: Theory and Experiment 2008: P10008. [Google Scholar] [CrossRef]
- Bögenhold, Dieter. 2013. Social network analysis and the sociology of economics: Filling a blind spot with the idea of social embeddedness. American Journal of Economics and Sociology 72: 293–318. [Google Scholar] [CrossRef]
- Bolland, John M. 1988. Sorting out centrality: An analysis of the performance of four centrality models in real and simulated networks. Social Networks 10: 233–53. [Google Scholar] [CrossRef]
- Bollobás, Béla, and Oliver Riordan. 2005. The critical probability for random Voronoi percolation in the plane is 1/2. Probability Theory and Related Fields 136: 417–68. [Google Scholar] [CrossRef]
- Bonacich, Phillip. 1987. Power and centrality: A family of measures. American Journal of Sociology 92: 1170–82. Available online: https://www.jstor.org/stable/2780000 (accessed on 18 May 2023). [CrossRef]
- Bonacich, Phillip. 2007. Some unique properties of eigenvector centrality. Social Networks 29: 555–64. [Google Scholar] [CrossRef]
- Boonthanapat, Naris, Kaewalee Soontornmon, Petchawan Pungrassami, Junthira Sukhasitwanichkul, Surakameth Mahasirimongkol, Chuleeporn Jiraphongsa, Patama Monkongdee, Kittipat Angchokchatchawal, and Anuwat Wiratsudakul. 2019. Use of network analysis multidrug resistant tuberculosis contact investigation in Kanchanaburi, Thailand. Tropical Medicine & International Health 24: 320–27. [Google Scholar] [CrossRef]
- Borgatti, Stephen P. 2005. Centrality and network flow. Social Networks 27: 55–71. [Google Scholar] [CrossRef]
- Brin, Sergey, and Lawrence Page. 1998. The anatomy of a large-scale hypertextual Web search engine. Computer Networks and ISDN Systems 30: 107–17. [Google Scholar] [CrossRef]
- Bryan, Nicholas J., and Gen Wang. 2011. Musical Influence Network Analysis and Rank of Sample-Based Music. Paper presented at 12th International Society for Music Information Retrieval Conference, Miami, FL, USA, October 24–28; Stanford: Stanford University, pp. 329–34. Available online: https://ccrma.stanford.edu/~njb/research/influence.pdf (accessed on 18 May 2023).
- Brynjolfsson, Erik, Yu Hu, and Michael D. Smith. 2010. Research commentary—Long-tails vs. superstars: The effect of information technology on product variety and sales concentration patterns. Information Systems Research 21: 736–47. [Google Scholar] [CrossRef]
- Brynjolfsson, Erik, Yu Jeffrey Hu, and Michael D. Smith. 2006. From niches to riches: Anatomy of the long-tail. Sloan Management Review 47: 67–71. Available online: https://ssrn.com/abstract=918142 (accessed on 18 May 2023).
- Budner, Pascal, and Joern Grahl. 2016. Collaboration Networks in the Music Industry. Köln: University of Cologne. [Google Scholar] [CrossRef]
- Byun, Chong Hyun Christie. 2016. The Economics of the Popular Music Industry: Modelling from Microeconomic Theory and Industrial Organization. New York: Palgrave Pivot. [Google Scholar] [CrossRef]
- Celma, Oscar. 2010. Music recommendation. In Music Recommendation and Discovery: The Long-Tail, Long Fail, and Long Play in the Digital Music Space. Berlin and Heidelberg: Springer, pp. 43–85. [Google Scholar] [CrossRef]
- Chen, Wenhong. 2015. Mediatizing the network model of cultural capital: Network diversity, media use, and cultural knowledge along and across ethnic boundaries. Social Networks 40: 185–96. [Google Scholar] [CrossRef]
- De Deyne, Simon, Danielle J. Navarro, Amy Perfors, Marc Brysbaert, and Gert Storms. 2019. The “Small World of Words” English word association norms for over 12,000 cue words. Behavior Research Methods 51: 987–1006. [Google Scholar] [CrossRef] [PubMed]
- Department of Intellectual Property Thailand. 2021. List of All Songs (Kor—Hor); Nonthaburi: Department of Intellectual Property, Ministry of Commerce. Available online: https://www.ipthailand.go.th/th/copyright-010/item/kor-hor.html (accessed on 5 January 2021).
- Di Tommaso, Giorgia, Mauro Gatti, Michela Iannotta, Ajay Mehra, Giovanni Stilo, and Paola Velardi. 2020. Gender, rank, and social networks on an enterprise social media platform. Social Networks 62: 58–67. [Google Scholar] [CrossRef]
- Donker, Silvia. 2019. Networking Data. A Network Analysis of Spotify’s Socio-Technical Related Artist Network. International Journal of Music Business Research 8: 67–101. Available online: https://core.ac.uk/download/pdf/232529815.pdf (accessed on 12 July 2023).
- Drott, Eric. 2021. Copyright, compensation, and commons in the music AI industry. Creative Industries Journal 14: 190–207. [Google Scholar] [CrossRef]
- Easley, David, and Jon Kleinberg. 2010. Networks, Crowds, and Markets: Reasoning about a Highly Connected World. Cambridge: Cambridge University Press. Available online: https://ds.amu.edu.et/xmlui/bitstream/handle/123456789/14747/Networks-book%20-%20833%20pages.pdf?sequence=1&isAllowed=y (accessed on 18 May 2023).
- Erdős, Paul, and Alfréd Rényi. 1959. Some further statistical properties of the digits in Cantor’s series. Acta Mathematica Academiae Scientiarum Hungarica 10: 21–29. [Google Scholar] [CrossRef]
- Euler, Leonhard. 1736. Mechanica Sive Motus Scientia Analytice Exposita: Instar Supplementi Ad Commentar. Acad. Scient. Imper. Ex typographia academiae scientiarum. vol. 2, Available online: https://books.google.com/books?hl=th&lr=&id=Id_FWenUwYIC&oi=fnd&pg=PA1&dq=Euler,+Leonhard.+1736.+Mechanica+Sive+Motus+Scientia+Analytice+Exposita:+Instar+Supplementi+Ad+Commentar.+Acad.+Scient&ots=4fBU_XpJQr&sig=hrWBgNBslRKdqWN_JPcVaax3ueo (accessed on 12 July 2023).
- Everett, Martin G., and Stephen P. Borgatti. 1999. The centrality of groups and classes. The Journal of Mathematical Sociology 23: 181–201. [Google Scholar] [CrossRef]
- Felton, Emma, Christy Collis, and Philip Graham. 2010. Making Connections: Creative Industries Networks in Outer-Suburban Locations. Australian Geographer 41: 57–70. [Google Scholar] [CrossRef]
- Fields, Ben, Kurt Jacobson, Christophe Rhodes, Mark d’Inverno, Mark Sandler, and Michael Casey. 2011. Analysis and Exploitation of Musician Social Networks for Recommendation and Discovery. IEEE Transactions on Multimedia 13: 674–86. [Google Scholar] [CrossRef]
- Frank, Ove. 1978. Sampling and estimation in large social networks. Social Networks 1: 91–101. [Google Scholar] [CrossRef]
- Freeman, Linton C. 2002. Centrality in social networks: Conceptual clarification. In Social Network: Critical Concepts in Sociology. Edited by John Scott. London: Routledge, vol. 1, pp. 238–63. Available online: https://www.bebr.ufl.edu/sites/default/files/Centrality%20in%20Social%20Networks.pdf (accessed on 12 October 2023).
- Freeman, Linton. 2004. The Development of Social Network Analysis: A Study in the Sociology of Science. Vancouver: Empirical Press, pp. 28–33. [Google Scholar]
- Freeman, Linton C., Douglas Roeder, and Robert R. Mulholland. 1979. Centrality in social networks: II. Experimental results. Social Networks 2: 119–41. [Google Scholar] [CrossRef]
- Gayer, Amit, and Oz Shy. 2003. Internet and Peer-to-Peer Distributions in Markets for Digital Products. Economics Letters 81: 197–203. [Google Scholar] [CrossRef]
- Gladwell, Malcolm. 2002. The Talent Myth: Are Smart People Overatred? The New Yorker. Available online: https://www.newyorker.com/magazine/2002/07/22/the-talent-myth (accessed on 5 December 2023).
- Gneiser, Martin, Julia Heidemann, Mathias Klier, Andrea Landherr, and Florian Probst. 2012. Valuation of online social networks taking into account users’ interconnectedness. Information Systems and e-Business Management 10: 61–84. [Google Scholar] [CrossRef]
- Godart, Frédéric, and Ashley Mears. 2022. Transitory ties: A network ecology perspective on job opportunities in fashion modeling. Social Networks. In Press. [Google Scholar] [CrossRef]
- Goodrich, Peter, Stan Renard, and Nancy Rossiter. 2011. Social Network Analysis of the Music Industry: From Barrel Organ to Youtube. Nashville: Academic and Business Research Institute International. Available online: https://www.researchgate.net/profile/Stan-Renard/publication/340493005_Social_network_analysis_of_the_music_industry_from_barrel_organ_To_Youtube/links/5e8d0011299bf1307985d4cb/Social-network-analysis-of-the-music-industry-from-barrel-organ-To-Youtube.pdf (accessed on 18 May 2023).
- Gowers, Andrew. 2006. Gowers Review of Intellectual Property; London: The Stationery Office. Available online: https://assets.publishing.service.gov.uk/media/5a7c9f7740f0b65b3de0a17d/0118404830.pdf (accessed on 12 October 2023).
- Grando, Felipe, Lisandro Z. Granville, and Luis C. Lamb. 2018. Machine learning in network centrality measures: Tutorial and outlook. ACM Computing Surveys (CSUR) 51: 1–32. [Google Scholar] [CrossRef]
- Granovetter, Mark S. 1973. The strength of weak ties. American Journal of Sociology 78: 1360–80. [Google Scholar] [CrossRef]
- Gunaratna, Charith, Evan Stoner, and Ronaldo Menezes. 2011. Using Network Sciences to Rank Musicians and Composers in Brazilian Popular Music. Paper presented at 12th International Society for Music Information Retrieval Conference (ISMIR 2011), Miami, FL, USA, October 24–28; Available online: https://archives.ismir.net/ismir2011/paper/000080.pdf (accessed on 12 July 2023).
- Hesmondhalgh, David, Richard Osborne, Hyojung Sun, and Kenny Barr. 2021. Music Creators’ Earnings in the Digital Era. New Port: Intellectual Property Office Research Paper Forthcoming. Available online: https://ssrn.com/abstract=4089749 (accessed on 27 January 2024).
- Hevey, David. 2018. Network analysis: A brief overview and tutorial. Health Psychology and Behavioral Medicine 6: 301–28. [Google Scholar] [CrossRef]
- Hirschberg, Daniel S., Ashok K. Chandra, and Dilip V. Sarwate. 1979. Computing connected components on parallel computers. Communications of the ACM 22: 461–64. [Google Scholar] [CrossRef]
- Humphries, Mark D., and Kevin Gurney. 2008. Network ‘Small-World-Ness’: A Quantitative Method for Determining Canonical Network Equivalence. PLoS ONE 3: e0002051. [Google Scholar] [CrossRef]
- Iacobucci, Dawn, Rebecca McBride, Deidre Popovich, and Maria Rouziou. 2017. In social network analysis, which centrality index should I use? Theoretical differences and empirical similarities among top centralities. Journal of Methods and Measurement in the Social Sciences 8: 72–99. [Google Scholar] [CrossRef]
- IFPI. 2020. Global Music Report 2020; London: International Federation of the Phonographic Industry. Available online: https://www.ifpi.org/news/Global-Music-Report-2020 (accessed on 18 May 2023).
- Im Kampe, Eveline Otte, Ann-Sophie Lehfeld, Silke Buda, Udo Buchholz, and Walter Haas. 2020. Surveillance of COVID-19 school outbreaks, Germany, March to August 2020. Eurosurveillance 25: 2001645. [Google Scholar] [CrossRef]
- Jain, Sanjay. 2020. Fumbling to the future? Socio-technical regime change in the recorded music industry. Technological Forecasting and Social Change 158: 120168. [Google Scholar] [CrossRef]
- Ji, Shulei, Jing Luo, and Xinyu Yang. 2020. A comprehensive survey on deep music generation: Multi-level representations, algorithms, evaluations, and future directions. arXiv arXiv:2011.06801. [Google Scholar] [CrossRef]
- Joel, Sian. 2009. A Social Network Analysis Approach to a Social Model of the Creative Industries: The Design Sub-Sector. Creative Industries Journal 2: 191–201. [Google Scholar] [CrossRef]
- Jones, Pete, Eithne Quinn, and Johan Koskinen. 2020. Measuring Centrality in Film Narratives Using Dynamic Character Interaction Networks. Social Networks 63: 21–37. [Google Scholar] [CrossRef]
- Kagan, Dima, Thomas Chesney, and Michael Fire. 2020. Using data science to understand the film industry’s gender gap. Palgrave Communications 6: 92. [Google Scholar] [CrossRef]
- Kanellopoulou, Jenny. 2021. Competition Policy and the Music Industries: A Business Model Perspective. London: Routledge. [Google Scholar] [CrossRef]
- Karpov, Ilia, and Roman Marakulin. 2021. Social Network Analysis of the Professional Community Interaction—Movie Industry Case. Paper presented at 23rd International Conference on Data Analytics and Management in Data Intensive Domains, Moscow, Russia, October 26–29; Cham: Springer International Publishing, pp. 36–50. [Google Scholar]
- Kietzmann, Jan H., Kristopher Hermkens, Ian P. McCarthy, and Bruno S. Silvestre. 2011. Social media? Get serious! Understanding the functional building blocks of social Media. Business Horizons 54: 241–51. [Google Scholar] [CrossRef]
- Kim, Yonghwan, and Hsuan-Ting Chen. 2015. Discussion network heterogeneity matters: Examining a moderated mediation model of social media use and civic engagement. International Journal of Communication 9: 2344–65. [Google Scholar]
- Klärner, Andreas, Markus Gamper, Sylvia Keim-Klärner, Irene Moor, Holger von der Lippe, and Nico Vonneilich. 2022. Social Networks and Health Inequalities: A New Perspective for Research. Cham: Springer Nature, p. 343. [Google Scholar] [CrossRef]
- Ko, Tobey H., and Henry Y. K. Lau. 2015. A Brand Premium Pricing Model for Digital Music Market. International Journal of Trade, Economics, and Finance 6: 117–24. [Google Scholar] [CrossRef]
- Krueger, Alan B. 2019. Rockonomics: A Backstage Tour of What the Music Industry Can Teach Us about Economics and Life. Currency. Available online: https://scholar.google.com/citations?view_op=view_citation&hl=th&user=5fY6_jMAAAAJ&cstart=100&pagesize=100&citation_for_view=5fY6_jMAAAAJ:bxPAEoiBajcC (accessed on 18 May 2023).
- Landherr, Andrea, Bettina Friedl, and Julia Heidemann. 2010. A critical review of centrality measures in social networks. Wirtschaftsinformatik 52: 367–82. [Google Scholar] [CrossRef]
- Lee, Minha. 2015. Fostering Connectivity: A Social Network Analysis of Entrepreneurs in Creative industries. International Journal of Cultural Policy 21: 139–52. [Google Scholar] [CrossRef]
- Leyshon, Andrew. 2001. Time–Space (and Digital) Compression: Software Formats, Musical Networks, and the Reorganisation of the Music Industry. Environment and Planning 33: 49–77. [Google Scholar] [CrossRef]
- Lin, Cheng-Yi. 2014. The Evolution of Taipei’s Music Industry: Cluster and Network Dynamics in the Innovation Practices of the Music Industry. Urban Studies 51: 335–54. [Google Scholar] [CrossRef]
- Malinick, Todd E., David B. Tindall, and Mario Diani. 2013. Network centrality and social movement media coverage: A two-mode network analytic approach. Social Networks 35: 148–58. [Google Scholar] [CrossRef]
- McAndrew, Siobhan, and Martin Everett. 2015. Music as Collective Invention: A Social Network Analysis of Composers. Cultural Sociology 9: 56–80. [Google Scholar] [CrossRef]
- Milgram, Stanley. 1967. The small world problem. Psychology Today 2: 60–67. Available online: http://snap.stanford.edu/class/cs224w-readings/milgram67smallworld.pdf (accessed on 15 July 2023).
- Moon, Shin-Il, George A. Barnett, and Yon Soo Lim. 2010. The Structure of International Music Flows Using Network Analysis. New Media & Society 12: 379–99. [Google Scholar] [CrossRef]
- Newman, Mark E. J. 2005. Power laws, Pareto distributions and Zipf’s law. Contemporary Physics 46: 323–51. [Google Scholar] [CrossRef]
- Noopataya, Supot, Sukanya Thongratsakul, and Chaithep Poolkhet. 2015. Social network analysis of cattle movement in Sukhothai province, Thailand: A study to improve control measurements. Veterinary Medicine International 2015: 587252. [Google Scholar] [CrossRef] [PubMed]
- Noroozian, Ali, Babak Amiri, and Mehrdad Agha Mohammad Ali Kermani. 2022. Investigation of cinematic genre diversity based on social network analysis: The lost ring of the Iranian cinema industry. Kybernetes. ahead-of-print. [Google Scholar] [CrossRef]
- Oberholzer-Gee, Felix, and Koleman Strumpf. 2007. The effect of file sharing on record sales: An empirical analysis. Journal of Political Economy 115: 1–42. [Google Scholar] [CrossRef]
- Pachayappan, Murugaiyan, and Ramakrishnan Venkatesakumar. 2018. A graph theory based systematic literature network analysis. Theoretical Economics Letters 8: 960–80. [Google Scholar] [CrossRef]
- Parhami, Behrooz, and Chi-Hsiang Yeh. 2000. Why Network Diameter Is Still Important. Paper presented at International Conference Communications in Computing, Las Vegas, NV, USA, June 26–29; Available online: https://web.ece.ucsb.edu/~parhami/pubs_folder/parh00c-cic-why-network-diam-important.pdf (accessed on 12 October 2023).
- Phimpraphai, Waraphon, Sirikachorn Tangkawattana, Suwicha Kasemsuwan, and Banchob Sripa. 2018. Social influence in liver fluke transmission: Application of social network analysis of food sharing in Thai Isaan culture. Advances in Parasitology 101: 97–124. [Google Scholar] [CrossRef]
- Piccolo, Sebastiano A., Sune Lehmann, and Anja Maier. 2018. Design process robustness: A bipartite network analysis reveals the central importance of people. Design Science 4: e1. [Google Scholar] [CrossRef]
- Prey, Robert, Marc Esteve Del Valle, and Leslie Zwerwer. 2022. Platform pop: Disentangling Spotify’s intermediary role in the music industry. Information, Communication & Society 25: 74–92. [Google Scholar] [CrossRef]
- Prinz, Aloys. 2017. Rankings as Coordination Games: The Dutch Top 2000 Pop Song Ranking. Journal of Cultural Economics 41: 379–401. [Google Scholar] [CrossRef]
- Puttanapong, Nattapong. 2018. The Network Analysis of Interlocking Directors: The Case of Thailand’s Listed Companies. Paper presented at 24th Eurasia Business and Economics Society, Bangkok, Thailand, January 10–12; Bangkok: Eurasian Economic Perspectives, pp. 330–62. [Google Scholar]
- Radhakrishnan, Srinivasan, Rohit Jacob, Arjun Duvvuru, and Sagar Kamrthi. 2014. Organizing Patterns and Evolution of Indian Movie Industry. Procedia Computer Science 36: 655–59. [Google Scholar] [CrossRef]
- Rambarran, Shara. 2021. Virtual Music: Sound, Music, and Image in the Digital Era. London: Bloomsbury Publishing. Available online: https://books.google.com/books?hl=en&lr=&id=zZYXEAAAQBAJ&oi=fnd&pg=PR3&dq=Virtual+Reality+in+music+industry&ots=iAwF4s8ngg&sig=Jt-kFhH6SFDB_TFmFjbsBkgaGbU (accessed on 12 October 2023).
- Rayna, Thierry, and Ludmila Striukova. 2009. Monometapoly or the Economics of the Music Industry. Prometheus 27: 211–22. [Google Scholar] [CrossRef]
- Rehman, Abdul, Anand Paul, Awais Ahmad, and Gwanggil Jeon. 2020. A novel class-based searching algorithm in small world internet of drone network. Computer Communications 157: 329–35. [Google Scholar] [CrossRef]
- Sankowska, Anna, and Dariusz Siudak. 2016. The Small World Phenomenon and Assertive Mixing in Polish Corporate Board and Director Networks. Physica A 443: 309–15. [Google Scholar] [CrossRef]
- Scott, John. 1991. Methods of Network Analysis. The Sociological Review 39: 155–63. [Google Scholar] [CrossRef]
- Scott, John. 2012. What Is Social Network Analysis? London: Bloomsbury Academic. [Google Scholar] [CrossRef]
- Shin, Eui Hang, and Joong-Hwan Oh. 2002. Changing Patterns of Social Network Structure in Composer-Singer Relationships: A Case Study of the Korean Popular Music Industry, 1927–1997. East Asia 20: 24–53. [Google Scholar] [CrossRef]
- Sosa, Manuel E., Steven D. Eppinger, and Craig M. Rowles. 2007. A network approach to define modularity of components in complex products. Journal of Mechanical Design 129: 1118–29. [Google Scholar] [CrossRef]
- Spitz, Andreas, and Emőke-Ágnes Horvát. 2014. Measuring Long-Term Impact Based on Network Centrality: Unraveling Cinematic Citations. PLoS ONE 9: e108857. [Google Scholar] [CrossRef]
- Sporns, Olaf, Giulio Tononi, and Gerald M. Edelman. 2000. Theoretical neuroanatomy: Relating anatomical and functional connectivity in graphs and cortical connection matrices. Cerebral Cortex 10: 127–41. [Google Scholar] [CrossRef]
- Spotify. n.d.a Spotify Charts. Available online: https://charts.spotify.com/charts/ (accessed on 10 January 2021).
- Spotify. n.d.b Spotify for Developers. Available online: https://developer.spotify.com/ (accessed on 10 January 2021).
- Spotify. n.d.c Spotify for Developers—Web API. Available online: https://developer.spotify.com/documentation/web-api/ (accessed on 10 January 2021).
- Tiangtip, Rattana, and Somchai Jongwutiwes. 2002. Molecular analysis of Cryptosporidium species isolated from HIV-infected patients in Thailand. Tropical Medicine & International Health 7: 357–64. [Google Scholar] [CrossRef]
- Tofalvy, Tamas, and Júlia Koltai. 2023. “Splendid Isolation”: The reproduction of music industry inequalities in Spotify’s recommendation system. New Media & Society 25: 1580–604. [Google Scholar] [CrossRef]
- Turchet, Luca, Rob Hamilton, and Anil Çamci. 2021. Music in extended realities. IEEE Access 9: 15810–32. [Google Scholar] [CrossRef]
- Wasserman, Stanley, and Katherine Faust. 1994. Social Network Analysis: Methods and Applications. Cambridge: Cambridge University Press. Available online: https://toc.library.ethz.ch/objects/pdf_ead50/3/E28_1502716_TB-I_002336476.pdf (accessed on 18 May 2023).
- Watson, Allan. 2012. The World According to iTunes: Mapping Urban Networks of Music Production. Global Networks 12: 446–66. [Google Scholar] [CrossRef]
- Watts, Duncan J., and Steven H. Strogatz. 1998. Collective dynamics of ‘small-world’networks. Nature 393: 440–42. [Google Scholar] [CrossRef]
- Weng, Sung-Shun, and Hung-Chia Chen. 2020. Exploring the role of deep learning technology in the sustainable development of the music production industry. Sustainability 12: 625. [Google Scholar] [CrossRef]
- Wikström, Patrik. 2020. The Music Industry: Music in the Cloud, 3rd ed. Medford: Polity Press. Available online: https://books.google.com/books?hl=en&lr=&id=1nDJDwAAQBAJ&oi=fnd&pg=PA1938&dq=future+of+music+labels&ots=VJECJ2wd2H&sig=6ljQy9h6XnY-3Go7qPTPTRr__J0 (accessed on 12 October 2023).
- Wolff, Georg, Michael Wältermann, and Olaf N. Rank. 2020. The embeddedness of social relations in inter-firm competitive structures. Social Networks 62: 85–98. [Google Scholar] [CrossRef]
- Zhang, Jintong, and Haibo Hu. 2021. Musical preference in an online music community in China. Social Network Analysis and Mining 12: 36. [Google Scholar] [CrossRef]
Figure 1.
Accumulated number of songs in Thailand (1985–2020). The data was taken from the Department of Intellectual Property Thailand (2021).
Figure 1.
Accumulated number of songs in Thailand (1985–2020). The data was taken from the Department of Intellectual Property Thailand (2021).
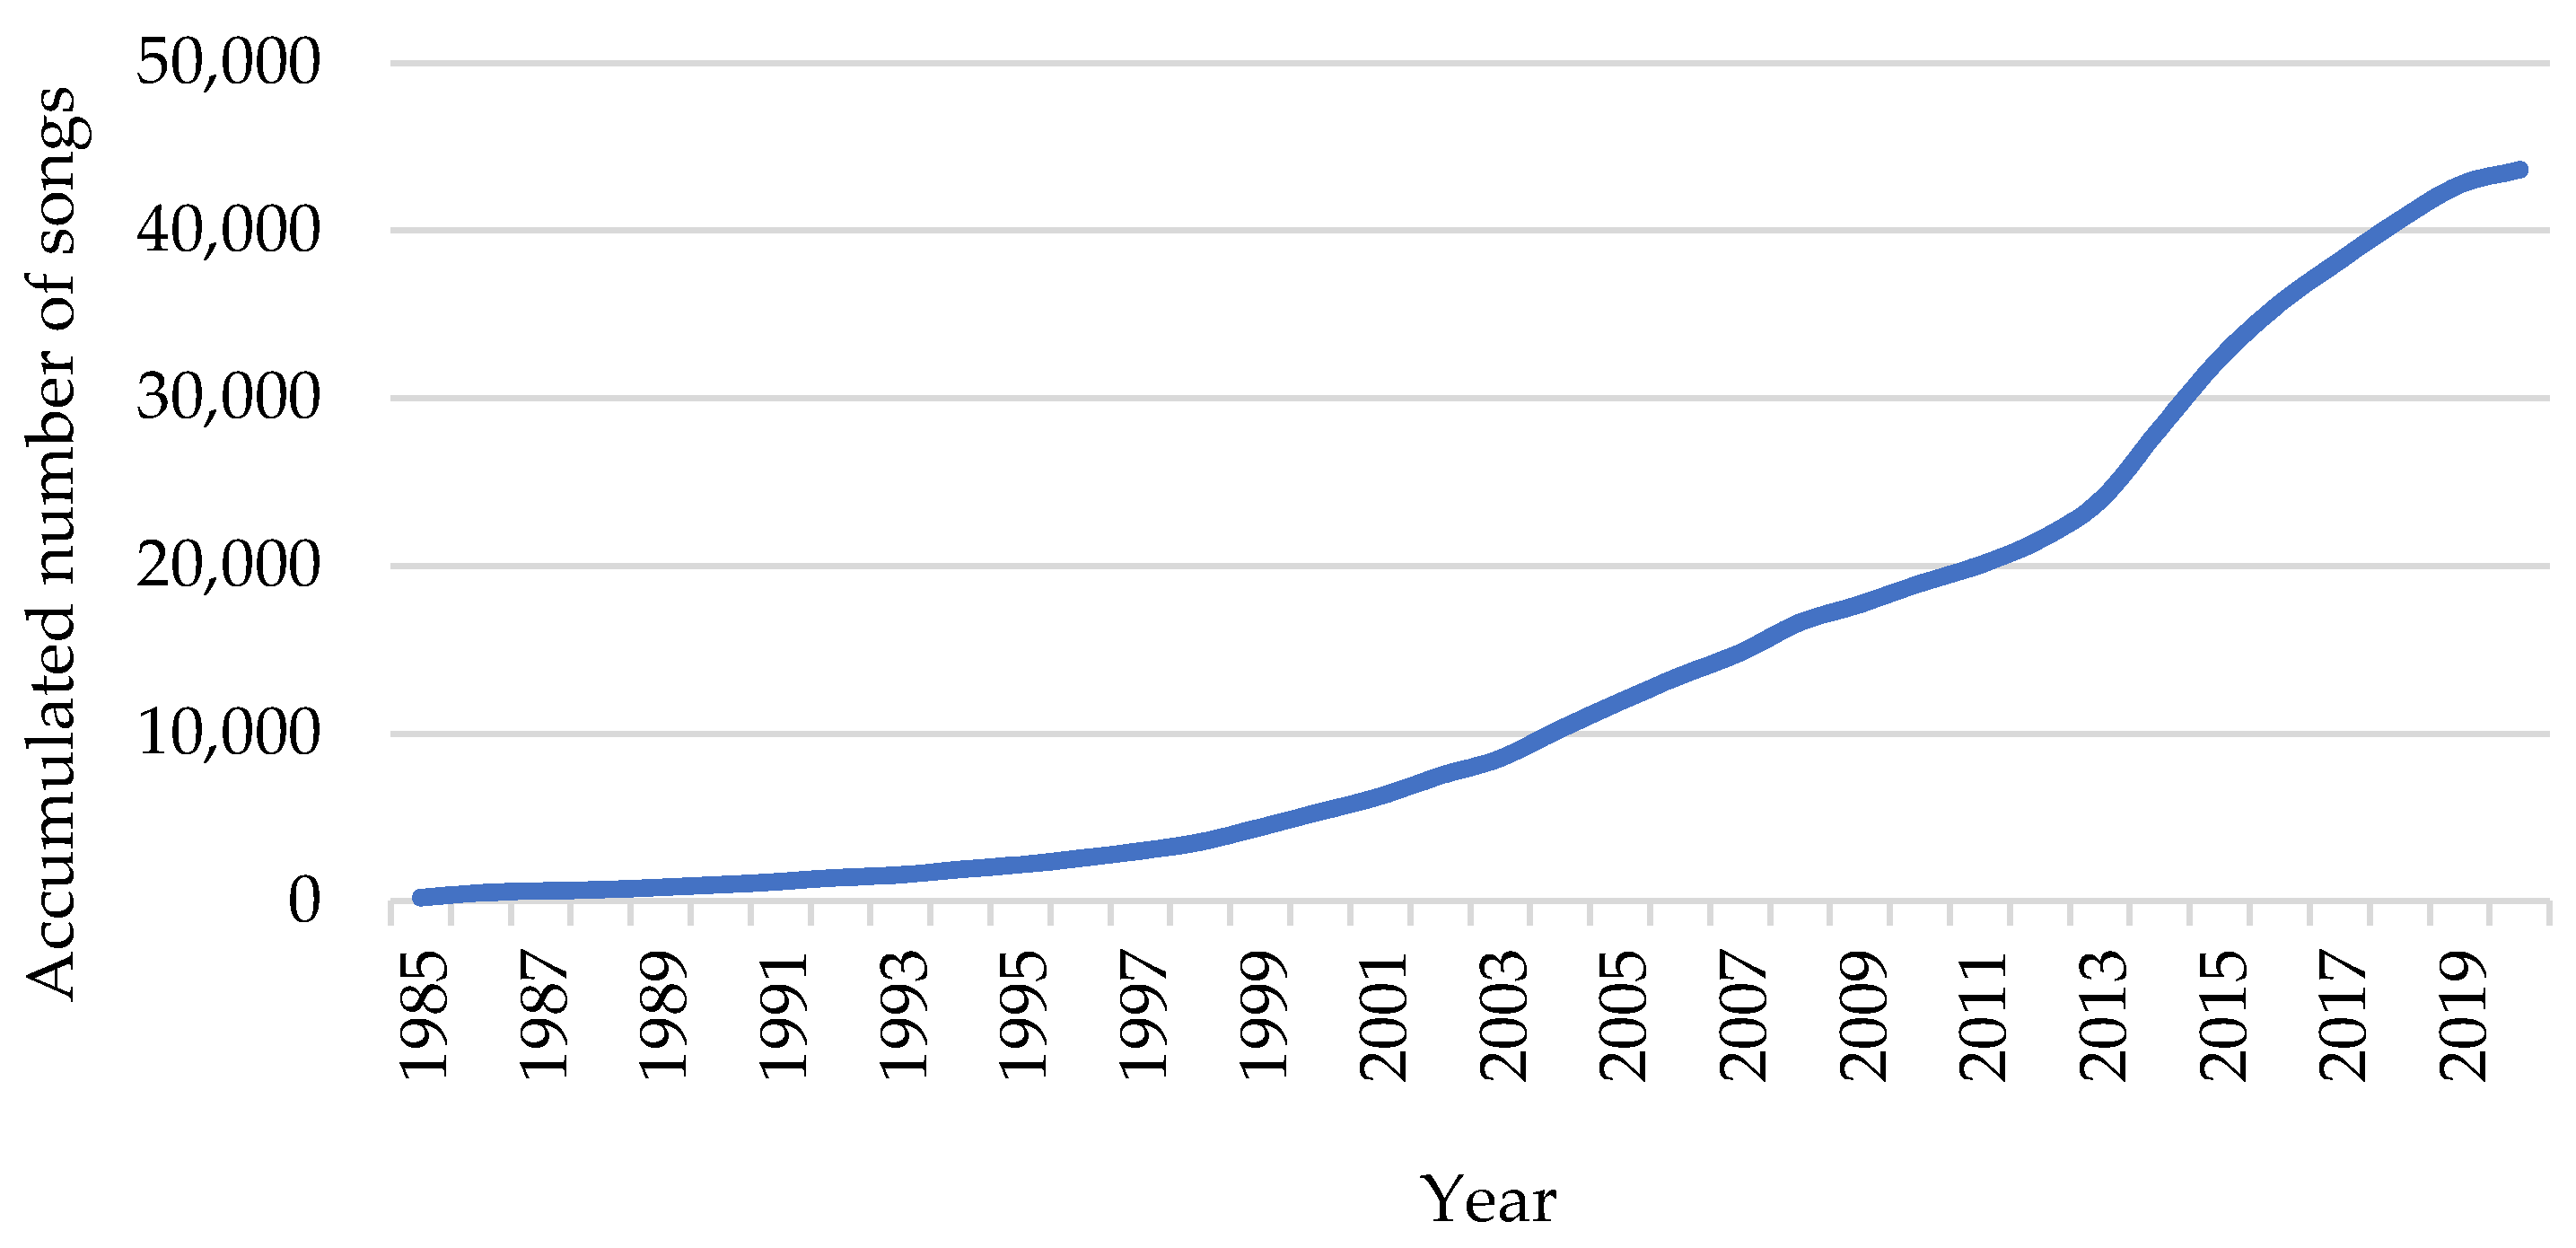
Figure 2.
Linearized long-tail distribution of streaming popularity for Thai songs (logarithmic scale on the vertical axis).
Figure 2.
Linearized long-tail distribution of streaming popularity for Thai songs (logarithmic scale on the vertical axis).
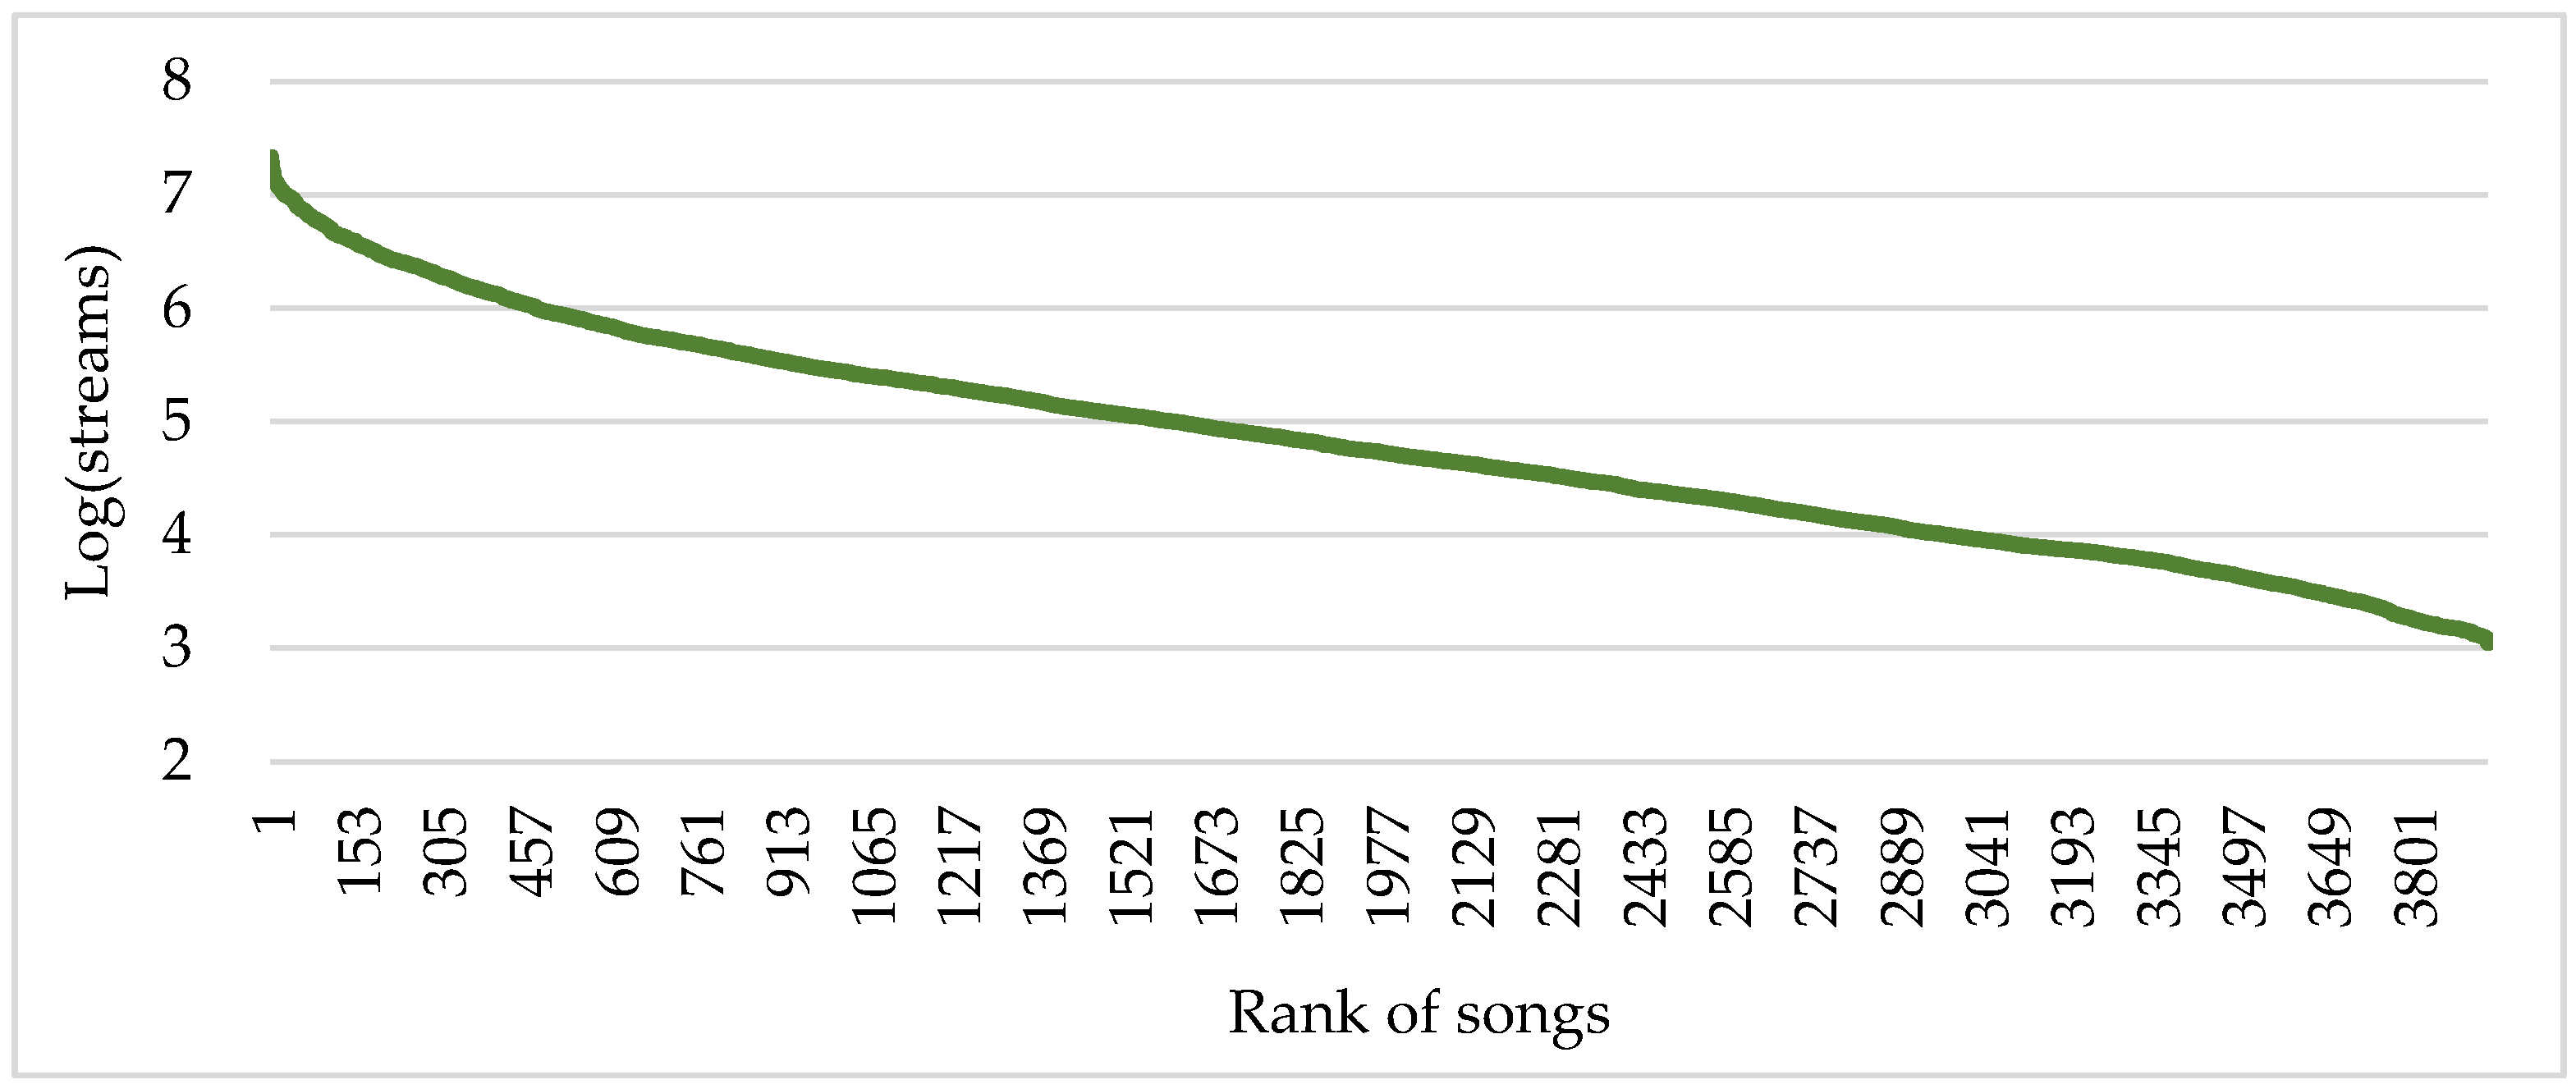
Figure 3.
Linearized long-tail distribution of streaming popularity for Thai artists (logarithmic scale on the vertical axis).
Figure 3.
Linearized long-tail distribution of streaming popularity for Thai artists (logarithmic scale on the vertical axis).

Figure 4.
The analytical framework of this study.

Figure 5.
Network structure between recording owner and artist. Purple nodes are recording owners, and blue nodes are artists. The node size represents the degree size, comparatively. The names shown in the graph correspond to the top ten nodes with the highest degrees. The symbol “(R)” following the names indicates that the individual is a recording owner.
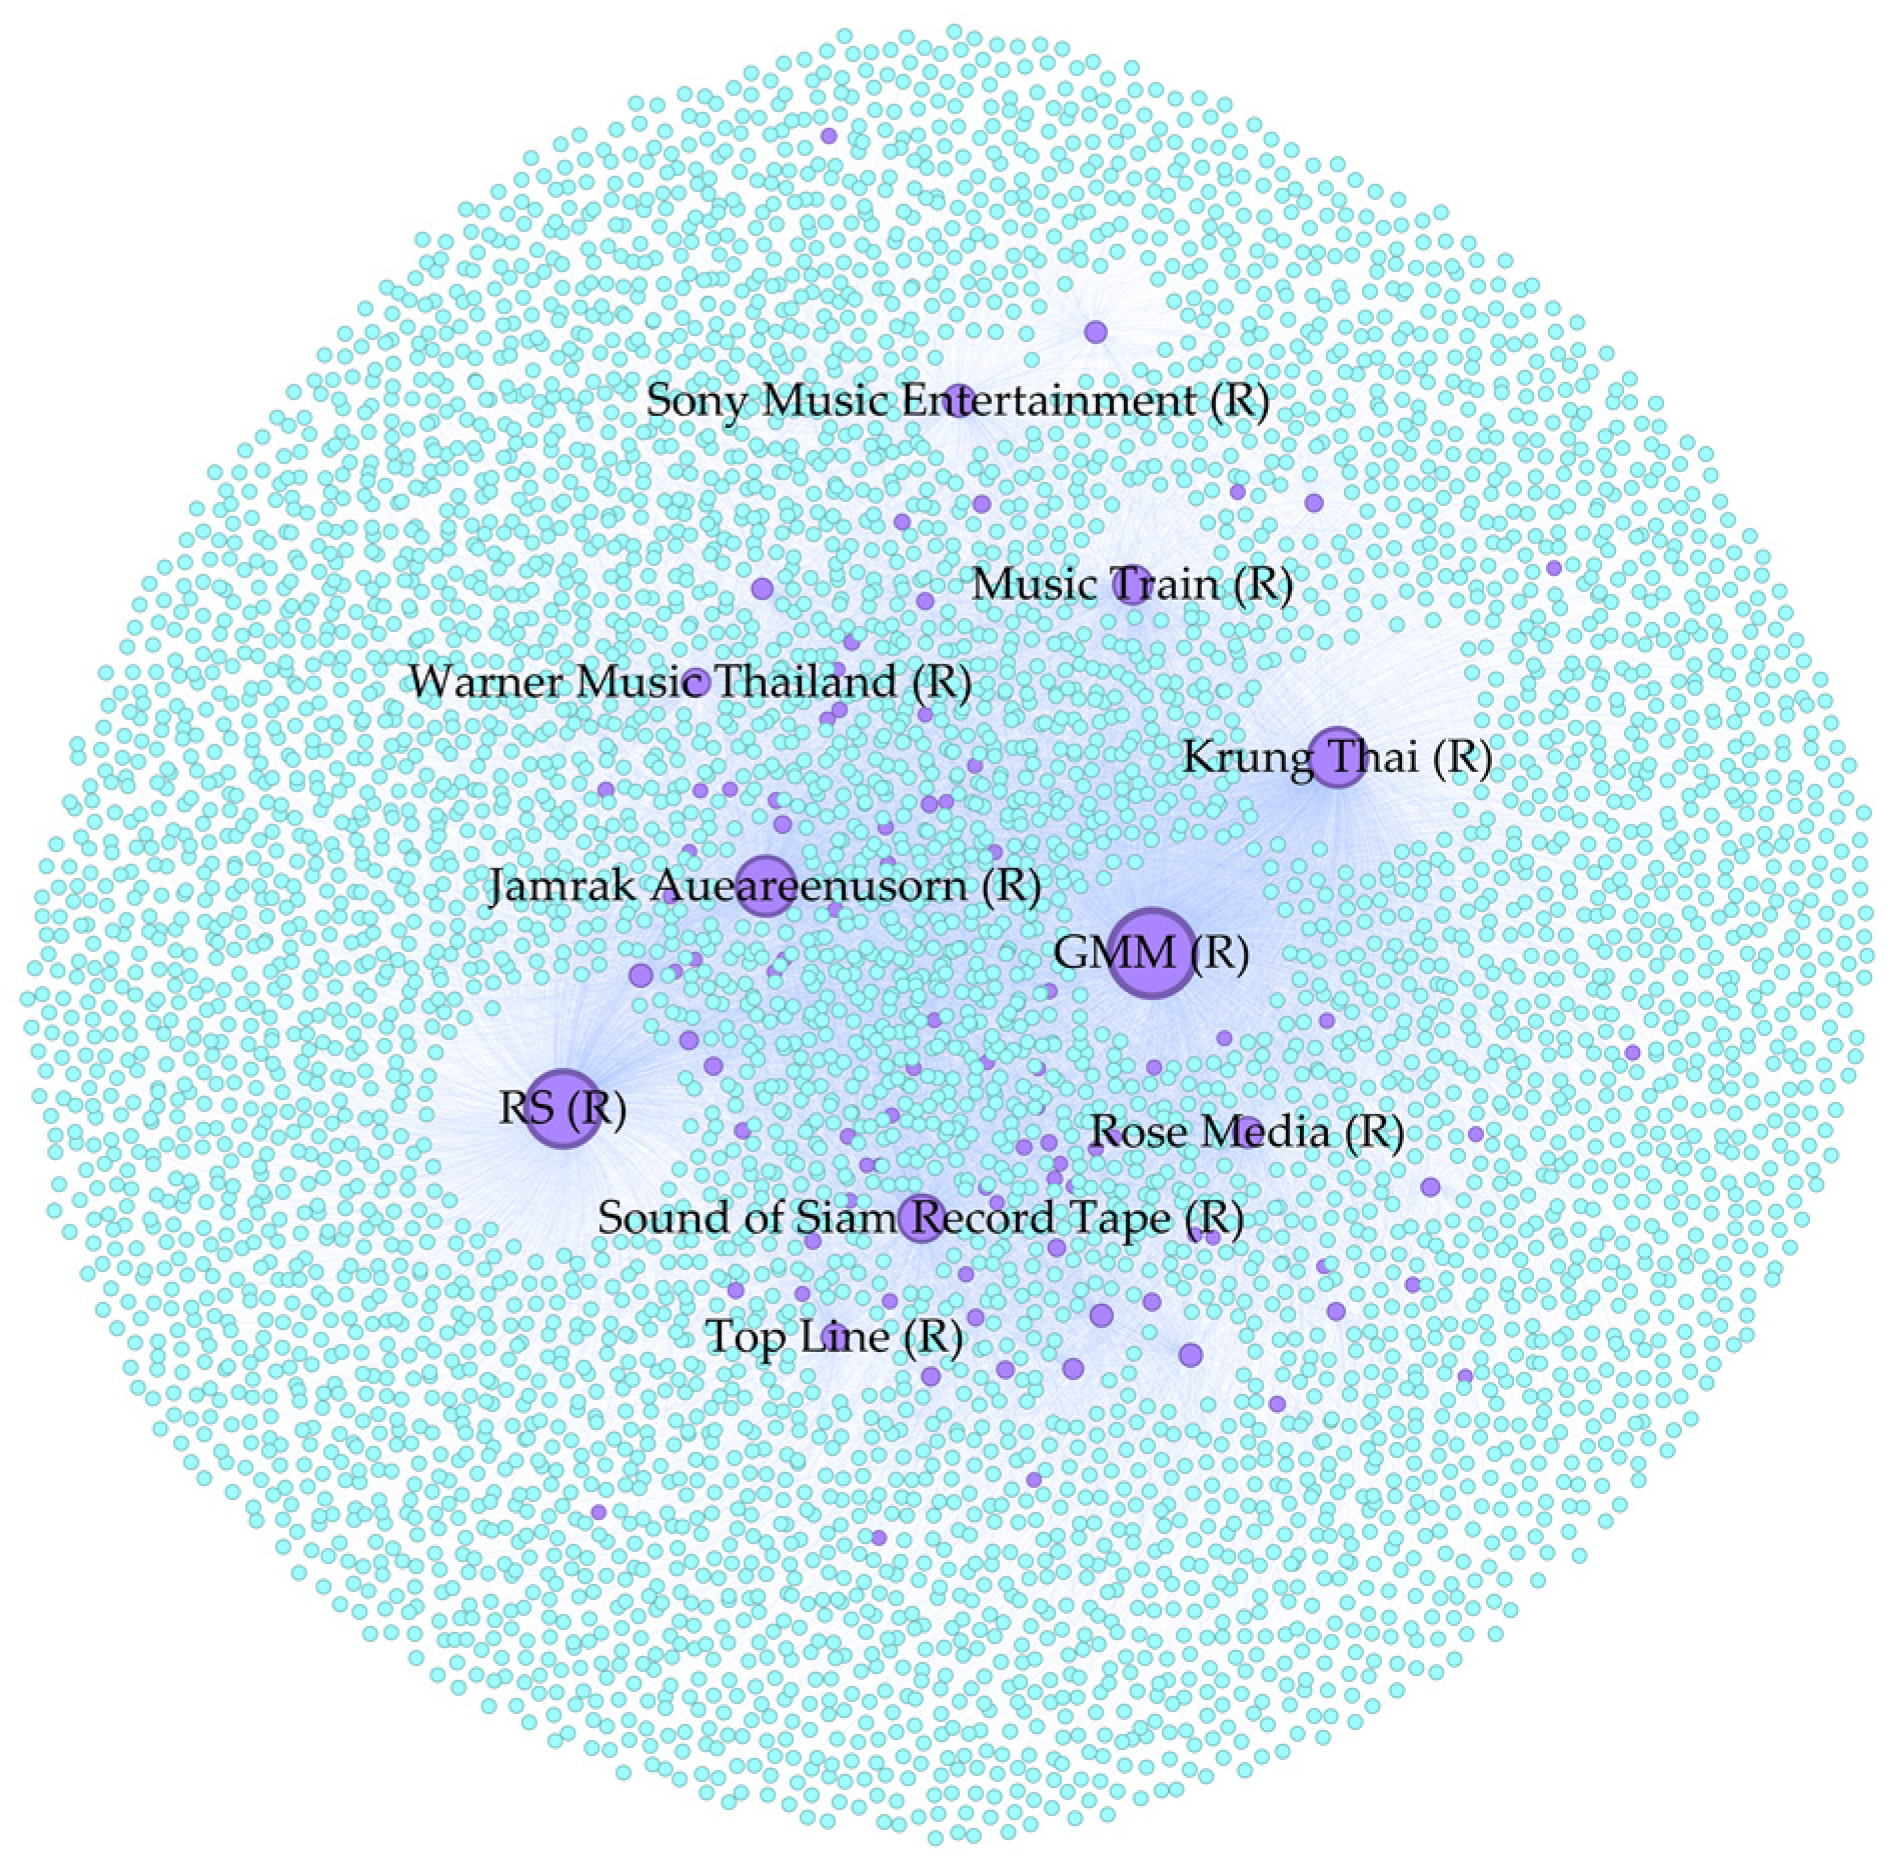
Figure 6.
Network structure between music owner and artist. Green nodes are music owners, and blue nodes are artists. The node size represents the degree size, comparatively. The names shown in the graph correspond to the top ten nodes with the highest degrees. The symbol “(S)” following the names indicates that the individual is a music owner.
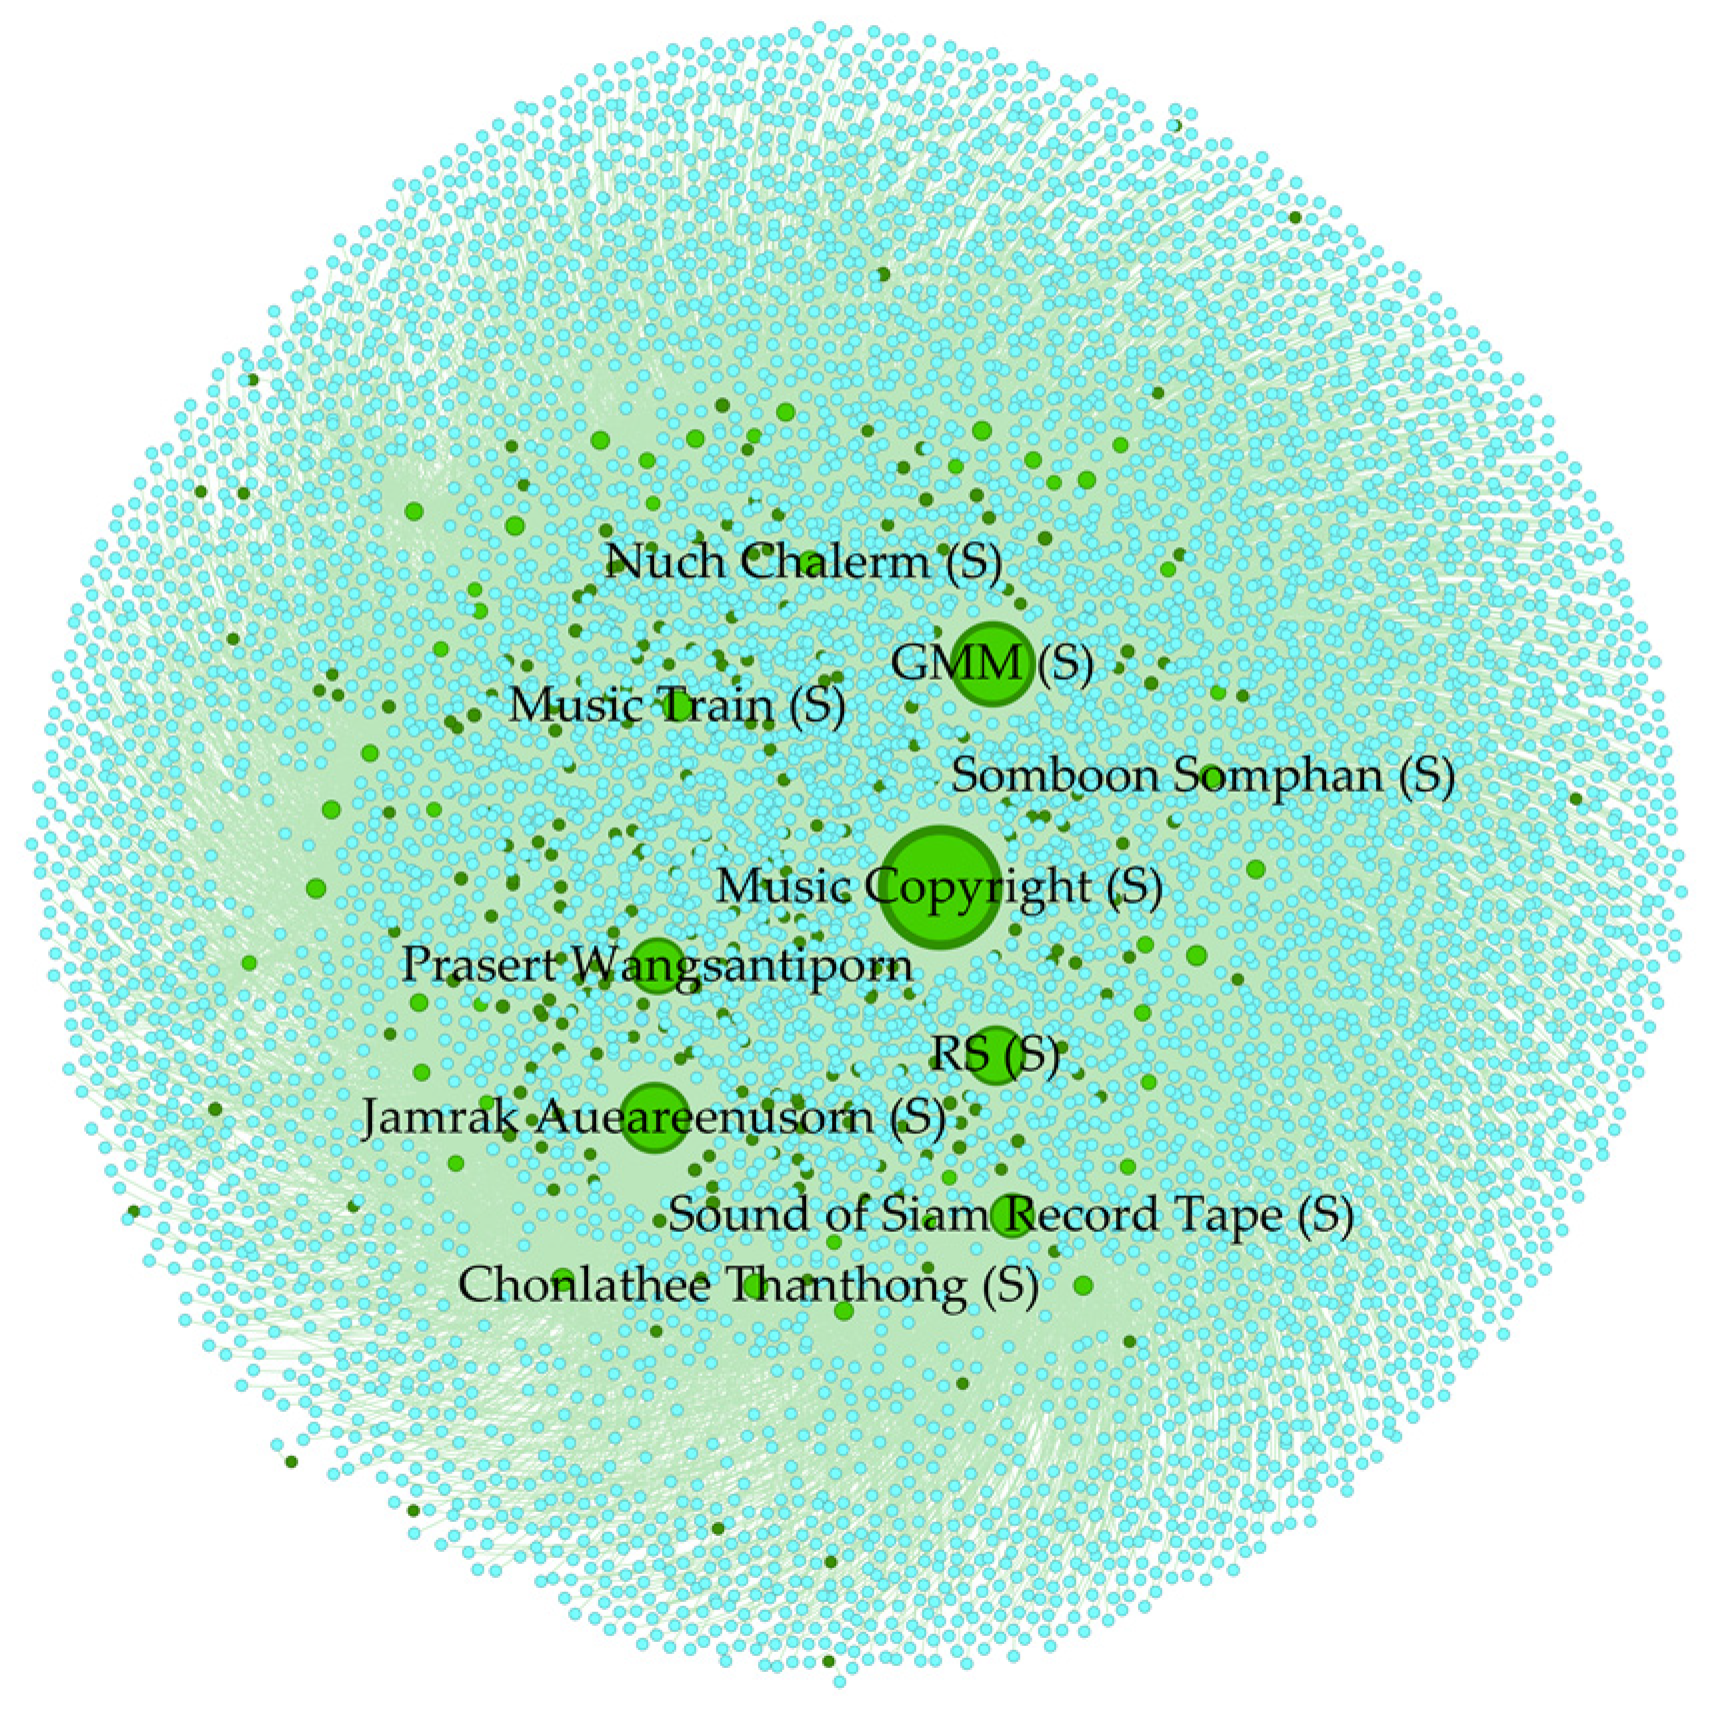
Figure 7.
Network structure between melody owner and artist. Dark-blue nodes are melody owners, and light-blue nodes are artists. The node size represents the degree size, comparatively. The names shown in the graph correspond to the top ten nodes with the highest degrees. The symbol “(M)” following the names indicates that the individual is a melody owner.
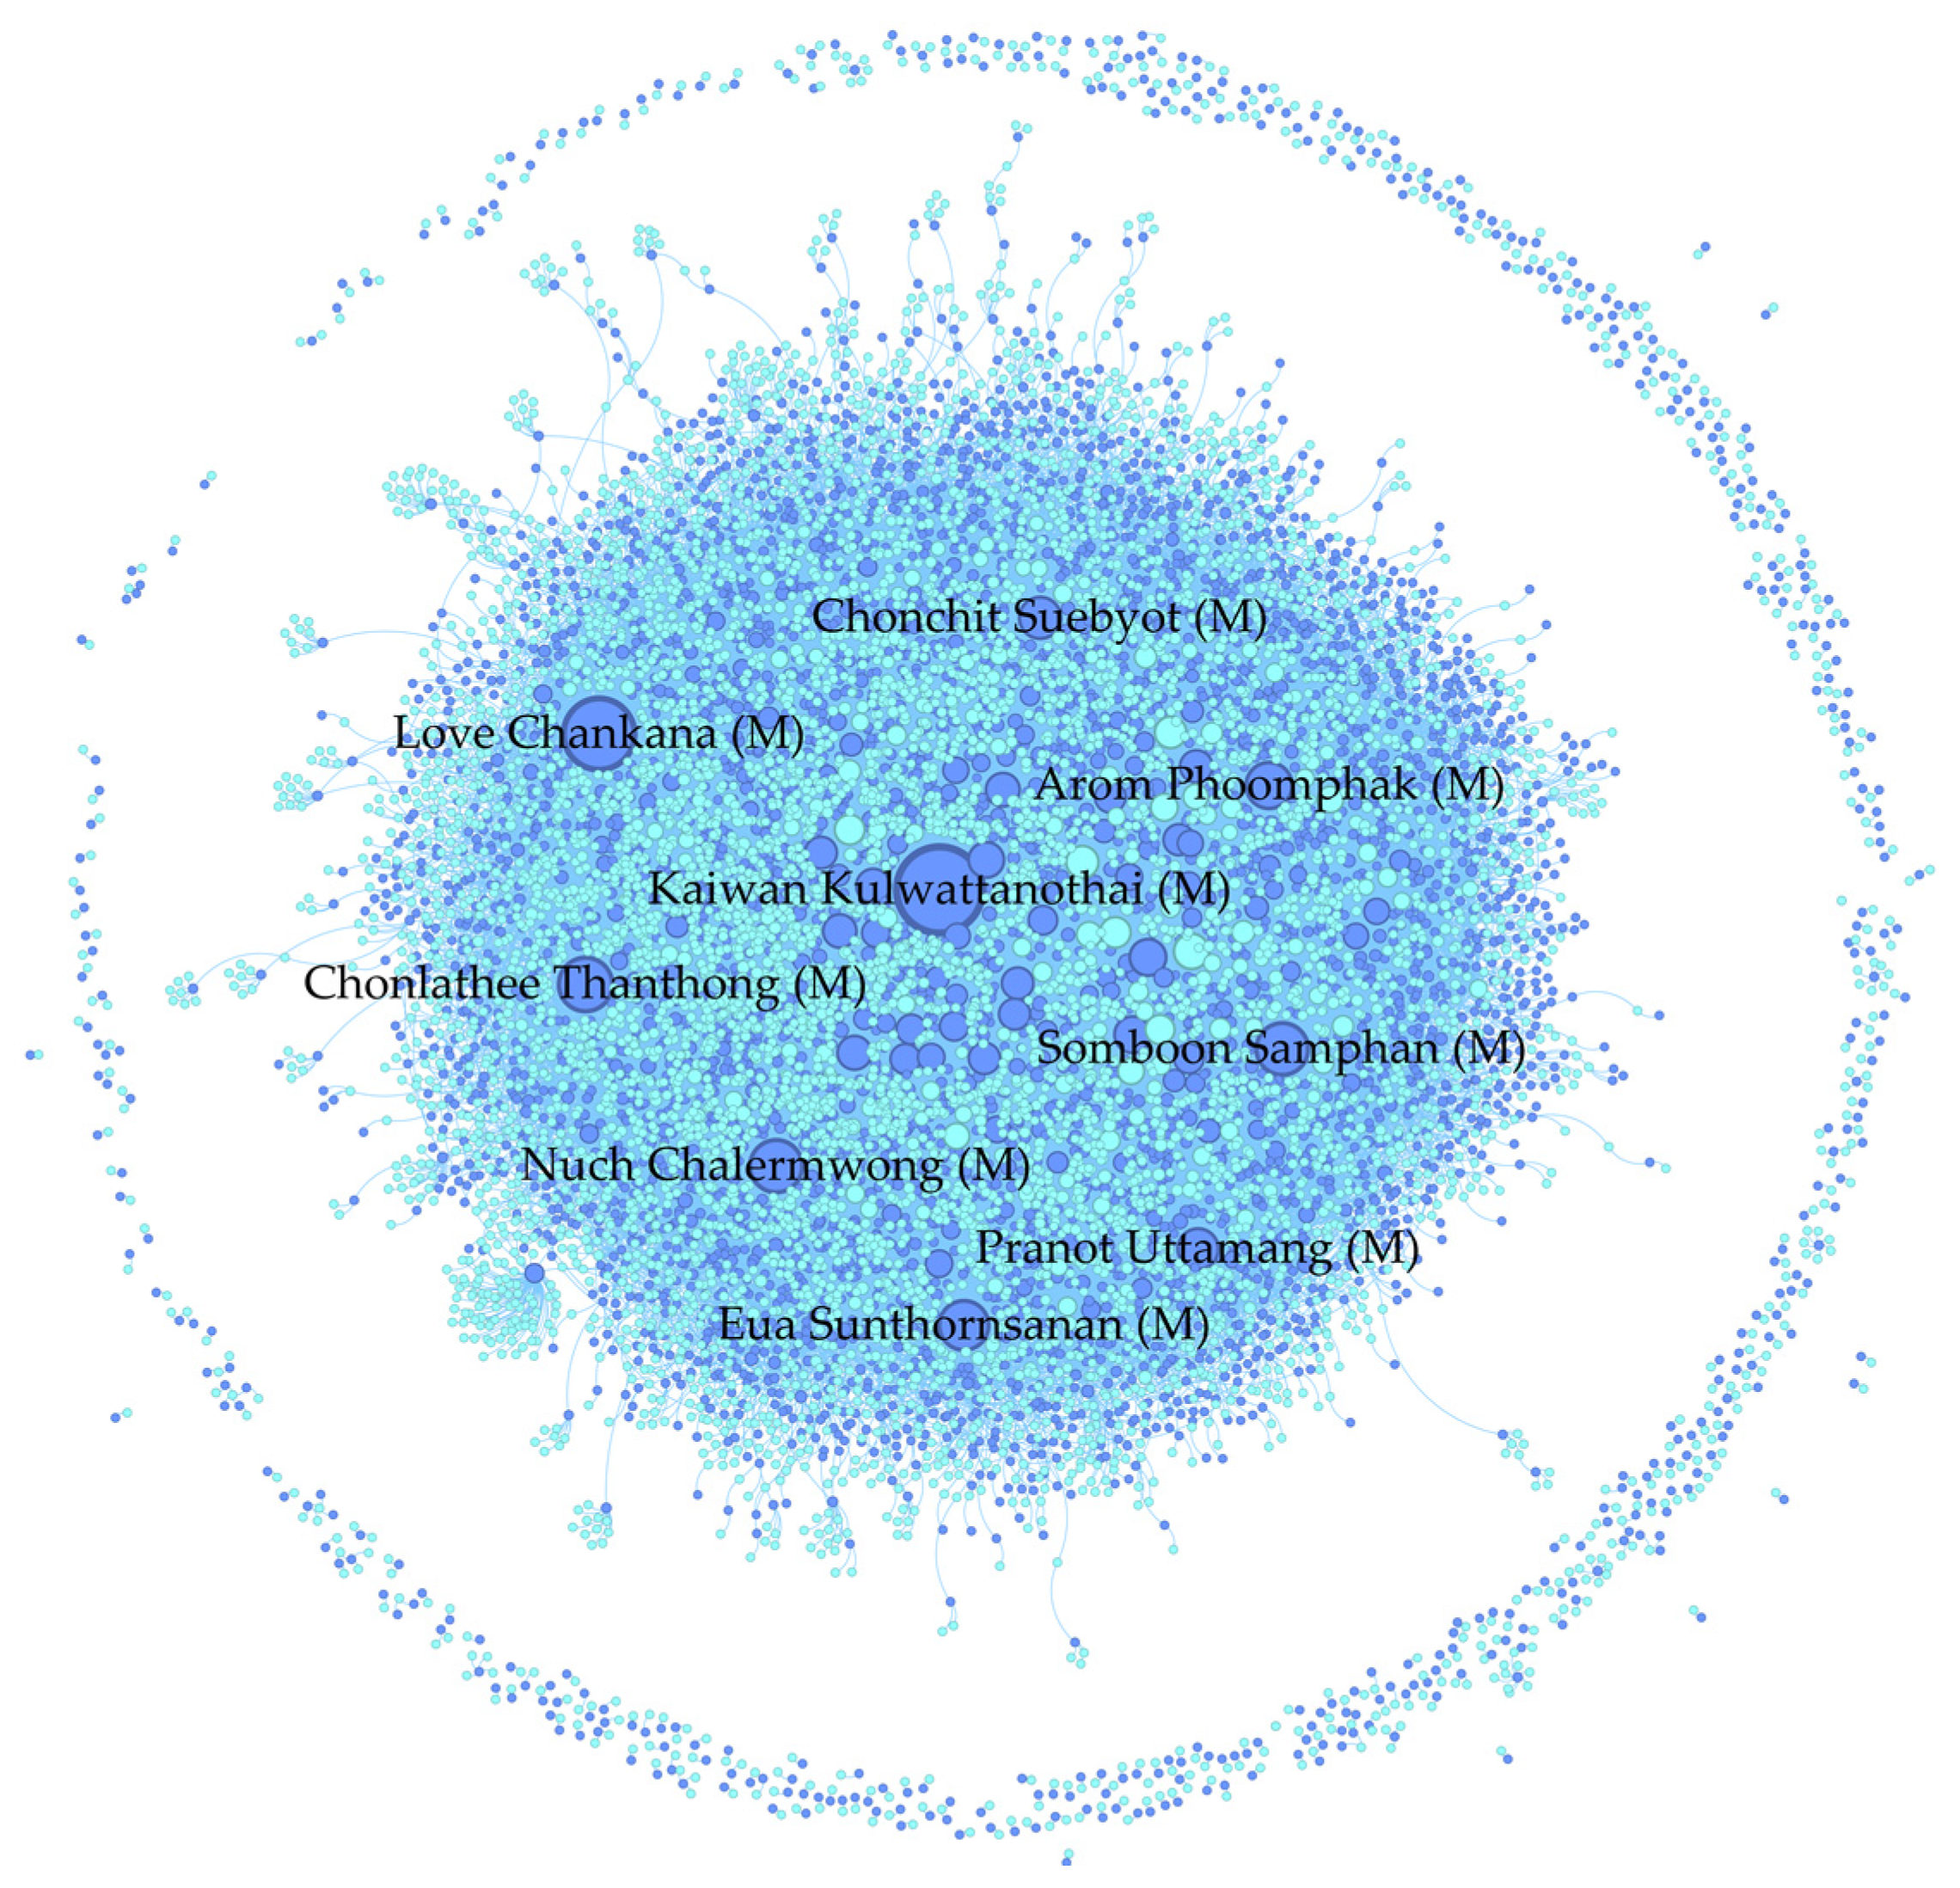
Figure 8.
Network structure between lyric owner and artist. Yellow nodes are lyric owners, and blue nodes are artists. The node size represents the degree size, comparatively. The names shown in the graph correspond to the top ten nodes with the highest degrees. The symbol “(L)” following the names indicates that the individual is a lyric owner.

Figure 9.
Network structure between recording owner and artist (filtered by degree). Purple nodes are recording owners, and blue nodes are artists. The node size represents the degree size, comparatively. Nodes displayed in the figure are filtered based on a degree greater than 25. This criterion is the highest value that effectively reveals the bipartite network of collaboration between artists and recording owners. There is a concentration of large-sized nodes, indicating that only a few nodes have a significantly high degree. The symbol “(R)” after the names denotes individuals who are recording owners, while “(A)” identifies those who are artists.

Figure 10.
Network structure between music owner and artist (filtered by degree). Green nodes are music owners, and blue nodes are artists. The node size represents the degree size, comparatively. Nodes displayed in the figure are filtered based on a degree greater than 50. This criterion is the highest value that effectively reveals the bipartite network of collaboration between artists and music owners. There is a concentration of large-sized nodes, indicating that only a few nodes have a significantly high degree. The symbol “(S)” after the names denotes individuals who are music owners, while “(A)” identifies those who are artists.
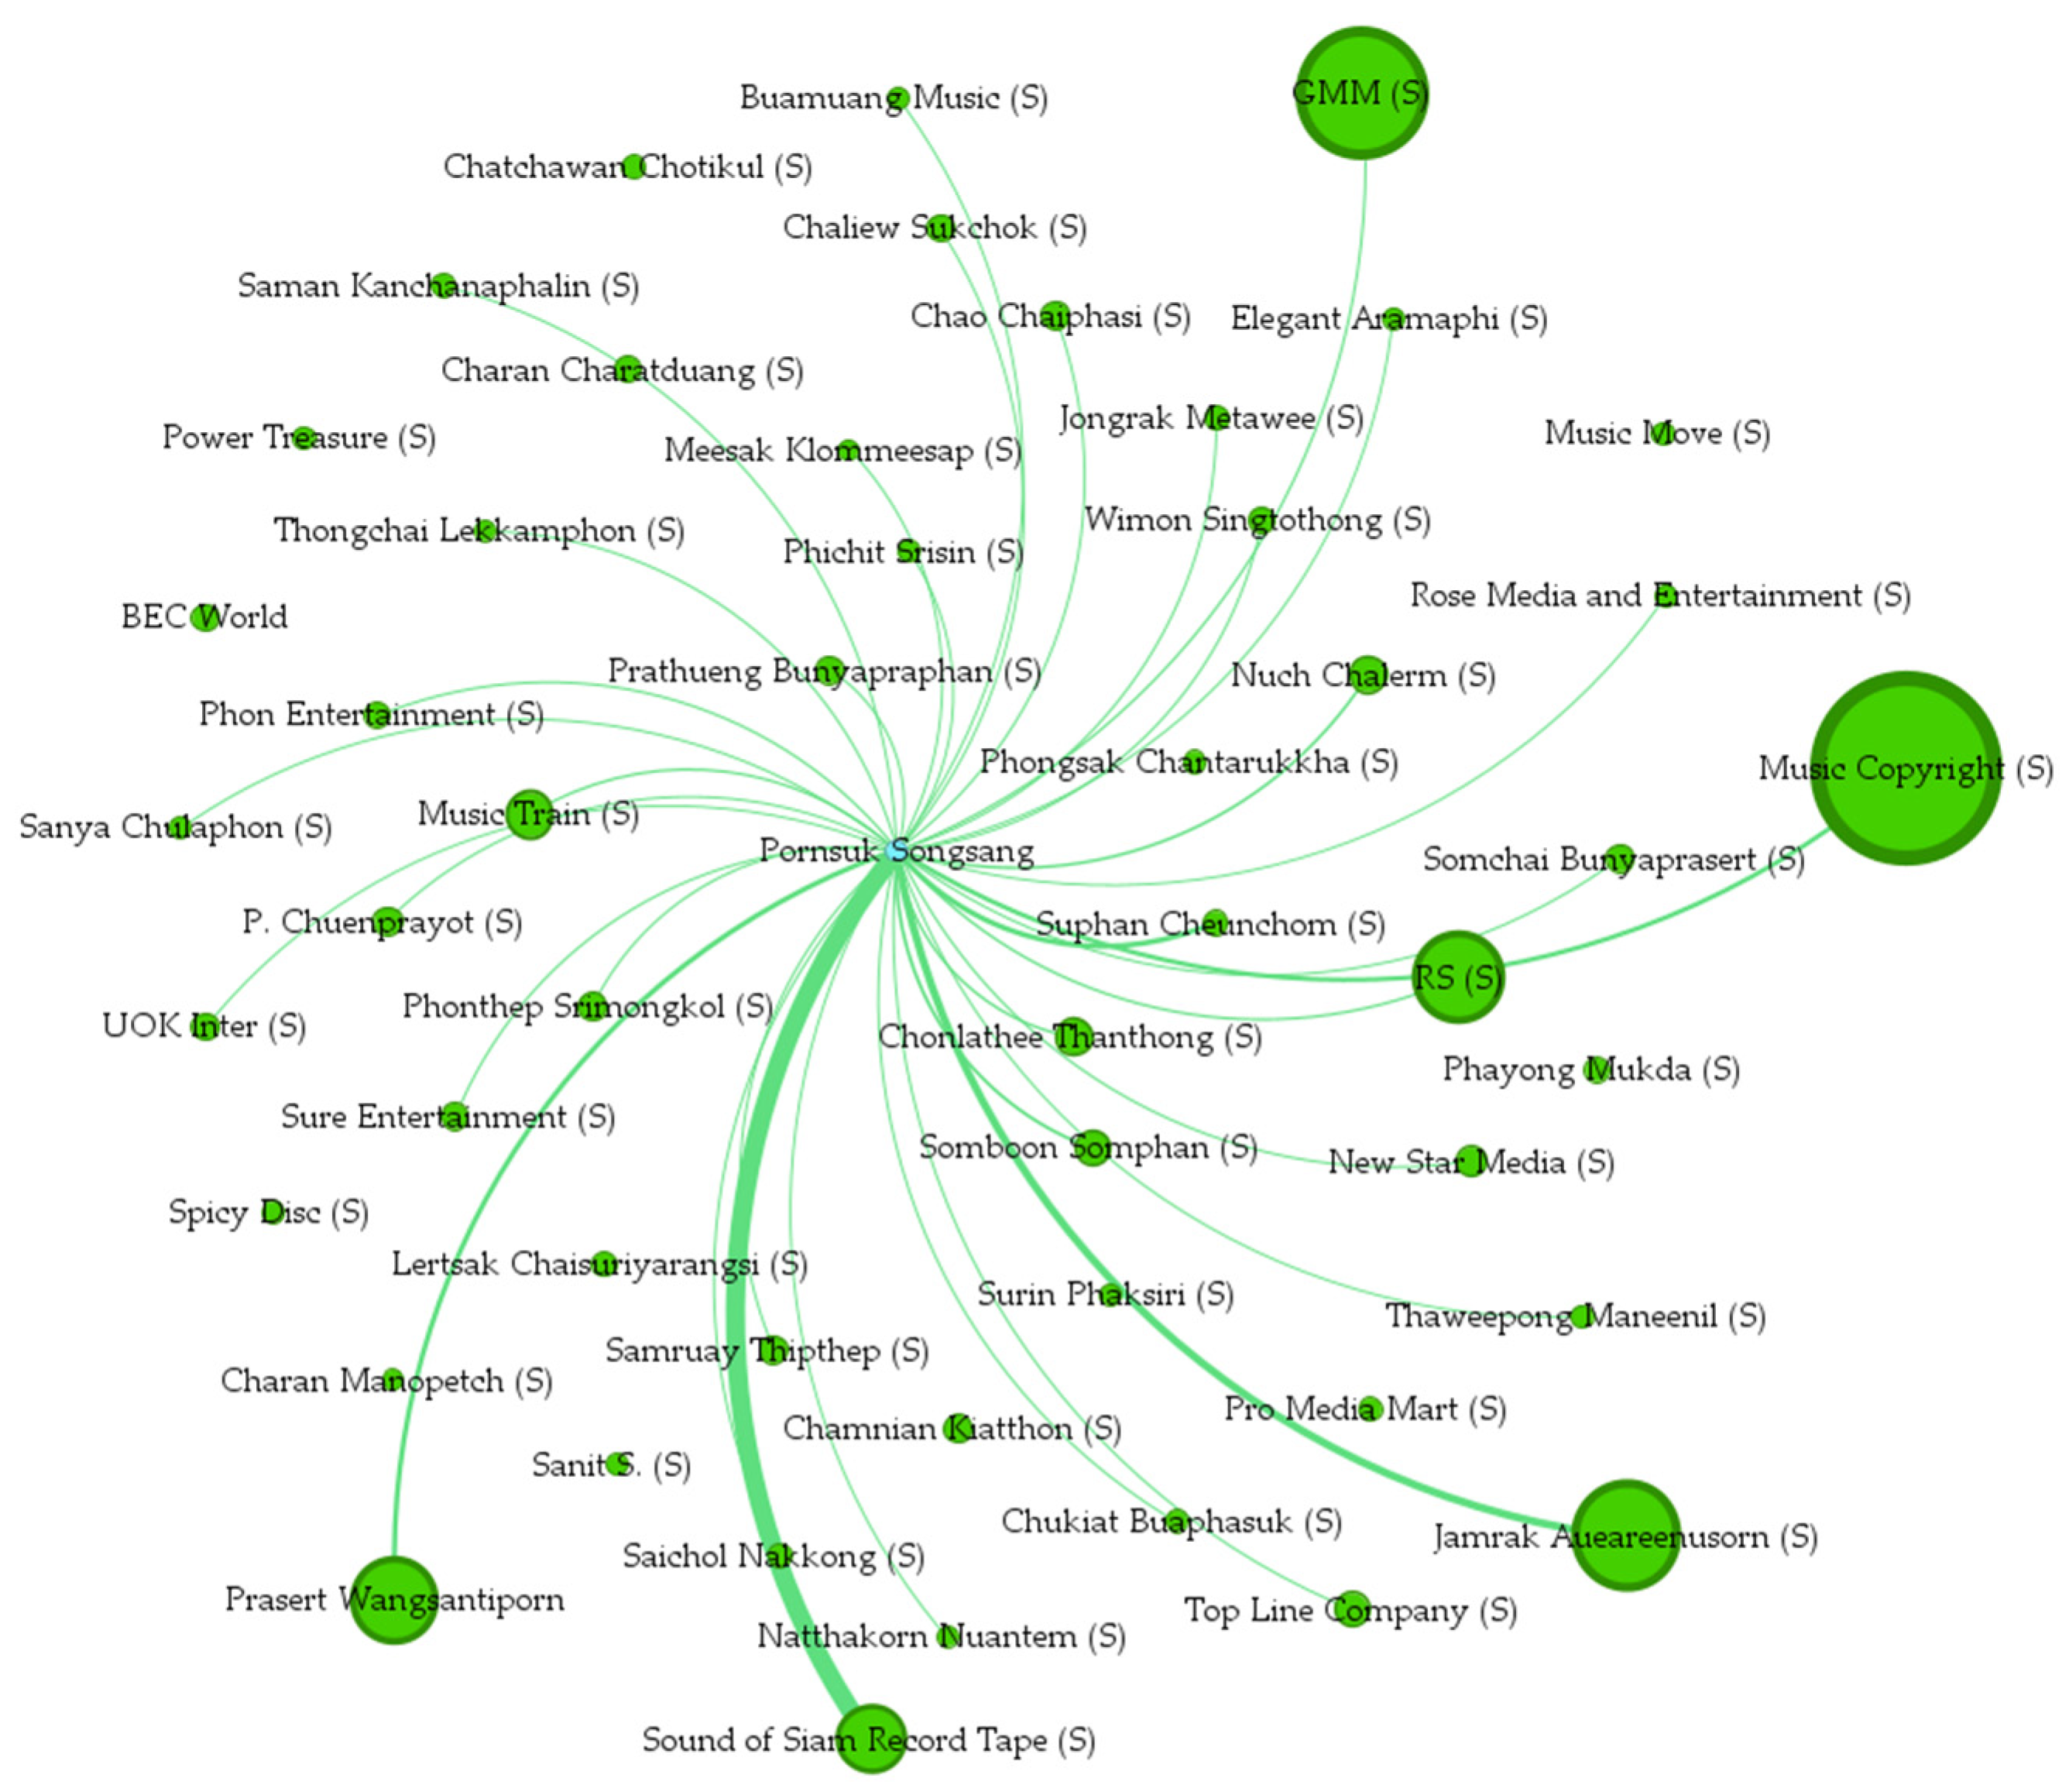
Figure 11.
Network structure between melody owner and artist (filtered by degree) Dark-blue nodes are melody owners, and light-blue nodes are artists. The node size represents the degree size, comparatively. Nodes displayed in the figure are filtered based on a degree greater than 200. This criterion is the highest value that effectively reveals the bipartite network of collaboration between artists and melody owners. There is a concentration of large-sized nodes, indicating that only a few nodes have a significantly high degree. The symbol “(M)” after the names denotes individuals who are melody owners, while “(A)” identifies those who are artists.
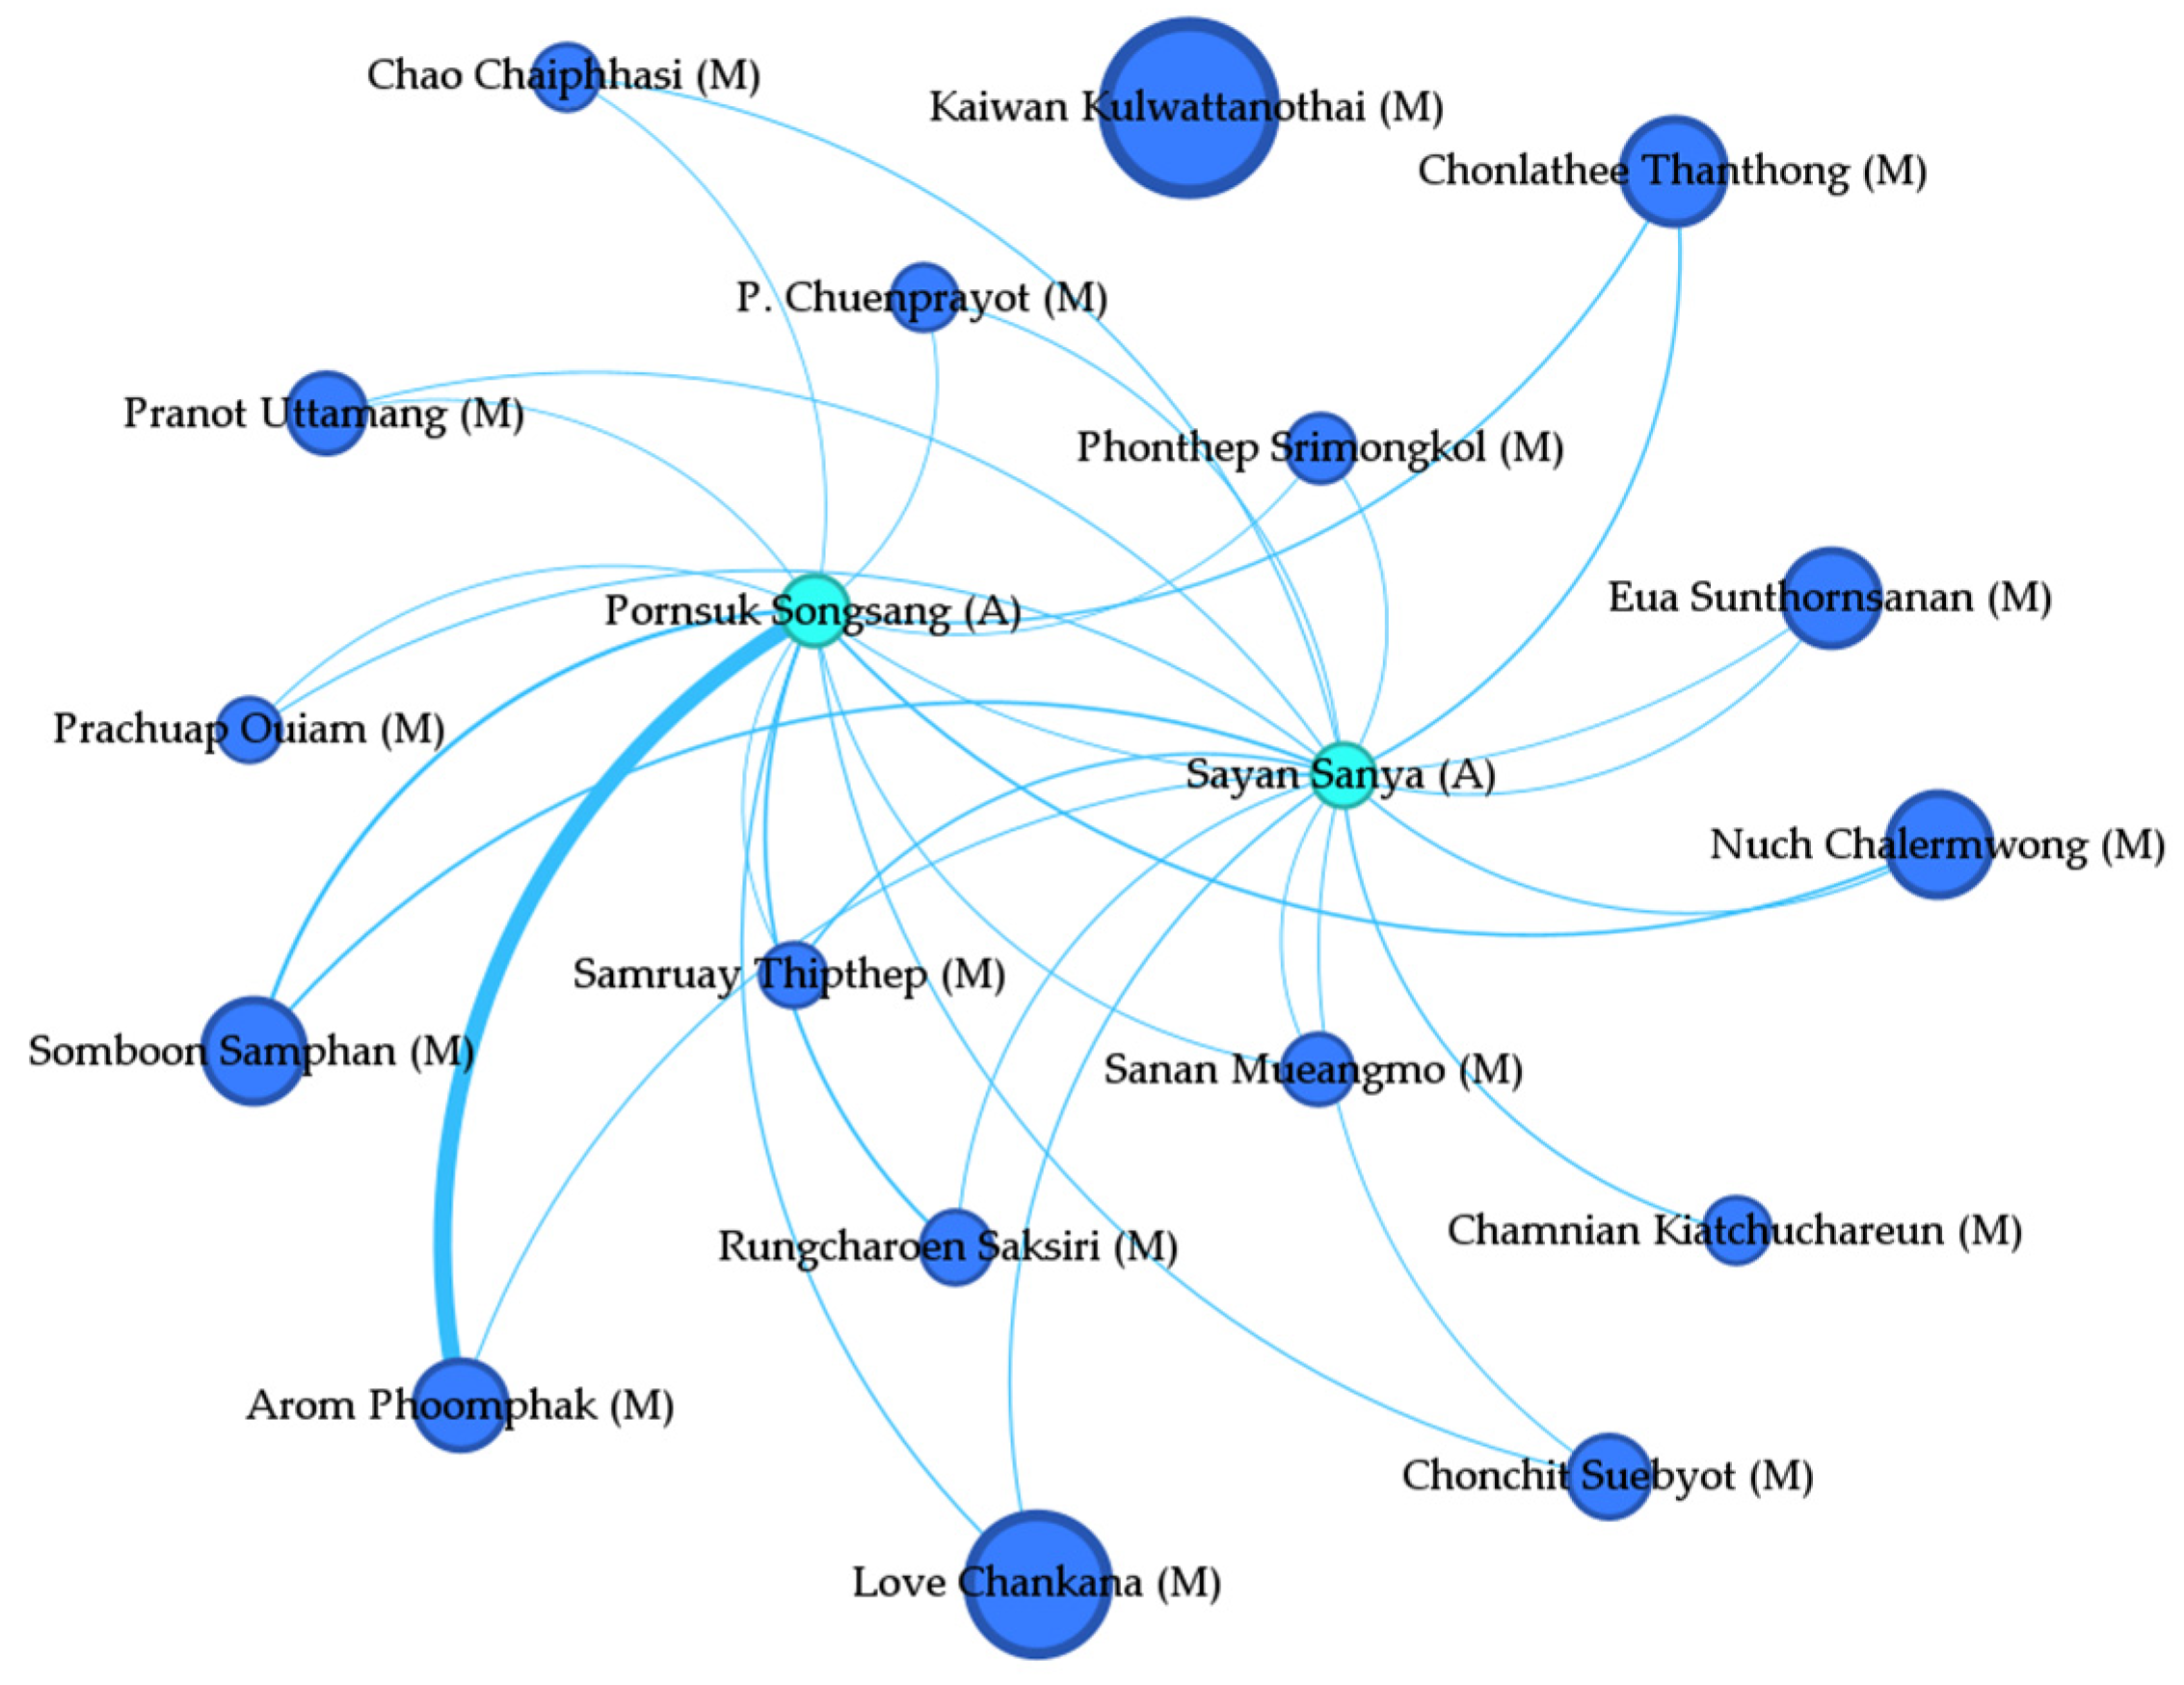
Figure 12.
Network structure between lyric owner and artist (filtered by degree). Yellow nodes are lyric owners, and blue nodes are artists. The node size represents the degree size, comparatively. Nodes displayed in the figure are filtered based on a degree greater than 200. This criterion is the highest value that effectively reveals the bipartite network of collaboration between artists and lyric owners. There is a concentration of large-sized nodes, indicating that only a few nodes have a significantly high degree. The symbol “(L)” after the names denotes individuals who are lyric owners, while “(A)” identifies those who are artists.
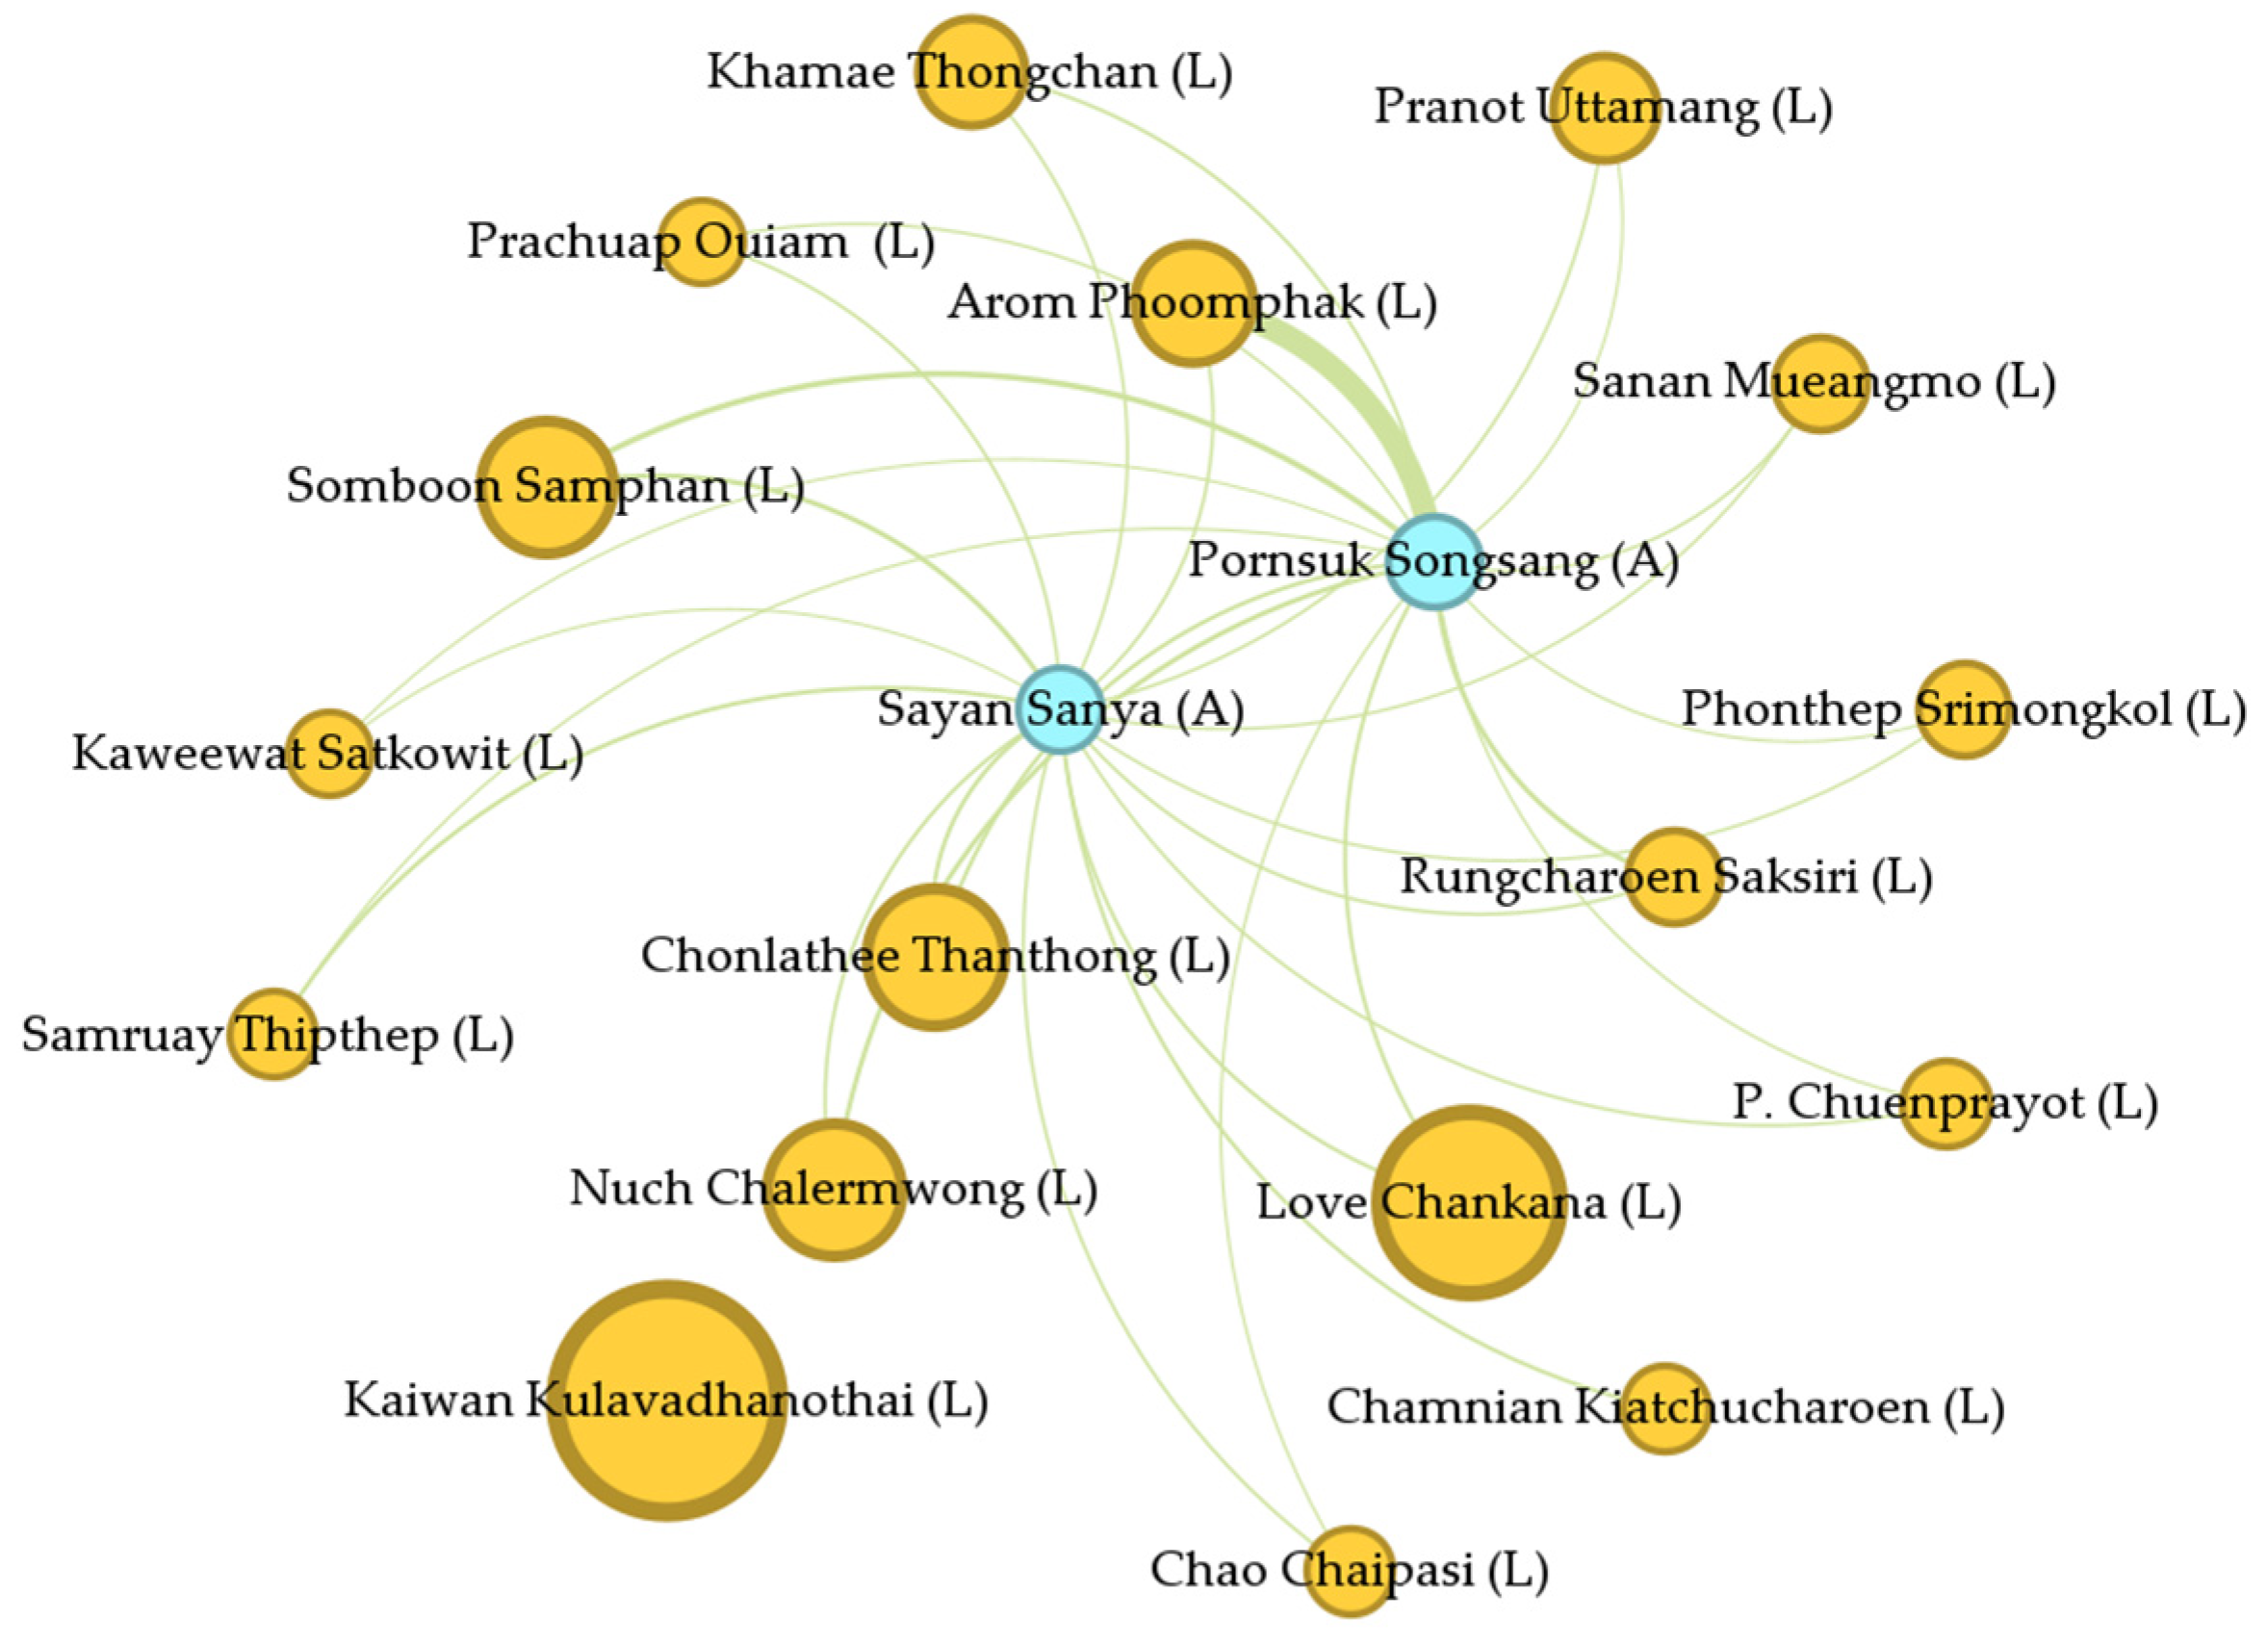
Figure 13.
Linearized long-tail network of recording owners and artists by degree.
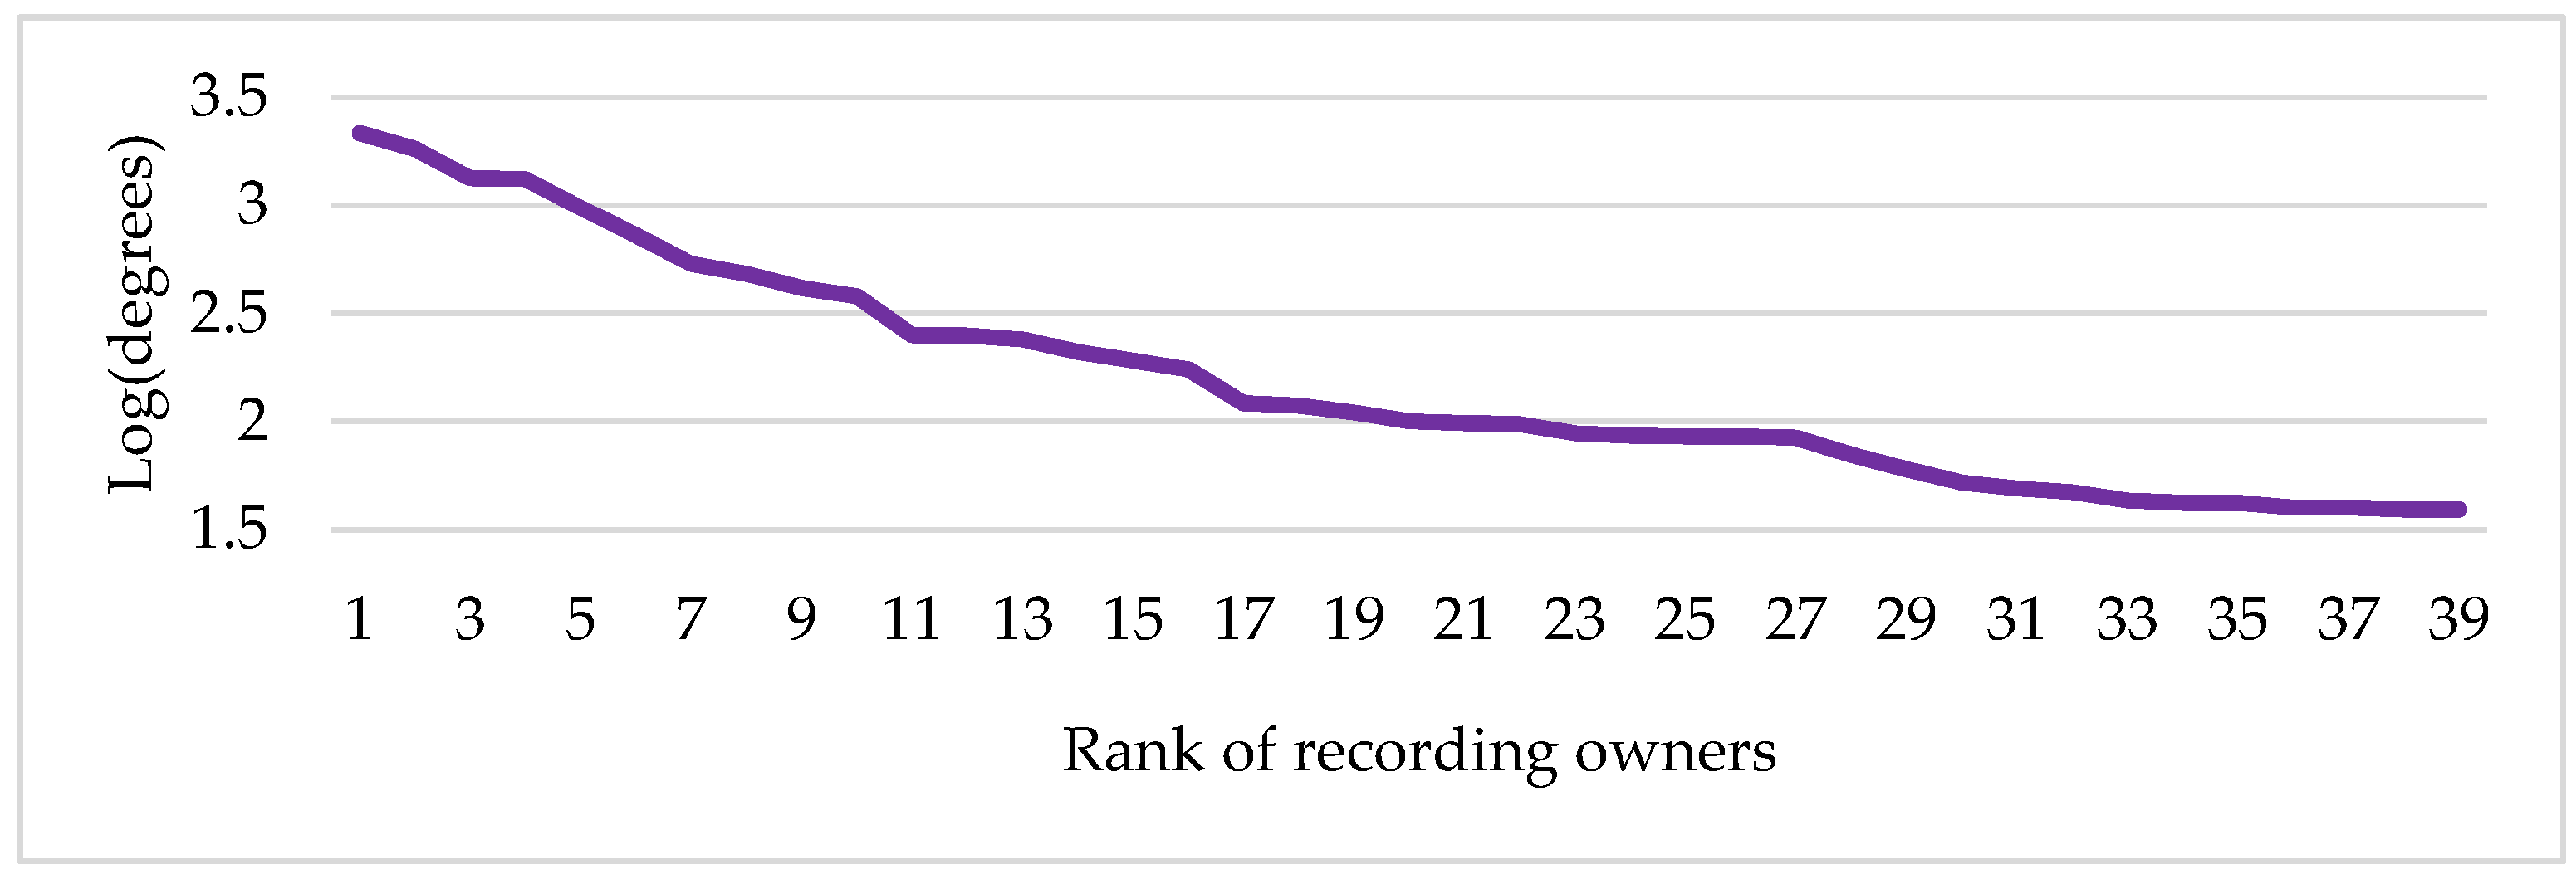
Figure 14.
Linearized long-tail network of music owners and artists by degree.
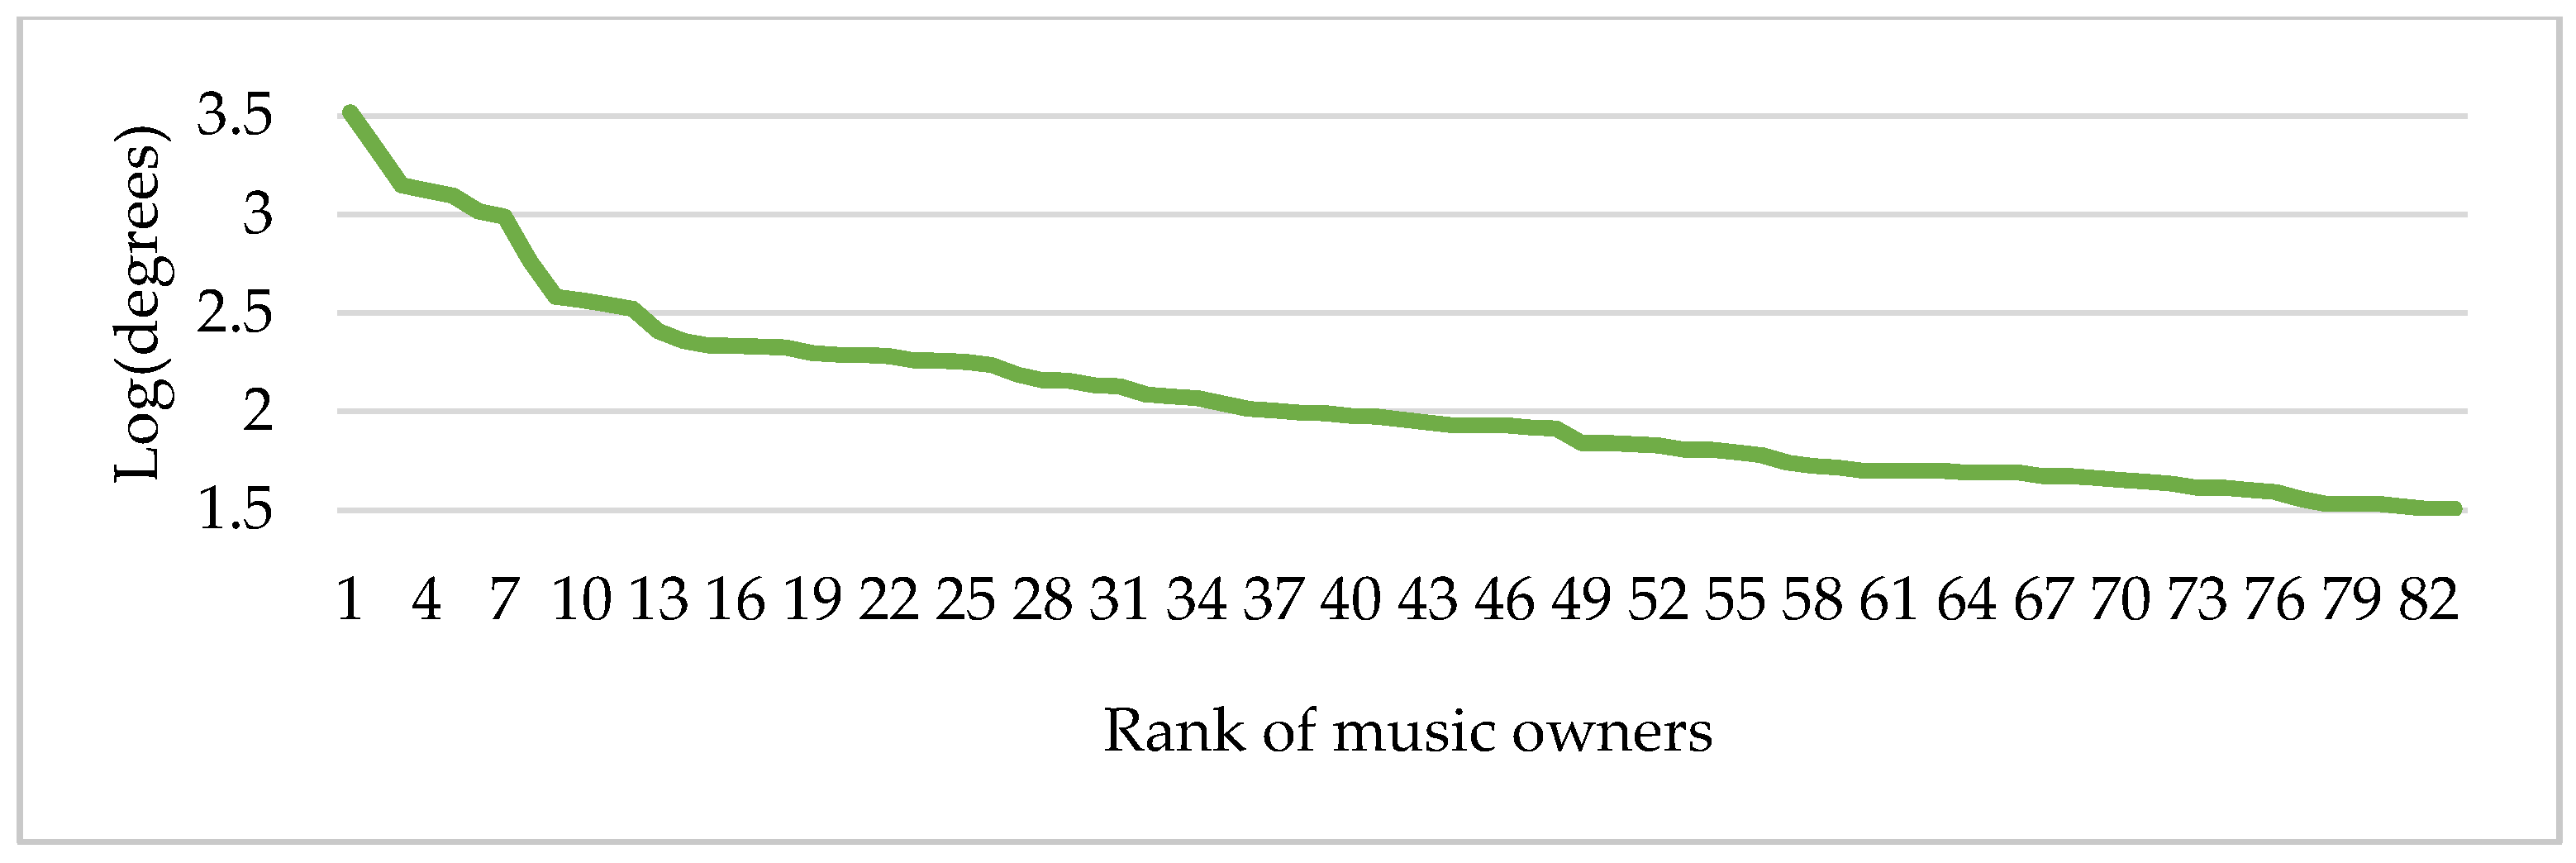
Figure 15.
Linearized long-tail network of melody owners and artists by degree.

Figure 16.
Linearized long-tail network of lyric owners and artists by degree.


Table 1.
The number of music creators in each role in the Thai music industry.
| Creator Category | Number |
|---|---|
| Recording owner | 101 |
| Music owner | 364 |
| Melody owner | 7584 |
| Lyric owner | 7969 |
| Artist | 8078 |
Table 2.
Power law coefficients for music creators in Thailand.
| Recording Owner–Artist | Music Owner–Artist | Melody Owner–Artist | Lyric Owner–Artist | |
|---|---|---|---|---|
| Constant | 4.3616 *** (0.0107) | 4.6112 *** (0.0101) | 4.7365 *** (0.0084) | 4.7087 *** (0.0082) |
| 1.1903 *** (0.0032) | 1.2266 *** (0.0029) | 1.18 *** (0.0023) | 1.1748 *** (0.0022) | |
| R-Squared | 0.9595 | 0.9597 | 0.9543 | 0.9554 |
| N | 5883 | 7445 | 13,146 | 13,238 |
Notes: Standard error in parentheses; *** p < 0.001.
Table 3.
Network analysis of the bipartite network for music creators in the Thai music industry.
| Recording Owner–Artist | Music Owner–Artist | Melody Owner–Artist | Lyric Owner–Artist | |
|---|---|---|---|---|
| Nodes | 5883 | 7444 | 13,146 | 13,238 |
| Edges | 13,659 | 21,391 | 39,533 | 39,607 |
| Average Degree | 4.644 | 5.747 | 6.014 | 5.984 |
| Average Weighted Degree | 12.119 | 12.625 | 7.824 | 7.771 |
| Network Diameter | 7 | 8 | 13 | 12 |
| Connected Components | 1 | 6 | 457 | 508 |
| Modularity | 0.477 | 0.395 | 0.452 | 0.454 |
| Average Path Length | 3.344 | 3.251 | 4.593 | 4.573 |
Table 4.
Centrality analysis between recording owner and artist.
| Degree | Betweenness | PageRank | Eigencentrality | ||||||||
|---|---|---|---|---|---|---|---|---|---|---|---|
| Name | Creator Category | Degree | Name | Creator Category | Betweenness | Name | Creator Category | PageRank | Name | Creator Category | Eigencentrality |
| GMM | Recording owner | 2161 | GMM | Recording owner | 6,930,064 | GMM | Recording owner | 0.0861 | GMM | Recording owner | 1.0000 |
| RS | Recording owner | 1829 | RS | Recording owner | 5,153,199 | RS | Recording owner | 0.0658 | RS | Recording owner | 0.9011 |
| Jamrak Aueareenusorn | Recording owner | 1332 | Jamrak Aueareenusorn | Recording owner | 2,740,970 | Jamrak Aueareenusorn | Recording owner | 0.0416 | Krung Thai | Recording owner | 0.7268 |
| Krung Thai | Recording owner | 1325 | Krung Thai | Recording owner | 2,627,892 | Krung Thai | Recording owner | 0.0410 | Jamrak Aueareenusorn | Recording owner | 0.7225 |
| Sound of Siam Record Tape | Recording owner | 975 | Sound of Siam Record Tape | Recording owner | 1,639,873 | Sound of Siam Record Tape | Recording owner | 0.0293 | Sound of Siam Record Tape | Recording owner | 0.5476 |
| Music Train | Recording owner | 727 | Sony Music Entertainment | Recording owner | 1,510,457 | Music Train | Recording owner | 0.0226 | Music Train | Recording owner | 0.4027 |
| Sony Music Entertainment | Recording owner | 537 | Music Train | Recording owner | 1,262,719 | Sony Music Entertainment | Recording owner | 0.0207 | Rose Media | Recording owner | 0.2952 |
| Rose Media | Recording owner | 482 | Warner Music Thailand | Recording owner | 1,223,269 | Warner Music Thailand | Recording owner | 0.0167 | Sony Music Entertainment | Recording owner | 0.2262 |
| Warner Music Thailand | Recording owner | 415 | Spicy Disk | Recording owner | 706,442 | Rose Media | Recording owner | 0.0138 | Top Line | Recording owner | 0.2254 |
| Top Line | Recording owner | 380 | Rose Media | Recording owner | 564,638 | Top Line | Recording owner | 0.0110 | Chaiwut Truktrong | Recording owner | 0.1635 |
Table 5.
Centrality analysis between music owner and artist.
| Degree | Betweenness | PageRank | Eigencentrality | ||||||||
|---|---|---|---|---|---|---|---|---|---|---|---|
| Name | Creator Category | Degree | Name | Creator Category | Betweenness | Name | Creator Category | PageRank | Name | Creator Category | Eigencentrality |
| Music Copyright (Thailand) | Music owner | 3295 | Music Copyright (Thailand) | Music owner | 13,342,482 | Music Copyright (Thailand) | Music owner | 0.0911 | Music Copyright (Thailand) | Music owner | 1.0000 |
| GMM | Music owner | 2161 | GMM | Music owner | 8,061,172 | GMM | Music owner | 0.0565 | GMM | Music owner | 0.6412 |
| RS | Music owner | 1408 | RS | Music owner | 4,047,106 | RS | Music owner | 0.0318 | Prasert Wangsantiporn | Music owner | 0.4865 |
| Prasert Wangsantiporn | Music owner | 1322 | Prasert Wangsantiporn | Music owner | 2,632,669 | Prasert Wangsantiporn | Music owner | 0.0254 | Jamrak Aueareenusorn | Music owner | 0.4595 |
| Jamrak Aueareenusorn | Music owner | 1250 | Jamrak Aueareenusorn | Music owner | 2,430,279 | Jamrak Aueareenusorn | Music owner | 0.0237 | RS | Music owner | 0.4586 |
| Sound of Siam Record Tape | Music owner | 975 | Sound of Siam Record Tape | Music owner | 1,638,525 | Sound of Siam Record Tape | Music owner | 0.0181 | Sound of Siam Record Tape | Music owner | 0.3691 |
| Music Train | Music owner | 578 | Music Train | Music owner | 975,408 | Music Train | Music owner | 0.0110 | Music Train | Music owner | 0.2189 |
| Chonlathee Thanthong | Music owner | 382 | BEC World | Music owner | 505,057 | Chonlathee Thanthong | Music owner | 0.0064 | Chonlathee Thanthong | Music owner | 0.1683 |
| Nuch Chalermchai | Music owner | 368 | Top Line | Music owner | 400,338 | Nuch Chalermchai | Music owner | 0.0062 | Nuch Chalermchai | Music owner | 0.1619 |
| Somboon Samphan | Music owner | 350 | Spicy Disk | Music owner | 382,038 | Top Line | Music owner | 0.0060 | Somboon Samphan | Music owner | 0.1557 |
Table 6.
Centrality analysis between melody owner and artist.
| Degree | Betweenness | PageRank | Eigencentrality | ||||||||
|---|---|---|---|---|---|---|---|---|---|---|---|
| Name | Creator Category | Degree | Name | Creator Category | Betweenness | Name | Creator Category | PageRank | Name | Creator Category | Eigencentrality |
| Kaiwan Kulwattanothai | Melody owner | 660 | Kaiwan Kulwattanothai | Melody owner | 8,084,163 | Kaiwan Kulwattanothai | Melody owner | 0.0215 | Chongrak Chankana | Melody owner | 1.0000 |
| Chongrak Chankana | Melody owner | 531 | Chongrak Chankana | Melody owner | 5,935,932 | Chongrak Chankana | Melody owner | 0.0051 | Chonlathee Thanthong | Melody owner | 0.8683 |
| Chonlathee Thanthong | Melody owner | 382 | Various Artists | Artist | 5,323,015 | Chonlathee Thanthong | Melody owner | 0.0033 | Somboon Samphan | Melody owner | 0.8408 |
| Nuch Chalermwong | Melody owner | 370 | Chonlathee Thanthong | Melody owner | 3,027,078 | Nuch Chalermwong | Melody owner | 0.0032 | Nuch Chalermwong | Melody owner | 0.8254 |
| Somboon Samphan | Melody owner | 367 | Nuch Chalermwong | Melody owner | 2,931,463 | Somboon Samphan | Melody owner | 0.0032 | Eua Sunthornsanan | Melody owner | 0.7325 |
| Eua Sunthornsanan | Melody owner | 345 | Somboon Samphan | Melody owner | 2,787,324 | Eua Sunthornsanan | Melody owner | 0.0031 | Arom Phoomphak | Melody owner | 0.6927 |
| Arom Phoomphak | Melody owner | 318 | Eua Sunthornsanan | Melody owner | 2,447,194 | PIERANTON | Melody owner | 0.0029 | Khamae Thongchan | Melody owner | 0.6646 |
| Khamae Thongchan | Melody owner | 279 | Bird Thongchai | Artist | 2,322,493 | Arom Phoomphak | Melody owner | 0.0028 | Pornsuk Songsang | Artist | 0.6645 |
| Pranot Uttamang | Melody owner | 272 | Arom Phoomphak | Melody owner | 2,154,826 | Khamae Thongchan | Melody owner | 0.0024 | Sayan Sanya | Artist | 0.6535 |
| Rungcharoen Serek | Melody owner | 236 | Pranot Uttamang | Melody owner | 2,020,457 | Pranot Uttamang | Melody owner | 0.0024 | Pranot Uttamang | Melody owner | 0.6279 |
Table 7.
Centrality analysis between lyric owner and artist.
| Degree | Betweenness | PageRank | Eigencentrality | ||||||||
|---|---|---|---|---|---|---|---|---|---|---|---|
| Name | Creator Category | Degree | Name | Creator Category | Betweenness | Name | Creator Category | PageRank | Name | Creator Category | Eigencentrality |
| Kaiwan Kulavadhanothai | Lyric owner | 659 | Kaiwan Kulavadhanothai | Lyric owner | 7,716,845 | Kaiwan Kulavadhanothai | Lyric owner | 0.0215 | Chongrak Chankana | Lyric owner | 1.0000 |
| Chongrak Chankana | Lyric owner | 531 | Chongrak Chankana | Lyric owner | 5,676,886 | Chongrak Chankana | Lyric owner | 0.0050 | Chonlathee Thanthong | Lyric owner | 0.8645 |
| Chonlathee Thanthong | Lyric owner | 382 | Various Artists | Artist | 5,117,055 | Chonlathee Thanthong | Lyric owner | 0.0033 | Somboon Samphan | Lyric owner | 0.8372 |
| Nuch Chalermwong | Lyric owner | 370 | Chonlathee Thanthong | Lyric owner | 3,053,777 | Nuch Chalermwong | Lyric owner | 0.0032 | Nuch Chalermwong | Lyric owner | 0.8231 |
| Somboon Samphan | Lyric owner | 366 | Nuch Chalermwong | Lyric owner | 2,953,369 | Somboon Samphan | Lyric owner | 0.0032 | Arom Phoomphak | Lyric owner | 0.6895 |
| Arom Phoomphak | Lyric owner | 318 | Somboon Samphan | Lyric owner | 2,812,346 | Arom Phoomphak | Lyric owner | 0.0028 | Khamae Thongchan | Lyric owner | 0.6649 |
| Khamae Thongchan | Lyric owner | 279 | Arom Phoomphak | Lyric owner | 2,088,924 | PIERANTON | Lyric owner | 0.0027 | Pornsuk Songsang | Artist | 0.6613 |
| Pranot Uttamang | Lyric owner | 272 | Bird Thongchai | Artist | 2,078,997 | Khamae Thongchan | Lyric owner | 0.0024 | Sayan Sanya | Artist | 0.6500 |
| Rungcharoen Serksiri | Lyric owner | 236 | Pranot Uttamang | Lyric owner | 1,965,217 | Pranot Uttamang | Lyric owner | 0.0024 | Pranot Uttamang | Lyric owner | 0.6271 |
| Sanan Muengmo | Lyric owner | 235 | Khamae Thongchan | Lyric owner | 1,933,807 | Pornthep Srimongkon | Lyric owner | 0.0021 | Mike Phiromphon | Artist | 0.6250 |
Table 8.
Watts–Strogatz statistics for music creators.
| Recording owner | 2.6722 | 1.0383 | 2.5737 |
| Music owner | 3.0091 | 1.0339 | 2.9106 |
| Melody owner | 17.5455 | 1.2254 | 14.3177 |
| Lyric owner | 19.8289 | 1.1875 | 16.6987 |
Table 9.
Summary of empirical test results.
| Test | Result |
|---|---|
| The power law distribution (Easley–Kleinberg model) | Statistically confirmed |
| Social network analysis: Centrality indices | Networks were dominated by a small group of entities |
| Social network analysis: The small-world pattern (Watts–Strogatz model) | Statistically confirmed |
Disclaimer/Publisher’s Note: The statements, opinions and data contained in all publications are solely those of the individual author(s) and contributor(s) and not of MDPI and/or the editor(s). MDPI and/or the editor(s) disclaim responsibility for any injury to people or property resulting from any ideas, methods, instructions or products referred to in the content. |
© 2024 by the authors. Licensee MDPI, Basel, Switzerland. This article is an open access article distributed under the terms and conditions of the Creative Commons Attribution (CC BY) license (https://creativecommons.org/licenses/by/4.0/).
Share and Cite
MDPI and ACS Style
Peechapat, W.; Puttanapong, N. Collaboration and Competition: A Social Network Analysis of Thailand’s Music Industry. Economies 2024, 12, 45. https://doi.org/10.3390/economies12020045
AMA Style
Peechapat W, Puttanapong N. Collaboration and Competition: A Social Network Analysis of Thailand’s Music Industry. Economies. 2024; 12(2):45. https://doi.org/10.3390/economies12020045
Chicago/Turabian StylePeechapat, Wichaya, and Nattapong Puttanapong. 2024. "Collaboration and Competition: A Social Network Analysis of Thailand’s Music Industry" Economies 12, no. 2: 45. https://doi.org/10.3390/economies12020045
Note that from the first issue of 2016, this journal uses article numbers instead of page numbers. See further details here.