
Critical Overview of Visual Tracking with Kernel Correlation Filter


Networked Robotics and Sensing Laboratory, School of Engineering Science, Simon Fraser University, Burnaby, BC V5C 0L2, Canada
*
Author to whom correspondence should be addressed.
Technologies 2021, 9(4), 93; https://doi.org/10.3390/technologies9040093
Submission received: 13 October 2021
/
Revised: 12 November 2021
/
Accepted: 13 November 2021
/
Published: 30 November 2021
(This article belongs to the Section Information and Communication Technologies)
Abstract
:With the development of new methodologies for faster training on datasets, there is a need to provide an in-depth explanation of the workings of such methods. This paper attempts to provide an understanding for one such correlation filter-based tracking technology, Kernelized Correlation Filter (KCF), which uses implicit properties of tracked images (circulant matrices) for training and tracking in real-time. It is unlike deep learning, which is data intensive. KCF uses implicit dynamic properties of the scene and movements of image patches to form an efficient representation based on the circulant structure for further processing, using properties such as diagonalizing in the Fourier domain. The computational efficiency of KCF, which makes it ideal for low-power heterogeneous computational processing technologies, lies in its ability to compute data in high-dimensional feature space without explicitly invoking the computation on this space. Despite its strong practical potential in visual tracking, there is a need for an in-depth critical understanding of the method and its performance, which this paper aims to provide. Here we present a survey of KCF and its method along with an experimental study that highlights its novel approach and some of the future challenges associated with this method through observations on standard performance metrics in an effort to make the algorithm easy to investigate. It further compares the method against the current public benchmarks such as SOTA on OTB-50, VOT-2015, and VOT-2019. We observe that KCF is a simple-to-understand tracking algorithm that does well on popular benchmarks and has potential for further improvement. The paper aims to provide researchers a base for understanding and comparing KCF with other tracking technologies to explore the possibility of an improved KCF tracker.
1. Introduction
Visual tracking can be considered as finding the minimum distance in feature space between the current position of the tracked object to the subspace represented by the previously stored data or previous tracking results. Visual tracking systems have, for a long time, employed hand-crafted similarity metrics for this purpose, such as the Euclidean distance [1], Matusita metric [2], Bhattacharyya coefficient [3], and Kullback–Leibler [4] and information-theoretic divergences [5].
Visual tracking has seen tremendous progress in recent years in robotics and monitoring applications. It aims to address the issues caused by noise, clutter, occlusion, illumination changes, and viewpoints (e.g., in mobile or aerial robotics). There have been numerous attempts to design and deploy a robust tracking method; however, the work continues. Since the seminal work of Bolme et al. [6], correlation-based filters have enjoyed immense popularity in the tracking community. Recent developments in Correlation Filter Trackers (CFTs) [7] have accelerated the development of visual object tracking. Despite their impressive performance, these discriminative learning tracking systems, for example CFTs, still have several limitations. Firstly, they tend to drift while tracking over a long period of time. This drift can be more closely observed in a dynamic environment and while tracking multiple targets, thereby affecting its accuracy. Secondly, in such discriminative learning methods, negative samples of the image are equally as important as the positive samples. In fact, training with a higher number of negative samples (image patches from different locations and scales) has been found to be highly advantageous to better training of any tracking algorithm. However, any increase in the samples can lead to a higher computational burden, which can adversely affect the time-sensitive nature of trackers. Along a similar line, limiting the samples, however, can sacrifice performance, which is a tradeoff.
Kernelized Correlation Filter (KCF) [8] addresses this issue of handling thousands of samples of data while keeping the computation load low by exploring tools of the kernel trick and, most importantly, properties of circulant matrices. Circulant matrices also allow us to enrich the toolset provided by classical signal processing like that of correlation filters, by working in the Fourier domain, making the training process faster.
Despite the increased efficiency brought by KCF, the current number and variety of datasets that can be used for real-time performance studies are inadequate. In the past, most experiments conducted on available state-of-the-art trackers (TDAM [9], MDP [10], DP-NMS [11], and NOMT [12]), were carried out on sample videos. This observation is sometimes very significant since it is obvious that for real-life robotic monitoring and surveillance, and due to various factors such as environmental changes, the tracking accuracy depicted by online trackers may not reflect real-time scenarios. The limitations include using their validations only on a few datasets (example videos) or shorter-length videos. To cover for the lack of needed datasets for given scenarios, we collected our own dataset in real time using the Microsoft Kinect sensor. This dataset reflects real-time scenarios in different settings. We refer readers to a comprehensive review of visual tracking using datasets in [13,14,15] and specifically using the correlation filter with the kernel trick in [7].
In this paper, we study some of the key components that contribute to the design of KCF, a detailed overview on its working principles, and its performance under various challenging scenarios such as variation in illumination, appearance, change due to viewpoints, occlusions, speed of the subject (slow, medium, or fast), type of crowd (tracking a single target with no crowd and tracking a single target with a crowd of 10–15 people), the position of the camera, etc. We chose these factors while keeping in mind that these are some of the most challenging factors the field of visual tracking has been facing. The experiments are performed using the RGB-D sensor in a live, open environment to ensure real-time scenarios. The environment chosen is the public hallway of a university with students as subjects to replicate the real-time scenario. Moreover, the duration of tracking time varies from 10 s to 2–4 min in order to allow enough time to observe the performance of the tracker. These factors ensure that we have worked in various scenarios in order to make the surrounding environment as diverse as possible. We also compared the performance of KCF with other state-of-the-art trackers evaluated on OTB-50, VOT 2015, and VOT 2019.
The remainder of the paper is organized as follows: Section 2 of the paper gives a general overview of the KCF tracker and its key practical properties, followed by Section 3, which goes through a key analytical description of the method; Section 4 shows the KCF pipeline and details the dataset used. Section 5 presents the results of our experimental studies using various scenarios and measures in terms of precision curves and other metrics. Section 6 discusses the performance comparison of KCF with other state-of-the-art trackers evaluated on OTB-50, VOT 2015, and VOT 2019. Finally, the paper presents concluding remarks in Section 7.
2. An Overview of KCF
There are few recent works that have surveyed correlation filter tracking techniques. The most recent work is [16], which focuses on the background and current advancement of correlation filter-based algorithms in object tracking. Chen et al. [7] provide a detailed survey of recent development and improvements in CFTs and summarize their general framework. Similarly, the work also discusses the correlation tracking methodology and experiments on standard datasets. We also highlight various challenging scenarios that affect tracking performance. However, this paper differs from others whereby none of the surveys mentioned above provide such an in-depth explanation of the workings of the tracker.
KCF uses a large number of (all the possible) translations of an image patch (window size of the Region of Interest i.e., ROI in the entire image). These image patches can be extracted by providing the dimensions of the window size to the image at the time of computation. KCF uses these patches and its extracted features (raw image pixels or Histogram of Gradient i.e., HOG) as data to detect the location of the target in the subsequent frame of the image. This detection at subsequent frames can eventually be stored and used to track the target over time. It is to be noted that there is a good rationale behind using this large amount of stored data in KCF. These data are relevant for any learning algorithm because they represent various ways in which the samples (here features) can be encountered by the learning algorithm, thus making the algorithm more robust. However, if not used efficiently, these data (high-dimensional features) can also become a bottleneck in the case of real-time processing. If we can, somehow, represent the high-dimensional feature space in a form that captures the translational properties of the object between the frame and still accomplish learning using a linear model (using an algorithmic trick that will be discussed later), we can reduce the computation significantly. A linear model is preferred because it gives us a simpler linear discrimination relationship between the classes in the feature space and any independent and associated dependent variable. The above-mentioned methods also bring the certain advantage of element-wise multiplication in the Fourier domain and their resemblance to fast correlation filters, making computation faster.
3. Mathematical Exposition of KCF
KCF is based on the discriminative method, which formulates the tracking problem as a binary classification task and distinguishes the target from the background by using a discriminative classifier [17]. Any modern framework in addressing recognition and classification problems in the field of computer vision is usually supported by a learning algorithm. The objective is to find a function that can classify through learning from a given set of examples. It should be able to classify an unseen data representation of an image patch from an arbitrary distribution within a certain error bound. One such linear discriminator is the Linear Ridge Regression (LRR). Mathematically, it is defined as:
where is the input sampled variable (here image feature), is the weight vector, is the true value/ground truth (obtained by observation or measurement), is the squared error between the actual and predicted variable, and is a squared norm regularizer with as the regularizer to prevent overfitting. In simple words, in determining the weight vector w for minimizing the square of the model error , it is bound to a certain limit with the help of a regularizer . For a better understanding of the mathematical representations, the authors feel the need to make certain clarifications in the representations. and will be used as independent variables. The transpose of will be defined as . The authors will use bold fonts in a variable to represent vectors. For example, represents a concatenated vector with each element/entry in the vector represented as i.e., in the space of all integers ().
Traditionally, for learning, research has been focused on utilizing positive samples (samples that are similar to the target object); however, negative samples (samples that do not resemble the target object) have been found to be equally important in discriminative learning. Hence, the higher the number of negative samples, the better the discriminative power of the learning algorithm. If we can use a higher number of features (and as a result, more negative samples), it will be beneficial for the learning algorithm. For instance, though raw pixels of an image are good features in themselves, using features such as HOG can be advantageous because of the larger number of data (features). Though effective in helping with improved accuracy, the availability of a large number of samples can create a bottleneck in terms of complexity and speed.
The Kernelized Correlation Filter tracker attempts to use a large number (high-dimensional data) of negative samples, but with reduced complexity. It achieves this using (a) the dual space for learning high-dimensional data using the kernels trick and (b) the property of diagonalizing the circulant matrix in the Fourier domain. These factors make the tracking algorithm computationally inexpensive and faster, respectively. We will discuss the concept of the circulant matrix, the kernel trick, and the Fourier domain in more detail in upcoming sections.
The KCF algorithm exploits this circulant structure in the learning algorithm in using a sample 2D image patch of the target and generating additional samples (using all the possible translations of it, leading to a circulant structure). This results in several virtual negative samples, which can be used in the learning stage to make our discriminative classifier efficient. For example, in 2D images, we obtain circulant blocks using a similar concept of circulant blocks. Let us assume we have a 2D image represented as a data matrix in the following form:
where represents the image features. Now, construct a matrix that has four rows of denoted by as below:
where defines a function that can generate circulant values of the input. More specifically, we can write it as:
We can now construct a circulant matrix as:
This structure of X is called the Block-Circulant Circulant Matrix (BCCM), i.e., a matrix that is circulant at the block level, composed of blocks that are circulant themselves. Visualization of a BCCM on a sample 2D image patch of the target taken from a Kinect RGB camera can be seen in Figure 1. Similar visualization can be performed on features, such as HOG features, of the target image patch we used in our visual tracking experiment, as shown in Figure 2.
Since we know that (a) a large amount of data is beneficial for our learning algorithm and (b) translating samples in a circulant manner creates a circulant structure of a large amount of data, we can generate and exploit the circulant nature of HOG features for a visual tracking advantage. Hence, we can now define as very high-dimensional data that represent all possible translations of the base sample HOG features (in the case of a 1D image) or base patch HOG features (in the case of a 2D image). Such a data matrix (with shifted translations) is relevant for a learning algorithm because it represents various ways (distribution of inputs) in which the samples can be encountered by the learning algorithm.
Now, with features in hand, we can use our learning algorithm (e.g., linear ridge regression (LRR from Equation (1)). The goal of the objective function is to find a weight that will help in classifying the data. Mathematically, the optimal solution of LRR is given by:
where is a data matrix (also called the design matrix). In our case, the data matrix is the circulant matrix. It can be observed from Equation (6) that we need to take the inverse of , which is an matrix. In most cases, i.e., the feature space is very large, making the computation very expensive. This problem can be addressed by solving the Linear Ridge Regression in dual space [18] as explained in Appendix A. Mathematically, the dual solution for the Linear Ridge Regression can be written as:
where is a vector of coefficients that defines the solution. Here, is called the Gram Matrix. The Gram Matrix will be helpful later. In general, for any two pair of samples , the Gram Matrix can be written as:
Hence, for of size where is the number of examples (samples) and is the number of features, dual space allows us to compute the inverse of dimensional data, unlike the in previous case. It is advantageous in scenarios where .
In the linear learning model (i.e., dual LLR), the objective is to find a hyperplane that can linearly separate our training data. However, there is an issue. Our preferred feature space i.e., HOG is non-linear in nature. One way to resolve this issue is to investigate some non-linear hyperplane pattern classifiers (i.e., higher-order surfaces). This is not a practical approach in comparison with a simple linear one. There are a number of such transformation techniques, such as the powerful kernel trick [19] and their efficient applications in correlation filter-based tracking [18,20]. By applying the kernel trick in a non-linear feature space, we would be able to conduct the computation in the non-linear feature space without explicitly instantiating a vector in the space.
In many cases, the non-linear data points can be linearly separable if we can map the original data points to some other feature space using a transformation, say . Hence, it is expected that, in this new feature space, the points will be linearly separable. Hence, for any two training data points , if we can somehow find a function (called kernel function), it can map non-linear data to a higher-dimensional feature space such that:
where is the dot product. The data in the new feature space are now linearly separable. The functions that make these transformations are called kernel functions.
A kernel function helps us evaluate the dot product in the lower-dimensional original data space without having to transform it to the higher dimensional feature space. In this process, we can benefit from the linearity in the transformed high-dimensional (mapped with ) feature space. This is called the kernel trick. There are various types of kernels such as linear kernels, polynomial kernels, and gaussian kernels. Understanding the kernel trick will help us better understand its applications in the KCF tracker. For our explanation, we will stick with Gaussian kernels because of their ability to transform data into an infinite feature space.
If we can map our current non-linear features to a high-dimension feature space using the kernel function , we can now use standard machine-learning techniques, such as linear ridge regression. For simplicity in explanations, let our original data points be denoted by . We will call this space the input space. Let us assume that for some kernel function , we can transform our data points from the input space to a higher-dimensional feature space with the data i.e.,
such that . Hence, we can define a solution for the dual case using the kernel function as:
where . Here, is called the Kernel matrix (equivalent to the Gram Matrix ). is the circulant for the kernel, like in Gaussian kernels. We keep stating high-dimensional feature space brought by yet we have not stated what these features are. For Gaussian kernels, we can obtain the explicit features using the Taylor expansion [21] of these Gaussian kernel functions as follows:
where and enumerate over all selections of co-ordinates of . Now, in KCF, the learned function for some sample is given by:
To calculate this learned function, we need the value of . It can be computed using the relation between the Circulant Matrix (readers are suggested to refer to Equations (2) to (5) for details of the Circulant Matrix) and sample [8] such that:
where is the inverse transform of , is the Fourier transform, and is the inverse Fourier transform. Using Equations (14) and (11), it is possible to diagonalize (the concept is similar in the linear case) and obtain:
From the right-hand side of the above equation, we can see that multiple computations are taking place in the higher-dimensional space. However, these computations can be made very fast if we can somehow make the computations a simple dot product i.e., using Discrete Fourier transform. Taking DFT on both sides,
where is the first row of the kernel matrix and a hat denotes DFT of a vector, can be computed and taken as the inverse Fourier transform of .
From Equation (13), using kernelized Ridge Regression, we can finally evaluate , which represents the learned function on several image locations i.e., for several cyclic patches such as:
where
Hence, we only need the first row of the Kernel matrix for our computation. This is one of the main components that can offer much lower computation compared to or computation in the original input feature space of the data matrix In addition, from Equation (16), we have , the full detection response i.e., a vector containing the output for all cyclic shifts of . Equation (16) can be computed more efficiently by diagonalizing it to obtain:
where represents the dot product. This increase in computation speed is due to the element-wise multiplication in the Fourier Domain and also the computation in high-dimensional data using the kernel trick. Once we are able to locate the target in a subsequent frame, we can use the prior knowledge of the target at the first frame and the calculated response at the second to track the target. This method can be employed for all subsequent frames. Hence, for any instance in the image, with the current target location and prior memory, the target can be tracked over time. As mentioned before, this type of tracking methodology is called tracking-by-detection and has been used in research time and again. Tracking-by-Detection breaks down the task of tracking into detection-learning and then detection, where tracking and detection complement each other i.e., results provided by the tracker are then used for the algorithm to learn and improve its detection.
4. KCF Tracker Pipeline and Dataset
The dataset used in the evaluation was collected by the author using the Kinect V2 RGB camera. The environment was chosen to replicate the real-time environment for testing the KC tracker. Subjects varied in size, the color of the dress, etc. Figure 3 gives an overview of the sequence of images used in the experiment.
Motivated by the suggested performance of the KCF tracking algorithm, we realize the need to further analyze and study the experimental performance of the tracker under similar conditions also exists. Commonly, such a study is accomplished using standard datasets. However, we realized the tracker performance needs to also be validated in real-time under different challenging possible scenarios. The current standard benchmark does not test it in real-time settings, leading to a major drawback in its validity when used using a real-time setup, e.g., by observing people via a camera in real time under different scenarios. This section builds on this motivation and discusses tracker performance.
Figure 4 shows the CF tracking pipeline in detail. It has the following main components: (a) Pre-processing stage; (b) feature extraction stage; (c) learning stage; and (d) updating stage. A preprocessing step is performed first on every captured frame of the video before it is passed to the tracker.
Scenarios used for the analysis were selected based on the major challenges faced by the visual tracking community. These include scenarios such as (a) normal, (b) background clutter, (c) deformation, (d) occlusion, (e) fast motion, and (f) out-of-view scenes. Figure 5 shows a sample representation of our data. We refer readers to Figure 3 for a complete overview of all scenarios.
A brief description of these scenarios is given below:
Normal: Normal scenarios include no occlusion, deformation, illumination, etc.
Background Clutter: In this scenario, scenes are composed of several familiar objects with similar colors and textures, making it harder to recognize the target by an algorithm.
Deformation: In the case of deformation, the location of the object as a whole or object parts often vary in frames of a video.
Motion: This indicates how fast the target is moving (faster objects cause motion blur).
Out-of-view: Out-of-view is a state when the target, during its observation, moves out of the visible range of the sensor (for example, the camera). This scenario is different from occlusion since in occlusion, the target is still in the visible range of the sensor but is temporarily hidden. However, in out-of-view, the target disappears from the visible range altogether. In such cases, the model loses information of the target, making it harder to re-detect.
Occlusion: One of the most challenging scenarios is occlusion, where the target under observation has their body parts or movements hidden.
Numerous performance measures have been suggested, which have become popular in the visual tracking community. However, none of them have been singled out as a de facto standard. In most cases, standard datasets are used for comparative results. However, since our purpose was to analyze the tracker in a real-time environment, we collected our own dataset using different subjects from different scenarios in order to test the robustness against, for example, occlusions, out-of-view, etc. Table 1 gives a more detailed description of the number of datasets collected for individual scenarios. In total, they averaged approximately 6000 images collected using Kinect V2 and were manually annotated to generate ground truth. Inspired by previous work [22], we determine a general definition for the description of the object state in a dataset of N sequences as:
where denotes a center of the object and denotes the region of the object at any time . Hence, for any particular example and at any particular time , the center can be denoted as:
A subject in any particular tracking algorithm is tested against the ground-truth (the true value of the object location). We define our ground truth annotations as and tracker’s predicted annotation as where are the top-left x co-ordinates, top-left y coordinates, width, and height, respectively, of the subject in question.
5. Results of Performance Analysis Using Experimental Dataset
5.1. Center Error
Center error is one of the oldest measures [23,24] and is still relatively popular. It measures the difference between the target’s predicted center from the tracker and the ground-truth center. Mathematically, it can be calculated using the Bhattacharya method as:
where the center for the ground-truth bounding box can be defined as the predicted bounding box can be defined as . The resulting error can be plotted against the sequence of frames as a graph as can be seen from Figure 6. It requires less annotation effort and hence can be used for quick analysis.
Observation: The plots for the center error for all six scenarios can be seen in Figure 7. We observe that in cases of deformation, occlusion, and out-of-view, the center error was relatively higher as compared to other scenarios, for all datasets. In the case of motion, the center errors are low in the beginning but tend to increase after 40% of the frames have been tracked, indicating it may be more robust for short-term tracking than in the long term. In the case of clutter, one dataset did not perform well, indicating that the tracker may be sensitive to additional factors. The tracker performed best for the general scenario, indicating that given ideal scenarios (no occlusion, clutter, slow speed), KCF works well.
5.2. Intersection of Union
The intersection of Union (IoU) is an evaluation metric used for calculating the match between the ground truth and predictions. In other words, a higher value of IoU implies that the coordinates of the tracked bounding box (prediction) are going to closely match the coordinates of the subject location (ground truth). It is computed using:
IoU can be seen as a metric to measure the accuracy of the tracker. IoU rewards more to the prediction parameters (co-ordinates), which overlap heavily with the ground-truth parameters (coordinates). The results for the IoU for each scenario for all datasets are shown in Figure 8. The values of the y-axis denote IoU where 0 denotes no overlap and 1 denotes 100% overlap. A threshold for 0.5 is set to make a distinction for desired and undesired values of IoU. Any value above the threshold would imply that there is 50% or more overlap between the ground truth and the trackers’ prediction, and hence the tracker is performing well.
Observation: Ignoring the few inconsistent outliers due to datasets, it was generally observed that the tracker performs best in ideal scenarios. It was most unstable in the case of occlusion and out-of-view scenarios. In the case of deformation, the performance was initially better; however, it was degraded as the subject continued to undergo deformation over time. In the case of out-of-view scenarios, the tracker failed abruptly, indicating that once the subject goes out of view of the camera, it is never recovered.
5.3. Precision Curve
Precision is another evaluation metric that provides information about what proportion of positive identifications was actually correct. Formally, it is defined as:
where True Positive (TP) is an outcome where the algorithm correctly predicts the positive class i.e., in our case, the algorithm correctly predicts the subjects where the subject exists. On the contrary, False Positive (FP) in an outcome where the model/algorithm incorrectly predicts the positive class i.e., the algorithm predicts the subject where it does not exist. Hence, the higher the precision, the better the prediction. In general practice, a precision value below a certain threshold is not desired.
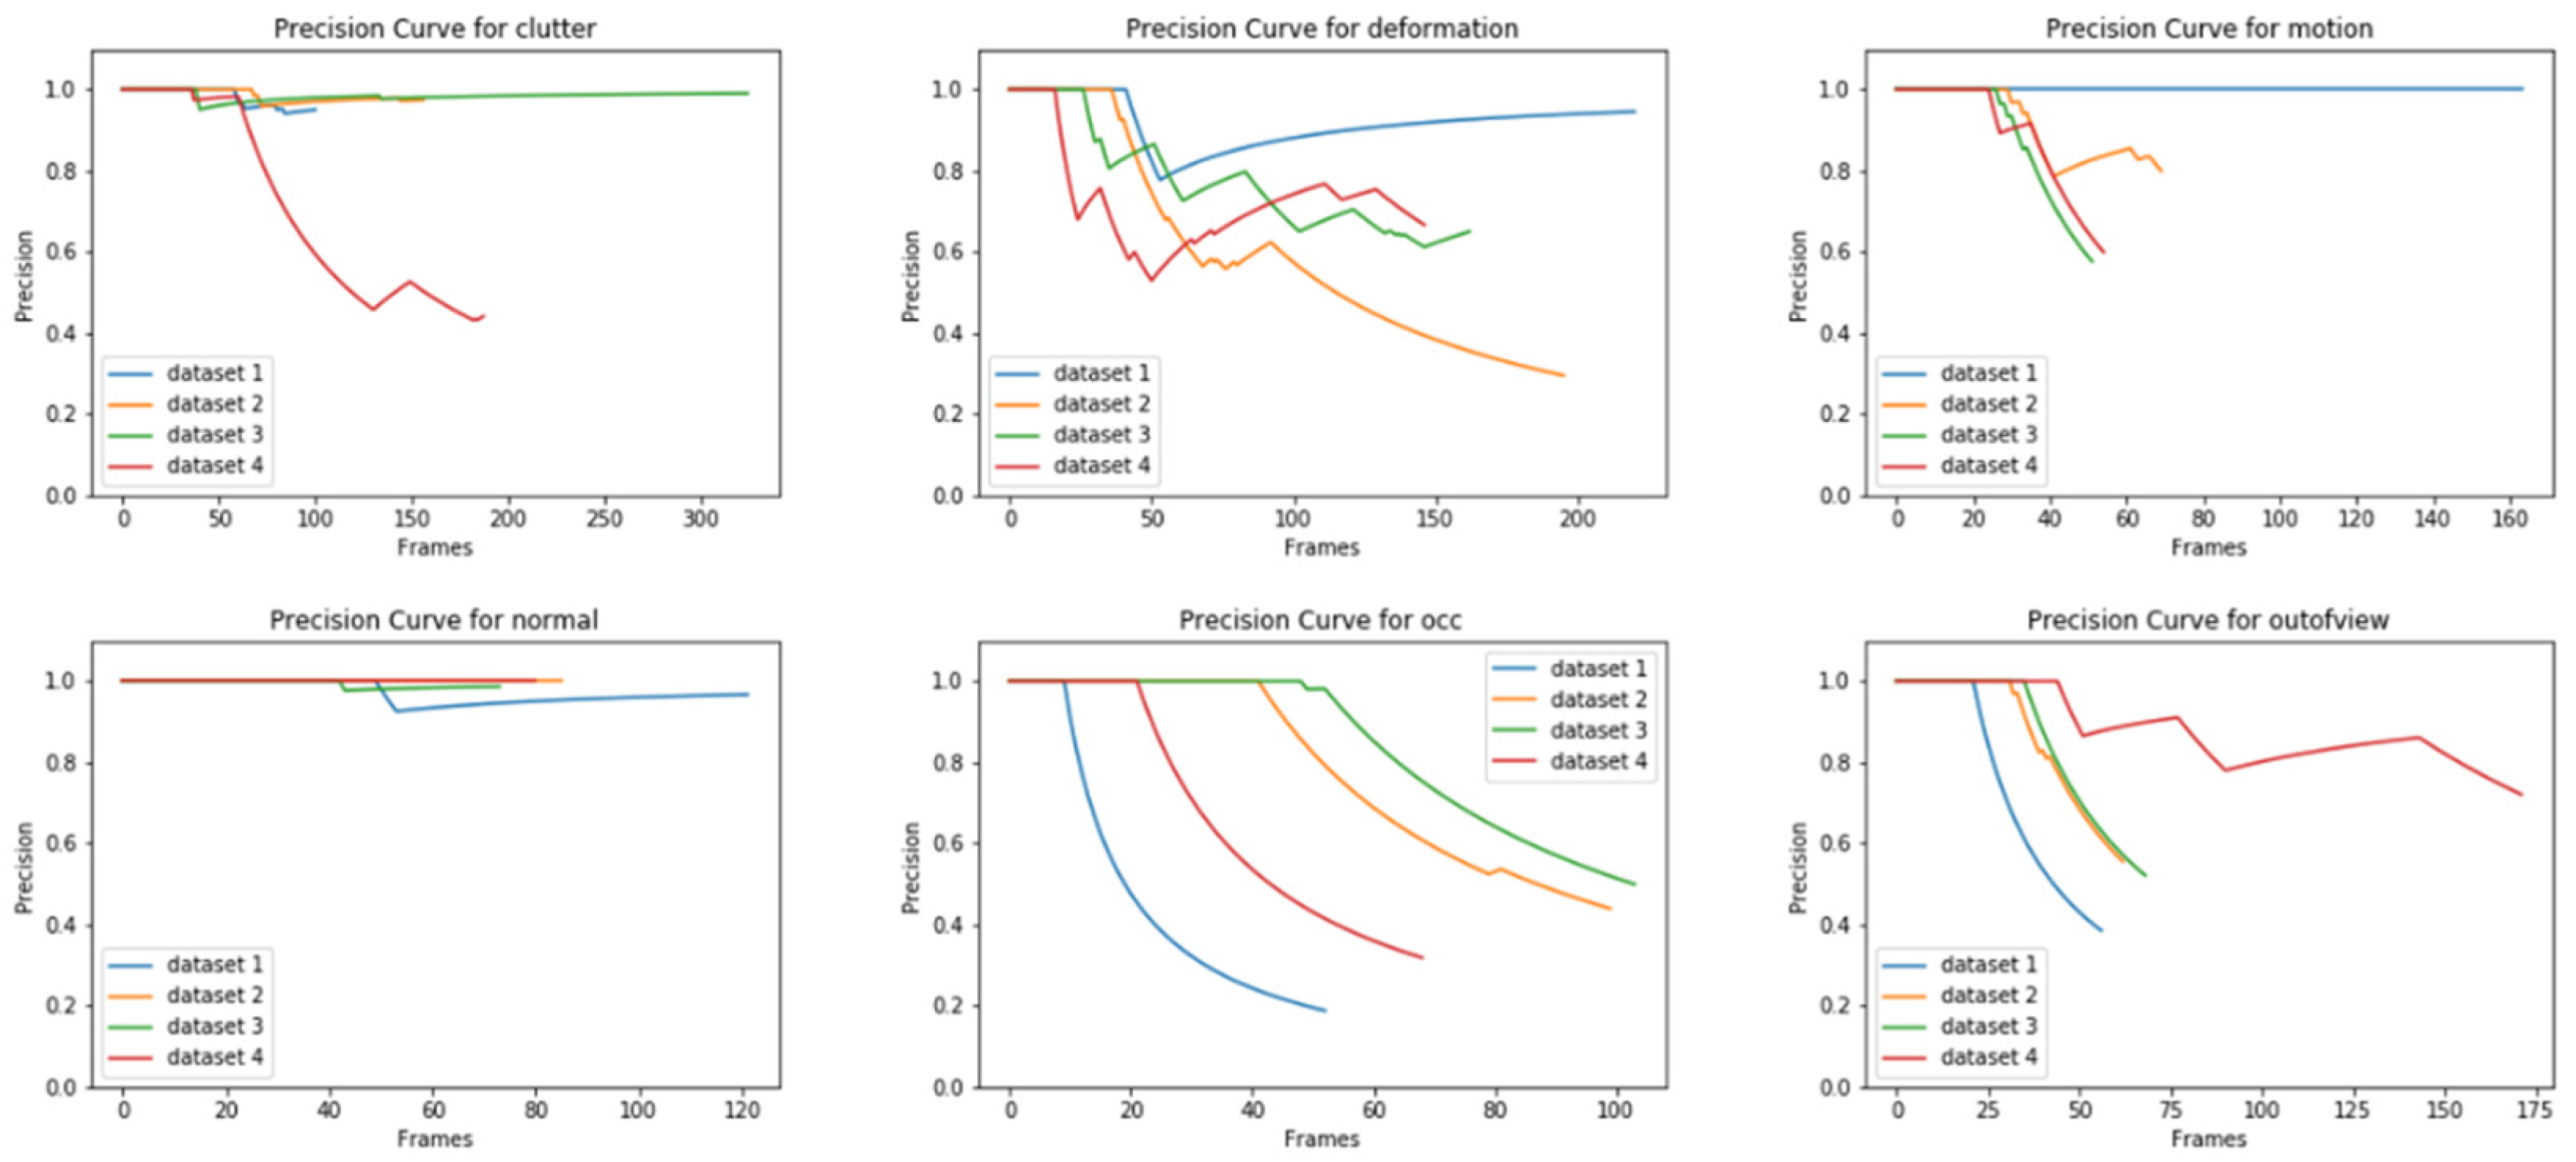
Observation: From Figure 9, we observe that precision is lowest for occlusion scenarios, although depending on the dataset and when the subject was occluded, the precision may decrease at different times. The value of precision can also be seen in Table 2 where the average precision is 70%, the lowest among all scenarios. It is closely followed by deformation at 75 %, where precision was dependent on subject movements, but it may recover over time. The out-of-view scenario performs poorly too. It is better than occlusion and deformation scenarios because the subject is tested under normal scenarios initially and it is only towards the end where it goes out of the view of the camera. As can be seen from the plot, it never recovers, indicating that the tracker does not have the ability to re-identify the subject once it goes out of view and returns. For scenarios such as clutter and ideal cases, the tracker seems to perform well.
6. Results of Performance Analysis Using Public Benchmark
6.1. OTB-50 Benchmark Analysis
The OTB [25] methodology applies a no-reset experiment in which the tracker is initialized in the first frame and runs unsupervised until the end of the sequence. KCF is compared with other existing top-performing trackers available for comparison on OTB50 [25] sequences, which are fully labeled and contain more than 26,000 frames. A standard evaluation protocol is used to evaluate the 11 appearance variants. The results are presented in the form of a Success Rate (SR). For the tracker bounding box and the ground truth bounding box of the target, the success rate (SR) is given by:
where and represent the intersection and union operators. The 11 appearance variants or categories are illumination variation (IV), scale variation (SV), occlusion (OCC), deformation (DEF), motion blur (MB), fast motion (FM), in-plane rotation (IPR), out-of-plane rotation (OPR), out-of-view (OV), background clutter (BC), and low resolution (LR). For comparison purposes, we used state-of-the-art trackers as mentioned in Table 3. The CSK [18], KCF [8], and DSST [26] are the most popular correlation filter-based trackers, while TLD [27] and Struck [28] are frequently used tracking-by-detection based algorithms. There are other CF tackers that address many model issues such as unwanted boundary and model degradation (DDCF [29]), scale change of target objects (SAMF [30]), and drifting and long-tern failure (ELMACF [31]). With the increased popularity of attention paid to mechanisms, trackers such as AFCN [32] utilized the dynamic properties of targets for the best performance.
6.2. VOT 2015 Performance Analysis
The VOT 2015 [34] challenge saw various competitive trackers tested against a diverse dataset. Here, many variants of correlation filter-based trackers, and some specifically around the KCF tracker, proved their competitiveness, robustness, and speed. For VOT 2015, three performance measures were used due to their understandability and interpretability: (a) Accuracy, (b) robustness, and (c) speed. The accuracy measures how well the bounding box predicted by the tracker overlaps with the ground-truth annotation for the dataset. On the other hand, robustness measures how many times the tracker loses the target. In particular, the raw accuracy (average overlap) and raw robustness (number of failures per sequence) were computed for each tracker on each sequence. They were then quantized in the interval [0, 9]. Raw robustness was clipped at nine failures to calculate the quantized robustness, and the quantized accuracy was computed by 9 − [10], where is the VOT accuracy.
It was observed that although CNN-based correlation trackers did achieve great accuracy, the traditional correlation filter (especially KCF variants) performed best in speed. The effectiveness of KCF-based trackers can be understood by the fact that the speed of traditional KCF trackers (sKCF [34] and KCFv2 [34]) is almost 70–100% faster than CNN-based CF trackers. Table 4 shows various CF trackers and their results on the VOT 2015 challenge.
In VOT 2015, among other trackers, several were from the KCF tracker class, namely SRDCF [35], DeepSRDCF [36], LDP [37], NSAMF [34] RAJSSC [34], and MvCFT [34]. RAJSSC is a KCF-based framework that focuses on making tracker rotation invariant, NSAMF is an extension of the VOT 2014 top-performing tracker that uses color in addition to edge features, SRDCF is a regularized KCF that reduces boundary effects in learning a filter, and DeepSRDCF is its extension of [35] that uses CNN for feature extraction. Using activations from the convolutional layer of a CNN to mitigate the need for task-specific fine tuning, MKCF+ was built upon MKCF [38] and addresses the issue of model-drift using a background modelling algorithm. MvCFT [34] addresses the problem of multiple object views using a set of correlation filters. LDP, on the other hand, addresses the non-rigid deformation by applying a deformable part-based correlation filter. KCFDP [34] uses an EdgeBoxes algorithm to search for detection proposals nearby and finds the best target candidate for the tracker. MTSA-KCF addresses the scaling issue of KCF using a simple voting over-grid method. One of the limitations of KCF is the fixed size of the filter, and this issue was addressed in sKCF [34], which builds upon KCF and uses an adjustable Gaussian window function and a keypoint-based model for scale estimation. KCF2 [34] and KCFv2 [34] are more simple modifications of KCF where the former uses online SVM to enhance the robustness and the latter replaces the model update by linear interpolation with a more robust update scheme.
6.3. VOT 2019 Performance Analysis
VOT 2019 [39] was different than previous challenges as the evaluation included the standard VOT and other popular methodologies for both short-term trackers and long-term trackers in a diverse dataset. The metrics for analysis were similar to VOT 2015. Table 5 shows the performance results of the correlation filter-based trackers in the VOT 2019 challenge. The expected average overlap (EAO) is an estimator of the average overlap a tracker is expected to attain on a large collection of short-term sequences with the same visual properties as the given dataset. Readers are referred to [34] for further details on the average expected overlap measure.
LSRDFT [39] and TDE [39] are CNN-based deep-tracking approaches equipped with deep features. They differ in the way that LSRDFT uses a shortened interval of updating in the correlation filter, while TDE utilizes an adaptive spatial selection scheme to learn a robust model. SSRCCOT is a correlation filter-based tracking method that proposes selective spatial regularization while training continuous convolution filters. CSRDCF [40] (and its C++ implementation CSRcpp) improves DCF trackers by introducing spatial and channel reliability. Its variant CISRDCF differs from the CSRDCF by independent feature channel calculation and an iterative regularization process. Another CFT tracker ECO [41] saw two variants, FSC2F and M2C2F, in the comparative analysis, where the former employs a motion-aware saliency map to address robustness and the latter adaptively utilizes multiple representative models of the tracked object for robustness. An attempt was made to address the issue of the boundary effect by WSCF-ST [39]. An ensemble of CF trackers also proved its robustness. TCLCF [39], which is an ensemble CF tracker, uses a different correlation filter to track the same target. Being computationally faster, it is great for embedded systems. There are other trackers that are either a variant of KCF (Struck [28]) or use KCF in some way (DPT [42]) in their algorithm.
7. Discussion and Conclusions
The application of visual tracking in robotics and surveillance has made tremendous progress in recent years. On one hand, there are deep learning-based trackers that propose end-to-end learning and depend on high GPU power and frequent fine tunings. On the other hand, there are correlation filter-based trackers that propose one-shot learning and perform well in speed without GPU acceleration, hence are computationally efficient. The research community has made significant progress in both fields, and it is the authors’ opinion that both signs of progress go together. CF-based visual trackers, in particular, have been popular because of their speed (almost ~70–100% faster than CNN-based CF trackers) and accuracy. One such state-of-the-art tracker was presented by the work of Henriques et al. [8], which utilized a unique structure of image samples, making it computationally very fast. The tracking algorithm, though fast, has its own weaknesses. This paper discusses this state-of-the-art Kernelized correlation filter (KCF) in detail in all aspects associated with its original inspiration, mathematical framework, and its experimental validation. The authors believe that the core inspired ideas of using circulant matrices and a kernel trick offer a natural approach for constructing a computationally efficient framework suited to real-time tracking. The tracker is tested on a dataset collected by authors consisting of 6000+ images using the Kinect RGB camera. The current dataset consists of subjects being observed from an elevation unlike the dataset used in [8], which consists of more uniform data with subjects and cameras at the same level. The results from the tracker were subject to standard evaluation metrics. It performs well for scenarios such motion and clutter; however, the performance is affected over a longer duration of time indicating that the tracker performs best as a short-term tracker than a long-term tracker. It was observed that the tracker was least robust to occlusion, irrespective of the size of the occlusion (person, pillar etc.). It was followed by deformation when the subject changed its size (bend down, sit etc.) in any given scenario. It was also observed that the tracker is unable to recover in out-of-view scenarios when the subject goes out of the view of the camera and re-enters, thereby affecting the tracker’s performance. In the future, we would like to expand our work and test a more diverse dataset including (a) close up data for better tracking of faces and hands and (b) level-headed data for people following robot applications.
The paper further shows the comparison of the OTB50 benchmark, VOT 2015, and VOT 2019 challenges with other existing state-of-the-art trackers. The authors are hopeful that a comprehensive comparison of the trackers will provide the research community with a better understanding of the current research of KCF, KCF variants, and other CF-based trackers. The preliminarily experiential study suggests many opportunities remain for extending the core framework to offer a robust real-time tracking approach.
This tracker has shown great potential for improvements both in robustness and accuracy. The authors aim to improve on this great work by using a better sampling strategy, such as particle filtering techniques. The PF framework has proved advantageous in the past in algorithm robustness due to its maximum likelihood estimation algorithm. It implements a recursive Bayesian filter by Monte Carlo simulations. The tracker utilizes the samples propagated based on the system dynamic model, and weighs samples by a weight function. With more samples, it is expected that it can recover the true posterior probability density, hence predicting the location with the highest likelihood of the correct response in KCF. The authors also feel that integrating the tracker with depth features will positively affect the tracker’s performance since the tracker will have the ability to better differentiate between the subject and the background. The authors intend to use Kinect RGB-D cameras for this feature extraction. The authors also realize that deep learning methods have proved beneficial for the current research community [43,44,45,46] and intend to explore the potential integration of correlation filters with deep-learning techniques to make the best of both methods.
Author Contributions
Conceptualization, S.Y. and S.P.; methodology, S.Y.; software, S.Y.; validation, S.Y.; formal analysis, S.Y.; investigation, S.Y.; resources, S.P.; data curation, S.Y.; writing—original draft preparation, S.Y.; writing—review and editing, S.P.; visualization, S.Y.; supervision, S.P.; project administration, S.P.; funding acquisition, S.P. All authors have read and agreed to the published version of the manuscript.
Funding
This work has been supported by the Natural Sciences and Engineering Research Council of Canada, grant number 31-611205.
Institutional Review Board Statement
Not Applicable.
Informed Consent Statement
Informed consent was obtained from all subjects involved in the study.
Data Availability Statement
Please contact author for data requests.
Acknowledgments
Funding to support the publication of this paper has been provided by Simon Fraser University Library’s Open-Access Fund.
Conflicts of Interest
The authors declare that they have no competing interests.
Consent for Publication
The picture materials quoted in this article have no copyright requirements, and the source, if applicable, has been indicated.
Abbreviations
| ROI | Region of Interest |
| HOG | Histogram of Gradient |
| KCF | Kernelized Correlation Filter |
| CF | Correlation Filter |
| FPS | Frame Per Second |
| CFT | Correlation Filter Tracker |
| BCCM | Block-Circulant Circulant Matrix |
| LRR | Linear Ridge Regression |
| IoU | Intersection of Union |
| TP | True Positive |
| FP | False Positive |
| TN | True Negative |
| FN | False Negative |
| IV | Illumination Variation |
| SV | Scale Variation |
| OCC | Occlusion |
| DEF | Deformation |
| MB | Motion Blur |
| FM | Fast Motion |
| IPR | In-Plane Rotation |
| OPR | Out-of-Plane Rotation |
| OV | Out-of-View |
| BC | Background Clutter |
| LR | Low Resolution |
| SR | Success Rate |
| CNN | Convolution Neural Network |
Appendix A
Dual form of Ridge Regression
We know that learning a linear classifier
also expanded as
can be formulated as learning an optimization problem over . This optimization problem is known as the primal problem. Instead, we can learn a linear classifier by solving an optimization problem over . This is known as the dual problem and has been studied extensively using Lagrangian Duality [47], and it can be used to derive the dual formulations of the learning algorithms. This can be extended to ridge regression problems. Ridge regression has a closed-form solution for its optimization problem and can be given by:
This optimization problem in is a convex problem and can be solved by differentiating it w.r.t. giving:
where is the data matrix. We can find its dual form solution by using the Representer Theorem [48], which states that for a regularized risk minimization problem:
the solution can be given by:
To find the dual form of the solution given by Equation (A6), we aim to find a relationship between Equations (A4) and (A6). Hence, we use the Sherman–Morrison–Woodbury formula [49], which states:
Comparing the L.H.S. of Equation (A7):
with (re-arranged) Equation (A4):
we get:
However, from Equation (A7), we know that:
Therefore, if we use Equation (A8) to substitute in the R.H.S. of Equation (A7) i.e., , we will get an equivalent of the closed-form solution of ridge regression given by Equation (A4), which is in the form of . The substitution can be shown as:
Hence, using the Sherman–Morrison–Woodbury formula and from Equation (A9), we now have:
Comparing this with Equation (A6):
we have the dual form solution of ridge regression as:
where we have defined as the Gram Matrix.
References
- Mei, X.; Ling, H. Robust Visual Tracking Using L1 Minimization. In Proceedings of the 2009 IEEE 12th International Conference on Computer Vision, Kyoto, Japan, 29 September–2 October 2009. [Google Scholar]
- Hager, G.D.; Dewan, M.; Stewart, C.V. Multiple Kernel Tracking with SSD. In Proceedings of the 2004 IEEE Computer Society Conference on Computer Vision and Pattern Recognition, (CVPR 2004), Washington, DC, USA, 27 June–2 July 2004. [Google Scholar]
- Parameswaran, V.; Ramesh, V.; Zoghlami, I. Tunable Kernels for Tracking. In Proceedings of the 2006 IEEE Computer Society Conference on Computer Vision and Pattern Recognition (CVPR’06), New York, NY, USA, 17–22 June 2006. [Google Scholar]
- Elgammal, A.; Duraiswami, R.; Davis, L.S. Probabilistic Tracking in Joint Feature-Spatial Spaces. In Proceedings of the 2003 IEEE Computer Society Conference on Computer Vision and Pattern Recognition, Madison, WI, USA, 18–20 June 2003. [Google Scholar]
- Viola, P.; Wells, W.M., III. Alignment by Maximization of Mutual Information PAUL. Int. J. Comput. Vis. 1997, 24, 137–154. [Google Scholar] [CrossRef]
- Bolme, D.S.; Beveridge, J.R.; Draper, B.A.; Lui, Y.M. Visual Object Tracking Using Adaptive Correlation Filters. In Proceedings of the 2010 IEEE Computer Society Conference on Computer Vision and Pattern Recognition, San Francisco, CA, USA, 13–18 June 2010. [Google Scholar]
- Chen, Z.; Hong, Z.; Tao, D. An Experimental Survey on Correlation Filter-Based Tracking. arXiv 2015, arXiv:1509.05520. [Google Scholar]
- Henriques, J.F.; Caseiro, R.; Martins, P.; Batista, J. High-Speed Tracking with Kernelized Correlation Filters. IEEE Trans. Pattern Anal. Mach. Intell. 2014, 37, 583–596. [Google Scholar] [CrossRef] [PubMed] [Green Version]
- Yang, M.; Jia, Y. Temporal dynamic appearance modeling for online multi-person tracking. Comput. Vis. Image Underst. 2016, 153, 16–28. [Google Scholar] [CrossRef] [Green Version]
- Xiang, Y.; Alahi, A.; Savarese, S. Learning to Track: Online Multi-Object Tracking by Decision Making. In Proceedings of the IEEE International Conference on Computer Vision (ICCV), Santiago, Chile, 7–13 December 2015. [Google Scholar]
- Pirsiavash, H.; Ramanan, D.; Fowlkes, C.C. Globally-Optimal Greedy Algorithms for Tracking a Variable Number of Objects. In Proceedings of the IEEE Conference on Computer Vision and Pattern Recognition (CVPR), Colorado Springs, CO, USA, 20–25 June 2011. [Google Scholar]
- Choi, W. Near-Online Multi-Target Tracking with Aggregated Local Flow Descriptor. In Proceedings of the IEEE International Conference on Computer Vision (ICCV), Santiago, Chile, 7–13 December 2015. [Google Scholar]
- Yadav, S.; Payandeh, S. Understanding Tracking Methodology of Kernelized Correlation Filter. In Proceedings of the 2018 IEEE 9th Annual Information Technology, Electronics and Mobile Communication Conference (IEMCON 2018), Vancouver, BC, Canada, 1–3 November 2018; pp. 1330–1336. [Google Scholar]
- Yadav, S.; Payandeh, S. Real-Time Experimental Study of Kernelized Correlation Filter Tracker Using RGB Kinect Camera. In Proceedings of the 2018 IEEE 9th Annual Information Technology, Electronics and Mobile Communication Conference (IEMCON 2018), Vancouver, BC, Canada, 1–3 November 2018; pp. 1324–1329. [Google Scholar]
- Smeulders, A.W.M.; Chu, D.M.; Cucchiara, R.; Calderara, S.; Dehghan, A.; Shah, M. Visual Tracking: An Experimental Survey. IEEE Trans. Pattern Anal. Mach. Intell. 2014, 36, 1442–1468. [Google Scholar]
- Liu, S.; Liu, D.; Srivastava, G.; Połap, D.; Woźniak, M. Overview and methods of correlation filter algorithms in object tracking. Complex Intell. Syst. 2020, 1–23. [Google Scholar] [CrossRef]
- Babenko, B.; Yang, M.-H.; Belongie, S. Robust Object Tracking with Online Multiple Instance Learning. IEEE Trans. Pattern Anal. Mach. Intell. 2011, 33, 1619–1632. [Google Scholar] [CrossRef] [Green Version]
- Henriques, J.F.; Caseiro, R.; Martins, P.; Batista, J. Exploiting the Circulant Structure of Tracking-by-Detection with Kernels. In Proceedings of the European Conference on Computer Vision, Florence, Italy, 7–13 October 2012; pp. 702–715. [Google Scholar]
- Cortes, C.; Vapnik, V. Support Vector Network. Mach. Learn. 1995, 20, 273–297. [Google Scholar] [CrossRef]
- Galoogahi, H.K.; Sim, T.; Lucey, S. Multi-Channel Correlation Filters. In Proceedings of the IEEE International Conference on Computer Vision (ICCV), Sydney, Australia, 1–8 December 2013. [Google Scholar]
- Cotter, A.; Keshet, J.; Srebro, N. Explicit Approximations of the Gaussian Kernel. arXiv 2011, arXiv:1109.4603. [Google Scholar]
- Cehovin, L.; Leonardis, A.; Kristan, M. Visual object tracking performance measures revisited. IEEE Trans. Image Process. 2016, 25, 1261–1274. [Google Scholar] [CrossRef] [Green Version]
- Wang, D.; Lu, H.; Yang, M.-H. Online Object Tracking with Sparse Prototypes. IEEE Trans. Image Process. 2012, 22, 314–325. [Google Scholar] [CrossRef] [Green Version]
- Yang, F.; Lu, H.; Yang, M.-H. Robust Superpixel Tracking. IEEE Trans. Image Process. 2014, 23, 1639–1651. [Google Scholar] [CrossRef] [PubMed] [Green Version]
- Wu, Y.; Lim, J.; Yang, M.-H. Object Tracking Benchmark. IEEE Trans. Pattern Anal. Mach. Intell. 2015, 37, 1834–1848. [Google Scholar] [CrossRef] [Green Version]
- Danelljan, M.; Häger, G.; Khan, F.S.; Felsberg, M. Accurate Scale Estimation for Robust Visual Tracking. In Proceedings of the British Machine Vision Conference 2014 (BMVC 2014), Nottingham, UK, 1–5 September 2014. [Google Scholar]
- Kalal, Z.; Mikolajczyk, K.; Matas, J. Tracking-Learning-Detection. IEEE Trans. Pattern Anal. Mach. Intell. 2012, 34, 1409–1422. [Google Scholar] [CrossRef] [Green Version]
- Hare, S.; Golodetz, S.; Saffari, A.; Vineet, V.; Cheng, M.-M.; Hicks, S.L.; Torr, P.H.S. Struck: Structured Output Tracking with Kernels. IEEE Trans. Pattern Anal. Mach. Intell. 2016, 38, 2096–2109. [Google Scholar] [CrossRef] [Green Version]
- Xu, G.; Zhu, H.; Deng, L.; Han, L.; Li, Y.; Lu, H. Dilated-aware discriminative correlation filter for visual tracking. World Wide Web 2019, 22, 791–805. [Google Scholar] [CrossRef]
- Li, Y.; Zhu, J. A Scale Adaptive Kernel Correlation Filter Tracker with Feature Integration. In Computer Vision—ECCV 2014 Workshops; Lecture Notes in Computer Science (Including Subser. Lect. Notes Artif. Intell. Lect. Notes Bioinformatics); Springer: Cham, Switzerland, 2015; Volume 8926, pp. 254–265. [Google Scholar]
- Qu, L.; Liu, K.; Yao, B.; Tang, J.; Zhang, W. Real-time visual tracking with ELM augmented adaptive correlation filter. Pattern Recognit. Lett. 2018, 127, 138–145. [Google Scholar] [CrossRef]
- Choi, J.; Chang, H.J.; Yun, S.; Fischer, T.; Demiris, Y.; Choi, J.Y. Attentional Correlation Filter Network for Adaptive Visual Tracking. In Proceedings of the 30th IEEE Conference on Computer Vision and Pattern Recognition, CVPR 2017, Las Vegas, NV, USA, 27–30 June 2017; pp. 4828–4837. [Google Scholar]
- Wang, L.; Ouyang, W.; Wang, X.; Lu, H. Visual Tracking with Fully Convolutional Networks. In Proceedings of the IEEE International Conference on Computer Vision (ICCV), Santiago, Chile, 7–13 December 2015; pp. 3119–3127. [Google Scholar]
- Fern, G.; Nebehay, G.; Pflugfelder, R.; Gupta, A.; Bibi, A. The Visual Object Tracking VOT2015 Challenge Results. In Proceedings of the IEEE International Conference on Computer Vision (ICCV) Workshops, Santiago, Chile, 7–13 December 2015. [Google Scholar]
- Danelljan, M.; Hager, G.; Khan, F.S.; Felsberg, M. Learning Spatially Regularized Correlation Filters for Visual Tracking. In Proceedings of the IEEE International Conference on Computer Vision (ICCV), Santiago, Chile, 7–13 December 2015; pp. 4310–4318. [Google Scholar]
- Danelljan, M.; Hager, G.; Khan, F.S.; Felsberg, M. Convolutional Features for Correlation Filter Based Visual Tracking. In Proceedings of the IEEE International Conference on Computer Vision (ICCV), Santiago, Chile, 7–13 December 2015. [Google Scholar]
- Cehovin, L.; Kristan, M.; Leonardis, A. Robust Visual Tracking Using an Adaptive Coupled-Layer Visual Model. IEEE Trans. Pattern Anal. Mach. Intell. 2012, 35, 941–953. [Google Scholar] [CrossRef] [PubMed]
- Tang, M.; Feng, J. Multi-Kernel Correlation Filter for Visual Tracking. In Proceedings of the IEEE International Conference on Computer Vision (ICCV), Santiago, Chile, 7–13 December 2015; pp. 3038–3064. [Google Scholar]
- Mishra, D.; Matas, J. The Visual Object Tracking VOT2017 Challenge Results. In Proceedings of the IEEE International Conference on Computer Vision (ICCV), Venice, Italy, 22–29 October 2017; pp. 1949–1972. [Google Scholar]
- Lukežič, A.; Vojíř, T.; Zajc, L.Č.; Matas, J.; Kristan, M. Discriminative Correlation Filter with Channel and Spatial Reliability. In Proceedings of the 30th IEEE Conference on Computer Vision and Pattern Recognition (CVPR), Honolulu, HI, USA, 21–26 July 2017. [Google Scholar]
- Danelljan, M.; Bhat, G.; Khan, S.; Felsberg, M.; Khan, F.S.; Felsberg, M. ECO: Efficient Convolution Operators for Tracking. In Proceedings of the IEEE Conference on Computer Vision and Pattern Recognition, Honolulu, HI, USA, 21–26 July 2017; pp. 6638–6646. [Google Scholar]
- Lukezic, A.; Zajc, L.C.; Kristan, M. Deformable Parts Correlation Filters for Robust Visual Tracking. IEEE Trans. Cybernetics. 2017, 48, 1849–1861. [Google Scholar] [CrossRef] [PubMed] [Green Version]
- Rasoulidanesh, M.; Yadav, S.; Herath, S.; Vaghei, Y.; Payandeh, S. Deep Attention Models for Human Tracking Using RGBD. Sensors 2019, 19, 750. [Google Scholar] [CrossRef] [PubMed] [Green Version]
- Murahari, V.S.; Ploetz, T. On Attention Models for Human Activity Recognition. In Proceedings of the 2018 ACM International Symposium on Wearable Computers, Singapore, 8–12 October 2018. [Google Scholar]
- Ba, J.; Mnih, V.; Kavukcuoglu, K. Multiple Object Recognition with Visual Attention. arXiv 2014, arXiv:1412.7755. [Google Scholar]
- Song, S.; Xiao, J. Deep Sliding Shapes for Amodal 3D Object Detection in RGB-D Images. In Proceedings of the IEEE Conference on Computer Vision and Pattern Recognition (CVPR), Las Vegas, NV, USA, 27–30 June 2016; pp. 808–816. [Google Scholar]
- Boyd, S.; Boyd, S.P.; Vandenberghe, L. Convex Optimization; Cambridge University Press: Cambridge, UK, 2004. [Google Scholar]
- Schölkopf, B.; Herbrich, R.; Smola, A.J. A Generalized Representer Theorem. In Proceedings of the International Conference on Computational Learning Theory, Amsterdam, The Netherlands, 16–19 July 2001; pp. 416–426. [Google Scholar]
- Horn, R.A.; Johnson, C.R. Matrix Analysis; Cambridge University Press: Cambridge, UK, 2012. [Google Scholar]
Figure 1.
(a) Sample 2D greyscale image and cropped patches. The dimension of each of the cropped images is 30 × 30. (b) Color-coded Block-Circulant Circulant Matrix for the cropped 2D image patch shown in (a).
Figure 1.
(a) Sample 2D greyscale image and cropped patches. The dimension of each of the cropped images is 30 × 30. (b) Color-coded Block-Circulant Circulant Matrix for the cropped 2D image patch shown in (a).
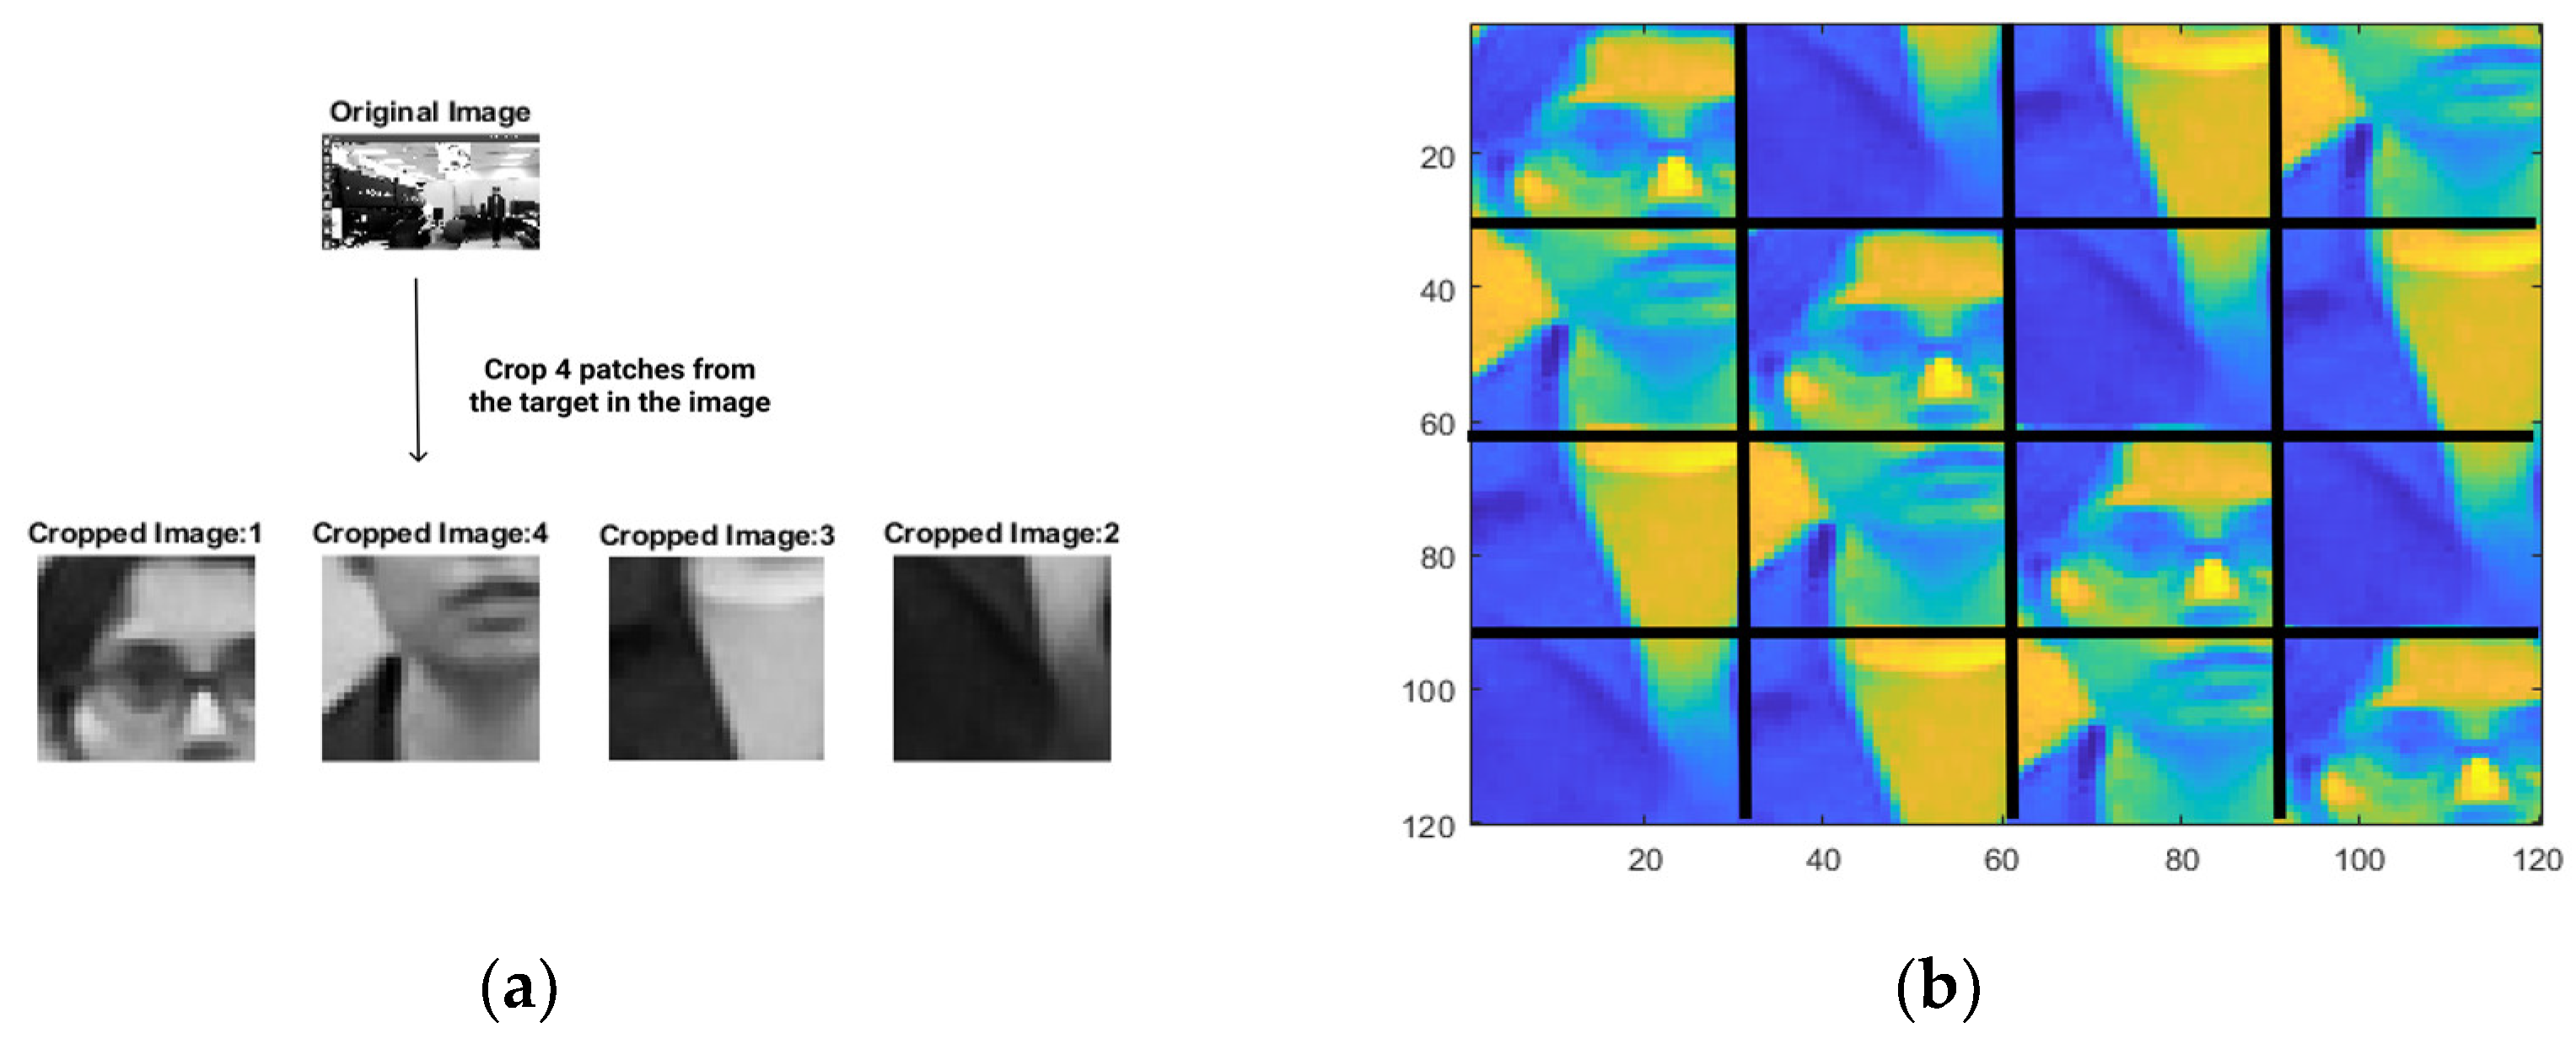
Figure 2.
(a) HOG features of the cropped patches from an image frame. For convenience, we extracted the HOG features from the same grayscale cropped patches as shown in Figure 1a. It is to be noted that we chose 1 (out of 32) orientations of the HOG features for simplicity in visualization (best viewed in color). The dimension of HOG features for each of the four patches shown is 7 × 7 per orientation. (b) HOG features as color-coded circulant blocks. The edges and labels have been added for better clarity.
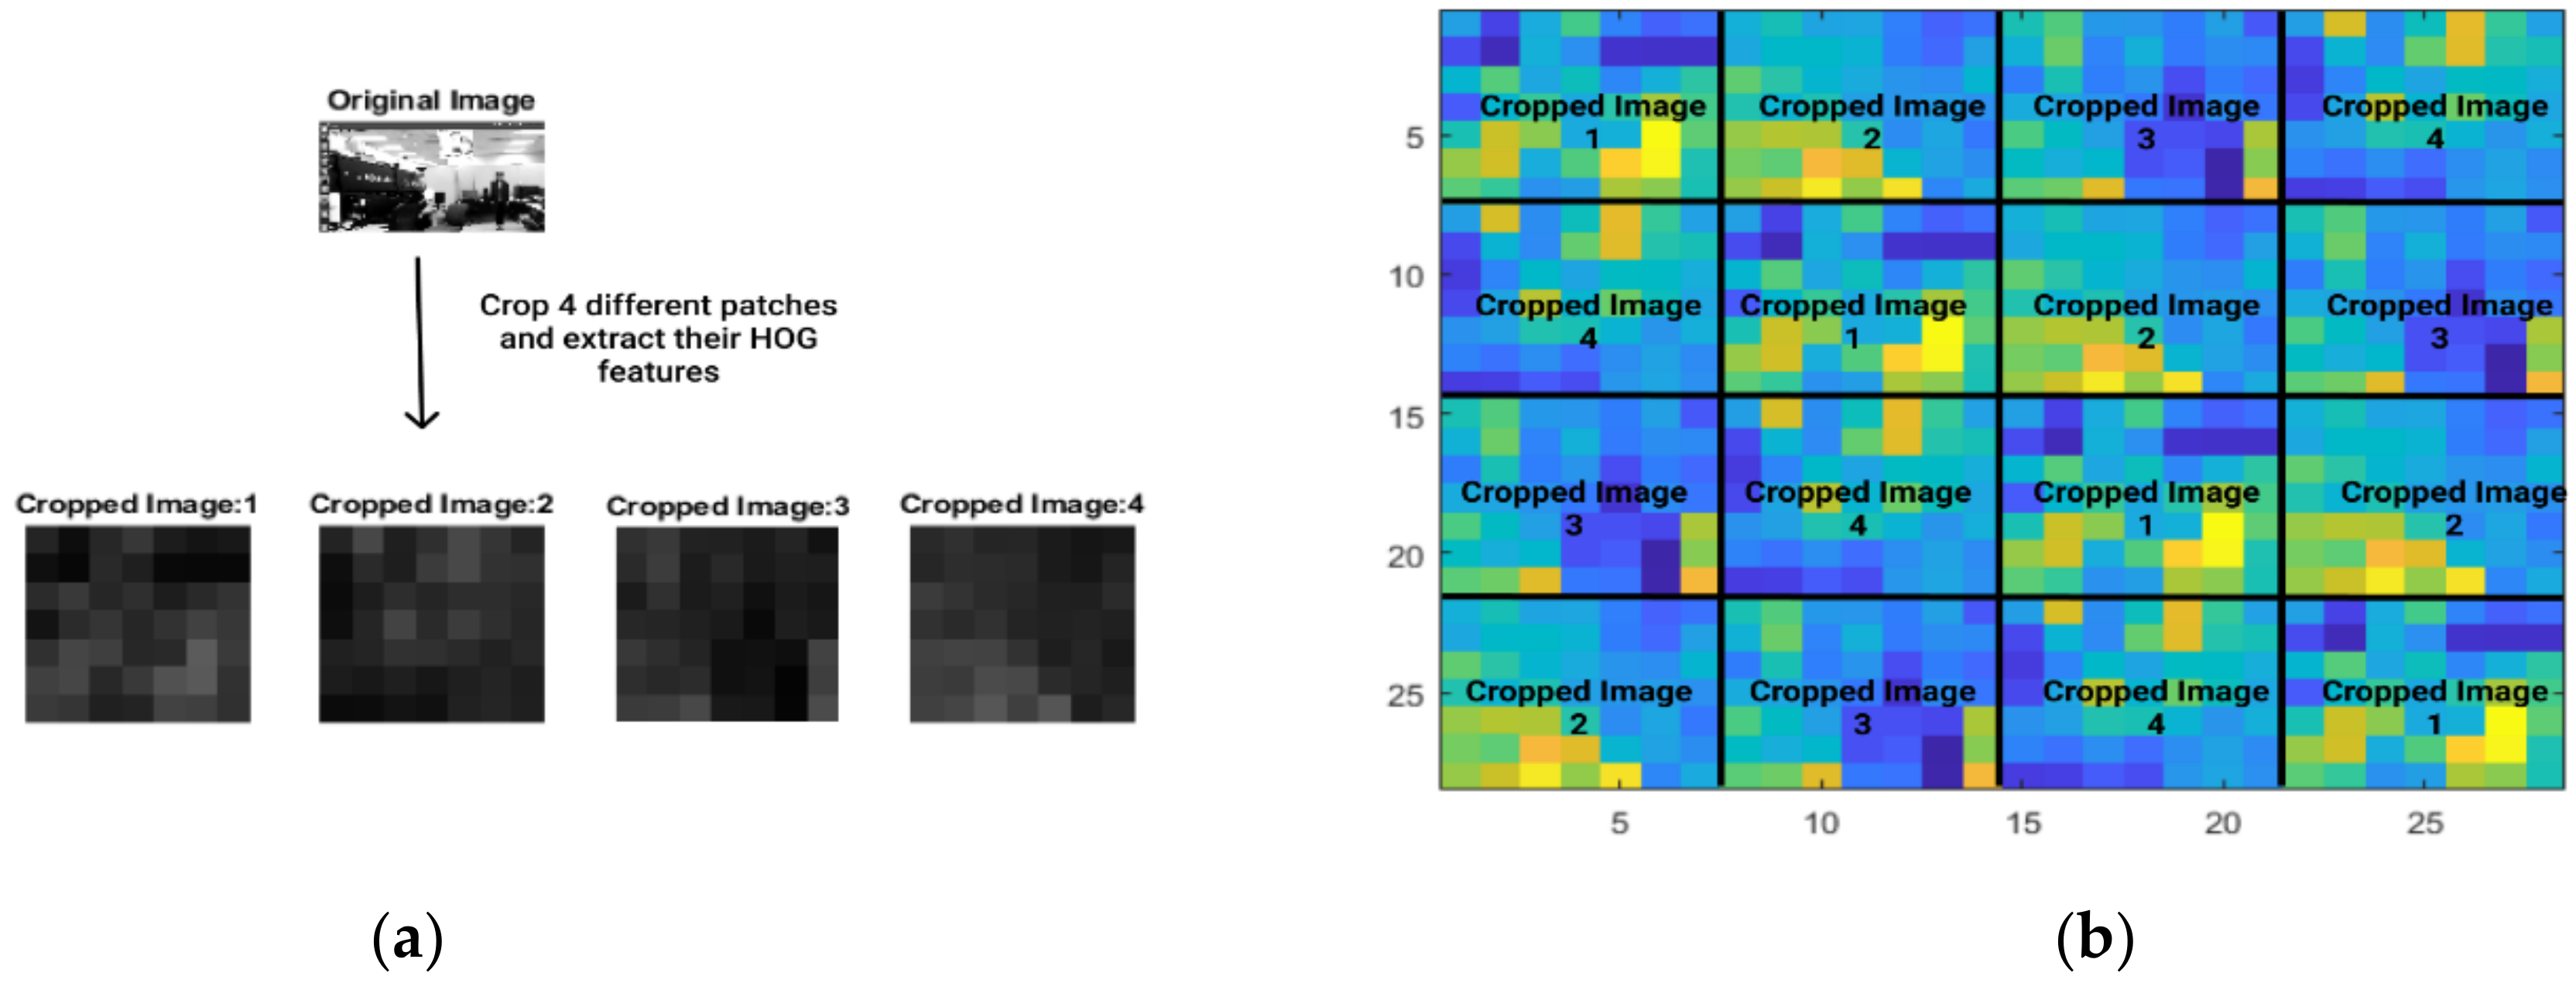
Figure 3.
Overview of the sequences used in the experiment. A total of six experimental scenarios: (a) Clutter; (b) deformation; (c) motion; (d) normal; (e) occlusion; (f) out-of-view. Targets have a bounding box around them. Best viewed in color.
Figure 3.
Overview of the sequences used in the experiment. A total of six experimental scenarios: (a) Clutter; (b) deformation; (c) motion; (d) normal; (e) occlusion; (f) out-of-view. Targets have a bounding box around them. Best viewed in color.
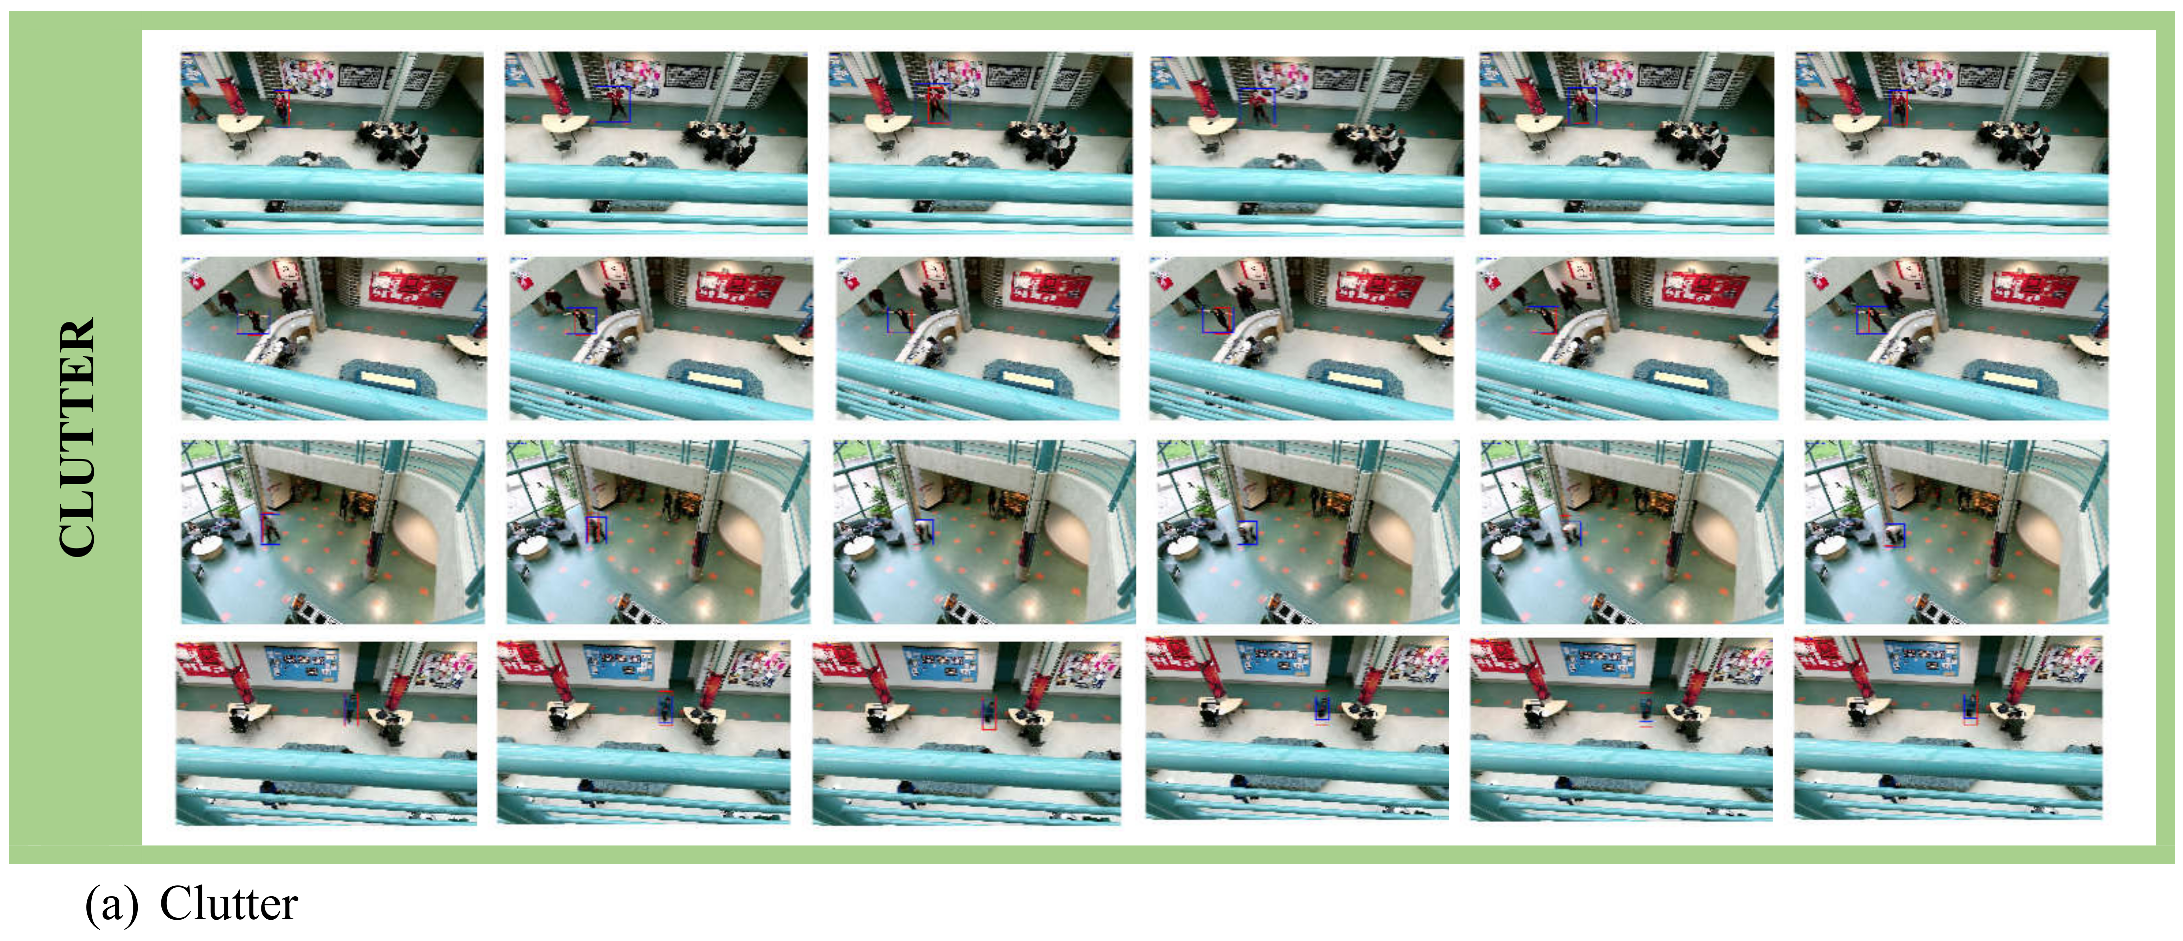
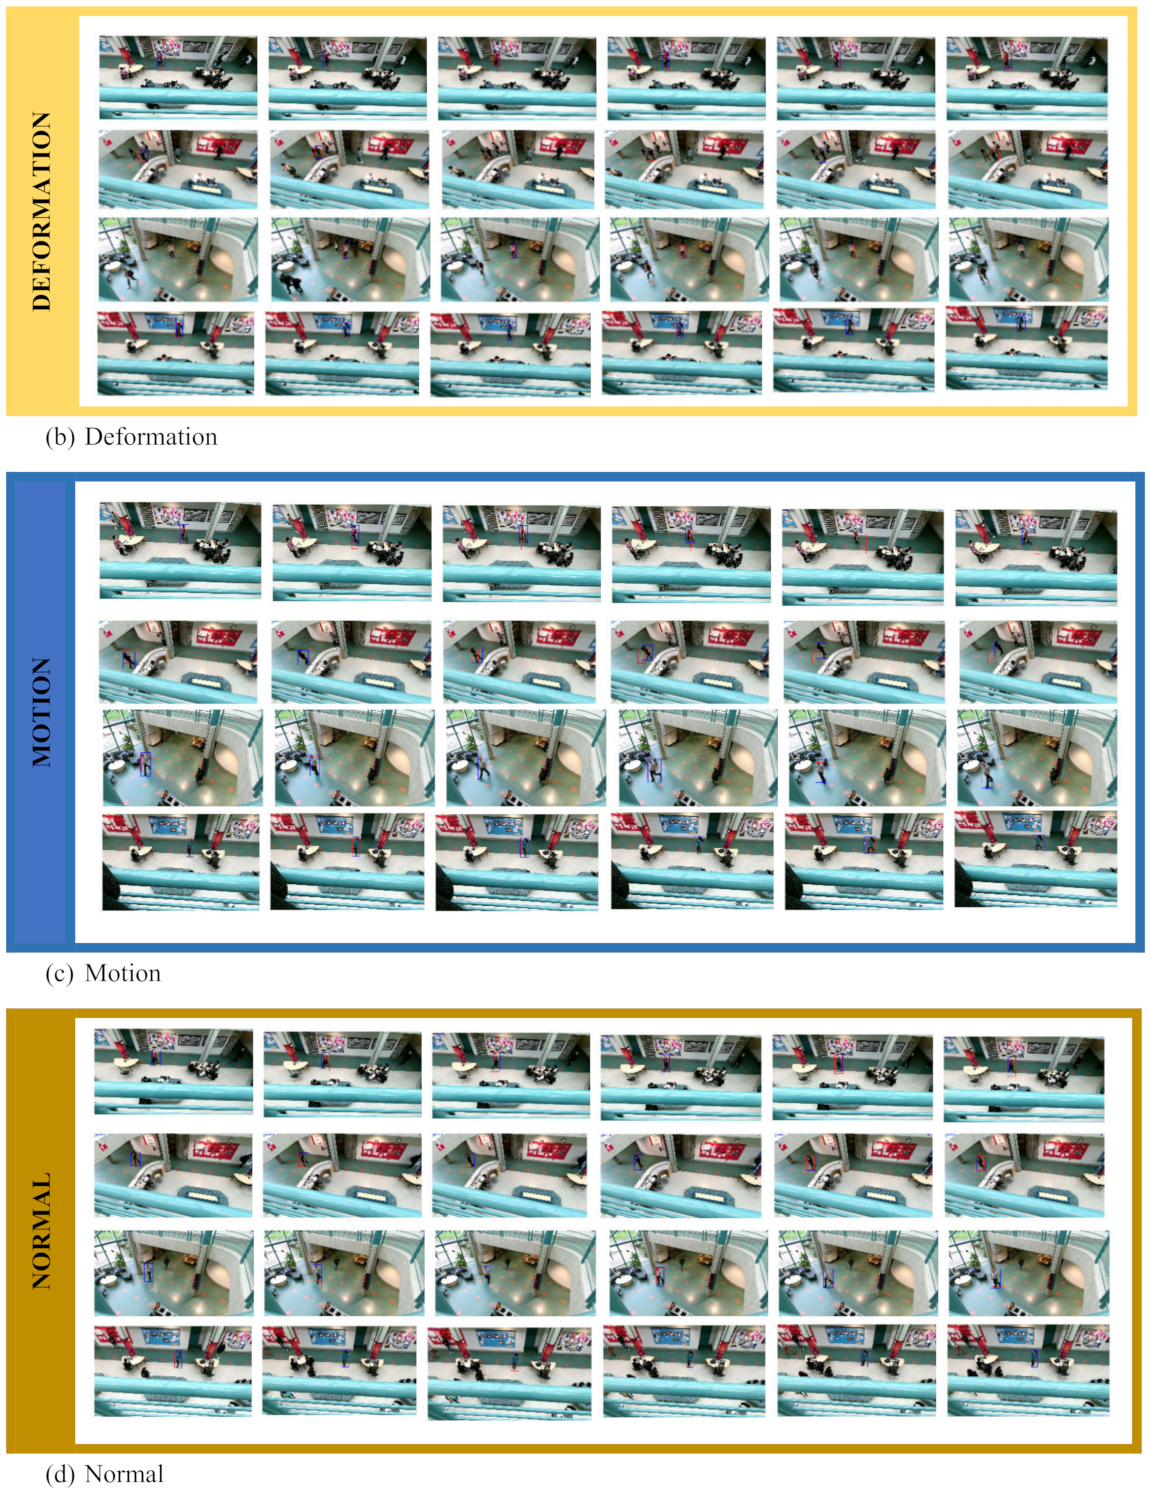

Figure 4.
Flow diagram of training and detection pipeline.
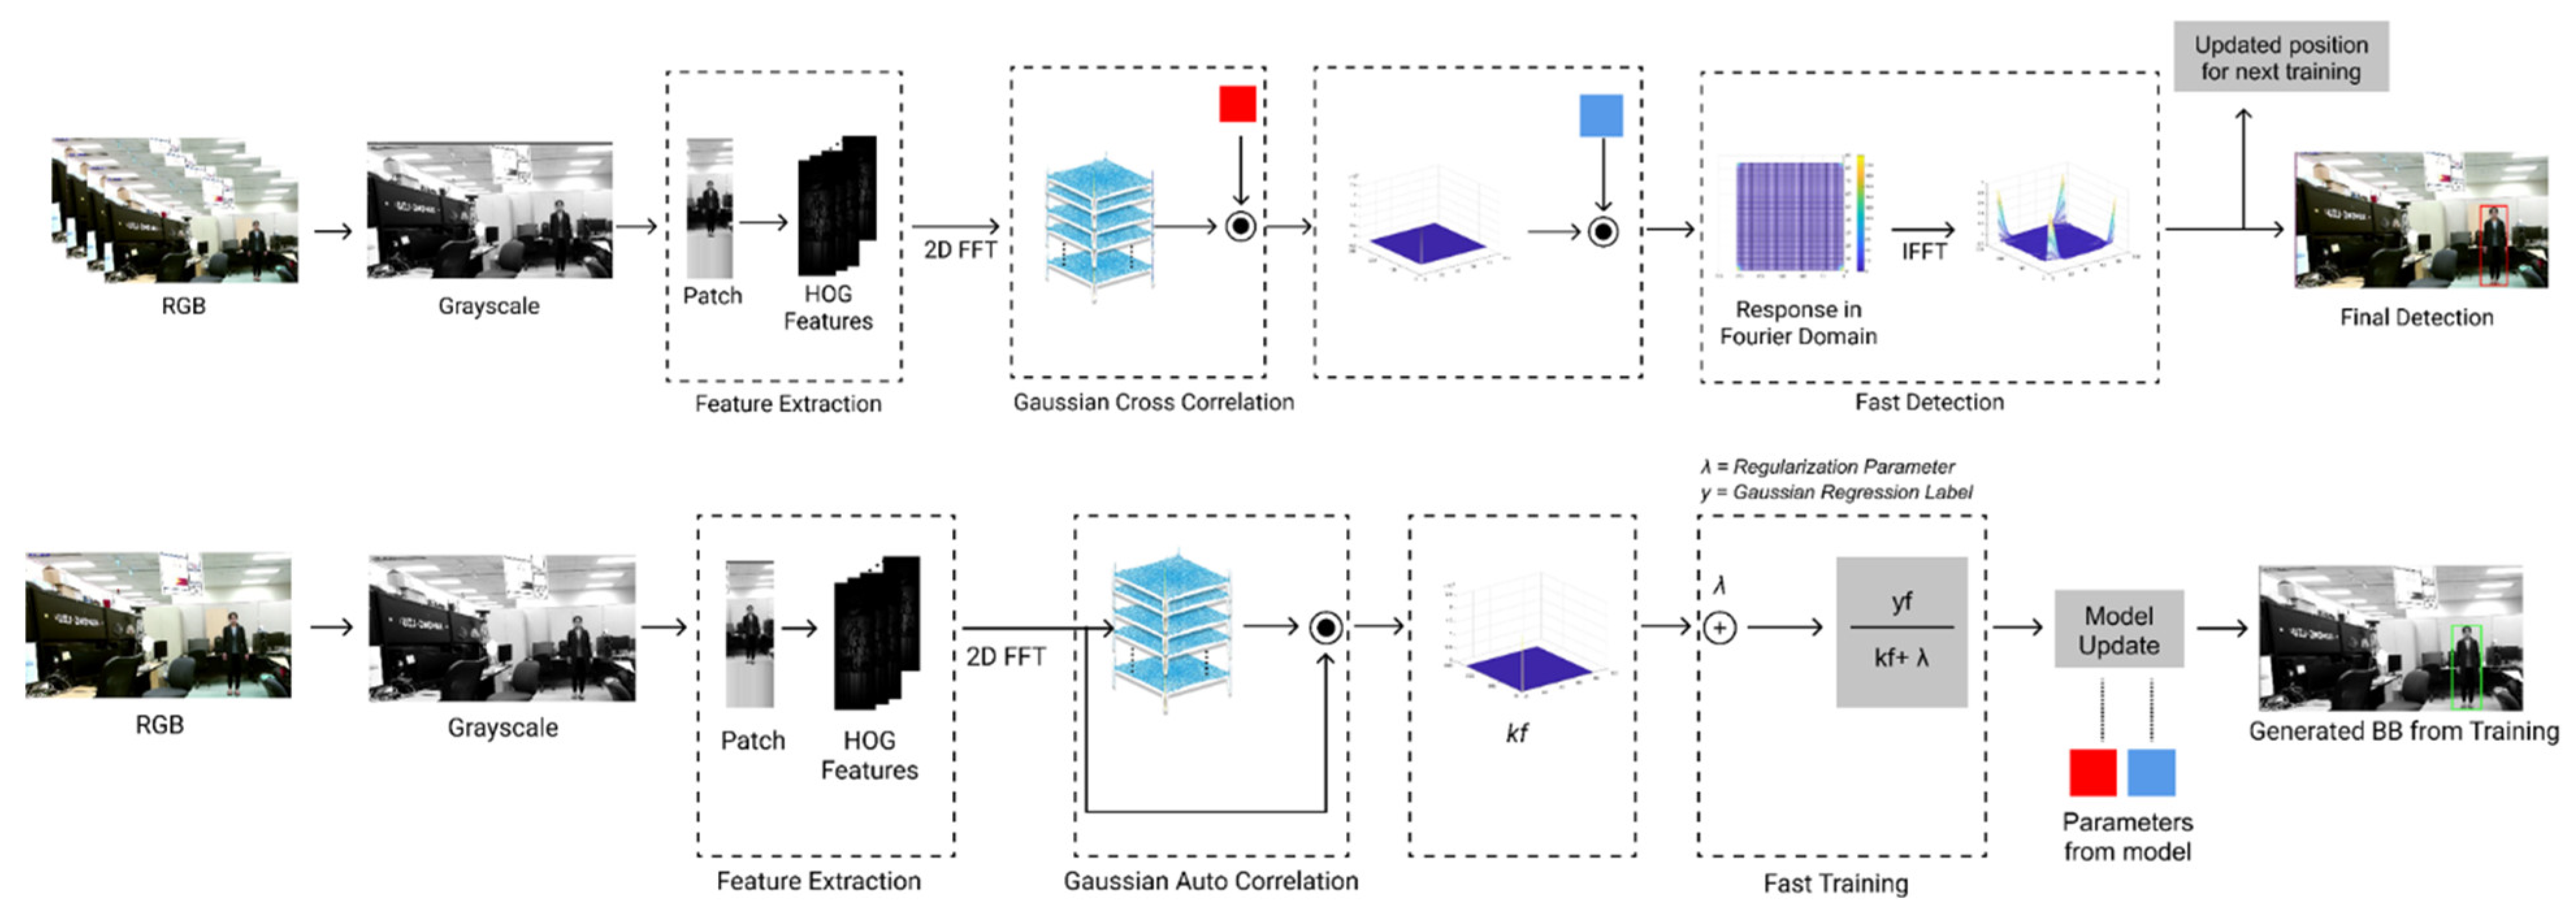
Figure 5.
Sample images from ‘occlusion’ scene that were used in tracker evaluation. The target has a bounding box around it. Best viewed in color.
Figure 5.
Sample images from ‘occlusion’ scene that were used in tracker evaluation. The target has a bounding box around it. Best viewed in color.
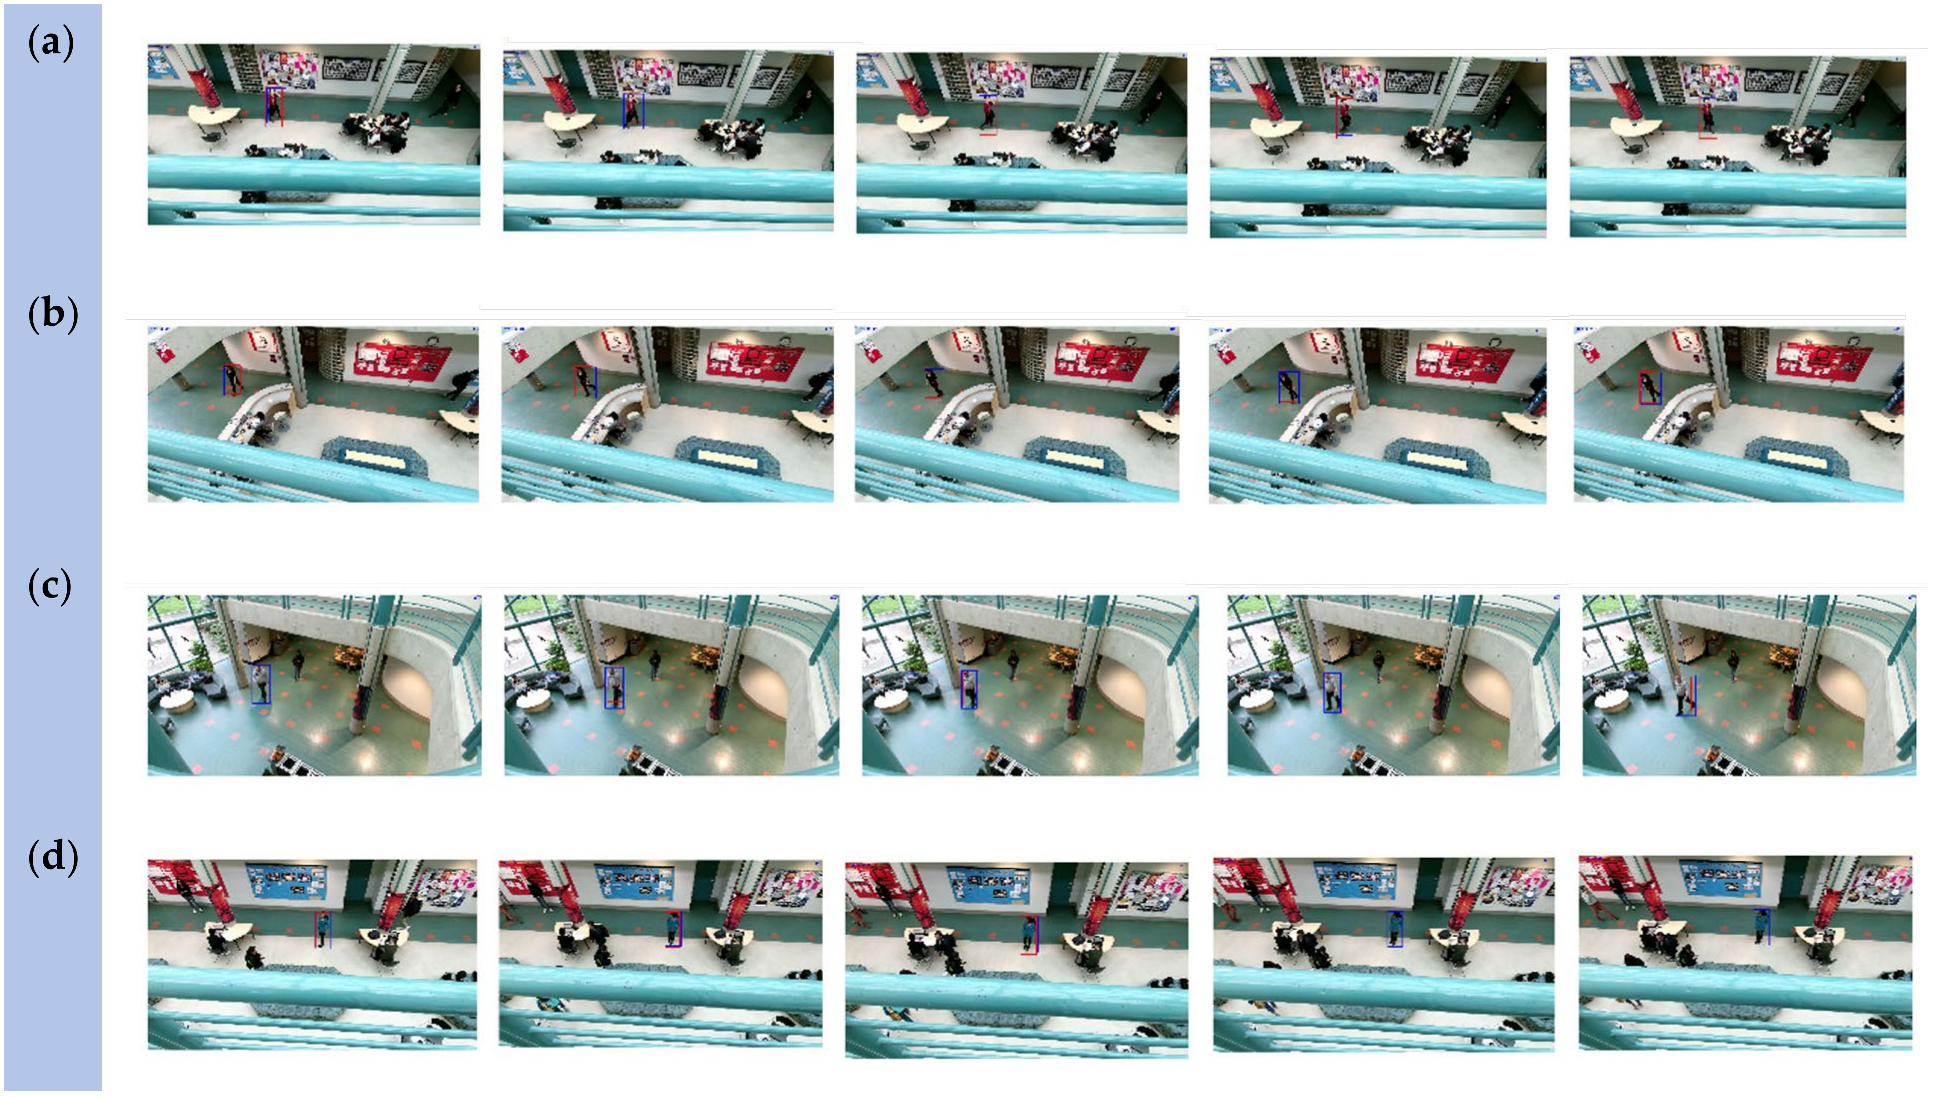
Figure 6.
Reasons for the sensitivity of center error due to GT and prediction annotations.

Figure 7.
Plots for center error for (Top, L–R) clutter, deformation, motion and (Bottom, L–R) normal, occlusion, out-of-view (best viewed when zoomed in).
Figure 7.
Plots for center error for (Top, L–R) clutter, deformation, motion and (Bottom, L–R) normal, occlusion, out-of-view (best viewed when zoomed in).


Figure 8.
Plots for Intersection of Union for (Top, L–R) clutter, deformation, motion and (Bottom, L–R) normal, occlusion, out-of-view (best viewed when zoomed in).
Figure 8.
Plots for Intersection of Union for (Top, L–R) clutter, deformation, motion and (Bottom, L–R) normal, occlusion, out-of-view (best viewed when zoomed in).

Figure 9.
Plots for precision for (Top, L–R) clutter, deformation, motion (Bottom, L–R) normal, occlusion, out-of-view (best viewed when zoomed in).
Figure 9.
Plots for precision for (Top, L–R) clutter, deformation, motion (Bottom, L–R) normal, occlusion, out-of-view (best viewed when zoomed in).

Table 1.
Details about the RGB dataset collected using Microsoft Kinect V2.
| Scenarios | Subjects | Data (No of Frames) |
|---|---|---|
| Clutter | 6 | 1677 |
| Deformation | 6 | 1494 |
| Normal | 6 | 900 |
| Occlusion | 6 | 663 |
| Motion | 6 | 784 |
| Out of view | 6 | 620 |
| Total | 6138 | |
Table 2.
Precision and average precision over the sequence of datasets for each scenario/environment.
Table 2.
Precision and average precision over the sequence of datasets for each scenario/environment.
| Clutter | Deformation | Motion | Normal | Occlusion | Out-of-View | |
|---|---|---|---|---|---|---|
| Dataset-1 | 0.9808 | 0.9168 | 1.0 | 0.9718 | 0.4958 | 0.7480 |
| Dataset-2 | 0.9841 | 0.6005 | 0.9123 | 1.0 | 0.7857 | 0.8717 |
| Dataset-3 | 0.9843 | 0.7731 | 0.8852 | 0.9927 | 0.8436 | 0.8577 |
| Dataset-4 | 0.7093 | 0.7274 | 0.8884 | 1.0 | 0.6784 | 0.8798 |
| Average | 0.9038 | 0.7544 | 0.9213 | 0.9911 | 0.7008 | 0.8393 |
Table 3.
The SR score of several state-of-the-art trackers, including KCF, on the 11 challenging scenarios. The best performance in each tracker has been highlighted in bold.
Table 3.
The SR score of several state-of-the-art trackers, including KCF, on the 11 challenging scenarios. The best performance in each tracker has been highlighted in bold.
| IV | IPR | LR | OCC | OPR | OV | SV | MB | FM | DEF | BC | |
|---|---|---|---|---|---|---|---|---|---|---|---|
| ELMACF [31] | 55.7 | 59.1 | 38.1 | 62.5 | 62.2 | 51.3 | 52.8 | 58.1 | 54.0 | 64.0 | 59.6 |
| ACFN [32] | 55.7 | 56.5 | 35.2 | 60.4 | 60.0 | 62.4 | 59.2 | 52.1 | 52.7 | 63.2 | 54.6 |
| FCN [33] | 59.8 | 55.5 | 51.4 | 57.1 | 58.1 | 59.2 | 55.8 | 58.0 | 56.5 | 64.4 | 56.4 |
| DDCF [29] | 63.8 | 48.8 | 44.8 | 44.4 | 46.1 | 44.3 | 48.3 | 53.3 | 52.3 | 41.2 | 54.5 |
| SAMF [30] | 46.3 | 45.8 | 44.0 | 47.8 | 48.1 | 39.5 | 44.6 | 44.0 | 42.8 | 44.0 | 43.8 |
| DSST [26] | 51.7 | 44.0 | 37.3 | 43.2 | 40.2 | 32.3 | 41.7 | 40.5 | 36.6 | 40.9 | 49.1 |
| KCF [8] | 43.3 | 38.9 | 28.5 | 39.6 | 39.6 | 32.7 | 35.3 | 40.8 | 38.9 | 40.0 | 41.7 |
| Struck [28] | 33.0 | 37.6 | 31.9 | 33.2 | 33.5 | 32.7 | 35.9 | 39.9 | 40.4 | 32.3 | 35.6 |
Table 4.
Raw accuracy and raw robustness (defined by the average number of failures) and speed of various CF trackers. The best performance is highlighted in bold.
Table 4.
Raw accuracy and raw robustness (defined by the average number of failures) and speed of various CF trackers. The best performance is highlighted in bold.
| Tracker | Accuracy | Robustness | Speed |
|---|---|---|---|
| RAJSSC [34] | 0.57 | 1.63 | 2.12 |
| SRDCF [35] | 0.56 | 1.24 | 1.99 |
| DeepSRDCF [36] | 0.56 | 1.05 | 0.38 |
| NSAMF [34] | 0.53 | 1.29 | 5.47 |
| MKCF+ [38] | 0.52 | 1.83 | 0.21 |
| MvCFT [34] | 0.52 | 1.72 | 2.24 |
| LDP [37] | 0.51 | 1.84 | 4.36 |
| KCFDP [34] | 0.49 | 2.34 | 4.80 |
| MTSA-KCF [34] | 0.49 | 2.29 | 2.83 |
| sKCF [34] | 0.48 | 2.68 | 66.22 |
| KCF2 [34] | 0.48 | 2.17 | 4.60 |
| KCFv2 [34] | 0.48 | 1.95 | 10.90 |
Table 5.
The expected average overlap (EOA), raw accuracy (A), and raw robustness (R) for the experiments in the VOT 2019 challenge. The best performance is highlighted in bold.
Table 5.
The expected average overlap (EOA), raw accuracy (A), and raw robustness (R) for the experiments in the VOT 2019 challenge. The best performance is highlighted in bold.
| Baseline | Real-Time | |||||
|---|---|---|---|---|---|---|
| EOA | A | R | EOA | A | R | |
| LSRDFT [39] | 0.317 | 0.531 | 0.312 | 0.087 | 0.455 | 1.741 |
| TDE [39] | 0.256 | 0.534 | 0.465 | 0.086 | 0.308 | 1.274 |
| SSRCCOT [39] | 0.234 | 0.495 | 0.507 | 0.081 | 0.360 | 1.505 |
| CSRDCF [40] | 0.201 | 0.496 | 0.632 | 0.100 | 0.478 | 1.405 |
| CSRpp [39] | 0.187 | 0.468 | 0.662 | 0.172 | 0.468 | 0.727 |
| FSC2F [41] | 0.185 | 0.480 | 0.752 | 0.077 | 0.461 | 1.836 |
| M2C2F [41] | 0.177 | 0.486 | 0.747 | 0.068 | 0.424 | 1.896 |
| TCLCF [39] | 0.170 | 0.480 | 0.843 | 0.170 | 0.480 | 0.843 |
| WSCF-ST [39] | 0.162 | 0.534 | 0.963 | 0.160 | 0.532 | 0.968 |
| DPT [42] | 0.153 | 0.488 | 1.008 | 0.136 | 0.488 | 1.159 |
| CISRDCF [39] | 0.153 | 0.420 | 0.883 | 0.146 | 0.421 | 0.928 |
| KCF [8] | 0.110 | 0.441 | 1.279 | 0.108 | 0.440 | 1.294 |
| Struck [28] | 0.094 | 0.417 | 1.726 | 0.088 | 0.428 | 1.926 |
Publisher’s Note: MDPI stays neutral with regard to jurisdictional claims in published maps and institutional affiliations. |
© 2021 by the authors. Licensee MDPI, Basel, Switzerland. This article is an open access article distributed under the terms and conditions of the Creative Commons Attribution (CC BY) license (https://creativecommons.org/licenses/by/4.0/).
Share and Cite
MDPI and ACS Style
Yadav, S.; Payandeh, S. Critical Overview of Visual Tracking with Kernel Correlation Filter. Technologies 2021, 9, 93. https://doi.org/10.3390/technologies9040093
AMA Style
Yadav S, Payandeh S. Critical Overview of Visual Tracking with Kernel Correlation Filter. Technologies. 2021; 9(4):93. https://doi.org/10.3390/technologies9040093
Chicago/Turabian StyleYadav, Srishti, and Shahram Payandeh. 2021. "Critical Overview of Visual Tracking with Kernel Correlation Filter" Technologies 9, no. 4: 93. https://doi.org/10.3390/technologies9040093
Note that from the first issue of 2016, this journal uses article numbers instead of page numbers. See further details here.