
Heuristic Weight Initialization for Diagnosing Heart Diseases Using Feature Ranking


1
The School of Computer Science and Engineering, Kyungpook National University, Daegu 41566, Republic of Korea
2
Department of Mathematics and Computer Science, Royal Military College of Canada, Kingston, ON 17000, Canada
*
Author to whom correspondence should be addressed.
Technologies 2023, 11(5), 138; https://doi.org/10.3390/technologies11050138
Submission received: 19 May 2023
/
Revised: 28 September 2023
/
Accepted: 4 October 2023
/
Published: 6 October 2023
(This article belongs to the Section Assistive Technologies)
Abstract
:The advent of Artificial Intelligence (AI) has had a broad impact on life to solve various tasks. Building AI models and integrating them with modern technologies is a central challenge for researchers. These technologies include wearables and implants in living beings, and their use is known as human augmentation, using technology to enhance human abilities. Combining human augmentation with artificial intelligence (AI), especially after the recent successes of the latter, is the most significant advancement in their applicability. In the first section, we briefly introduce these modern applications in health care and examples of their use cases. Then, we present a computationally efficient AI-driven method to diagnose heart failure events by leveraging actual heart failure data. The classifier model is designed without conventional models such as gradient descent. Instead, a heuristic is used to discover the optimal parameters of a linear model. An analysis of the proposed model shows that it achieves an accuracy of 84% and an score of 0.72 with only one feature. With five features for diagnosis, the accuracy achieved is 83%, and the score is 0.74. Moreover, the model is flexible, allowing experts to determine which variables are more important than others when implementing diagnostic systems.
1. Introduction
The key part of modern technologies, including in health care, is a micromachine, a tiny machine or device, typically on the order of micrometers (millionths of a meter). It has wide applications, including in medicine, electronics, and manufacturing [1]. The use of micromachines to enhance human capabilities, while still in the realm of science fiction, is an active area of research and development that may have significant potential to improve the capabilities of individuals. The term human augmentation refers to the use of technology to enhance the capabilities of the human body [2] and can be achieved through wearable devices, such as smart glasses or fitness trackers, and body implants based on micromachines, such as cochlear implants or artificial limbs. The potential applications of these technologies are diverse, ranging from improving communication and mobility for people with disabilities to improving athletic performance or access to information and other digital services.
Human augmentation devices need to be extremely small for practical implementation. One such device is the microchip or implantable microchip, which is typically implanted in the human body through an injection to record or transmit data about various aspects of the body such as blood pressure or symptoms as the controller of an artificial human organ. Numerous implementations have been developed over the past several decades. For example, the worldwide count of cochlear implants exceeds 700,000. Fifty-four percent of adults who fell ill with COVID-19 reported no or only partial recovery of their sense of smell. The E-Nose project was started in 2011 and is aimed at helping people who have lost their sense of smell. The working principle is similar to that of cochlear implants, which transmit signals to a small array of electrodes. However, this project faces several problems. The human nose can distinguish 1 trillion odors from 400 different receptors, and the such devices will be very expensive to produce [3]. A similar invention, sensors, which are commonly used to collect data from industrial processes and control them, are a leading-edge technology to collect data from deep brain activities and prevent serious health issues, such as brain hemorrhage. One successful implementation of such a sensor is neuropixels, which has been researched since the 1950s. Unlike in other implantable sensors, the shafts of neurpixels are unusually small, about 23µm thick and 1 cm long, making the devices suitable for brain implantation. These devices can record the activities of a single neuron for about six months [4].
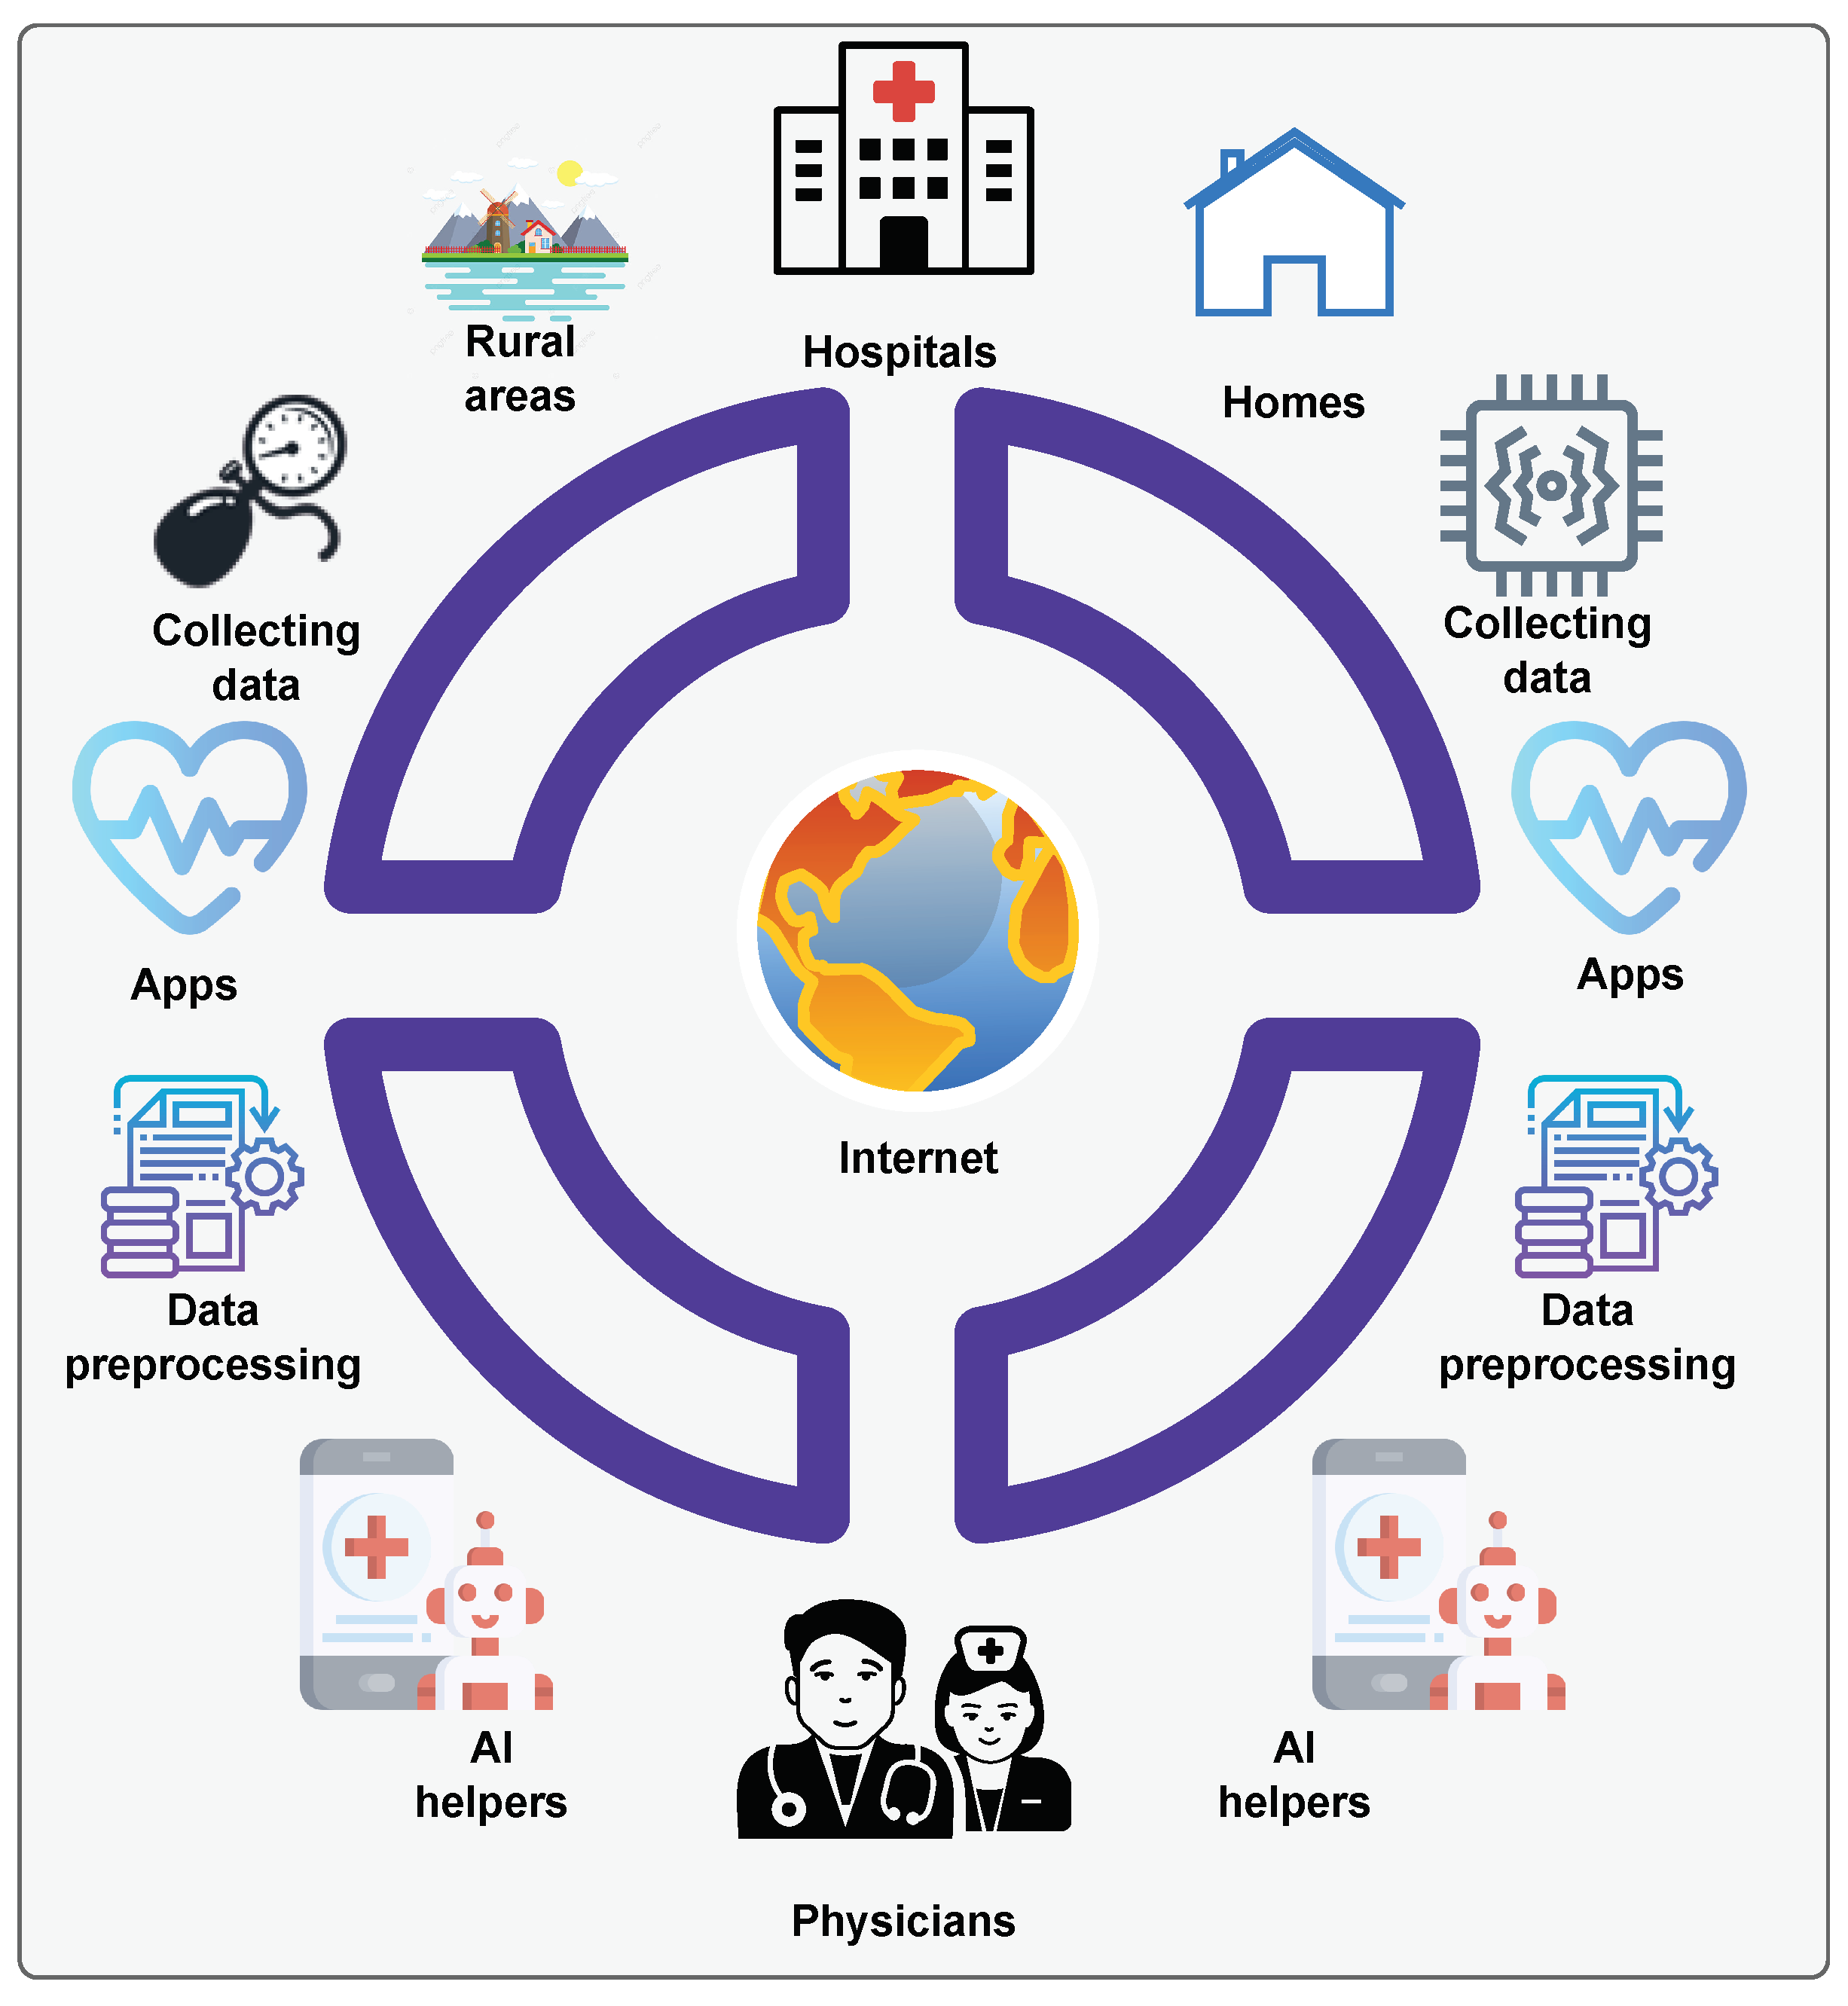
In the last two decades, many technologies have been researched for implementing a single connected system that can communicate in real time regardless of the distance. Such systems usually have a complex structure with many parts. One unique and critical part is the implantable microchip that continuously collects data without human intervention. By using such a system, for example, a cardiologist can be informed within seconds of the changes in the performance of the heart in patients with cardiovascular diseases and help prevent a heart failure, which can lead to even death. Figure 1 shows the system concept for the normal case for data acquisition and data transfer over the Internet. The system has six main parts: a unique data source, including hospitals, homes, and rural areas; data collection using microchips, implants, and wearables; data transfer using specialized apps; preprocessing; and recording of conversations with AI helpers and physicians for real-time diagnosis and treatment.
In this paper, we propose a Machine Learning (ML) model on a heuristic approach without additional theoretical assumptions to determine the optimal weights of a logistic regression model to diagnose heart failure in patients with heart disease. A summary of the main contributions of the paper is given below:
- linear model parameters (feature weights) are calculated based on heuristics instead of gradient descent;
- higher accuracies achieved in various metrics compared to previous research;
- feature ranking is determined based on heuristics, guaranteeing a single solution, unlike Random Forest, and it does not suffer from the class inequality problem either.
The remainder of the paper is organized as follows: The second section reviews the related work with an explanation of the results, limitations and differences between them and this work. Then, we present the proposed linear model based on feature ranking with its results and comparisons in the third section. The results are discussed in the fourth section, and, finally, the conclusions are presented in the fifth section.
2. Related Work
Despite the recent advances in high-end technology in medicine, heart defects cause more human deaths than other types of diseases. Cardiovascular disease statistics show 874,613 deaths, and in 2019, there was a death about every three and a half minutes in the United States [5]. In the medical domain, numerous scientific studies have been carried out over the years and solutions proposed to improve the quality of human life. Among them, the implantable bio-nanochip technology has been used to treat heart and cardiovascular diseases. The nanochip is programmable, i.e., it can be controlled with code [6]. Another method of monitoring patients with heart failure remotely was devised by the Calhoun Cardiology Center, which used a microchip of implantable sensors [7].
The recent successes of AI in many domains, including video, image, natural language, and signal processing, have been attributed to the use of complex models, such as Convolutional Neural Networks (CNN), Recurrent Neural Networks (RNN), and others. However, these models can fail when deployed in tiny nanochips, such as bio-nanochips, because of the lack of computational resources. Works that leverage the CNN model for diagnosing heart disease from phonocardiogram signals in real time have been proposed. Studies [8,9,10] are audio and image-based models with high accuracy. However, the implementation of these models in the micromachines and nanochips in wearables and implants often fails because of resource shortages. The extraction of multiple images and signals and their transfer to a central server may be not be possible. Another similar research on structural datasets employing CNN achieved more accurate results in various metrics [11], but this model also needs more resources. Similarly, the authors in [12,13] suggested a machine learning model employing data from two features, serum creatinine and ejection fraction, to diagnose cardiovascular diseases in patients using statistical analysis such as feature ranking, p-value tests based on linear regression and random forest.
In this work, as in previous research, we use feature ranking. However, the method is based on heuristic algorithms instead of a statistical hypothesis, producing more stable results and a slightly higher accuracy while leveraging fewer features. This methodology has been widely used in several scientific papers for data mining and classification. It is expressed as a linear regression model for binary classification:
where represents the parameters of the model, x represents input data, and b is a bias term that is omitted in this study. To decide the class of the input data x, usually a threshold with a value of 0.5 as a decision boundary is used. However, this study attempts to find the boundary that maximizes certain criteria.
To determine the optimal parameters w in Equation (1), most research works employ a gradient-decent method by minimizing an appropriate loss. In this case, it is a binary cross-entropy loss. In contrast, some other researchers have proposed a heuristic and deterministic methodology to calculate the parameters w [14,15,16,17]:
where is the class direction and are the optimal parameters of the model calculated using feature ranking. Therefore, our approach does not require any gradient-based optimization. The class directions of each feature in the model are found by calculating every possible combination of in previous works [14,15,16,17]. We propose a new method by modifying this approach based on the results of heuristic feature ranking.
3. The Proposed Methodology
This section will provide an overall model with a modern working internet and an AI-powered automatic classification task of heart failure diseases.
3.1. Heart Disease Data and the Proposed Model
During the experiments, we will use the heart failure dataset [12,13,18], which can be considered as data received from remote sensors. The dataset consists of 290 instances described by 13 features. The following Table 1 provides explicit information on each feature. As can be seen from Table 1, some feature values, such as patient age, cannot be measured using sensors, and some others are constant values, like the sex of patients. However, these features provide some flexibility in determining their values. For example, patient age and followed-period can be calculated within the devices and do not require extra resources. This dataset requires that the patients with heart disease be followed up continuously to enable prevention of early deaths. To achieve this purpose, we have a target feature: the results for observed patients who died or survived during the observation period.
3.2. The Proposed ML Model
The proposed ML model reduces the number of features using heuristics derived from data mining. Even with fewer features, it achieves almost the same accuracy as the other standard models. This has advantages in real-time applications as it can decrease laboratory analysis and device costs. Feature engineering and feature selection have many aspects. Our analysis rates 12 features and the relationship of each feature to the target values independently, replacing conventional methods such as logistic regression feature ranking and statistical tests. Equation (3) ranks the feature importance for target values independently. First, the values for one feature from the dataset are sorted. Then, we include the target values according to the location of each selected value. For example, Table 2 presents 20 values of patient ages derived from rows 70 to 90 of the dataset. If the target value equals 0, the patient survived during this period; otherwise, they died.
The ranking involves dividing the sorted feature values into two disjoint intervals and finding the border value by maximizing Equation (3). The maximum value of Equation (3) for a single feature is assigned to its weight . Let and denote the number of surviving and deceased patients in the first interval and and the number of surviving and deceased patients in the second interval of feature .
where , , are the minimum, border, and maximum values of the feature after dividing the data into disjoint intervals , in accordance. The solution of Equation (3) lies in the interval . If it is equal to 1, then the objects of the two classes (surviving and deceased) are located in different intervals. Moreover, the first and second brace expressions in Equation (3) imply the inner-class similarity and difference respectively. The Algorithm 1 below illustrates the steps for calculating the rank for a given feature.
| Algorithm 1 Feature Ranking Algorithm |
|
We assume a function criterion exists in Algorithm 1. Given below is an example for this function using the values in Table 2 based on choosing a probable best decision boundary. The object numbers in Table 2 are 15 and 5 in two classes in accordance. In the current case, we have a class-imbalance problem. At first glance, the first and second intervals are and ; refer the second part of the table. After the borders are defined, we can calculate the object numbers of each class in every interval. As denoted above, , , , are the number of objects in classes and intervals respectively, where the superscripts and subscripts indicate the interval and the class indices, respectively. The similarity and the difference can be computed as and , and the overall value of Equation (3) is , and the binary accuracy is 65%, which is a little high.
Similar to logistic regression, the presented approach uses a feature border calculated by the Algorithm 1 (a feature with the height rank) as a decision boundary instead of determining the threshold, usually . It is important to remember that a decision based on a single feature can have adverse effects, especially in medicine. In particular, if a patient has cardiovascular disease, there is a high probability of death after a certain period. Therefore, we include other features based on the ranking given by Equation (3) and the difficulty of measuring them in real time; for instance, determining a patient’s age does not call for any additional resources or effort, but platelets in the blood can be measured only in test laboratories. To end this, we leverage Equation (4) as linear logistic regression instead of leveraging gradient descent optimization with modification of Equation (2) is divided into two sums for: quantitative and categorical features separately. Equation (4) transforms all object feature values into a single value, which can used for further analysis by applying Equation (3).
where is the class direction, is the value of Equation (3), , , are the minimum, border, and maximum values of feature after dividing the entire range into disjoint intervals , . The class direction is implicit. The easiest way, as introduced in the task of maximizing the value of Equation (3), is determining case by case, which is NP-complete [19,20]; for example, if there 12 features in the datasets, then the number of total cases will be . This paper proposes to modify this limitation of the existing method. Let us assume the first-class objects are located in the first interval for each feature. To make this assumption work when the class intervals are misplaced, we set the class direction and otherwise, we assign 1 to the class direction . To apply Equation (4) to the categorical features, we preprocess them using a target encoder with an important modification: the value of each category is replaced with its posterior probability over the classes in Equation (5) [14].
We can group the features by using Equation (4) to obtain a single output for multiple inputs, as in the logistic regression model. After we have the output values of the objects in the training set, we apply Equation (3) to them to locate the border between two classes. Based on the assumption of the object locations in the intervals, we can write Equation (6) to predict new patients. We used the same approach for computing metrics using a single feature in Table 3.
4. Experiments
In this section, we illustrate our findings based on the methodology described in the previous section along with the outcomes of the comparison with other existing methods.
4.1. Data Preprocessing
According to Table 1, the dataset contains both categorical and numerical variables. Therefore, before using the AI models, the data must be preprocessed by scaling the numerical variables to intervals and converting categorical variables to numerical variables. Normalizing the numerical variables of different scales makes the AI models scale invariant and increases the goodness of fit and generalizability. Normalization is defined in several ways in statistics. For example, one of them is to fit variables at different scales to one scale. There are several scaling methods. In this experiment, we use a max-min scaling technique in the Formula (7) before predicting patients using the existing methods.
where is any numerical feature. Similarly, there are many methods to encode categorical variables into numerical variables, including one-hot, effect, binary, base-N, hash, and target encoders. Because all categorical variables are binary, they are not required to be encoded into numerical values.
4.2. Evaluation Metrics
We leverage four metrics to check the model performance, thus guaranteeing its performance in production. In addition, during the training, we can extract patterns of the model performance which can be used to find and fix failures. In the statistical analysis and machine learning of the binary classification, the score in Equation (8), Precision in Equation (9), and Recall in Equation (10) are used together to determine the accuracy of the classification problem [21].
where TP, FP, and FN are the number of True Positive, False Positive, and False Negative predicted objects, respectively.
4.3. Results of Existing Algorithms
After the input data have been preprocessed, we can apply various well-known machine learning algorithms, including k-nearest neighbors (kNN), support vector machines (SVM), Linear Classifiers, Random Forests, and Neural Networks (NN), and compare with the proposed method. Many models can be employed in different situations, and we must choose the best model for the problem. Table 4 depicts the results of 6 well-known methods using all the features from the dataset. The last metric in Table 4 is accuracy, calculated as a percentage of correctly predicted objects for all objects in the dataset. We split the dataset into two subsets comprising 75% and 25% of the data for training and testing, respectively, with a cross-validation technique of 4 folds. The values produced by scikit-learn library [22] in Table 4 are the results for the training and testing sets. The Random Forests results are the highest in precision and accuracy, while the Gradient Boosting Classifier results for the Recall and score metrics are the best among others. Even though a Multi-Layer Perceptron (MLP) has 1000 neurons in a single hidden layer with fine-tuning, its results are not applicable and are the lowest. Both training and test accuracies of Random Forest and Gradient Boosting meet the requirements for production. However, they require all feature values and can have a negative effect when acquiring all variables in real time.
4.4. Results of the Proposed Method
We report our findings in two different forms: Table 3 depicts the importance of each feature and its accuracy for the target as a single-feature decision-maker. Table 5 shows the results of grouping of the features for building a predictor with various combinations of features. The border can be used as a classifier by leveraging it for a single-feature decision as in a logistic regression model. The detailed steps for classification using the single-feature values are given earlier.
The results can be interpreted by experts in medicine and patterns can be identified in datasets. For a specific case, according to the results of the proposed model based on the dataset, Sex, Smoking do not have as much importance as Observed period. Now, we list some important properties of Equation (3), which determines the optimal border that can be employed as a decision-making boundary for binary classification:
- It does not require normalized data, i.e., it is scale invariant;
- It determines the applicable border even in datasets that are class-imbalanced;
- It can replace three metrics Precision, Recall, and score, i.e., it is more stable;
- It is unaffected by class locations in the two intervals;
- It can be used to determine a fine-tuned threshold in logistic regression.
5. Discussion
The results show that the proposed architecture performs exceptionally well even with one feature. Nevertheless, as mentioned earlier also, we encourage using more features to get sufficient guaranteed results, especially in medicine. The proposed algorithm works well on the datasets because of the following reasons. First, Equation (3) finds the most separable intervals concerning getting a higher value for each feature. The highest value is multiplied by the feature values and the feature’s class direction. Second, we estimate each object by adding all their feature values based on their class locations in the intervals. The values can be determined by using the result of Equation (5). Finally, we estimate each object by including the most ranked feature values step-by-step to get higher performance. We use the estimation values of objects to predict test objects.
The current method results in Table 4 show that the highest accuracy for is achieved by Gradient Boosting Classifier. However, its overfitting rate of 0.27 is also the highest because the gradient descent optimization can fit well on the training set. The Random Forest model has the highest accuracy of 0.85, followed by SVM with 0.84. However, the existing models presented in Table 4 use all feature values to predict the outcomes. In contrast, the proposed method requires only up to 5 features to diagnose cardiovascular diseases. In addition, the overfitting rates of the proposed method for all metrics are less than 0.04. Because the dataset has class-imbalance and all results are provided with an score, the accuracy of the proposed method for this score is acceptable with up to 5 features as per Equation (3).
The major advantage of the proposed method is that experts can select the features based on the facilities required and available for the proposed tests, such as their ranking or the difficulty in getting the proper medical records for selected features. In contrast, other methods require all the features. This feature selection process is not visible in Random Forest because it selects objects and features randomly and repeatedly to achieve higher accuracies [23]. Moreover, the proposed ranking is also useful for knowledge extraction.
6. Conclusions
We have proposed a ML model for the prediction of heart failure in patients with cardiovascular disease. This method can be used in real time even with less information. We have compared the results of the proposed method with those of several existing methods with respect to four metrics. The results show that the proposed method predicts heart failure better even if the dataset has class-imbalance. We have also suggested an overall IoT structure to work with patients with cardiovascular diseases in real time in both online and offline modes. Future work should be aimed at improving the model’s accuracy and applying this approach to other tasks, such as transfer learning. One limitation of the proposed method is that the model can perform well if the single-feature ranking rates are reasonably high.
Author Contributions
Conceptualization, M.L. and S.M.N.; methodology, M.L. and A.P.; software, S.M.N.; validation, S.M.N. and A.C.; formal analysis, A.P.; investigation, A.C.; resources, M.L.; writing—original draft preparation, S.M.N.; writing—review and editing, A.P. and M.L.; visualization, M.L. and A.C.; supervision, A.P.; project administration, A.C.; funding acquisition, A.P. All authors have read and agreed to the published version of the manuscript.
Funding
This work is supported by BK21 Four Project, AI-Driven Convergence Software Education Research Program 4199990214394 2, and also supported by the National Research Foundation of Korea 2020R1A2C101 2196.
Institutional Review Board Statement
Not applicable.
Informed Consent Statement
Not applicable.
Data Availability Statement
Samples are available from the authors.
Conflicts of Interest
The authors declare no conflict of interest.
References
- Fujita, H. Microactuators and micromachines. Proc. IEEE 1998, 86, 1721–1732. [Google Scholar] [CrossRef]
- Roope, R.; Ismo, R.; Päivi, M.; Katri, S.; Jussi, R.; Ahmed, F. Human Augmentation: Past, Present and Future. Int. J. Hum.-Comput. Stud. 2019, 131, 131–143. [Google Scholar]
- Strickland, E. A bionic nose to smell to the roses again. IEEE Spectr. 2022, 59, 22–27. [Google Scholar]
- Dutta, B. Eavesdropping on the brain. IEEE Spectr. 2022, 6, 32–35. [Google Scholar]
- Connie, W.T. Heart Disease and Stroke Statistics—2022 Update: A Report From the American Heart Association. Circulation 2022, 145, e153–e639. [Google Scholar]
- Christodoulides, N. Programmable Bio-NanoChip Technology for the Diagnosis of Cardiovascular Disease at the Point of Care. MDCVJ 2012, 8, 6–12. [Google Scholar] [CrossRef] [PubMed]
- Tiny Microchip Monitoring Heart Failure Patients at Home. Available online: https://today.uconn.edu/2017/10/tiny-microchip-monitoring-heart-failure-patients-home/ (accessed on 17 October 2017).
- Tariq, T.; Khushal, S.S.; Lee, Y. Automatic Multimodal Heart Disease Classification using Phonocardiogram Signal. In Proceedings of the IEEE International Conference on Big Data, Atlanta, GA, USA, 10–13 December 2020; pp. 3514–3521. [Google Scholar] [CrossRef]
- Sharma, A.; Pal, T.; Jaiswal, V. Heart disease prediction using convolutional neural network. In Cardiovascular and Coronary Artery Imaging; El-Baz Ayman, S., Jasjit Suri, S., Eds.; Academic Press: Cambridge, MA, USA, 2022; pp. 245–272. [Google Scholar]
- Dutta, A.; Batabyal, T.; Basu, M.; Scott, T.A. An efficient convolutional neural network for coronary heart disease prediction. Expert Syst. Appl. 2022, 159, 113408. [Google Scholar]
- Arooj, S.; Rehman, S.; Imran, A.; Almuhaimeed, A.; Alzahrani, A.K.; Alzahrani, A. A Deep Convolutional Neural Network for the Early Detection of Heart Disease. Biomedicines 2022, 10, 2796. [Google Scholar] [CrossRef]
- Chicco, D.; Jurman, G. Machine learning can predict survival of patients with heart failure from serum creatinine and ejection fraction alone. BMC Med. Inform. Decis. Mak. 2020, 20, 1–16. [Google Scholar] [CrossRef] [PubMed]
- Tanvir, A.; Munir, A.; Sajjad, H.B.; Aftab, M.; Muhammad, A.R. Survival analysis of heart failure patients: A case study. PLoS ONE 2017, 12, e0181001. [Google Scholar] [CrossRef]
- Ignatev, N.A. On Nonlinear Transformations of Features Based on the Functions of Objects Belonging to Classes. Pattern Recognit. Image Anal. 2021, 31, 197–204. [Google Scholar] [CrossRef]
- Ignatev, N.A. Structure choice for relations between objects in metric classification algorithms. Pattern Recognit. Image Anal. 2018, 28, 695–702. [Google Scholar] [CrossRef]
- Ignatev, N.A.; Madrakhimov, S.F.; Saidov, D.Y. Stability of Object Classes and Selection of the Latent Features. IJTES 2017, 4. [Google Scholar] [CrossRef]
- Ignatev, N.A.; Mirzaev, A.I. The intelligent health index calculation system. Pattern Recognit. Image Anal. 2016, 26, 114–118. [Google Scholar] [CrossRef]
- Markelle, K.; Rachel, L.; Kolby, N. The UCI Machine Learning Repository. Available online: http://archive.ics.uci.edu/ml (accessed on 1 November 2022).
- Madrakhimov, S.; Rozikhodjaeva, G.; Makharov, Q.T. The use of data mining methods for estimating of vascular aging. Atherosclerosis 2020, 315, e13513. [Google Scholar] [CrossRef]
- Makharov, Q.T.; Rozikhodjaeva, G.; Madrakhimov, S.; Ikramova, Z. The choice of informative signs for classification of atherosclerotic burden of carotid arteries. Diagn. Radiol. Radiother. 2022, 13, 189–190. [Google Scholar]
- David, M.W. Evaluation: From Precision, Recall and F-Factor to ROC, Informedness, Markedness & Correlation; Technical Report SIE-07-001; University of South Australia: Adelaide, Australia, 2008. [Google Scholar]
- Pedregosa, F.; Varoquaux, G.; Gramfort, A.; Michel, V.; Thirion, B.; Grisel, O.; Blondel, M.; Prettenhofer, P.; Weiss, R.; Dubourg, V.; et al. Scikit-learn: Machine Learning in Python. J. Mach. Learn. Res. 2011, 12, 2825–2830. [Google Scholar]
- Tin, K.H. Random Decision Forest. In Proceedings of the 3rd International Conference on Document Analysis and Recognition, Montreal, QC, Canada, 14–16 August 1995. [Google Scholar]
Figure 1.
Modern healthcare structure comprising the internet, wearables, implants, and AI medical helpers.
Figure 1.
Modern healthcare structure comprising the internet, wearables, implants, and AI medical helpers.

Table 1.
Description of features of the heart failure dataset.
| # | Name of Feature | Type of Feature |
|---|---|---|
| 1 | Age of the patient (Age) | Integer |
| 2 | The patient has or does not have anemia (Anemia) | Yes/no |
| 3 | Level of creatinine phosphokinase enzyme in the blood (mcg/L) (Creatinine phosphokinase) | Real |
| 4 | The patient has or does not have diabetes (Diabetes) | Yes/no |
| 5 | The patient has or does not have hypertension (High blood pressure) | Yes/no |
| 6 | Percentage of blood leaving the heart at each contraction (Ejection fraction) | Real |
| 7 | Platelets in the blood (kiloplatelets/mL) (Platelets) | Real |
| 8 | Male or female (Sex) | Binary |
| 9 | Level of serum creatinine in the blood (mg/dL) (Serum creatinine) | Real |
| 10 | Level of serum sodium in the blood (mEq/L) (Serum sodium) | Real |
| 11 | The patient smokes or does not smoke (Smoking) | Yes/no |
| 12 | The follow-up period in days (Period) | Integer |
| 13 | The patient deceased or survived during the follow-up period | Target (Death/Survived) |
Table 2.
Examples of raw values with the target event.
| The raw objects | ||||||||||||||||||||
| Time periods | 41 | 58 | 85 | 65 | 69 | 60 | 70 | 42 | 75 | 55 | 70 | 67 | 60 | 79 | 59 | 51 | 55 | 65 | 44 | 57 |
| Target values | 0 | 0 | 1 | 0 | 1 | 1 | 0 | 0 | 0 | 0 | 0 | 0 | 1 | 0 | 1 | 0 | 0 | 0 | 0 | 0 |
| The sorted objects | ||||||||||||||||||||
| Time periods | 41 | 42 | 44 | 51 | 55 | 55 | 57 | 58 | 59 | 60 | 60 | 65 | 65 | 67 | 69 | 70 | 70 | 75 | 79 | 85 |
| Target values | 0 | 0 | 0 | 0 | 0 | 0 | 0 | 0 | 1 | 1 | 1 | 0 | 0 | 0 | 1 | 0 | 0 | 0 | 0 | 1 |
Table 3.
The average ranked importance of features derived from Equation (3) for 1000 executions.
Table 3.
The average ranked importance of features derived from Equation (3) for 1000 executions.
| Feature | Rank by Equation (3) | t | Precision | Recall | Score | Accuracy |
|---|---|---|---|---|---|---|
| Period | 0.52 | −1 | 0.84/0.83 | 0.65/0.64 | 0.73/0.72 | 0.85/0.84 |
| Serum creatinine | 0.34 | 1 | 0.63/0.60 | 0.48/0.46 | 0.54/0.51 | 0.74/0.72 |
| Ejection fraction | 0.33 | −1 | 0.57/0.55 | 0.52/0.50 | 0.54/0.52 | 0.71/0.71 |
| Serum sodium | 0.30 | −1 | 0.50/0.48 | 0.48/0.46 | 0.49/0.46 | 0.68/0.67 |
| Age | 0.30 | 1 | 0.50/0.48 | 0.43/0.42 | 0.46/0.44 | 0.68/0.67 |
| Platelets in the blood | 0.26 | −1 | 0.40/0.35 | 0.38/0.33 | 0.39/0.33 | 0.62/0.59 |
| High blood pressure | 0.26 | 1 | 0.37/0.37 | 0.41/0.40 | 0.39/0.38 | 0.59/0.58 |
| Anemia | 0.25 | −1 | 0.36/0.35 | 0.48/0.47 | 0.41/0.40 | 0.55/0.55 |
| Creatinine phosphokinase | 0.25 | 1 | 0.35/0.28 | 0.46/0.37 | 0.40/0.32 | 0.56/0.50 |
| Diabetes | 0.25 | −1 | 0.33/0.28 | 0.52/0.45 | 0.40/0.34 | 0.51/0.46 |
| Sex | 0.25 | 1 | 0.33/0.28 | 0.50/0.43 | 0.39/0.33 | 0.52/0.47 |
| Smoking | 0.24 | 1 | 0.33/0.29 | 0.58/0.51 | 0.41/0.36 | 0.49/0.45 |
Table 4.
Numerical experiments on the heart failure dataset using scikit-learn.
| Model | Precision | Recall | Score | Accuracy |
|---|---|---|---|---|
| SVM | 0.80/0.82 | 0.65/0.65 | 0.72/0.72 | 0.80/0.84 |
| MLP | 1.00/0.61 | 1.00/0.58 | 1.00/0.59 | 1.00/0.74 |
| kNN (3-neighbors) | 0.88/0.64 | 0.51/0.32 | 0.65/0.41 | 0.82/0.72 |
| Nearest neighbor | 1.00/0.48 | 1.00/0.38 | 1.00/0.42 | 1.00/0.66 |
| Random Forest | 0.93/0.85 | 0.74/0.65 | 0.83/0.73 | 0.90/0.85 |
| Gradient Boosting Classifier | 1.00/0.76 | 1.00/0.72 | 1.00/0.73 | 1.00/0.83 |
Table 5.
Group prediction results for 100 executions.
| Feature Group | Rank by Equation (3) | Precision | Recall | Score | Accuracy |
|---|---|---|---|---|---|
| Period, Serum creatinine | 0.52 | 0.80/0.76 | 0.68/0.65 | 0.74/0.70 | 0.84/0.82 |
| Period, Serum creatinine, Ejection fraction | 0.53 | 0.80/0.79 | 0.70/0.69 | 0.75/0.73 | 0.85/0.84 |
| Period, Serum creatinine, Ejection fraction, Serum sodium | 0.53 | 0.81/0.78 | 0.69/0.67 | 0.74/0.72 | 0.85/0.83 |
| Period, Serum creatinine, Ejection fraction, Serum sodium, Age | 0.55 | 0.77/0.75 | 0.76/0.74 | 0.77/0.74 | 0.85/0.83 |
| Period, Serum creatinine, Ejection fraction, Serum sodium, Age, Platelets in the blood | 0.54 | 0.81/0.78 | 0.70/0.68 | 0.75/0.73 | 0.85/0.84 |
| Period, Age, High blood pressure | 0.48 | 0.72/0.53 | 0.71/0.76 | 0.71/0.62 | 0.82/0.71 |
| Period, Age, High blood pressure, Sex, Smoking | 0.48 | 0.74/0.42 | 0.69/0.89 | 0.71/0.57 | 0.82/0.58 |
Disclaimer/Publisher’s Note: The statements, opinions and data contained in all publications are solely those of the individual author(s) and contributor(s) and not of MDPI and/or the editor(s). MDPI and/or the editor(s) disclaim responsibility for any injury to people or property resulting from any ideas, methods, instructions or products referred to in the content. |
© 2023 by the authors. Licensee MDPI, Basel, Switzerland. This article is an open access article distributed under the terms and conditions of the Creative Commons Attribution (CC BY) license (https://creativecommons.org/licenses/by/4.0/).
Share and Cite
MDPI and ACS Style
Lolaev, M.; Naik, S.M.; Paul, A.; Chehri, A. Heuristic Weight Initialization for Diagnosing Heart Diseases Using Feature Ranking. Technologies 2023, 11, 138. https://doi.org/10.3390/technologies11050138
AMA Style
Lolaev M, Naik SM, Paul A, Chehri A. Heuristic Weight Initialization for Diagnosing Heart Diseases Using Feature Ranking. Technologies. 2023; 11(5):138. https://doi.org/10.3390/technologies11050138
Chicago/Turabian StyleLolaev, Musulmon, Shraddha M. Naik, Anand Paul, and Abdellah Chehri. 2023. "Heuristic Weight Initialization for Diagnosing Heart Diseases Using Feature Ranking" Technologies 11, no. 5: 138. https://doi.org/10.3390/technologies11050138
Note that from the first issue of 2016, this journal uses article numbers instead of page numbers. See further details here.