Article

Trajectory Predictor and Conflict Detection Figures of Merit for a Performance-Based Adaptive Air Traffic Monitoring System

by
Chen Xia
1,2,*,
Christian Eduardo Verdonk Gallego
2,
Adrián Fabio Bracero
3,
Víctor Fernando Gómez Comendador
1 and
Rosa María Arnaldo Valdés
1
1
Aeronautical Systems, Air Transport and Airports Department, Universidad Politécnica de Madrid, 28040 Madrid, Spain
2
CRIDA A.I.E., 28022 Madrid, Spain
3
EUROCONTROL Innovation Hub (EIH), 91222 Bretigny-Sur-Orge, France
*
Author to whom correspondence should be addressed.
Aerospace 2024, 11(2), 155; https://doi.org/10.3390/aerospace11020155
Submission received: 27 December 2023 / Revised: 31 January 2024 / Accepted: 13 February 2024 / Published: 15 February 2024
(This article belongs to the Special Issue Advances in Avionics and Astrionics Systems)

Abstract

:
This paper investigates the impact of trajectory predictor performance on the encounter probability generated by an adaptive conflict detection tool and examines the flexibility of the tool dependent on its adjustable thresholds, using historical radar track data. To achieve these objectives, two figures of merit were proposed: System Dynamic Range and System Tuning Envelope. To examine the conflict detection’s performance variability under different uncertainty levels and predictor types, simple multi-horizon trajectory predictors trained with two machine learning techniques of different characteristics are assessed at various look-ahead times: extreme gradient boosting with a discrete nature and a multi-layer perceptron regressor with a continuous nature. The results highlight the interdependence between the performances of the trajectory predictor and the conflict detector, and the quantification of this relationship can be represented through a sigmoid function. In addition, the two proposed figures of merit are effective for selecting suitable operating points in an adaptive conflict detector, based on dynamic thresholds and the performance requirements necessary for the trajectory predictors to achieve the expected detection performance at different look-ahead time.

1. Introduction

The accommodation of increasing levels of air traffic has long been limited by the insufficient capacity of the ATM (Air Traffic Management) system, leading to a significant number of delays caused by air traffic flow and management capacity constraints. This not only results in longer flight times but also contributes to increased fuel consumption and emissions [1].
The COVID-19 pandemic caused a significant drop in air traffic, but as the global situation improved, traffic now is rising once again to pre-pandemic levels [2]. To meet the increasing demand, airspace capacity must increase. Capacity increments can be approached from various perspectives. The main driver of capacity limits is the workload of air traffic controllers (ATCos). The workload of ATCos is tied to the tasks they perform during their shifts, and it varies based on the number of flights within their sector and the level of complexity each flight presents [3]. For example, in an en-route sector, a flight may only require minimal attention if it is simple to monitor, or it may require a significant amount of attention if it interacts with other flights and potentially causes conflicts that require additional clearances [4,5]. Therefore, employing additional supporting tools for ATCos to handle potential conflicts has long stood as one of the solutions to reduce workload and increase sector capacity.
Efforts are underway, particularly through the SESAR 3 Joint Undertaking programme in Europe and the NextGen program in the United States, to address this challenge. In particular, a project of the SESAR programme, PJ18-W2 4DSkyways, developed a solution named “Improved Ground Trajectory Predictions enabling future automation tools”, which aimed to increase the quality of separation management service. The primary objective of the solution was to validate enhanced conflict detection and resolution (CDR) tools, rooted in the improvement of the performance of ground trajectory predictors (TPs), thereby enhancing the overall quality of service [6]. The present paper was developed within this project. Therefore, this paper presents metrics to assess the interrelation between the performance of TPs and CDs (Conflict Detectors), to facilitate establishing performance requirements for TP services to support the separation management function.
The sections of this paper are arranged as follows: Section 1 includes a brief introduction and Section 1.1 presents a literature review of the related topic; the methodology adopted for the construction of the TP and CD tools and proposed figures of merit is described in Section 2, including the outline of the selected use case for the analysis; the results of the figures of merit are displayed in Section 3; and finally, the findings of this work and the next steps are summarised in Section 4.

1.1. The State of the Art

A study carried out by EUROCONTROL Experimental Centre using fast time simulation demonstrated that, when controllers are equipped with conflict detection tools such as medium-term conflict detection (MTCD) and a tactical controller tool with a perfect accuracy level, their task load is reduced by up to 21%, leading to a more balanced distribution of task load between planner and tactical controllers [7]. Consequently, one viable approach to reducing air traffic controller workload and increasing capacity is to provide them with more advanced decision support tools (DSTs) for CDR [8].
However, CDR functionality is dependent on an accurate trajectory prediction. As a result, the performance of the CDR tool and the overall ATC (Air Traffic Control) system is directly impacted by the accuracy of the TP [8].
Trajectory prediction was defined in [9] as the process that estimates a future trajectory of an aircraft through computation, and it is performed by a trajectory predictor. The TP can adopt various methodological approaches [10]. Ref. [11] conducted a general review of 282 papers, with a detailed examination of 20 of them. These selected studies showcased diverse methodologies, including mathematical models such as point-mass models with the BADA (Base of aircraft data) database [12], kinematic models, and kinetic models, among others. Recent studies have facilitated the integration of novel input sources and methodologies. Regarding data, the inclusion of onboard information through extended projected profiles enables prediction enhancement [13]. Regarding the method, the utilisation of data-driven predictors trained using machine learning (ML) algorithms has become widespread in present times [14,15]. These ML techniques have exhibited superior performances to conventional methods, given an appropriate dataset and training pipeline [16].
Predictions are always subject to error. The inaccuracies of predictions stem from diverse sources, leading to a high level of uncertainty [17,18,19,20], and their applicability depends on the operational context [21]. The consideration of this uncertainty is crucial in decision-making processes within ATM. High uncertainty leads to an amplification of the workload, due to the increasing need to monitor potential conflicts, an increase in both false and missed alerts [19,22], and results in more drastic clearances at a small look-ahead time (LAT) [23]. On the contrary, low uncertainty implies high reliability, enabling anticipated resolutions.
Ehrmanntraut [22] highlighted the importance of considering the uncertainty of trajectory prediction in conflict detection tools. CDR tools generally operate by identifying the breach of minimum separation between two aircraft, indicated by a specific measure falling below a predetermined threshold. The commonly used approach involves projecting the trajectory over a specified look-ahead time and determining if the two aircraft will lose separation by evaluating the probability of their relative distance being below a previously set threshold for each time point in the series [24].
Regarding the requirements of TP and CDR, basic metrics to evaluate TP performance encompass longitudinal, lateral, and vertical prediction error [25]. In [26], Mondoloni introduced a framework to define metrics, providing a list of metrics for assessing TP performance and presenting the system operating characteristics (SOC) curve, which depicts the trade-off between false alert (FA) and missed alert (MA) of a CD tool. Additionally, Schuster et al. [8] conducted a review on the requirements of TP and CDR for each element of the SESAR Concept of Operations and proposed performance metrics such as TP accuracy, TP integrity, CD false alert, and CD integrity.
Concerning the link between TP and CDR, ref. [27] proposed a methodology for the functional verification and performance validation of TPs. The proposed process categorises TP requirements into two groups: direct and indirect. Direct requirements are directly related to the TP itself, such as prediction accuracy, while indirect requirements relate to the impact on the overall system performance, like meeting the required CDR performance. Ref. [27] highlighted the difficulty in validating indirect TP requirements using recorded radar track data, primarily due to controller-issued clearances for deconfliction, which complicate the computation of false alerts and positive alerts. Therefore, ref. [27] proposed a validation approach relying on simulations that have a high level of fidelity, although the cost is expensive.
Many studies have used simulations to assess the impact of TP accuracy on CD performance. Ref. [28] evaluated the relationship between different levels of longitudinal error and the performance of a conflict probe using Monte Carlo simulations, and ref. [29] used simulations with a time shift from [30] to emulate conflict events, evaluating several scenarios of different TP accuracy levels using the hit rate and the FA rate. The latter study led to the conclusion that the conflict probe performance depends on TP accuracy, showcasing reduced false alarm rates and increased true positive rates as TP accuracy improves. Furthermore, the CD performance was estimated using a linear regression function based on TP accuracy.
Based on the SOC curve [26] and the conflict probability [24], this study proposes quantitative figures of merit using historical traffic data to evaluate the influence of TP performance on the encounter probability of a dynamic CD tool, without the need for expensive simulation effort. Apart from revealing their relation, these metrics inform the selection of the operating point of the CD for different LATs, based on the trade-off between false alerts and missed alerts, establishing requirements for TP performance and CD settings.
In this context, an encounter is considered to be a state which may develop into a loss of separation between two flights in the absence of ATCos intervention, and dynamic CD refers to a detection tool with dynamic variables in the setting capable of adjusting its operational performance to meet task-specific requirements.
Two TPs trained with different ML algorithms are selected for comparative evaluation regarding TP accuracy and prediction stability: extreme gradient boosting (XGB), a member of boosting algorithm family, and a multi-layer perceptron regressor (MLP), a type of artificial neural network.
This paper focuses on analysing the dependency between the performance of TPs and CDs, considering performance in terms of their accuracy and stability. The impact of accuracy is quantitatively assessed with two figures of merit, each supporting the selection of operating points in adaptive CD and defining performance requirements.

2. Methodology

This section provides an overview of the trajectory predictor and conflict detector tools developed for the analysis, including the corresponding figures of merit to assess their performance and their relationships. As the analysis focuses on the horizontal plane, the predictor is referred to as the horizontal trajectory predictor (HTP). To facilitate comprehension, the nomenclature used in this paper is summarised in Table 1, Table 2, Table 3 and Table 4.
In this study, the measures are derived from the time separation at a specified location where minimum separation will be violated if both aircraft arrive concurrently, based on one of the cognitive abstractions of air traffic control operators (ATCOs) [4], who concentrate on critical points in an air traffic sector. Consequently, the probabilistic definition of that metric between two aircraft also considers uncertainty in the temporal dimension instead of the spatial dimension. This perspective was explored in [23].
Hence, the primary reference variable for the models is γ , which represents the arc-length along the trajectory of each pattern [23].

2.1. Horizontal Trajectory Predictor

The HTPs trained in this study are termed multi-horizon HTPs; this term refers to trajectory predictors that can update the prediction in accordance with variations in current position information by updating the inputs accordingly. This unique characteristic enables the assessment of performance at various positions without requiring the training of multiple individual predictors.
The objective of the HTP is to predict the time a flight requires ( t ^ γ , γ p ) to reach a given distance γ from the current position γ p . The inputs include the following:
  • aircraft characteristics: wake vortex (WV);
  • information collected at the current position: current position ( γ p ), current flight level ( F L p ), current speed ( v p ) and elapsed time from the entry ( t p );
  • target point: distance from current location to the target distance for prediction ( δ γ ).
Regarding training, each identified traffic flow possesses its own predictor. As pointed out in [31], each flow exhibits recurring patterns—with the most commonly flown trajectories within it—with the planned route being one of them. Hence, it is worth noting that the same γ can refer to different geographic coordinates, depending on the specific pattern and flow that are being considered, as shown in Figure 1. However, for each recurrent pattern, the relation between the coordinates and γ is bijective.
The left-hand side of Figure 1 illustrates the concept of traffic flow, with two recurrent patterns for a single flow, and depicts the bijective relation between γ and the geographical coordinates, varying according to the pattern. The right hand side of Figure 1 shows the concept of multi-horizon HTP, which depends on the current position and the target point.
The entry to the sector is considered to be the starting point of the trajectory of analysis. When a flight reaches its entry point at instance T e , its current position or elapsed distance within the sector γ p is 0 NM, and its associated elapsed time of entry t e is also 0 s. As the flight progresses, its position γ p changes accordingly, along with the associated elapsed time t p .
To present performance differences and their implications, two multi-horizon HTPs were trained using different types of ML algorithms that used the same features:
  • Extreme gradient boosting regressor: a tree-based algorithm capable of providing reasonable performance with a small training sample. This HTP is referred to as XGB-HTP.
  • Multi-layer perceptron regressor: a feed-forward artificial neural network (ANN). This HTP is referred to as MLP-HTP.

2.2. Conflict Detector

The aim of the CD tool is to detect flight pairs that could evolve into an encounter without ATCo intervention. Each identified flight pair is considered as potential conflict. This paper only considers flight pairs that belong to different traffic flows, excluding potential conflicts within the same flow.
The CD used for the study has three user-defined thresholds, namely distance ( d T H R ), time ( t T H R ), and probability ( P T H R ), for its functioning. The latter two parameters are always modifiable, while d T H R is immutable during the functioning of the tool; it can only be set at the configuration phase. The incorporation of the two dynamic variables within the system architecture endows the CD tool with adaptive capabilities, enabling it to adjust its responses to meet different operational needs.
The CD tool identifies potential conflicts by calculating the time separation between two flights at their critical area (CA), a specific spatial location where an infringement in horizontal separation occurs if two aircraft arrive simultaneously or with small time separation. This is inherent information for the CD tool that is calculated based on the recurrent patterns of flow pairs. Thus, a critical area between the pattern i of a flow and the pattern j of another flow ( C A i , j ) is an area that contains a set of tuples of two values of γ - one for each flow - where the horizontal separation is below the selected distance threshold ( d T H R ). Each tuple is a critical point (CP), C P k i , j , and the number of CPs depends on the convergence between the two pattern trajectories.
Let us consider two flights: Flight 1 ( f 1 ) as the first flight entering the sector of analysis, and Flight 2 ( f 2 ) as the second. The mathematical representation of the critical area is provided as follows in Equation (1):
C A i , j = C P 1 i , j C P 2 i , j = ( γ C P 1 i , f 1 , γ C P 1 j , f 2 ) ( γ C P 2 i , f 1 , γ C P 2 j , f 2 )
The identification of the potential conflicts relies on comparing between the time separation estimated at CA and the minimum time separation ( Δ t T H R ).
As the estimated time separation is the difference between the two predictions—which has an associated uncertainty—the output of the CD tool is also a probabilistic variable. The formula for estimating the probability of conflict, presented in Equations (2)–(4), was demonstrated in [23], which resembles those demonstrated in [24] for distance-based thresholds. The probability, as estimated using Equation (2) as follows, is derived by applying the error function, denoted as erf.
P ( x Δ t T H R ) = 1 2 e r f Δ t T H R + μ 2 σ + e r f Δ t T H R μ 2 σ
Based on the previous work of [23,24], when the prediction data follows a normal distribution centred around the prediction μ with its corresponding standard deviation σ , the encounter probability is defined as the probability of the time separation falling below Δ t T H R .
Due to the probabilistic nature of the output, a probability threshold ( P T H R ) is set to select the sample of infringement notifications; flight pairs whose encounter probability is below P T H R will be notified and require attention. Therefore, given the same encounter probability, the notifications vary according to P T H R .

Conflict Detection Process

Given two flights, the evaluation of their encounter probability begins when the second flight enters the sector. Hence, the arc-length of evaluation depends on the location of f 2 ( γ p 2 ). For facilitation, the location of the evaluation is named γ p in the sections of CD ( γ p = γ p 2 ).
The detection process at the arc-length of evaluation γ p encompasses the selection of potential interacting flight pairs and the calculation of the encounter probability.
The steps to identify the flights that potentially interact with f 2 are as follows (see Figure 2A):
1.
Select the concurrent flights of f 2 ; these are the flights that are also in the sector at γ p . Figure 2A shows an example of the instant when f 2 enters the sector. The triangles represent the flights and the three coloured lines represent the recurrent patterns of f 2 ’s flow; these are possible trajectories that the flight might take. f 2 has five concurrent flights at the entry (A, B, D, E, and F), and flight C is discarded because it is still out of the sector.
2.
Select from the concurrent flights those that belong to flows that interact with f 2 ’s flow and do not belong to the same flow as f 2 . In the example of Figure 2A, A and F are discarded because A belongs to f 2 ’s flow and F does not interact with f 2 .
3.
Estimate the present location of the concurrent flights: γ p 1 .
4.
Select those flights that have not reached any of their CA with f 2 ’s flow, i.e., flights whose γ p 1 < m i n ( γ C P 1 i , f 1 , γ C P 2 i , f 1 , ) . The flights that have already overflown the critical areas will not lose separation with f 2 . In the example of Figure 2A, B has already overflown CA.
For each remaining flight f 1 , the encounter probability ( P γ p , C A i , j , Δ t T H R ) is evaluated for each pattern combination [i, j], because the pattern is unknown in advance.
1.
For each C P k i , j of the C A i , j (see Figure 2B):
(a)
Predict the time each flight crosses C P k i , j for both flights: t ^ γ p , γ C P k i , f 1 and t ^ γ p , γ C P k j , f 2 . Figure 2B takes the pattern 1 (blue lines) of flight D and f 2 , as an example. The HTP of each flow will predict the time each flight crosses the corresponding γ C P k i , f 1 ( γ C P k j , f 2 ) of each C P k i , j .
(b)
Determine the standard deviation of the following predictions: σ γ p , γ C P k i , f 1 and σ γ p , γ C P k j , f 2 .
(c)
Obtain Δ t ^ r e s , γ p , C P k i , j and the corresponding prediction error σ r e s , γ p , C P k i , j (see Equations (3) and (4), as follows).
μ = Δ t ^ r e s , γ p , C P k i , j = t ^ γ p , γ C P k i , f 1 t ^ γ p , γ C P k j , f 2
σ = σ r e s , γ p , C P k i , j = ( σ γ p , γ C P k i , f 1 ) 2 + ( σ γ p , γ C P k j , f 2 ) 2
(d)
Based on the selected Δ t T H R , evaluate P γ p , C P k i , j , Δ t T H R using Equation (2).
P γ p , C P k i , j , Δ t T H R = P ( x Δ t T H R )
2.
The final encounter probability between patterns [i,j] ( P γ p , C A i , j , Δ t T H R ) is calculated using the mean of the probabilities obtained from each C P k i , j (see Figure 2C).
Finally, flight pairs whose P γ p 2 , C A i , j , Δ t T H R exceeds P T H R are considered to be detected potential conflicts that could lead to horizontal infringement if the flights continue to follow their patterns [i,j].

2.3. Evaluation Metrics and Figures of Merits

For the assessment of HTP accuracy, the prediction errors are used. The target point for prediction is always a critical point, enabling the analysis of the encounter probability between flights.
Once evaluated, the impact of different HTP accuracies on the CD functioning is presented by two figures of merit. Beyond the quantification of the impact, each exhibits a specialised application.
The figures of merits are both defined in the Operational Service and Environment Definition (OSED) document of the project PJ18-W2 4DSkyways:
  • System dynamic range (SDR): an element to support the possible encounter classification and to prioritise resolution, as well as evaluating the performance of the CD tool. It mainly represents the impact of the HTP accuracy on the outputs of the CD tool.
  • System tuning envelope (STE): an element to facilitate the tuning of the CD tool using the parameters Δ t T H R and P T H R . It assesses the performance of the CD tool, supporting the selection of operating points.
These metrics are further detailed in Section 2.3.1, Section 2.3.2 and Section 2.3.3.

2.3.1. Horizontal Trajectory Predictor Performance Metrics

The performance of the HTP considered in this paper includes mainly the prediction accuracy, but the stability of the prediction is also analysed, with stability defined as the tendency to maintain the predictions’ consistencies over time.
The performance of the trajectory predictors is assessed by analysing the residuals of the test sample, which are the differences between the prediction ( t ^ γ p , γ ) and the real value ( t γ p , γ ), as follows:
r e s = t ^ γ p , γ t γ p , γ
Based on the residuals obtained from the test sample, the metrics that facilitate the visualisation of the performance are as follows:
  • Heatmap of residuals’ mean ( μ r e s , γ p , γ ), which represents the residual mean for each current position and possible target point. Ideally the mean is zero for every combination of γ and γ p .
  • Heatmap of residuals’ standard deviation ( σ r e s , γ p , γ ): ideally the deviation is zero for every combination of γ and γ p .

2.3.2. System Dynamic Range

Quoting the definition from the OSED: “… the dynamic range can be considered as the rates at which the conflict probability decreases as the predicted minimum separation increases…”. Hence, the SDR shows the relationship between the outputs of the TP and the CD, which are the predictions and the encounter probability, respectively. It is an extension of the system operating characteristic curves [26].
The graphical representation of the SDR is the encounter probability P γ p , C A i , j , Δ t T H R versus the peak probability-predicted time separation Δ t ^ γ p , C P m a x P i , j .
Figure 3 shows a draft of possible SDR behaviours, adapted from the OSED. Each curve represents a SDR curve using predictors of a given accuracy, from the perfect TP in red to the green curve with a large TP error. The coloured area from the highest to the lowest probability of the SDR is named transition area.
If the trajectory prediction error is large—indicating large uncertainty—the CD performance shows a slow transition from high to low encounter probabilities with a broader transition area, suggesting a low dynamic range and a shallow curve. On the contrary, high-performance predictors will exhibit steep curves and consequently, a large dynamic range and a quick transition. In the case of a perfect detection tool without error, the curve will resemble a step function, with an encounter probability equal to 100% for predictions below the “safe” time-over-difference threshold, and an abrupt drop to zero thereafter.
When the uncertainty follows a normal distribution and when considering the absolute predicted time difference, the resulting probability has a folded normal distribution [24]. Hence, the representation of the SDR should follow a S-shaped function. Based on this theoretical property, the shape of the SDR distribution can be approximated with the following logistic function:
f ( x ) = L 1 + e k ( x x 0 ) + b
The parameters that define the logistic functions are as follows:
  • L: the maximum value of the curve (b = 0) when the logistic curve is increasing, or the minimum value when it is decreasing.
  • k: the steepness of the curve.
  • b: the displacement of the curve over the y-axis.
  • x 0 : the x-axis value of the midpoint.

2.3.3. System Tuning Envelope

Due to the presence of uncertainty, conflict detection also has associated errors. Hence, a notification from the tool can be genuine or a false alert (FA), and a hidden instance can be correctly hidden or a missed alert (MA). These elements reflect the accuracy and reliability of the CD tool. STE, as a figure of merit, enables the assessment of CD accuracy using the proportion of FAs and MAs.
The adaptive conflict detector provides conflict alerts based on the estimation of the encounter probability, which depends on Δ t T H R and d T H R , and the operation threshold P T H R . Every possible interaction with an estimated probability higher than P T H R will be notified, while those with an estimated probability lower than P T H R will be filtered out.
However, P T H R is a dynamic threshold. Therefore, a low P T H R will result in a large number of notifications, including most of the genuine infringements, in exchange for overloading the controller with excessive nuisance notifications. This increases the workload and diminishes user confidence in the tool. Conversely, a high P T H R implies fewer false alerts, but risks missing critical notifications.
The conditions to detect the nuisances and missed notifications are visualised in Figure 4. The horizontal and vertical grey lines indicate the Δ t T H R . All instances falling into the green area represent real infringements, and those in the red area do not. Those on the left side of the vertical line are notified alerts, and the rest are hidden. Based on Figure 4, the following variables related to CD accuracy are derived and used for the representation of STE:
  • False alerts or nuisance: incorrectly notified alerts. Flight pairs whose real minimum separation is above the threshold ( | Δ t m i n | > Δ t T H R ) but are notified as potential conflicts because the estimated probability is above the decision threshold ( P γ p , C P m a x P i , j > P T H R ).
  • Missed alerts or missed: incorrectly hidden alerts. Flight pairs whose real minimum separation is below the threshold ( | Δ t m i n | < Δ t T H R ) but the estimated probability is below the decision threshold ( P γ p , C P m a x P i , j P T H R ).
  • True alerts (TA): correctly notified alerts. Flight pairs whose real minimum separation is below the threshold ( | Δ t m i n | < Δ t T H R ) and estimated probability is above the decision threshold ( P γ p , C P m a x P i , j > P T H R ).
  • True negative (TN): correctly filtered-out alerts. Flight pairs whose real minimum separation is above the threshold ( | Δ t m i n | > Δ t T H R ) and estimated probability is below the decision threshold ( P γ p , C P m a x P i , j P T H R ).
  • Real positive (RP) or real conflict: flight pairs whose real minimum separation is below the threshold ( | Δ t m i n | < Δ t T H R ).
The proportions of nuisance and missed alerts used in STE are calculated using the following equations:
N u i s a n c e % = F A T N + F A
M i s s e d % = M A T A + M A
The graphical representation of STE illustrates the trade-off between nuisance and missed alerts for every P T H R . These are reflected as proportions of FAs and MAs, respectively. Changes in the output notifications resulting from adjustments to P T H R are captured in the STE, which helps balance the trade-off between nuisance and missed alerts. Consequently, STE supports the selection of the most suitable operating point for the CD tool at different LATs to align with specific operational needs.

2.4. Use Cases

To demonstrate the applicability of the proposed methodology, we have selected a use case that includes a complex crossing point. This use case has been chosen based on its relevance and adequacy to highlight our methodology.
The selected use case is located in the Spanish airspace. The area of responsibility (AoR) for the analysis is LECMPAU (Pamplona Upper Sector), where the interactions between flows take place. For the planning controller of LECMPAU, adjacent sectors should also be considered. Therefore, the collapsed sector LECMBDP is selected as the area of interest (AoI) for the analysis to anticipate possible encounters. LECMBDP comprises LECMPAU, LECMBLU (Bilbao Upper Sector), and LECMDGU (Domingo Upper Sector).
Two cruising flows are considered, named F4 and F24 (see Figure 5). F4 is a northward flow with 2890 flights, and F24 is eastbound with 1432 flights. F24 interacts with F4 within the AoR, close to the boundary.
This use case was selected because the traffic densities are significant and the critical points between the flows are close to the sector boundary. Clearances issued to the flights during their crossing through BLU or DGU could induce a conflict at PAU. An incident between a similar pair of flows occurred in 2018 [32].

Evaluation Contextual Parameters

The following four parameters are considered to analyse the adaptiveness and corresponding variability in performance: the independent variable γ p and the three adjustable parameters d T H R , Δ t T H R , and P T H R .
For the analysis, the following values are selected:
  • d T H R : context threshold that influences the resulting critical area.
    1 NM.
  • Δ t T H R : internal parameter of CD that impacts the encounter probability.
    10 s, 30 s, 60 s, 90 s, and 120 s.
  • P T H R : internal parameter of CD that affects the notified alerts.
    from 0.1 to 0.99, incremented by 0.1.
  • γ p : independent variable that indicates LAT and consequently, the level of prediction error.
    0, 20, 40, 60, 80, 100, and 120 NM from the entry point in the sector of analysis.
Due to the characteristics of the two flows, flight pairs with the second flight belonging to F24 are more likely to evolve into a conflict. Therefore, the analysis is focused on these instances and along the trajectory of F24. The arc-length of evaluation ( γ p ) is referred to LECMPAU’s boundary; that is, the entry at LECMPAU is considered to be γ p = 0 NM. The planned trajectory of F24 from entry at LECMBDP to LECMPAU is 108 NM long, which equates to approximately 15 min, considering the mean required time of the traffic sample (see Figure 6).

3. Results

This section presents the results of the study, which are divided into two subsections. Section 3.1 analyses and compares the performance of the two HTPs, and Section 3.2 details the analysis of the metrics SDR and STE.

3.1. Horizontal Trajectory Predictor Performance

This subsection presents the performance comparison between the four trained HTPs for the flows F4 and F24.
For both flows, the data were partitioned, with 75% reserved for training and the remaining 25% designated as the test sample, to assess the models’ performance on unseen data. The XGB-HTPs were trained by fine-tuning their parameters, setting the depth of trees to five for F24 and six for F4, with the learning rate set to 0.055 in both cases. On the other hand, the network architecture of the MLP-HTPs consisted of two hidden layers, each with 12 neurons, and used the ReLU (Rectified Linear Unit) activation function.
Regarding the HTP accuracy, it is dependent on the current position of the flight and the prediction point; a smaller δ γ implies reduced uncertainty and increased predictability. Details of the prediction errors of the MLP and XGB-HTPs are shown in Figure 7 and Figure 8.
In each figure, columns represent flows; the top row illustrates the mean of the residuals, and the second row shows the standard deviation. Each heatmap displays a matrix containing the corresponding value for each pair of γ p and γ . As the target point γ should be larger than γ p , only values in the upper triangular area are available.
For both flows, σ r e s , γ p , γ escalates with an increase in the distance between γ p and γ because the uncertainty increases with γ , whereas μ r e s , γ p , γ predominantly fluctuates around zero. Statistically, the maximum value of σ r e s , γ p , γ across the four HTPs is comparable, approximately 28 s, while μ r e s , γ p , γ varies within a range of −6 s to 6 s.
In comparison, the difference in σ r e s , γ p , γ for F4’s HTPs is minimal. However, for F24’s HTPs, particularly when the γ p of F24 is high, σ γ p , γ is notably lower in the XGB than in the MLP model. Additionally, the deviation of μ r e s , γ p , γ from zero is more pronounced in F4.
Diverse regions are discernible in the μ r e s , γ p , γ heatmaps of the four HTPs. These areas are related to trajectory patterns and common manoeuvres of the aircraft. A contributing factor to the formation of these regions is the speed variation. Figure 9 illustrates these speed variations from the entry point to the subsequent points ( V γ p V γ p = 0 NM ) for each flight of the test sample.
Regarding the prediction stability, a clear difference between the XGB-HTPs and MLP-HTPs is evidenced by the presence of diagonal bands in XGB-HTPs heatmaps (see Figure 8), indicating prediction instability over γ . This phenomenon stems from the discrete nature of decision tree algorithms, where similar inputs ranges lead to identical prediction allocation, despite differences in the actual input values.
However, when analysing the prediction stability of particular flights, predictions of MLP-HTPs also exhibit fluctuation over γ , despite the continuous nature of the algorithm. The cause of the fluctuation could be due to various reasons, such as the non-linearity of the problem.
Figure 10 shows two flight pairs selected as examples, which present the predictions of the total time from the entry to their corresponding C P 1 1 , 1 at each γ p .
In most cases, the predictions for XGB-HTPs exhibit more variation, although MLP-HTPs also show fluctuation.

3.2. Conflict Detection

One derivation from Equation (2) is that the performance of the CD is impacted by the uncertainty of the associated predictors, which increases over γ . Consequently, the performance tendency of the CD varies for each pair of patterns.
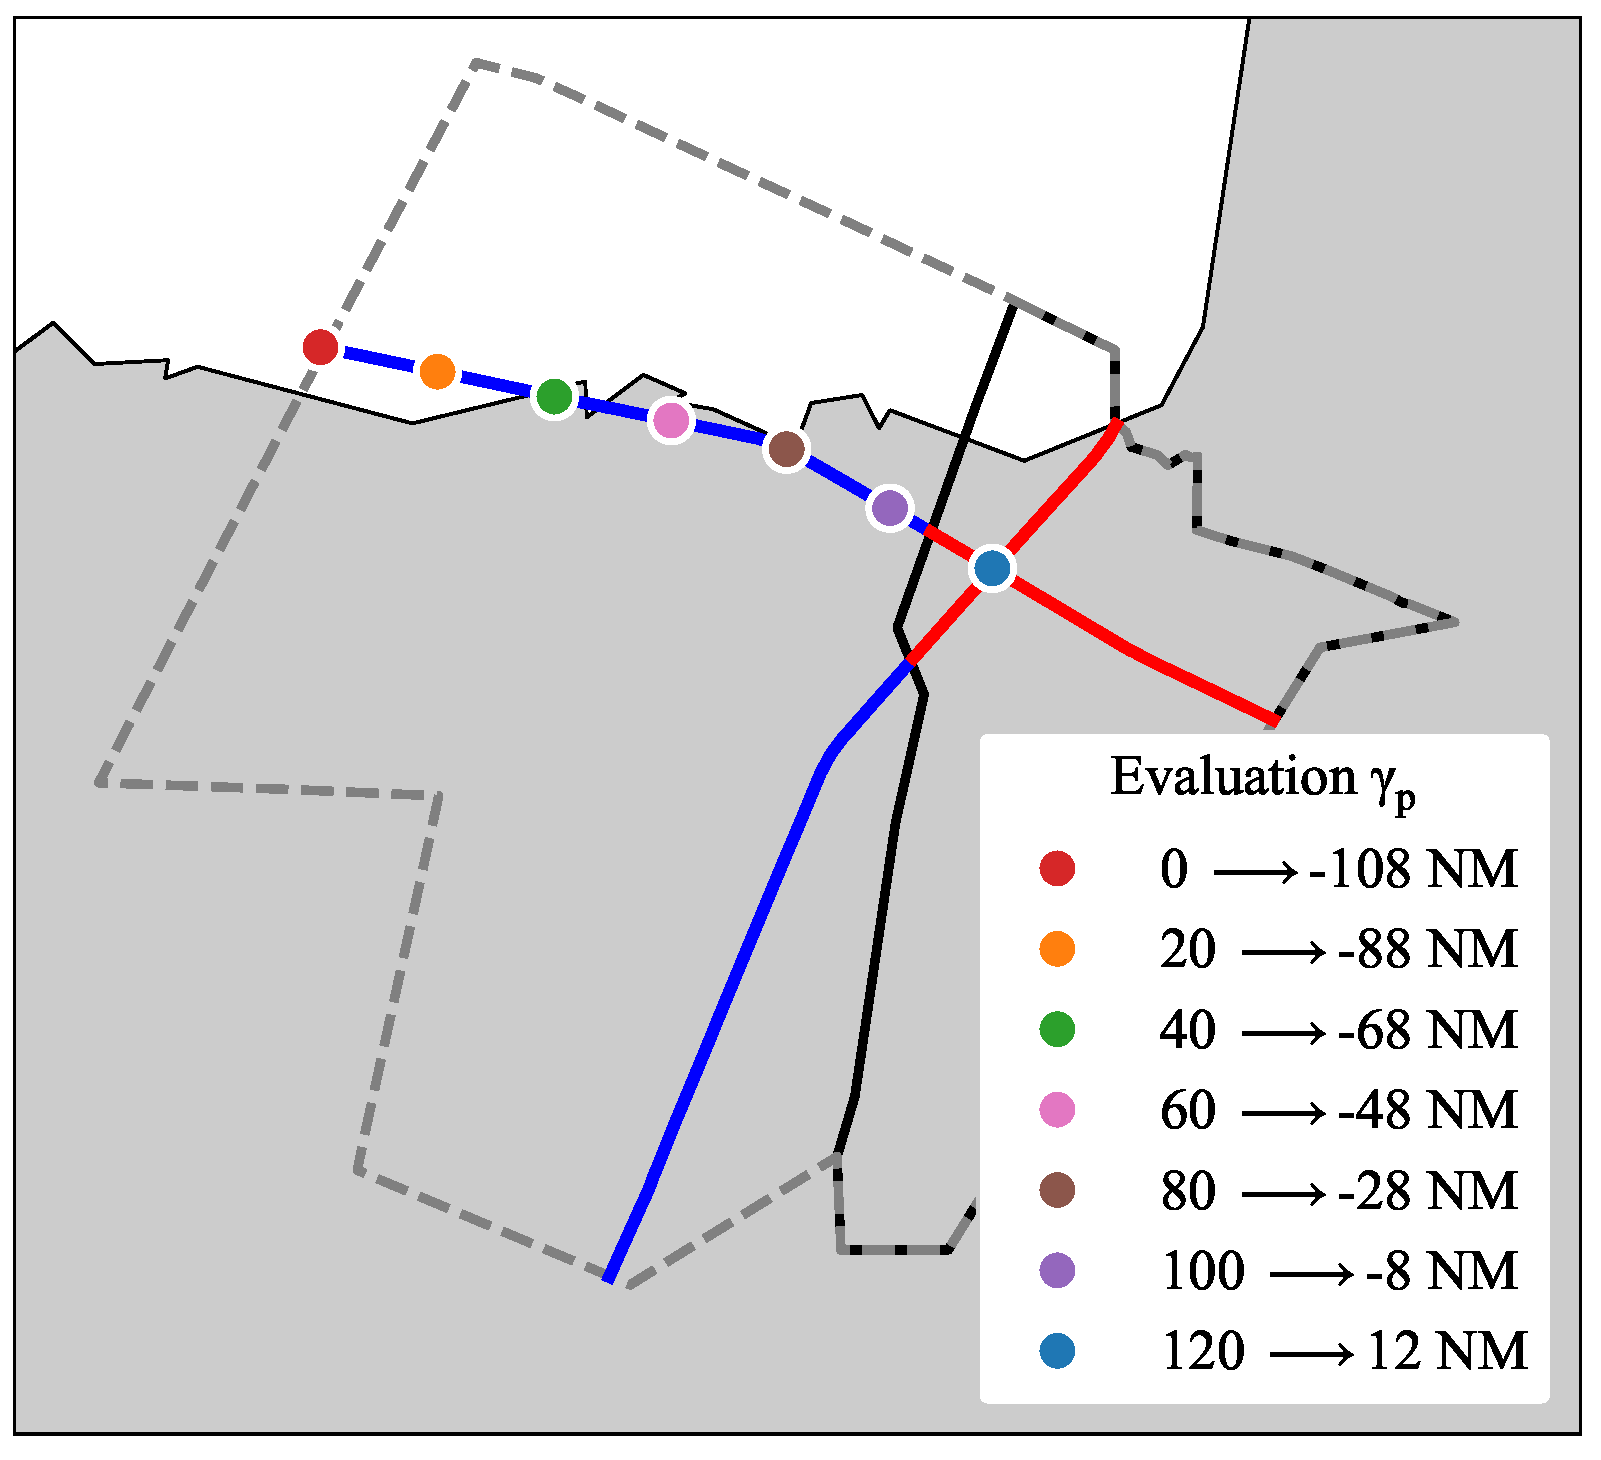
This subsection is focused on the horizontal potential conflicts between the pattern pair 1–1 of the flow pair F4–F24, where the second flight belongs to F24 (i.e., the flight of F4 is already within LECMBDP).
The CD performance is evaluated from two perspectives. Firstly, the HTP performance impact assessment considers the two differently modeled HTPs, alongside a selection of γ p , which are selected as they represent different levels of uncertainty. Secondly, the examination of the effects of dynamic thresholds involves the P T H R , which sets the notification threshold, and Δ t T H R , which influences the estimation of encounter probability.
The analyses of the metrics SDR and STE are detailed in Section 3.2.1 and Section 3.2.2.

3.2.1. System Dynamic Range

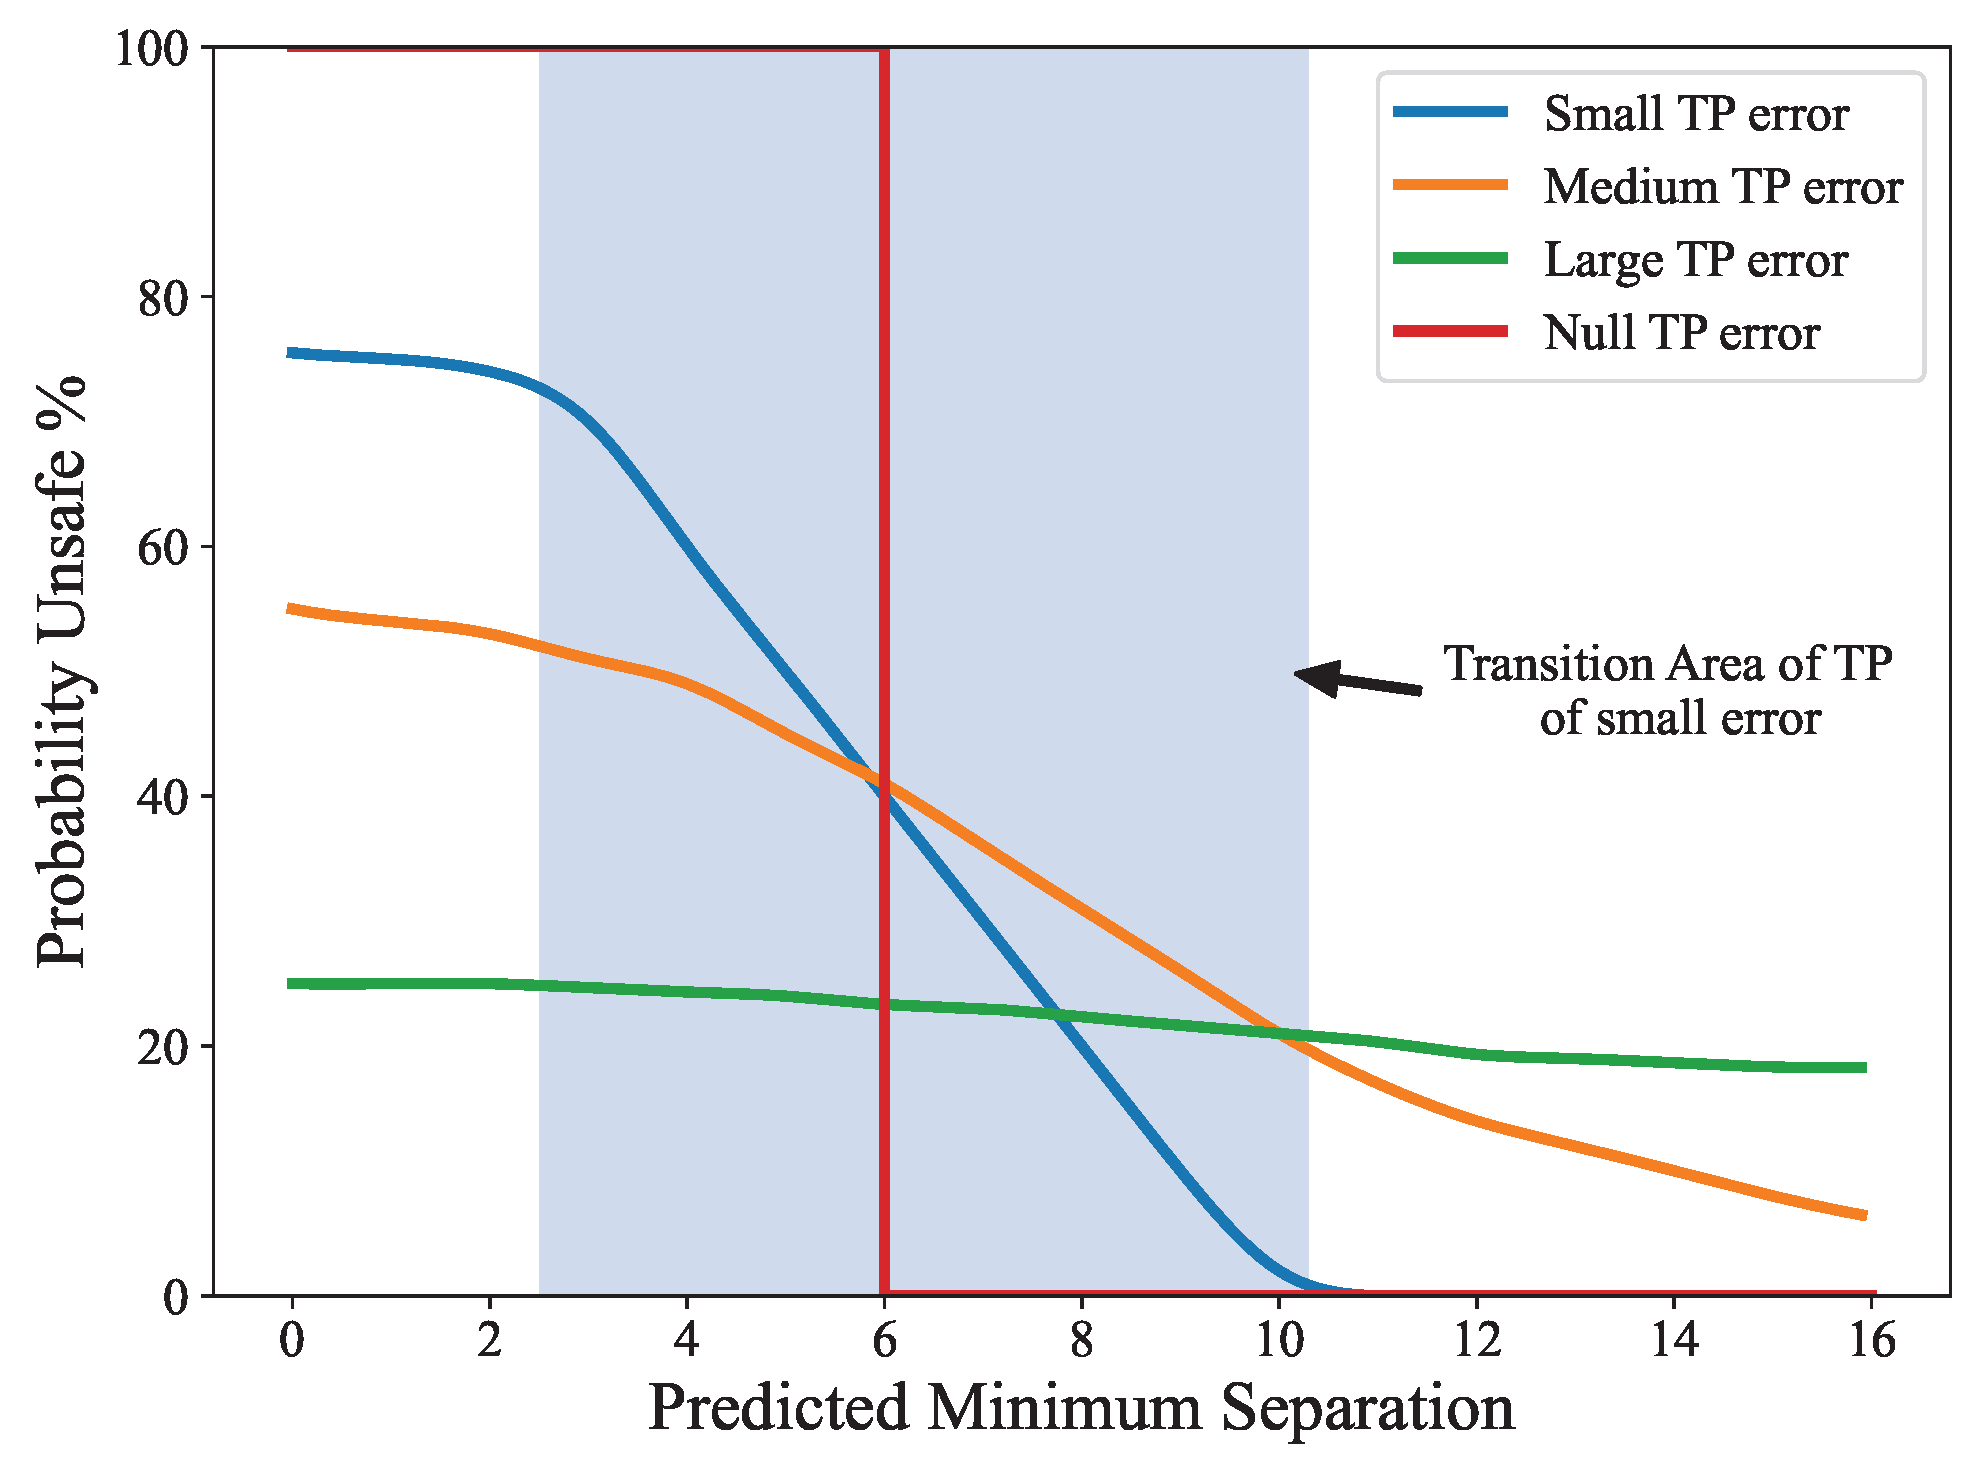
The estimated probability, and consequently the CD performance, are intimately related to the performance of the trajectory predictors used in the detection process. This dependency can be observed in the SDR graphs, which compare the predicted time separation and the estimated encounter probability.
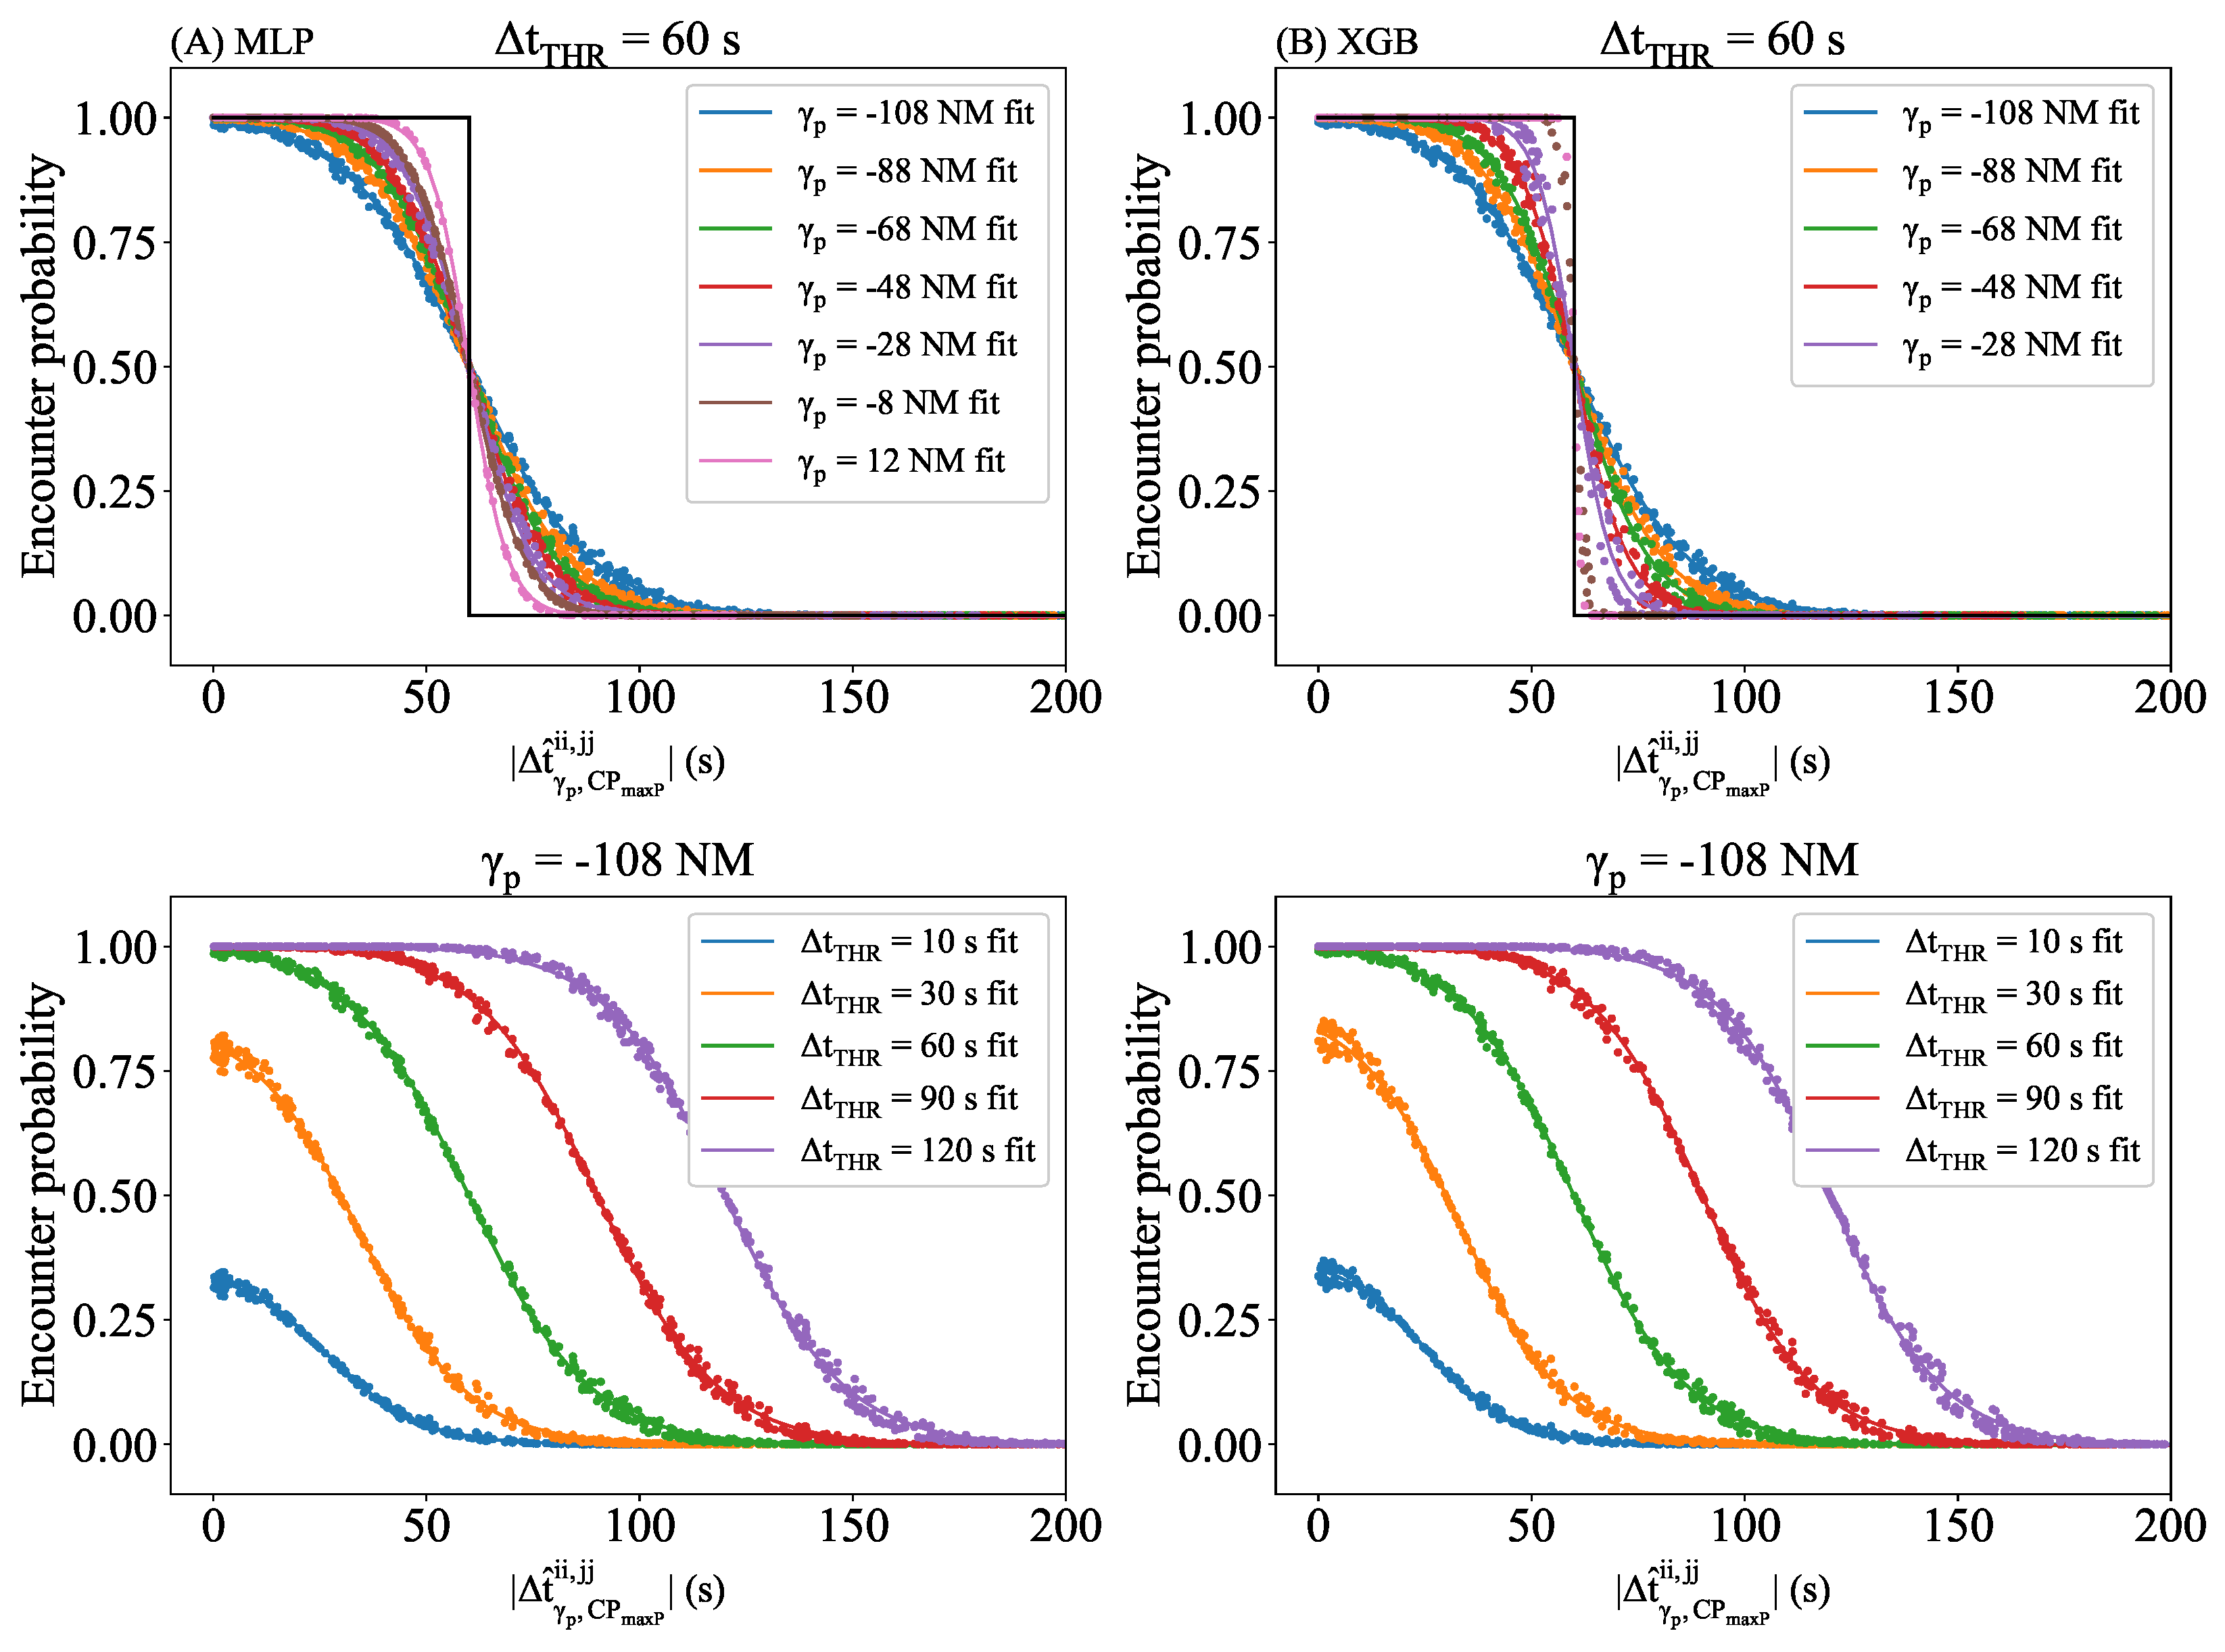
Figure 11 presents the SDR graphs of the pair F4–F24 using different HTPs, time difference thresholds, and evaluation arc-lengths. It contains four graphs. The figures of column A are obtained using MLP-HTPs whereas those for column B are obtained using XGB-HTPs. The two upper graphs show the SDR curves across γ p when Δ t T H R = 60 s, and the lower two show the variation in Δ t T H R when γ p = −108 NM (entry point at LECMBDP).
In the four graphs, each point represents a flight pair whose encounter probability P γ p , C P m a x P 1 , 1 , Δ t T H R is greater than zero. Points of the same colour form the SDR distribution of the same evaluation arc-length γ p or threshold Δ t T H R . Each distribution has its corresponding logistic fit in the same colour.
Regarding the variation by γ p , all logistic fits intersect with the black step function, which represents the ideal CD performance, around a midpoint. At this intersection, the | Δ t ^ γ p , C P m a x P 1 , 1 | is approximately Δ t T H R and the encounter probability is about 0.5. Due to the characteristic of the probability estimation formula, Equation (2) simplifies when | Δ t ^ γ p , C P m a x P 1 , 1 | = Δ t T H R , as shown in Equation (10), as follows:
P ( x Δ t T H R ) = 1 2 e r f 0 + e r f 2 Δ t T H R 2 σ = 1 2 e r f 2 Δ t T H R 2 σ
As error function is bounded within the range of −1 and 1 and Δ t T H R is positive, the resulting probability is 0.5 at this point in the distribution. Therefore, the transition area is centred around this midpoint; as | Δ t γ p , C P m a x P 1 , 1 | increasingly deviates from Δ t T H R , the resulting probabilities asymptotically approach the extremities of zero and one.
In addition, the prediction uncertainty diminishes as γ p increases, because the flights are approaching the critical point. Consequently, the SDR distribution progressively approximates ideal behaviour, characterised by a steeper slope.
Regarding the variation by Δ t T H R , it is noteworthy that the maximum probability of the SDR escalates with increasing Δ t T H R until it reaches 1. The maximum encounter probability occurs when | Δ t ^ | = 0 s, where the probability estimation (Equation (2)) simplifies to the following form:
P ( x Δ t T H R ) = 1 2 e r f Δ t T H R 2 σ + e r f Δ t T H R 2 σ = e r f Δ t T H R 2 σ
As result, the encounter probability will equal the error function of Δ t T H R 2 σ . The ideal result will be P = 1 for | Δ t ^ | = 0 s. Given the characteristics of the error function, the larger Δ t T H R 2 σ is, the closer to one the output of the error function will be. Therefore, the maximum probability achievable is determined by the selected threshold and the performance of the predictor and Δ t T H R > 2 σ is a necessary condition to approach optimum performance.
To check the condition, the highest σ r e s , γ p , γ of both flows for the first critical point are selected, which correspond to the prediction errors at their corresponding entry point (see Table 5). The σ r e s , γ p , γ of MLP-HTPs for F4 and F24 are 20.78 and 17.73 s, respectively, resulting in a σ (using Equation (4)) of 27.31 and 2 σ 38.63 . On the other side, the σ r e s , γ p , γ of XGB-HTPs are 21.15 and 15.56 s, respectively, resulting in 2 σ 37.13 . Thus, the results of both predictors reached a probability of one when the time separation equals 60 s. However, for a Δ t T H R of 10 and 30 s, the maximum probability achievable is less than one, because 2 σ > Δ t T H R , resulting in a distribution with a reduced maximum value.
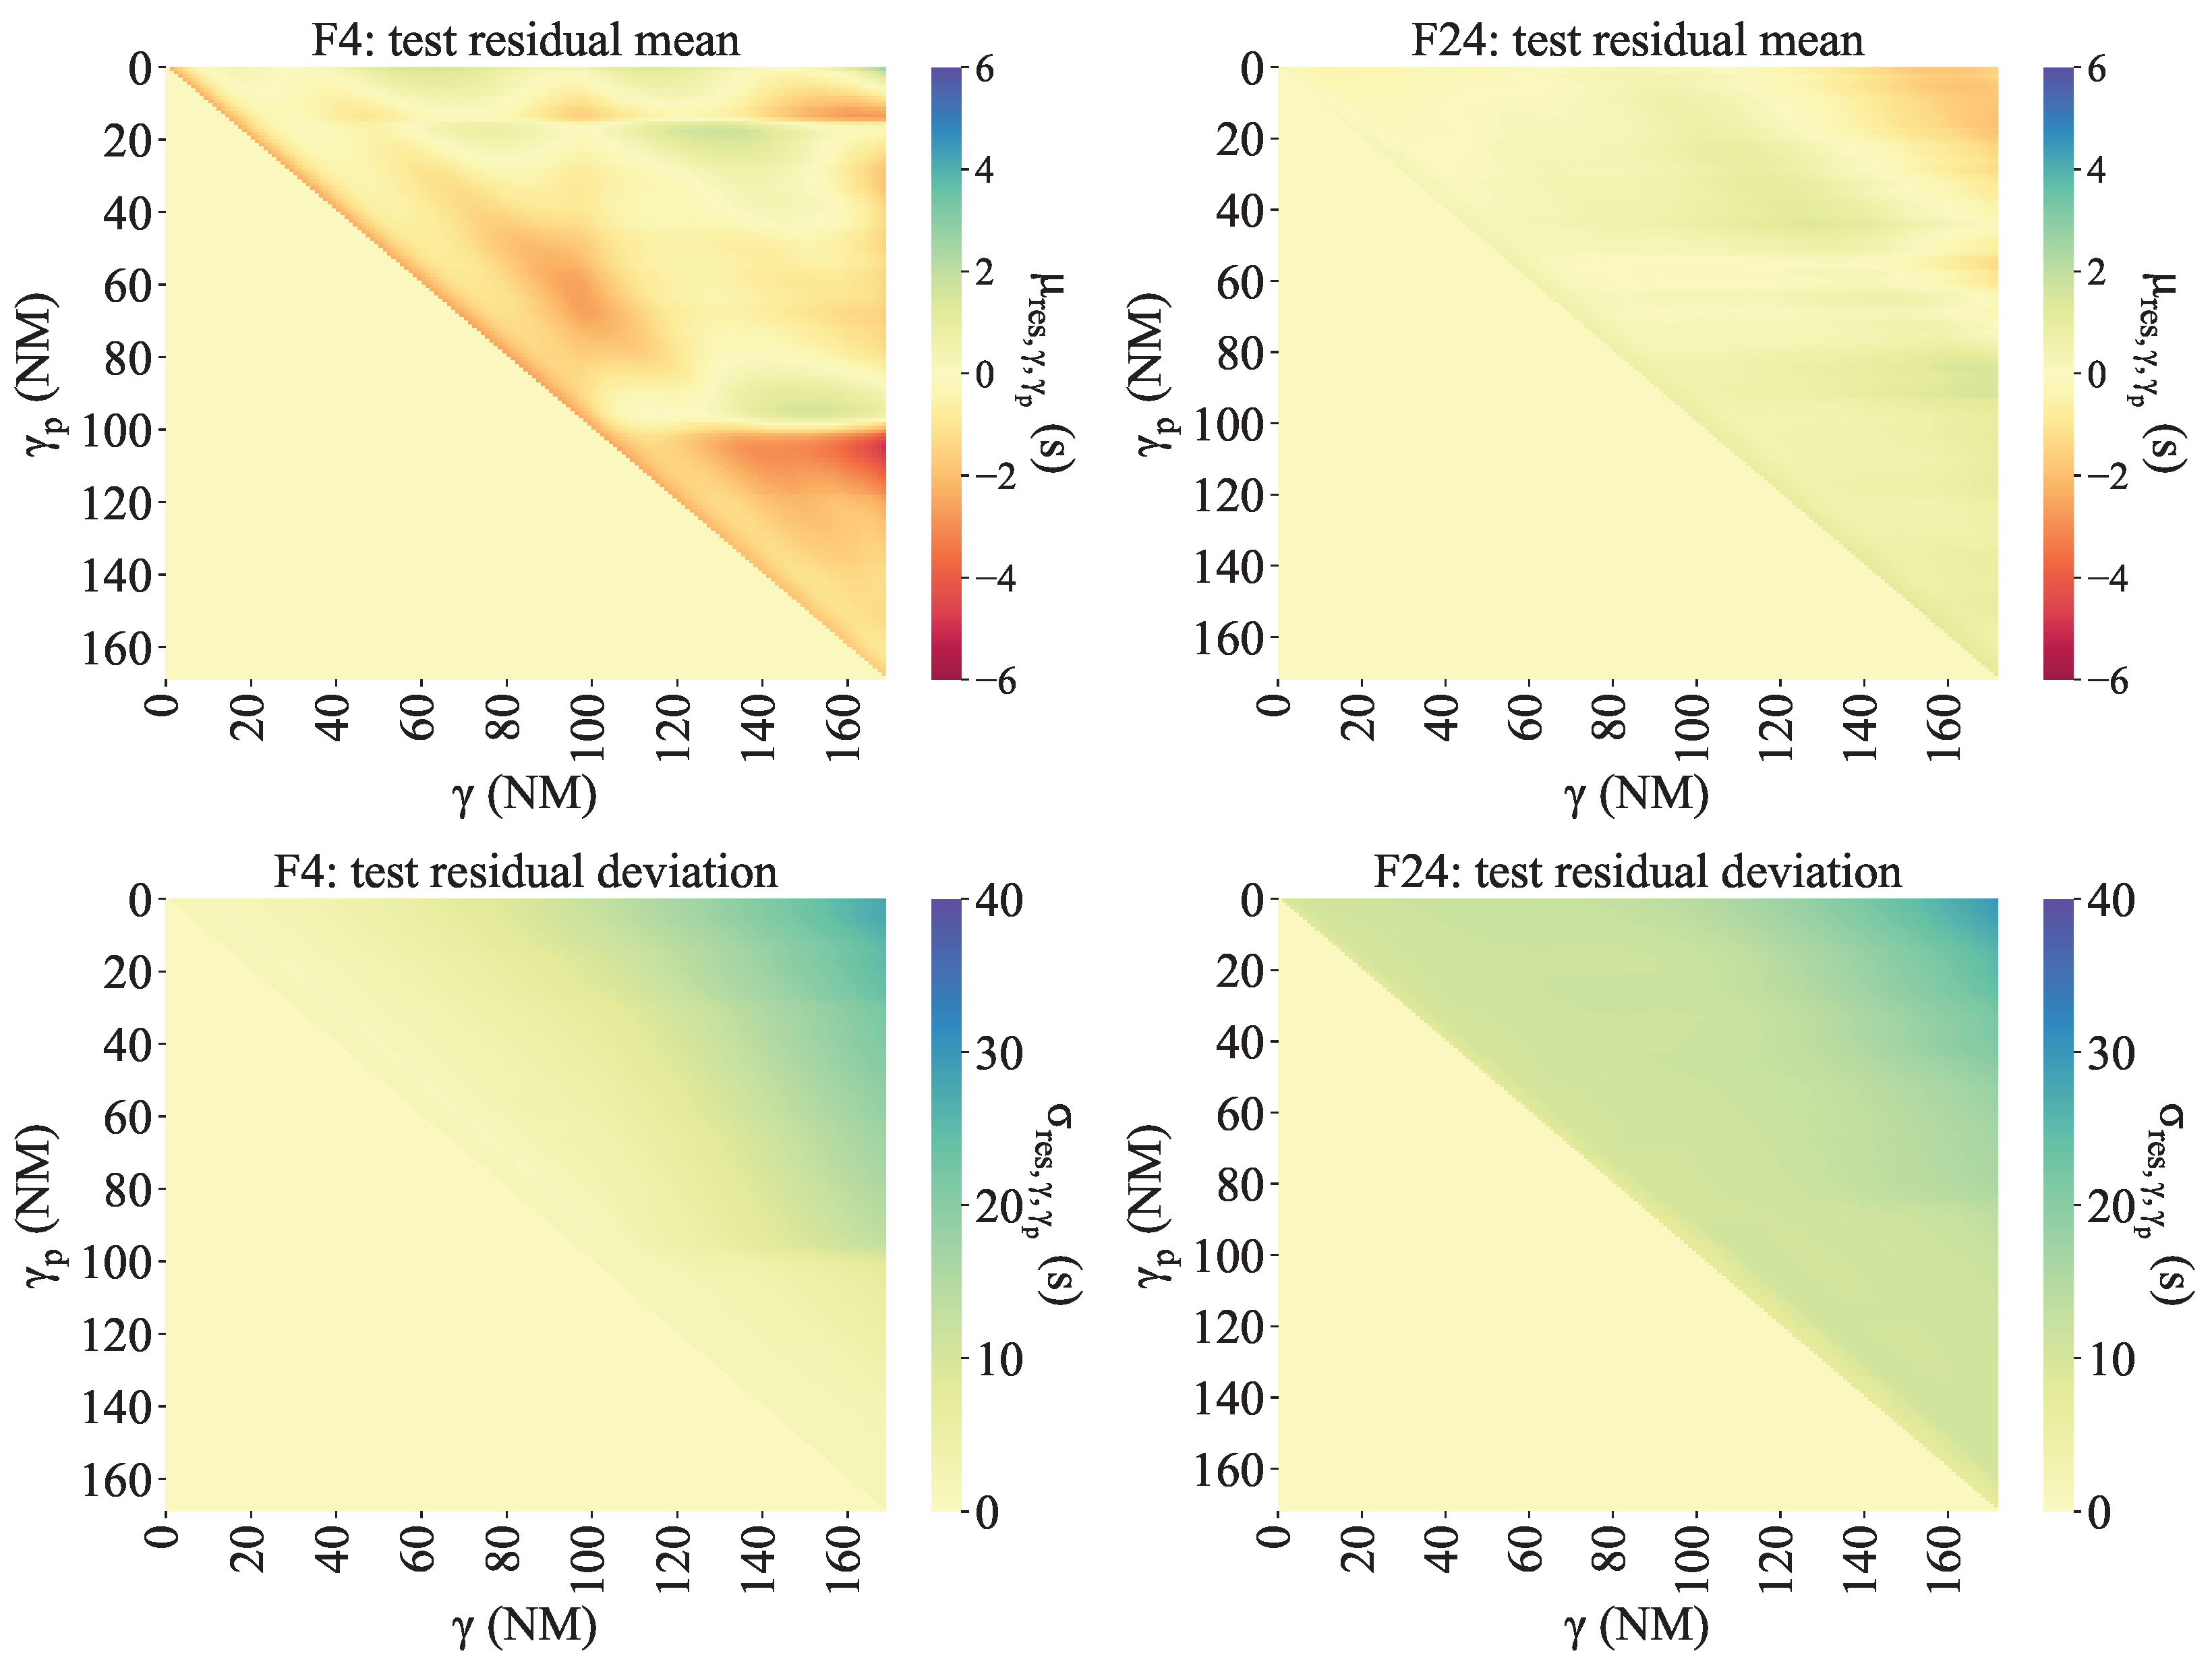
Although the overall deviation of the predictors is slightly lower in MLP-HTPs for F4 for low γ p 1 and γ p 2 , the low σ r e s , γ p , γ in XGB-HTPs for F24 compensates for the error and leads to a set of lower σ , as reflected in Table 5. As a result, the XGB-HTPs’ distributions exhibit a more pronounced slope than those of the MLP-HTPs.
The analysis of the SDR graphs is further detailed by examining the parameters of the logistic functions (see Figure 12). The values that lead to a optimum SDR are:
  • L: −1. The negative sign indicates the direction of the function.
  • x 0 : Δ t T H R .
  • k: the higher the better.
  • b: 1.
In Figure 12, the optimal values of L, k, and b are achieved in the CD tool for the Δ t T H R values of 60, 90, and 120 s, and they remain constant. This constancy is because they all satisfy the condition of Δ t T H R > 2 σ for any given γ p , whereas for Δ t T H R values of 10 s and 30 s, the parameters are far away from optimal. As uncertainty decreases with increasing γ p , the parameters of these curves approach the optimal. Specifically, for 30 s, the SDR curve meets the optimal values for L, k, and b at −28 NM. For the same reason, the logistic parameters of CD using XGB-HTPs reach the optimal values earlier than those using MLP-HTPs.
As result, the SDR and its associated logistic parameters facilitate setting the performance requirements for the trajectory predictors used in the detection process. By selecting the appropriate logistic parameters, the SDR curve that aligns with the expected CD output distribution and performance (to be analysed in Section 3.2.2) can be constructed, and the key points of the SDR will delineate the required TP accuracy. In the adaptive CD tool, where the dynamic parameters are adjustable during operation, the TP requirements may vary accordingly, to sustain CD performance across various CD configurations. This approach ensures flexibility in selecting the CD configuration while consistently upholding CD performance.

3.2.2. System Tuning Envelope

For the variable STE, the CD performance variations, mainly the accuracy, arising from HTP performance and dynamic thresholds are examined.
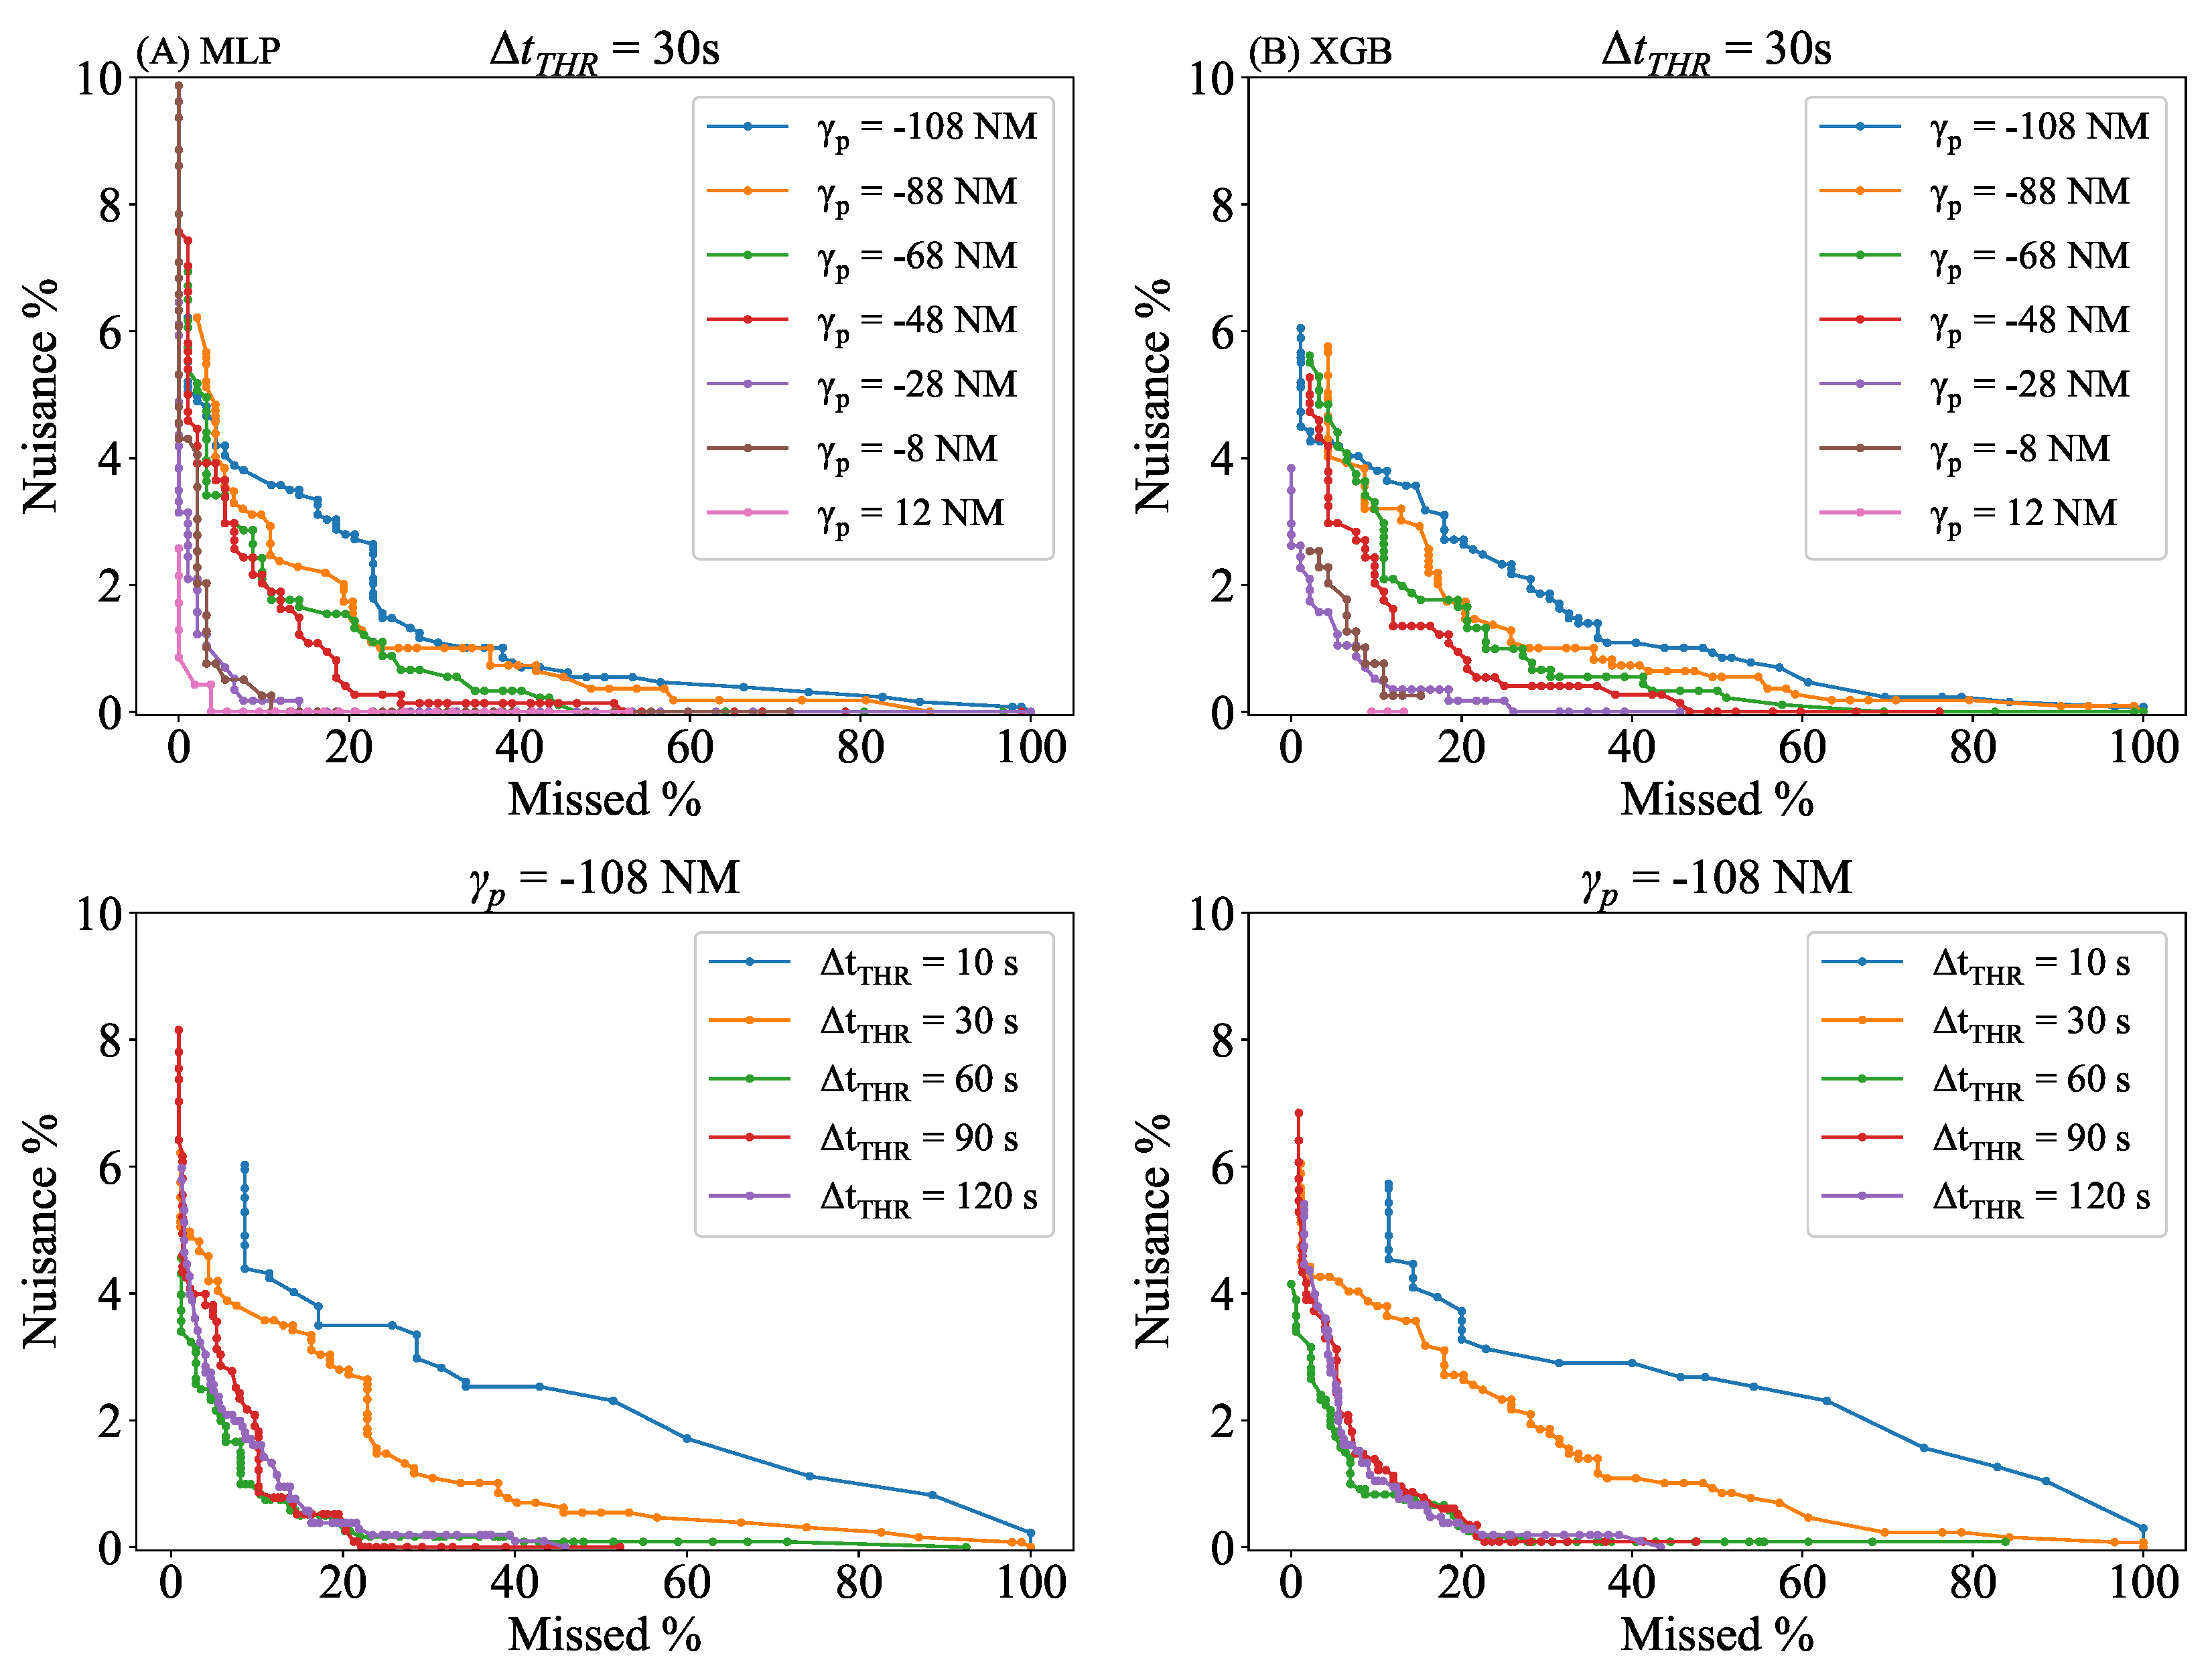
The resulting STE curves are presented in Figure 13. Each curve is composed of several points, which represent the proportion of nuisances and missed alerts for a given P T H R . The two graphs on the first row present the variation of the STE curves by γ p for a fixed Δ t T H R = 30 s, and the other two illustrate the variation by Δ t T H R for a fixed γ p = −108 NM. In this subsection, the selected Δ t T H R is 30 s to visualise distinct variations, because it is the closest value to the maximum σ , as presented in Section 3.2.1.
In general, despite the fluctuations in the curves, the STE curves exhibit a clear trend across γ p , where the proportion of nuisances and missed alerts decreases as γ p increases, approaching the critical point. This phenomenon is due to the reduction in the size of the sample of potential conflicts; as γ p increases, many flights have already flown over the critical point, and the potential interaction is cleared.
Regarding the HTP-induced variation, XGB-HTPs generally exhibit a higher proportion of FAs, whereas MLP-HTPs show a greater proportion of MAs. This phenomenon, taking into account the smaller standard deviation of XGB-HTPs’ residuals, is caused by the use of the error function ( e r f Δ t T H R + μ 2 σ and e r f Δ t T H R μ 2 σ ) in the probability estimation, using Equation (2). The error function is a sigmoid function in nature, whose slope depends on σ . A lower σ in XGB-HTPs causes the function to have a steep slope, leading to a rapid transition to extreme values as the predicted time separation deviates from Δ t T H R , resulting in a sharp probability transition and thereby an increase in notified positives and FAs. In contrast, MLP-HTPs, with higher σ values, induce a gradual slope in the error function, manifesting a slower probability transition over the predicted separation range and a tendency towards more MAs due to a less pronounced probability change.
The CD performance variation due to the larger disparity of the predictors’ accuracy is assessed by comparing results at different evaluation points. As presented in Figure 13, the FA and MA proportions both decrease with an increase in γ p . This reduction is caused by two factors. Firstly, a higher γ p leads many flights to overfly the critical point, making the interaction impossible and consequently reducing the interaction sample size. Second, the uncertainty diminishes as γ p increases, enhancing the accuracy of probability estimations and resulting in higher rates of True Positive (TP) and True Negative (TN). 
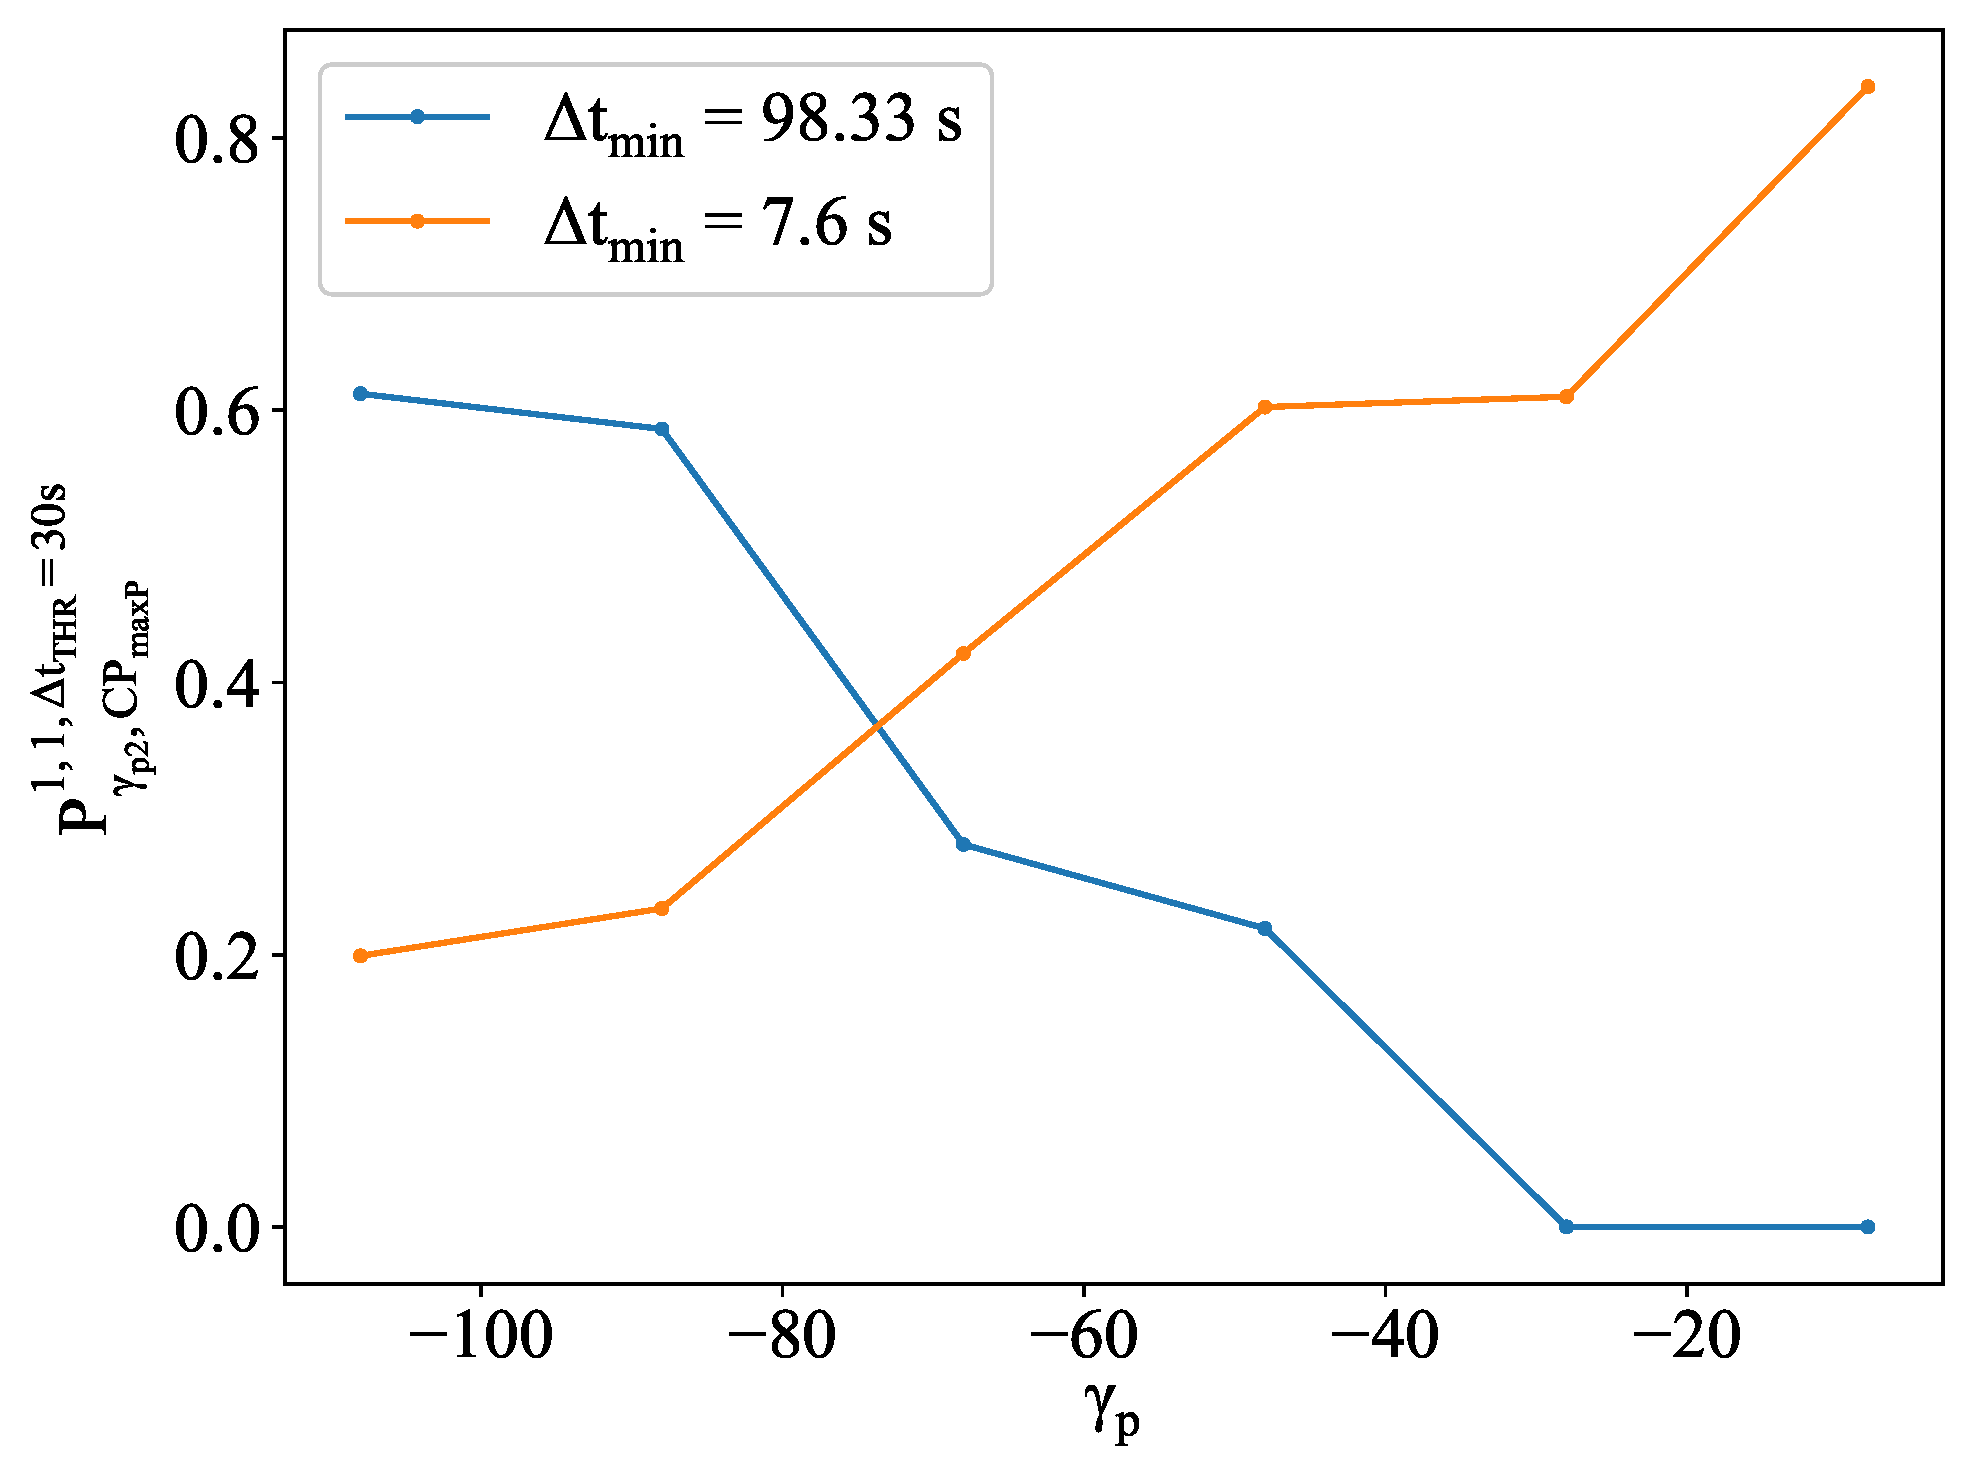
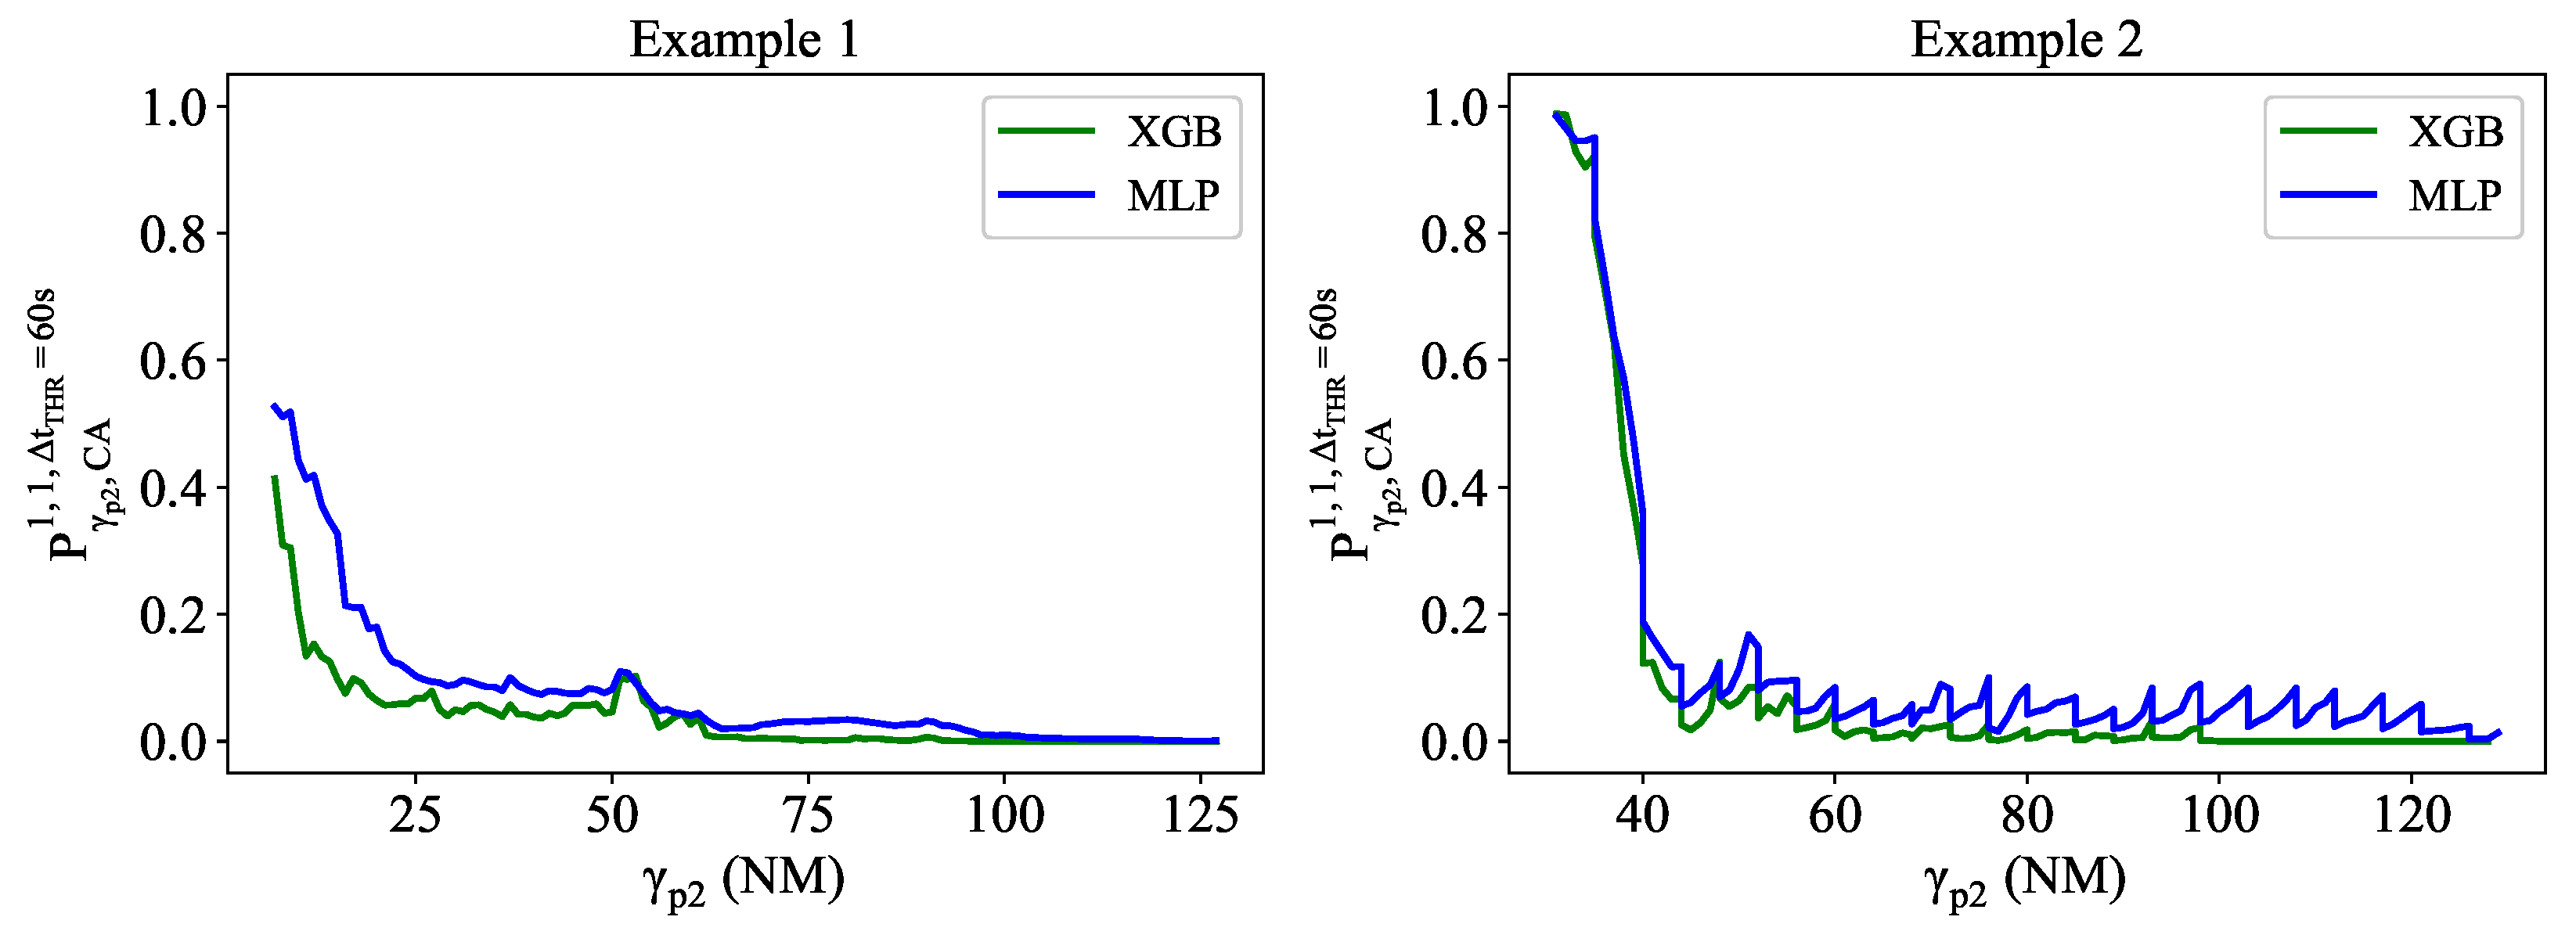
Figure 14 provides two flight pair examples, showcasing significant probability variation over γ p , converting what initially appear as FAs and MAs into TNs and TAs, respectively. In the blue one, although it is a conflict-free flight pair, whose Δ t m i n lies above Δ t T H R = 30 s, the estimated probability at γ p = −108 NM is relatively high at 0.61, making it possible to be notified and then classified as an FA. However, as the uncertainty decreases, this probability decreases to zero when γ p reaches −28 NM, allowing the tool to accurately identify this case as conflict-free. The second flight pair presents the opposite case: a RP with an initial low estimated probability of 0.2 that escalates to 0.84 at γ p = −8 NM, close to the sector boundary of PAU.
Concerning the variation by Δ t T H R at γ p = −108 NM, the observed trend is inconsistent. The FA and MA proportions initially decrease with increasing Δ t T H R up to 60 s, followed by a slight increase at 90 s and 120 s. The sample sizes and the error function again influence the results. RP and CD notifications are both dependent on Δ t T H R ; the size of both samples increases with less strict Δ t T H R . In terms of the error function, unlike the variation by γ p , changing the Δ t T H R does not affect the overall steepness of the curve; it changes the point along the existing sigmoid curve. Given the same σ and predicted separation, the difference between Δ t T H R and the predicted separation increases with Δ t T H R , where the estimated point is likely to be located at the extreme steep regions. Table 6 shows an example, illustrating changes in analysis sample size with different Δ t T H R .
These graphs could assist the user in selecting the most appropriate CD operating point for the operation, depending on LAT, by choosing suitable dynamic thresholds. First, this involves selecting the most appropriate Δ t T H R that exhibits the lowest proportions of FAs and MAs.
Secondly, the selection of P T H R determines the notification of predicted alerts, representing the trade-off between FAs and MAs. The dynamic nature of P T H R is beneficial during the operation. A low P T H R implies a higher proportion of nuisances and fewer missed alerts, while a high P T H R implies fewer nuisances and more missed alerts. The trade-off is tailored to the specific roles and tasks of the executive and planner controller, as well as to the look-ahead time.
On one hand, a large LAT allows for the consideration of a low rate of MAs and a reduction in the number of missed alerts. This is considering the greater TP prediction error and more available time for the controller to further evaluate the situation at a large LAT. Consequently, this implies selecting a low P T H R .
On the other hand, as flights approach the critical point, a higher operating point that prioritises highly probable encounters becomes more appropriate. This is aimed at short LATs, to reduce false alerts by notifying interactions that require immediate actions and thus avoiding overwhelming the controllers.
Hence, the STE facilitates the selection of different operating points for the adaptive CD tool, depending on the corresponding LAT.

CD Stability

The stability of the estimated probability cannot be directly discerned from the previous figures of merit; it requires the examination of specific instances. The analysis, based on the two flight pairs selected in Section 3.1, demonstrates that CD stability is influenced by the stability of the predictions, as depicted in Figure 15. Moderate fluctuations in the predictions result in smooth variation in the estimated probability with γ p , while large irregularities result in high-frequency fluctuations.

4. Discussion

In this paper, the primary objectives included assessing the impact of trajectory predictor performance on the encounter probability generated by an adaptive conflict detection tool and examining the flexibility of the CD tool dependent on its adjustable thresholds. Two figures of merit were proposed to address these objectives, which also assist in selecting the most suitable trajectory predictors and dynamic CD thresholds. These selections ultimately determine the operating point necessary to meet operational requirements.
For the analysis conducted, trajectory predictors were used to compute the time separation at critical points where minimum separation might be infringed. The conflict detection tool then evaluated the difference between the predicted time and the actual time to compute the encounter probability.
Two simple machine-learning-based horizontal trajectory predictors were employed for each flow of analysis: one trained using extreme gradient boosting, and the other using a multi-layer perceptron regressor. By leveraging these predictors and multiple evaluation points with varying uncertainty, changes in the figures of merit due to the prediction error could be visualised.
Flexibility was attributed to the conflict detection tool through its three adjustable thresholds: the distance threshold, defining the critical point; the time difference threshold, influencing the resulting encounter probability; and the probability threshold, determining the notification of alerts. The latter two thresholds were examined with various values to illustrate their effects on alert notifications and the implications for different operating points.
To assess the impact, predictor performance was quantified using the mean and standard deviation of prediction errors, evaluated at each location and for every subsequent segment. Distinct regions were identified in the metrics’ heatmaps, with locations of splits typically corresponding to ground speed variations.
Furthermore, the relationship between trajectory predictors and the CD tool was demonstrated using two figures of merit: system dynamic range and system tuning envelope. System dynamic range illustrates the variation of encounter probability with predicted time separation. It demonstrates that the rate at which the encounter probability decreases with increasing predicted separation is higher for high-performance predictors, and it declines with the deterioration of TP performance. The distribution of the system dynamic range follows a logistic function, and the analysis of its parameters aids in selecting appropriate horizontal trajectory predictors.
The remaining figure of merit, system tuning envelope, illustrates the trade-off between the proportion of nuisances and missed alerts. It demonstrated that high-performance predictors provide a smaller proportion of nuisances and missed alerts. However, its main utility lies in the selection of operating points, allowing for the fine-tuning of the system to better align with specific requirements for managing the airspace safely. The notifications are mainly impacted by the probability threshold; lower thresholds result in a larger proportion of nuisances and a lower proportion of missed alerts, while higher thresholds enhance the reliability of notified alerts at the expense of increased missed alerts. The trade-off decision rests with the controllers and depends on their specific tasks.
The selection of the time difference threshold depends on the performance of the trajectory predictors. It has been observed that when the ratio of the time separation threshold for conflict detection to the prediction errors exceeds 2 , the behaviour of the conflict detector converges towards the ideal, following a stepped function.
In conclusion, this study demonstrated that the performance of the trajectory predictor and the conflict detector are intrinsically related, and the figures of merit are useful in selecting appropriate trajectory predictors and operating points for an adaptive conflict detection tool. Additionally, given a specified operating point, these figures of merit facilitate the specification of prediction performance requirements and conflict detection configurations to achieve the desired operational outcomes.
Building upon the findings of this study, the next stages can be divided into three primary blocks. The first block encompasses further research and development to enhance trajectory predictors, aligned with operational requirements that may be elicited from the application of this study. This part can involve extending investigations to vertical predictors, as well as assessing other impacts on the proposed figures of merit, such as flight Intent variations. To achieve this, it may entail the exploration of advanced machine learning algorithms and the integration of additional input sources, such as airborne information through extended projected profiles.
The second block focuses on the further development of the conflict detector, expanding the detection process to encompass not only interactions between flights within the same flow but also those between singular flights that do not belong to any standard flows, and between singular flights.
Following this, the third block will focus on integrating the figures of merit into the decision making process within the existing separation management workflow. The results of this study can contribute to the evolution of human–machine interactions of air traffic controllers, enabling the dynamic selection of operating points of conflict detectors, based on their operational needs. Additionally, incorporating uncertainty management and improving trajectory predictors could enhance the controller’s trust in these tools, thus underpinning the deployment of future concepts such as a reduction of the separation minima, which would bring significant performance benefits [33].

Author Contributions

Conceptualization, C.X. and C.E.V.G.; methodology, C.X. and C.E.V.G.; software, C.X.; validation, C.X. and C.E.V.G.; formal analysis, C.X.; investigation, C.X.; data curation, C.X.; writing—original draft preparation, C.X.; writing—review and editing, C.X.; visualization, C.X.; supervision, C.E.V.G., V.F.G.C., R.M.A.V. and A.F.B.; project administration, C.E.V.G.; funding acquisition, C.E.V.G. and A.F.B. All authors have read and agreed to the published version of the manuscript.

Funding

This project received funding from the European Union’s H2020 research and innovation programme under Grant Agreement no. 872320. This publication reflects only the authors’ views and the SESAR 3 Joint Undertaking is not responsible for any use that may be made of the information it contains.

Data Availability Statement

The data presented in this study are available on request from the corresponding author, due to restrictions.

Conflicts of Interest

Adrián Fabio Bracero was employed by the company EUROCONTROL Innovation Hub. The remaining authors declare that the research was conducted in the absence of any commercial or financial relationships that could be construed as a potential conflict of interest.

References

  1. Performance Review Comission. PRR 2021 Performance Review Report, An Assessment of Air Traffic Management in Europe; Technical report; EUROCONTROL: Brussels, Belgium, 2022. [Google Scholar]
  2. EUROCONTROL. EUROCONTROL Forecast Update 2022–2028, European Flight Movements and Service Units–Three Scenarios for Recovery from COVID-19; Technical report; EUROCONTROL: Brussels, Belgium, 2022. [Google Scholar]
  3. Djokic, J.; Lorenz, B.; Fricke, H. Air traffic control complexity as workload driver. Transp. Res. Part Emerg. Technol. 2010, 18, 930–936. [Google Scholar] [CrossRef]
  4. Histon, J.; Hansman, R.J. Air Traffic Controller Operating Modes and Cognitive Complexity Regulation. Proc. Hum. Factors Ergon. Soc. Annu. Meet. 2011, 55, 345–349. [Google Scholar] [CrossRef]
  5. Radanovic, M.; Piera Eroles, M.A.; Koca, T.; Ramos Gonzalez, J.J. Surrounding traffic complexity analysis for efficient and stable conflict resolution. Transp. Res. Part Emerg. Technol. 2018, 95, 105–124. [Google Scholar] [CrossRef]
  6. PJ18-W2 4D Skyways Grant Nº 872320. Available online: https://cordis.europa.eu/project/id/872320 (accessed on 15 August 2023).
  7. EUROCONTROL. Conflict Detection Tools Impact on Controller Taskload–Fast Time Study; Technical report; EUROCONTROL: Brétigny-sur-Orge, France, 2010. [Google Scholar]
  8. Schuster, W.; Ochieng, W. Performance requirements of future Trajectory Prediction and Conflict Detection and Resolution tools within SESAR and NextGen: Framework for the derivation and discussion. J. Air Transp. Manag. 2014, 35, 92–101. [Google Scholar] [CrossRef]
  9. Common Trajectory Predictor Structure and Terminology in Support of Sesar and NextGen. Available online: https://www.academia.edu/9410077/Common_Trajectory_Predictor_Structure_and_Terminology_in_support_of_Sesar_and_NextGen (accessed on 20 November 2023).
  10. Zeng, W.; Chu, X.; Xu, Z.; Liu, Y.; Quan, Z. Aircraft 4D Trajectory Prediction in Civil Aviation: A Review. Aerospace 2022, 9, 91. [Google Scholar] [CrossRef]
  11. Musialek, B.; Munafo, C.F.; Ryan, H.; Paglione, M. Literature Review of Trajectory Predictor Technology; DOT/FAA/TC-TN11/1; U.S. Department of Transportation Federal Aviation Administration: Washington, DC, USA, 2010.
  12. Poles, D.; Nuic, A.; Mouillet, V. Advanced aircraft performance modeling for ATM: Analysis of BADA model capabilities. In Proceedings of the 29th Digital Avionics Systems Conference, Salt Lake City, UT, USA, 3–7 October 2010; pp. 1.D.1-1–1.D.1-14. [Google Scholar] [CrossRef]
  13. Bronsvoort, J.; McDonald, G.; Torres, S.; Paglione, M.; Young, C.; Hochwarth, J.; Boucquey, J.; Vilaplana, M. Use of the Extended Projected Profile (EPP) in Trajectory Management. In Proceedings of the 16th AIAA Aviation Technology, Integration, and Operations Conference, Washington, DC, USA, 13–17 June 2016. [Google Scholar]
  14. Wang, Z.; Liang, M.; Delahaye, D. Short-term 4d trajectory prediction using machine learning methods. In Proceedings of the SID 2017, 7th SESAR Innovation Days, Belgrade, Serbia, 28–30 November 2017. [Google Scholar]
  15. Shi, Z.; Xu, M.; Pan, Q. 4-D Flight Trajectory Prediction With Constrained LSTM Network. IEEE Trans. Intell. Transp. Syst. 2021, 22, 7242–7255. [Google Scholar] [CrossRef]
  16. Alligier, R.; Gianazza, D. Learning aircraft operational factors to improve aircraft climb prediction: A large scale multi-airport study. Transp. Res. Part Emerg. Technol. 2018, 96, 72–95. [Google Scholar] [CrossRef]
  17. Rudnyk, J.; Ellerbroek, J.; Hoekstra, J. Trajectory Prediction Sensitivity Analysis Using Monte Carlo Simulations. In Proceedings of the 2018 Aviation Technology, Integration, and Operations Conference, Atlanta, GA, USA, 25–29 June 2018. [Google Scholar] [CrossRef]
  18. Rudnyk, J.; Ellerbroek, J.; Hoekstra, J. Trajectory Prediction Sensitivity Analysis Using Monte Carlo Simulations Based on Inputs’ Distributions. J. Air Transp. 2019, 27, 1–18. [Google Scholar] [CrossRef]
  19. Mondoloni, S.; Rozen, N. Aircraft trajectory prediction and synchronization for air traffic management applications. Prog. Aerosp. Sci. 2020, 119, 100640. [Google Scholar] [CrossRef]
  20. Graas, R.; Sun, J.; Hoekstra, J. Quantifying accuracy and uncertainty in data-driven flight trajectory predictions with gaussian process regression. In Proceedings of the 11th SESAR Innovation Days, Virtual Event, 7–9 December 2021. [Google Scholar]
  21. Dalmau, R.; Melgosa, M.; Vilardaga, S.; Prats, X. A Fast and Flexible Aircraft Trajectory Predictor and Optimiser for ATM Research Applications. In Proceedings of the ICRAT 2018—8th International Conference for Research in Air Transportation, Barcelona, Spain, 26–29 June 2018; pp. 1–8. [Google Scholar]
  22. Ehrmanntraut, R. Full Automation of Air Traffic Management in High Complexity Airspace. Ph.D. Thesis, Technischen Universität Dresden, Dresden, Germany, 2010. [Google Scholar]
  23. Verdonk Gallego, C.E.; Gómez Comendador, V.F.; Amaro Carmona, M.A.; Arnaldo Valdés, R.M.; Sáez Nieto, F.J.; García Martínez, M. A machine learning approach to air traffic interdependency modelling and its application to trajectory prediction. Transp. Res. Part Emerg. Technol. 2019, 107, 356–386. [Google Scholar] [CrossRef]
  24. Irvine, R. A Geometrical Approach to Conflict Probability Estimation. Air Traffic Control. Q. 2002, 10, 85–113. [Google Scholar] [CrossRef]
  25. EUROCONTROL. EUROCONTROL Specification for Trajectory Prediction; Technical report; EUROCONTROL: Brussels, Belgium, 2017. [Google Scholar]
  26. Mondoloni, S.; Swierstra, S.; Paglione, M. Assessing trajectory prediction performance—metrics definition. In Proceedings of the 24th Digital Avionics Systems Conference, Washington, DC, USA, 30 October–3 November 2005; Volume 1. [Google Scholar] [CrossRef]
  27. Vivona, R.; Paglione, M.; Hughes, W.; Cate, K.; Enea, G. Definition and Demonstration of a Methodology for Validating Aircraft Trajectory Predictors. In Proceedings of the AIAA Guidance, Navigation, and Control Conference, Toronto, ON, Canada, 2–5 August 2010. [Google Scholar] [CrossRef]
  28. Mondoloni, S. Trajectory-based operations—Robust planning under trajectory uncertainty. In Proceedings of the 2016 IEEE/AIAA 35th Digital Avionics Systems Conference (DASC), Sacramento, CA, USA, 25–29 September 2016; pp. 1–10. [Google Scholar] [CrossRef]
  29. Paglione, M.; Young, C.M.; Torres, S.; Hochwarth, J.K.; McDonald, G.; Bronsvoort, J.; Boucquey, J. Operational impact of trajectory prediction accuracy on air traffic automation tools. In Proceedings of the 2017 IEEE/AIAA 36th Digital Avionics Systems Conference (DASC), St. Petersburg, FL, USA, 17–21 September 2017; pp. 1–10. [Google Scholar] [CrossRef]
  30. Paglione, M.; Oaks, R.; Bilimoria, K. Methodology for Generating Conflict Scenarios by Time Shifting Recorded Traffic Data. In Proceedings of the AIAA’s 3rd Annual Aviation Technology, Integration, and Operations (ATIO) Forum, Denver, CO, USA, 17–19 November 2003. [Google Scholar] [CrossRef]
  31. Verdonk Gallego, C.E.; Gómez Comendador, V.F.; Sáez Nieto, F.J.; García Martínez, M. Discussion On Density-Based Clustering Methods Applied for Automated Identification of Airspace Flows. In Proceedings of the 2018 IEEE/AIAA 37th Digital Avionics Systems Conference (DASC), London, UK, 23–27 September 2018; pp. 1–10. [Google Scholar] [CrossRef]
  32. Comisión de Investigación de Accidentes e Incidentes de Aviación Civil; Report IN-039/2018; Technical report; Ministerio de Transportes, Movilidad y Agenda Urbana, Gobierno de España: Madrid, Spain, 2018.
  33. Li, T.; Wan, Y. A fuel savings and benefit analysis of reducing separation standards in the oceanic airspace managed by the New York Air Route Traffic Control Center. Transp. Res. Part Logist. Transp. Rev. 2021, 152, 102407. [Google Scholar] [CrossRef]
Figure 1. (A) Example of differences between patterns of the same flow. The same γ represents different geographical locations depending on the pattern. (B) Prediction when the flight has flown 60 NM ( γ p is 60 NM) and the target point is at 140 NM.
Aerospace 11 00155 g001
Figure 2. (A) An example of an instantaneous capture of the situation when f 2 enters the sector featuring candidate interacting flights (E and D) and non-interacting flights (the rest). The red triangle symbolizes f 2 , while the black ones indicate other flights; those marked with a cross are non-interacting flights. (B) Each red line connects a pair of points, representing a critical point. Alongside each red line, the associated predicted time of the corresponding γ C P k 1 , f 1 o r f 2 of each C P k 1 , 1 between pattern combination [1,1] is shown. (C) Encounter probability between f 2 and f 1 ( P C A 1 , 1 ), if they follow their planned trajectory.
Aerospace 11 00155 g002
Figure 3. Unsafe probability with given predicted minimum separation—draft.
Aerospace 11 00155 g003
Figure 4. Conditions to detect nuisance and missed alerts based on predicted and real time separation. The grey lines represent the Δ t T H R set at 90 s.
Aerospace 11 00155 g004
Figure 5. Recurrent patterns of the two flows of analysis (pattern 1 refers to the planned route). The two flows interact in LECMPAU.
Aerospace 11 00155 g005
Figure 6. Selected arc-length of evaluation γ p .
Aerospace 11 00155 g006
Figure 7. Residual statistics of MLP models for the flows of analysis.
Aerospace 11 00155 g007
Figure 8. Residual statistics of XGB models for the flows of analysis.
Aerospace 11 00155 g008
Figure 9. Speed variation in relation to the entry speed-test sample. The vertical lines indicate the positions of region splits in the performance heatmaps.
Aerospace 11 00155 g009
Figure 10. Comparison of t ^ γ p , C P 1 1 , 1 variation by γ p of the flights between MLP and XGB models—examples 1 and 2.
Aerospace 11 00155 g010
Figure 11. (A) The SDR and logistic curve fit variation by γ p when Δ t T H R = 60 s and variation by Δ t T H R when γ p = −108 NM. The grey step line represents the ideal performance of the CD tool for the selected Δ t T H R —MLP-HTPs for F4–F24. (B) The same graphs using XGB-HTPs for F4–F24.
Aerospace 11 00155 g011
Figure 12. Variation of the four parameters of the sigmoid function by Δ t T H R and γ p .
Aerospace 11 00155 g012
Figure 13. (A) STE variation by Δ t T H R when γ p = −108 NM, and STE variation by γ p when Δ t T H R = 30 s for MLP-HTPs. (B) Same graphs for XGB-HTPs.
Aerospace 11 00155 g013
Figure 14. Examples of flight pairs with probability variation by γ p .
Aerospace 11 00155 g014
Figure 15. Stability of estimated encounter probability—examples.
Aerospace 11 00155 g015
Table 1. Nomenclature—Relevant Abbreviations.
AbbreviationDefinitionAbbreviationDefinition
ANNArtificial Neural NetworkMLPMulti-Layer Perceptron Regressor
AoI/RArea of Interest/ResponsibilityNMNautical Miles
ATCoAir Traffic ControllerOSEDOperational Service and Environment Definition
CA/PCritical Area/PointRPReal positive
CDRConflict Detection and ResolutionsSeconds
DCBDemand and Capacity BalancingSDRSystem Dynamic Range
DSTDecision Support ToolSTESystem Tuning Envelope
FA/MAFalse Alert/Missed AlertTATrue Alert
FLFlight LevelTNTrue negative
HTPHorizontal Trajectory PredictorTPTrajectory Predictor
LATLook-Ahead TimeWVWake Vortex
MLMachine LearningXGBeXtreme Gradient Boosting regressor
Table 2. Notation—Indexes.
IndexDefinitionIndexDefinition
iRecurrent pattern of flow 1kCritical point within a critical area
jRecurrent pattern of flow 2pPresent or current
Table 3. Notation—Trajectory Predictor.
NotationDefinitionNotationDefinition
γ Arc-length along the trajectory of each flow pattern [NM] t e Elapsed time at sector entry [s]
γ p Current position of the flight, measured as elapsed distance γ of the flight from the entry point [NM] t p Elapsed time from entry to γ p [s]
δ γ Target distance from the current location to make prediction [NM] F L p Flight level at γ p [FL]
t ^ γ , γ p Predicted required time to reach the target point δ γ from the current position γ p [s] v p Ground speed at γ p [knots (kts)]
Table 4. Notation—Conflict Detector.
NotationDefinitionNotationDefinition
f 1 Flight 1 of an interacting flight pair γ p Arc-length of evaluation, indicating γ p 2
f 2 Flight 2 of an interacting flight pair γ C P k i , f 1 ( γ C P k j , f 2 ) γ of pattern i (j) of f 1 ( f 2 ) to reach the critical point k [NM]
d T H R Horizontal distance threshold to identify CP [NM] C A i , j Critical point k between patterns [i, j], composed of the location of f 1 and f 2 along patterns i and j, respectively, [NM]
Δ t T H R Time difference threshold to obtain real conflict and encounter probability [s] C P k i , j Critical point k between patterns [i, j], composed of the location of f 1 and f 2 along patterns i and j, respectively, [NM]
P T H R Probability threshold and operation threshold to decide whether notify an alert t ^ γ p , γ C P k i , f 1 ( t ^ γ p , γ C P k j , f 2 ) Time predicted to reach γ C P k i , f 1 ( γ C P k j , f 2 ) at γ p through pattern i (j) [s]
Δ t m i n Real-time difference [s] Δ t ^ r e s , γ p , C P k i , j Difference between the predicted time to reach C P k i , j of both flights for the patterns [i, j] [s]
Δ d m i n Real minimum horizontal separation [NM] σ γ p , γ C P k i , f 1 ( σ γ p , γ C P k j , f 2 ) Standard deviation of HTP to predict γ C P k i , f 1 ( γ C P k j , f 2 ) at γ p through pattern i (j) [s]
Δ h m i n Real minimum vertical separation [ft] σ r e s , γ p , C P k i , j Combined standard deviation of the predictions of both flights for C P k [s]
μ Mean P γ p , C P k i , j , Δ t T H R Encounter probability at C P k of the patterns [i, j] at γ p
σ Standard deviation P γ p , C A i , j , Δ t T H R Encounter probability of the patterns [i, j] of the flight pair
γ p 1 ( γ p 2 ) Current position of f 1 ( f 2 ) [NM] P γ p Δ t T H R Encounter probability of the flight pair
Table 5. Variation of σ in both HTPs for different γ p .
γ p 1 , γ p 2 f 1 MLP σ res , γ p 1 , γ f 2 MLP σ res , γ p 2 , γ f 1 XGB σ res , γ p 1 , γ f 2 XGB σ res , γ p 2 , γ MLP σ XGB σ MLP σ –XGB σ
0, 020.7817.7321.1515.5638.6337.131.50
20, 2017.3514.2717.7411.4731.7729.881.89
40, 4014.0612.9114.309.6927.0024.422.57
60, 6011.4812.0811.546.6423.5718.824.74
80, 809.0711.419.055.3420.6114.865.75
100, 1004.1810.653.871.6416.18610.23
Table 6. Number of flight pairs with Δ t m i n < Δ t T H R at γ p = −108 NM and P T H R = 0.5.
Δ t THR No. RPNo. FANo. MA
1035035
30922621
601731215
902262123
1203251828
Disclaimer/Publisher’s Note: The statements, opinions and data contained in all publications are solely those of the individual author(s) and contributor(s) and not of MDPI and/or the editor(s). MDPI and/or the editor(s) disclaim responsibility for any injury to people or property resulting from any ideas, methods, instructions or products referred to in the content.

